Turk J Chem
(2014) 38: 617 – 628
c⃝ TUBITAK
doi:10.3906/kim-1309-55
Turkish Journal of Chemistry
http :// journa l s . tub i tak .gov . t r/chem/
Research Article
Organic biomolecules bind to phosphate through borate linkages in aqueous
solutions
Nazik AYDOGMUS1, Dursun Ali KOSE2,∗, Michael Andrew BECKETT3,
Birgul ZUMREOGLU KARAN1,∗
1Department of Chemistry, Hacettepe University, Beytepe Campus, Ankara, Turkey2Department of Chemistry, Hitit University, Ulukavak, Corum, Turkey
3School of Chemistry, Bangor University, Bangor, UK
Received: 23.09.2013 • Accepted: 22.01.2014 • Published Online: 11.06.2014 • Printed: 10.07.2014
Abstract: Solutions of salicyclic, ascorbic, and citric acids were reacted with boric acid, followed by NaH2PO4 . The
products, triphosphateborate ester of salicylic acid (1), orthosphateborate ester of ascorbic acid (2), triphosphateborate
ester of ascorbic acid (3), and orthosphateborate ester of citric acid (4), were flash precipitated with cold acetone and
characterised by microanalysis, thermal analysis, FT-IR, Raman, 11B NMR, 31P MAS NMR, and mass spectroscopic
techniques. Analytical results indicated the presence of –C–O–B–O–P– linkages with the attached phosphate groups
varying between orthophosphate and triphosphate, depending on the starting material. The biomolecules studied in this
work may serve as models in the B–P-organic system and the results would provide a possible contribution to boron
prebiotic chemistry.
Key words: Borate complex, phosphate ester, boric acid, 31P MAS NMR, 11B NMR
1. Introduction
The question of how biological life emerged from inorganic matter through natural processes and the role
of inorganic ions in the synthesis of simple organic molecules have been the subject of several hypotheses
and laboratory studies.1,2 Commonly accepted models for the prebiotic world emphasise the requirement of
negatively charged ions such as carbonate, cyanide, ferrocyanide, phosphate, sulphide, and sulphite as sources
of biomolecules.3,4 Among these anionic species, phosphate ions are of particular importance in the prebiotic
synthesis of products containing one or more phosphate groups able to oligomerise to sugar phosphates and
further polymerise to RNA molecules.5 Selective concentration of phosphate species, stabilisation of ribose, and
catalytic synthesis of organic molecules under prebiotic conditions most likely proceeded over reactive surfaces
of the rocks and minerals present in the oceans. It has been suggested that borate minerals could have played a
crucial role by stabilising the cyclic ribose during RNA synthesis.6−8 A potential and catalytic role of boric acid
in peptide and nucleic acid synthesis9 and stabilisation of sugar molecules by acting as a complexing agent10,11
have been demonstrated. Recently, thermal condensation of formamide in the presence of borate minerals has
been shown to form nucleic acid precursors.12 Holm et al.13 proposed that brucite mineral (solid Mg(OH)2) may
scavenge borate and phosphate from sea water. Brucite with adsorbed phosphate may catalyse the synthesis
of pyrophosphate from orthophosphate, high pH conditions promote the abiotic formation of ribose, and ribose
can be stabilised by borate leaving available positions for phosphorylation.
∗Correspondence: [email protected], [email protected]
617
AYDOGMUS et al./Turk J Chem
Stimulated by the above-mentioned prebiotic scenarios, we explored the possibility of binding organic
molecules to phosphate groups through borate ester linkages in aqueous solutions. Both boric acid and
phosphoric acid are known to form ester structures with organic molecules through condensation reactions.
Compounds containing B–O–P fragments prepared from boranes with phosphoric acid derivatives have been
reported.14 However, B–O–P bonding in aqueous media is limited to borophosphate formation in hydrothermal
conditions,15−18 to the best of the authors’ knowledge. In this paper, we present evidence that such compounds
are formed in solutions containing boric acid, NaH2PO4 , and carboxylic acid derivatives. Salicylic acid was
chosen as the probe molecule for reaction optimisation because of its well-defined esterification sites with
boron19,20 phosphorus.21 The knowledge obtained with salicylic acid was then utilised in reactions with other
carboxylic acids in order to obtain more information about the general applicability of the method. Our
attention was drawn to ascorbic acid (a sugar acid with the same furanose ring as ribose) and citric acid (an
important intermediate in the citric acid cycle), expecting further support for the formation of –C–O–B–O–P–
linkages in aqueous solutions with carboxylic acid derivatives of biochemical importance.
2. Results and discussion
The experimental strategy was based on the formation of borate monoester of the biomolecule first, which
undergoes further condensation with the added dihydrogenphosphate (Scheme 1). Because borate formation is
reversible, H3BO3 was added in solid form to avoid confusion between interacting trigonal and tetrahedral boron
species. No pH adjustment was made as the measured pH (≤5) of the mixture throughout the reaction course
was optimal for complexation of boric acid with hydroxycarboxylic acids, according to the rules formulated by
Van Duin et al.22
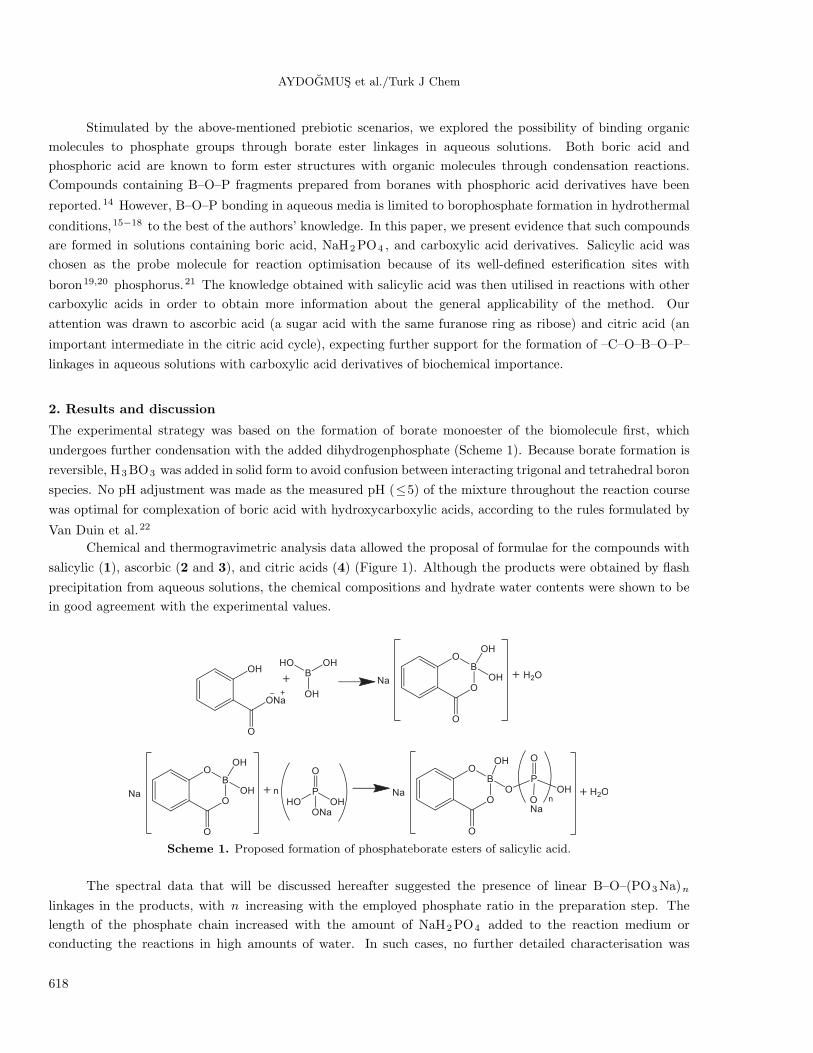
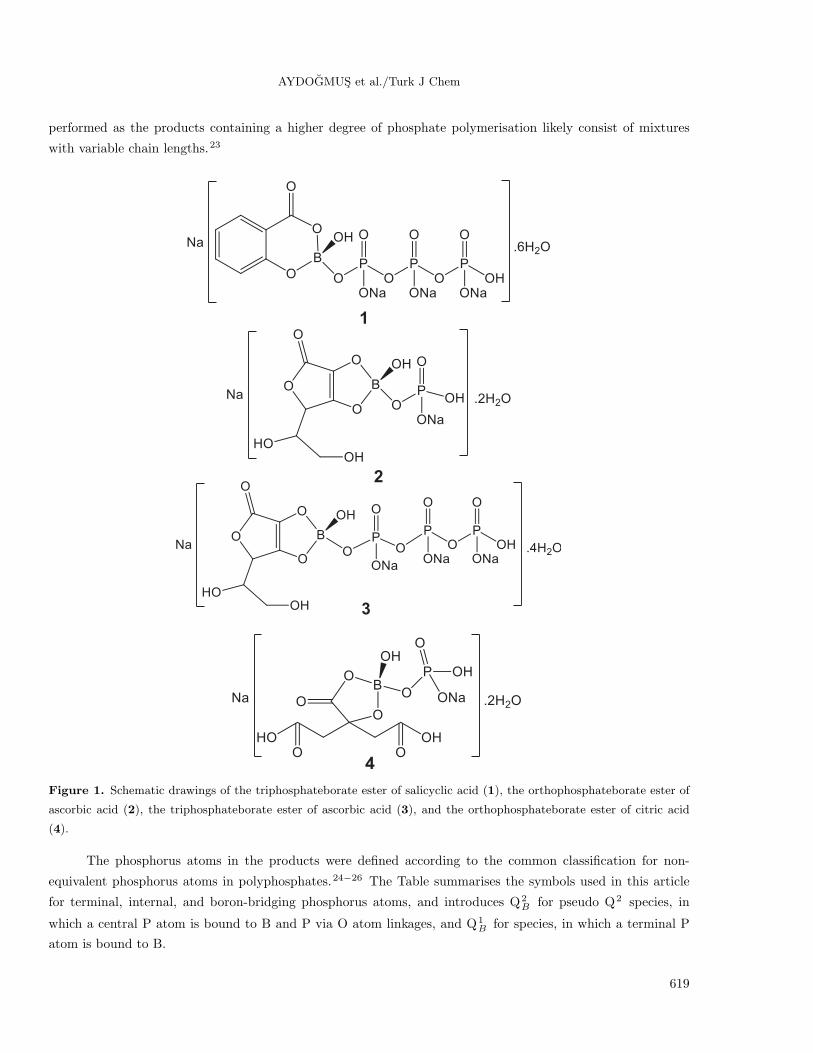
Chemical and thermogravimetric analysis data allowed the proposal of formulae for the compounds with
salicylic (1), ascorbic (2 and 3), and citric acids (4) (Figure 1). Although the products were obtained by flash
precipitation from aqueous solutions, the chemical compositions and hydrate water contents were shown to be
in good agreement with the experimental values.
Scheme 1. Proposed formation of phosphateborate esters of salicylic acid.
The spectral data that will be discussed hereafter suggested the presence of linear B–O–(PO3Na)n
linkages in the products, with n increasing with the employed phosphate ratio in the preparation step. The
length of the phosphate chain increased with the amount of NaH2PO4 added to the reaction medium or
conducting the reactions in high amounts of water. In such cases, no further detailed characterisation was
618
AYDOGMUS et al./Turk J Chem
performed as the products containing a higher degree of phosphate polymerisation likely consist of mixtures
with variable chain lengths.23
Figure 1. Schematic drawings of the triphosphateborate ester of salicyclic acid (1), the orthophosphateborate ester of
ascorbic acid (2), the triphosphateborate ester of ascorbic acid (3), and the orthophosphateborate ester of citric acid
(4).
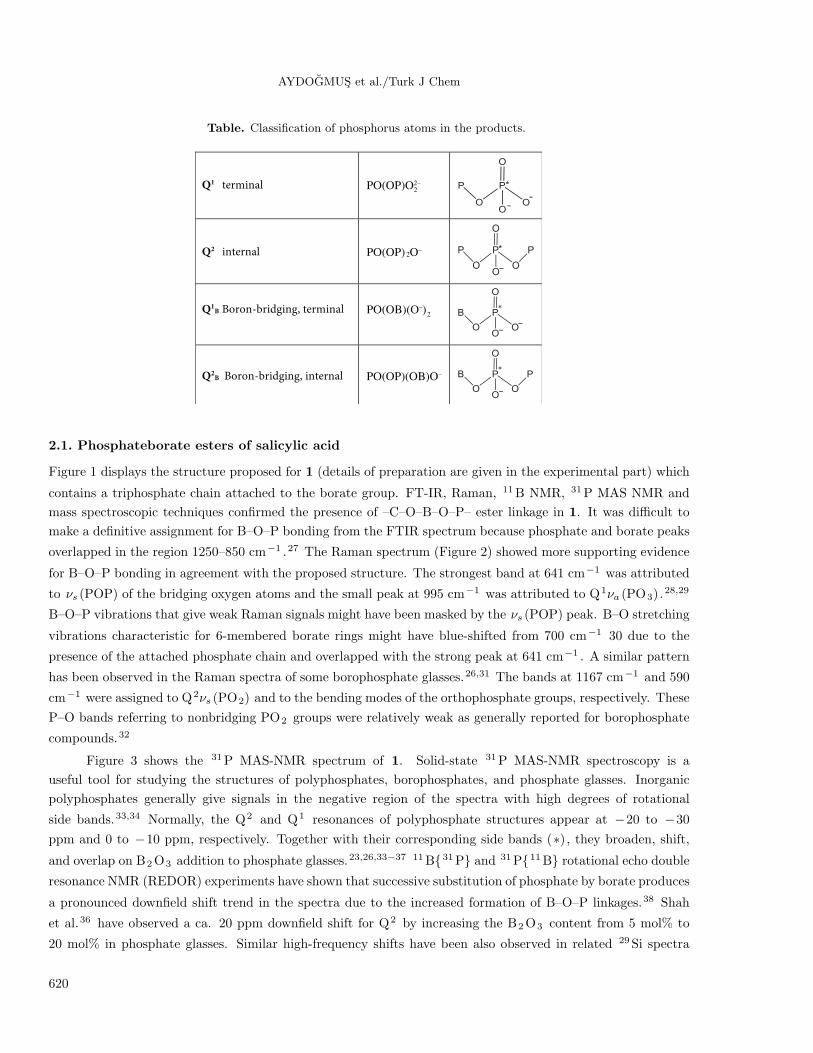
The phosphorus atoms in the products were defined according to the common classification for non-
equivalent phosphorus atoms in polyphosphates.24−26 The Table summarises the symbols used in this article
for terminal, internal, and boron-bridging phosphorus atoms, and introduces Q2B for pseudo Q2 species, in
which a central P atom is bound to B and P via O atom linkages, and Q1B for species, in which a terminal P
atom is bound to B.
619
AYDOGMUS et al./Turk J Chem
Table. Classification of phosphorus atoms in the products.
Q1 terminal
PO(OP)O2–2
Q2 internal
PO(OP) 2O–
Q1B Boron-bridging, terminal
PO(OB)(O–)2
Q2B Boron-bridging, internal
PO(OP)(OB)O–
2.1. Phosphateborate esters of salicylic acid
Figure 1 displays the structure proposed for 1 (details of preparation are given in the experimental part) which
contains a triphosphate chain attached to the borate group. FT-IR, Raman, 11B NMR, 31P MAS NMR and
mass spectroscopic techniques confirmed the presence of –C–O–B–O–P– ester linkage in 1. It was difficult to
make a definitive assignment for B–O–P bonding from the FTIR spectrum because phosphate and borate peaks
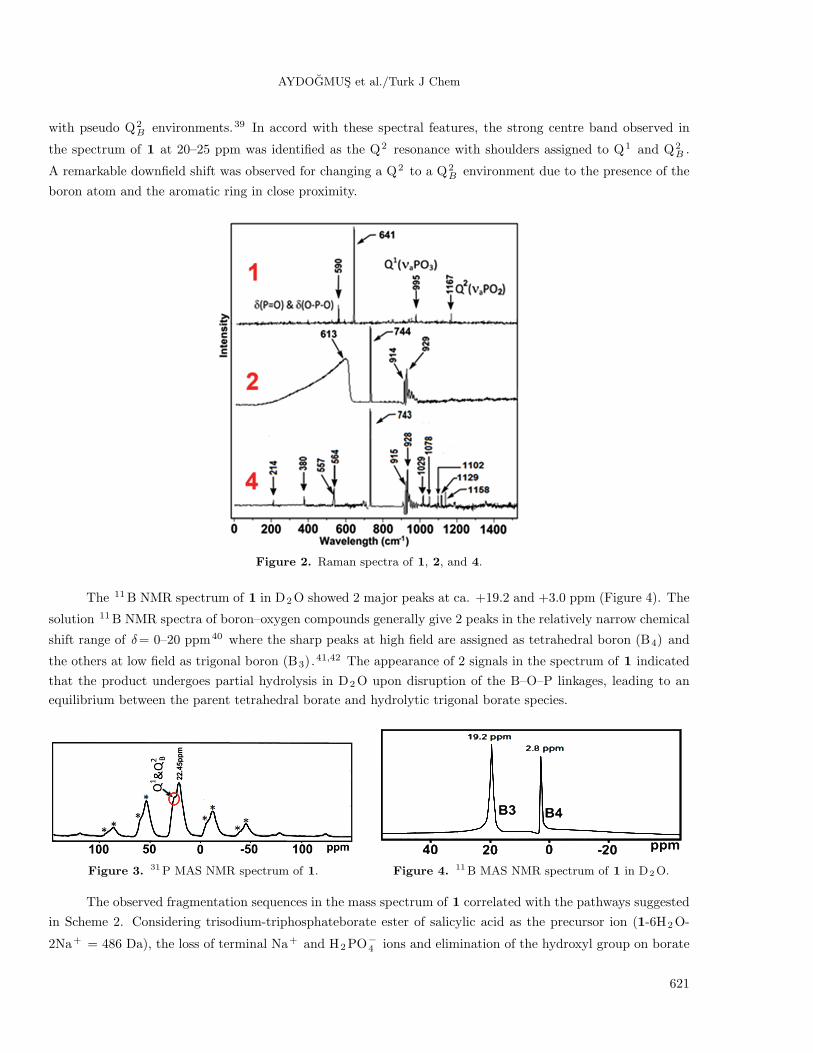
overlapped in the region 1250–850 cm−1 .27 The Raman spectrum (Figure 2) showed more supporting evidence
for B–O–P bonding in agreement with the proposed structure. The strongest band at 641 cm−1 was attributed
to νs (POP) of the bridging oxygen atoms and the small peak at 995 cm−1 was attributed to Q1νa (PO3).28,29
B–O–P vibrations that give weak Raman signals might have been masked by the νs (POP) peak. B–O stretching
vibrations characteristic for 6-membered borate rings might have blue-shifted from 700 cm−1 30 due to the
presence of the attached phosphate chain and overlapped with the strong peak at 641 cm−1 . A similar pattern
has been observed in the Raman spectra of some borophosphate glasses.26,31 The bands at 1167 cm−1 and 590
cm−1 were assigned to Q2νs (PO2) and to the bending modes of the orthophosphate groups, respectively. These
P–O bands referring to nonbridging PO2 groups were relatively weak as generally reported for borophosphate
compounds.32
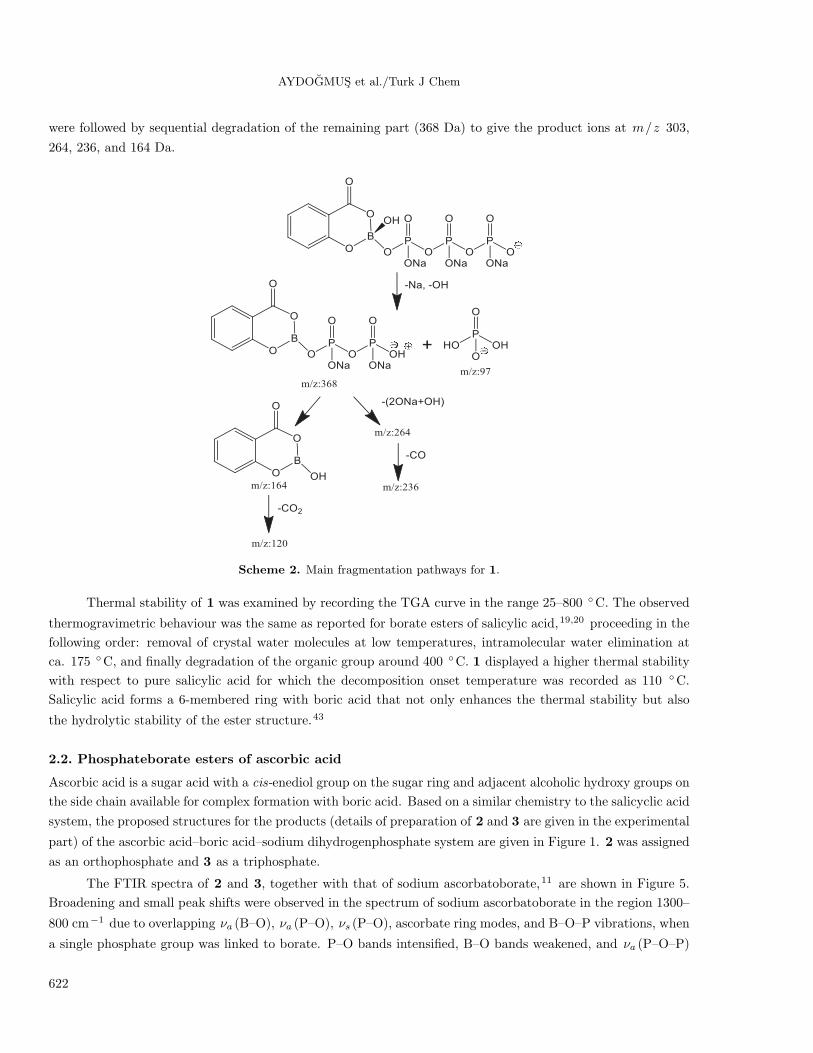
Figure 3 shows the 31P MAS-NMR spectrum of 1. Solid-state 31P MAS-NMR spectroscopy is a
useful tool for studying the structures of polyphosphates, borophosphates, and phosphate glasses. Inorganic
polyphosphates generally give signals in the negative region of the spectra with high degrees of rotational
side bands.33,34 Normally, the Q2 and Q1 resonances of polyphosphate structures appear at −20 to −30
ppm and 0 to −10 ppm, respectively. Together with their corresponding side bands (∗), they broaden, shift,
and overlap on B2O3 addition to phosphate glasses.23,26,33−37 11B{31P} and 31P{11B} rotational echo double
resonance NMR (REDOR) experiments have shown that successive substitution of phosphate by borate produces
a pronounced downfield shift trend in the spectra due to the increased formation of B–O–P linkages.38 Shah
et al.36 have observed a ca. 20 ppm downfield shift for Q2 by increasing the B2O3 content from 5 mol% to
20 mol% in phosphate glasses. Similar high-frequency shifts have been also observed in related 29Si spectra
620
AYDOGMUS et al./Turk J Chem
with pseudo Q2B environments.39 In accord with these spectral features, the strong centre band observed in
the spectrum of 1 at 20–25 ppm was identified as the Q2 resonance with shoulders assigned to Q1 and Q2B .
A remarkable downfield shift was observed for changing a Q2 to a Q2B environment due to the presence of the
boron atom and the aromatic ring in close proximity.
Figure 2. Raman spectra of 1, 2, and 4.
The 11B NMR spectrum of 1 in D2O showed 2 major peaks at ca. +19.2 and +3.0 ppm (Figure 4). The
solution 11B NMR spectra of boron–oxygen compounds generally give 2 peaks in the relatively narrow chemical
shift range of δ= 0–20 ppm40 where the sharp peaks at high field are assigned as tetrahedral boron (B4) and
the others at low field as trigonal boron (B3).41,42 The appearance of 2 signals in the spectrum of 1 indicated
that the product undergoes partial hydrolysis in D2O upon disruption of the B–O–P linkages, leading to an
equilibrium between the parent tetrahedral borate and hydrolytic trigonal borate species.
Figure 3. 31P MAS NMR spectrum of 1. Figure 4. 11B MAS NMR spectrum of 1 in D2O.
The observed fragmentation sequences in the mass spectrum of 1 correlated with the pathways suggested
in Scheme 2. Considering trisodium-triphosphateborate ester of salicylic acid as the precursor ion (1-6H2O-
2Na+ = 486 Da), the loss of terminal Na+ and H2PO−4 ions and elimination of the hydroxyl group on borate
621
AYDOGMUS et al./Turk J Chem
were followed by sequential degradation of the remaining part (368 Da) to give the product ions at m/z 303,
264, 236, and 164 Da.
Scheme 2. Main fragmentation pathways for 1.
Thermal stability of 1 was examined by recording the TGA curve in the range 25–800 ◦C. The observed
thermogravimetric behaviour was the same as reported for borate esters of salicylic acid,19,20 proceeding in the
following order: removal of crystal water molecules at low temperatures, intramolecular water elimination at
ca. 175 ◦C, and finally degradation of the organic group around 400 ◦C. 1 displayed a higher thermal stability
with respect to pure salicylic acid for which the decomposition onset temperature was recorded as 110 ◦C.
Salicylic acid forms a 6-membered ring with boric acid that not only enhances the thermal stability but also
the hydrolytic stability of the ester structure.43
2.2. Phosphateborate esters of ascorbic acid
Ascorbic acid is a sugar acid with a cis-enediol group on the sugar ring and adjacent alcoholic hydroxy groups on
the side chain available for complex formation with boric acid. Based on a similar chemistry to the salicyclic acid
system, the proposed structures for the products (details of preparation of 2 and 3 are given in the experimental
part) of the ascorbic acid–boric acid–sodium dihydrogenphosphate system are given in Figure 1. 2 was assigned
as an orthophosphate and 3 as a triphosphate.
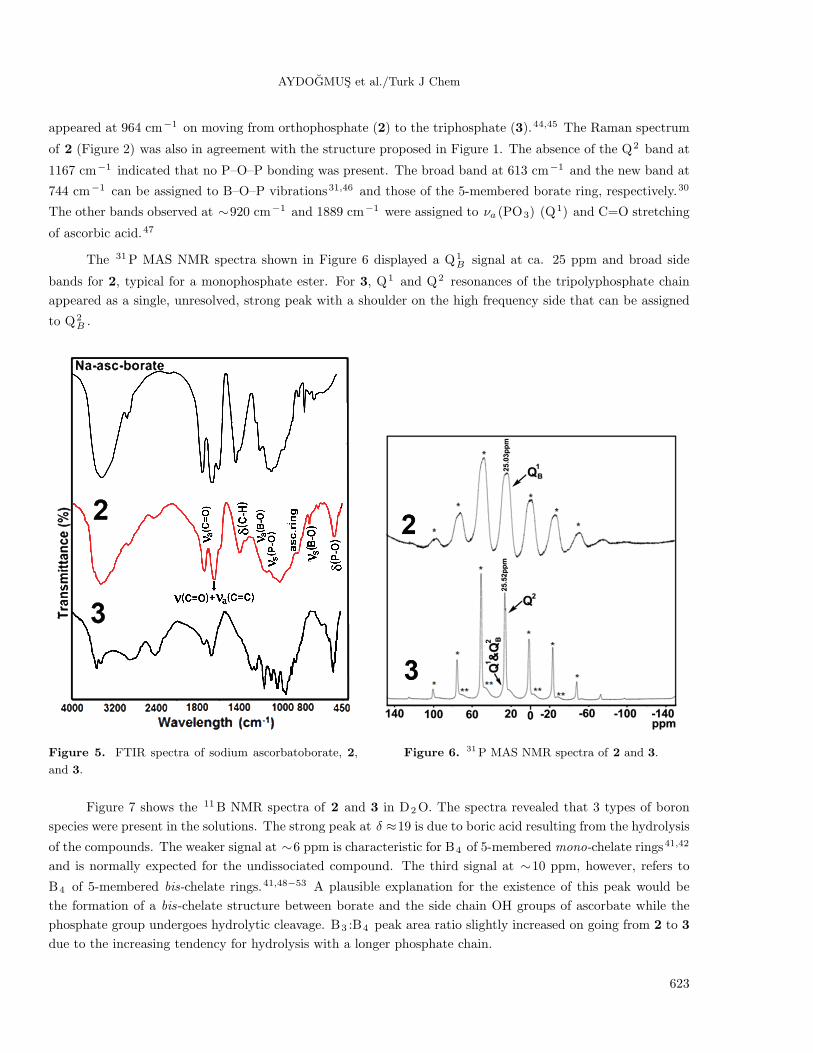
The FTIR spectra of 2 and 3, together with that of sodium ascorbatoborate,11 are shown in Figure 5.
Broadening and small peak shifts were observed in the spectrum of sodium ascorbatoborate in the region 1300–
800 cm−1 due to overlapping νa (B–O), νa (P–O), νs (P–O), ascorbate ring modes, and B–O–P vibrations, when
a single phosphate group was linked to borate. P–O bands intensified, B–O bands weakened, and νa (P–O–P)
622
AYDOGMUS et al./Turk J Chem
appeared at 964 cm−1 on moving from orthophosphate (2) to the triphosphate (3).44,45 The Raman spectrum
of 2 (Figure 2) was also in agreement with the structure proposed in Figure 1. The absence of the Q2 band at
1167 cm−1 indicated that no P–O–P bonding was present. The broad band at 613 cm−1 and the new band at
744 cm−1 can be assigned to B–O–P vibrations31,46 and those of the 5-membered borate ring, respectively.30
The other bands observed at ∼920 cm−1 and 1889 cm−1 were assigned to νa (PO3) (Q1) and C=O stretching
of ascorbic acid.47
The 31P MAS NMR spectra shown in Figure 6 displayed a Q1B signal at ca. 25 ppm and broad side
bands for 2, typical for a monophosphate ester. For 3, Q1 and Q2 resonances of the tripolyphosphate chain
appeared as a single, unresolved, strong peak with a shoulder on the high frequency side that can be assigned
to Q2B .
Figure 5. FTIR spectra of sodium ascorbatoborate, 2,
and 3.
Figure 6. 31P MAS NMR spectra of 2 and 3.
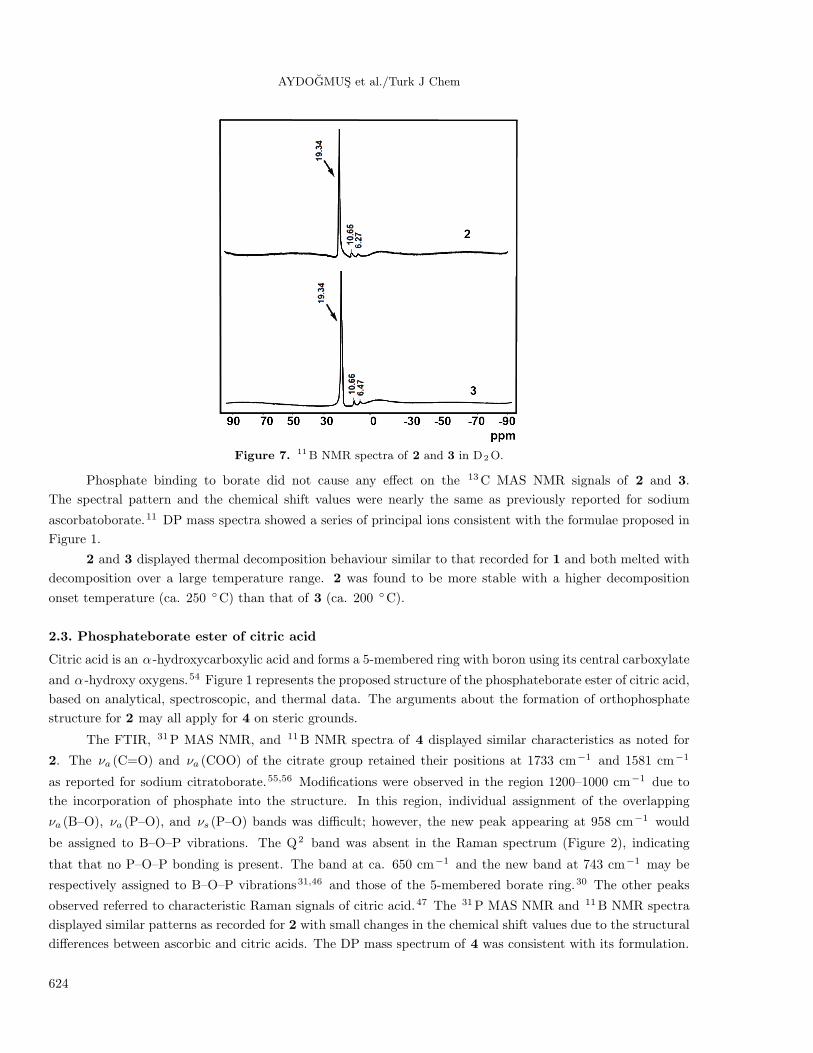
Figure 7 shows the 11B NMR spectra of 2 and 3 in D2O. The spectra revealed that 3 types of boron
species were present in the solutions. The strong peak at δ ≈19 is due to boric acid resulting from the hydrolysis
of the compounds. The weaker signal at ∼6 ppm is characteristic for B4 of 5-membered mono-chelate rings41,42
and is normally expected for the undissociated compound. The third signal at ∼10 ppm, however, refers to
B4 of 5-membered bis-chelate rings.41,48−53 A plausible explanation for the existence of this peak would be
the formation of a bis-chelate structure between borate and the side chain OH groups of ascorbate while the
phosphate group undergoes hydrolytic cleavage. B3 :B4 peak area ratio slightly increased on going from 2 to 3
due to the increasing tendency for hydrolysis with a longer phosphate chain.
623
AYDOGMUS et al./Turk J Chem
Figure 7. 11B NMR spectra of 2 and 3 in D2O.
Phosphate binding to borate did not cause any effect on the 13C MAS NMR signals of 2 and 3.
The spectral pattern and the chemical shift values were nearly the same as previously reported for sodium
ascorbatoborate.11 DP mass spectra showed a series of principal ions consistent with the formulae proposed in
Figure 1.
2 and 3 displayed thermal decomposition behaviour similar to that recorded for 1 and both melted with
decomposition over a large temperature range. 2 was found to be more stable with a higher decomposition
onset temperature (ca. 250 ◦C) than that of 3 (ca. 200 ◦C).
2.3. Phosphateborate ester of citric acid
Citric acid is an α -hydroxycarboxylic acid and forms a 5-membered ring with boron using its central carboxylate
and α -hydroxy oxygens.54 Figure 1 represents the proposed structure of the phosphateborate ester of citric acid,
based on analytical, spectroscopic, and thermal data. The arguments about the formation of orthophosphate
structure for 2 may all apply for 4 on steric grounds.
The FTIR, 31P MAS NMR, and 11B NMR spectra of 4 displayed similar characteristics as noted for
2. The νa (C=O) and νa (COO) of the citrate group retained their positions at 1733 cm−1 and 1581 cm−1
as reported for sodium citratoborate.55,56 Modifications were observed in the region 1200–1000 cm−1 due to
the incorporation of phosphate into the structure. In this region, individual assignment of the overlapping
νa (B–O), νa (P–O), and νs (P–O) bands was difficult; however, the new peak appearing at 958 cm−1 would
be assigned to B–O–P vibrations. The Q2 band was absent in the Raman spectrum (Figure 2), indicating
that that no P–O–P bonding is present. The band at ca. 650 cm−1 and the new band at 743 cm−1 may be
respectively assigned to B–O–P vibrations31,46 and those of the 5-membered borate ring.30 The other peaks
observed referred to characteristic Raman signals of citric acid.47 The 31P MAS NMR and 11B NMR spectra
displayed similar patterns as recorded for 2 with small changes in the chemical shift values due to the structural
differences between ascorbic and citric acids. The DP mass spectrum of 4 was consistent with its formulation.
624
AYDOGMUS et al./Turk J Chem
3. Conclusions
Possible formation of –C–O–B–O–P– linkages in aqueous media was examined by adding orthophosphate
to solutions of boric acid and carboxylic acid functionalised biomolecules. Species containing ortho- to tri-
phosphate groups attached to the borate esters of salicylic, ascorbic, and citric acids were obtained and
structurally defined by FTIR, Raman, and NMR studies.
The length of the phosphate chain increased nonlinearly with the amount of NaH2PO4 employed in
the condensation reactions, due to the water-buffered concentration of phosphate species (ortho-, pyro-, or
tripolyphosphate) present in the reaction medium.57 Steric properties of the biomolecule and the nature of the
borate chelate could have also played a prominent role in influencing the size of the attached phosphate groups.
Orthophosphate structures were obtained with ascorbic and citric acids, which both form 5-membered borate
rings and involve side chains that impose steric effects on the attached phosphate group. Salicylic acid, on the
other hand, gave a triphosphate product with equimolar reactants, experiencing a less steric repulsion with the
planar organic molecule through a 6-membered borate chelate.
The compounds were thermally stable but underwent hydrolytic cleavage in water via disruption of the
B–O–P linkages first, followed by the slower hydrolysis of C–O–B linkages as verified by 11B NMR studies.
While no details of the mechanism are yet available to us, the model studies presented here with carboxylic
acids indicate that formation of –C–O–B–O–P– linkages in water can occur under simple conditions. The results
suggest a possible role for boron in linking biomolecules to inorganic phosphate providing that the appropriate
concentration and pH requirements are established.
4. Experimental studies
4.1. General
The reagents salicylic acid (C7H6O3 , Merck), sodium ascorbate (NaC6H7O6 , Merck), citric acid (C6H8O7 ,
Sigma), NaHCO3 (Merck), H3BO3 (Merck), NaH2PO4 .2H2O (Merck), and acetone (Riedel-Haen) were used
as received. All experiments were performed in deionised water. Inert reaction conditions and deoxygenated
water were employed in experiments with ascorbic acid. C and H contents were determined by a CHNS-932
LECO model analytical instrument. Boron contents were determined by carminic acid method;58 phosphate
analyses were carried out by a DIONEX-ICS-100 model ion chromatograph and sodium analyses by a Jenway
PFP:7 flame photometer. Crystal water determination and thermal analyses (thermogravimetric analysis (TGA)
and differential thermal analysis (DTA)) were performed by the Shimadzu DTG-60H system, in a dynamic
nitrogen atmosphere (15 mL/min), at a heating rate of 10 ◦C/min, in platinum sample vessels with reference to
α -Al2O3 . Melting points were determined by an OptiMelt Automated Melting Point System. FTIR spectra
were measured in the 450–4000 cm−1 range with a PerkinElmer Spectrum One instrument, by using the KBr
pellet technique. Raman spectra of samples were recorded using a Labram 800 HR Raman spectrometer (Jobin
Yvon) with a He–Ne Laser source emitting at 633 nm, 600–1200 grooves/mm holographic grating, and a charge
coupled device (CCD) detector. Solid state 13C NMR spectra were recorded in 280–0 ppm with a Bruker
Avance Ultrashield TM 300 MHz WB instrument, by using a 4-mm MAS probe at 5 kHz spin rate and contact
time of 2 ms at 293 K. 11B NMR spectra were recorded with a Bruker Ultrashield TM 500 MHz instrument in
D2O with reference to BF3 .Et2O. 31P MAS NMR spectra were recorded with a Bruker UltraShield 300 MHz
instrument with reference to H3PO4 by using a 4-mm MAS probe. The spectrometer frequency was 121.49
MHz and thus 1 ppm amounts to 121.49 Hz. Mass spectra were recorded by an Agilent 5973 Mass Spectrometer
in positive ion mode with a direct insertion probe from 40 ◦C to 450 ◦C at 5 ◦C/min.
625
AYDOGMUS et al./Turk J Chem
4.2. Reaction conditions
Borate monoesters were prepared in situ by adding solid H3BO3 to the solutions containing the metal salt of
the respective acid in a 1:1 molar ratio, as described previously.11,19,20,54 After complete dissolution of H3BO3
was achieved, NaH2PO4 .2H2O was added to the solution containing the mono-ester of the bio-acid. The
mixture was gently heated and stirred in a rotary evaporator until complete dissolution. The solution was
then concentrated to a syrup into which cold acetone was added. The solidified white product was separated,
washed with acetone, and dried in a vacuum desiccator. Employing sodium salicylate (8.0 g, 0.05 mol), boric
acid (3.1 g, 0.05 mol), and NaH2PO4·2H2O (7.8 g, 0.05 mol) (1) in 250 mL of water was helpful for product
solidification and separation with quantitative yields. The experiments with ascorbic acid were continued with
the same conditions employed for 1 (2) and by employing a higher amount of NaH2PO4·2H2O (23.5 g, 0.15
mol) (3), with citric acid (4) as for 1, after converting the acids into their corresponding mono sodium salts.
All the products were obtained as white hygroscopic powders with high solubility in water.
4.3. Characterisation data
Schematic structures for 1–4 are shown in Figure 1; experimental data for them are given below.
1. Found (%): C 12.89, H 2.36, B 1.82, P 16.20, Na 16.8, H2O ca. 16.0. Calculated for BC7H6Na4P3O14 .
6H2O (MW 618 g mol−1) (%): C 13.59, H 2.91, B 1.78, P 15.05, Na 14.89, H2O 17.47. mp 330 ◦C. 11B/ppm:
19.2, 2.8. 31P/ppm: 22.45. IR/cm−1 : 1692, 1614, 1482, 1351, 1263, 1250, 1150, 1075, 976, 753, 695, 530.
Raman/cm−1 : 590, 641, 995, 1167. MS/m/z : 486, 303, 264, 236, 164.
2. Found (%): C 18.09, H 3.25, B 3.21, H2O ca. 10.0. Calculated for BC6H10Na2PO11 .2H2O (MW
380 g mol−1) (%): C 18.94, H 3.68, B 2.89, H2O 9.47. mp 140 ◦C. 11B/ppm: 19.3, 10.6, 6.3. 31P/ppm: 25.03.
13C/ppm: 169, 147, 110, 70, 62, 57. IR/cm−1 : 1748, 1655, 1408, 1300–850 (broad), 760, 518. Raman/cm−1 :
613, 744, 914, 929. MS/ m/z 279, 256, 236, 185, 167, 97, 83, 44.
3. Found (%): C 11.18, H 2.87, B 2.20, H2O ca. 11.0. Calculated for BC6H10Na4P3O17 .4H2O (MW
621 g mol−1) (%): C 11.59, H 2.90, B 1.77, H2O 11.59 mp 128 ◦C. 11B/ppm: 19.3, 10.6, 6.5. 31P/ppm: 26.52.
IR/cm−1 : 1750, 1655, 1400–800 (broad), 525.
4. Found (%): C 17.89, H 2.89, B 2.40, H2O ca. 10.0. Calculated for BC6H10Na2PO11 .2H2O (MW
396 g mol−1) (%): C 18.18, H 3.53, B 1.77, H2O 9.09. mp 122 ◦C.
11B/ppm: 19.4, 9.1, 5.2. 31P/ppm: 25.56. IR/cm−1 : 1733, 1406, 1323, 1119, 958, 517. Raman/cm−1 :
214, 380, 557, 564, 743, 915, 928, 1029, 1078, 1102, 1129, 1158. MS/m/z 337, 321, 97, 44.
Acknowledgements
This work was financially supported by the Scientific and Technological Research Council of Turkey (project:
109T904). The authors acknowledge Prof Ali Guner and Dr Serap Kavlak for recording the Raman spectra,
and Prof Bekir Salih and Dr Omur Celikbicak for the DP-MS spectra.
References
1. Cairns-Smith, A. G. Seven Clues to the Origin of Life, Cambridge University Press: Cambridge, UK, 1985.
2. Fitz, D.; Reiner, H.; Rode, B. M. Pure Appl. Chem. 2007, 79, 2101–2117.
3. Arrhenius, G.; Sales, B.; Mojzsis, S.; Lee, T. J. Theor. Biol. 1987, 187, 503–522.
626
AYDOGMUS et al./Turk J Chem
4. Arrhenius, G. O. Helv. Chim. Acta 2003, 86, 1569–1586.
5. Schwartz, A. W. Phil. Trans. R. Soc. B. 2006, 361, 1743–1749.
6. Ricardo, A.; Carrigan, M. A.; Olcott, A. N.; Benner, S. A. Science 2004, 303, 196.
7. Amaral, A. F.; Marques, M. M.; da Silva, J. A. L.; da Silva, J. J. R. F. New J. Chem. 2008, 32, 2043–2049.
8. Scorei, R. Orig. Life Evol. Biosph. 2012, 42, 3–17.
9. Prieur, B. E. C. R. Acad. Sci. Ser. IIC Chem. 2001, 4, 667–670.
10. Scorei, R.; Cimpoiasu, V. M. Orig. Life Evol. Biosph. 2006, 36, 1–11.
11. Kose, D. A.; Zumreoglu-Karan, B. New J. Chem. 2009, 33, 1874–1881.
12. Saladino, R.; Barontini, M.; Cossetti, C.; Di Mauro, E.; Crestini, C. Orig. Life Evol. Biosph. 2011, 41, 317–330.
13. Holm, N. G.; Dumont, M.; Ivarsson, M.; Konn, C. Geochem. T. 2006, 7, 1–7.
14. Nikonov, G. N.; Balyeva, A. S. Russ. Chem. Rev. 1992, 61, 335–351.
15. Hauf, C.; Kniep, E. R. Z. Kristallogr. 1996, 211, 705–706.
16. Boy, I.; Hauf, C.; Kniep, R. Z. Naturforsch B 1998, 53, 631–633.
17. Bontchev, R. P.; Sevov, S. C. Inorg. Chem. 1996, 35, 6910–6911.
18. Li, M. R.; Mao, S. Y.; Huang, Y. X.; Mi, J. X.; Wei, Z. B.; Zhao, J. T.; Kniep R. Z. Krist. - New Cryst. St. 2002,
217, 165–166.
19. Kose, D. A.; Zumreoglu-Karan, B.; Hokelek, T.; Sahin, E. Inorg. Chim Acta 2010, 363, 4031–4037.
20. Kose, D. A.; Zumreoglu-Karan, B.; Hokelek, T. Inorg. Chim. Acta 2011, 375, 236–241.
21. Chvertkina, L. V.; Khoklov, P. S.; Mironov, V. F. Russ. Chem. Rev. 1992, 61, 1009–1021.
22. Van Duin, M.; Peters, J. A.; Kieboom, A. P. G.; Van Bekkum, H. Tetrahedron 1984, 40, 2901–2911.
23. Kulaev, I. S.; Vagabov, V. M.; Kulakovskaya, T. V. The Biochemistry of Inorganic Polyphosphates, Wiley: New
York, NY, USA, 2004, pp. 3–14.
24. Kirkpatrick, R. J.; Brow, R. K. Solid State Nucl. Mag. Res. 1995, 5, 9–21.
25. Wiench, J. M.; Pruski, M.; Tischendorf, B.; Otaigbe, J. U.; Sales, B. C. J. Non-Cryst. Solids 2000, 263, 101–110.
26. Carta, D.; Qiu, D.; Guerry, I.; Ahmed, P.; Abou Neel, E. A.; Knowles, J. C.; Smith, M. E.; Newport, R. J. J.
Non-Cryst Solids 2008, 354, 3671–3677.
27. Peak, D.; Luther, G. W.; Sparks, D. L. Geochim. Cosmochim. Acta 2003, 67, 2551–2560.
28. Efimov, A. M. J. Non-Cryst. Solids 1997, 209, 209–226.
29. Saranti, A.; Koutselas, I.; Karakassides, M. A. J. Non-Cryst. Solids 2006, 352, 390–398.
30. Oertel, R. P. Inorg. Chem. 1972, 11, 544–549.
31. Gaylord, S.; Tincher, B.; Petit, L.; Richardson, K. Mater. Res. Bull. 2009, 44, 1031–1035.
32. Kim, N. J.; Im, S. H.; Kim, D. H.; Yoon, D. K.; Ryu, B. K. Electron. Mater. Lett. 2010, 6, 103–106.
33. Turner, B. L.; Mahieu, N.; Condron, L. M. Soil Sci. Soc. Am. J. 2003, 67, 497–510.
34. Brow, R. K. J. Non-Cryst. Solids 2000, 263 & 264, 1–28.
35. Munoz, F.; Montagne, L.; Pascual, L.; Duran, A. J. Non-Cryst. Solids 2009, 355, 2571–2577.
36. Shah, K. V.; Goswami, M.; Deot, M. N.; Sarkar, A.; Manikandan, S.; Shrikhande, V. K.; Kothiyal, G. P. Bull.
Mater. Sci. 2006, 29, 43–48.
37. Grimmer, A. R.; Muller, D.; Gozel, G.; Kniep, R. Fresen. J. Anal. Chem. 1997, 357, 485–488.
38. Elbers, S.; Strojek, W.; Koudelka, L.; Eckert, H. Solid State Nucl. Magn. Reson. 2005, 27, 65–76.
39. Beckett, M. A.; Rugen-Hankey, M. P.; Varma, K. S. J. Sol-Gel Sci. Techn. 2006, 39, 95–101.
627

AYDOGMUS et al./Turk J Chem
40. Kennedy, J. D. In: Mason J. (ed) Multinuclear NMR, Plenum: New York, NY, USA, 1987, 221-253.
41. Bishop, M.; Shahid, N.; Yang, J.; Barron, A. R. Dalton Trans. 2004, 7, 2621–2634.
42. Tossell, J. A. Geochim. Cosmochim. Acta 2006, 70, 5089–5103.
43. Kose, D. A.; Zumreoglu-Karan, B. Chem. Pap. 2012, 66, 54–60.
44. Michelmore, A.; Gong, W.; Jenkins, P.; Ralston, J. Phys. Chem. Chem. Phys. 2000, 2, 2985–2992.
45. Gong, W. Int. J. Miner. Process. 2001, 63, 147–165.
46. Vyatchina, V. G.; Perelyaeva, L. A.; Zuev, M. G.; Mamoshin, V. L. Glass. Phys. Chem. 2003, 29, 522–525.
47. De Gelder, J.; De Gussem, K.; Vandenabeele, P.; Moens, L.; J. Raman Spectrosc. 2007, 38, 1133–1147.
48. Matsunaga, T.; Nagata, T. Anal. Sci. 1995, 11, 889–892.
49. Shao, C. Y.; Matsuoka, S.; Miyazaki, Y.; Yoshimura, K. Anal. Sci. 2001, 17, i1475–i1478.
50. Beckett, M. A.; Bland, C. C.; Varma, K. S. Polyhedron 2008, 27, 2226–2230.
51. Dawber, J. G.; Green, S. I. E. J. Chem. Soc. Faraday Trans.I 1986, 82, 3407–3413.
52. Dawber, J. G. J. Chem. Soc. Faraday Trans. I 1987, 83, 771–777.
53. Dawber, J. G.; Green, S. I. E.; Dawber, J. C.; Gabrail, S. J. Chem. Soc. Faraday Trans. I 1988, 84, 41–45.
54. Kose, D. A. Dissertation, Hacettepe University, Turkey, 2008.
55. Zviedre, I. I.; Belyakov, S. V. J. Struct. Chem. 2009, 50, 114–119.
56. Zviedre, I. I.; Belyakov, S. V. Russ. J. Inorg. Chem. 2009, 54, 1390–1395.
57. Pasek, M. A. P. Natl. Acad. Sci. USA 2008, 105, 853–858.
58. Weicher, F. H. Standard Methods of Chemical Analysis, Part B, 6th edn. Van Nostrand: New York, NY, USA,
1963, pp. 2406–2407.
628
Recommended