Organizational Network Mapping 393
© Copyright 1996, The Advisory Board Company. All rights reserved.
TH
E
AD
V
I S O R Y
BO
AR
D
Communities of Knowledge
Tactic #17: Organizational Network Mapping ............................................ 395
Tactic #18: Human Asset “Yellow Pages” .................................................... 411
Tactic #19: Knowledge Transfer Engineering .............................................. 439
Exposure to New Business Disciplines
Tactic #20: Intellectual Capital Accounting ................................................. 457
Tactic #21: Human Resources “Executive Producer” ................................. 475
Tactic #22: Human Asset Planning .............................................................. 497
Chapter Four
Managing Core Competencies of the Corporation

394 Managing Core Competencies of the Organization
© Copyright 1996, The Advisory Board Company. All rights reserved.
Organizational Network Mapping 395
© Copyright 1996, The Advisory Board Company. All rights reserved.
Tactic #17
Organizational Network Mapping
Definition
Based on simple set of inputs, computer generates graphical and quantitative representationsof informal knowledge networks within an organization. Tactic driven by failure oftraditional process and organizational maps to capture the increasingly complex nature ofwork processes. Tactic represents most accurate, systematic means yet seen to identify keyvalue creators, informal knowledge communities that drive corporate core competencies.
Corporate Leadership Council Grade: A
Managing Core Competencies of the Organization
396 Managing Core Competencies of the Organization
© Copyright 1996, The Advisory Board Company. All rights reserved.
Revealing the
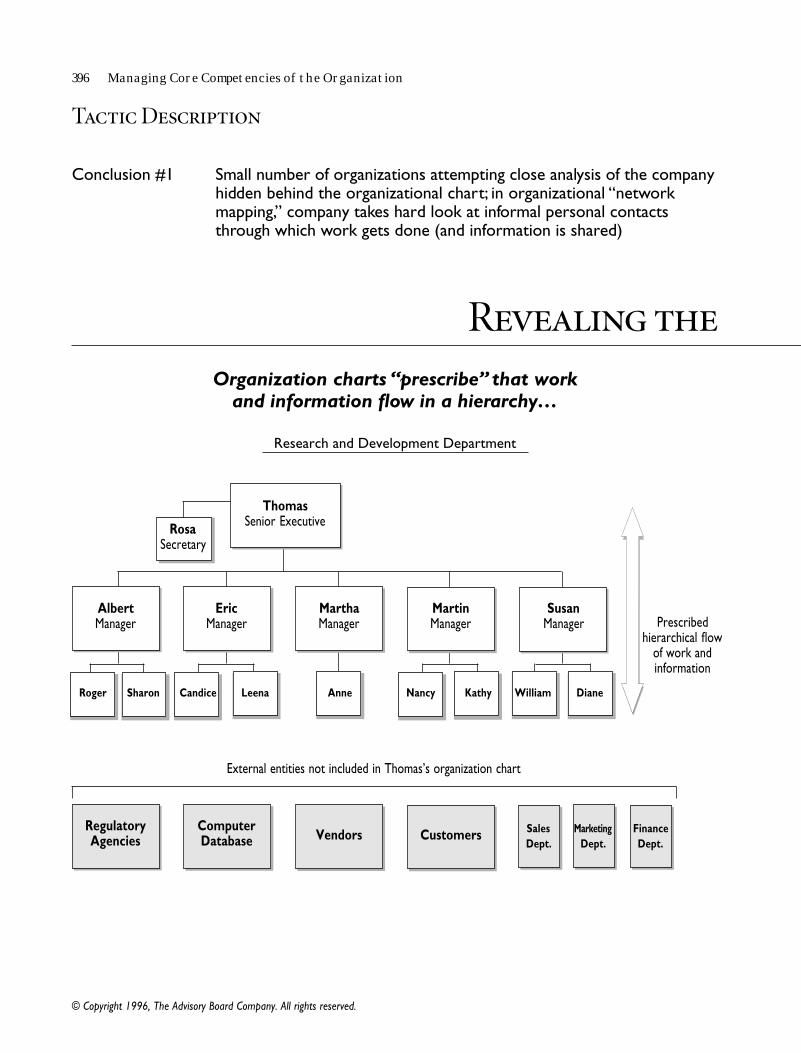
ThomasSenior Executive
Research and Development Department
CustomersVendorsComputerDatabase
RegulatoryAgencies
Organization charts “prescribe” that workand information flow in a hierarchy…
Prescribedhierarchical flow
of work andinformation
RosaSecretary
External entities not included in Thomas’s organization chart
Conclusion #1 Small number of organizations attempting close analysis of the companyhidden behind the organizational chart; in organizational “networkmapping,” company takes hard look at informal personal contactsthrough which work gets done (and information is shared)
Tactic Description
AlbertManager
EricManager
MarthaManager
MartinManager
SusanManager
Candice Leena Nancy Kathy William DianeAnneRoger Sharon
SalesDept.
MarketingDept.
FinanceDept.
Organizational Network Mapping 397
© Copyright 1996, The Advisory Board Company. All rights reserved.
Albert
Diane
Vendors
Customers
William
Sharon Roger
Susan
Kathy
Martin
Nancy
Eric Leena
Candice
AnneMartha
Thomas
Rosa
A
Work Group E
B
C
D
Database
Sales Dept.
Marketing Dept.
Finance Dept.
Regulatory Agencies
Work Group
Work Group
Work Group
Work Group
Work Group
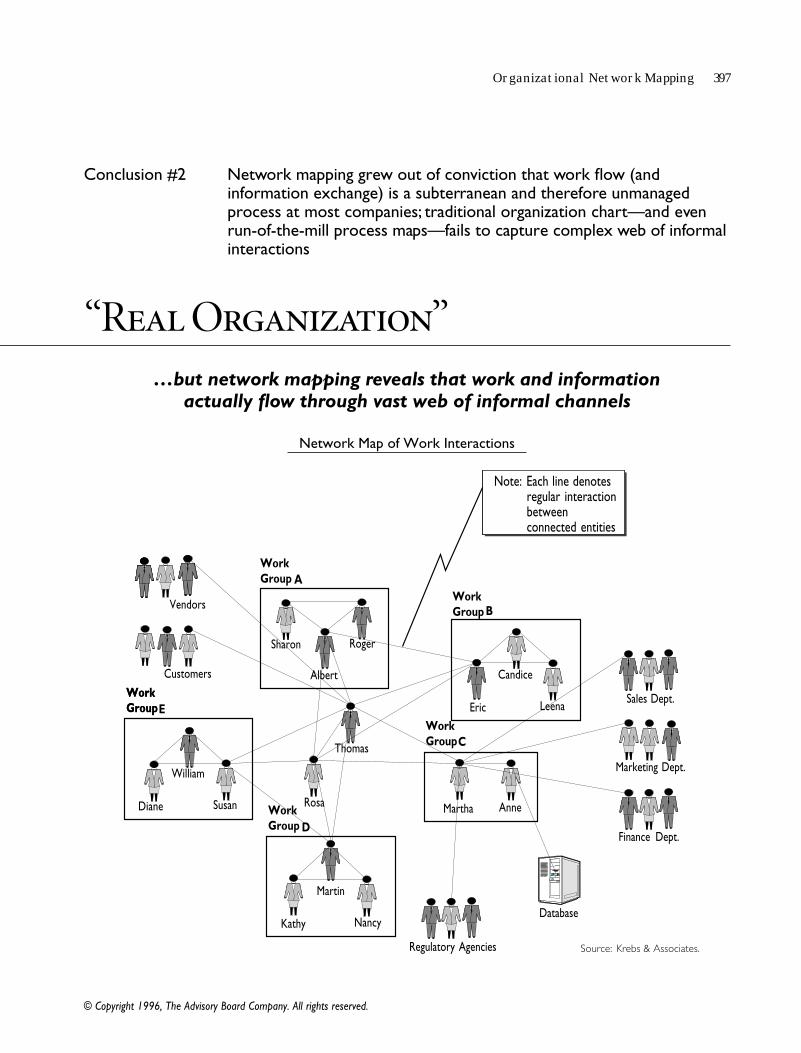
…but network mapping reveals that work and informationactually flow through vast web of informal channels
Network Map of Work Interactions
“Real Organization”
Conclusion #2 Network mapping grew out of conviction that work flow (andinformation exchange) is a subterranean and therefore unmanagedprocess at most companies; traditional organization chart—and evenrun-of-the-mill process maps—fails to capture complex web of informalinteractions
Source: Krebs & Associates.
Note: Each line denotesregular interactionbetweenconnected entities
398 Managing Core Competencies of the Organization
© Copyright 1996, The Advisory Board Company. All rights reserved.
Conclusion #3 Goal is to illuminate informal organization in order to identify not onlyclear breakdowns in cooperation and sharing but also opportunities tostrengthen viable but imperfect elements of the “collaborative fabric”
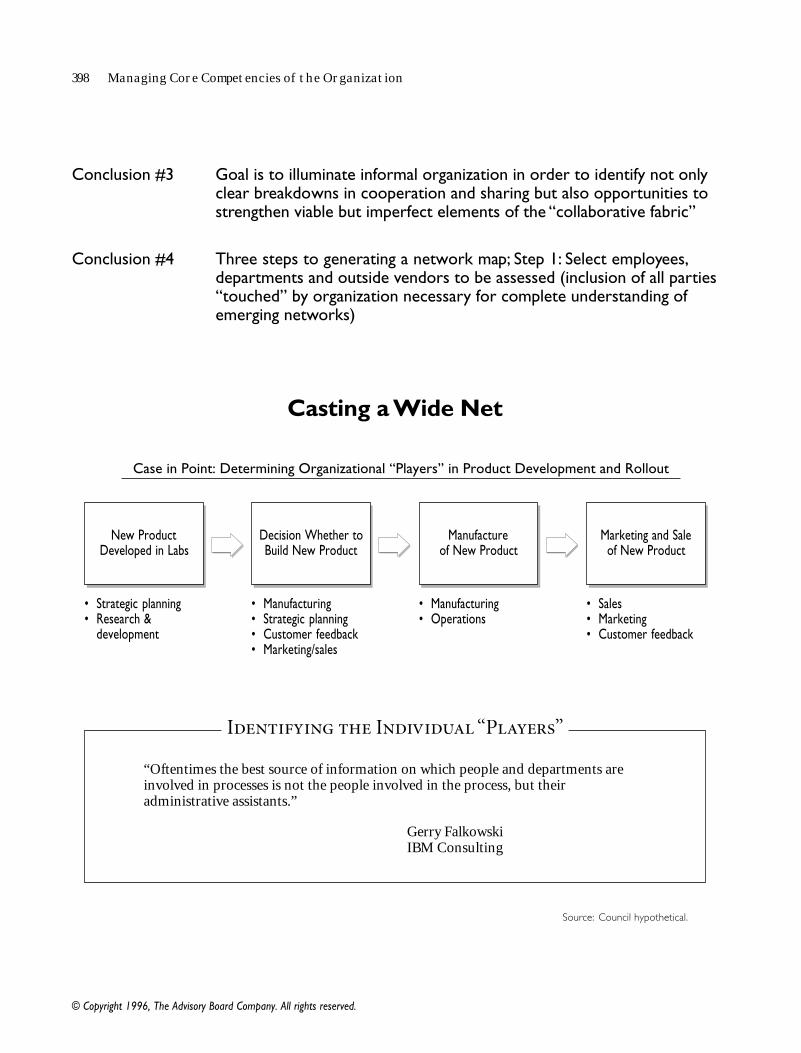
Conclusion #4 Three steps to generating a network map; Step 1: Select employees,departments and outside vendors to be assessed (inclusion of all parties“touched” by organization necessary for complete understanding ofemerging networks)
New ProductDeveloped in Labs
Decision Whether toBuild New Product
Manufactureof New Product
Marketing and Saleof New Product
• Sales• Marketing• Customer feedback
• Manufacturing• Operations
• Manufacturing• Strategic planning• Customer feedback• Marketing/sales
• Strategic planning• Research &
development
Case in Point: Determining Organizational “Players” in Product Development and Rollout
Casting a Wide Net
“Oftentimes the best source of information on which people and departments areinvolved in processes is not the people involved in the process, but theiradministrative assistants.”
Gerry FalkowskiIBM Consulting
Identifying the Individual “Players”
Source: Council hypothetical.
Organizational Network Mapping 399
© Copyright 1996, The Advisory Board Company. All rights reserved.
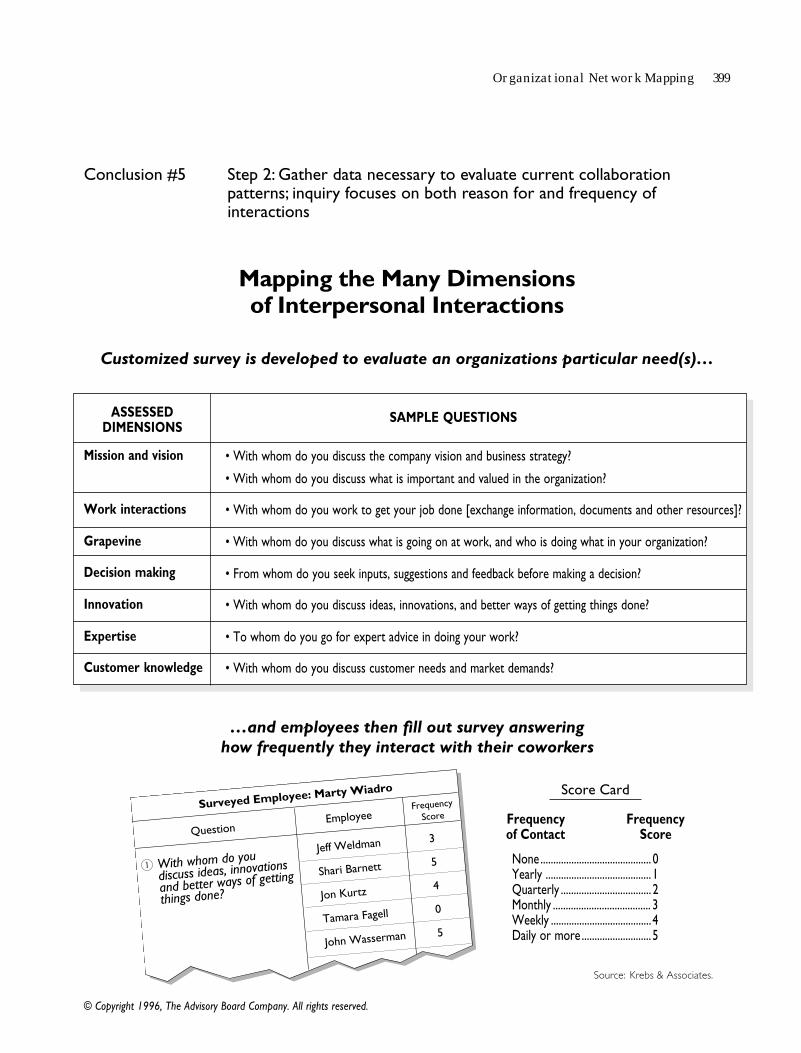
Mission and vision
Work interactions
Grapevine
Decision making
Innovation
Expertise
Customer knowledge
• With whom do you discuss the company vision and business strategy?
• With whom do you discuss what is important and valued in the organization?
• With whom do you work to get your job done [exchange information, documents and other resources]?
• With whom do you discuss what is going on at work, and who is doing what in your organization?
• From whom do you seek inputs, suggestions and feedback before making a decision?
• With whom do you discuss ideas, innovations, and better ways of getting things done?
• To whom do you go for expert advice in doing your work?
• With whom do you discuss customer needs and market demands?
Conclusion #5 Step 2: Gather data necessary to evaluate current collaborationpatterns; inquiry focuses on both reason for and frequency ofinteractions
Surveyed Employee: Marty Wiadro
QuestionEmployee
Frequency
Score
With whom do you
discuss ideas, innovations
and better ways of getting
things done?
1
Jeff Weldman
Shari Barnett
Jon Kurtz
Tamara Fagell
John Wasserman
3
5
4
0
5
Score Card
Frequency Frequencyof Contact Score
None........................................... 0Yearly ......................................... 1Quarterly ................................... 2Monthly ...................................... 3Weekly .......................................4Daily or more ........................... 5
…and employees then fill out survey answeringhow frequently they interact with their coworkers
Mapping the Many Dimensionsof Interpersonal Interactions
Customized survey is developed to evaluate an organizations particular need(s)…
ASSESSEDDIMENSIONS
SAMPLE QUESTIONS
Source: Krebs & Associates.
400 Managing Core Competencies of the Organization
© Copyright 1996, The Advisory Board Company. All rights reserved.
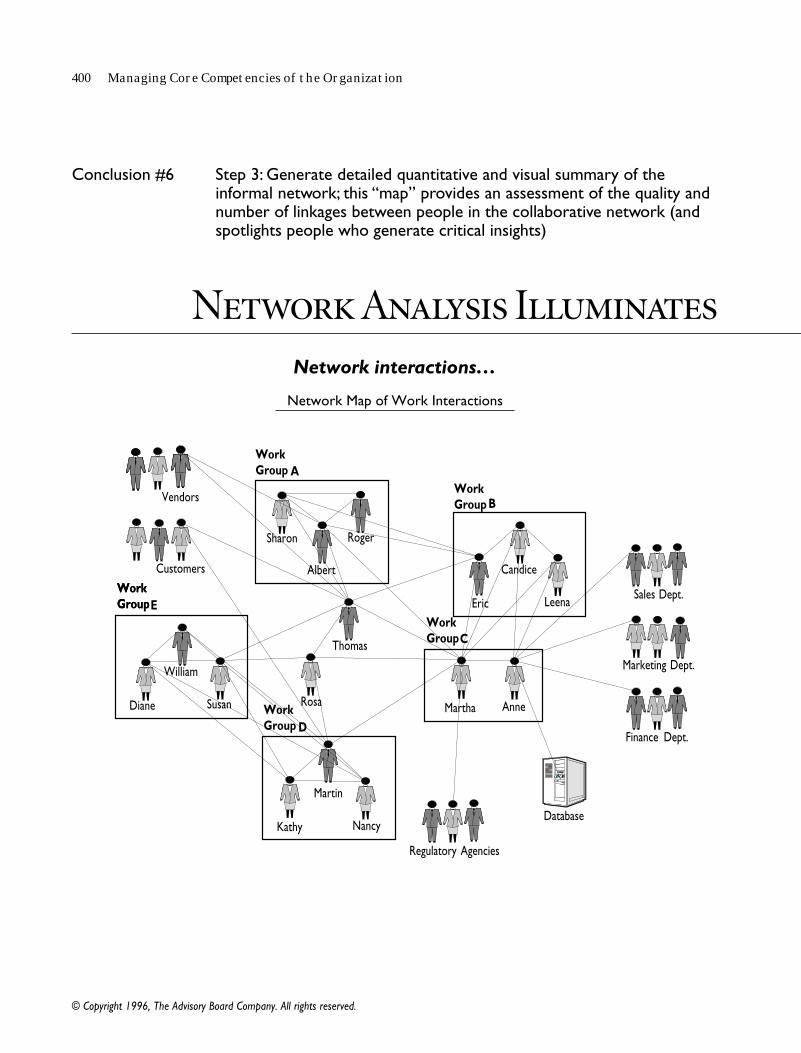
Network Analysis IlluminatesNetwork interactions…
Network Map of Work Interactions
Conclusion #6 Step 3: Generate detailed quantitative and visual summary of theinformal network; this “map” provides an assessment of the quality andnumber of linkages between people in the collaborative network (andspotlights people who generate critical insights)
Albert
Diane
Vendors
Customers
William
Sharon Roger
Susan
Kathy
Martin
Nancy
Eric Leena
Candice
AnneMartha
Thomas
Rosa
A
Work Group E
B
C
D
Database
Sales Dept.
Marketing Dept.
Finance Dept.
Regulatory Agencies
Work Group
Work Group
Work Group
Work Group
Work Group
Organizational Network Mapping 401
© Copyright 1996, The Advisory Board Company. All rights reserved.
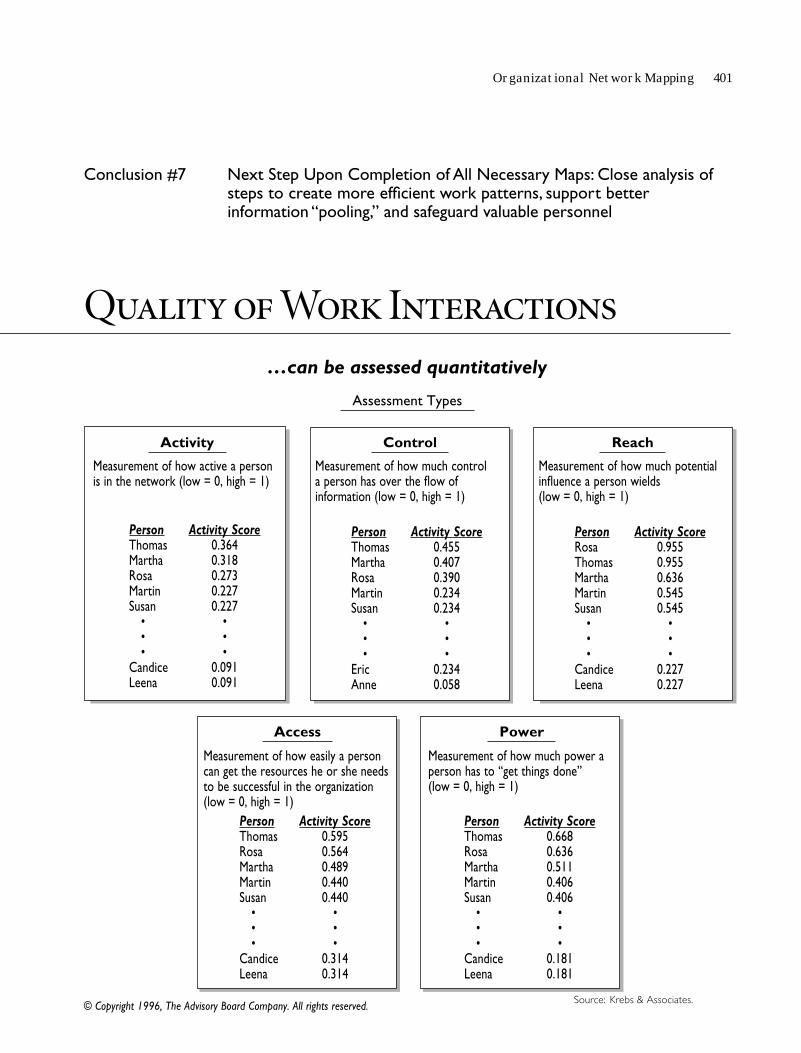
Quality of Work Interactions…can be assessed quantitatively
Assessment Types
Conclusion #7 Next Step Upon Completion of All Necessary Maps: Close analysis ofsteps to create more efficient work patterns, support betterinformation “pooling,” and safeguard valuable personnel
Reach
Measurement of how much potentialinfluence a person wields(low = 0, high = 1)
Control
Measurement of how much controla person has over the flow ofinformation (low = 0, high = 1)
Activity
Measurement of how active a personis in the network (low = 0, high = 1)
Person Activity ScoreThomas 0.455Martha 0.407Rosa 0.390Martin 0.234Susan 0.234
• •• •• •
Eric 0.234Anne 0.058
Person Activity ScoreThomas 0.364Martha 0.318Rosa 0.273Martin 0.227Susan 0.227
• •• •• •
Candice 0.091Leena 0.091
Person Activity ScoreRosa 0.955Thomas 0.955Martha 0.636Martin 0.545Susan 0.545
• •• •• •
Candice 0.227Leena 0.227
Access
Measurement of how easily a personcan get the resources he or she needsto be successful in the organization(low = 0, high = 1)
Person Activity ScoreThomas 0.595Rosa 0.564Martha 0.489Martin 0.440Susan 0.440
• •• •• •
Candice 0.314Leena 0.314
Power
Measurement of how much power aperson has to “get things done”(low = 0, high = 1)
Person Activity ScoreThomas 0.668Rosa 0.636Martha 0.511Martin 0.406Susan 0.406
• •• •• •
Candice 0.181Leena 0.181
Source: Krebs & Associates.
402 Managing Core Competencies of the Organization
© Copyright 1996, The Advisory Board Company. All rights reserved.
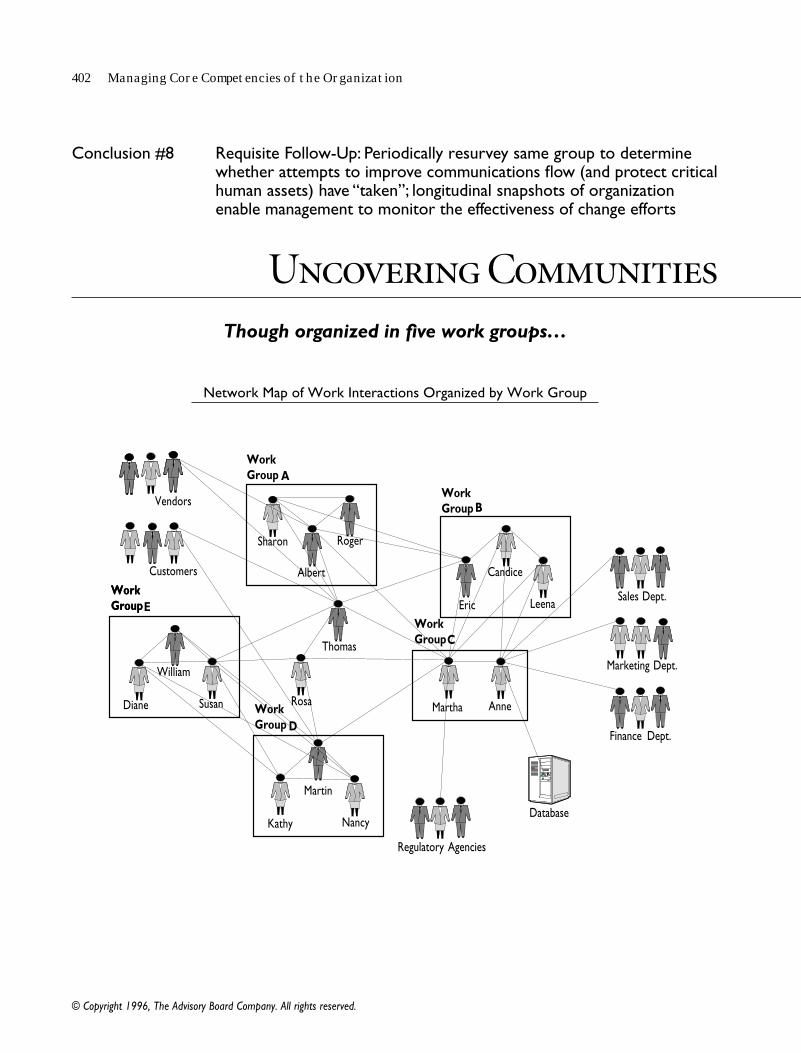
Uncovering CommunitiesThough organized in five work groups…
Network Map of Work Interactions Organized by Work Group
Albert
Diane
Vendors
Customers
William
Sharon Roger
Susan
Kathy
Martin
Nancy
Eric Leena
Candice
AnneMartha
Thomas
Rosa
A
Work Group E
B
C
D
Database
Sales Dept.
Marketing Dept.
Finance Dept.
Regulatory Agencies
Work Group
Work Group
Work Group
Work Group
Work Group
Conclusion #8 Requisite Follow-Up: Periodically resurvey same group to determinewhether attempts to improve communications flow (and protect criticalhuman assets) have “taken”; longitudinal snapshots of organizationenable management to monitor the effectiveness of change efforts
Organizational Network Mapping 403
© Copyright 1996, The Advisory Board Company. All rights reserved.
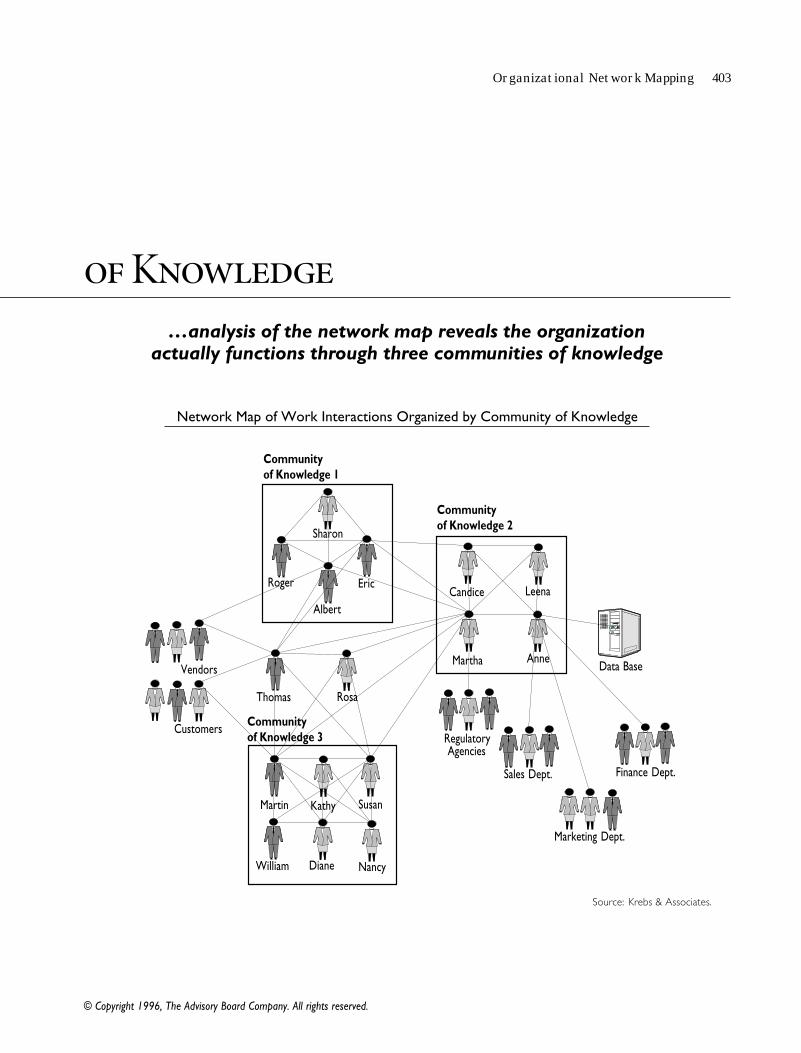
of Knowledge…analysis of the network map reveals the organization
actually functions through three communities of knowledge
Network Map of Work Interactions Organized by Community of Knowledge
Source: Krebs & Associates.
Roger
Albert
Diane
Vendors
Customers
William
Sharon
SusanMartin Kathy
Nancy
EricCandice Leena
AnneMartha
Rosa
Community of Knowledge 1
Data Base
Sales Dept.
Marketing Dept.
Finance Dept.
Regulatory Agencies
Thomas
Community of Knowledge 2
Community of Knowledge 3
404 Managing Core Competencies of the Organization
© Copyright 1996, The Advisory Board Company. All rights reserved.
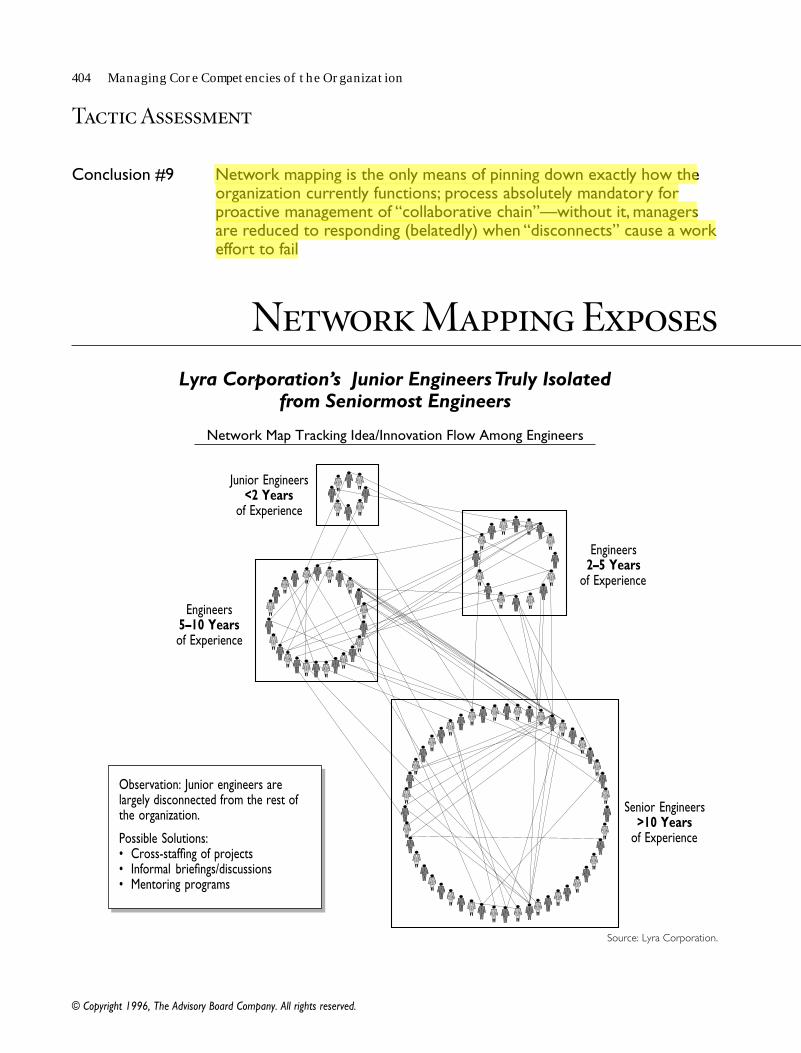
Conclusion #9 Network mapping is the only means of pinning down exactly how theorganization currently functions; process absolutely mandatory forproactive management of “collaborative chain”—without it, managersare reduced to responding (belatedly) when “disconnects” cause a workeffort to fail
Tactic Assessment
Network Mapping ExposesLyra Corporation’s Junior Engineers Truly Isolated
from Seniormost Engineers
Network Map Tracking Idea/Innovation Flow Among Engineers
Junior Engineers<2 Years
of Experience
Engineers2–5 Years
of Experience
Engineers5–10 Yearsof Experience
Senior Engineers>10 Years
of Experience
Observation: Junior engineers arelargely disconnected from the rest ofthe organization.
Possible Solutions:• Cross-staffing of projects• Informal briefings/discussions• Mentoring programs
Source: Lyra Corporation.
Organizational Network Mapping 405
© Copyright 1996, The Advisory Board Company. All rights reserved.
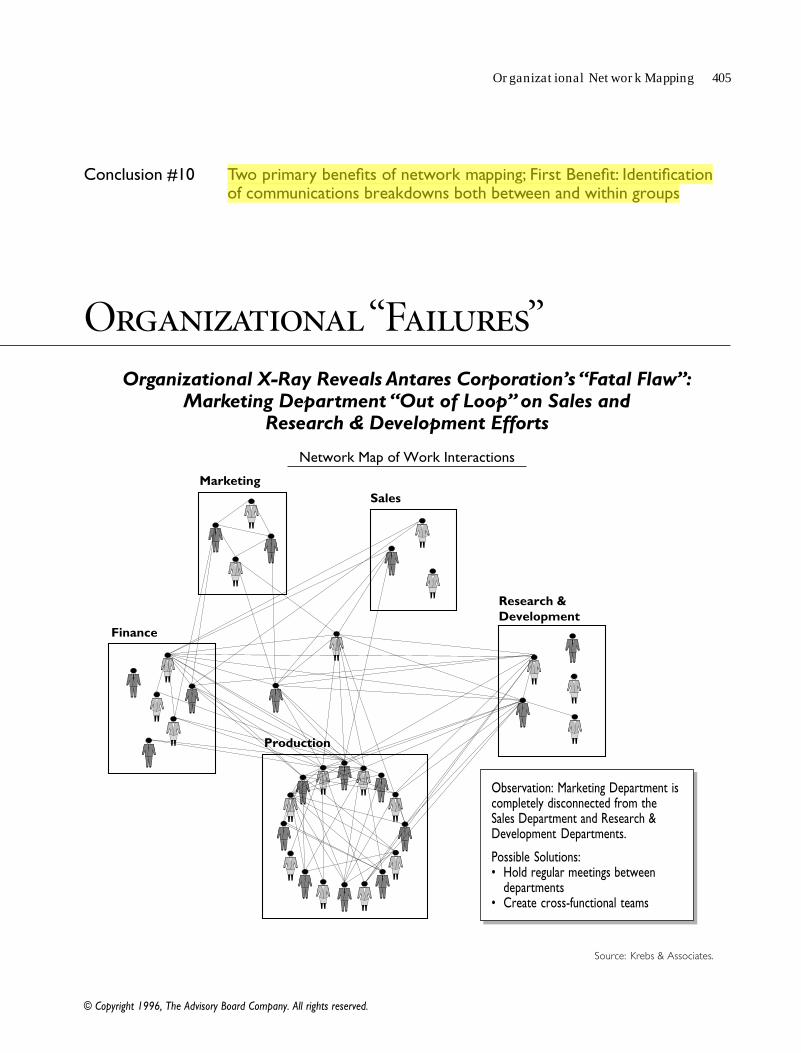
Conclusion #10 Two primary benefits of network mapping; First Benefit: Identificationof communications breakdowns both between and within groups
Organizational “Failures”Organizational X-Ray Reveals Antares Corporation’s “Fatal Flaw”:
Marketing Department “Out of Loop” on Sales andResearch & Development Efforts
Network Map of Work Interactions
Observation: Marketing Department iscompletely disconnected from theSales Department and Research &Development Departments.
Possible Solutions:• Hold regular meetings between
departments• Create cross-functional teams
Marketing
Finance
Sales
Research & Development
Production
Source: Krebs & Associates.
406 Managing Core Competencies of the Organization
© Copyright 1996, The Advisory Board Company. All rights reserved.
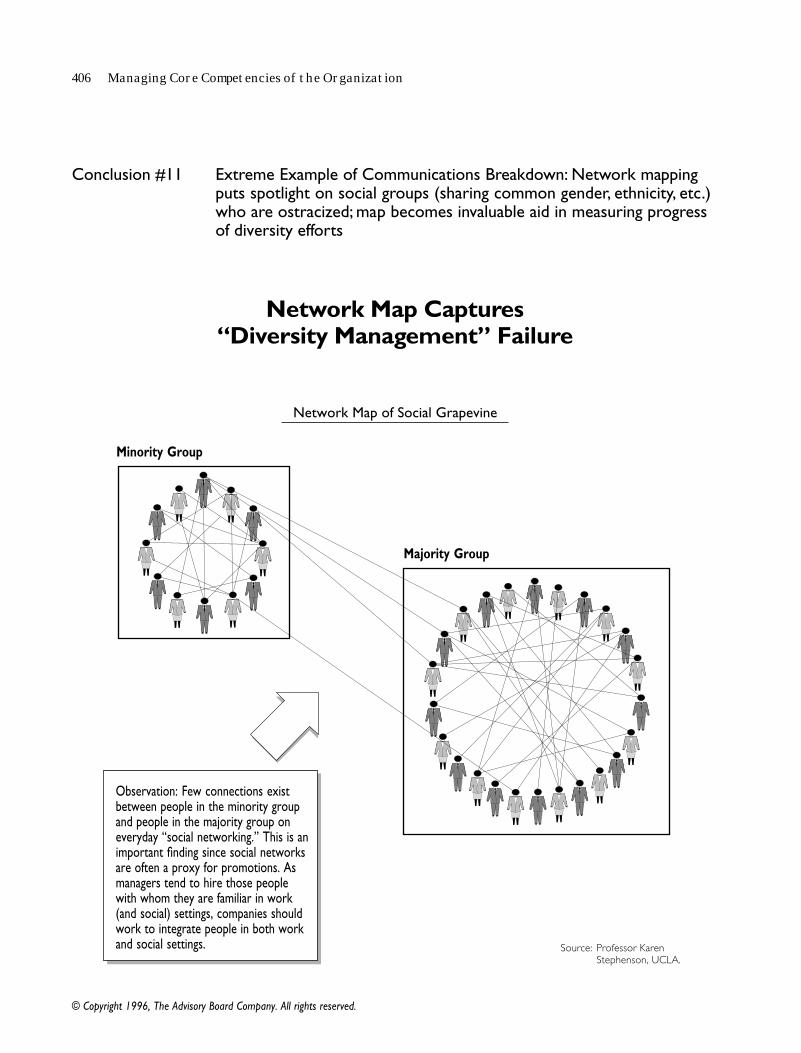
Conclusion #11 Extreme Example of Communications Breakdown: Network mappingputs spotlight on social groups (sharing common gender, ethnicity, etc.)who are ostracized; map becomes invaluable aid in measuring progressof diversity efforts
Network Map Captures“Diversity Management” Failure
Network Map of Social Grapevine
Minority Group
Majority Group
Observation: Few connections existbetween people in the minority groupand people in the majority group oneveryday “social networking.” This is animportant finding since social networksare often a proxy for promotions. Asmanagers tend to hire those peoplewith whom they are familiar in work(and social) settings, companies shouldwork to integrate people in both workand social settings. Source: Professor Karen
Stephenson, UCLA.
Organizational Network Mapping 407
© Copyright 1996, The Advisory Board Company. All rights reserved.
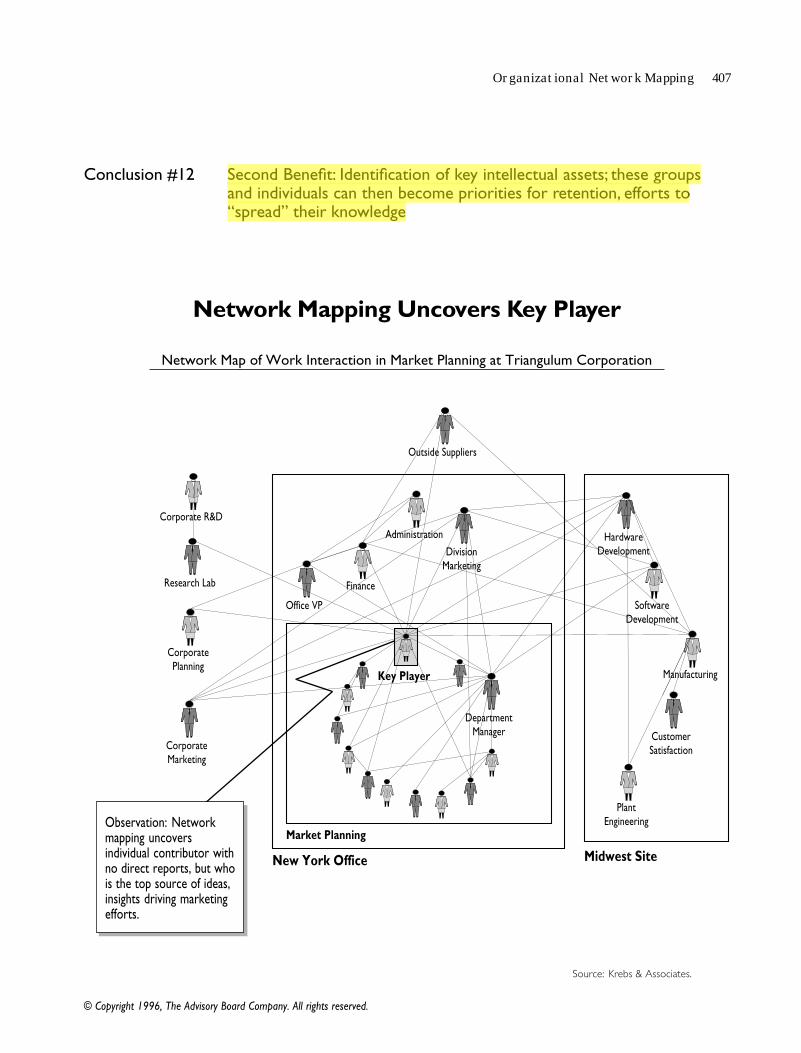
Conclusion #12 Second Benefit: Identification of key intellectual assets; these groupsand individuals can then become priorities for retention, efforts to“spread” their knowledge
Network Mapping Uncovers Key Player
Network Map of Work Interaction in Market Planning at Triangulum Corporation
Source: Krebs & Associates.
Observation: Networkmapping uncoversindividual contributor withno direct reports, but whois the top source of ideas,insights driving marketingefforts.
Outside Suppliers
Administration
Division Marketing
Finance
Office VP
Corporate R&D
Research Lab
Corporate Planning
Corporate Marketing
Key Player
Department Manager
Hardware Development
Software Development
Manufacturing
Customer Satisfaction
Plant Engineering
New York Office Midwest SiteMarket Planning
408 Managing Core Competencies of the Organization
© Copyright 1996, The Advisory Board Company. All rights reserved.
Jesse
Jane
JimPolly
Sandra
Tony
Anne
Chris
Martha
Michael (Director)
John
Diane
EileenDavid
Martha
Edward (Gatekeeper)
Financial Database
Western Sales Division
Southern Sales DivisionEastern Sales Division
Northern Sales Division
➤
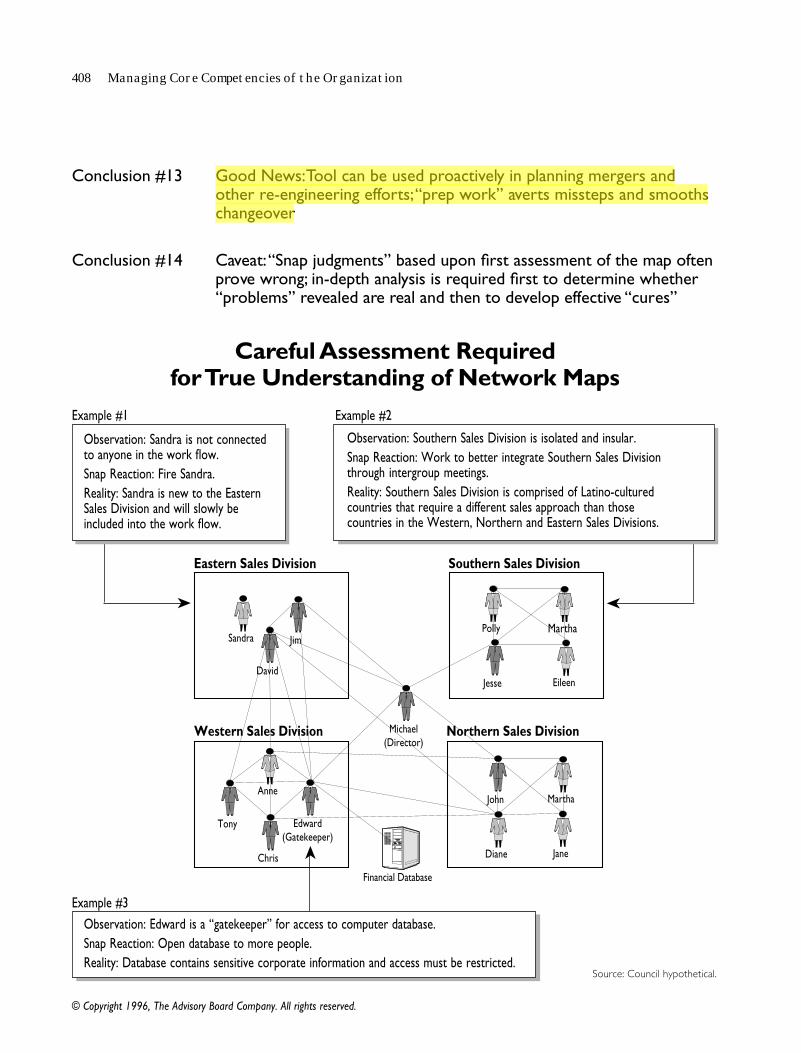
Conclusion #13 Good News: Tool can be used proactively in planning mergers andother re-engineering efforts; “prep work” averts missteps and smoothschangeover
Conclusion #14 Caveat: “Snap judgments” based upon first assessment of the map oftenprove wrong; in-depth analysis is required first to determine whether“problems” revealed are real and then to develop effective “cures”
➤ ➤
Observation: Sandra is not connectedto anyone in the work flow.Snap Reaction: Fire Sandra.Reality: Sandra is new to the EasternSales Division and will slowly beincluded into the work flow.
Example #1 Example #2
Observation: Southern Sales Division is isolated and insular.Snap Reaction: Work to better integrate Southern Sales Divisionthrough intergroup meetings.Reality: Southern Sales Division is comprised of Latino-culturedcountries that require a different sales approach than thosecountries in the Western, Northern and Eastern Sales Divisions.
Observation: Edward is a “gatekeeper” for access to computer database.Snap Reaction: Open database to more people.Reality: Database contains sensitive corporate information and access must be restricted.
Careful Assessment Requiredfor True Understanding of Network Maps
Example #3
Source: Council hypothetical.
Organizational Network Mapping 409
© Copyright 1996, The Advisory Board Company. All rights reserved.
Note to Our MembersWhile a few highly qualified consultants provide organizational network mapping tools,Krebs & Associates has pioneered the application of metrics to organizational networkmapping. Though not specifically endorsing Krebs & Associates’s work, the Councilnonetheless thanks the staff of Krebs & Associates for its extensive assistance in thepreparation of this tactic and for helping the Council to understand networks andcommunities of knowledge. Members interested in additional information on the techniquesdescribed herein are invited to contact:
Valdis KrebsPresidentorgnet.comCleveland, OH 44145(440) [email protected]

410 Managing Core Competencies of the Organization
© Copyright 1996, The Advisory Board Company. All rights reserved.
Recommended