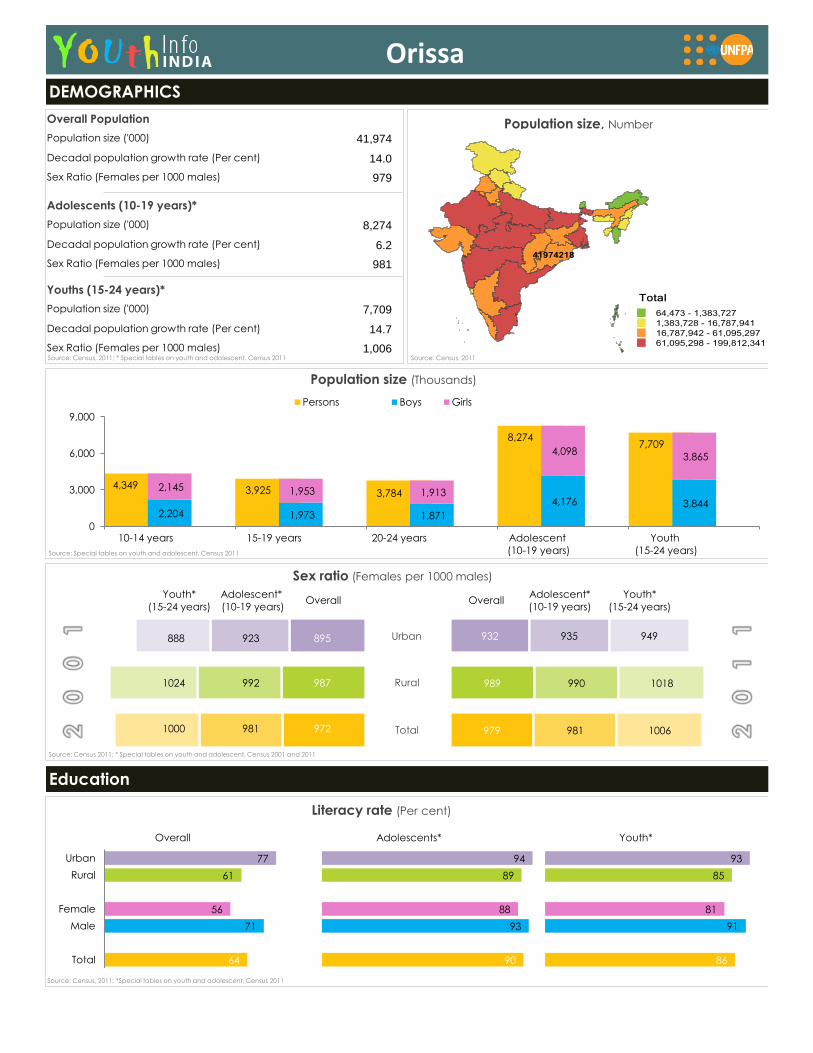
DEMOGRAPHICS
Education
4,349 3,925 3,784
8,274 7,709
2,204 1,973 1,871
4,176 3,844
2,145 1,953 1,913
4,098 3,865
0
3,000
6,000
9,000
Population size (Thousands)
Persons Boys Girls
Population size, Number
Source: Census, 2011
Population size ('000)
Overall Population
Decadal population growth rate (Per cent)
Sex Ratio (Females per 1000 males)
Population size ('000)
Adolescents (10-19 years)*
Decadal population growth rate (Per cent)
Sex Ratio (Females per 1000 males)
Population size ('000)
Youths (15-24 years)*
Decadal population growth rate (Per cent)
Sex Ratio (Females per 1000 males)
41,974
14.0
979
8,274
6.2
981
7,709
14.7
1,006
979
989
932
981
990
935
1006
1018
949
Sex ratio (Females per 1000 males)
Urban
Rural
Total
Overall Overall
888 923 895
1024 992 987
1000 981 972
Literacy rate (Per cent)
64
71
56
61
77
Total
Male
Female
Rural
Urban
Overall
90
93
88
89
94
Adolescents*
86
91
81
85
93
Youth*
Orissa
10-14 years 15-19 years 20-24 years Adolescent
(10-19 years)
Youth
(15-24 years)
Youth*
(15-24 years)
Youth*
(15-24 years)
Adolescent*
(10-19 years)
Adolescent*
(10-19 years)
Source: Special tables on youth and adolescent, Census 2011
Source: Census, 2011; * Special tables on youth and adolescent, Census 2011
Source: Census 2011; * Special tables on youth and adolescent, Census 2001 and 2011
Source: Census, 2011; *Special tables on youth and adolescent, Census 2011
Reproductive Health
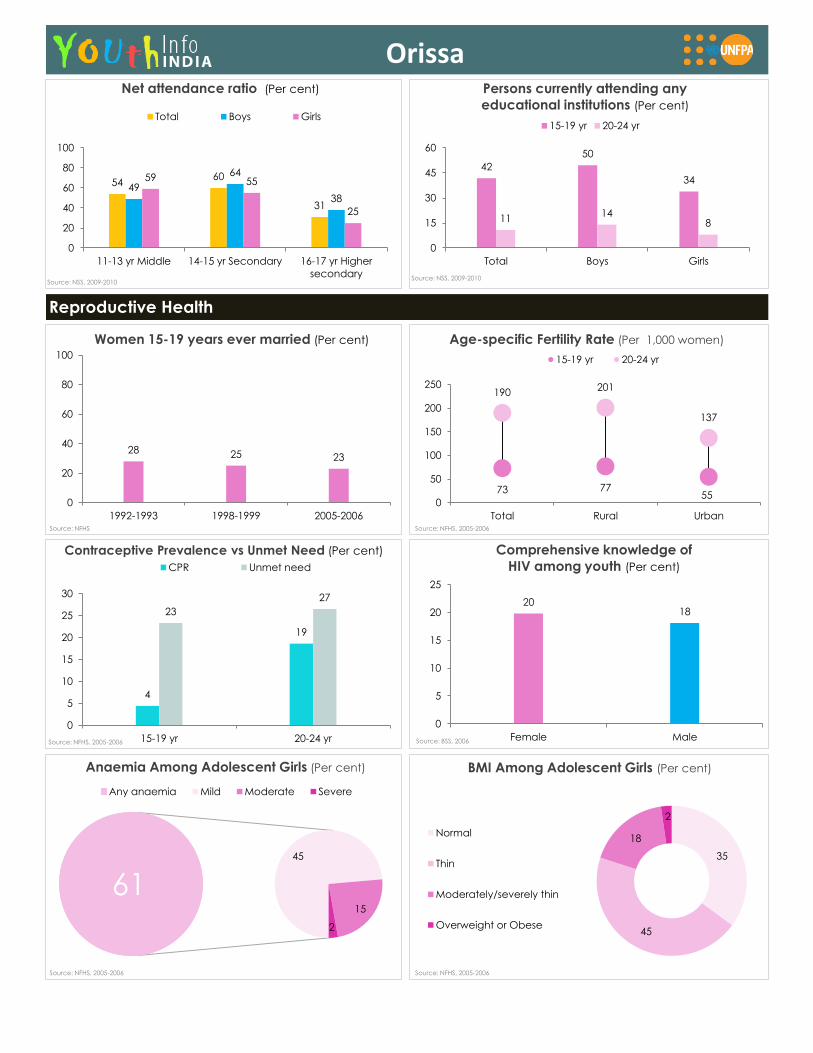
61 45
15
2
Any anaemia Mild Moderate Severe
4
19
23
27
0
5
10
15
20
25
30
15-19 yr 20-24 yr
CPR Unmet need
Contraceptive Prevalence vs Unmet Need (Per cent)
73 77 55
190 201
137
Total Rural Urban
0
50
100
150
200
250
15-19 yr 20-24 yr
Age-specific Fertility Rate (Per 1,000 women)
20 18
Female Male
0
5
10
15
20
25
28 25 23
0
20
40
60
80
100
1992-1993 1998-1999 2005-2006
Women 15-19 years ever married (Per cent)
54 60
31
49
64
38
59 55
25
0
20
40
60
80
100
11-13 yr Middle 14-15 yr Secondary 16-17 yr Higher
secondary
Total Boys Girls
Net attendance ratio (Per cent)
Source: NSS, 2009-2010
Comprehensive knowledge of
HIV among youth (Per cent)
Anaemia Among Adolescent Girls (Per cent)
35
45
18
2
Normal
Thin
Moderately/severely thin
Overweight or Obese
BMI Among Adolescent Girls (Per cent)
Source: NFHS
Source: NFHS, 2005-2006 Source: BSS, 2006
Source: NFHS, 2005-2006 Source: NFHS, 2005-2006
Source: NFHS, 2005-2006
42
50
34
11 14
8
0
15
30
45
60
Total Boys Girls
15-19 yr 20-24 yr
Source: NSS, 2009-2010
Persons currently attending any
educational institutions (Per cent)
Orissa
Recommended