Overview of Connected and Autonomous Vehicle
Research at the Rutgers Intelligent Transportation
Systems (RITS) Laboratory
Kaan Ozbay, Ph.D.
Professor
June, 2013
Rutgers University Intelligent Transportation
Systems Laboratory

SUMMARY OF CONNECTED VEHICLE
STUDIES Rutgers University Intelligent Transportation
Systems Laboratory
Connected Vehicles Simulation using PARAMICS
• For simulation of connected vehicles, especially on a larger scale, a
realistic mobility test bed is very important
• Microscopic simulation is an ideal tool to replicate real-world traffic
flows, speeds and congestion
• PARAMICS with Application Programming Interface (API) can
– Provide dynamic network information (level of congestion, travel time, etc.)
– Override or extend the default models such as car following, lane changing,
route choice, etc.
– Incorporate customized functionalities such as (probabilistic) communication
range depending on the technology (DSRC, WiFi, optical, WiMax, etc.), upload
and download packet size, market penetration, etc.

Connected Vehicles Simulation using PARAMICS
• Vehicles can be instrumented at random and multiple simulation runs would result in a realistic network layer performance
• Performance metrics such as – channel bandwidth usage,
– spread of information: speed and extent,
– number of mobile nodes,
– range/radius of communication,
– upload and download packet size,
– improvements in travel time, etc.
• Parameterize performance metrics as a function parameters such as, – vehicular density,
– market penetration of technology,
– arterial network density,
– vehicular speed/speed limit,
– signal timings,
– presence of communication interference (buildings, etc.)
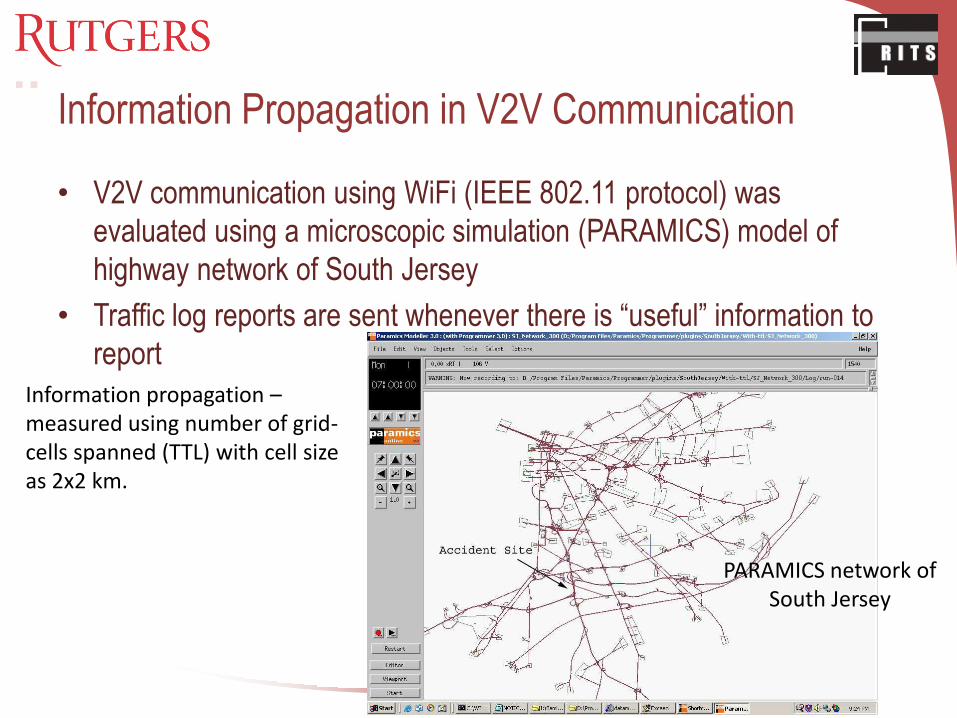
Information Propagation in V2V Communication
• V2V communication using WiFi (IEEE 802.11 protocol) was
evaluated using a microscopic simulation (PARAMICS) model of
highway network of South Jersey
• Traffic log reports are sent whenever there is “useful” information to
report
Information propagation – measured using number of grid-cells spanned (TTL) with cell size as 2x2 km.
PARAMICS network of South Jersey

Information Propagation during Incident Information spread after 2 min. and 5 min.
3% Market penetration 5% Market penetration
10% Market penetration
Number of connections to cell tower with time
TECH TIP: Evaluation of information spread and
RSU load during accidents

Experimental Set-up
eDAQ
Vehicle Bus
Accelerometer
GPS Receiver
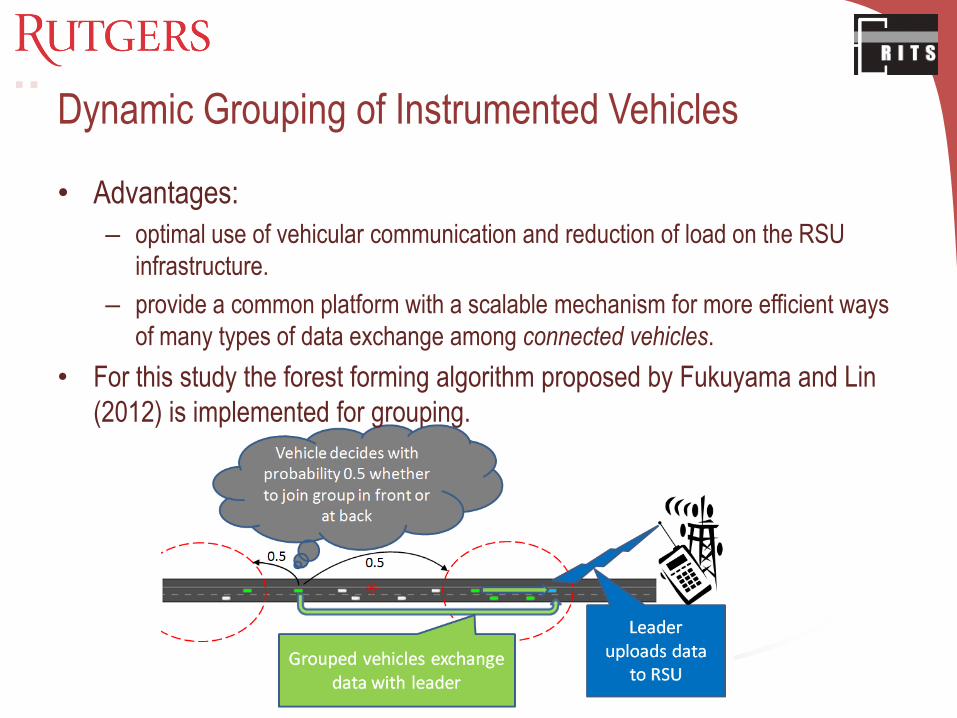
Dynamic Grouping of Instrumented Vehicles
• Advantages:
– optimal use of vehicular communication and reduction of load on the RSU
infrastructure.
– provide a common platform with a scalable mechanism for more efficient ways
of many types of data exchange among connected vehicles.
• For this study the forest forming algorithm proposed by Fukuyama and Lin
(2012) is implemented for grouping.

Findings
• 85-91% reduction in channel usage with 5-15% market penetration of technology
• Average group size of about 35 instrumented cars helps sustain data transfer
• Scalability of 0.23 Mbps/% increase in market penetration, which is an 80%
reduction when compared to individual probe data collection
TECH TIP: Use this
methodology to find threshold for market
penetration and power of DSRC radio for sustainable
data transfer

Validation of Data Quality using Dynamic Grouping • Travel time estimation using dynamic grouping approach is less than
4.5% within the travel time from individual vehicles’ probe data,
albeit, using 80-90% less bandwidth.
No Grouping Grouping Comparison
Path Avg. Trav. Time (min.)
Avg. Band width (Mbps)
Avg. Trav. Time (min.)
Avg. Band width (Mbps)
% Err. in Trav Time
% Diff. in Band width
1 16.04 3.70 16.39 0.52 3.7% 86%
2 16.27 3.67 16.98 0.67 4.4% 82%
3 18.94 3.53 19.31 0.01 2.0% 99%

Validation of Data Quality using Dynamic Grouping
• During an incident, accuracy of estimated travel times on each path
from dynamic grouping are almost always less than 10% and less
than 5% on an average within the individual probe vehicle travel
times.
Path No Grouping Grouping Comparison
Travel Time (min.)
Band width (Mbps)
Travel Time (min.)
Band width (Mbps)
%Err. in Travel Time
% Diff. in Band width
Path 1 19.01 3.90 19.49 0.39 4.8% 89.8%
Path 2 18.63 3.78 18.69 0.49 4.9% 86.2%
Path 3 21.05 3.71 20.70 0.61 4.3% 82.9%

Data Broadcast using Dynamic Grouping
• The leader receives information about an accident, improper pavement
condition or any useful local information such as parking space availability.
This information first is transmitted to only the group members.
• The data packet is further sent by the trailing vehicle of the group to the
leader of the closest upstream group.

Bandwidth Reduction using Dynamic Grouping
• Simple flooding (SF): Each vehicular node broadcasts the event message to all upstream vehicles
• Farthest neighbor broadcast (FN): First node to receive the information floods the message to all
upstream vehicles. The node farthest from the first node to receive the message in turn floods it to the
upstream nodes and so on. In order to determine the node that is farthest, all equipped vehicles keep
sending beacon messages of sizes: 24 bytes (FN 24), 256 bytes (FN 256), 512 bytes (FN 512)
Performance Parameter
mDG DG FN 512
SF
Message Bandwidth (Kbps)
2.70 3.75 7.17 11.5
Beacon Bandwidth (Kbps)
0.00 0.00 2.32 0.00
Improvement from Simple Flooding
77% 67% 37% -
Average Number of Transmissions per message
5.40 7.50 9.69 23.0
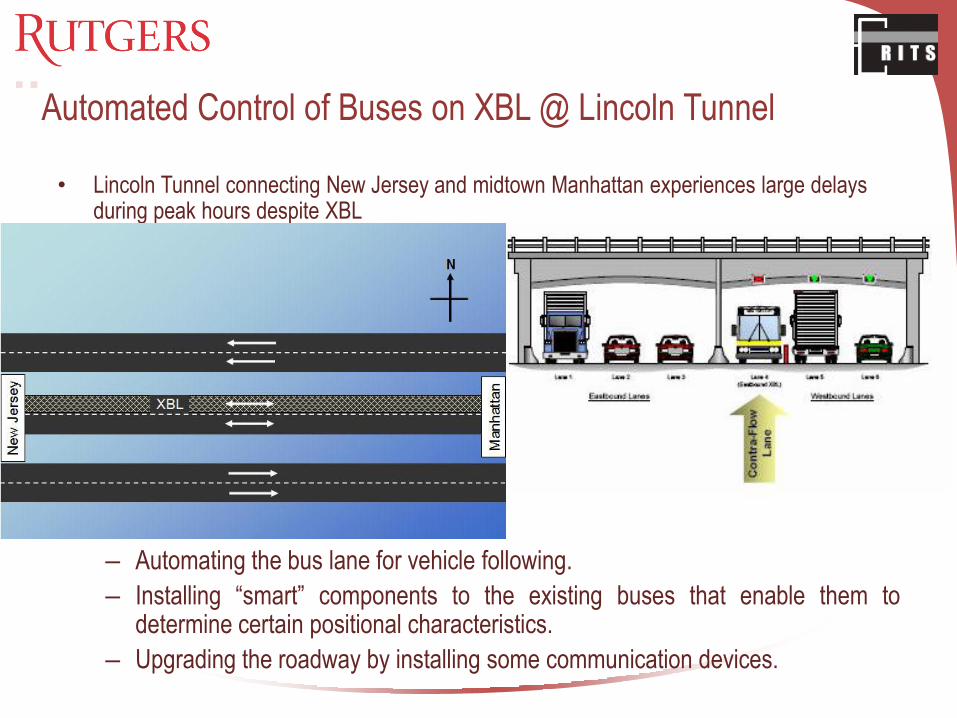
Automated Control of Buses on XBL @ Lincoln Tunnel
• Lincoln Tunnel connecting New Jersey and midtown Manhattan experiences large delays during peak hours despite XBL
• Solution:
– Automating the bus lane for vehicle following.
– Installing “smart” components to the existing buses that enable them to determine certain positional characteristics.
– Upgrading the roadway by installing some communication devices.

PARAMICS Microsimulation Model
10
11
12
13
14
15
16
17
18
5:45-6:00
6:00-6:15
6:15-6:30
6:30-6:45
6:45-7:00
7:00-7:15
7:15-7:30
7:30-7:45
7:45-8:00
8:00-8:15
8:15-8:30
8:30-8:45
8:45-9:00
9:00-9:15
9:15-9:30
9:30-9:45
9:45-10:0
Tra
vel T
imes (
Min
ute
s)
Existing travel times
Times obtained in the model
Travel time Calibration
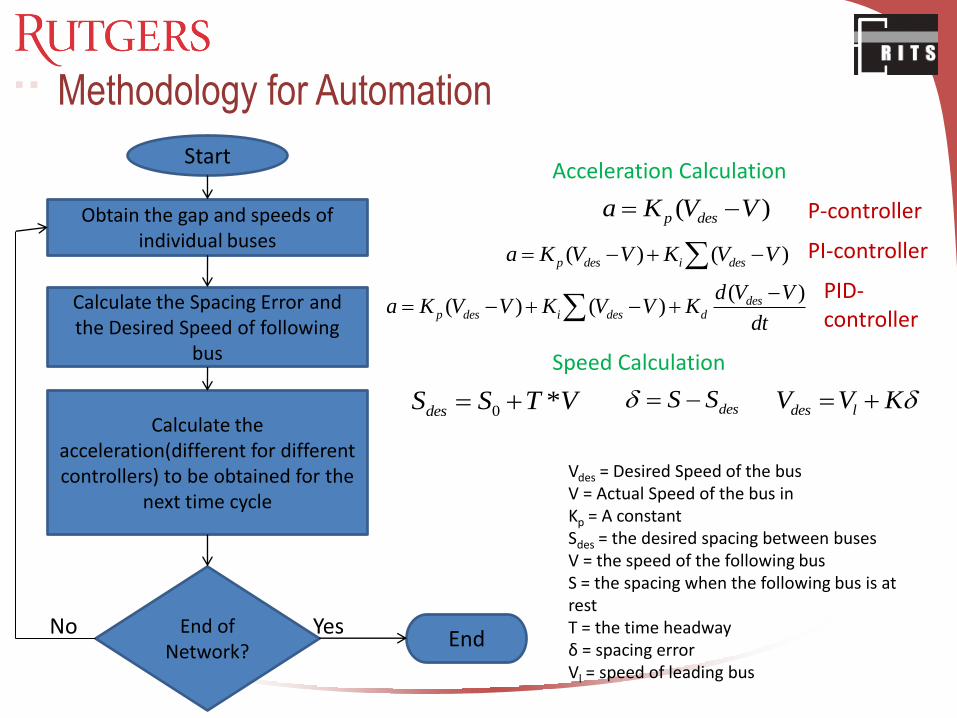
Methodology for Automation
Start
Obtain the gap and speeds of individual buses
Calculate the Spacing Error and the Desired Speed of following
bus
Calculate the acceleration(different for different controllers) to be obtained for the
next time cycle
End of Network?
End Yes No
( )p desa K V V
( ) ( )p des i desa K V V K V V ( )
( ) ( ) desp des i des d
d V Va K V V K V V K
dt
Vdes = Desired Speed of the bus V = Actual Speed of the bus in Kp = A constant Sdes = the desired spacing between buses V = the speed of the following bus S = the spacing when the following bus is at rest T = the time headway δ = spacing error Vl = speed of leading bus
Acceleration Calculation
P-controller
PI-controller
PID-controller
Speed Calculation
0 *desS S T V desS S des lV V K
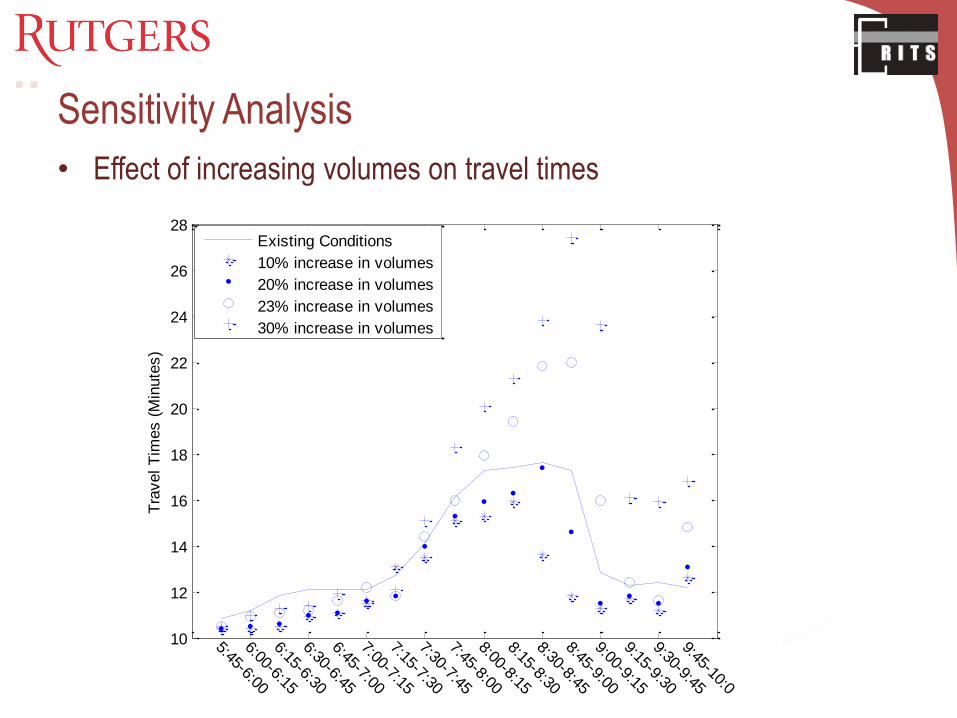
Sensitivity Analysis
• Effect of increasing volumes on travel times
10
12
14
16
18
20
22
24
26
28
5:45-6:00
6:00-6:15
6:15-6:30
6:30-6:45
6:45-7:00
7:00-7:15
7:15-7:30
7:30-7:45
7:45-8:00
8:00-8:15
8:15-8:30
8:30-8:45
8:45-9:00
9:00-9:15
9:15-9:30
9:30-9:45
9:45-10:0
Tra
vel T
imes (
Min
ute
s)
Existing Conditions
10% increase in volumes
20% increase in volumes
23% increase in volumes
30% increase in volumes

Cost Type Total Amount ($)
Incremental Cost in Materials 13,780.6
Incremental Cost in Fuel Consumption 561,827.4
Road Maintenance Costs 516,175.0
Bus Replacement Costs 30,925,129.0
Initial Automation Costs 61,650,000.0
Total 93,666,912.0
Rate of Interest (Percentage)
Value of Time
($/hour) 3% 5% 7% 10%
7.5 1.50 1.34 1.22 1.08
15 2.97 2.70 2.4 2.17
20 3.97 3.59 3.28 2.90
25 4.96 4.49 4.11 3.62
Total costs incurred by type of cost
Benefit-Cost ratios

Lincoln Tunnel XBL Bus Automation - Findings • Predicted 10-30% increase in bus volumes.
• Estimated 20% increase in capacity.
• 23% increase in bus volumes will result in current travel times (no
automation).
TECH TIP: Vehicle automation can be
implemented for cars / buses / trucks on
specific roadway sections such as HOV
lanes to improve safety and mobility

2nd Connected Vehicles Symposium:
Building the Path from Connected to Self-Driving Vehicles
• June 17-18, 2013 at Rutgers University
• Funded by UTRC @ CUNY (USDOT RITA) & RITS Lab
• Attended by over 85 researchers, representative of government
agencies and industry experts
• The ultimate goal of the symposium is to build an active community
of researchers, industry and government partners to work towards
the goal of supporting exciting developments in the area of
connected and self-driving vehicles that may well revolutionize our
transportation systems in many ways.
• http://www.connectedvehicleworkshop.com/
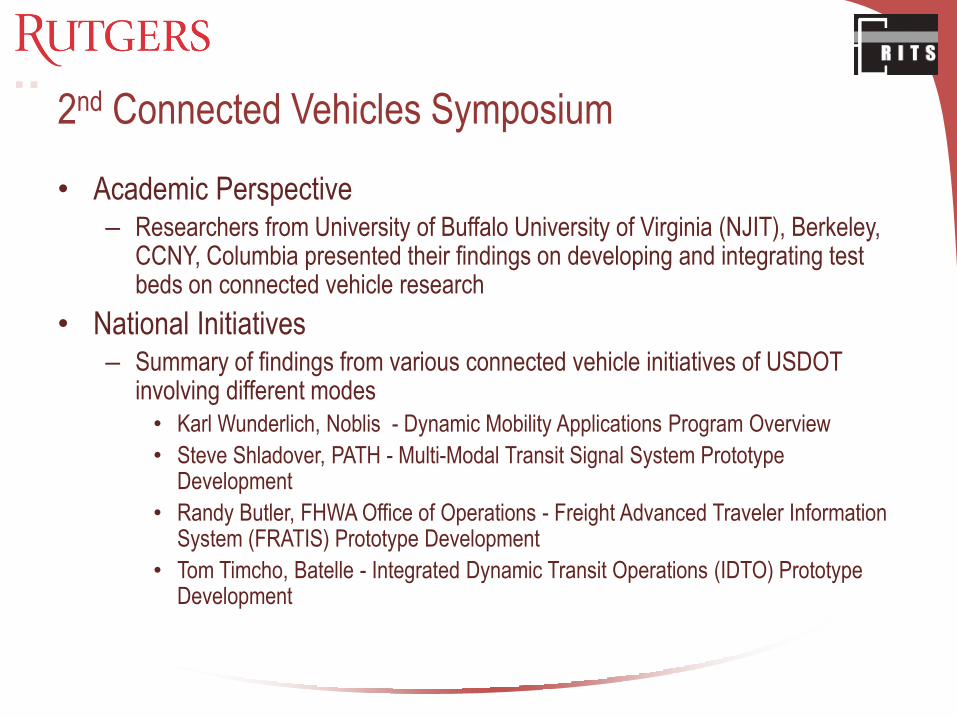
2nd Connected Vehicles Symposium
• Academic Perspective – Researchers from University of Buffalo University of Virginia (NJIT), Berkeley,
CCNY, Columbia presented their findings on developing and integrating test beds on connected vehicle research
• National Initiatives – Summary of findings from various connected vehicle initiatives of USDOT
involving different modes
• Karl Wunderlich, Noblis - Dynamic Mobility Applications Program Overview
• Steve Shladover, PATH - Multi-Modal Transit Signal System Prototype Development
• Randy Butler, FHWA Office of Operations - Freight Advanced Traveler Information System (FRATIS) Prototype Development
• Tom Timcho, Batelle - Integrated Dynamic Transit Operations (IDTO) Prototype Development

2nd Connected Vehicles Symposium • Industry Perspective
– Experts from Mercedes-Benz and Qualcomm Technologies presented their vision on forthcoming and future products
– Also expert from the insurance industry illustrated how the liabilities may be seen once the connected vehicles become more ubiquitous
• Government – Key city (NYCDOT), state (NJDOT, PANYNJ, NJTA, NJTPA) and federal
government officials presented their thoughts on connected vehicle research needs, testing, applications and policies
• Roundtable – Experts from various areas joined together to discuss different aspects of
connected vehicles initiatives, test beds, applications and future needs
• Next Steps – Establish and maintain an active “regional” working group
– Actively work on the establishment of a regional test bed that will focus on the needs of NJ and NY metropolitan area
Thanks for Listening http://rits.rutgers.edu
For more information please contact:
Kaan Ozbay, [email protected] 23
Recommended