Overview of Malaysian PSC
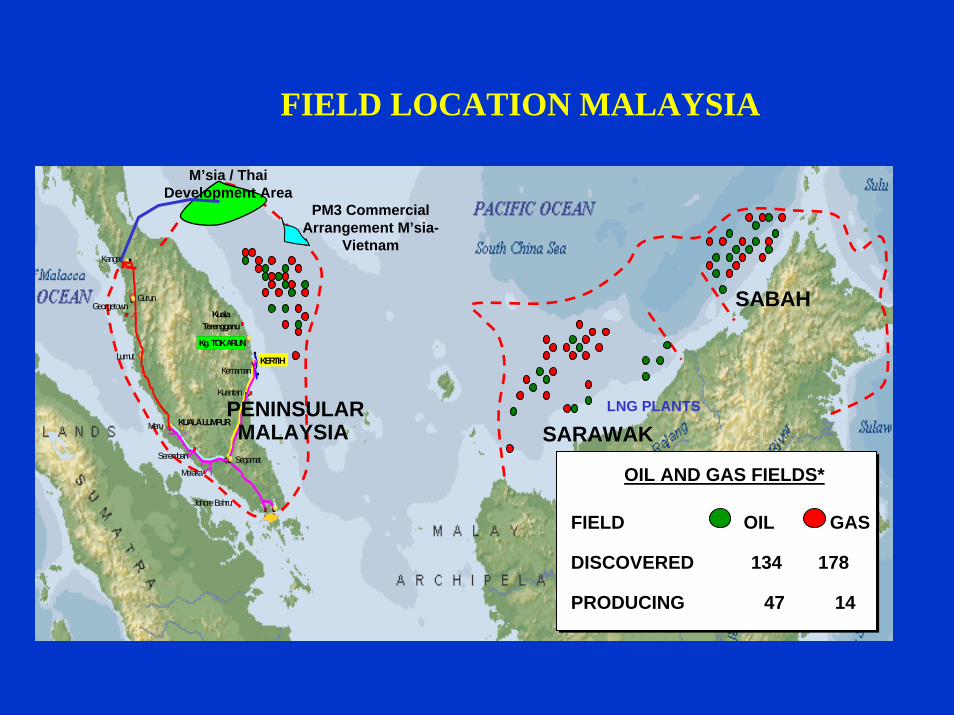
FIELD LOCATION MALAYSIA
M’sia / Thai Development Area
PM3 Commercial Arrangement M’sia-
VietnamKangar
Georgetown
Lumut
Meru KUALA LUMPUR
Seremban
Melaka
Johore Bahru
Segamat
Kuantan
KemamanKERTIH
KualaTerengganu
Gurun
Kg. TOK ARUN
SARAWAK
SABAH
LNG PLANTS
FIELD OIL GAS
DISCOVERED 134 178
PRODUCING 47 14
OIL AND GAS FIELDS*
PENINSULARMALAYSIA
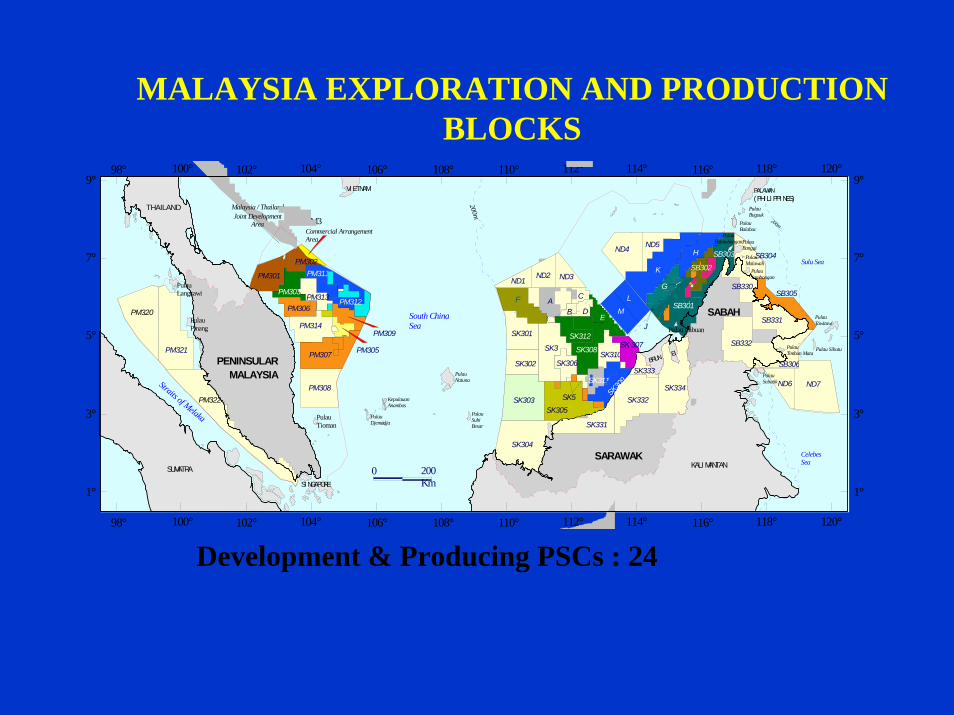
MALAYSIA EXPLORATION AND PRODUCTION BLOCKS
Sulu Sea
Celebes Sea
PulauTimbun Mata
Pulau Tawitawi
Pulau Sibutu
Pulau Malawali
Pulau Bugsuk
PALAWAN(PHI LI PPI NES)
Pulau Balabac
THAILAND Malaysia / ThailandJoint Development
Area PM3Commercial Arrangement Area
South China Sea
VI ETNAM
SI NGAPORE
Straits of Melaka
SUMATRA
KepulauanAnambas
Pulau Djemadja
Pulau Natuna
PulauSubi Besar
1°
3°
5°
7°
9°
1°
3°
5°
7°
9°98° 100° 102° 104° 106° 108° 110° 112° 114° 116° 118° 120°
98° 100° 102° 104° 106° 108° 110° 112° 114° 116° 118° 120°
PulauBanggi
SARAWAKKALI MANTAN
SABAH
PulauLangkawi
PulauPinang
PENINSULARMALAYSIA
Pulau Labuan
BRUN EI
0 200 Km
PM314
PulauBalambangan
AC
BD
SB303
E
SB302
PM321
PM322
PM303
PM308
SK301
F
SK302
SK303
SK304
SK331
SK333
SK332SK334
SB304
SB332
SB330SB305
SB331
SB306
SB301
J
SK308SK3
PM311
PM306
PM302
SK312
PM301
PM307 PM305
G
H
SK310
SK311
200m
200m
SK306
B
SK309
F
SK309
PM313
SK 307
K
SK5
SK305
PM320
L
M
PM309
PM312
Pulau Tioman
ND1ND2 ND3
ND4 ND5
ND6 ND7Pulau Sebatik
Pulau Jambongan
Development & Producing PSCs : 24
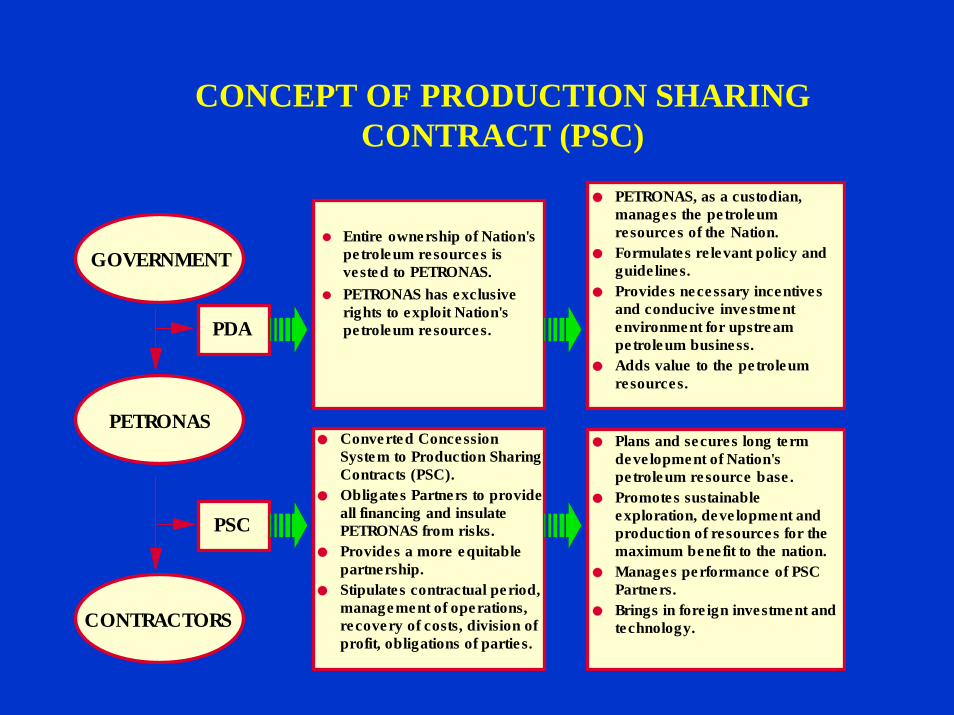
CONCEPT OF PRODUCTION SHARING CONTRACT (PSC)
GOVERNMENT
PETRONAS
CONTRACTORS
PDA
PSC
Entire ownership of Nation's petroleum resources is vested to PETRONAS.PETRONAS has exclusive rights to exploit Nation's petroleum resources.
PETRONAS, as a custodian, manages the petroleum resources of the Nation.Formulates re levant policy and guide lines.Provides necessary incentives and conducive investment environment for upstream pe troleum business.Adds value to the petroleum resources.
Converted Concession System to Production Sharing Contracts (PSC).Obligates Partners to provide all financing and insulate PETRONAS from risks.Provides a more equitable partnership.Stipulate s contractual period, management of operations, recovery of costs, division of profit, obligations of partie s.
Plans and secures long term deve lopment of Nation's pe troleum re source base .Promotes sustainable exploration, deve lopment and production of resources for the maximum benefit to the nation.Manages performance of PSC Partners.Brings in fore ign investment and technology.
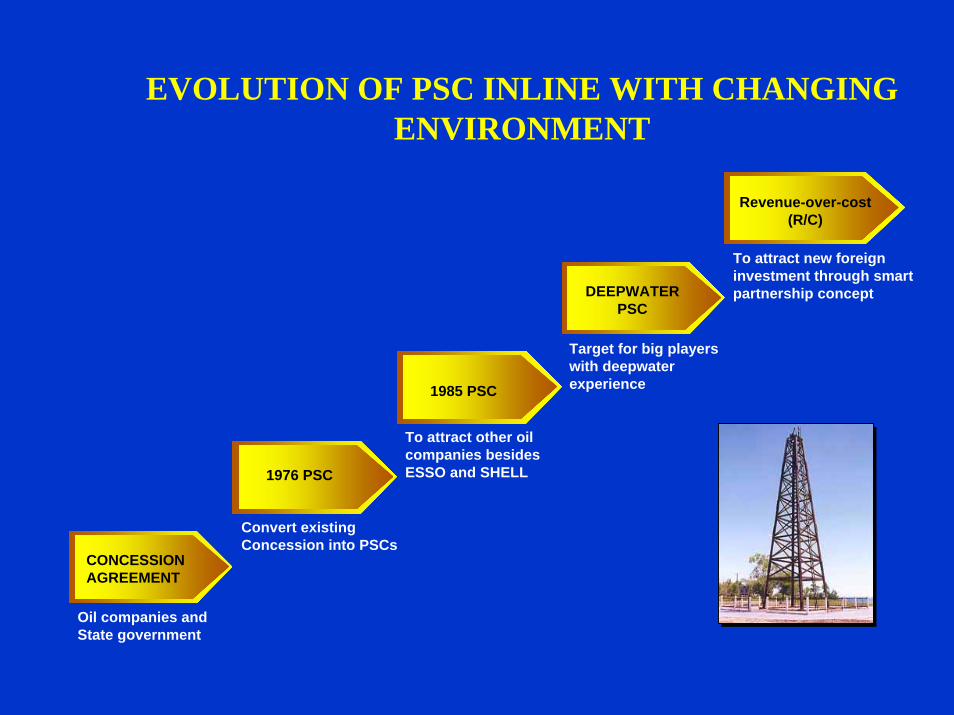
EVOLUTION OF PSC INLINE WITH CHANGING ENVIRONMENT
Revenue-over-cost(R/C)
To attract new foreigninvestment through smartpartnership conceptDEEPWATER
PSC
Target for big playerswith deepwaterexperience1985 PSC
To attract other oilcompanies besidesESSO and SHELL1976 PSC
Convert existingConcession into PSCs
CONCESSIONAGREEMENT
Oil companies andState government
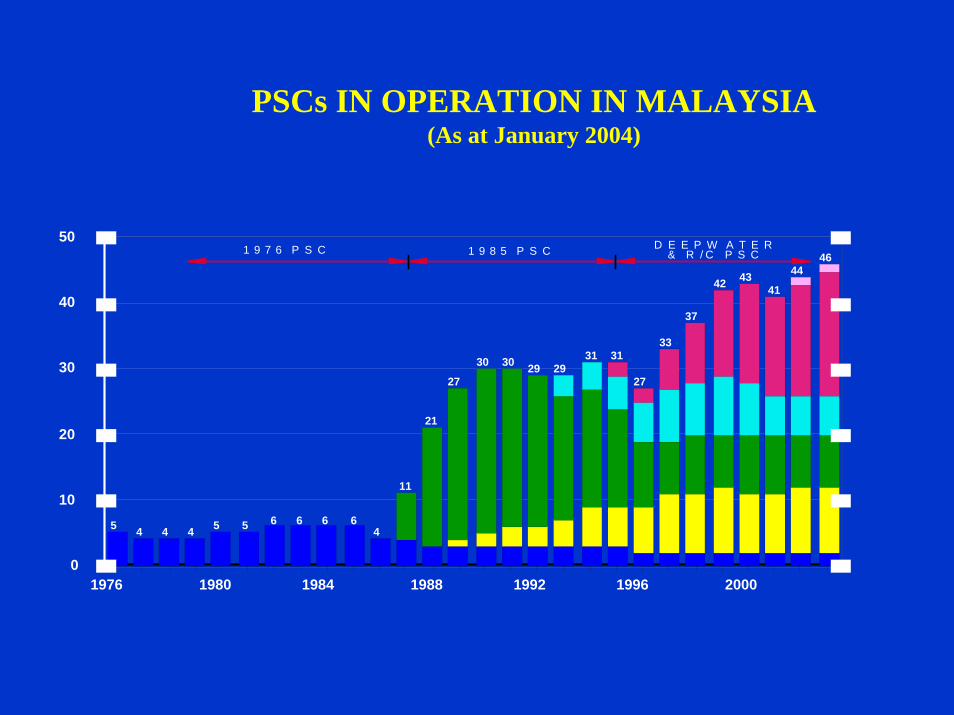
PSCs IN OPERATION IN MALAYSIA(As at January 2004)
5 4 4 4 5 5 6 6 6 64
11
21
27
30 30 29 2931 31
27
33
37
42 4341
4446
1976 1980 1984 1988 1992 1996 20000
10
20
30
40
501 9 7 6 P S C 1 9 8 5 P S C D E E P W A T E R
& R / C P S C
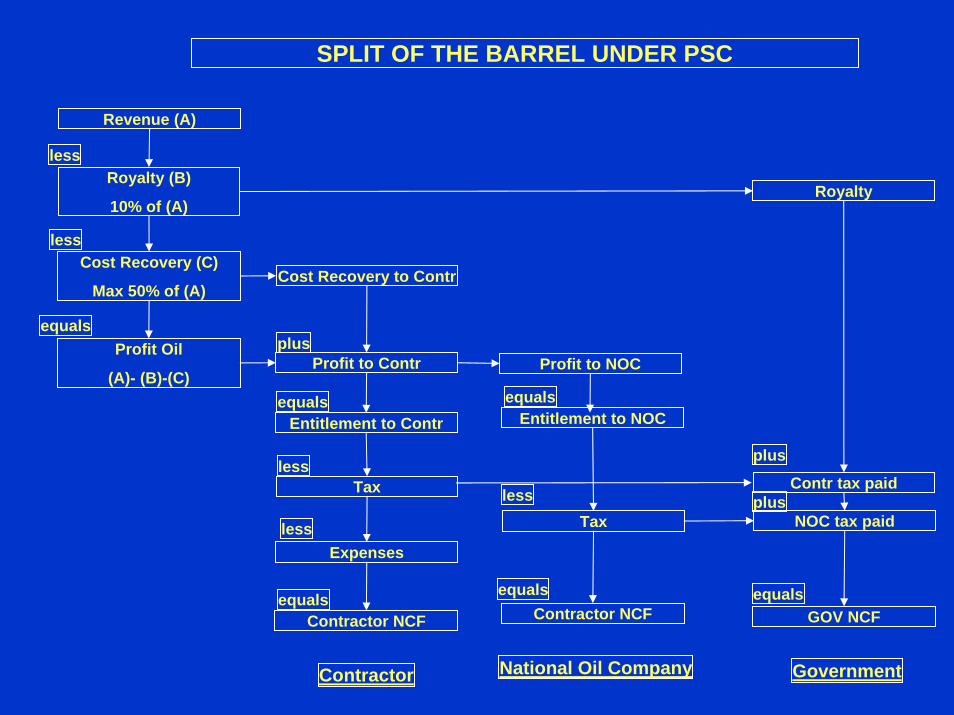
SPLIT OF THE BARREL UNDER PSC
Royalty (B)
10% of (A)
Cost Recovery (C)
Max 50% of (A)
less
less
equals
Revenue (A)
Profit Oil
(A)- (B)-(C)
Cost Recovery to Contr
Profit to Contr
Entitlement to Contr
Tax
Expenses
less
less
equalsContractor NCF
plus
equals
Contractor
Profit to NOC
Tax
Entitlement to NOCequals
less
equalsContractor NCF
National Oil Company
Royalty
Contr tax paid
NOC tax paid
GOV NCF
plus
plus
equals
Government
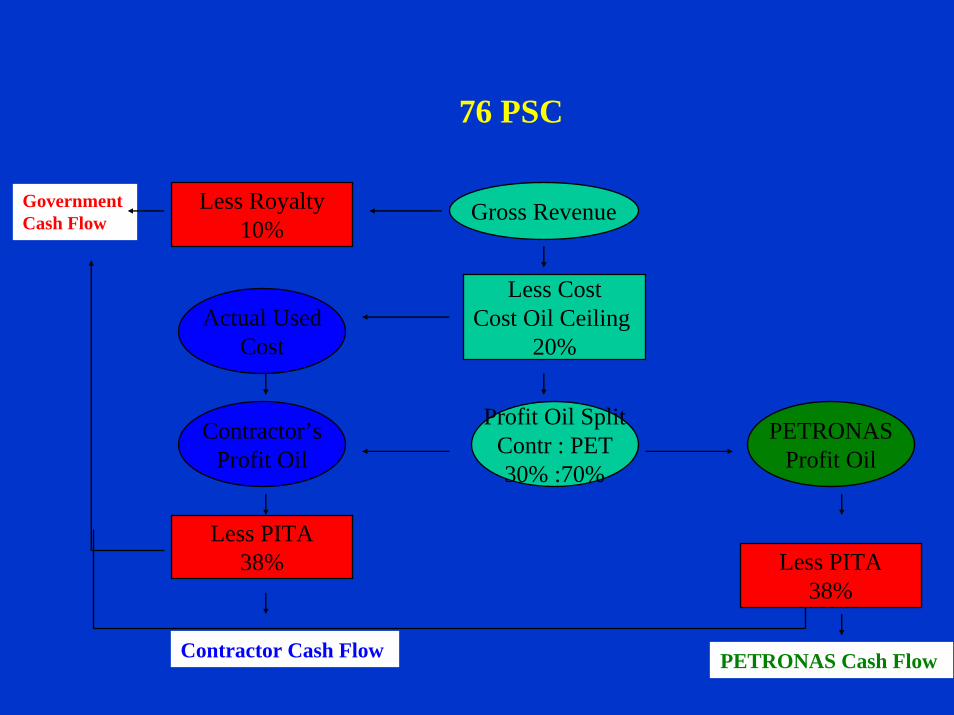
76 PSC
Gross Revenue
Less CostCost Oil Ceiling
20%Actual Used
Cost
Contractor’sProfit Oil
Profit Oil SplitContr : PET30% :70%
PETRONASProfit Oil
Less Royalty10%
GovernmentCash Flow
Less PITA38% Less PITA
38%
Contractor Cash Flow PETRONAS Cash Flow
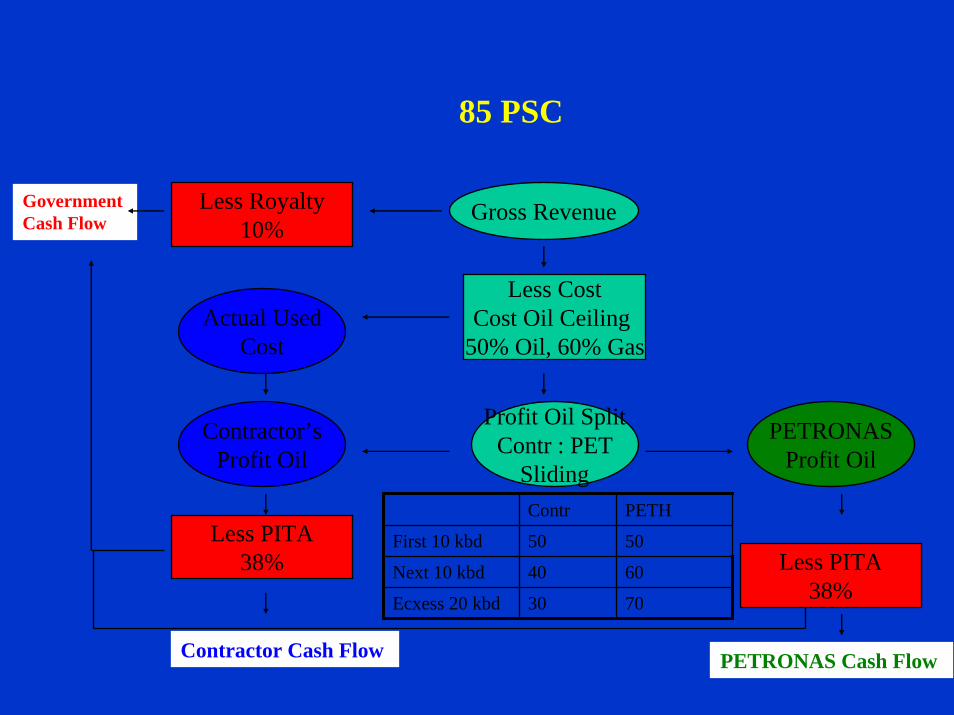
85 PSC
Gross Revenue
Less CostCost Oil Ceiling
50% Oil, 60% GasActual Used
Cost
Contractor’sProfit Oil
Profit Oil SplitContr : PET
Sliding
PETRONASProfit Oil
Less Royalty10%
GovernmentCash Flow
Less PITA38% Less PITA
38%
Contractor Cash Flow PETRONAS Cash Flow
Contr PETH
First 10 kbd 50 50
Next 10 kbd 40 60
Ecxess 20 kbd 30 70
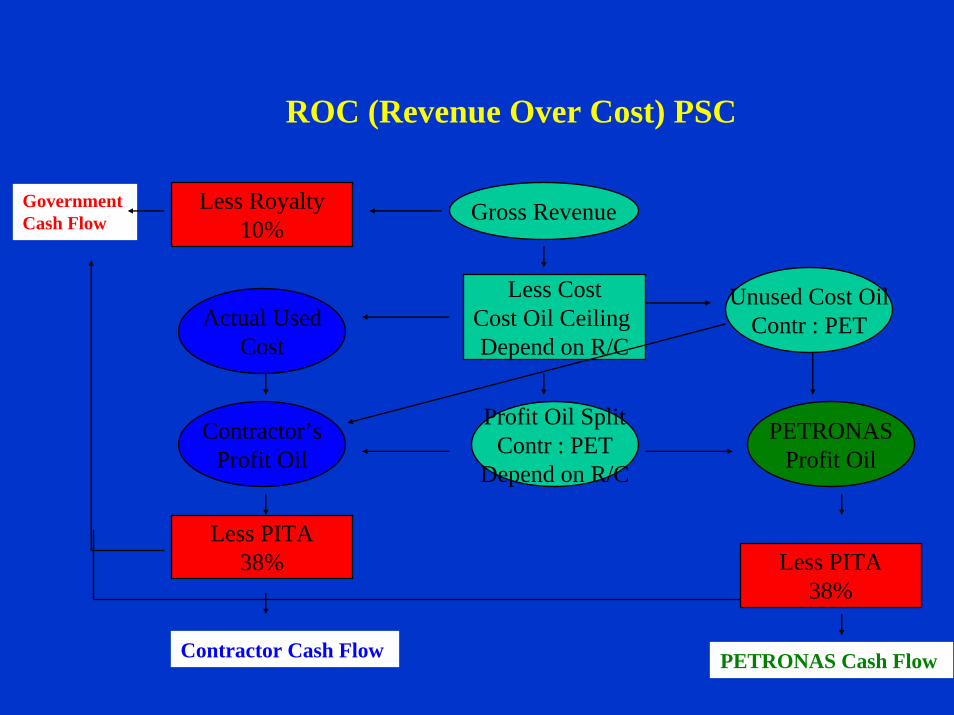
ROC (Revenue Over Cost) PSC
Gross Revenue
Less CostCost Oil Ceiling Depend on R/C
Actual UsedCost
Contractor’sProfit Oil
Profit Oil SplitContr : PET
Depend on R/C
PETRONASProfit Oil
Less Royalty10%
GovernmentCash Flow
Less PITA38% Less PITA
38%
Contractor Cash Flow PETRONAS Cash Flow
Unused Cost OilContr : PET
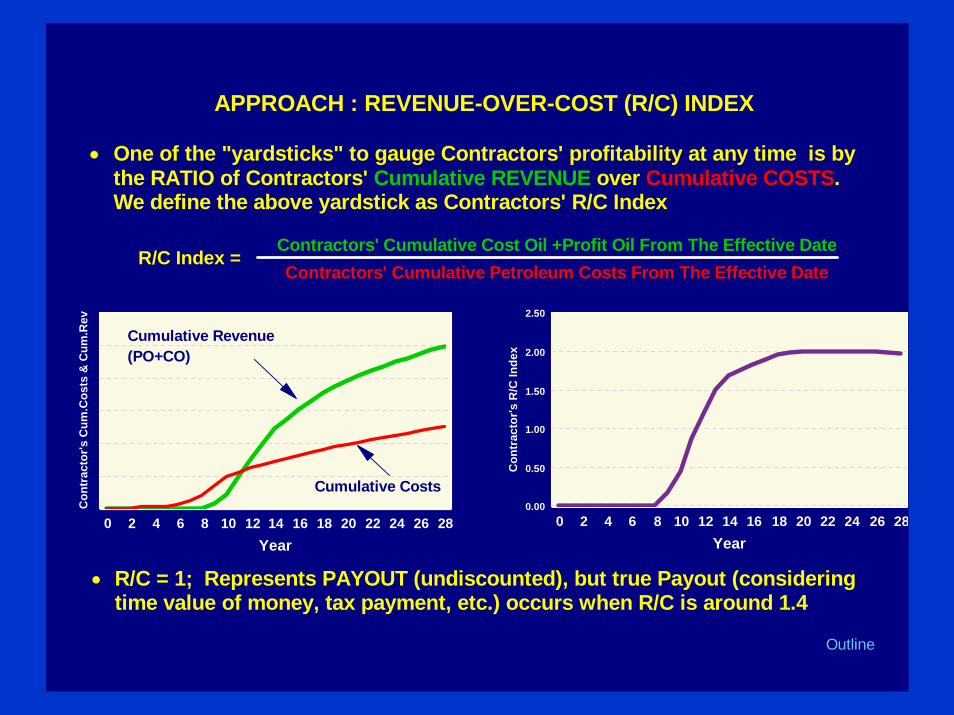
Contractors' Cumulative Cost Oil +Profit Oil From The Effective DateContractors' Cumulative Petroleum Costs From The Effective Date
R/C Index =
One of the "yardsticks" to gauge Contractors' profitability at any time is by the RATIO of Contractors' Cumulative REVENUE over Cumulative COSTS. We define the above yardstick as Contractors' R/C Index
R/C = 1; Represents PAYOUT (undiscounted), but true Payout (considering time value of money, tax payment, etc.) occurs when R/C is around 1.4
0 2 4 6 8 10 12 14 16 18 20 22 24 26 28Year
Con
trac
tor's
Cum
.Cos
ts &
Cum
.Rev
Cumulative Revenue(PO+CO)
Cumulative Costs
0 2 4 6 8 10 12 14 16 18 20 22 24 26 28Year
0.00
0.50
1.00
1.50
2.00
2.50
Con
trac
tor's
R/C
Inde
x
APPROACH : REVENUE-OVER-COST (R/C) INDEX
Outline
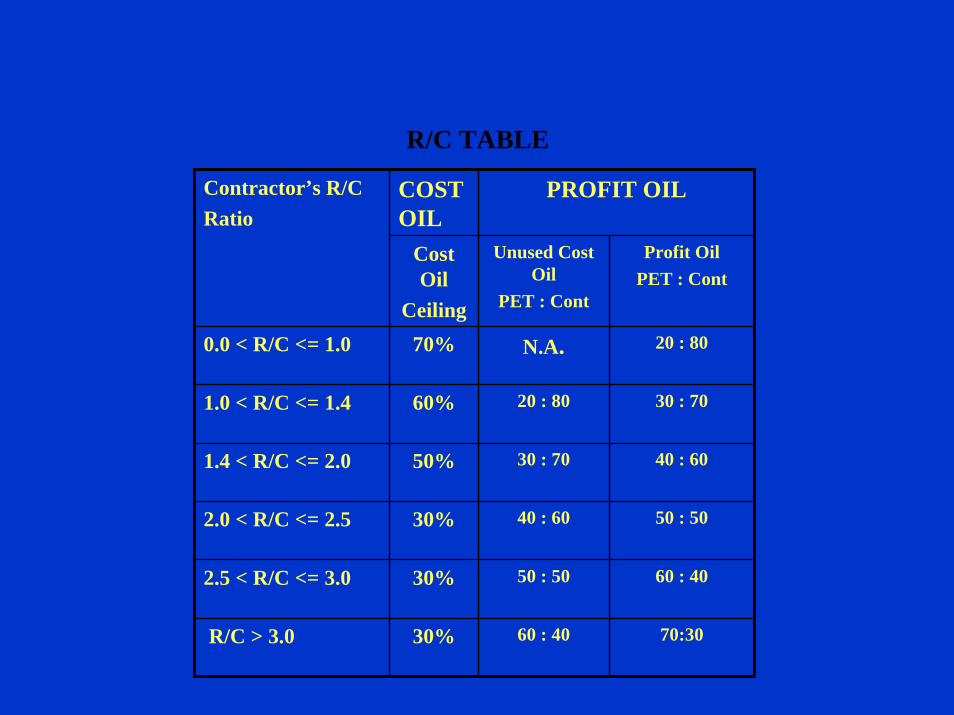
R/C TABLE
COST OIL
PROFIT OIL
Cost Oil
Ceiling
Unused Cost Oil
PET : Cont
Profit OilPET : Cont
0.0 < R/C <= 1.0 70% N.A. 20 : 80
1.0 < R/C <= 1.4 60% 20 : 80 30 : 70
1.4 < R/C <= 2.0 50% 30 : 70 40 : 60
2.0 < R/C <= 2.5 30% 40 : 60 50 : 50
2.5 < R/C <= 3.0 30% 50 : 50 60 : 40
R/C > 3.0 30% 60 : 40 70:30
Contractor’s R/CRatio
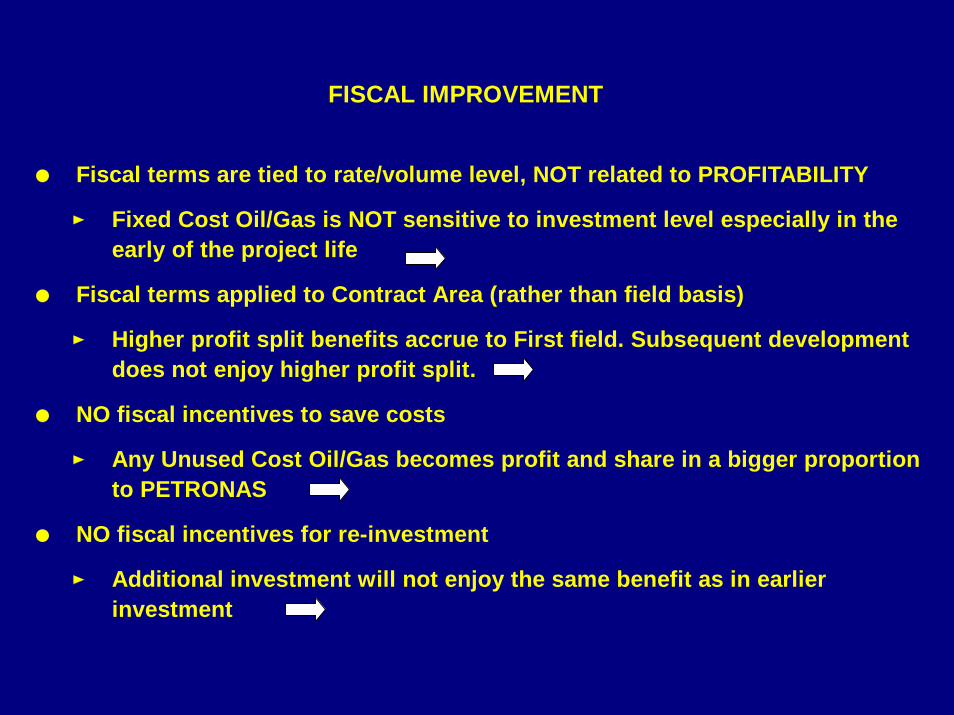
FISCAL IMPROVEMENT
Fiscal terms are tied to rate/volume level, NOT related to PROFITABILITY
Fixed Cost Oil/Gas is NOT sensitive to investment level especially in the early of the project life
Fiscal terms applied to Contract Area (rather than field basis)
Higher profit split benefits accrue to First field. Subsequent development does not enjoy higher profit split.
NO fiscal incentives to save costs
Any Unused Cost Oil/Gas becomes profit and share in a bigger proportion to PETRONAS
NO fiscal incentives for re-investment
Additional investment will not enjoy the same benefit as in earlier investment
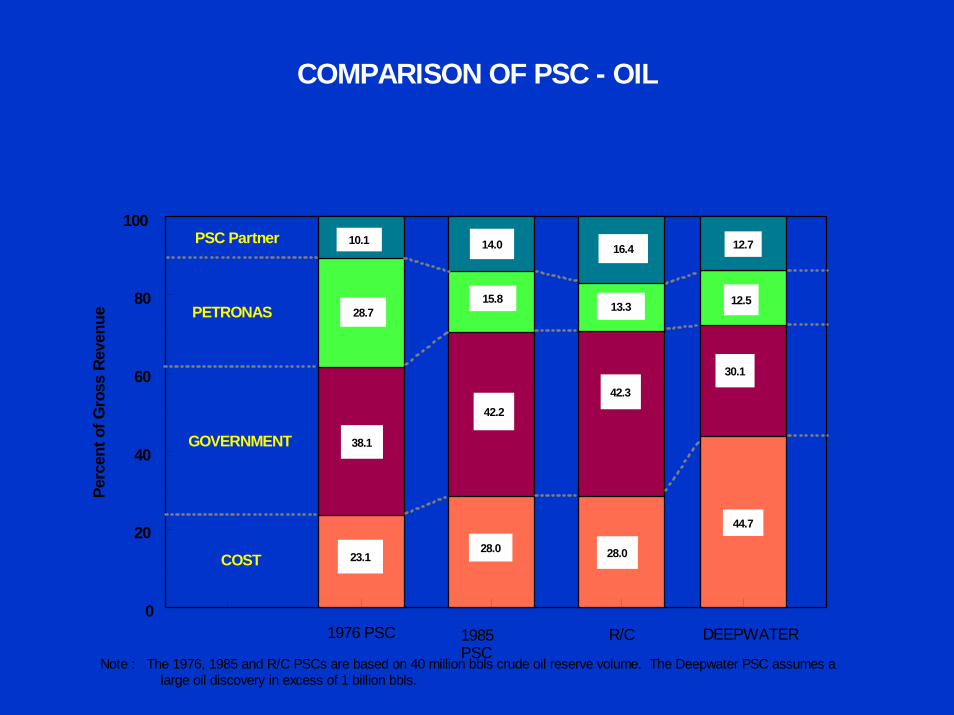
COMPARISON OF PSC - OIL
Note : The 1976, 1985 and R/C PSCs are based on 40 million bbls crude oil reserve volume. The Deepwater PSC assumes a large oil discovery in excess of 1 billion bbls.
Perc
ent o
f Gro
ss R
even
ue
0
20
40
60
80
100
GOVERNMENT
COST
PSC Partner
PETRONAS
42.3
28.0
13.3
R/C
16.4
42.2
28.0
15.8
14.0
1985 PSC
38.1
23.1
28.7
10.1
1976 PSC
30.1
44.7
12.5
12.7
DEEPWATER
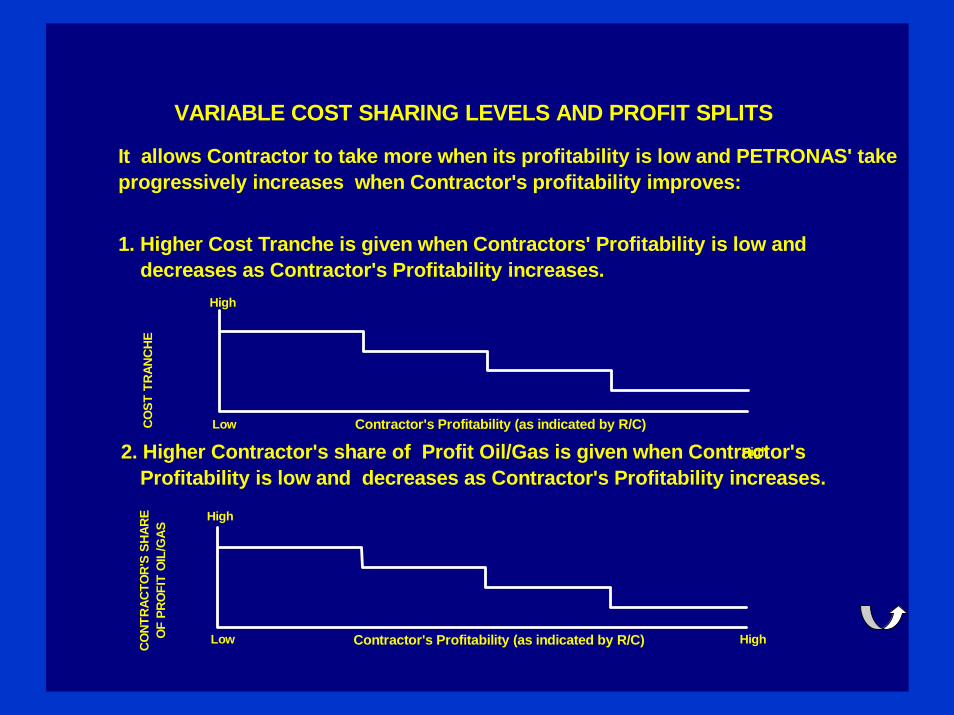
It allows Contractor to take more when its profitability is low and PETRONAS' take progressively increases when Contractor's profitability improves:
1. Higher Cost Tranche is given when Contractors' Profitability is low and decreases as Contractor's Profitability increases.
2. Higher Contractor's share of Profit Oil/Gas is given when Contractor's Profitability is low and decreases as Contractor's Profitability increases.
CONT
RACT
OR
'S S
HAR
EO
F PR
OFI
T O
IL/G
AS
High
Low HighContractor's Profitability (as indicated by R/C)
COST
TRA
NCHE
High
High
Contractor's Profitability (as indicated by R/C)Low
VARIABLE COST SHARING LEVELS AND PROFIT SPLITS
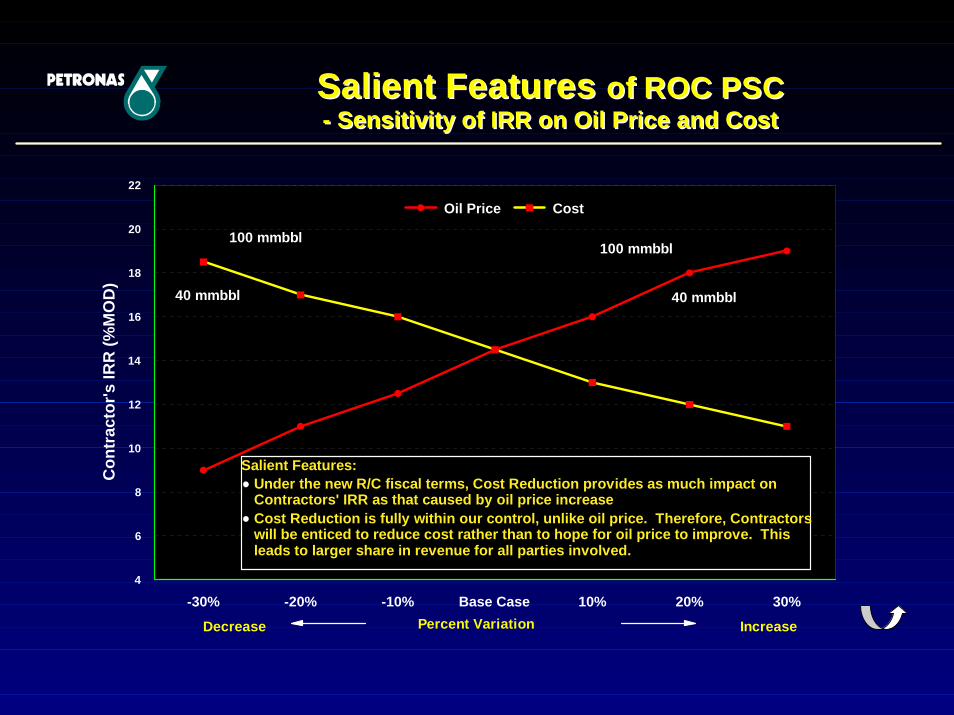
-30% -20% -10% Base Case 10% 20% 30%4
6
8
10
12
14
16
18
20
22
Con
trac
tor's
IRR
(%M
OD
)
Oil Price Cost
Salient Features Salient Features of ROC PSCof ROC PSC- Sensitivity of IRR on Oil Price and Cost- Sensitivity of IRR on Oil Price and Cost
Salient Features:Under the new R/C fiscal terms, Cost Reduction provides as much impact on Contractors' IRR as that caused by oil price increaseCost Reduction is fully within our control, unlike oil price. Therefore, Contractors will be enticed to reduce cost rather than to hope for oil price to improve. This leads to larger share in revenue for all parties involved.
Decrease IncreasePercent Variation
100 mmbbl
40 mmbbl 40 mmbbl
100 mmbbl
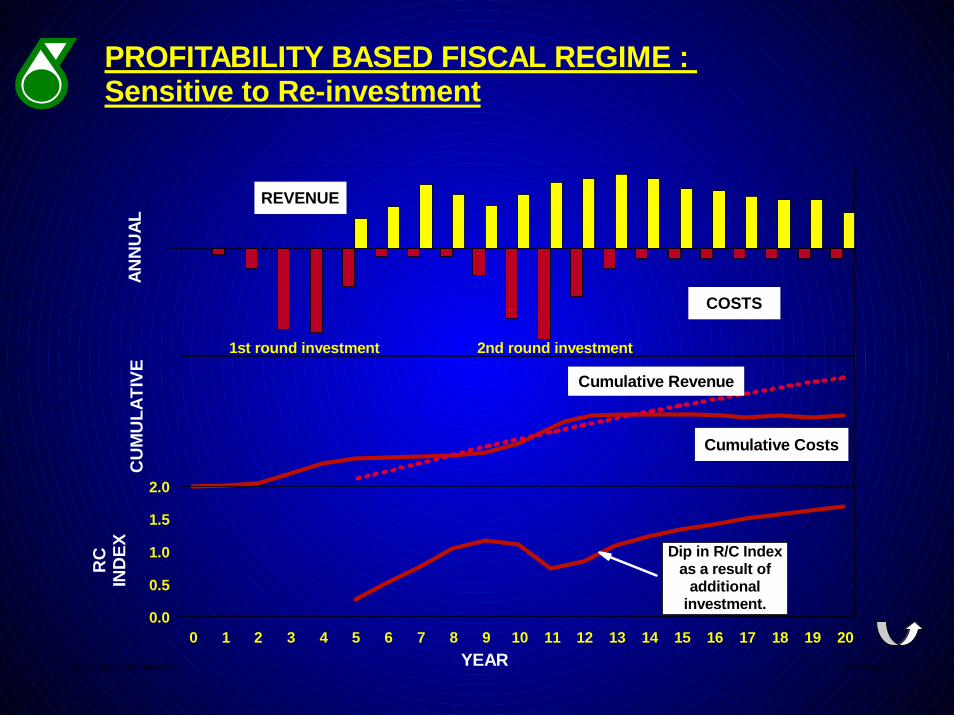
RC
IND
EX
YEAR
ANN
UAL
0 1 2 3 4 5 6 7 8 9 10 11 12 13 14 15 16 17 18 19 20
CU
MU
LATI
VE
0.0
0.5
1.0
1.5
2.0
COSTS
REVENUE
Cumulative Costs
Cumulative Revenue
1st round investment 2nd round investment
Dip in R/C Indexas a result of
additionalinvestment.
E&P BusinessECA-1 / mcprer3c/JAN 1996 EMD
PROFITABILITY BASED FISCAL REGIME : Sensitive to Re-investment
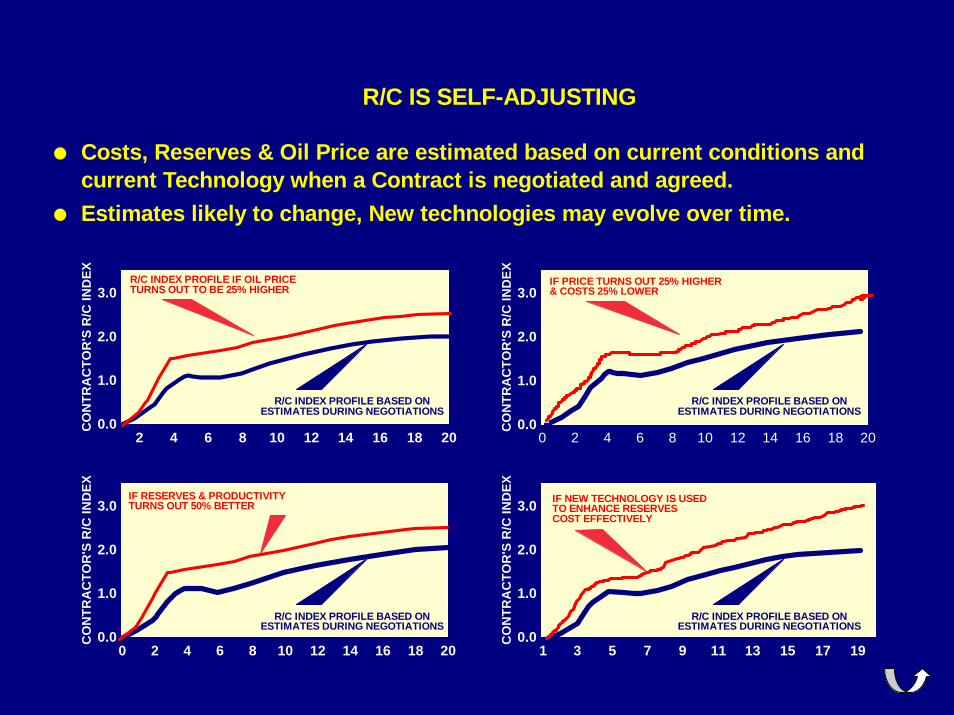
Costs, Reserves & Oil Price are estimated based on current conditions and current Technology when a Contract is negotiated and agreed.Estimates likely to change, New technologies may evolve over time.
R/C IS SELF-ADJUSTING
2 4 6 8 10 12 14 16 18 200.0
1.0
2.0
3.0
CO
NTR
AC
TOR
'S R
/C IN
DEX
0 2 4 6 8 10 12 14 16 18 200.0
1.0
2.0
3.0
CO
NTR
AC
TOR
'S R
/C IN
DEX
1 3 5 7 9 11 13 15 17 190.0
1.0
2.0
3.0C
ON
TRA
CTO
R'S
R/C
IND
EX
0 2 4 6 8 10 12 14 16 18 200.0
1.0
2.0
3.0
CO
NTR
AC
TOR
'S R
/C IN
DEX IF RESERVES & PRODUCTIVITY
TURNS OUT 50% BETTER
R/C INDEX PROFILE IF OIL PRICETURNS OUT TO BE 25% HIGHER
R/C INDEX PROFILE BASED ONESTIMATES DURING NEGOTIATIONS
IF PRICE TURNS OUT 25% HIGHER& COSTS 25% LOWER
IF NEW TECHNOLOGY IS USEDTO ENHANCE RESERVESCOST EFFECTIVELY
R/C INDEX PROFILE BASED ONESTIMATES DURING NEGOTIATIONS
R/C INDEX PROFILE BASED ONESTIMATES DURING NEGOTIATIONS
R/C INDEX PROFILE BASED ONESTIMATES DURING NEGOTIATIONS
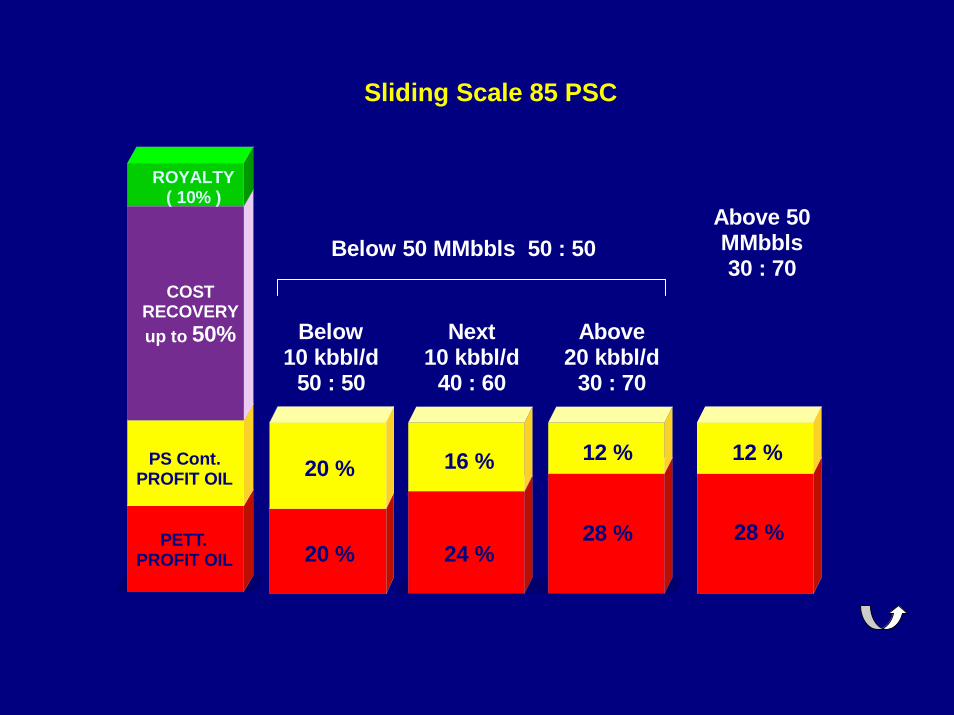
Sliding Scale 85 PSC
ROYALTY( 10% )
PS Cont.PROFIT OIL
PETT.PROFIT OIL
COSTRECOVERYup to 50%
12 %
28 %
12 %
28 %
Above 50 MMbbls30 : 70
20 %
20 %
Below 50 MMbbls 50 : 50
20 %
20 %
Below10 kbbl/d
50 : 50
Next10 kbbl/d
40 : 60
16 %
24 %
Above20 kbbl/d
30 : 70
12 %
28 %
Recommended