1
Paraprofessional Support in !Inclusive Schools: !
Research, Practices & AlternativesStudent Services Administrator's Association
of Manitoba Portage la Prairie, Manitoba
April 27, 2018 © Michael F. Giangreco, Ph.D.
University of Vermont
If Paraprofessionals are Used for Instruction, the Research says:
1. Supplemental Instruction (not primary or exclusive)
2. Work from professionally prepared plans using research-based approaches (not to make pedagogical decisions)
3. Trained to implement with fidelity4. Trained in responding to behaviors5. Ongoing monitoring & supervision6. These are rare; the opposite is more common.
2
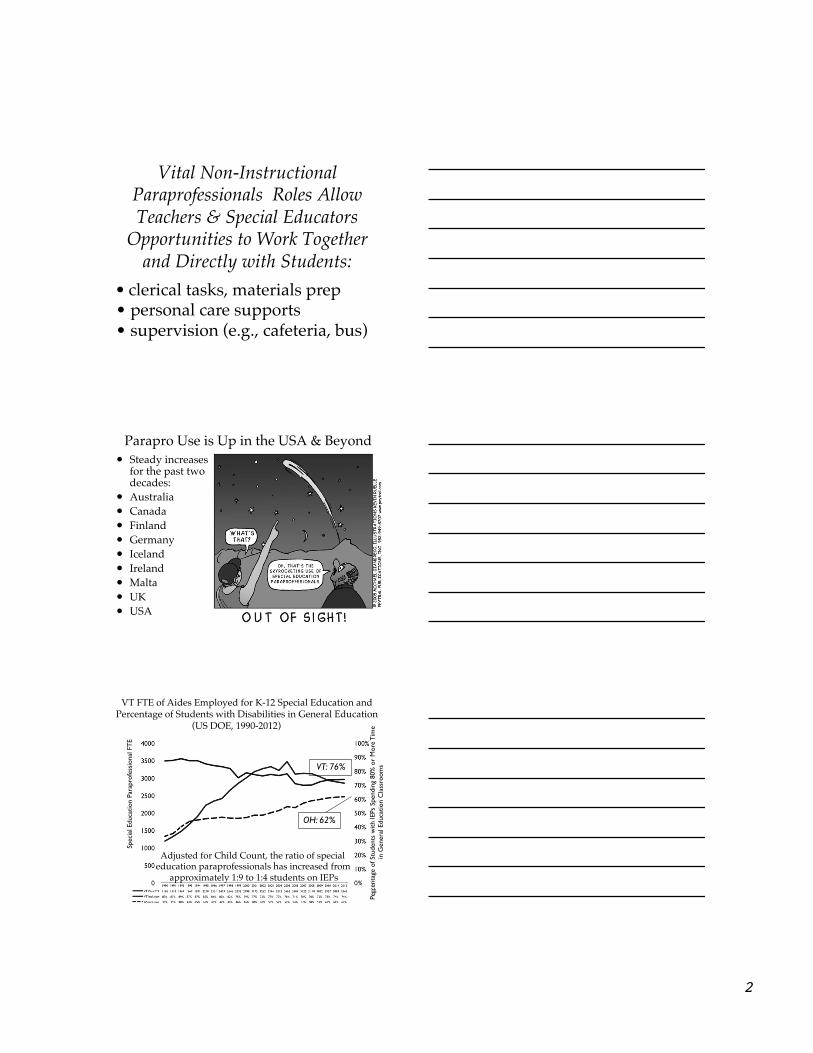
Vital Non-Instructional Paraprofessionals Roles Allow Teachers & Special Educators
Opportunities to Work Together and Directly with Students:
• clerical tasks, materials prep !• personal care supports• supervision (e.g., cafeteria, bus)
Parapro Use is Up in the USA & Beyond • Steady increases
for the past two decades:
• Australia• Canada• Finland• Germany• Iceland• Ireland• Malta• UK• USA
VT FTE of Aides Employed for K-12 Special Education and Percentage of Students with Disabilities in General Education
(US DOE, 1990-2012)
Spec
ial E
duca
tion
Para
prof
essi
onal
FT
E
Perc
enta
ge o
f Stu
dent
s w
ith IE
Ps S
pend
ing
80%
or
Mor
e T
ime
in G
ener
al E
duca
tion
Cla
ssro
oms
Adjusted for Child Count, the ratio of special education paraprofessionals has increased from
approximately 1:9 to 1:4 students on IEPs6
OH: 62%
VT: 76%

3
What the literature says:Ø 1975-2017 repeats the same themes (clarify
roles, train, supervise); new themes emerged around 1997 (e.g., helping or hovering)
Ø Limited student outcome data:Ø A few single-subject studies report effectiveness of
assistants teaching new skills, facilitating interactions, increasing engaged time on task.
Ø A small set of literacy studies with “at risk” students report positive results under very specific/intensive conditions.
Ø Assistants can learn if we make the effort.
Recent Data Questions !Instructional Use of
Paraprofessionals • Deployment of Instructional Support Staff (Blatchford
et al., 2009); > 6,000 schools (England & Wales)• Teachers reported parapro use worked for them, but
data indicated it didn’t for students. • Students engaged with Teacher Assistants get less
teacher engagement/instruction• Across 7 grade levels there was a negative
relationship between TA Support and achievement in English, Math & Science (16 of 21 comparisons) and no difference in the other 5
• Qualitative differences in Teacher:Pupil Talk vs. TA:Pupil Talk (e.g., conceptual vs. task completion)
SPED Paraprofessionals
77% 48%Assigned to SPED One-to-One
Assigned to GenEd
Non One-to-One
All Paraprofessionals
NTC Data Set: Distribution of Paraprofessional FTE!
n = 88 (VT, CT, NH, MA, CA)
(17% to 100%)
24%(0% to 83%)
(0% to 100%)
9

4
10
NTC Data Set: Special Education Time Use (n = 452 Special Educators)
SPEDs supervised an ave. of 3.1 Parapros, leaving ≈ 2% time
available to supervise each paraprofessional
NTC Data Set: Percentage of Out-of-Class Instruction forStudents with IEPs (n = 256 SPEDS)
Mean = 73%
11
12
NTC Data Set: Special Education Parapros Time Use as Reported by 398 Special Educators
SPEDs supervised an ave. of 3.1 Parapros
Range = 0 to 20Total reported on = 1363 Parapro (FTE)

5
AKAL
AR
AZ
CA
CO
CT
DC
DE
GAHI
ILIO
KSKY LA
MA
MD
MEMI
MNMO
MS
MTNC
ND
NE
NHNJ
NM
NV
NY
OH
OK
OR
PARI
SC SDTN
TXUT
VA
VT
WA
WIWV
WY
0
5
10
15
20
25
30
35
40
0.0 0.5 1.0 1.5 2.0 2.5 3.0
Mea
n Sp
ecia
l Edu
cato
r IE
P C
asel
oad
Special Education Services Concentration 13
Mean Special Educator IEP Caseload by Special Education Services Concentration for Students K-12 !
(US DOE, 2013)US = 1.1
*Note: 3 states (IN, ID, FL) with suspect data were removed.
More SPED
Para FTE
More SPED FTE
NH
?
NTC Data Set: Mean Special Educator IEP Caseload by !Special Education Services Concentration !
n = 88
Mean (n = 88) Special Education Services Concentration (3.2)
More SPED
Para FTE
More SPED FTE
14
In your school…n What percent of SWD are included 80% or
more?n How many of your students are sent
elsewhere?n What is the SPED Teacher:Parapro ratio?n What percent of parapros are 1:1?n How do SPED Teachers spend their time?n How much SPED Teacher time is in pull-
out?n How do parapros spend their time?

6
Data-Based Issues &
Inadvertent Detrimental
Effects Regarding Assistants
In Inclusive Classrooms
Least Trained Adults Assigned to Students with Most Challenging Characteristics
NTC Data Set: Instructional Time Provided to Students on IEPs by Special Educators and SPED Paraprofessionals !
(n = 457 Special Educators)
Because so many more Parapros than SPEDs and more
Parapro % of time in instruction
Special Educators
Special Education Paraprofessionals
18

7
Excessive Proximity
Research Documents Unintended Detrimental Effects Excessive Assistant Use & Proximity
n Separation from Classmatesn Unnecessary Dependencen Interference with Peer Interactionsn Insular Relationships with Paraprofessionalsn Stigmatizationn Limited Access to Instruction from HQTn Interference with Teacher Engagementn Loss of personal controln Provocation of behavior problemsn Risk of being bullied

8
69% of ParaPros report that they make curricular or instructional decisions without professional oversight

9
45% of ParaPros agree that some SWD communicate that they find ParaPro support offered to them unwanted.
Special Ed Caseload Challengesn Large IEP caseload sizen More students with
special needsn Equivalent or more
students than typical class
n Across multiple grade levels/curricula, locations, and teachers
n Service disruptions due to TA absence, behavioral crises, lack of layered structures
Ratio of Special Educator FTE to Total Enrollment !Special Educator School Density
Mean Ratio = 1:91
1:37 1:224n = 87 (VT, CT, NH, MA, CA)
1:250
1:200
1:150
1:100
1:50
0
27

10
1:2001:40 1:80 1:1001:60 1:120 1:140 1:160 1:180
10
9
8
7
7
6
5
4
4
3
2
1
Spe
cial
Edu
cato
r R
atin
g fo
r W
ork
Healthy(Conducive)
Unhealthy
(Not conducive)
Special Education School Density
Relationship Between Special Educator School Density & Special Educator Ratings of Work Responsibilities!
(Giangreco, Suter, Hurley, 2013)
t(32.98) = -2.9 (p = .006)
29
Increase in school density of 33 is expected to lower special educator rating by a full point.
Most recent data retains “large” effect size
n = 74*, r = -0.58 (p <.001)
Why Special Educator Caseload Numbers Don’t Tell the Whole Story
Example where Schools Serve All Students: School A School BAve. SPED Caseload 11.5 11.5
SPED School Density 1:131 1:69
% on IEPs 8.8% 18.5%
% IEP & SEN 26% 28% 30

11
Implications SPED School Density n Easily calculated and actionable variable
correlated with special educator self-efficacy n National & international implications to compare
across states countries with SPED rolesn Assigning special education teacher resources to
schools based on identification/certification of students as disabled, often leads to more identification in order to access services.
n Build school structures, practices, and capacities to account for the full range of student diversity with layers of support for qualified personnel
n Giving teachers the supports to bridge the research to practice gap
Let’s Talk About SPED Density Can you calculate the SPED Density in your school? Total Enrollment/SPED FTE = SPED Density Where does this put you on the SPED Density chart in terms of potential system health?
How does your SPED Density impact your school (positively or adversely)?
32
The focus on strengthening paraprofessional supports is
predicated on the assumption that we have identified the root need of appropriate educational supports
for students with significant disabilities as: paraprofessionals
need to be more skilled to do what is asked of them. Is this correct?

12
Though training is vital, training alone is not the answer -- if applied in isolation it can actually make things worse if it leads to less teacher engagement.
Would it be OK if the student did not have a disability?
Is there a double-standard?
13
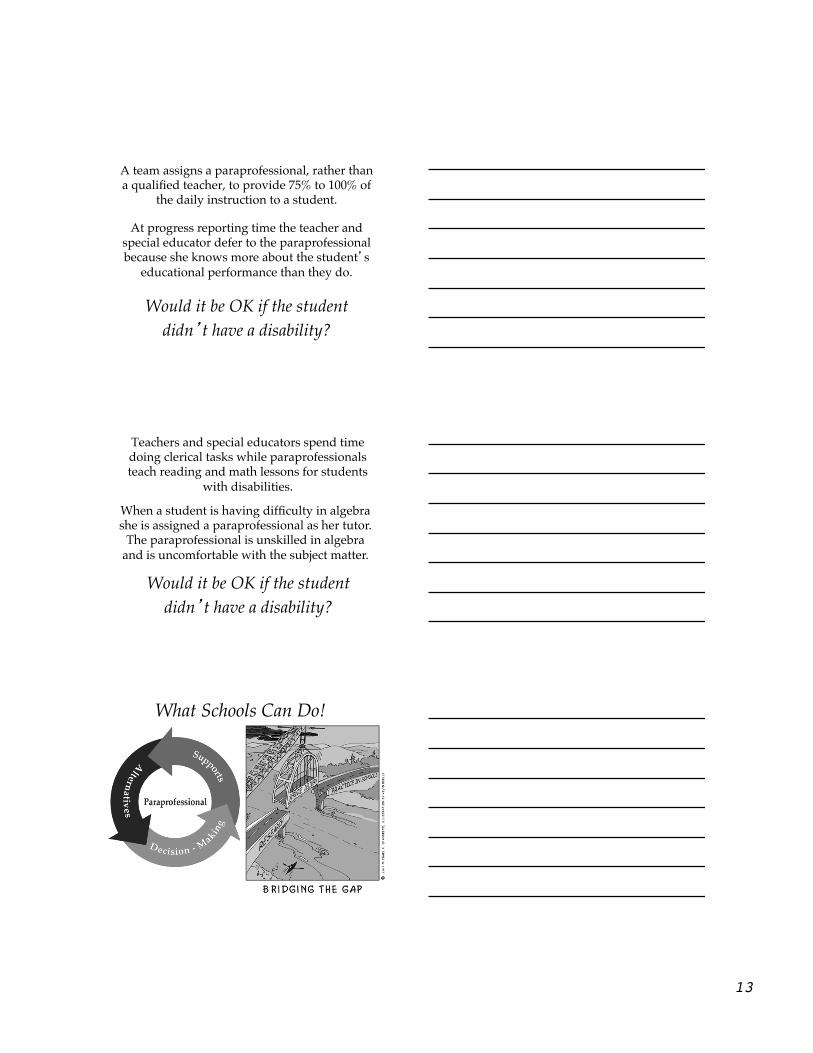
A team assigns a paraprofessional, rather than a qualified teacher, to provide 75% to 100% of
the daily instruction to a student.
Would it be OK if the student didn’t have a disability?
At progress reporting time the teacher and special educator defer to the paraprofessional because she knows more about the student’s
educational performance than they do.
Teachers and special educators spend time doing clerical tasks while paraprofessionals teach reading and math lessons for students
with disabilities.
Would it be OK if the student didn’t have a disability?
When a student is having difficulty in algebra she is assigned a paraprofessional as her tutor.
The paraprofessional is unskilled in algebra and is uncomfortable with the subject matter.
What Schools Can Do!

14
1. Improve Existing Paraprofessional Supports
#1: Acknowledging & Respecting!#2: Orienting & Training!#3: Hiring & Assigning#4: Interactions w/ Students & Staff#5: Roles & Responsibilities#6: Supervision & Evaluation*This is the old stuff – you can’t stop here!
Free !online !as a pdf!
!http://www.uvm.edu/~cdci/
parasupport/?Page=guide.html
2. Shift Paraprofessional Decision-Making Away
from Justification Models (which student needs an
assistant) toward Developing Coherent
Models of Inclusive Service Delivery

15
43
Justification Models are Problematic1. Acting from a reactive posture2. Inattention to proactive models of
service delivery to support full range of students leads to add-on rather than systemic change
3. Brink of capacity perceptions are relative
4. Restricts potential solutions to a narrow, pre-determined set of options focusing on parapros as the answer
Justification Models (continued)5. Sets up unintended messages and
unhealthy dynamics; hurdle to be cleared or game to be played to access only available support
6. Substantial and inappropriate focus on student characteristics and concerns
7. Asking to approve or disapprove the request is the asking the wrong question
8. Focus needed on team, class, school, and system-level issues

16
Myth of the Prototypical Student who “Needs” a 1:1 Parapro
• Illogical and problematic for any students identified (detrimental effects)
• Variations across and between schools suggest prototypes are socially constructed (similar students with widely varying supports)
• Nothing inherent about a student’s characteristics that necessitates a 1:1 parapro as opposed to other supports
47
48

17
How are decisions made about parapro supports in your school?
n Is a “justification” approach, based primarily on student characteristics, utilized?
n Is there are formal tool or process?n Does the approach fall prey to any of
the concerns discussed today?
49
3. Pursue Alternatives to Overreliance on Paraprofessionals !A. School/District Level Actions !B. Classroom/Team Level Action !(The more these are done, the less
likely the school will be reactive and unnecessarily use parapros)!
See RASE article for specifics!(Giangreco, Doyle & Suter, 2012)
School/District Level Actions1. Shared Understanding about Inclusive
Education and LRE2. Guiding Principles: Support Services3. Clarifying Roles of All Team Members4. Understanding Service Delivery Data5. Self-Assessment of General and
Special Education Practices6. Building a Service Delivery Model to
Account for the Full Range of Student Diversity

18
Classroom/Team Level Actions1. First 3 school actions (e.g., Inclusion/
LRE, Guiding Principles, Roles)2. Inclusive Environments (settings/
physical arrangements and people poised to facilitate belonging, participation & learning)
3. Individualized Curriculum4. Purposeful Instruction5. Necessary Supports (VISTA model)
#1 Resource Reallocation:!Trading Places
ALTERNATIVES
As I sharethese, rate
theirdesirability
(1-10)and jot downany ideas for
When webreak intogroups.
#2: Co-Teaching: Special Education !& General Education

19
#3: Building Capacity of!General Education Teachers
#4: Paperwork Paraprofessionals
#5: Improving Working Conditions !for Special Educators

20
#6: Improving Working Conditions !for General Educators
#7: Peer Support Strategies
#8: Self-Determination

21
Student Perspectives
Ø Self-Advocate Study (EC 2005):
Ø Paraprofessional as:ü Motherü Friendü Primary Instructorü Protector (Bullying)
#9: Information Sharing Among Families & Professionals
Emerging Alternatives Ø Paraprofessional PoolsØ “Temporary Support Assistants”Ø Fade Plans/Independence PlansØ More activity-based instructionØ Differentiated Teacher RolesØ More Dual Certified Teachers

22
GSA Planning ToolField-Tested in CA, CT, KS, NH, VT, WI
ü Cross stakeholder teamü Screening & Clusteringü Learn About Alternativesü Self-Assessmentü Prioritize Greatest Needsü Adopt, Adapt, Inventü Action Planü Evaluateü Communicate with the
School Community
© Michael F. Giangreco 2013
© Michael F. Giangreco 2013

23
© Michael F. Giangreco 2013
Over use of parapros is a symptom, not a cause.We need to address special and
general education practices.
69

24
Q & A 70
Recommended
![CSD Paraprofessional Handbook - Home - · Web viewCSD Paraprofessional Handbook Page 13 of 13 [Type here][Type here][Type here] Chamberlain School District Paraprofessional Handbook](https://img.pdfslide.net/doc/110x75/5aa3aaf67f8b9ab4208e8de9/csd-paraprofessional-handbook-home-viewcsd-paraprofessional-handbook-page.jpg)