All SBSO Jurisdictions Part 1 Crimes Recap
# Diff % Diff2010 2011 2012 2013 2014 2015 2016 2017 2018 2019 10 vs 19 10 vs 19
Total Part 1 Crimes 2758 2644 3173 3002 2710 2851 2934 2794 2311 2348 -410 -15%
Violent Crime Total 413 333 349 351 383 353 353 377 315 296 -117 -28%
Homicide 4 1 3 2 11 3 6 4 3 3 -1 -25%
Rape 44 44 51 54 52 54 54 53 38 19 -25 -57%
Robbery 46 41 39 43 34 50 53 55 36 37 -9 -20%
Agg Assault 319 247 256 252 286 246 240 265 238 237 -82 -26%
Property Crime Total 2345 2311 2824 2651 2327 2498 2581 2417 1996 2052 -293 -12%
Burglary 820 678 791 793 686 692 644 618 473 472 -348 -42%
Theft 1489 1573 1941 1796 1588 1723 1865 1695 1417 1486 -3 0%
MV Theft 30 45 78 51 39 66 64 94 103 86 56 187%
Arson 6 15 14 11 14 17 8 10 3 8 2 33%
10-Years Part 1 Crime Counts
2758 2644
31733002
2710 2851 2934 2794
2311 2348
0
500
1000
1500
2000
2500
3000
3500
2010 2011 2012 2013 2014 2015 2016 2017 2018 2019
Part 1 Total Crimes Total Part 1 Crimes
413
333 349 351383
353 353 377
315 296
0
100
200
300
400
500
2010 2011 2012 2013 2014 2015 2016 2017 2018 2019
Part 1 Total Violent Crimes Violent Crime Total
2345 2311
28242651
23272498 2581
2417
1996 2052
0
500
1000
1500
2000
2500
3000
2010 2011 2012 2013 2014 2015 2016 2017 2018 2019
Part 1 Total Property Crimes Property Crime Total
Page 1 of 40

All SBSO Jurisdictions Part 1 Crimes Recap
2015 2016 2017 2018 2019 15-16 16-17 17-18 18-19 15-19 15-16 16-17 17-18 18-19 15-19
Total Part 1 Crimes 2851 2934 2794 2311 2348 83 -140 -483 37 -503 3% -5% -17% 2% -18%
Violent Crime Total 353 353 377 315 296 0 24 -62 -19 -57 0% 7% -16% -6% -16%
Homicide 3 6 4 3 3 3 -2 -1 0 0 100% -33% -25% 0% 0%
Rape 54 54 53 38 19 0 -1 -15 -19 -35 0% -2% -28% -50% -65%
Robbery 50 53 55 36 37 3 2 -19 1 -13 6% 4% -35% 3% -26%
Agg Assault 246 240 265 238 237 -6 25 -27 -1 -9 -2% 10% -10% 0% -4%
Property Crime Total 2498 2581 2417 1996 2052 83 -164 -421 56 -446 3% -6% -17% 3% -18%
Burglary 692 644 618 473 472 -48 -26 -145 -1 -220 -7% -4% -23% 0% -32%
Theft 1723 1865 1695 1417 1486 142 -170 -278 69 -237 8% -9% -16% 5% -14%
MV Theft 66 64 94 103 86 -2 30 9 -17 20 -3% 47% 10% -17% 30%
Arson 17 8 10 3 8 -9 2 -7 5 -9 -53% 25% -70% 167% -53%
2015 2016 2017 2018 2019 2015 2016 2017 2018 2019 2015 2016 2017 2018 2019
Total Part 1 Crimes 2851 2934 2794 2311 2348 684 544 496 483 300 24% 19% 18% 21% 43%
Violent Crime Total 353 353 377 315 296 252 206 201 195 181 71% 58% 53% 62% 66%
Homicide 3 6 4 3 3 2 5 4 3 1 67% 83% 100% 100% 9%
Rape 54 54 53 38 19 40 21 10 11 9 74% 39% 19% 29% 31%
Robbery 50 53 55 36 37 22 27 27 17 22 44% 51% 49% 47% 138%
Agg Assault 246 240 265 238 237 188 153 160 164 149 76% 64% 60% 69% 69%
Property Crime Total 2498 2581 2417 1996 2052 432 338 295 288 215 17% 13% 12% 14% 51%
Burglary 692 644 618 473 472 119 80 76 80 54 17% 12% 12% 17% 37%
Theft 1723 1865 1695 1417 1486 289 238 199 190 148 17% 13% 12% 13% 56%
MV Theft 66 64 94 103 86 16 14 14 15 9 24% 22% 15% 15% 90%
Arson 17 8 10 3 8 8 6 6 3 4 47% 75% 60% 100% 67%
Number of Crimes Number Differences
Number of ClearancesNumber of Crimes Clearance Rate
Percentage Differences
28512934
2794
2311 2348
0
500
1000
1500
2000
2500
3000
3500
Total Part 1 Crimes
Part 1 Total Crimes2015 2016 2017 2018 2019
Page 2 of 40

All SBSO Jurisdictions Part 1 Crimes Recap
3
54 50
246
6
54 53
240
4
53 55
265
3
38 36
238
3
19
37
237
0
50
100
150
200
250
300
Homicide Rape Robbery Agg Assault
Part 1 Violent Crimes2015 2016 2017 2018 2019
692
1723
6617
644
1865
648
618
1695
94
10
473
1417
103
3
472
1486
868
0
200
400
600
800
1000
1200
1400
1600
1800
2000
Burglary Theft MV Theft Arson
Part 1 Property Crimes2015 2016 2017 2018 2019
Page 3 of 40

All SBSO Jurisdictions Part 1 Crimes Recap
2015 2016 2017 2018 2019 15-16 16-17 17-18 18-19 15-19 15-16 16-17 17-18 18-19 15-19Murder 3 5 3 3 3 2 -2 0 0 0 67% -40% 0% 0% 0%
Manslaughter 0 1 1 0 0 1 0 -1 0 0 NC 0% -100% NC NC
Rapes 53 52 48 36 19 -1 -4 -12 -17 -34 -2% -8% -25% -47% -64%
Att Rapes 1 2 5 2 0 1 3 -3 -2 -1 100% 150% -60% -100% -100%
Firearm 11 6 9 8 7 -5 3 -1 -1 -4 -45% 50% -11% -13% -36%
Knife 3 9 5 5 0 6 -4 0 -5 -3 200% -44% 0% -100% -100%
Other 4 3 2 4 5 -1 -1 2 1 1 -25% -33% 100% 25% 25%
Hands, Feet, Etc 32 35 39 19 25 3 4 -20 6 -7 9% 11% -51% 32% -22%
Highway 7 9 6 6 4 2 -3 0 -2 -3 29% -33% 0% -33% -43%
Business 7 6 3 10 4 -1 -3 7 -6 -3 -14% -50% 233% -60% -43%
Gas Station 2 0 1 2 1 -2 1 1 -1 -1 -100% NC 100% -50% -50%
Conevience Store 4 3 8 5 5 -1 5 -3 0 1 -25% 167% -38% 0% 25%
Residence 10 16 9 5 11 6 -7 -4 6 1 60% -44% -44% 120% 10%
Bank 3 1 3 1 1 -2 2 -2 0 -2 -67% 200% -67% 0% -67%
Misc 17 18 25 7 11 1 7 -18 4 -6 6% 39% -72% 57% -35%
Firearm 11 15 14 10 2 4 -1 -4 -8 -9 36% -7% -29% -80% -82%
Knife 36 33 43 36 37 -3 10 -7 1 1 -8% 30% -16% 3% 3%
Other 80 55 83 64 59 -25 28 -19 -5 -21 -31% 51% -23% -8% -26%
Hands, Feet, Etc 119 137 125 128 139 18 -12 3 11 20 15% -9% 2% 9% 17%
Forcible Entry 268 211 237 146 224 -57 26 -91 78 -44 -21% 12% -38% 53% -16%
Unforced Entry 412 418 367 321 244 6 -51 -46 -77 -168 1% -12% -13% -24% -41%
Att Burglary 12 15 14 6 4 3 -1 -8 -2 -8 25% -7% -57% -33% -67%
Residential 298 277 217 203 195 -21 -60 -14 -8 -103 -7% -22% -6% -4% -35%
Commerical 112 113 145 108 140 1 32 -37 32 28 1% 28% -26% 30% 25%
Multiple Resid 147 146 129 108 49 -1 -17 -21 -59 -98 -1% -12% -16% -55% -67%
Institutional 20 12 23 15 11 -8 11 -8 -4 -9 -40% 92% -35% -27% -45%
All Others 115 96 104 39 77 -19 8 -65 38 -38 -17% 8% -63% 97% -33%
Shoplifting 160 131 152 134 176 -29 21 -18 42 16 -18% 16% -12% 31% 10%
From Vehicle 611 713 531 464 511 102 -182 -67 47 -100 17% -26% -13% 10% -16%
Bicycle 178 189 184 145 126 11 -5 -39 -19 -52 6% -3% -21% -13% -29%
Other 774 832 828 674 673 58 -4 -154 -1 -101 7% 0% -19% 0% -13%
Auto 27 28 38 52 41 1 10 14 -11 14 4% 36% 37% -21% 52%
Truck/Bus 21 22 36 41 22 1 14 5 -19 1 5% 64% 14% -46% 5%
Other 18 14 20 10 23 -4 6 -10 13 5 -22% 43% -50% 130% 28%
Stol Local/Recov Local 30 35 36 42 46 5 1 6 4 16 17% 3% 17% 10% 53%
Stol Local/Recov Other 9 12 26 15 11 3 14 -11 -4 2 33% 117% -42% -27% 22%
Stol Other/Recov Local 38 48 38 41 44 10 -10 3 3 6 26% -21% 8% 7% 16%
Agg
Assa
ult
Bur
glar
y
Ent
ryP
rem
ise
Typ
e
Larc
-The
ft
Cat
egor
y
Mot
or V
ehic
le
The
ft Typ
eR
ecov
ery
Murder
Rape
Rob
bery
Wea
pon
Loca
tions
Number Differences Percentage DifferencesPart 1 Crime Details
Page 4 of 40

All SBSO Jurisdictions Part 1 Crimes Recap
2017 2018 2019
Simple Assaults 1369 1248 1106
Forgery & Counterfeit 285 256 258
Fraud 138 173 125
Embezzlement 14 21 8
Stolen Prop 32 54 42
Vandalism 613 654 609
Weapons 134 152 140
Prostitution/Vice 36 32 27
Sex Offenses 58 56 56
Drugs 853 1064 1039
Gambling 0 0 0
Offense Against Family/Child 81 91 84
DUI 297 204 222
Liquor Laws 1146 818 928
Drunkness 659 491 463
Disorderly 346 287 83
Vagrancy 6 6 3
All Other 2798 2461 2924
Curfew 90 115 97
Runaways 141 198 134
Part 2 Crimes
Page 5 of 40

Unincorporated Areas Part 1 Crimes Recap
# Diff % Diff2010 2011 2012 2013 2014 2015 2016 2017 2018 2019 10 vs 19 10 vs 19
Total Part 1 Crimes 1879 1825 2114 2076 1868 1973 1951 1791 1485 1497 -581 -20%
Violent Crime Total 296 257 274 273 313 278 271 279 230 232 -35 -22%
Homicide 3 1 3 1 11 3 6 3 3 2 2 -33%
Rape 35 34 43 39 45 39 42 44 27 17 -7 -51%
Robbery 29 30 28 29 31 32 33 24 22 26 4 -10%
Agg Assault 229 192 200 204 226 204 190 208 178 187 -34 -18%
Property Crime Total 1583 1568 1840 1803 1555 1695 1680 1512 1255 1265 -546 -20%
Burglary 630 491 568 569 487 506 476 424 344 305 -388 -52%
Theft 942 1058 1243 1211 1052 1164 1180 1058 884 938 -168 0%
MV Theft 6 7 15 13 5 13 17 24 24 14 9 133%
Arson 5 12 14 10 11 12 7 6 3 8 1 60%
10-Years Part 1 Crime Counts
1879 18252114 2076
1868 1973 19511791
1485 1497
0
500
1000
1500
2000
2500
2010 2011 2012 2013 2014 2015 2016 2017 2018 2019
Part 1 Total Crimes
Total Part 1 Crimes
296257 274 273
313278 271 279
230 232
0
100
200
300
400
2010 2011 2012 2013 2014 2015 2016 2017 2018 2019
Part 1 Total Violent Crimes
Violent Crime Total
1583 15681840 1803
15551695 1680
15121255 1265
0
500
1000
1500
2000
2010 2011 2012 2013 2014 2015 2016 2017 2018 2019
Part 1 Total Property Crimes
Property Crime Total
Page 6 of 40

Unincorporated Areas Part 1 Crimes Recap
2015 2016 2017 2018 2019 15-16 16-17 17-18 18-19 15-19 15-16 16-17 17-18 18-19 15-19
Total Part 1 Crimes 1973 1951 1791 1485 1497 -22 -160 -306 12 -476 -1% -8% -17% 1% -24%
Violent Crime Total 278 271 279 230 230 -7 8 -49 0 -48 -3% 3% -18% 0% -17%
Homicide 3 6 3 3 2 3 -3 0 -1 -1 100% -50% 0% -33% -33%
Rape 39 42 44 27 17 3 2 -17 -10 -22 8% 5% -39% -37% -56%
Robbery 32 33 24 22 26 1 -9 -2 4 -6 3% -27% -8% 18% -19%
Agg Assault 204 190 208 178 187 -14 18 -30 9 -17 -7% 9% -14% 5% -8%
Property Crime Total 1695 1680 1512 1255 1255 -15 -168 -257 0 -440 -1% -10% -17% 0% -26%
Burglary 506 476 424 344 305 -30 -52 -80 -39 -201 -6% -11% -19% -11% -40%
Theft 1164 1180 1058 884 938 16 -122 -174 54 -226 1% -10% -16% 6% -19%
MV Theft 13 17 24 24 14 4 7 0 -10 1 31% 41% 0% -42% 8%
Arson 12 7 6 3 8 -5 -1 -3 5 -4 -42% -14% -50% 167% -33%
2015 2016 2017 2018 2019 2015 2016 2017 2018 2019 2015 2016 2017 2018 2019
Total Part 1 Crimes 1973 1951 1791 1485 1497 461 338 312 312 242 23% 17% 17% 21% 50%
Violent Crime Total 278 271 279 230 232 199 150 141 141 128 72% 55% 51% 61% 58%
Homicide 3 6 3 3 2 2 5 3 3 0 67% 83% 100% 100% 0%
Rape 39 42 44 27 17 31 13 7 7 8 79% 31% 16% 26% 38%
Robbery 32 33 24 22 26 14 13 10 10 17 44% 39% 42% 45% 113%
Agg Assault 204 190 208 178 187 152 119 121 121 103 75% 63% 58% 68% 59%
Property Crime Total 1695 1680 1512 1255 1265 262 188 171 171 114 15% 11% 11% 14% 44%
Burglary 506 476 424 344 305 85 59 47 47 29 17% 12% 11% 14% 36%
Theft 1164 1180 1058 884 938 165 114 116 116 78 14% 10% 11% 13% 45%
MV Theft 13 17 24 24 14 6 9 5 5 3 46% 53% 21% 21% 100%
Arson 12 7 6 3 8 6 6 3 3 4 50% 86% 50% 100% 80%
Number of Crimes
Number of Crimes Number of Clearances
Number Differences
Clearance Rate
Percentage Differences
1973 19511791
1485 1497
0
500
1000
1500
2000
2500
Total Part 1 Crimes
Part 1 Total Crimes
2015 2016 2017 2018 2019
Page 7 of 40
Unincorporated Areas Part 1 Crimes Recap
3
3932
204
6
4233
190
3
44
24
208
217
26
187
0
50
100
150
200
250
Homicide Rape Robbery Agg Assault
Part 1 Violent Crimes
2015 2016 2017 2018 2019
506
1164
13 12
476
1180
17 7
424
1058
24 6
305
938
14 80
200
400
600
800
1000
1200
1400
Burglary Theft MV Theft Arson
Part 1 Property Crimes
2015 2016 2017 2018 2019
Page 8 of 40

Unincorporated Areas Part 1 Crimes Recap
2015 2016 2017 2018 2019 15-16 16-17 17-18 18-19 15-19 15-16 16-17 17-18 18-19 15-19Murder 3 5 2 3 2 2 -3 1 -1 -1 67% -60% 50% -33% -33%
Manslaughter 0 1 1 0 0 1 0 -1 0 0 NC 0% -100% NC NC
Rapes 39 40 40 25 17 1 0 -15 -8 -22 3% 0% -38% -32% -56%
Att Rapes 0 2 4 2 0 2 2 -2 -2 0 NC 100% -50% -100% NC
Firearm 6 4 2 4 5 -2 -2 2 1 -1 -33% -50% 100% 25% -17%
Knife 3 7 3 4 0 4 -4 1 -4 -3 133% -57% 33% -100% -100%
Other 4 2 1 1 4 -2 -1 0 3 0 -50% -50% 0% 300% 0%
Hands, Feet, Etc 19 20 18 13 17 1 -2 -5 4 -2 5% -10% -28% 31% -11%
Highway 6 8 3 6 4 2 -5 3 -2 -2 33% -63% 100% -33% -33%
Business 4 2 1 5 0 -2 -1 4 -5 -4 -50% -50% 400% -100% -100%
Gas Station 2 0 0 2 0 -2 0 2 -2 -2 -100% NC NC -100% -100%
Conevience Store 1 2 2 1 3 1 0 -1 2 2 100% 0% -50% 200% 200%
Residence 8 11 6 4 10 3 -5 -2 6 2 38% -45% -33% 150% 25%
Bank 1 0 0 0 0 -1 0 0 0 -1 -100% NC NC NC -100%
Misc 10 10 12 4 9 0 2 -8 5 -1 0% 20% -67% 125% -10%
Firearm 9 6 14 8 1 -3 8 -6 -7 -8 -33% 133% -43% -88% -89%
Knife 26 24 31 24 32 -2 7 -7 8 6 -8% 29% -23% 33% 23%
Other 66 38 56 44 45 -28 18 -12 1 -21 -42% 47% -21% 2% -32%
Hands, Feet, Etc 103 122 107 102 109 19 -15 -5 7 6 18% -12% -5% 7% 6%
Forcible Entry 185 134 148 99 133 -51 14 -49 34 -52 -28% 10% -33% 34% -28%
Unforced Entry 309 332 266 241 168 23 -66 -25 -73 -141 7% -20% -9% -30% -46%
Att Burglary 12 10 10 4 4 -2 0 -6 0 -8 -17% 0% -60% 0% -67%
Residential 248 227 157 174 160 -21 -70 17 -14 -88 -8% -31% 11% -8% -35%
Commerical 49 47 65 38 54 -2 18 -27 16 5 -4% 38% -42% 42% 10%
Multiple Resid 128 133 117 93 32 5 -16 -24 -61 -96 4% -12% -21% -66% -75%
Institutional 16 7 15 15 8 -9 8 0 -7 -8 -56% 114% 0% -47% -50%
All Others 65 62 70 24 51 -3 8 -46 27 -14 -5% 13% -66% 113% -22%
Shoplifting 63 49 61 64 68 -14 12 3 4 5 -22% 24% 5% 6% 8%
From Vehicle 416 454 331 299 326 38 -123 -32 27 -90 9% -27% -10% 9% -22%
Bicycle 135 141 114 87 81 6 -27 -27 -6 -54 4% -19% -24% -7% -40%
Other 550 536 552 434 463 -14 16 -118 29 -87 -3% 3% -21% 7% -16%
Auto 6 6 5 12 3 0 -1 7 -9 -3 0% -17% 140% -75% -50%
Truck/Bus 4 6 5 7 3 2 -1 2 -4 -1 50% -17% 40% -57% -25%
Other 3 5 14 5 8 2 9 -9 3 5 67% 180% -64% 60% 167%
Stol Local/Recov Local 12 16 12 17 12 4 -4 5 -5 0 33% -25% 42% -29% 0%
Stol Local/Recov Other 0 1 3 3 0 1 2 0 -3 0 NC 200% 0% -100% NC
Stol Other/Recov Local 16 21 18 16 22 5 -3 -2 6 6 31% -14% -11% 38% 38%
Mot
or V
ehic
le
The
ft Typ
eR
ecov
ery
Agg
Assa
ult
Bur
glar
y
Ent
ryP
rem
ise
Typ
e
Larc
-The
ft
Cat
egor
y
Rob
bery
Wea
pon
Loca
tions
Rape
Number Differences
Murder
Percentage DifferencesPart 1 Crime Details
Page 9 of 40

Unincorporated Areas Part 1 Crimes Recap
2017 2018 2019
Simple Assaults 1082 915 829
Forgery & Counterfeit 170 146 159
Fraud 85 91 80
Embezzlement 7 4 6
Stolen Prop 24 27 28
Vandalism 390 477 377
Weapons 100 103 89
Prostitution/Vice 20 15 19
Sex Offenses 40 38 38
Drugs 619 781 744
Gambling 0 0 0
Offense Against Family/Child 50 59 50
DUI 136 94 75
Liquor Laws 1092 784 884
Drunkness 397 286 270
Disorderly 320 257 66
Vagrancy 3 3 2
All Other 1818 1562 1946
Curfew 72 109 91
Runaways 124 160 97
Part 2 Crimes
Page 10 of 40

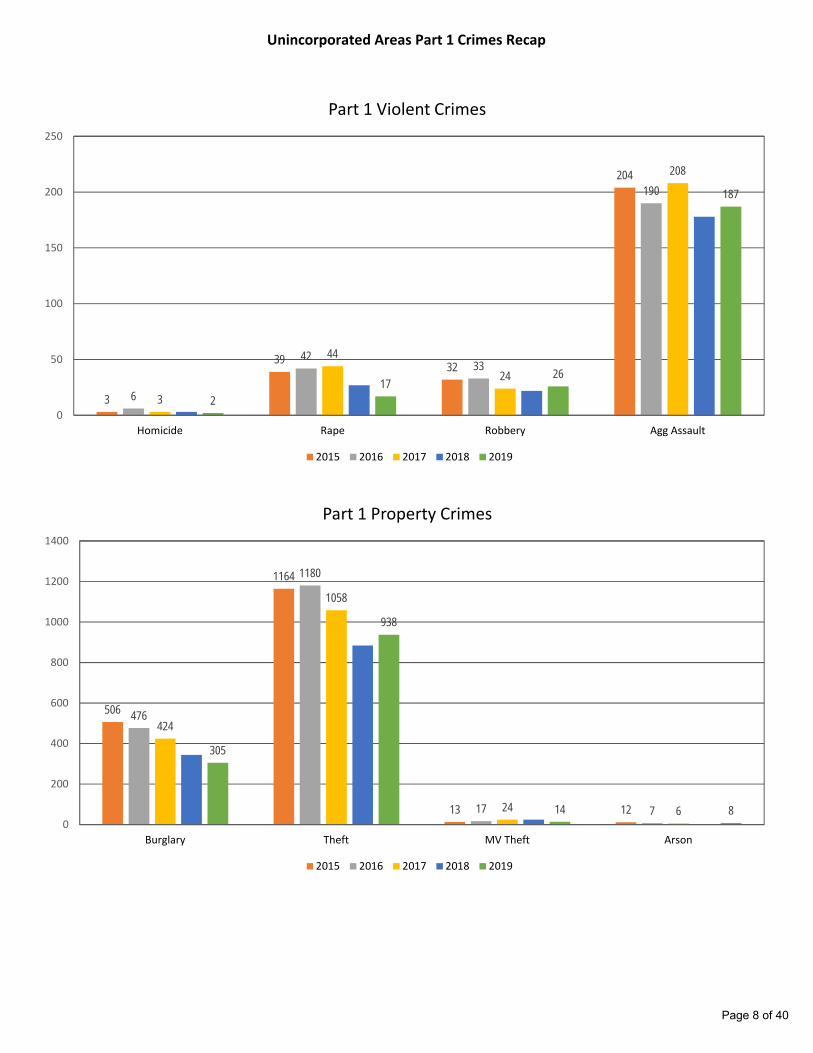
Uninc No IVFP Part 1 Crimes Recap
# Diff % Diff2010 2011 2012 2013 2014 2015 2016 2017 2018 2019 10 vs 19 10 vs 19
Total Part 1 Crimes 1169 1168 1332 1360 1189 1438 1410 1369 1166 1273 104 9%
Violent Crime Total 203 153 176 178 174 199 198 232 195 198 -5 -2%
Homicide 3 -1 3 1 5 3 6 3 3 2 -1 -33%
Rape 21 20 28 22 18 26 24 34 20 10 -11 -52%
Robbery 13 16 14 13 10 18 19 14 16 18 5 38%
Agg Assault 166 118 131 142 141 152 149 181 156 168 2 1%
Property Crime Total 966 1015 1156 1182 1015 1239 1212 1137 971 1075 109 11%
Burglary 325 258 286 322 260 315 282 264 216 253 -72 -22%
Theft 631 745 853 843 743 900 908 845 730 802 171 27%
MV Theft 6 6 15 13 4 12 17 23 24 14 8 133%
Arson 4 6 2 4 8 12 5 5 1 6 2 50%
10-Years Part 1 Crime Counts
1169 11681332 1360
11891438 1410 1369
1166 1273
0
500
1000
1500
2000
2010 2011 2012 2013 2014 2015 2016 2017 2018 2019
Part 1 Total Crimes
Total Part 1 Crimes
203
153176 178 174
199 198232
195 198
0
50
100
150
200
250
2010 2011 2012 2013 2014 2015 2016 2017 2018 2019
Part 1 Total Violent Crimes
Violent Crime Total
966 10151156 1182
10151239 1212 1137
9711075
0
500
1000
1500
2010 2011 2012 2013 2014 2015 2016 2017 2018 2019
Part 1 Total Property Crimes
Property Crime Total
Page 11 of 40

Uninc No IVFP Part 1 Crimes Recap
2015 2016 2017 2018 2019 15-16 16-17 17-18 18-19 15-19 15-16 16-17 17-18 18-19 15-19Total Part 1 Crimes 1438 1410 1369 1166 1273 -28 -41 -203 107 -165 -2% -3% -15% 9% -11%
Violent Crime Total 199 198 232 195 198 -1 34 -37 3 -1 -1% 17% -16% 2% -1%
Homicide 3 6 3 3 2 3 -3 0 -1 -1 100% -50% 0% -33% -33%
Rape 26 24 34 20 10 -2 10 -14 -10 -16 -8% 42% -41% -50% -62%
Robbery 18 19 14 16 18 1 -5 2 2 0 6% -26% 14% 13% 0%
Agg Assault 152 149 181 156 168 -3 32 -25 12 16 -2% 21% -14% 8% 11%
Property Crime Total 1239 1212 1137 971 1075 -27 -75 -166 104 -164 -2% -6% -15% 11% -13%
Burglary 315 282 264 216 253 -33 -18 -48 37 -62 -10% -6% -18% 17% -20%
Theft 900 908 845 730 802 8 -63 -115 72 -98 1% -7% -14% 10% -11%
MV Theft 12 17 23 24 14 5 6 1 -10 2 42% 35% 4% -42% 17%
Arson 12 5 5 1 6 -7 0 -4 5 -6 -58% 0% -80% 500% -50%
2015 2016 2017 2018 2019 2015 2016 2017 2018 2019 2015 2016 2017 2018 2019
Total Part 1 Crimes 1438 1410 1369 1166 1273 356 277 275 276 219 25% 20% 20% 24% 17%
Violent Crime Total 199 198 232 195 198 152 125 123 127 111 76% 63% 53% 65% 56%
Homicide 3 6 3 3 2 2 5 3 3 0 67% 83% 100% 100% 0%
Rape 26 24 34 20 10 24 8 2 6 6 92% 33% 6% 30% 60%
Robbery 18 19 14 16 18 8 10 6 6 13 44% 53% 43% 38% 72%
Agg Assault 152 149 181 156 168 118 102 112 112 92 78% 68% 62% 72% 55%
Property Crime Total 1239 1212 1137 971 1075 204 152 152 149 108 16% 13% 13% 15% 10%
Burglary 315 282 264 216 253 60 43 40 39 27 19% 15% 15% 18% 11%
Theft 900 908 845 730 802 132 94 104 102 74 15% 10% 12% 14% 9%
MV Theft 12 17 23 24 14 6 9 5 5 3 50% 53% 22% 21% 21%
Arson 12 5 5 1 6 6 6 3 3 4 50% 120% 60% 300% 67%
Number of Crimes Number of Clearances Clearance Rate
Number Differences Percentage DifferencesNumber of Crimes
1438 1410 1369
1166
1273
0
200
400
600
800
1000
1200
1400
1600
Total Part 1 Crimes
Part 1 Total Crimes
2015 2016 2017 2018 2019
Page 12 of 40

Uninc No IVFP Part 1 Crimes Recap
3
2618
152
6
2419
149
3
34
14
181
3
20 16
156
210
18
168
0
20
40
60
80
100
120
140
160
180
200
Homicide Rape Robbery Agg Assault
Part 1 Violent Crimes
2015 2016 2017 2018 2019
315
900
12 12
282
908
17 5
264
845
23 5
216
730
241
253
802
14 60
100
200
300
400
500
600
700
800
900
1000
Burglary Theft MV Theft Arson
Part 1 Property Crimes
2015 2016 2017 2018 2019
Page 13 of 40
Uninc No IVFP Part 1 Crimes Recap
2015 2016 2017 2018 2019 15-16 16-17 17-18 18-19 15-19 15-16 16-17 17-18 18-19 15-19Murder 3 5 2 3 2 2 -3 1 -1 -1 67% -60% 50% -33% -33%
Manslaughter 0 1 1 0 0 1 0 -1 0 0 NC 0% -100% NC NC
Rapes 25 22 31 19 10 -3 9 -12 -9 -15 -12% 41% -39% -47% -60%
Att Rapes 1 2 3 1 0 1 1 -2 -1 -1 100% 50% -67% -100% -100%
Firearm 4 4 1 4 3 0 -3 3 -1 -1 0% -75% 300% -25% -25%
Knife 0 5 2 3 0 5 -3 1 -3 0 NC -60% 50% -100% NC
Other 1 0 1 1 1 -1 1 0 0 0 -100% NC 0% 0% 0%
Hands, Feet, Etc 13 10 10 8 14 -3 0 -2 6 1 -23% 0% -20% 75% 8%
Highway 1 4 1 2 1 3 -3 1 -1 0 300% -75% 100% -50% 0%
Business 4 2 1 5 0 -2 -1 4 -5 -4 -50% -50% 400% -100% -100%
Gas Station 2 0 0 2 0 -2 0 2 -2 -2 -100% NC NC -100% -100%
Conevience Store 0 2 2 1 2 2 0 -1 1 2 NC 0% -50% 100% NC
Residence 4 4 4 2 8 0 0 -2 6 4 0% 0% -50% 300% 100%
Bank 1 0 0 0 0 -1 0 0 0 -1 -100% NC NC NC -100%
Misc 6 7 6 4 7 1 -1 -2 3 1 17% -14% -33% 75% 17%
Firearm 5 5 14 7 1 0 9 -7 -6 -4 0% 180% -50% -86% -80%
Knife 25 20 26 23 31 -5 6 -3 8 6 -20% 30% -12% 35% 24%
Other 52 34 51 38 42 -18 17 -13 4 -10 -35% 50% -25% 11% -19%
Hands, Feet, Etc 70 90 90 88 94 20 0 -2 6 24 29% 0% -2% 7% 34%
Forcible Entry 149 115 130 84 120 -34 15 -46 36 -29 -23% 13% -35% 43% -19%
Unforced Entry 160 159 125 129 131 -1 -34 4 2 -29 -1% -21% 3% 2% -18%
Att Burglary 6 8 9 3 2 2 1 -6 -1 -4 33% 13% -67% -33% -67%
Residential 175 162 110 138 139 -13 -52 28 1 -36 -7% -32% 25% 1% -21%
Commerical 43 43 63 35 52 0 20 -28 17 9 0% 47% -44% 49% 21%
Multiple Resid 17 9 6 5 3 -8 -3 -1 -2 -14 -47% -33% -17% -40% -82%
Institutional 16 7 15 15 8 -9 8 0 -7 -8 -56% 114% 0% -47% -50%
All Others 64 61 70 23 51 -3 9 -47 28 -13 -5% 15% -67% 122% -20%
Shoplifting 54 39 56 55 61 -15 17 -1 6 7 -28% 44% -2% 11% 13%
From Vehicle 391 428 309 284 308 37 -119 -25 24 -83 9% -28% -8% 8% -21%
Bicycle 29 29 27 22 27 0 -2 -5 5 -2 0% -7% -19% 23% -7%
Other 426 412 453 369 406 -14 41 -84 37 -20 -3% 10% -19% 10% -5%
Auto 5 6 4 12 3 1 -2 8 -9 -2 20% -33% 200% -75% -40%
Truck/Bus 4 6 5 7 3 2 -1 2 -4 -1 50% -17% 40% -57% -25%
Other 3 5 14 5 8 2 9 -9 3 5 67% 180% -64% 60% 167%
Stol Local/Recov Local 12 16 11 17 12 4 -5 6 -5 0 33% -31% 55% -29% 0%
Stol Local/Recov Other 0 1 3 3 0 1 2 0 -3 0 NC 200% 0% -100% NC
Stol Other/Recov Local 16 21 17 16 22 5 -4 -1 6 6 31% -19% -6% 38% 38%
Rob
bery
Wea
pon
Loca
tions
Agg
Assa
ult
Bur
glar
y
Ent
ryP
rem
ise
Typ
e
Larc
-The
ft
Cat
egor
y
Mot
or V
ehic
le
The
ft Typ
eR
ecov
ery
Number Differences
Murder
Rape
Percentage DifferencesPart 1 Crime Details
Page 14 of 40

Uninc No IVFP Part 1 Crimes Recap
2017 2018 2019
Simple Assaults 943 826 721
Forgery & Counterfeit 165 135 150
Fraud 75 84 71
Embezzlement 4 4 6
Stolen Prop 19 25 24
Vandalism 299 352 287
Weapons 93 96 74
Prostitution/Vice 20 15 19
Sex Offenses 39 30 31
Drugs 573 736 707
Gambling 0 0 0
Offense Against Family/Child 50 59 49
DUI 126 89 74
Liquor Laws 92 39 53
Drunkness 216 176 176
Disorderly 39 31 26
Vagrancy 3 1 1
All Other 1600 1428 1550
Curfew 69 103 85
Runaways 122 159 97
Part 2 Crimes
Page 15 of 40

Isla Vista Part 1 Crimes Recap
# Diff % Diff2010 2011 2012 2013 2014 2015 2016 2017 2018 2019 10 vs 19 10 vs 19
Total Part 1 Crimes 710 657 782 716 679 535 541 422 319 224 -486 -68%
Violent Crime Total 93 104 98 95 139 79 73 47 35 34 -59 -63%
Homicide 0 2 0 0 6 0 0 0 0 0 0 NC
Rape 14 14 15 17 27 13 18 10 7 7 -7 -50%
Robbery 16 14 14 16 21 14 14 10 6 8 -8 -50%
Agg Assault 63 74 69 62 85 52 41 27 22 19 -44 -70%
Property Crime Total 617 553 684 621 540 456 468 375 284 190 -427 -69%
Burglary 305 233 282 247 227 191 194 160 128 52 -253 -83%
Theft 311 313 390 368 309 264 272 213 154 136 -175 -56%
MV Theft 0 1 0 0 1 1 0 1 0 0 0 NC
Arson 1 6 12 6 3 0 2 1 2 2 1 100%
10-Years Part 1 Crime Counts
710 657782
716 679535 541
422319
224
0
200
400
600
800
1000
2010 2011 2012 2013 2014 2015 2016 2017 2018 2019
Part 1 Total Crimes
Total Part 1 Crimes
93104 98 95
139
79 73
4735 34
0
50
100
150
2010 2011 2012 2013 2014 2015 2016 2017 2018 2019
Part 1 Total Violent Crimes
Violent Crime Total
617553
684621
540456 468
375284
190
0
200
400
600
800
2010 2011 2012 2013 2014 2015 2016 2017 2018 2019
Part 1 Total Property Crimes
Property Crime Total
Page 16 of 40

Isla Vista Part 1 Crimes Recap
2015 2016 2017 2018 2019 15-16 16-17 17-18 18-19 15-19 15-16 16-17 17-18 18-19 15-19
Total Part 1 Crimes 535 541 422 319 224 6 -119 -103 -95 -311 1% -22% -24% -30% -58%
Violent Crime Total 79 73 47 35 34 -6 -26 -12 -1 -45 -8% -36% -26% -3% -57%
Homicide 0 0 0 0 0 0 0 0 0 0 NC NC NC NC NC
Rape 13 18 10 7 7 5 -8 -3 0 -6 38% -44% -30% 0% -46%
Robbery 14 14 10 6 8 0 -4 -4 2 -6 0% -29% -40% 33% -43%
Agg Assault 52 41 27 22 19 -11 -14 -5 -3 -33 -21% -34% -19% -14% -63%
Property Crime Total 456 468 375 284 190 12 -93 -91 -94 -266 3% -20% -24% -33% -58%
Burglary 191 194 160 128 52 3 -34 -32 -76 -139 2% -18% -20% -59% -73%
Theft 264 272 213 154 136 8 -59 -59 -18 -128 3% -22% -28% -12% -48%
MV Theft 1 0 1 0 0 -1 1 -1 0 -1 -100% NC -100% NC -100%
Arson 0 2 1 2 2 2 -1 1 0 2 NC -50% 100% 0% NC
2015 2016 2017 2018 2019 2015 2016 2017 2018 2019 2015 2016 2017 2018 2019
Total Part 1 Crimes 535 541 422 319 224 105 61 37 36 23 20% 11% 9% 11% 13%
Violent Crime Total 79 73 47 35 34 47 25 18 14 17 59% 34% 38% 40% 19%
Homicide 0 0 0 0 0 0 0 0 0 0 NC NC NC NC 0%
Rape 13 18 10 7 7 7 5 5 1 2 54% 28% 50% 14% 12%
Robbery 14 14 10 6 8 6 3 4 4 4 43% 21% 40% 67% 50%
Agg Assault 52 41 27 22 19 34 17 9 9 11 65% 41% 33% 41% 19%
Property Crime Total 456 468 375 284 190 58 36 19 22 6 13% 8% 5% 8% 7%
Burglary 191 194 160 128 52 25 16 7 8 2 13% 8% 4% 6% 7%
Theft 264 272 213 154 136 33 20 12 14 4 13% 7% 6% 9% 8%
MV Theft 1 0 1 0 0 0 0 0 0 0 0% NC 0% NC 0%
Arson 0 2 1 2 2 0 0 0 0 0 NC 0% 0% 0% 0%
Number of Crimes
Number Differences Percentage DifferencesNumber of Crimes
Number of Clearances Clearance Rate
535 541
422
319
224
0
100
200
300
400
500
600
Total Part 1 Crimes
Part 1 Total Crimes
2015 2016 2017 2018 2019
Page 17 of 40

Isla Vista Part 1 Crimes Recap
0
13 14
52
0
18
14
41
0
10 10
27
0
7 6
22
0
7 8
19
0
10
20
30
40
50
60
Homicide Rape Robbery Agg Assault
Part 1 Violent Crimes
2015 2016 2017 2018 2019
191
264
1 0
194
272
0 2
160
213
1 1
128
154
0 2
52
136
0 20
50
100
150
200
250
300
Burglary Theft MV Theft Arson
Part 1 Property Crimes
2015 2016 2017 2018 2019
Page 18 of 40

Isla Vista Part 1 Crimes Recap
2015 2016 2017 2018 2019 15-16 16-17 17-18 18-19 15-19 15-16 16-17 17-18 18-19 15-19Murder 0 0 0 0 0 0 0 0 0 0 NC NC NC NC NC
Manslaughter 0 0 0 0 0 0 0 0 0 0 NC NC NC NC NC
Rapes 14 18 9 6 7 4 -9 -3 1 -7 29% -50% -33% 17% -50%
Att Rapes -1 0 1 1 0 1 1 0 -1 1 -100% NC 0% -100% -100%
Firearm 2 0 1 0 2 -2 1 -1 2 0 -100% NC -100% NC 0%
Knife 3 2 1 1 0 -1 -1 0 -1 -3 -33% -50% 0% -100% -100%
Other 3 2 0 0 3 -1 -2 0 3 0 -33% -100% NC NC 0%
Hands, Feet, Etc 6 10 8 5 3 4 -2 -3 -2 -3 67% -20% -38% -40% -50%
Highway 5 4 2 4 3 -1 -2 2 -1 -2 -20% -50% 100% -25% -40%
Business 0 0 0 0 0 0 0 0 0 0 NC NC NC NC NC
Gas Station 0 0 0 0 0 0 0 0 0 0 NC NC NC NC NC
Conevience Store 1 0 0 0 1 -1 0 0 1 0 -100% NC NC NC 0%
Residence 4 7 2 2 2 3 -5 0 0 -2 75% -71% 0% 0% -50%
Bank 0 0 0 0 0 0 0 0 0 0 NC NC NC NC NC
Misc 4 3 6 0 2 -1 3 -6 2 -2 -25% 100% -100% NC -50%
Firearm 4 1 0 1 0 -3 -1 1 -1 -4 -75% -100% NC -100% -100%
Knife 1 4 5 1 1 3 1 -4 0 0 300% 25% -80% 0% 0%
Other 14 4 5 6 3 -10 1 1 -3 -11 -71% 25% 20% -50% -79%
Hands, Feet, Etc 33 32 17 14 15 -1 -15 -3 1 -18 -3% -47% -18% 7% -55%
Forcible Entry 36 19 18 15 13 -17 -1 -3 -2 -23 -47% -5% -17% -13% -64%
Unforced Entry 149 173 141 112 37 24 -32 -29 -75 -112 16% -18% -21% -67% -75%
Att Burglary 6 2 1 1 2 -4 -1 0 1 -4 -67% -50% 0% 100% -67%
Residential 73 65 47 36 21 -8 -18 -11 -15 -52 -11% -28% -23% -42% -71%
Commerical 6 4 2 3 2 -2 -2 1 -1 -4 -33% -50% 50% -33% -67%
Multiple Resid 111 124 111 88 29 13 -13 -23 -59 -82 12% -10% -21% -67% -74%
Institutional 0 0 0 0 0 0 0 0 0 0 NC NC NC NC NC
All Others 1 1 0 1 0 0 -1 1 -1 -1 0% -100% NC -100% -100%
Shoplifting 9 10 5 9 7 1 -5 4 -2 -2 11% -50% 80% -22% -22%
From Vehicle 25 26 22 15 18 1 -4 -7 3 -7 4% -15% -32% 20% -28%
Bicycle 106 112 87 65 54 6 -25 -22 -11 -52 6% -22% -25% -17% -49%
Other 124 124 99 65 57 0 -25 -34 -8 -67 0% -20% -34% -12% -54%
Auto 1 0 1 0 0 -1 1 -1 0 -1 -100% NC -100% NC -100%
Truck/Bus 0 0 0 0 0 0 0 0 0 0 NC NC NC NC NC
Other 0 0 0 0 0 0 0 0 0 0 NC NC NC NC NC
Stol Local/Recov Local 0 0 1 0 0 0 1 -1 0 0 NC NC -100% NC NC
Stol Local/Recov Other 0 0 0 0 0 0 0 0 0 0 NC NC NC NC NC
Stol Other/Recov Local 0 0 1 0 0 0 1 -1 0 0 NC NC -100% NC NC
Percentage DifferencesPart 1 Crime Details Number Differences
Murder
Rape
Rob
bery
Wea
pon
Loca
tions
Agg
Assa
ult
Bur
glar
y
Ent
ryP
rem
ise
Typ
e
Larc
-The
ft
Cat
egor
y
Mot
or V
ehic
le
The
ft Typ
eR
ecov
ery
Page 19 of 40

Isla Vista Part 1 Crimes Recap
2017 2018 2019
Simple Assaults 139 89 108
Forgery & Counterfeit 5 11 9
Fraud 10 7 9
Embezzlement 3 0 0
Stolen Prop 5 2 4
Vandalism 91 125 90
Weapons 7 7 15
Prostitution/Vice 0 0 0
Sex Offenses 1 8 7
Drugs 46 45 37
Gambling 0 0 0
Offense Against Family/Child 0 0 1
DUI 10 5 1
Liquor Laws 1000 745 831
Drunkness 181 110 94
Disorderly 281 226 40
Vagrancy 0 2 1
All Other 218 134 396
Curfew 3 6 6
Runaways 2 1 0
Part 2 Crimes
Page 20 of 40

City of Solvang Part 1 Crimes Recap
# Diff % Diff2010 2011 2012 2013 2014 2015 2016 2017 2018 2019 10 vs 19 10 vs 19
Total Part 1 Crimes 72 76 68 78 90 92 95 93 66 78 6 8%
Violent Crime Total 8 5 5 8 9 11 13 7 8 10 2 25%
Homicide 0 0 0 1 0 0 0 0 0 0 0 NC
Rape 1 1 0 3 2 0 2 1 3 0 -1 -100%
Robbery 1 0 2 0 0 3 1 1 1 2 1 100%
Agg Assault 6 4 3 4 7 8 10 5 4 8 2 33%
Property Crime Total 64 71 63 70 81 81 82 86 58 68 4 6%
Burglary 22 23 15 21 18 29 17 21 12 18 -4 -18%
Theft 40 43 46 45 60 47 65 63 40 46 6 15%
MV Theft 2 4 2 4 3 5 0 2 6 4 2 100%
Arson 0 1 0 0 0 0 0 0 0 0 0 NC
10-Years Part 1 Crime Counts
72 7668
7890 92 95 93
6678
0
20
40
60
80
100
2010 2011 2012 2013 2014 2015 2016 2017 2018 2019
Part 1 Total Crimes
Total Part 1 Crimes
8
5 5
89
1113
78
10
0
5
10
15
2010 2011 2012 2013 2014 2015 2016 2017 2018 2019
Part 1 Total Violent Crimes
Violent Crime Total
6471
6370
81 81 82 86
5868
0
20
40
60
80
100
2010 2011 2012 2013 2014 2015 2016 2017 2018 2019
Part 1 Total Property Crimes
Property Crime Total
Page 21 of 40

City of Solvang Part 1 Crimes Recap
2015 2016 2017 2018 2019 15-16 16-17 17-18 18-19 15-19 15-16 16-17 17-18 18-19 15-19Total Part 1 Crimes 92 95 93 66 78 3 -2 -27 12 -14 3% -2% -29% 18% -15%
Violent Crime Total 11 13 7 8 10 2 -6 1 2 -1 18% -46% 14% 25% -9%
Homicide 0 0 0 0 0 0 0 0 0 0 NC NC NC NC NC
Rape 0 2 1 3 0 2 -1 2 -3 0 NC -50% 200% -100% NC
Robbery 3 1 1 1 2 -2 0 0 1 -1 -67% 0% 0% 100% -33%
Agg Assault 8 10 5 4 8 2 -5 -1 4 0 25% -50% -20% 100% 0%
Property Crime Total 81 82 86 58 68 1 4 -28 10 -13 1% 5% -33% 17% -16%
Burglary 29 17 21 12 18 -12 4 -9 6 -11 -41% 24% -43% 50% -38%
Theft 47 65 63 40 46 18 -2 -23 6 -1 38% -3% -37% 15% -2%
MV Theft 5 0 2 6 4 -5 2 4 -2 -1 -100% NC 200% -33% -20%
Arson 0 0 0 0 0 0 0 0 0 0 NC NC NC NC NC
2015 2016 2017 2018 2019 2015 2016 2017 2018 2019 2015 2016 2017 2018 2019
Total Part 1 Crimes 92 95 93 66 78 20 21 18 11 23 22% 22% 19% 17% 88%
Violent Crime Total 11 13 7 8 10 7 4 5 4 20 64% 31% 71% 50% 333%
Homicide 0 0 0 0 0 0 0 0 0 0 NC NC NC NC NC
Rape 0 2 1 3 0 0 1 0 1 0 NC 50% 0% 33% 0%
Robbery 3 1 1 1 2 1 1 1 0 0 33% 100% 100% 0% NC
Agg Assault 8 10 5 4 8 6 2 4 3 20 75% 20% 80% 75% 400%
Property Crime Total 81 82 86 58 68 13 17 13 7 3 16% 21% 15% 12% 15%
Burglary 29 17 21 12 18 3 4 2 4 1 10% 24% 10% 33% 20%
Theft 47 65 63 40 46 9 13 11 3 2 19% 20% 17% 8% 13%
MV Theft 5 0 2 6 4 1 0 0 0 0 20% NC 0% 0% NC
Arson 0 0 0 0 0 0 0 0 0 0 NC NC NC NC NC
Number of Crimes Number of Clearances Clearance Rate
Number Differences Percentage DifferencesNumber of Crimes
92 95 93
66
78
0
10
20
30
40
50
60
70
80
90
100
Total Part 1 Crimes
Part 1 Total Crimes
2015 2016 2017 2018 2019
Page 22 of 40

City of Solvang Part 1 Crimes Recap
11
13
7
8
10
0
2
4
6
8
10
12
14
Violent Crime Total
Part 1 Violent Crimes
2015 2016 2017 2018 2019
29
47
5
0
17
65
0 0
21
63
20
12
40
6
0
18
46
40
0
10
20
30
40
50
60
70
Burglary Theft MV Theft Arson
Part 1 Property Crimes
2015 2016 2017 2018 2019
Page 23 of 40

City of Solvang Part 1 Crimes Recap
2015 2016 2017 2018 2019 15-16 16-17 17-18 18-19 15-19 15-16 16-17 17-18 18-19 15-19Murder 0 0 0 0 0 0 0 0 0 0 NC NC NC NC NC
Manslaughter 0 0 0 0 0 0 0 0 0 0 NC NC NC NC NC
Rapes 0 2 1 3 0 2 -1 2 -3 0 NC -50% 200% -100% NC
Att Rapes 0 0 0 0 0 0 0 0 0 0 NC NC NC NC NC
Firearm 0 0 0 0 0 0 0 0 0 0 NC NC NC NC NC
Knife 0 0 0 0 0 0 0 0 0 0 NC NC NC NC NC
Other 0 0 0 0 0 0 0 0 0 0 NC NC NC NC NC
Hands, Feet, Etc 3 1 1 1 2 -2 0 0 1 -1 -67% 0% 0% 100% -33%
Highway 0 0 0 0 0 0 0 0 0 0 NC NC NC NC NC
Business 2 0 0 0 1 -2 0 0 1 -1 -100% NC NC NC -50%
Gas Station 0 0 0 0 0 0 0 0 0 0 NC NC NC NC NC
Conevience Store 0 0 0 0 0 0 0 0 0 0 NC NC NC NC NC
Residence 0 0 0 0 0 0 0 0 0 0 NC NC NC NC NC
Bank 0 0 0 0 1 0 0 0 1 1 NC NC NC NC NC
Misc 1 1 1 1 0 0 0 0 -1 -1 0% 0% 0% -100% -100%
Firearm 1 8 0 0 0 7 -8 0 0 -1 700% -100% NC NC -100%
Knife 1 0 1 0 0 -1 1 -1 0 -1 -100% NC -100% NC -100%
Other 0 1 1 1 3 1 0 0 2 3 NC 0% 0% 200% NC
Hands, Feet, Etc 6 1 3 3 5 -5 2 0 2 -1 -83% 200% 0% 67% -17%
Forcible Entry 13 9 7 5 8 -4 -2 -2 3 -5 -31% -22% -29% 60% -38%
Unforced Entry 16 6 14 7 10 -10 8 -7 3 -6 -63% 133% -50% 43% -38%
Att Burglary 0 2 0 0 0 2 -2 0 0 0 NC -100% NC NC NC
Residential 5 6 7 3 2 1 1 -4 -1 -3 20% 17% -57% -33% -60%
Commerical 12 8 8 8 11 -4 0 0 3 -1 -33% 0% 0% 38% -8%
Multiple Resid 7 0 0 1 1 -7 0 1 0 -6 -100% NC NC 0% -86%
Institutional 0 0 0 0 0 0 0 0 0 0 NC NC NC NC NC
All Others 5 3 6 0 4 -2 3 -6 4 -1 -40% 100% -100% NC -20%
Shoplifting 7 5 5 6 7 -2 0 1 1 0 -29% 0% 20% 17% 0%
From Vehicle 16 28 16 13 21 12 -12 -3 8 5 75% -43% -19% 62% 31%
Bicycle 2 3 5 2 1 1 2 -3 -1 -1 50% 67% -60% -50% -50%
Other 22 29 37 19 17 7 8 -18 -2 -5 32% 28% -49% -11% -23%
Auto 2 0 1 4 2 -2 1 3 -2 0 -100% NC 300% -50% 0%
Truck/Bus 3 0 1 2 1 -3 1 1 -1 -2 -100% NC 100% -50% -67%
Other 0 0 0 0 1 0 0 0 1 1 NC NC NC NC NC
Stol Local/Recov Local 4 0 1 1 2 -4 1 0 1 -2 -100% NC 0% 100% -50%
Stol Local/Recov Other 0 0 0 1 0 0 0 1 -1 0 NC NC NC -100% NC
Stol Other/Recov Local 1 1 1 0 0 0 0 -1 0 -1 0% 0% -100% NC -100%
Agg
Assa
ult
Bur
glar
y
Ent
ryP
rem
ise
Typ
e
Larc
-The
ft
Cat
egor
y
Mot
or V
ehic
le
The
ft Typ
eR
ecov
ery
Murder
Rape
Rob
bery
Wea
pon
Loca
tions
Percentage DifferencesPart 1 Crime Details Number Differences
Page 24 of 40

City of Solvang Part 1 Crimes Recap
2017 2018 2019
Simple Assaults 25 36 40
Forgery & Counterfeit 18 10 10
Fraud 5 12 1
Embezzlement 0 1 0
Stolen Prop 0 5 1
Vandalism 22 17 24
Weapons 2 0 4
Prostitution/Vice 0 0 0
Sex Offenses 4 3 5
Drugs 17 18 18
Gambling 0 0 0
Offense Against Family/Child 6 2 5
DUI 32 16 27
Liquor Laws 7 4 1
Drunkness 27 16 25
Disorderly 2 3 3
Vagrancy 0 0 0
All Other 89 46 82
Curfew 0 0 0
Runaways 0 1 0
Part 2 Crimes
Page 25 of 40
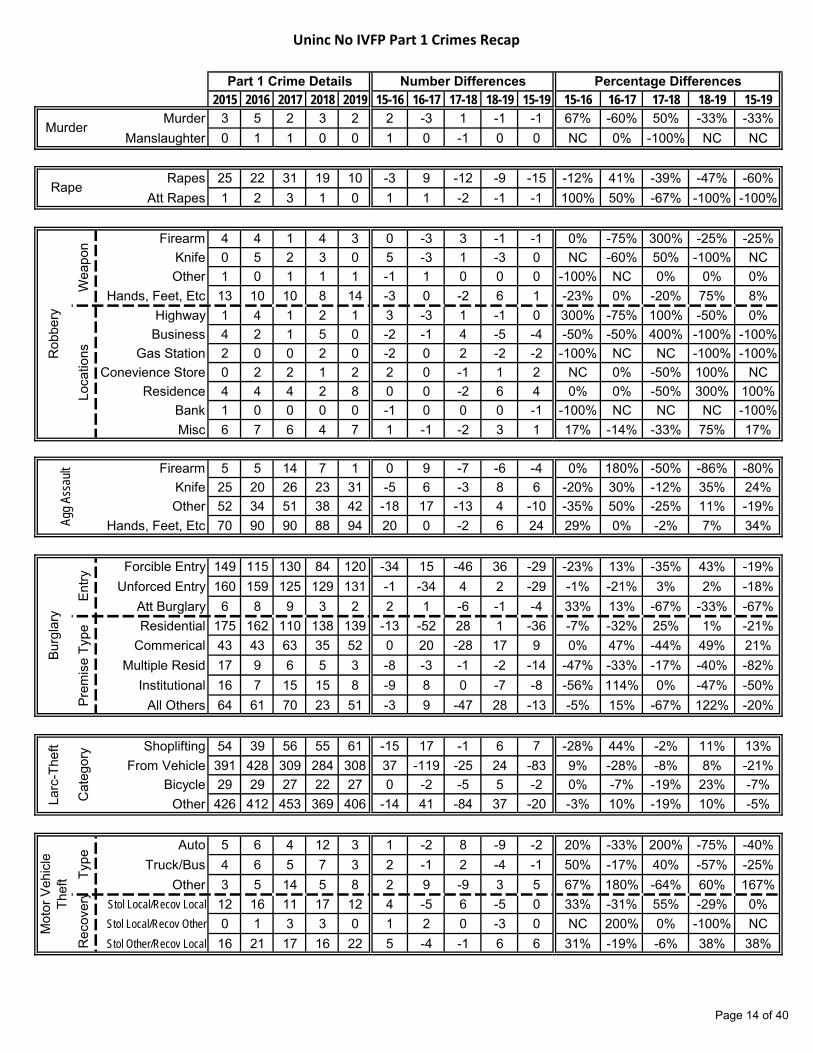
City of Carpinteria Part 1 Crimes Recap
# Diff % Diff2010 2011 2012 2013 2014 2015 2016 2017 2018 2019 10 vs 19 10 vs 19
Total Part 1 Crimes 236 229 322 282 217 223 267 317 227 166 -70 -30%
Violent Crime Total 41 24 17 21 19 13 26 33 21 11 -30 -73%
Homicide 0 0 0 0 0 0 0 0 0 1 1 NC
Rape 3 3 3 3 2 2 2 4 0 0 -3 -100%
Robbery 4 3 1 4 1 2 8 10 2 3 -1 -25%
Agg Assault 34 18 13 14 16 9 16 19 19 7 -27 -79%
Property Crime Total 195 205 305 261 198 210 241 284 206 155 -40 -21%
Burglary 29 43 51 50 49 43 49 58 35 19 -10 -34%
Theft 158 149 228 191 140 150 178 196 146 116 -42 -27%
MV Theft 8 12 26 20 8 14 14 29 25 20 12 150%
Arson 0 1 0 0 1 3 0 1 0 0 0 NC
10-Years Part 1 Crime Counts
236 229
322282
217 223267
317
227166
0
100
200
300
400
2010 2011 2012 2013 2014 2015 2016 2017 2018 2019
Part 1 Total Crimes
Total Part 1 Crimes
41
2417
21 1913
2633
21
11
0
10
20
30
40
50
2010 2011 2012 2013 2014 2015 2016 2017 2018 2019
Part 1 Total Violent Crimes
Violent Crime Total
195 205
305261
198 210241
284
206155
0
100
200
300
400
2010 2011 2012 2013 2014 2015 2016 2017 2018 2019
Part 1 Total Property Crimes
Property Crime Total
Page 26 of 40

City of Carpinteria Part 1 Crimes Recap
2015 2016 2017 2018 2019 15-16 16-17 17-18 18-19 15-19 15-16 16-17 17-18 18-19 15-19Total Part 1 Crimes 223 267 317 227 166 44 50 -90 -61 -57 20% 19% -28% -27% -26%
Violent Crime Total 13 26 33 21 11 13 7 -12 -10 -2 100% 27% -36% -48% -15%
Homicide 0 0 0 0 1 0 0 0 1 1 NC NC NC NC NC
Rape 2 2 4 0 0 0 2 -4 0 -2 0% 100% -100% NC -100%
Robbery 2 8 10 2 3 6 2 -8 1 1 300% 25% -80% 50% 50%
Agg Assault 9 16 19 19 7 7 3 0 -12 -2 78% 19% 0% -63% -22%
Property Crime Total 210 241 284 206 155 31 43 -78 -51 -55 15% 18% -27% -25% -26%
Burglary 43 49 58 35 19 6 9 -23 -16 -24 14% 18% -40% -46% -56%
Theft 150 178 196 146 116 28 18 -50 -30 -34 19% 10% -26% -21% -23%
MV Theft 14 14 29 25 20 0 15 -4 -5 6 0% 107% -14% -20% 43%
Arson 3 0 1 0 0 -3 1 -1 0 -3 -100% NC -100% NC -100%
2015 2016 2017 2018 2019 2015 2016 2017 2018 2019 2015 2016 2017 2018 2019
Total Part 1 Crimes 223 267 317 227 166 45 52 51 36 31 20% 19% 16% 16% 19%
Violent Crime Total 13 26 33 21 11 9 24 19 14 11 69% 92% 58% 67% 100%
Homicide 0 0 0 0 1 0 0 0 0 1 NC NC NC NC 100%
Rape 2 2 4 0 0 2 1 1 0 0 100% 50% 25% NC NC
Robbery 2 8 10 2 3 2 8 5 1 3 100% 100% 50% 50% 100%
Agg Assault 9 16 19 19 7 5 15 13 13 7 56% 94% 68% 68% 100%
Property Crime Total 210 241 284 206 155 36 28 32 22 20 17% 12% 11% 11% 13%
Burglary 43 49 58 35 19 5 3 11 3 5 12% 6% 19% 9% 26%
Theft 150 178 196 146 116 29 23 20 16 15 19% 13% 10% 11% 13%
MV Theft 14 14 29 25 20 1 2 0 3 0 7% 14% 0% 12% 0%
Arson 3 0 1 0 0 1 0 1 0 0 33% NC 100% NC NC
Number of Crimes
Number of Crimes
Percentage Differences
Clearance RateNumber of Clearances
Number Differences
223
267
317
166
227
0
50
100
150
200
250
300
350
Total Part 1 Crimes
Part 1 Total Crimes
2015 2016 2017 2018 2019
Page 27 of 40

City of Carpinteria Part 1 Crimes Recap
0
2 2
9
0
2
8
16
0
4
10
19
10
3
7
0 0
2
19
0
2
4
6
8
10
12
14
16
18
20
Homicide Rape Robbery Agg Assault
Part 1 Violent Crimes
2015 2016 2017 2018 2019
43
150
143
49
178
14
0
58
196
29
1
19
116
20
0
35
146
25
00
50
100
150
200
250
Burglary Theft MV Theft Arson
Part 1 Property Crimes
2015 2016 2017 2018 2019
Page 28 of 40

City of Carpinteria Part 1 Crimes Recap
2015 2016 2017 2018 2019 15-16 16-17 17-18 18-19 15-19 15-16 16-17 17-18 18-19 15-19Murder 0 0 0 0 1 0 0 0 1 1 NC NC NC NC NC
Manslaughter 0 0 0 0 0 0 0 0 0 0 NC NC NC NC NC
Rapes 2 2 4 0 0 0 2 -4 0 -2 0% 100% -100% NC -100%
Att Rapes 0 0 0 0 0 0 0 0 0 0 NC NC NC NC NC
Firearm 1 1 2 2 2 0 1 0 0 1 0% 100% 0% 0% 100%
Knife 0 2 0 0 0 2 -2 0 0 0 NC -100% NC NC NC
Other 0 1 0 0 0 1 -1 0 0 0 NC -100% NC NC NC
Hands, Feet, Etc 1 4 8 0 1 3 4 -8 1 0 300% 100% -100% NC 0%
Highway 0 1 1 0 0 1 0 -1 0 0 NC 0% -100% NC NC
Business 0 1 0 1 0 1 -1 1 -1 0 NC -100% NC -100% NC
Gas Station 0 0 0 0 0 0 0 0 0 0 NC NC NC NC NC
Conevience Store 1 0 1 1 2 -1 1 0 1 1 -100% NC 0% 100% 100%
Residence 0 3 1 0 1 3 -2 -1 1 1 NC -67% -100% NC NC
Bank 1 0 2 0 0 -1 2 -2 0 -1 -100% NC -100% NC -100%
Misc 0 3 5 0 0 3 2 -5 0 0 NC 67% -100% NC NC
Firearm 0 0 0 0 0 0 0 0 0 0 NC NC NC NC NC
Knife 5 4 5 3 1 -1 1 -2 -2 -4 -20% 25% -40% -67% -80%
Other 2 5 9 7 4 3 4 -2 -3 2 150% 80% -22% -43% 100%
Hands, Feet, Etc 2 7 5 9 2 5 -2 4 -7 0 250% -29% 80% -78% 0%
Forcible Entry 21 19 27 12 8 -2 8 -15 -4 -13 -10% 42% -56% -33% -62%
Unforced Entry 22 30 28 22 11 8 -2 -6 -11 -11 36% -7% -21% -50% -50%
Att Burglary 0 0 3 1 0 0 3 -2 -1 0 NC NC -67% -100% NC
Residential 16 21 25 11 7 5 4 -14 -4 -9 31% 19% -56% -36% -56%
Commerical 13 16 16 10 4 3 0 -6 -6 -9 23% 0% -38% -60% -69%
Multiple Resid 3 5 4 8 2 2 -1 4 -6 -1 67% -20% 100% -75% -33%
Institutional 3 1 5 0 1 -2 4 -5 1 -2 -67% 400% -100% NC -67%
All Others 8 6 8 6 5 -2 2 -2 -1 -3 -25% 33% -25% -17% -38%
Shoplifting 14 14 19 16 12 0 5 -3 -4 -2 0% 36% -16% -25% -14%
From Vehicle 64 77 74 48 42 13 -3 -26 -6 -22 20% -4% -35% -13% -34%
Bicycle 15 20 29 26 14 5 9 -3 -12 -1 33% 45% -10% -46% -7%
Other 57 67 74 56 48 10 7 -18 -8 -9 18% 10% -24% -14% -16%
Auto 4 9 14 14 10 5 5 0 -4 6 125% 56% 0% -29% 150%
Truck/Bus 5 5 12 9 6 0 7 -3 -3 1 0% 140% -25% -33% 20%
Other 5 0 3 2 4 -5 3 -1 2 -1 -100% NC -33% 100% -20%
Stol Local/Recov Local 4 8 6 5 8 4 -2 -1 3 4 100% -25% -17% 60% 100%
Stol Local/Recov Other 1 5 14 4 0 4 9 -10 -4 -1 400% 180% -71% -100% -100%
Stol Other/Recov Local 10 14 6 4 4 4 -8 -2 0 -6 40% -57% -33% 0% -60%
Agg
Assa
ult
Bur
glar
y
Ent
ryP
rem
ise
Typ
e
Larc
-The
ft
Cat
egor
y
Mot
or V
ehic
le
The
ft Typ
eR
ecov
ery
Murder
Rape
Rob
bery
Wea
pon
Loca
tions
Number Differences Percentage DifferencesPart 1 Crime Details
Page 29 of 40

City of Carpinteria Part 1 Crimes Recap
2017 2018 2019
Simple Assaults 70 80 64
Forgery & Counterfeit 36 20 27
Fraud 13 9 17
Embezzlement 0 8 1
Stolen Prop 2 11 2
Vandalism 75 48 71
Weapons 6 12 21
Prostitution/Vice 0 0 0
Sex Offenses 6 5 0
Drugs 81 95 105
Gambling 0 0 0
Offense Against Family/Child 5 10 11
DUI 20 21 20
Liquor Laws 14 12 12
Drunkness 71 64 65
Disorderly 2 7 8
Vagrancy 0 1 1
All Other 364 344 330
Curfew 2 2 4
Runaways 3 23 27
Part 2 Crimes
Page 30 of 40

City of Buellton Part 1 Crimes Recap
# Diff % Diff2010 2011 2012 2013 2014 2015 2016 2017 2018 2019 10 vs 19 10 vs 19
Total Part 1 Crimes 92 83 96 69 75 58 86 82 57 57 -35 -38%
Violent Crime Total 11 8 3 7 6 4 5 6 3 3 -8 -73%
Homicide 1 0 0 0 0 0 0 0 0 0 -1 -100%
Rape 0 2 1 3 0 1 0 0 0 0 0 NC
Robbery 1 1 0 1 1 1 3 2 0 0 -1 -100%
Agg Assault 9 5 2 3 5 2 2 4 3 3 -6 -67%
Property Crime Total 81 75 93 62 69 54 81 76 54 54 -27 -33%
Burglary 15 18 28 15 11 15 13 14 4 15 0 0%
Theft 63 52 56 46 53 39 64 55 44 31 -32 -51%
MV Theft 3 5 9 1 5 0 4 7 6 8 5 167%
Arson 0 0 0 0 0 0 0 0 0 0 0 NC
10-Years Part 1 Crime Counts
92 8396
69 7558
86 82
57 57
0
50
100
150
2010 2011 2012 2013 2014 2015 2016 2017 2018 2019
Part 1 Total Crimes
Total Part 1 Crimes
11
8
3
76
45
6
3 3
0
5
10
15
2010 2011 2012 2013 2014 2015 2016 2017 2018 2019
Part 1 Total Violent Crimes
Violent Crime Total
81 75
93
6269
54
81 76
54 54
0
20
40
60
80
100
2010 2011 2012 2013 2014 2015 2016 2017 2018 2019
Part 1 Total Property Crimes
Property Crime Total
Page 31 of 40

City of Buellton Part 1 Crimes Recap
2015 2016 2017 2018 2019 15-16 16-17 17-18 18-19 15-19 15-16 16-17 17-18 18-19 15-19Total Part 1 Crimes 58 86 82 57 57 28 -4 -25 0 -1 48% -5% -30% 0% -2%
Violent Crime Total 4 5 6 3 3 1 1 -3 0 -1 25% 20% -50% 0% -25%
Homicide 0 0 0 0 0 0 0 0 0 0 NC NC NC NC NC
Rape 1 0 0 0 0 -1 0 0 0 -1 -100% NC NC NC -100%
Robbery 1 3 2 0 0 2 -1 -2 -2 -1 200% -33% -100% NC -100%
Agg Assault 2 2 4 3 3 0 2 -1 -1 1 0% 100% -25% 0% 50%
Property Crime Total 54 81 76 54 54 27 -5 -22 0 0 50% -6% -29% 0% 0%
Burglary 15 13 14 4 15 -2 1 -10 -10 0 -13% 8% -71% 275% 0%
Theft 39 64 55 44 31 25 -9 -11 -11 -8 64% -14% -20% -30% -21%
MV Theft 0 4 7 6 8 4 3 -1 -1 8 NC 75% -14% 33% NC
Arson 0 0 0 0 0 0 0 0 0 0 NC NC NC NC NC
2015 2016 2017 2018 2019 2015 2016 2017 2018 2019 2015 2016 2017 2018 2019
Total Part 1 Crimes 58 86 82 57 57 18 8 11 9 4 31% 9% 13% 16% 33%
Violent Crime Total 4 5 6 3 3 5 0 4 1 1 125% 0% 67% 33% 25%
Homicide 0 0 0 0 0 0 0 0 0 0 NC NC NC NC NC
Rape 1 0 0 0 0 3 0 0 0 0 300% NC NC NC NC
Robbery 1 3 2 0 0 0 0 1 0 0 0% 0% 50% NC NC
Agg Assault 2 2 4 3 3 2 0 3 1 1 100% 0% 75% 33% 25%
Property Crime Total 54 81 76 54 54 13 8 7 8 3 24% 10% 9% 15% 38%
Burglary 15 13 14 4 15 7 1 3 2 1 47% 8% 21% 50% 33%
Theft 39 64 55 44 31 6 7 3 6 1 15% 11% 5% 14% 33%
MV Theft 0 4 7 6 8 0 0 1 0 1 NC 0% 14% 0% 50%
Arson 0 0 0 0 0 0 0 0 0 0 NC NC NC NC NC
Number of Crimes Number of Clearances Clearance Rate
Number Differences Percentage DifferencesNumber of Crimes
58
8682
57 57
0
10
20
30
40
50
60
70
80
90
100
Total Part 1 Crimes
Part 1 Total Crimes
2015 2016 2017 2018 2019
Page 32 of 40

City of Buellton Part 1 Crimes Recap
0
1 1
2
0 0
3
2
0 0
2
4
0 0 0
3
0 0 0
3
0
0.5
1
1.5
2
2.5
3
3.5
4
4.5
Homicide Rape Robbery Agg Assault
Part 1 Violent Crimes
2015 2016 2017 2018 2019
15
39
0 0
13
64
40
14
55
7
04
44
6
0
15
31
8
00
10
20
30
40
50
60
70
Burglary Theft MV Theft Arson
Part 1 Property Crimes
2015 2016 2017 2018 2019
Page 33 of 40

City of Buellton Part 1 Crimes Recap
2015 2016 2017 2018 2019 15-16 16-17 17-18 18-19 15-19 15-16 16-17 17-18 18-19 15-19Murder 0 0 0 0 0 0 0 0 0 0 NC NC NC NC NC
Manslaughter 0 0 0 0 0 0 0 0 0 0 NC NC NC NC NC
Rapes 1 0 0 0 0 -1 0 0 0 -1 -100% NC NC NC -100%
Att Rapes 0 0 0 0 0 0 0 0 0 0 NC NC NC NC NC
Firearm 0 0 0 0 0 0 0 0 0 0 NC NC NC NC NC
Knife 0 0 0 0 0 0 0 0 0 0 NC NC NC NC NC
Other 0 0 0 0 0 0 0 0 0 0 NC NC NC NC NC
Hands, Feet, Etc 1 3 2 0 0 2 -1 -2 0 -1 200% -33% -100% NC -100%
Highway 0 0 0 0 0 0 0 0 0 0 NC NC NC NC NC
Business 0 0 0 0 0 0 0 0 0 0 NC NC NC NC NC
Gas Station 0 0 1 0 0 0 1 -1 0 0 NC NC -100% NC NC
Conevience Store 0 0 0 0 0 0 0 0 0 0 NC NC NC NC NC
Residence 1 0 0 0 0 -1 0 0 0 -1 -100% NC NC NC -100%
Bank 0 1 0 0 0 1 -1 0 0 0 NC -100% NC NC NC
Misc 0 2 1 0 0 2 -1 -1 0 0 NC -50% -100% NC NC
Firearm 0 0 0 0 0 0 0 0 0 0 NC NC NC NC NC
Knife 1 0 0 1 1 -1 0 1 0 0 -100% NC NC 0% 0%
Other 1 2 4 0 1 1 2 -4 1 0 100% 100% -100% NC 0%
Hands, Feet, Etc 0 0 0 2 1 0 0 2 -1 1 NC NC NC -50% NC
Forcible Entry 3 9 8 1 13 6 -1 -7 12 10 200% -11% -88% 1200% 333%
Unforced Entry 12 4 6 3 2 -8 2 -3 -1 -10 -67% 50% -50% -33% -83%
Att Burglary 0 0 0 0 0 0 0 0 0 0 NC NC NC NC NC
Residential 6 1 2 1 3 -5 1 -1 2 -3 -83% 100% -50% 200% -50%
Commerical 5 8 7 3 12 3 -1 -4 9 7 60% -13% -57% 300% 140%
Multiple Resid 2 1 0 0 0 -1 -1 0 0 -2 -50% -100% NC NC -100%
Institutional 0 0 0 0 0 0 0 0 0 0 NC NC NC NC NC
All Others 2 3 5 0 0 1 2 -5 0 -2 50% 67% -100% NC -100%
Shoplifting 7 5 9 4 0 -2 4 -5 -4 -7 -29% 80% -56% -100% -100%
From Vehicle 14 30 14 23 13 16 -16 9 -10 -1 114% -53% 64% -43% -7%
Bicycle 2 7 8 1 2 5 1 -7 1 0 250% 14% -88% 100% 0%
Other 16 22 24 16 16 6 2 -8 0 0 38% 9% -33% 0% 0%
Auto 0 1 1 0 2 1 0 -1 2 2 NC 0% -100% NC NC
Truck/Bus 0 1 6 5 2 1 5 -1 -3 2 NC 500% -17% -60% NC
Other 0 2 0 1 4 2 -2 1 3 4 NC -100% NC 300% NC
Stol Local/Recov Local 0 0 0 1 3 0 0 1 2 3 NC NC NC 200% NC
Stol Local/Recov Other 0 3 2 0 1 3 -1 -2 1 1 NC -33% -100% NC NC
Stol Other/Recov Local 1 5 3 4 4 4 -2 1 0 3 400% -40% 33% 0% 300%
Agg
Assa
ult
Bur
glar
y
Ent
ryP
rem
ise
Typ
e
Larc
-The
ft
Cat
egor
y
Mot
or V
ehic
le
The
ft Typ
eR
ecov
ery
Murder
Rape
Rob
bery
Wea
pon
Loca
tions
Number Differences Percentage DifferencesPart 1 Crime Details
Page 34 of 40

City of Buellton Part 1 Crimes Recap
2017 2018 2019
Simple Assaults 31 29 25
Forgery & Counterfeit 11 16 7
Fraud 3 10 3
Embezzlement 0 1 0
Stolen Prop 3 0 1
Vandalism 10 10 14
Weapons 5 6 3
Prostitution/Vice 1 0 0
Sex Offenses 3 2 1
Drugs 18 17 29
Gambling 0 0 0
Offense Against Family/Child 4 6 4
DUI 39 12 20
Liquor Laws 4 0 2
Drunkness 24 19 10
Disorderly 8 7 1
Vagrancy 0 0 0
All Other 61 52 136
Curfew 1 0 0
Runaways 0 0 0
Part 2 Crimes
Page 35 of 40

City of Goleta Part 1 Crimes Recap
# Diff % Diff2010 2011 2012 2013 2014 2015 2016 2017 2018 2019 10 vs 19 10 vs 19
Total Part 1 Crimes 479 431 573 497 460 505 535 511 476 550 71 15%
Violent Crime Total 57 39 50 42 36 47 38 52 53 40 -17 -30%
Homicide 0 0 0 0 0 0 0 1 0 0 0 NC
Rape 5 4 4 6 3 12 8 4 8 2 -3 -60%
Robbery 11 7 8 9 1 12 8 18 11 6 -5 -45%
Agg Assault 41 28 38 27 32 23 22 29 34 32 -9 -22%
Property Crime Total 422 392 523 455 424 458 497 459 423 510 88 21%
Burglary 124 103 129 138 121 99 89 101 78 115 -9 -7%
Theft 286 271 368 303 283 323 378 323 303 355 69 24%
MV Theft 11 17 26 13 18 34 29 32 42 40 29 264%
Arson 1 1 0 1 2 2 1 3 0 0 -1 -100%
10-Years Part 1 Crime Counts
479 431
573497 460 505 535 511 476
550
0
200
400
600
800
2010 2011 2012 2013 2014 2015 2016 2017 2018 2019
Part 1 Total Crimes
Total Part 1 Crimes
57
39
5042
36
4738
52 53
40
0
20
40
60
2010 2011 2012 2013 2014 2015 2016 2017 2018 2019
Part 1 Total Violent Crimes
Violent Crime Total
422 392
523455 424 458
497 459 423510
0
200
400
600
2010 2011 2012 2013 2014 2015 2016 2017 2018 2019
Part 1 Total Property Crimes
Property Crime Total
Page 36 of 40

City of Goleta Part 1 Crimes Recap
2015 2016 2017 2018 2019 15-16 16-17 17-18 18-19 15-19 15-16 16-17 17-18 18-19 15-19
Total Part 1 Crimes 505 535 511 476 550 30 -24 -35 74 45 6% -4% -7% 16% 9%
Violent Crime Total 47 38 52 53 40 -9 14 1 -13 -7 -19% 37% 2% -25% -15%
Homicide 0 0 1 0 0 0 1 -1 0 0 NC NC -100% NC NC
Rape 12 8 4 8 2 -4 -4 4 -6 -10 -33% -50% 100% -75% -83%
Robbery 12 8 18 11 6 -4 10 -7 -5 -6 -33% 125% -39% -45% -50%
Agg Assault 23 22 29 34 32 -1 7 5 -2 9 -4% 32% 17% -6% 39%
Property Crime Total 458 497 459 423 510 39 -38 -36 87 52 9% -8% -8% 21% 11%
Burglary 99 89 101 78 115 -10 12 -23 37 16 -10% 13% -23% 47% 16%
Theft 323 378 323 303 355 55 -55 -20 52 32 17% -15% -6% 17% 10%
MV Theft 34 29 32 42 40 -5 3 10 -2 6 -15% 10% 31% -5% 18%
Arson 2 1 3 0 0 -1 2 -3 0 -2 -50% 200% -100% NC -100%
2015 2016 2017 2018 2019 2015 2016 2017 2018 2019 2015 2016 2017 2018 2019
Total Part 1 Crimes 505 535 511 476 550 140 125 104 115 0 28% 23% 20% 24% 0%
Violent Crime Total 47 38 52 53 40 32 28 32 35 21 68% 74% 62% 66% 78%
Homicide 0 0 1 0 0 0 0 1 0 0 NC NC 100% NC NC
Rape 12 8 4 8 2 4 6 2 3 1 33% 75% 50% 38% 25%
Robbery 12 8 18 11 6 5 5 10 6 2 42% 63% 56% 55% NC
Agg Assault 23 22 29 34 32 23 17 19 26 18 100% 77% 66% 76% 78%
Property Crime Total 458 497 459 423 510 108 97 72 80 75 24% 20% 16% 19% 74%
Burglary 99 89 101 78 115 19 13 13 24 18 19% 15% 13% 31% 42%
Theft 323 378 323 303 355 80 81 49 49 52 25% 21% 15% 16% 95%
MV Theft 34 29 32 42 40 8 3 8 7 5 24% 10% 25% 17% 125%
Arson 2 1 3 0 0 1 0 2 0 0 50% 0% 67% NC NC
Number of Crimes Number of Clearances Clearance Rate
Number Differences Percentage DifferencesNumber of Crimes
505
535
511
476
550
420
440
460
480
500
520
540
560
Total Part 1 Crimes
Part 1 Total Crimes
2015 2016 2017 2018 2019
Page 37 of 40

City of Goleta Part 1 Crimes Recap
0
12 12
23
0
8 8
22
1
4
18
29
0
8
11
34
02
6
32
0
5
10
15
20
25
30
35
40
Homicide Rape Robbery Agg Assault
Part 1 Violent Crimes
2015 2016 2017 2018 2019
99
323
34
2
89
378
29
1
101
323
32
3
78
303
42
0
115
355
40
00
50
100
150
200
250
300
350
400
Burglary Theft MV Theft Arson
Part 1 Property Crimes
2015 2016 2017 2018 2019
Page 38 of 40

City of Goleta Part 1 Crimes Recap
2015 2016 2017 2018 2019 15-16 16-17 17-18 18-19 15-19 15-16 16-17 17-18 18-19 15-19Murder 0 0 1 0 0 0 1 -1 0 0 NC NC -100% NC NC
Manslaughter 0 0 0 0 0 0 0 0 0 0 NC NC NC NC NC
Rapes 11 8 3 8 2 -3 -5 5 -6 -9 -27% -63% 167% -75% -82%
Att Rapes 1 0 1 0 0 -1 1 -1 0 -1 -100% NC -100% NC -100%
Firearm 4 1 5 2 0 -3 4 -3 -2 -4 -75% 400% -60% -100% -100%
Knife 0 0 2 1 0 0 2 -1 -1 0 NC NC -50% -100% NC
Other 0 0 1 3 1 0 1 2 -2 1 NC NC 200% -67% NC
Hands, Feet, Etc 8 7 10 5 5 -1 3 -5 0 -3 -13% 43% -50% 0% -38%
Highway 1 0 2 0 0 -1 2 -2 0 -1 -100% NC -100% NC -100%
Business 1 3 2 4 3 2 -1 2 -1 2 200% -33% 100% -25% 200%
Gas Station 0 0 0 0 1 0 0 0 1 1 NC NC NC NC NC
Conevience Store 2 1 5 3 0 -1 4 -2 -3 -2 -50% 400% -40% -100% -100%
Residence 1 2 2 1 0 1 0 -1 -1 -1 100% 0% -50% -100% -100%
Bank 1 0 1 1 0 -1 1 0 -1 -1 -100% NC 0% -100% -100%
Misc 6 2 6 2 2 -4 4 -4 0 -4 -67% 200% -67% 0% -67%
Firearm 1 1 0 2 1 0 -1 2 -1 0 0% -100% NC -50% 0%
Knife 3 5 6 8 3 2 1 2 -5 0 67% 20% 33% -63% 0%
Other 11 9 13 12 6 -2 4 -1 -6 -5 -18% 44% -8% -50% -45%
Hands, Feet, Etc 8 7 10 12 22 -1 3 2 10 14 -13% 43% 20% 83% 175%
Forcible Entry 46 40 47 29 62 -6 7 -18 33 16 -13% 18% -38% 114% 35%
Unforced Entry 53 46 53 48 53 -7 7 -5 5 0 -13% 15% -9% 10% 0%
Att Burglary 0 3 1 1 0 3 -2 0 -1 0 NC -67% 0% -100% NC
Residential 23 22 26 14 23 -1 4 -12 9 0 -4% 18% -46% 64% 0%
Commerical 33 34 49 49 59 1 15 0 10 26 3% 44% 0% 20% 79%
Multiple Resid 7 7 8 6 14 0 1 -2 8 7 0% 14% -25% 133% 100%
Institutional 1 4 3 0 2 3 -1 -3 2 1 300% -25% -100% NC 100%
All Others 35 22 15 9 17 -13 -7 -6 8 -18 -37% -32% -40% 89% -51%
Shoplifting 69 58 58 44 89 -11 0 -14 45 20 -16% 0% -24% 102% 29%
From Vehicle 101 124 96 81 109 23 -28 -15 28 8 23% -23% -16% 35% 8%
Bicycle 24 18 28 29 28 -6 10 1 -1 4 -25% 56% 4% -3% 17%
Other 129 178 141 149 129 49 -37 8 -20 0 38% -21% 6% -13% 0%
Auto 15 12 17 22 24 -3 5 5 2 9 -20% 42% 29% 9% 60%
Truck/Bus 9 10 12 18 10 1 2 6 -8 1 11% 20% 50% -44% 11%
Other 10 7 3 2 6 -3 -4 -1 4 -4 -30% -57% -33% 200% -40%
Stol Local/Recov Local 10 11 17 18 21 1 6 1 3 11 10% 55% 6% 17% 110%
Stol Local/Recov Other 8 3 7 7 10 -5 4 0 3 2 -63% 133% 0% 43% 25%
Stol Other/Recov Local 10 7 10 17 14 -3 3 7 -3 4 -30% 43% 70% -18% 40%
Agg
Assa
ult
Bur
glar
y
Ent
ryP
rem
ise
Typ
e
Larc
-The
ft
Cat
egor
y
Mot
or V
ehic
le
The
ft Typ
eR
ecov
ery
Murder
Rape
Rob
bery
Wea
pon
Loca
tions
Number Differences Percentage DifferencesPart 1 Crime Details
Page 39 of 40

City of Goleta Part 1 Crimes Recap
2017 2018 2019
Simple Assaults 161 188 148
Forgery & Counterfeit 50 64 55
Fraud 32 51 24
Embezzlement 7 7 1
Stolen Prop 3 11 10
Vandalism 116 102 123
Weapons 21 31 23
Prostitution/Vice 15 17 8
Sex Offenses 5 8 12
Drugs 118 153 143
Gambling 0 0 0
Offense Against Family/Child 16 14 14
DUI 70 61 80
Liquor Laws 29 18 29
Drunkness 140 106 93
Disorderly 14 13 5
Vagrancy 3 2 0
All Other 466 457 430
Curfew 15 4 2
Runaways 14 14 10
Part 2 Crimes
Page 40 of 40
Recommended
![REPELLENT CRIMES AND RATIONAL …...2012/02/15 · 2009] Repellent Crimes and Rational Deliberation 491 crimes evoke. My focus is, in part, on the emotional dynamics that contribute](https://img.pdfslide.net/doc/110x75/5e96cd79aa42d9649223c375/repellent-crimes-and-rational-20120215-2009-repellent-crimes-and-rational.jpg)