Clemson UniversityTigerPrints
All Dissertations Dissertations
8-2016
Particle Transport Phenomena in Non-NewtonianMicrofluidicsXinyu LuClemson University
Follow this and additional works at: https://tigerprints.clemson.edu/all_dissertations
This Dissertation is brought to you for free and open access by the Dissertations at TigerPrints. It has been accepted for inclusion in All Dissertations byan authorized administrator of TigerPrints. For more information, please contact [email protected].
Recommended CitationLu, Xinyu, "Particle Transport Phenomena in Non-Newtonian Microfluidics" (2016). All Dissertations. 1716.https://tigerprints.clemson.edu/all_dissertations/1716
PARTICLE TRANSPORT PHENOMENA IN NON-NEWTONIAN MICROFLUIDICS
A Dissertation
Presented to
the Graduate School of
Clemson University
In Partial Fulfillment
of the Requirements for the Degree
Doctor of Philosophy
Mechanical Engineering
by
Xinyu Lu
August 2016
Accepted by:
Dr. Xiangchun Xuan, Committee Chair
Dr. Donald Beasley
Dr. Richard Figliola
Dr. Chenning Tong
ii
ABSTRACT
In the past two decades, microfluidic devices have become attractive platforms for
many chemical and biomedical applications due to their enhanced efficiency and
accuracy at a reduced cost. Many of the fluids encountered in these applications exhibit
non-Newtonian behaviors. However, the majority of current particle transport studies
have been limited in Newtonian fluids only. Very little work has been done on particle
transport in non-Newtonian fluids. This dissertation presents experimental and numerical
studies of particle transport phenomena in both electric field- and pressure-driven flows
in non-Newtonian fluids through microchannels.
In the first part, electrokinetic transport phenomena are investigated in
viscoelastic polymer solutions though a constricted microchannel. The first experimental
study of particle electrophoresis shows an oscillatory particle motion in the constriction
region. This oscillatory motion is affected by the electric field magnitude, particle size
and fluid elasticity (i.e., polymer concentration). Then the viscoelastic effect on
electrokinetic particle focusing is presented via the study of particle charge effect. The
particle focusing trend observed is opposite to that in a Newtonian fluid when the electric
field varies. Particle aggregation phenomena are also found at high electric fields. These
phenomena are speculated to be a consequence of the fluid viscoelasticity effects.
Inspired by the interesting electrokinetic particle transport phenomena, the flow
visualization study in the viscoelastic fluid is conducted by using small fluorescent
particles as trackers. It is showed that the small particle trajectories, which represent the
electroosmotic flow streamlines, are significantly different from those in the Newtonian
iii
fluid at the upstream of the microchannel constriction due to the viscoelastic instability.
The 2D numerical result of Oldroyd-B model obtains a smaller flow rate than the
Newtonian one, but fails to predict the deflected particle trajectories via Lagrangian
particle tracking method.
In the second part, comprehensive studies are performed for particle transport in
pressure driven flows through straight rectangular microchannels. A continuous size-
based separation is achieved via elasto-inertial pinched flow fractionation (eiPFF). The
separation is found to be affected by the flow rate, polymer concentration and channel
aspect ratio significantly. Then elasto-inertial particle focusing is studied, which also
demonstrates a sheath-free particle separation. An interesting trend has been observed
that the particle size (blockage ratio) plays a less significant role on the particle
equilibrium position with the increase of channel aspect ratio. Shear-thinning effect is
studied in Polyvinylpyrrolidone (PAA) solutions of varied glycerol concentrations in a
near-slit channel, which has been demonstrated to inhibit the elastic lift and deflect
particles towards the walls. The 2D numerical studies of the particle motion via Oldroyd-
B and Giesekus models are qualitatively consistent with our experimental observations of
the viscoelastic and shear thinning effects on the elasto-inertial particle focusing.
Moreover, shape-based particle separations are demonstrated via both eiPFF and the
elasto-inertial lift in sheath-free flows. The rotational motion of non-spherical particles in
the viscoelastic fluid is speculated to affect the elasto-inertial lift and lead to different
migrations of particles with varied shapes.

iv
DEDICATION
To my best friend and loving wife Wei

v
ACKNOWLEDGMENTS
First, I would like to thank my advisor Dr. Xiangchun Xuan for investing in my
professional growth and providing me with incredible teaching and research opportunities
throughout my time at Clemson. I would like to express my sincere gratitude to him for
his broad foresight, patient guidance, and unwavering support on my research which
paved the way for my academic career.
I would also like to thank my committee members, Dr. Donald Beasley, Dr.
Richard Figliola, and Dr. Chenning Tong for giving up their precious time to be a part of
my committee. I am gracious for the constant support and constructive advice I have
received on their behalf during my graduate studies.
I would like to thank Dr. Shizhi Qian, Dr. Benjamin Mauroy, and Dr. Sang W.
Joo for their instruction and advice on the numerical simulation work of this dissertation.
I would like to thank my colleagues Saurin Patel, Akshay Kale, John DuBose, Jian Zeng,
Junjie Zhu, Yilong Zhou and Di Li for being supportive during the past years. I would
like to thank my friends in Clemson for creating a cheerful atmosphere which made my
years at the graduate school enjoyable. I would like to thank my father and mother for
their love and support throughout my entire life. I am forever indebted to them and much
of this work is a reflection of the values they installed in me. Finally, I would like to
thank my wife, Wei Xiong, for her patience and support while I pursued my education. I
am and will always be indebted to her.

vi
TABLE OF CONTENTS
Page
TITLE PAGE .................................................................................................................... i
ABSTRACT ..................................................................................................................... ii
DEDICATION ................................................................................................................ iv
ACKNOWLEDGMENTS ............................................................................................... v
LIST OF TABLES ........................................................................................................... x
LIST OF FIGURES ........................................................................................................ xi
NOMENCLATURE ................................................................................................... xxiii
CHAPTER
I. INTRODUCTION ......................................................................................... 1
1.1 Aims and motivation .......................................................................... 1
1.2 Background ........................................................................................ 3
1.2.1 Electrokinetic Phenomena .................................................. 3
1.2.2 Particle motion in Pressure driven flow .............................. 7
1.3 Overview of dissertation .................................................................. 10
Reference ............................................................................................... 11
II. AN UNEXPECTED PARTICLE OSCILLATION FOR
ELECTROPHORESIS IN VISCOELASTIC FLUIDS THROUGH A
MICROCHANNEL CONSTRICTION ....................................................... 15
2.1 Introduction ...................................................................................... 15
2.2 Experiment ....................................................................................... 17
2.2.1 Preparation of non-Newtonian fluids and particle
suspensions ....................................................................... 17
2.2.2 Microchannel fabrication .................................................. 19
2.2.3 Experimental technique .................................................... 21
2.3 Results and discussion ..................................................................... 22
2.3.1 Comparison of particle electrophoresis in Newtonian and
non-Newtonian fluids........................................................ 22
2.3.2 Attempted explanation of the observed particle oscillation

vii
Table of Contents (Continued)
Page
in the non-Newtonian fluid ............................................... 26
2.3.3 Parametric study of particle oscillation in non-Newtonian
fluids ................................................................................. 28
2.4 Conclusions ...................................................................................... 32
Reference ............................................................................................... 33
III. VISCOELASTIC EFFECTS ON ELECTROKINETIC PARTICLE
FOCUSING IN A CONSTRICTED MICROCHANNEL ........................... 39
3.1 Introduction ...................................................................................... 39
3.2 Experiment ....................................................................................... 42
3.2.1 Preparation of non-Newtonian fluids and particle
suspensions ....................................................................... 42
3.2.2 Experimental setup............................................................ 43
3.2.3 Measurement of electrokinetic particle mobility .............. 44
3.3 Results and discussion ..................................................................... 46
3.3.1 Comparison of electrokinetic particle focusing in Newtonian
and non-Newtonian fluids ................................................. 46
3.3.2 PEO concentration effect .................................................. 51
3.3.3 Particle size effect ............................................................. 53
3.4 Conclusions ...................................................................................... 56
Reference ............................................................................................... 57
IV. VISCOELASTIC EFFECTS ON ELECTROOSMOTIC FLOW IN A
CONSTRICTION MICROCHANNLE ....................................................... 62
4.1 Introduction ...................................................................................... 62
4.2 Experiment ....................................................................................... 64
4.2.1 Preparation and technique of experiment ......................... 64
4.2.2 Electrokinetic mobility and dimensionless number .......... 65
4.3 Mathematical model and numerical method .................................... 66
4.4 Results and discussion ..................................................................... 69
4.5 Conclusions ...................................................................................... 72
Reference ............................................................................................... 73
V. CONTINUOUS MICROFLUIDIC PARTICLE SEPARATION VIA
ELASTO-INERTIAL PINCHED FLOW FRACTIONATION (eiPFF) ..... 75
5.1 Introduction ...................................................................................... 75
5.2 Experiment ....................................................................................... 79

viii
Table of Contents (Continued)
Page
5.2.1 Preparation of particle suspensions ................................... 79
5.2.2 Experimental setup............................................................ 80
5.3 Theoretical ....................................................................................... 81
5.3.1 Dimensionless numbers .................................................... 81
5.3.2 Mechanism of eiPFF ......................................................... 82
5.4 Results and discussion ..................................................................... 85
5.4.1 Effects of fluid elasticity (Wi) and inertia (Re) ................. 85
5.4.2 Effect of flow rate ratio () between sheath fluid and particle
mixture .............................................................................. 89
5.4.3 Effect of PEO concentration (in terms of El) .................... 91
5.4.4 Effect of channel aspect ratio (AR) ................................... 95
5.5 Conclusions ...................................................................................... 99
Reference ............................................................................................. 100
VI. PARTICLE FOCUSING IN VISCOELASTIC FLUIDS THROUGH
RECTANGULAR STRAIGHT MICROCHANNELS ............................. 105
6.1 Introduction .................................................................................... 106
6.2 Experiment ..................................................................................... 109
6.2.1 Microchannel fabrication and particle suspensions ........ 109
6.2.2 Experimental setup.......................................................... 111
6.2.3 Dimensionless numbers .................................................. 112
6.3 Numerical modeling....................................................................... 114
6.3.1 Mathematical model and numerical method ................... 114
6.3.2 Code validation ............................................................... 117
6.4 Results and discussion ................................................................... 118
6.4.1 Effects of particle size (β) and flow rate (Wi) ................. 118
6.4.2 Effect of channel aspect ratio (AR) ................................. 120
6.4.3 Effects of polymer type and shear-thinning .................... 123
6.5 Conclusions .................................................................................... 130
Reference ............................................................................................. 132
VII. ELASTO-INERTIAL PINCHED FLOW FRACTIONATION (eiPFF) FOR
CONTINUOUS SHAPE-BASED PARTICLE SEPARATION ............... 137
7.1 Introduction .................................................................................... 137
7.2 Experiment ..................................................................................... 140
7.2.1 Preparation of particle suspensions ................................. 140
7.2.2 Experimental setup.......................................................... 142
7.2.3 Dimensionless numbers .................................................. 143

ix
Table of Contents (Continued)
Page
7.3 Results and discussion ................................................................... 145
7.3.1 Effects of fluid elasticity (Wi) ......................................... 145
7.3.2 Effects of fluid inertia (Re) ............................................. 149
7.3.3 Effects of flow rate ratio, ............................................. 152
7.3.4 Effects of PEO concentration (El) .................................. 154
7.3.5 Effects of channel aspect ratio, AR ................................. 156
7.4 Conclusions .................................................................................... 159
Reference ............................................................................................. 160
VIII. CONTINUOUS SHETH-FREE SEPARATION OF PARTICLES BY SHAPE
IN VISCOELASTIC FLUIDS ................................................................... 164
8.1 Introduction .................................................................................... 164
8.2 Experiment ..................................................................................... 166
8.3 Results and discussion ................................................................... 168
8.4 Conclusions .................................................................................... 175
Reference ............................................................................................. 176
IX. CONCLUSIONS AND FUTURE WORK ................................................ 181
9.1 Conclusions .................................................................................... 181
9.2 Future work .................................................................................... 185
APPENDICES ............................................................................................................. 186
A: SUPPORTING INFORMATION FOR CONTINUOUS MICROFLUIDIC
PARTICLE SEPARATION VIA ELASTO-INERTIAL PINCHED FLOW
FRACTIONATION (eiPFF) ...................................................................... 187
B: SUPPLEMENTARY MATERIAL FOR PARTICLE FOCUSING IN
VISCOELASTIC FLUIDS THROUGH RECTANGULAR STRAIGHT
MICROCHANNELS ................................................................................. 191
C: SUPPLEMENTARY MATERIAL FOR CONTINUOUS SHETH-FREE
SEPARATION OF PARTICLES BY SHAPE IN VISCOELASTIC FLUIDS
.............................................................................................................. 194

x
LIST OF TABLES
Table Page
CHAPTER II
1 Solution properties ....................................................................................... 18
CHAPTER V
1 Properties of the 21 wt.% glycerol/water-based Newtonian and non-
Newtonian fluids used in experiments. ........................................................ 80
CHAPTER VI
1 Properties of water-based non-Newtonian fluids used in experiments ...... 111
CHAPTER VII
1 Properties of the PEO solutions used in experiments (at 20 °C). .............. 145
CHAPTER VIII
1 Rheological properties of the prepared PEO solutions .............................. 166

xi
LIST OF FIGURES
Figure Page
CHAPTER I
1 Electroosmosis and Electrophoresis in a straight channel under a DC electric
field ................................................................................................................ 5
2 Schematic illustration of the inertial lift forces (a) and viscoelastic lift force
(b) in the half cross-section of a straight channel. In the inertial case, the
background color indicates the shear rate distribution (the redder color
indicating the higher magnitude). The green arrows indicate the wall lift force
and the blue arrows indicate the shear gradient lift force. In the viscoelastic
case, the background color indicates the first normal stress difference
distribution (the redder indicating the higher magnitude), and the red arrows
represent the viscoelastic lift force ................................................................ 8
CHAPTER II
1 Picture of the 10:1:10 contraction-expansion microchannel (filled with green
food dye for clarity) used in experiments. The inset indicates the dimensions
of the constriction ........................................................................................ 20
2 Sequential images demonstrating the difference of 10 µm particle
electrophoresis in (a) (enhanced) Newtonian (1mM buffer) and (b) (enhanced)
non-Newtonian (500 ppm PEO in 1 mM buffer) fluids through the
microchannel constriction under an average DC electric field of 200 V/cm.
The particles under track are highlighted by a circle (for singles) or an ellipse
(for doubles) for a better illustration, where the thin arrows indicate the
particle moving directions at the time instants labeled on the images. The
block arrows indicate the overall moving directions of the fluids and particles
in the channel ............................................................................................... 22
3 Comparison of the transient axial velocities of the single particles tracked in
the Newtonian and non-Newtonian fluids (see FIG. 2) through the
microchannel constriction. Note that the times greater than 0 s correspond to
those labeled in FIG. 2 for each fluid. The dashed-dotted line indicates a zero
particle velocity ............................................................................................ 24
4 Tracked center position vs. time for oscillating 10 µm particle chains with
various lengths (i.e., the number of particles in the chain) in 500 ppm PEO
solution through the microchannel constriction. The average DC electric field

xii
List of Figures (Continued)
Figure Page
is 200 V/cm across the channel length. The shaded zone represents the span of
the constriction from 0 to 200 µm ............................................................... 25
5 Schematic illustration of the speculated mechanism for particle oscillation in
electrophoresis through a microchannel constriction with a viscoelastic fluid.
The background color indicates the electric field contour (the darker the larger
magnitude) ................................................................................................... 26
6 Snapshot (top) and superimposed (bottom) images illustrating the effects of
DC field magnitude on 10 µm particle electrophoresis in (a) non-Newtonian
(500 ppm PEO in 1 mM buffer) and (b) Newtonian (1 mM buffer) fluids
through the microchannel constriction: 100 V/cm (left column), 200 V/cm
(middle column) and 400 V/cm (right column). The fluid flow and particle
moving directions are from left to right in all images ................................. 29
7 Effects of PEO concentration (50, 100, 200 and 500 ppm) on the oscillation of
single 10 µm particles in the microchannel constriction under 100 V/cm DC
electric field. The shaded zone represents the span of the constriction from 0
to 200 µm ..................................................................................................... 30
8 Effects of particle size (3, 5 and 10 µm in diameter) on the oscillation of
single particles in 200 ppm PEO solution in the microchannel constriction
under a 200 V/cm DC electric field. The shaded zone represents the span of
the constriction from 0 to 200 µm ............................................................... 31
CHAPTER III
1 Superimposed images illustrating the effects of fluid viscoelasticity on
electrokinetic focusing of 9.9 µm particles in a constricted microchannel
under various DC electric fields: (a) Newtonian fluid (1 mM buffer); (b) non-
Newtonian fluid (200 ppm PEO in 1 mM buffer). The block arrows indicate
the particle moving direction, which is from bottom to top in all images and
against the electric field direction. The two dashed boxes on the right-most
images highlight the regions in which the particle trapping is initiated. A clear
demonstration of the observed particle trapping phenomenon in the PEO
solution is presented as snapshot images in FIG. 2. Note that the widths of the
focused particle streams referred to in the text (see also FIG. 3 and FIG. 4)
were all measured directly from the top edge of the images where particles
travel out ...................................................................................................... 48
xiii
List of Figures (Continued)
Figure Page
2 Sequential images (with the relative time instants labeled) illustrating the
forward ejection (a) and backward rolling (b) of 9.9 µm-diameter particle
aggregations in a non-Newtonian (200 ppm PEO) fluid through the
microchannel constriction. The applied DC electric field is 400 V/cm. The
block arrow indicates the overall particle moving direction in the
microchannel, which is from bottom to top in all images and against the
electric field direction (from top to bottom). The thin arrows indicate the
moving directions of the particle clusters that are formed first inside the
constriction (Multimedia view).................................................................... 49
3 Effects of PEO concentration (0, 50, 100, 200 and 500 ppm) on the stream
width of electrokinetically focused 9.9 µm particles in the microchannel
constriction at different DC electric fields. Error bars are included for only the
data in the 500 ppm PEO solution for a better view, which are determined
from the reading error in identifying the edges of the focused particle stream.
The unfilled symbols represent the points at which particle aggregation was
observed inside the constriction. The particle stream widths of these points are
each measured from the superimposed images prior to the occurring of
particle aggregation ...................................................................................... 52
4 Superimposed images illustrating the electrokinetic focusing of 10 µm-
diameter particles in PEO solutions of various concentrations (0 and 200 ppm
are referred to Fig. 1) under four different DC electric fields. The block arrow
indicates the particle moving direction in all images ................................... 53
5 Superimposed images illustrating the electrokinetic focusing of 3.1 µm and
4.8 µm-diameter particles (the images for 9.9 µm particles are referred to FIG.
1) in 200 ppm PEO solution under four different DC electric fields. The block
arrow indicates the particle moving direction in all images ........................ 55
6 Experimentally measured stream widths of the electrokinetically focused
particles with different sizes in 200 ppm PEO solution in the constricted
microchannel. The unfilled symbol for 9.9 µm particles represents the point at
which particle aggregation inside the constriction was observed. The particle
stream width of this point is obtained from the superimposed images prior to
the occurring of particle aggregation ........................................................... 55
CHAPTER IV

xiv
List of Figures (Continued)
Figure Page
1 Particle trajectories of 1.01 μm particles in Newtonian solution (a) and PEO
solution (b) at different voltages. The electroosmotic direction is from top to
bottom and the electrokinetic particle motion is in the opposite direction .. 70
2 Snapshot images of 1.01 μm (a) and 0.53 μm (b) particles in PEO solution at
1000V ........................................................................................................... 71
3 Flow fields of Newtonian model (a) and OB model (b) with Wim=46,
corresponding to Wi=10 in experiment. The background color shows the
normalized velocity magnitude (V/Vc, where Vc is the slip velocity in the wide
channel). The black lines indicate the particle trajectories. The velocity
magnitudes are plotted in (c) for Newtonian model (dash lines) and OB model
(solid lines) along the normalized lateral (y) direction at the places which are
50 μm and 400 μm away from the constriction at the upstream (indicated by
the arrows in (a)) .......................................................................................... 72
CHAPTER V
1 Top-view picture of the asymmetric T-shaped microchannel (filled with green
food dye for clarity) used in experiments. The block arrows indicate the flow
directions of the sheath fluid (which is the pure suspending medium of the
particle mixture) and particle mixture for particle separation, which is
visualized at the 900 µm-wide expansion region at the end of the 2 cm-long,
50 µm-wide main-branch (highlighted by a dashed-box highlights) ........... 81
2 Schematic illustration (not to scale) of the mechanism for eiPFF. The sheath-
fluid focused particle-mixture solution (highlighted by the background color)
has a width of 𝑤𝑝 in the main-branch, which for traditional PFF should be
smaller than the maximum allowed width, 𝑤𝑝,𝑚𝑎𝑥, given in eq 6. In eiPFF,
this constraint is released because the elastic lift force, 𝐅𝑒𝐿 , and inertial lift
force, 𝐅𝑖𝐿 , induced in a viscoelastic fluid act together to deflect particles
toward the channel center at a size-dependent rate ...................................... 84
3 Superimposed images at the expansion of the main-branch comparing the
continuous separation of 3 µm (appearing gray) and 10 µm (appearing black)
particles in glycerol/water-based Newtonian (top row, El = 0) and non-
Newtonian (bottom row, 1000 ppm PEO, El = 42.5) fluids at various sheath
flow rates (indicated on top of the images) in a 40 µm deep T-shaped
microchannel. The flow rate ratio between the sheath fluid and particle
mixture was maintained at = 20. The arrows on the right-most images

xv
List of Figures (Continued)
Figure Page
indicate the reference points to which the particle stream positions shown in
Figures 4 and 8 were measured. The flow direction is from left to right in all
images .......................................................................................................... 86
4 Comparison of the exiting positions of 3 µm and 10 µm particle streams at the
expansion of the main-branch (measured from the images in Figure 3 with
reference to the top sidewall as indicated by the arrows) in Newtonian (dashed
lines with unfilled symbols) and non-Newtonian (solid lines with filled
symbols) fluids. Error bars are included for only 3 µm particles in the
Newtonian fluid and 10 µm particles in the non-Newtonian fluid for a non-
blocked view, which encompass the span of each particle stream. The single
data point with a circular symbol near the origin of the plot indicates an
(unstable) equilibrium position at the corner of the channel for 10 µm particles
in the non-Newtonian fluid due to the dominant elastic lift force at a
negligible Re. Note that all lines are used to guide eyes only ...................... 88
5 Superimposed images at the T-junction (top row) and expansion (bottom row)
of the main-branch illustrating the sheath-flow focusing and elasto-inertial
separation of 3 µm and 10 µm particles in 1000 ppm PEO solution through a
40 µm deep T-shaped microchannel. The volume flow rate of the sheath fluid,
Qsheath, was maintained at 0.3 ml/h in all cases. The flow rate ratio between the
sheath fluid and particle mixture, , was varied as seen on the images. The
two dotted lines across the images are used to assist viewing the effects of
on the exiting positions of the separated particle streams. The block arrows
indicate the flow directions .......................................................................... 90
6 Superimposed images at the expansion of the main-branch illustrating the
effect of PEO concentration (500, 1000 and 2000 ppm from left to right; in
terms of El) on the separation of 3 µm and 10 µm particles via eiPFF in a 40
µm deep T-shaped microchannel. The flow rate ratio between sheath fluid
(labeled to the left of the images) and particle mixture was fixed at 20. The
dotted lines across the images, which indicate the exiting positions of the two
types of particles in 1000 ppm PEO solution, are drawn to assist viewing the
PEO concentration effect on the particle stream positions at the expansion91
7 Comparison of the exiting positions of 3 µm (dashed lines) and 10 µm (solid
lines) particle streams at the expansion of the main-branch (measured directly
from the images in Figure 6) in non-Newtonian fluids with different PEO
concentrations. Error bars are included for particles suspended in 2000 ppm
PEO solution. Note that all lines are used to guide eyes only ..................... 94
xvi
List of Figures (Continued)
Figure Page
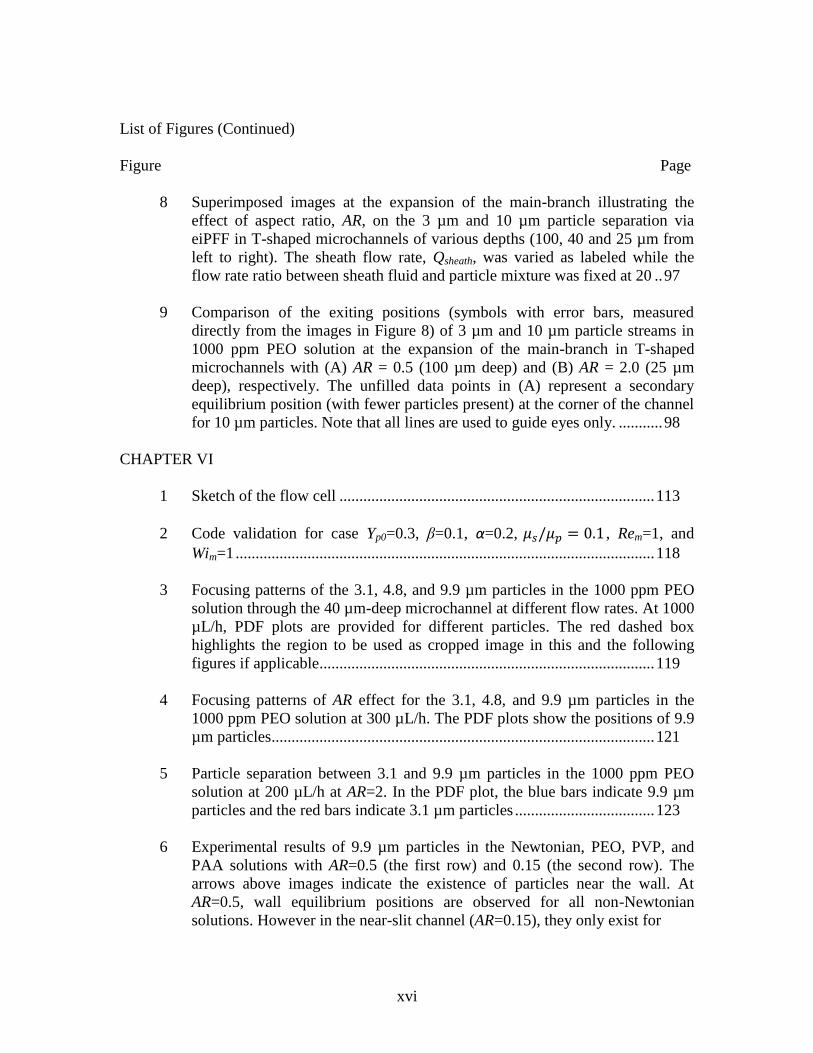
8 Superimposed images at the expansion of the main-branch illustrating the
effect of aspect ratio, AR, on the 3 µm and 10 µm particle separation via
eiPFF in T-shaped microchannels of various depths (100, 40 and 25 µm from
left to right). The sheath flow rate, Qsheath, was varied as labeled while the
flow rate ratio between sheath fluid and particle mixture was fixed at 20 .. 97
9 Comparison of the exiting positions (symbols with error bars, measured
directly from the images in Figure 8) of 3 µm and 10 µm particle streams in
1000 ppm PEO solution at the expansion of the main-branch in T-shaped
microchannels with (A) AR = 0.5 (100 µm deep) and (B) AR = 2.0 (25 µm
deep), respectively. The unfilled data points in (A) represent a secondary
equilibrium position (with fewer particles present) at the corner of the channel
for 10 µm particles. Note that all lines are used to guide eyes only. ........... 98
CHAPTER VI
1 Sketch of the flow cell ............................................................................... 113
2 Code validation for case Yp0=0.3, β=0.1, α=0.2, 𝜇𝑠/𝜇𝑝 = 0.1 , Rem=1, and
Wim=1 ......................................................................................................... 118
3 Focusing patterns of the 3.1, 4.8, and 9.9 µm particles in the 1000 ppm PEO
solution through the 40 µm-deep microchannel at different flow rates. At 1000
µL/h, PDF plots are provided for different particles. The red dashed box
highlights the region to be used as cropped image in this and the following
figures if applicable.................................................................................... 119
4 Focusing patterns of AR effect for the 3.1, 4.8, and 9.9 µm particles in the
1000 ppm PEO solution at 300 µL/h. The PDF plots show the positions of 9.9
µm particles ................................................................................................ 121
5 Particle separation between 3.1 and 9.9 µm particles in the 1000 ppm PEO
solution at 200 µL/h at AR=2. In the PDF plot, the blue bars indicate 9.9 µm
particles and the red bars indicate 3.1 µm particles ................................... 123
6 Experimental results of 9.9 µm particles in the Newtonian, PEO, PVP, and
PAA solutions with AR=0.5 (the first row) and 0.15 (the second row). The
arrows above images indicate the existence of particles near the wall. At
AR=0.5, wall equilibrium positions are observed for all non-Newtonian
solutions. However in the near-slit channel (AR=0.15), they only exist for
xvii
List of Figures (Continued)
Figure Page
PAA solution. A snapshot image near the wall is provided for the PEO
solution to illustrate the particle focal planes at AR=0.5 ........................... 125
7 Shear-thinning effect in 50 ppm PAA solutions in near-slit channel (AR=0.15)
for 9.9 µm particles. The glycerol concentrations in the images from left to
right are 0, 23wt%, and 76wt%. The arrows above images indicate the
existence of particles near the wall. The thickness of the arrow corresponds to
the amount of particles near the wall qualitatively .................................... 126
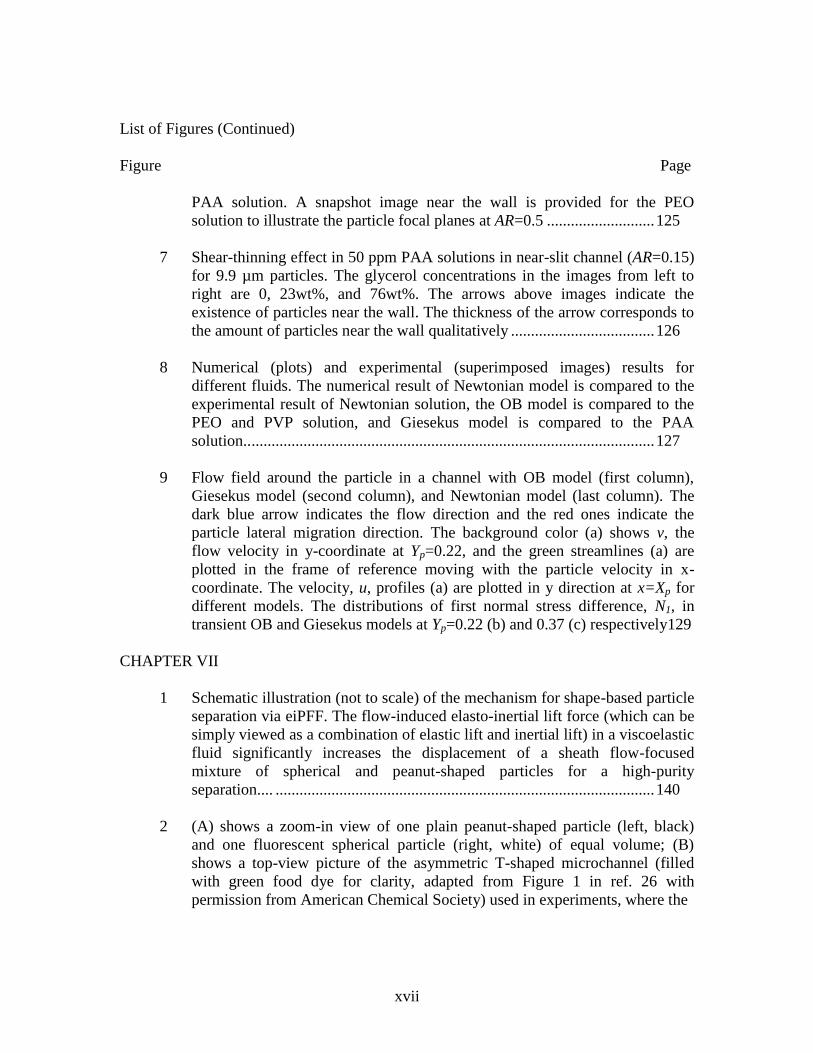
8 Numerical (plots) and experimental (superimposed images) results for
different fluids. The numerical result of Newtonian model is compared to the
experimental result of Newtonian solution, the OB model is compared to the
PEO and PVP solution, and Giesekus model is compared to the PAA
solution.. ..................................................................................................... 127
9 Flow field around the particle in a channel with OB model (first column),
Giesekus model (second column), and Newtonian model (last column). The
dark blue arrow indicates the flow direction and the red ones indicate the
particle lateral migration direction. The background color (a) shows v, the
flow velocity in y-coordinate at Yp=0.22, and the green streamlines (a) are
plotted in the frame of reference moving with the particle velocity in x-
coordinate. The velocity, u, profiles (a) are plotted in y direction at x=Xp for
different models. The distributions of first normal stress difference, N1, in
transient OB and Giesekus models at Yp=0.22 (b) and 0.37 (c) respectively129
CHAPTER VII
1 Schematic illustration (not to scale) of the mechanism for shape-based particle
separation via eiPFF. The flow-induced elasto-inertial lift force (which can be
simply viewed as a combination of elastic lift and inertial lift) in a viscoelastic
fluid significantly increases the displacement of a sheath flow-focused
mixture of spherical and peanut-shaped particles for a high-purity
separation.... ............................................................................................... 140
2 (A) shows a zoom-in view of one plain peanut-shaped particle (left, black)
and one fluorescent spherical particle (right, white) of equal volume; (B)
shows a top-view picture of the asymmetric T-shaped microchannel (filled
with green food dye for clarity, adapted from Figure 1 in ref. 26 with
permission from American Chemical Society) used in experiments, where the

xviii
List of Figures (Continued)
Figure Page
block arrows indicate the flow directions and the dashed-box highlights the
900 µm-wide expansion region for visualizing particle separation ........... 141
3 Comparison of shape-based separation of fluorescent spherical (white) and
plain peanut-shaped particles (black) in water (A) and 1000 ppm PEO solution
(B) through a 25 µm deep microchannel under the sheath flow rate of 100 µl/h
and the flow rate ratio of 20. The images in the left, middle and right columns
are the snapshot images of both particles, superimposed images of peanut
particles, and superimposed images of spherical particles at the channel
expansion, respectively. The two dashed boxes in (B) highlight the regions to
be used as cropped images in the following figures if applicable. The flow
direction is from left to right in all images ................................................ 146
4 Comparison of the rotation of peanut particles in water and 1000 ppm PEO
solution through a 25 µm deep microchannel under a sheath flow rate of 100
µl/h: (A) shows the superimposed images of single peanut particle in water
(top) and PEO (bottom), where the time interval between neighboring particle
positions is 1/1800 s and the block arrow indicates the particle traveling
direction; (B) shows the time-varied orientations of the long axis of peanut
particles (markers) with respect to the flow direction (see the definition of
angle on the schematic) in the two suspending fluids, which were estimated
from the images in (A) (note that not all the particle orientations are included
in the plot). The schematics of peanut particles on the plot are used to
highlight the particle orientations at different angles. The solid lines are used
to connect the markers only ....................................................................... 147
5 Cropped superimposed images [highlighted by the dashed boxes in Figure
3(B)] illustrating the effects of fluid elasticity (Wi) and inertia (Re) on the
shaped-based separation of fluorescent spherical (white) and plain peanut
(black) particles in water (A) and PEO solution (B) in a 25 µm deep
microchannel. The sheath flow rate is varied from 20 to 400 µl/h from left to
right while the flow rate ratio between the sheath fluid and particle mixture
remains at = 20. The solid arrow on the right-most image in (B) indicates
the reference point to which the particle stream positions in Figures 6, 9, and
10 were measured. The dashed arrow on the left-most image in (B) highlights
a secondary equilibrium position at the channel corner for spherical particles
in the PEO solution at a low flow rate. The scale bar on the right-most image
in (A) represents 200 µm ........................................................................... 150

xix
List of Figures (Continued)
Figure Page
6 Comparison of the exiting positions of fluorescent spherical and plain peanut
particles at the expansion of the main-branch in 1000 ppm PEO solution under
various flow rates. All data points (symbols with error bars to encompass the
span of each particle stream) were measured directly from the images in
Figure 5(B) with reference to the top sidewall of the channel expansion as
indicated by the solid arrow therein ........................................................... 152
7 Flow rate ratio effect on the shape-based separation of fluorescent spherical
(white) and plain peanut (black) particles via eiPFF in 1000 ppm PEO solution
through a 25 µm deep microchannel under a constant 100 µl/h sheath flow
rate: (A) shows the cropped superimposed images at the channel expansion,
where the dashed-dotted line is right in the middle of the two separated
particle streams; (B) shows the column plot for the measured separation purity
(i.e., percentage) of spherical and peanut particles below and above the
dashed-dotted line in (A), respectively. The scale bar on the right-most image
in (A) represents 200 µm ........................................................................... 153
8 PEO concentration effect on the shape-based separation of fluorescent
spherical (white) and plain peanut (black) particles via eiPFF in a 25 µm deep
microchannel under a 100 µl/h sheath flow rate with a fixed flow rate ratio of
20. The scale bar on the right-most image of the top row represents 200 µm
.............................................................................................................. 155
9 Comparison of the exiting positions of fluorescent spherical and plain peanut-
shaped particles at the expansion of the main-branch for different PEO
concentrations. All data points (symbols with error bars to encompass the span
of each particle stream) were measured directly from the images in Figure 8
.............................................................................................................. 156
10 Channel aspect ratio effect on the shape-based separation of fluorescent
spherical (white) and plain peanut (black) particles via eiPFF in 1000 ppm
PEO solution under a 100 µl/h sheath flow rate with a fixed flow rate ratio of
20: (A) shows the cropped superimposed images at the channel expansion,
where the dashed-dotted arrow highlights a secondary equilibrium position at
the channel corner for spherical particles in a low-AR microchannel; (B)
compares the exiting particle positions (symbols with error bars) at the
expansion of the main-branch. The scale bar on the right-most image in (A)
represents 200 µm ...................................................................................... 157
CHAPTER VIII
xx
List of Figures (Continued)
Figure Page
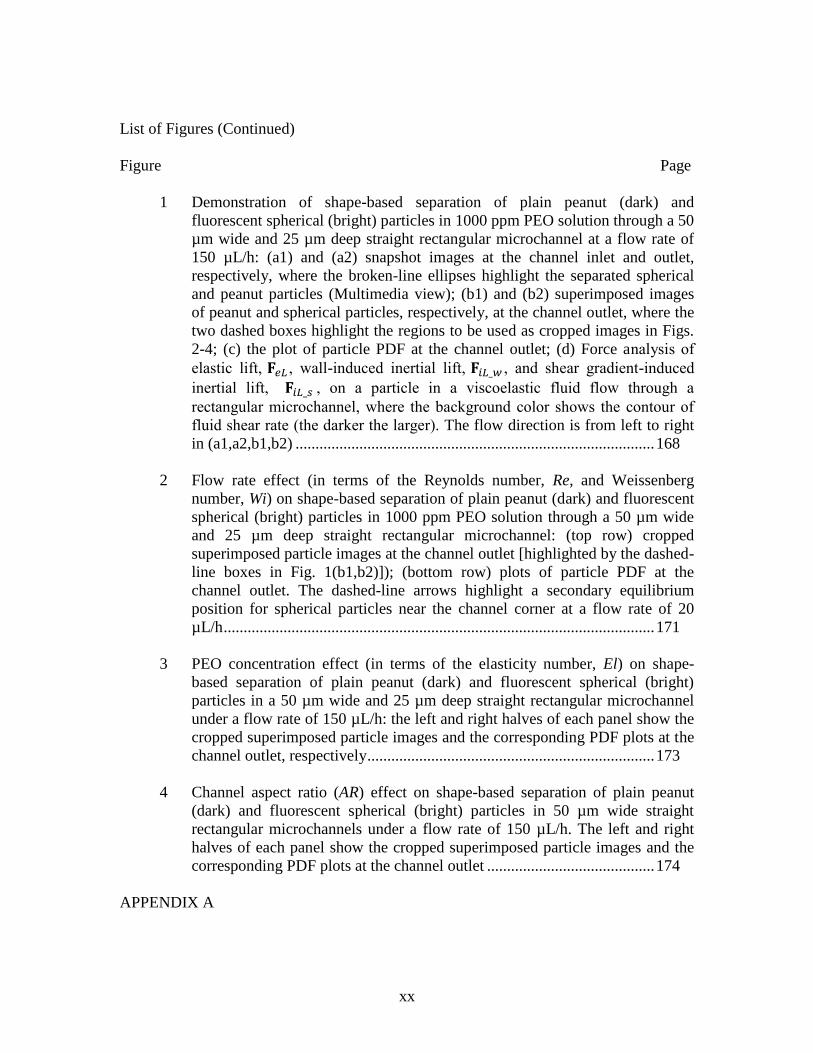
1 Demonstration of shape-based separation of plain peanut (dark) and
fluorescent spherical (bright) particles in 1000 ppm PEO solution through a 50
µm wide and 25 µm deep straight rectangular microchannel at a flow rate of
150 µL/h: (a1) and (a2) snapshot images at the channel inlet and outlet,
respectively, where the broken-line ellipses highlight the separated spherical
and peanut particles (Multimedia view); (b1) and (b2) superimposed images
of peanut and spherical particles, respectively, at the channel outlet, where the
two dashed boxes highlight the regions to be used as cropped images in Figs.
2-4; (c) the plot of particle PDF at the channel outlet; (d) Force analysis of
elastic lift, 𝐅𝑒𝐿 , wall-induced inertial lift, 𝐅𝑖𝐿_𝑤 , and shear gradient-induced
inertial lift, 𝐅𝑖𝐿_𝑠 , on a particle in a viscoelastic fluid flow through a
rectangular microchannel, where the background color shows the contour of
fluid shear rate (the darker the larger). The flow direction is from left to right
in (a1,a2,b1,b2) .......................................................................................... 168
2 Flow rate effect (in terms of the Reynolds number, Re, and Weissenberg
number, Wi) on shape-based separation of plain peanut (dark) and fluorescent
spherical (bright) particles in 1000 ppm PEO solution through a 50 µm wide
and 25 µm deep straight rectangular microchannel: (top row) cropped
superimposed particle images at the channel outlet [highlighted by the dashed-
line boxes in Fig. 1(b1,b2)]); (bottom row) plots of particle PDF at the
channel outlet. The dashed-line arrows highlight a secondary equilibrium
position for spherical particles near the channel corner at a flow rate of 20
µL/h ............................................................................................................ 171
3 PEO concentration effect (in terms of the elasticity number, El) on shape-
based separation of plain peanut (dark) and fluorescent spherical (bright)
particles in a 50 µm wide and 25 µm deep straight rectangular microchannel
under a flow rate of 150 µL/h: the left and right halves of each panel show the
cropped superimposed particle images and the corresponding PDF plots at the
channel outlet, respectively ........................................................................ 173
4 Channel aspect ratio (AR) effect on shape-based separation of plain peanut
(dark) and fluorescent spherical (bright) particles in 50 µm wide straight
rectangular microchannels under a flow rate of 150 µL/h. The left and right
halves of each panel show the cropped superimposed particle images and the
corresponding PDF plots at the channel outlet .......................................... 174
APPENDIX A
xxi
List of Figures (Continued)
Figure Page
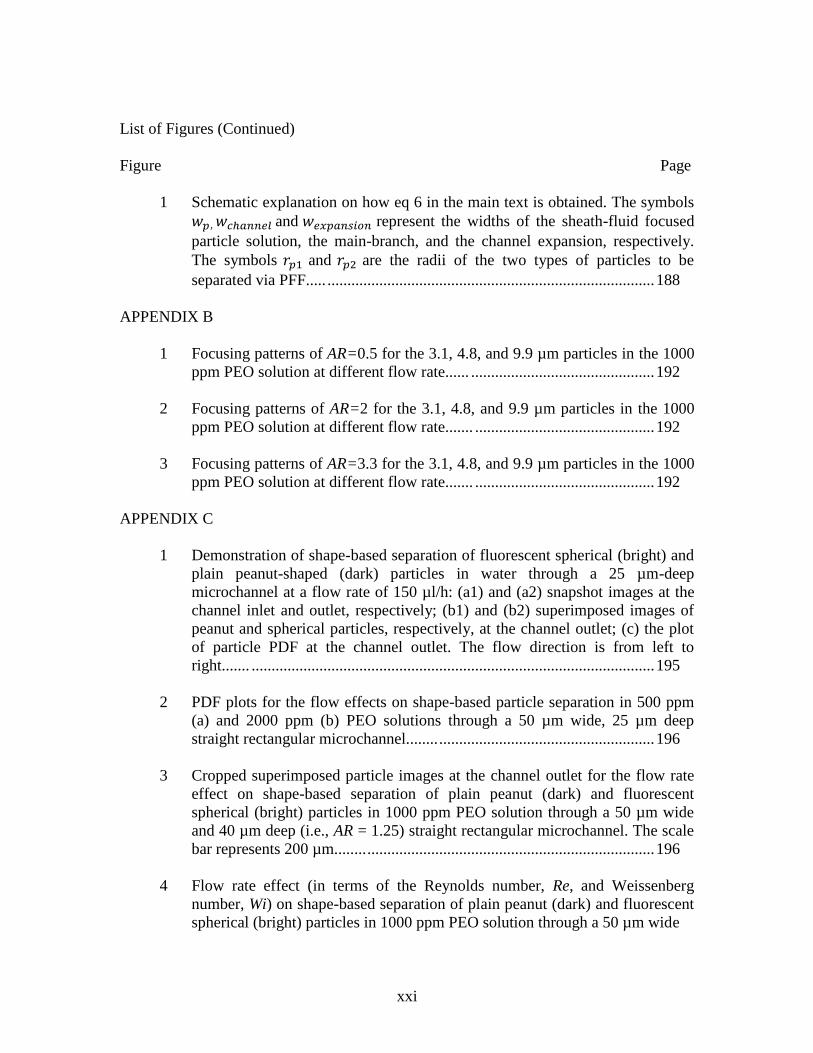
1 Schematic explanation on how eq 6 in the main text is obtained. The symbols
𝑤𝑝, 𝑤𝑐ℎ𝑎𝑛𝑛𝑒𝑙 and 𝑤𝑒𝑥𝑝𝑎𝑛𝑠𝑖𝑜𝑛 represent the widths of the sheath-fluid focused
particle solution, the main-branch, and the channel expansion, respectively.
The symbols 𝑟𝑝1 and 𝑟𝑝2 are the radii of the two types of particles to be
separated via PFF..... .................................................................................. 188
APPENDIX B
1 Focusing patterns of AR=0.5 for the 3.1, 4.8, and 9.9 µm particles in the 1000
ppm PEO solution at different flow rate...... .............................................. 192
2 Focusing patterns of AR=2 for the 3.1, 4.8, and 9.9 µm particles in the 1000
ppm PEO solution at different flow rate....... ............................................. 192
3 Focusing patterns of AR=3.3 for the 3.1, 4.8, and 9.9 µm particles in the 1000
ppm PEO solution at different flow rate....... ............................................. 192
APPENDIX C
1 Demonstration of shape-based separation of fluorescent spherical (bright) and
plain peanut-shaped (dark) particles in water through a 25 µm-deep
microchannel at a flow rate of 150 µl/h: (a1) and (a2) snapshot images at the
channel inlet and outlet, respectively; (b1) and (b2) superimposed images of
peanut and spherical particles, respectively, at the channel outlet; (c) the plot
of particle PDF at the channel outlet. The flow direction is from left to
right....... ..................................................................................................... 195
2 PDF plots for the flow effects on shape-based particle separation in 500 ppm
(a) and 2000 ppm (b) PEO solutions through a 50 µm wide, 25 µm deep
straight rectangular microchannel........ ...................................................... 196
3 Cropped superimposed particle images at the channel outlet for the flow rate
effect on shape-based separation of plain peanut (dark) and fluorescent
spherical (bright) particles in 1000 ppm PEO solution through a 50 µm wide
and 40 µm deep (i.e., AR = 1.25) straight rectangular microchannel. The scale
bar represents 200 µm........ ........................................................................ 196
4 Flow rate effect (in terms of the Reynolds number, Re, and Weissenberg
number, Wi) on shape-based separation of plain peanut (dark) and fluorescent
spherical (bright) particles in 1000 ppm PEO solution through a 50 µm wide

xxii
List of Figures (Continued)
Figure Page
and 15 µm deep (i.e., AR = 3.3) straight rectangular microchannel: (top row)
cropped superimposed particle images at the channel outlet; (bottom row)
plots of particle PDF at the channel outlet. The scale bar represents 200
µm......... ..................................................................................................... 197
xxiii
NOMENCLATURE
𝐮𝐸𝑂 electroosmotic velocity
𝜀 relative permittivity
𝜀0 vacuum permittivity
E electric field
𝜇, fluid dynamic viscosity
𝜁 zeta potential
𝜁𝑤 zeta potential of channel wall
𝜁𝑝 zeta potential of particle
𝐮𝐸𝑃 electrophoretic velocity
𝐮𝐸𝐾 electrokinetic velocity
𝐅𝐷𝐸𝑃 dielectrophoretic force
d particle diameter
rp particle radius
𝑓𝐶𝑀 Clausius-Mossotti (CM) factor
𝜎𝑝 electric conductivity of particle
𝜎𝑓 electric conductivity of solution
𝐅𝑖𝐿 inertial lift force
𝜌 fluid density
𝑉𝑚 maximum fluid velocity
up particle velocity
xxiv
w channel width
h channel height
N1 first normal stress difference
N2 second normal stress difference
𝐅𝑒𝐿 elastic lift force
c*
overlap concentration of polymer solution
Mw molecular weight
Z Zimm relaxation time
eff, 𝜆𝑒 effective relaxation time
µEK electrokinetic mobility
�̇� shear rate
Wi Weissenberg number
Re Reynolds number
EL Elasticity number
Ф electric potential
D rate-of-deformation tensor
𝛕 extra stress tensor
c conformation tensor
s log conformation tensor
𝜇𝑠 solvent viscosity
𝜇𝑝 polymer viscosity
𝜂0 zero-shear viscosity

xxv
Dh hydraulic diameter
Q volumetric flow rate
flow rate ratio
AR channel aspect ratio
𝛽 blockage ratio
𝑚𝑝 mass of particle
𝐼𝑝 inertia of particle
Torbit orbit period
1
CHAPTER ONE
INTRODUCTION
1.1 Aims and motivation
The field of microfluidics has been rapidly developed and widely used for many
biomedical, chemical, environmental and food industry applications during last
decades.1,2
Particle (synthetic or biological) transport is one of the most fundamental and
significant phenomena in microfluidic devices, including the focusing, trapping, sorting,
and separation of particles. As a matter of fact, many of the fluids used in the
microfluidic devices are complex, such as polymeric solutions and bodily fluids (e.g.,
blood, saliva and DNA solutions).3-5
These solutions usually have molecules with
extremely high molecular weights dissolved in the solvent, where the molecular chains
can display a tremendous number of configurations and be altered by stretch and
distortion.6 As a consequence, the fluids exhibit strong non-Newtonian behaviors such as
shear thinning and viscoelasticity. The shear thinning demonstrates the phenomenon that
the fluid viscosity decreases with the increase of shear strain; the viscoelasticity
demonstrates that the fluid exhibits both viscous and elastic characteristics when
undergoing deformation.
To date, however, particle transport has been little studied in non-Newtonian
fluids. In electric field-driven flow, the only experimental studies have been limited to
electroosmosis.7,8
Particle transport phenomenon has never been explored experimentally.
In pressure-driven flow, a few particle manipulation studies based on elasto-inertial effect
have been reported,9,10
but a comprehensive understanding of the elasto-inertial particle
2
focusing and separation is still lacking. There are two significant motivations for studying
the particle transport in non-Newtonian fluids. First, it is important and fundamental to
understand how the non-Newtonian rheological properties influence the particle motions
in microfluidics. Then, the non-Newtonian rheological properties may be able to help us
achieve particle manipulation functions that cannot be reached in Newtonian fluids.
Therefore, this dissertation is dedicated to exploring the non-Newtonian
rheological effects on particle motion in both electric field- and pressure-driven flows
through microchannels. We focus on the fundamentals of experimental behaviors of
particle transport in non-Newtonian fluids. Then numerical simulations of different
constitutive equations are conducted to support and explain some of the experimental
observations. The electrokinetic transport phenomena are studied in a constricted
microchannel, where high strains can be introduced near the constriction to generate
viscoelasticity. The particle transport in pressure driven flows are studied in straight
rectangular microchannels to eliminate other phenomena such as dean flow11
and lid-
driven cavity flow12
. The non-Newtonian rheological properties of synthetic polymer
solutions are stable and well-studied, such as polyethylene oxide (PEO), polyacrylamide
(PAA) and Polyvinylpyrrolidone (PVP) solutions. Thus we use them as the flow medium.
Our expectations for electric field-driven flow are that the particle motions in non-
Newtonian fluids, which have never been reported in previous experiments, are different
from those in Newtonian fluids. Our expectations for pressure-driven flow are that the
particle lateral motions in non-Newtonian fluids, which have been demonstrated to be
different from those in Newtonian fluids, can be affected and manipulated by a variety of

3
characteristics, such as particle size, particle shape, flow rate, channel geometry, fluid
elasticity, and polymer type. And these controllable particle migration behaviors can be
used in particle separations. The objective of this dissertation is to obtain a fundamental
knowledge of the particle transport phenomena in non-Newtonian microfluidics and to
provide a useful guidance for future design of microfluidic devices.
1.2 Background
There are two widely used pumping methods, electric field-driven flow and
pressure-driven flow. The electric field-driven flow is easy to control and integrate. Its
unique plug-like flow profile provides a uniform particle velocity, which is beneficial for
particle manipulation. The pressure-driven flow is the most traditional method. Both
flow/pressure control and high throughput can be easily fulfilled. Resulting from the non-
uniform velocity of the flow, the inertial hydrodynamic force can be used for particle
manipulation. The basic concepts and research backgrounds of both electric field- and
pressure-driven flows are introduced in this section.
1.2.1 Electrokinetic Phenomena
When a solid substrate is immerged into an aqueous medium, electric charges
(usually negative) develop on the surface spontaneously due to several mechanisms, such
as ionization of surface groups and adsorption of ions.13
In order to neutralize them, the
free counter-ions in the solution are attracted to the charged surface and free co-ions are
repelled from the charged surface. As a response to the balance between Coulomb force
and the thermal Brownian motion, the ions keep their structure of distribution, which is

4
described as the electric double layer (EDL). The first layer of EDL is the surface charge
on the substrate and the second layer is composed of attracted ions on the liquid side,
which can be further divided into stern layer of immobilized ions and diffuse layer of free
to move ions. The zeta potential, 𝜁, is defined as the potential at the interface between the
Stern layer and the diffuse layer. Typically, the dimension of the EDL is on the order of
several nanometers, which is much smaller than that of the microchannel.
Electroosmosis (EO) is the motion of the bulk fluid induced by an applied electric
field which drives the migration of excess counter-ions within the EDL. The non-charged
liquid molecules are dragged by the moving ions due to viscous effects. Because the EDL
is usually much smaller than the channel dimension, the bulk flow outside the EDL has a
uniform velocity. Therefore, a plug like bulk flow is formed as shown in Fig. 1. Under
the condition of uniform surface charge and fluid properties, low Reynolds number, and
zero pressure differences between inlets and outlets, the streamlines in electrokinetic
flows are equivalent to the electric field lines due to the similarity between
electroosmotic flow and electric fields.14
With the condition that the EDL is much smaller
than the channel width, the bulk fluid velocity can be describe by the Smoluchowski slip
velocity,
𝐮𝐸𝑂 = −𝜀𝜀0𝜁𝑤𝐄/𝜇 (1)
where 𝜀 and 𝜀0 are the relative and vacuum permittivity, 𝜁𝑤 is the zeta potential of the
channel wall, 𝜇 is the fluid dynamic viscosity, and E is the electric field.
5
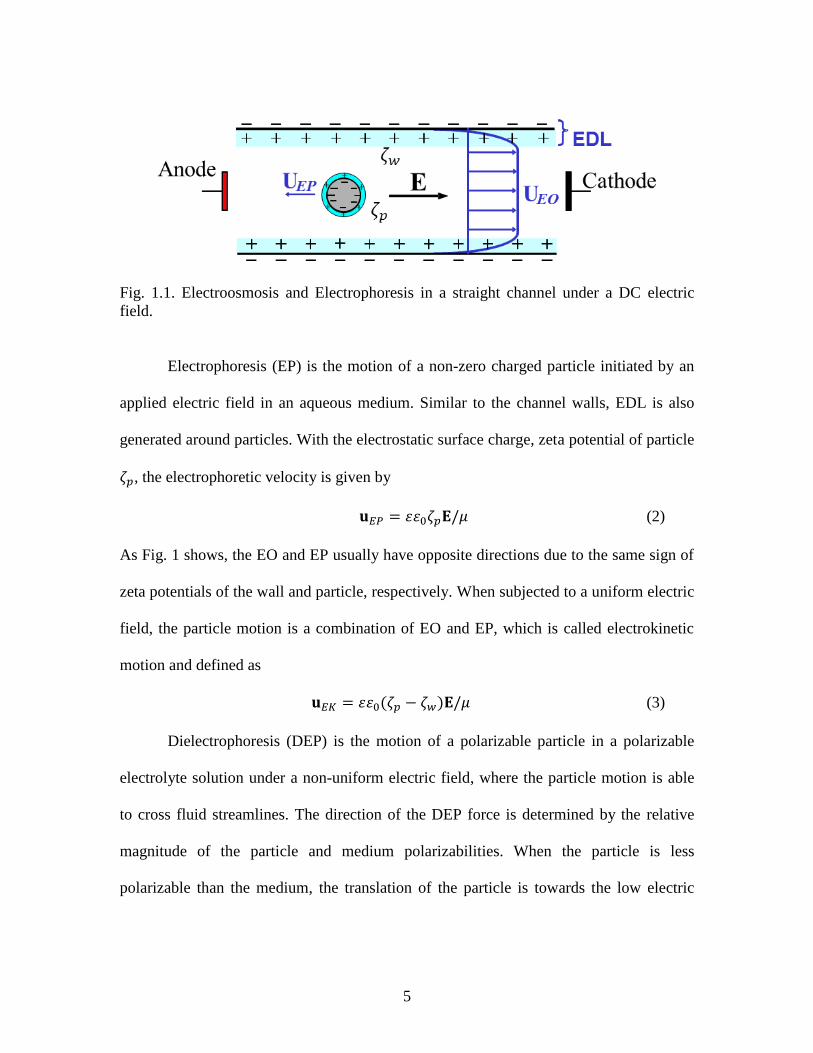
Fig. 1.1. Electroosmosis and Electrophoresis in a straight channel under a DC electric
field.
Electrophoresis (EP) is the motion of a non-zero charged particle initiated by an
applied electric field in an aqueous medium. Similar to the channel walls, EDL is also
generated around particles. With the electrostatic surface charge, zeta potential of particle
𝜁𝑝, the electrophoretic velocity is given by
𝐮𝐸𝑃 = 𝜀𝜀0𝜁𝑝𝐄/𝜇 (2)
As Fig. 1 shows, the EO and EP usually have opposite directions due to the same sign of
zeta potentials of the wall and particle, respectively. When subjected to a uniform electric
field, the particle motion is a combination of EO and EP, which is called electrokinetic
motion and defined as
𝐮𝐸𝐾 = 𝜀𝜀0(𝜁𝑝 − 𝜁𝑤)𝐄/𝜇 (3)
Dielectrophoresis (DEP) is the motion of a polarizable particle in a polarizable
electrolyte solution under a non-uniform electric field, where the particle motion is able
to cross fluid streamlines. The direction of the DEP force is determined by the relative
magnitude of the particle and medium polarizabilities. When the particle is less
polarizable than the medium, the translation of the particle is towards the low electric

6
field region which is called negative DEP. When the particle is more polarizable than the
medium, the translation of the particle is towards the high electric field region, which is
called positive DEP. The DEP force induced on a spherical particle in a DC electric field
is given by15
𝐅𝐷𝐸𝑃 = (1/2)𝜋𝜀𝜀0𝑑3𝑓𝐶𝑀 (𝐄 ∙ 𝛁𝐄) (4)
where d is the particle diameter and 𝑓𝐶𝑀 is the Clausius-Mossotti (CM) factor. In DC or
low-frequency AC (<100 kHz) fields, the CM factor can be calculated by
𝑓𝐶𝑀 =𝜎𝑝−𝜎𝑓
𝜎𝑝+2𝜎𝑓 (5)
where 𝜎𝑝 and 𝜎𝑓 are the electric conductivities of the particle and solution, respectively.
Because the Reynolds number is typically small in electrokinetic flows, the DEP velocity
is calculated by balancing the DEP force with Stokes’ drag,
𝐔𝐷𝐸𝑃 =𝜀𝜀0𝑑2𝑓𝐶𝑀
6𝜇(𝐄 ∙ 𝛁𝐄) (6)
A variety of electrokinetic particle manipulation studies have been reported in
Newtonian fluids. The electrophoretic separation technique has been demonstrated by the
mobility differences of different samples.16-19
But the long analysis time is always the
major concern of the batch-wised method. In contrast, the dielectrophoretic technique has
become a powerful tool for particle focusing and separation because it is a continuous
method and is less time consuming. Traditionally, the electric field gradient, which is the
source of DEP, is created by imbedded electrodes.20-23
The electrode-based DEP (eDEP)
technique can reorient the particles near the electrode according to the magnitude and
frequency of the applied AC electric field and achieve focusing or separation functions.

7
However, the fabrication complexity is one of its main disadvantages. An alternative
method to initiate the electric field gradient is through the insulating channel geometries,
which is called insulator-based DEP (iDEP). Particle manipulations can be achieved in
different channel geometries, such as converging-diverging channels,24
curve
channels,25,26
and channels with hurdles27
and posts28
. As compared with eDEP, iDEP is
able to pump the solution and manipulate the suspended particles under a DC electric
field simultaneously. However, no experimental studies have been reported on
electrokinetic particle motion in non-Newtonian fluids.
1.2.2 Particle motion in pressure driven flow
Because of the small dimensions of microchannels, the majority of flows in
microfluidic devices can be considered as laminar flows. The hydrodynamic forces of
particles in laminar flow can be classified as two groups, drag and lift forces. The drag
force acts on the particle opposite to the relative motion with respect to a surrounding
fluid, which affects the translation of the particle in both electric field- and pressure-
driven flows. The lift force acts on the particle perpendicular to the flow direction,
leading to a cross-streamline migration. The inertial particle migration was firstly
experimentally demonstrated by Segre and Silberberg29
for particles flowing through
circular pipes. As a result from the inertial effect, the lifts on particle migration in general
can be described as two different types of forces, i.e., wall lift and shear gradient lift
forces.30
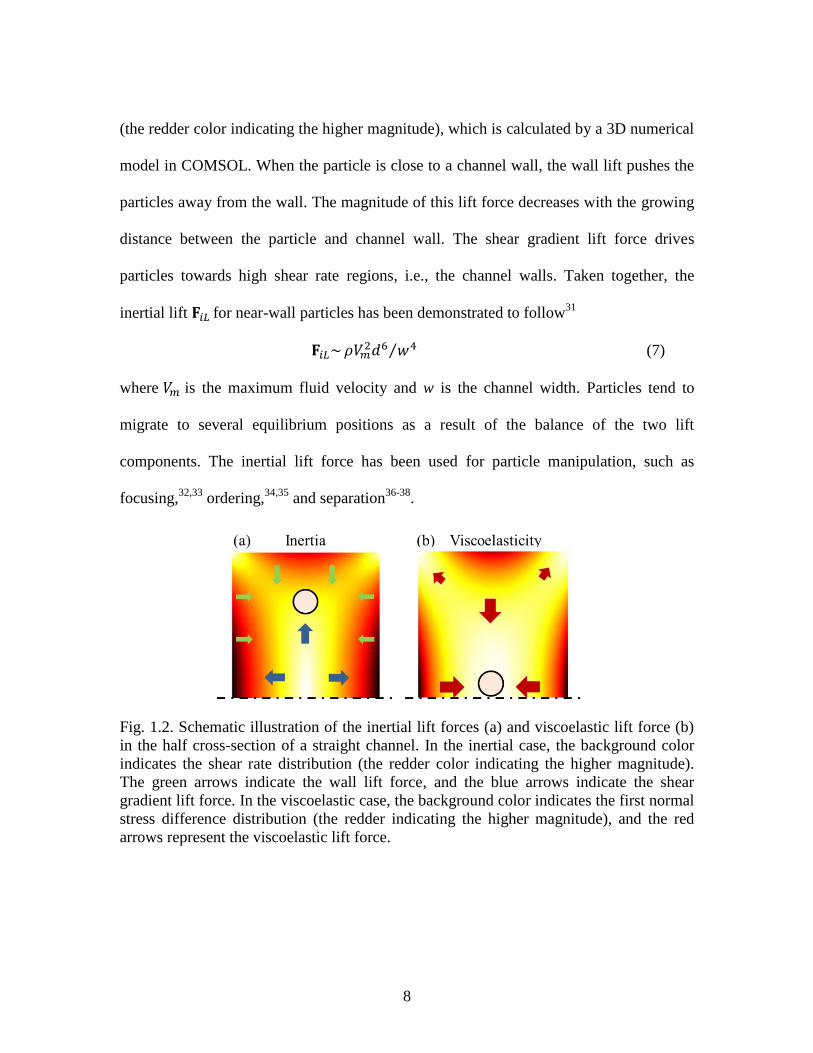
Fig. 2 (a) depicts the lift forces experienced by a particle in the half cross-
section of a straight channel. The background color indicates the shear rate distribution
8
(the redder color indicating the higher magnitude), which is calculated by a 3D numerical
model in COMSOL. When the particle is close to a channel wall, the wall lift pushes the
particles away from the wall. The magnitude of this lift force decreases with the growing
distance between the particle and channel wall. The shear gradient lift force drives
particles towards high shear rate regions, i.e., the channel walls. Taken together, the
inertial lift 𝐅𝑖𝐿 for near-wall particles has been demonstrated to follow31
𝐅𝑖𝐿~ 𝜌𝑉𝑚2𝑑6 𝑤4⁄ (7)
where 𝑉𝑚 is the maximum fluid velocity and w is the channel width. Particles tend to
migrate to several equilibrium positions as a result of the balance of the two lift
components. The inertial lift force has been used for particle manipulation, such as
focusing,32,33
ordering,34,35
and separation36-38
.
Fig. 1.2. Schematic illustration of the inertial lift forces (a) and viscoelastic lift force (b)
in the half cross-section of a straight channel. In the inertial case, the background color
indicates the shear rate distribution (the redder color indicating the higher magnitude).
The green arrows indicate the wall lift force, and the blue arrows indicate the shear
gradient lift force. In the viscoelastic case, the background color indicates the first normal
stress difference distribution (the redder indicating the higher magnitude), and the red
arrows represent the viscoelastic lift force.

9
In non-Newtonian fluids, the viscoelastic and shear thinning effects also
contribute to the particle migration. For viscoelastic fluid, the particle migration results
from the non-uniform normal stress differences.39
In a straight rectangular channel, τ11,
τ22, and τ33 are the normal stresses in the translational direction, velocity gradient
direction and rotational direction respectively. The first normal stress difference N1 is
defined as τ11 - τ22 and the second normal stress difference N2 is defined as τ22 – τ33.
Generally N1 is much larger than N2 in viscoelastic fluids with a constant shear
viscosity.40
In Fig. 2 (b), the distribution of N1 is calculated based on a widely used non-
Newtonian constitutive model, Oldroyd-B model, by COMSOL. The elastic lift force 𝐅𝑒𝐿
is given by,41,42
𝐅𝑒𝐿~𝑑3∇𝐍1 (8)
which drives the particle towards low first normal stress difference regions, i.e., the
channel corner and the center regions. In contrast, the shear thinning effect is found to
suppress the viscoelastic lift and push particles away from the center region.43
A very small number of works have paid attention to the viscoelastic particle
transport phenomena. Particle focusing was achieved by the combined viscoelastic and
inertial effects, which eliminate the viscoelastic equilibrium positions at corners.44,45
Particle separations were demonstrated in very few recent studies. Yang et al.9
successfully separated fresh red blood cells from rigid ones and particles in viscoelastic
fluid based on deformability. Nam et al.10
and Kang et al.44
showed size-based particle
separations from a sheath flow-focused particle mixture solution near the walls. But a

10
comprehensive understanding of the viscoelastic particle focusing and separation in
straight rectangular channels is still lacking.
1.3 Overview of dissertation
This dissertation consists of nine chapters and is organized as follows. The first
chapter is an introduction. The next three chapters focus on the electric field-driven
particle and fluid motions. Chapter 2 presents the experimental work of an unexpected
particle oscillation in viscoelastic fluids through a microchannel constriction for particles
that move along with the fluid flow. Several parameters are tested in the experiment to
further explore this oscillatory motion, such as the electric field magnitude, particle size
and fluid elasticity. Then the particle charge effect is studied for particles that move
against the fluid flow in Chapter 3, in which different transport phenomena are expected
between Newtonian and non-Newtonian fluids. For a better understanding of the
electrokinetic particle transport in viscoelastic fluids, Chapter 4 studies the viscoelastic
effect on electroosmosis experimentally and numerically in the constricted channel by
tracking small fluorescent particles. The flow field may be affected by the viscoelastic
effect, which may contribute to the significantly different particle motions between
Newtonian and non-Newtonian fluids as stated in the preceding two chapters. The
following four chapters study the particle transport in pressure driven flows. The particle
size effect is first studied in Chapter 5 by focusing all particles via sheath flow to let them
start from the same lateral position. A continuous size-based separation is achieved that
we call elasto-inertial pinched flow fractionation (eiPFF). This separation is found to be

11
affected by the flow rate, polymer concentration and channel aspect ratio significantly.
Inspired by them, it is more intriguing to study the lateral motions of particles that are
initially distributed everywhere in the cross-section. And in turn it is also favorable to
understand the mechanism of the eiPFF. Thus, Chapter 6 presents the experimental and
numerical explorations of the elasto-inertial effect on particle equilibrium positions and
focusing in the sheath-free flow through rectangular microchannels. The predictions with
the Oldroyd-B and Giesekus models are compared qualitatively with the experimental
observations of the viscoelastic and shear thinning effects on particle motion in slit-like
microchannels. Moreover, another important characteristic, particle shape, also draws our
interests and is studied in the experiments of the following two chapters. The elasto-
inertial focusing is found to be a strong function of particle shape due to perhaps the
rotational motion of non-spherical particles in viscoelastic fluids. Chapter 7 presents the
shape-based separation via the eiPFF technique. In a more general condition without
sheath flow, Chapter 8 demonstrates the sheath-free shape-based separation of in
viscoelastic fluids. In chapter 9, we summarize the key contributions of this dissertation
and propose the future work.
As the studies in chapters 2, 3, 5, 7, and 8 have all been published, the exact
copies of the journal articles are used in this dissertation. Those in chapters 4 and 6 are
also written in the format of journal publications and will be submitted for review in the
near future.
References

12
1 P. S. Dittrich, A. Manz, Nature Reviews Drug Discovery 5(3), 210-8 (2006).
2 H. A. Stone, A. D. Stroock, A. Ajdari, Annu Rev Fluid Mech 36, 381-411 (2004).
3 C. J. Pipe, G. H. McKinley, Mech. Res. Commun. 36, 110−120 (2009).
4 C. L. Berli, Electrophoresis 34, 622−630 (2013).
5 C. Zhao, C. Yang, Adv. Colloid Interface Sci. 201, 94−108 (2013).
6 R. B. Bird, R. C. Armstrong, O. Hassager, Dynamics of Polymeric liquids, vol.1 (1977).
7 R. M. Bryce and M. R. Freeman, Phys. Rev. E 81, 036328 (2010).
8 R. M. Bryce and M. R. Freeman, Lab Chip 10, 1436-1441 (2010).
9 S. Yang, S. S. Lee, S. W. Ahn, K. Kang, W. Shim, G. Lee, K. Hyune, J. M. Kim, Soft
Matter 8, 5011−5019 (2012).
10 J. Nam, H. Lim, D. Kim, H. Jung, S. Shin, Lab Chip 12, 1347−1354 (2012).
11 D.J. Lee, H. Brenner, J.R. Youn, and Y.S. Song, Scientific reports 3 (2013).
12 P. Pakdel and G. H. McKinley, Physics of Fluids (1994-present), 10(5), 1058-1070
(1998).
13 R. J. Hunter, Zeta potential in colloid science: principles and applications, Academic
Press London, vol. 125, (1981).
14 J. G. Santiago, Analytical Chemistry 73(10), 2353-2365 (2001).
15 H. Morgan, N. G. Green, AC electrokinetic: colloids and nanoparticles, Research
Studies Press (2002).
16 D. J. Harrison, K. Fluri, K. Seiler, Z. Fan, C. S. Effenhauser, and A. Manz, SCIENCE-
NEW YORK THEN WASHINGTON- 261, 895-895 (1993).
17 A. T. Woolley and R. A. Mathies, Analytical chemistry 67(20), 3676-3680 (1995).

13
18 D. E. Raymond, A. Manz and H. M. Widmer, Analytical Chemistry 66(18), 2858-2865
(1994).
19 L. Kremser, D. Blaas and E. Kenndler, Electrophoresis 25(14), 2282–91 (2004).
20 P. R. Gascoyne and J. Vykoukal, Electrophoresis 23, 1973–83 (2002).
21 V. H. Perez-Gonzalez , V. Ho, L. Kulinsky, M. Madou and S. O. Martinez-Chapa, Lab
Chip 13, 4642–52 (2013).
22 R. Pethig, Biomicrofluidics 4, 022811 (2010).
23 Z. R. Gagnon, Electrophoresis 32, 2466–87 (2011).
24 J. Zhu, X. Xuan, Electrophoresis 30, 2668-2675 (2009).
25 J. DuBose, J. Zhu, S. Patel, X. Lu, N. Tupper, J. M. Stonaker, and X. Xuan, Journal of
Micromechanics and Microengineering 24, 115018 (2014).
26 J. DuBose, X. Lu, S. Patel, S. Qian, S. Joo, X. Xuan, Biomicrofluidics 8, 014101 (2014).
27 B. G. Hawkins, A. E. Smith, Y. A. Syed and B. J. Kirby, Anal. Chem. 79, 7291–300
(2007).
28 R. C. Gallo-Villanueva, N. M. Jesús-Pérez, J. I. Martínez-López, A. Pacheco and B. H.
Lapizco-Encinas, Microfluid. Nanofluid. 10, 1305–15 (2011).
29 G. Segre and A. Silberberg, J. Fluid Mech. 14 (1962).
30 J. P. Matas, J. F. Morris, and E. Guazzelli, Oil & gas science and technology 59(1), 59-
70 (2004).
31 D. D. Carlo, J. F. Edd, K. J. Humphry, H. A. Stone, and M.Toner, Phys. Rev. Lett. 102,
094503, (2009).
32 B. Chun and A. J. C. Ladd, Physics of Fluids (1994-present) 18(3), 031704 (2006).

14
33 J. Zhou and I. Papautsky, Lab on a Chip 13(6), 1121-1132 (2013).
34 S. C. Hur, H. T. K. Tse, and D. Di Carlo, Lab on a Chip 10(3), 274-280 (2010).
35 D. D. Carlo, D. Irimia, R. G. Tompkins, and M. Toner, Proceedings of the National
Academy of Sciences 104(48), 18892-18897 (2007).
36 J. Hansson, J. M. Karlsson, T. Haraldsson, H. Brismar, W. van der Wijngaart, and A.
Russom, Lab on a Chip, 12(22), 4644-4650 (2012).
37 J. Zhou, P.V. Giridhar, S. Kasper, and I. Papautsky, Lab on a Chip 13(10), 1919-1929
(2013).
38 X. Lu and X. Xuan, Analytical chemistry 87(8), 4560-4565 (2015).
39 B. P. Ho and L. G. Leal, Journal of Fluid Mechanics 76(4), 783-799 (1976).
40 J. A. Pathak, D. Ross, and K. B. Migler, Physics of Fluids (1994-present) 16(11), 4028-
4034 (2004).
41 M. A. Tehrani, Journal of Rheology (1978-present) 40(6), 1057-77 (1996).
42 S. Yang, J. Y. Kim, S. J. Lee, S. S. Lee, and J. M. Kim, Lab on a Chip 11(2), 266-273
(2011).
43 G. Li, G. H. McKinley, and A. M. Ardekani, Journal of Fluid Mechanics 785,486-505
(2015).
44 K. Kang, S.S. Lee, K. Hyun, S.J. Lee, and J.M. Kim, Nature communications, 4 (2013).
45 E. J. Lim, T. J. Ober, J. F. Edd, S. P. Desai, D. Neal, K. W. Bong, P. S. Doyle, G. H.
McKinley, and M. Toner, Nature communications 5 (2014).

15
CHAPTER TWO
AN UNEXPECTED PARTICLE OSCILLATION FOR ELECTROPHORESIS IN
VISCOELASTIC FLUIDS THROUGH A MICROCHANNEL CONSTRICTION
Abstract
Electrophoresis plays an important role in many applications, which, however,
has so far been extensively studied in Newtonian fluids only. This work presents the first
experimental investigation of particle electrophoresis in viscoelastic polyethylene oxide
(PEO) solutions through a microchannel constriction under pure DC electric fields. An
oscillatory particle motion is observed in the constriction region, which is distinctly
different from the particle behavior in a polymer-free Newtonian fluid. This stream-wise
particle oscillation continues until a sufficient number of particles form a chain to pass
through the constriction completely. It is speculated that such an unexpected particle
oscillating phenomenon is a consequence of the competition between electrokinetic force
and viscoelastic force induced in the constriction. The electric field magnitude, particle
size, and PEO concentration are all found to positively affect this viscoelasticity-related
particle oscillation due to their respective influences on the two forces.
2.1 Introduction
Electrophoresis plays an important role in many applications such as capillary
electrophoresis and electrokinetic micro/nanofluidics etc.1 It is the motion of a charged
particle with respect to a suspending fluid under the application of an electric field. The
fluid can be either infinite for which particle electrophoresis resembles particle

16
sedimentation in a stationary fluid, or confined in a channel where particle
electrophoresis is almost always accompanied by fluid electroosmosis.2 While particle
electrophoresis in both cases has been extensively investigated in the past, the majority of
these studies concern only Newtonian fluids.3 Due to the shear-rate-independent viscosity
of these fluids, electrophoresis and electroosmosis are both a linear function of the
applied electric field and the surface charge (or zeta potential) of the particle/channel.4
However, many of the fluids used in capillary electrophoresis and microfluidic devices
are polymer solutions5-8
and biofluids9-12
which are complex. They often possess a shear-
rate-dependent viscosity and may even exhibit elastic or plastic effects.13-16
Consequently, electrophoresis in and electroosmosis of these non-Newtonian fluids could
be significantly different from those with Newtonian fluids.17-19
A number of theoretical (including numerical) studies have been recently reported
on electroosmosis of non-Newtonian fluids whose rheology is characterized by various
constitutive equations, including the power-law,20-30
Phan-Thien-Tanner (PTT),31-36
Carreau,37-39
Oldroyd-B (including Upper-Convected Maxwell, UCM34
)40
models and
others.41-43
Nonlinear relations are obtained for the electroosmotic velocity as a function
of the electric field and zeta potential. Also, the electrophoretic motion of particles in
non-Newtonian fluids has been numerically predicted by Hsu and co-workers with a
Carreau model.44-51
The fluid shear-thinning effect is found to increase the particle
mobility significantly as compared to that in a Newtonian fluid. Recently, Khair et al.52
presented a theoretical scheme to calculate the electrophoretic motion of particles of any
shape in fluids with a shear-rate-dependent viscosity. They demonstrated a shape and size
17
dependence of particle electrophoresis due to the non-Newtonian rheology, which is
markedly different from that in Newtonian fluids.53
To date, however, very little experimental work has been done on electroosmosis
of and electrophoresis in non-Newtonian fluids. Chang and Tsao54
observed a significant
drag reduction in electroosmotic flow of polymer solutions, which increases with the
ratio of the polymer size to the electric double layer thickness. Bryce and Freeman55
demonstrated that the flow velocity of standard electroosmotic pumping is sufficient to
excite extensional instabilities in dilute polymer solutions through a 2:1 microchannel
constriction. Interestingly, they found later that these instabilities actually reduce the fluid
mixing relative to that in polymer-free fluids.56
Inspired by the work from Bryce and
Freeman,55,56
we conducted an experimental study of particle electrophoresis in
viscoelastic polymer solutions through a microchannel constriction. An unexpected
particle oscillation was observed, which was found to vary with the applied electric field,
particle size, and polymer concentration. This article presents these experimental results
along with our attempted explanation of the particle oscillating phenomenon.
2.2 Experiment
2.2.1 Preparation of non-Newtonian fluids and particle suspensions
Non-Newtonian fluids were prepared by dissolving Poly(ethylene oxide) (PEO)
powder (average molecular weight is 4106 Da, Sigma-Aldrich USA) into 1 mM
phosphate buffer. Four concentrations of PEO were used in our experiment, 50 ppm (i.e.,
dissolving 50 mg of PEO powder into 1 litre of buffer), 100 ppm, 200 ppm, 500 ppm,
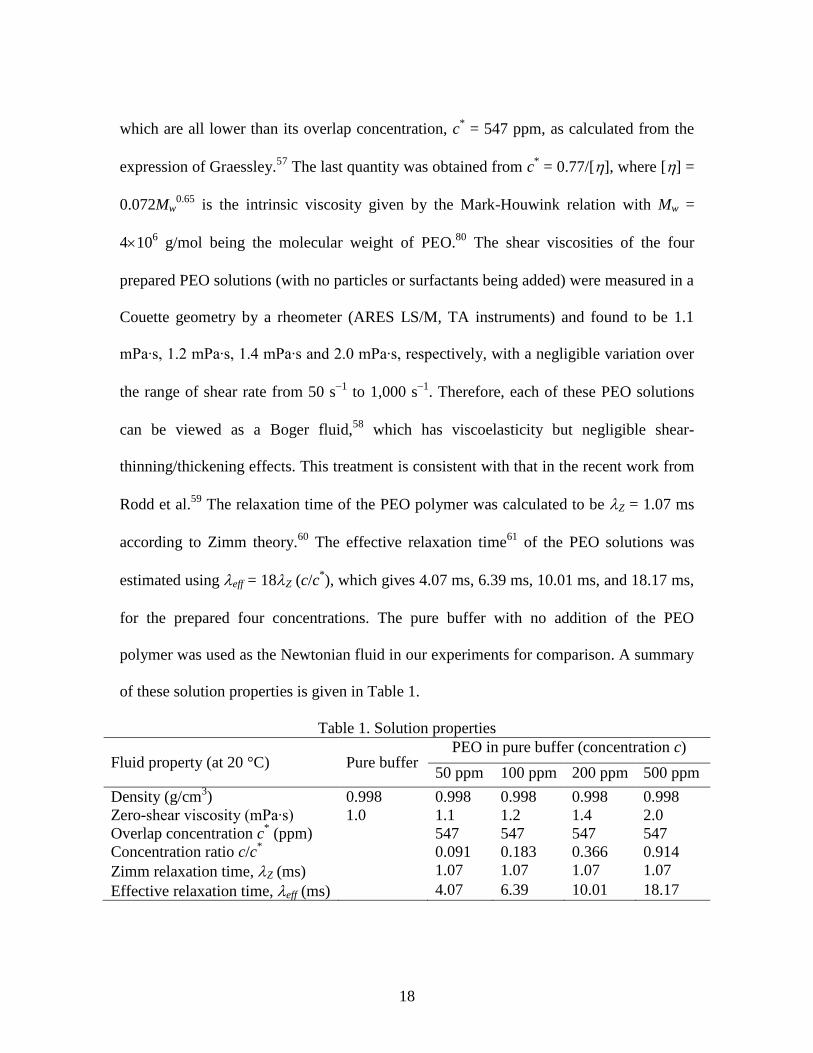
18
which are all lower than its overlap concentration, c* = 547 ppm, as calculated from the
expression of Graessley.57
The last quantity was obtained from c* = 0.77/[], where [] =
0.072Mw0.65
is the intrinsic viscosity given by the Mark-Houwink relation with Mw =
4106 g/mol being the molecular weight of PEO.
80 The shear viscosities of the four
prepared PEO solutions (with no particles or surfactants being added) were measured in a
Couette geometry by a rheometer (ARES LS/M, TA instruments) and found to be 1.1
mPa∙s, 1.2 mPa∙s, 1.4 mPa∙s and 2.0 mPa∙s, respectively, with a negligible variation over
the range of shear rate from 50 s1
to 1,000 s1
. Therefore, each of these PEO solutions
can be viewed as a Boger fluid,58
which has viscoelasticity but negligible shear-
thinning/thickening effects. This treatment is consistent with that in the recent work from
Rodd et al.59
The relaxation time of the PEO polymer was calculated to be Z = 1.07 ms
according to Zimm theory.60
The effective relaxation time61
of the PEO solutions was
estimated using eff = 18Z (c/c*), which gives 4.07 ms, 6.39 ms, 10.01 ms, and 18.17 ms,
for the prepared four concentrations. The pure buffer with no addition of the PEO
polymer was used as the Newtonian fluid in our experiments for comparison. A summary
of these solution properties is given in Table 1.
Table 1. Solution properties
Fluid property (at 20 °C) Pure buffer PEO in pure buffer (concentration c)
50 ppm 100 ppm 200 ppm 500 ppm
Density (g/cm3) 0.998 0.998 0.998 0.998 0.998
Zero-shear viscosity (mPa∙s) 1.0 1.1 1.2 1.4 2.0
Overlap concentration c* (ppm) 547 547 547 547
Concentration ratio c/c* 0.091 0.183 0.366 0.914
Zimm relaxation time, Z (ms) 1.07 1.07 1.07 1.07
Effective relaxation time, eff (ms) 4.07 6.39 10.01 18.17
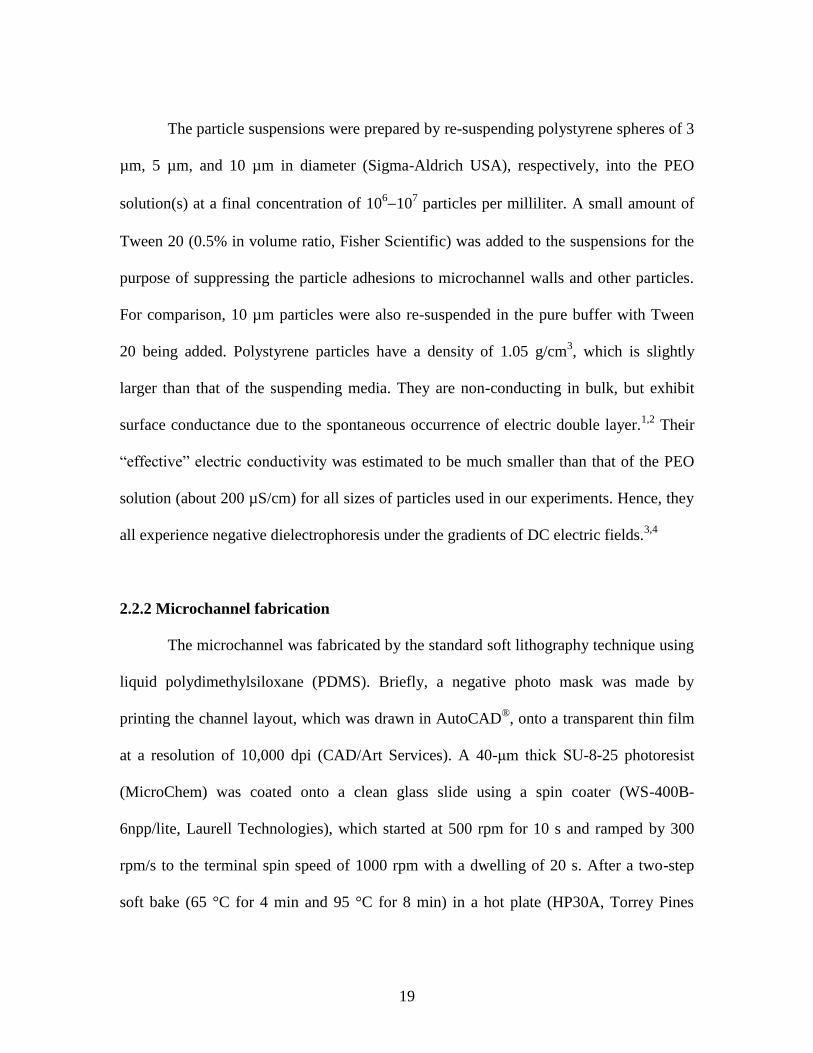
19
The particle suspensions were prepared by re-suspending polystyrene spheres of 3
µm, 5 µm, and 10 µm in diameter (Sigma-Aldrich USA), respectively, into the PEO
solution(s) at a final concentration of 10610
7 particles per milliliter. A small amount of
Tween 20 (0.5% in volume ratio, Fisher Scientific) was added to the suspensions for the
purpose of suppressing the particle adhesions to microchannel walls and other particles.
For comparison, 10 µm particles were also re-suspended in the pure buffer with Tween
20 being added. Polystyrene particles have a density of 1.05 g/cm3, which is slightly
larger than that of the suspending media. They are non-conducting in bulk, but exhibit
surface conductance due to the spontaneous occurrence of electric double layer.1,2
Their
“effective” electric conductivity was estimated to be much smaller than that of the PEO
solution (about 200 µS/cm) for all sizes of particles used in our experiments. Hence, they
all experience negative dielectrophoresis under the gradients of DC electric fields.3,4
2.2.2 Microchannel fabrication
The microchannel was fabricated by the standard soft lithography technique using
liquid polydimethylsiloxane (PDMS). Briefly, a negative photo mask was made by
printing the channel layout, which was drawn in AutoCAD®, onto a transparent thin film
at a resolution of 10,000 dpi (CAD/Art Services). A 40-μm thick SU-8-25 photoresist
(MicroChem) was coated onto a clean glass slide using a spin coater (WS-400B-
6npp/lite, Laurell Technologies), which started at 500 rpm for 10 s and ramped by 300
rpm/s to the terminal spin speed of 1000 rpm with a dwelling of 20 s. After a two-step
soft bake (65 °C for 4 min and 95 °C for 8 min) in a hot plate (HP30A, Torrey Pines
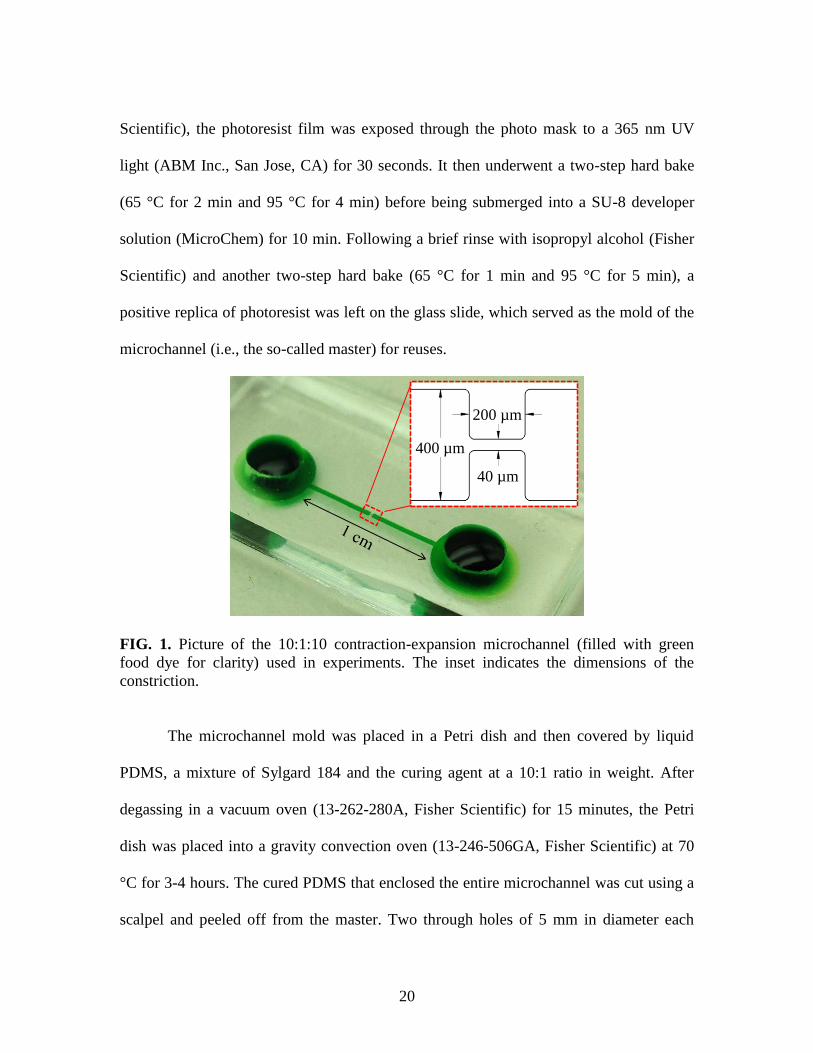
20
Scientific), the photoresist film was exposed through the photo mask to a 365 nm UV
light (ABM Inc., San Jose, CA) for 30 seconds. It then underwent a two-step hard bake
(65 °C for 2 min and 95 °C for 4 min) before being submerged into a SU-8 developer
solution (MicroChem) for 10 min. Following a brief rinse with isopropyl alcohol (Fisher
Scientific) and another two-step hard bake (65 °C for 1 min and 95 °C for 5 min), a
positive replica of photoresist was left on the glass slide, which served as the mold of the
microchannel (i.e., the so-called master) for reuses.
FIG. 1. Picture of the 10:1:10 contraction-expansion microchannel (filled with green
food dye for clarity) used in experiments. The inset indicates the dimensions of the
constriction.
The microchannel mold was placed in a Petri dish and then covered by liquid
PDMS, a mixture of Sylgard 184 and the curing agent at a 10:1 ratio in weight. After
degassing in a vacuum oven (13-262-280A, Fisher Scientific) for 15 minutes, the Petri
dish was placed into a gravity convection oven (13-246-506GA, Fisher Scientific) at 70
°C for 3-4 hours. The cured PDMS that enclosed the entire microchannel was cut using a
scalpel and peeled off from the master. Two through holes of 5 mm in diameter each
200 µm
400 µm
40 µm

21
were made as reservoirs in the pre-defined circles at microchannel ends using a metal
punch. Immediately following a plasma treating for 1 min (PDC-32G, Harrick Scientific),
the channel side of the PDMS slab was irreversibly bonded to a clean glass slide. A drop
of the working solution (with no particles suspended) was loaded into one of the
reservoirs, which was found to fill the entire microchannel automatically by capillary
force and used to maintain the channel walls hydrophilic. A picture of the fabricated
PDMS/glass microchannel is shown in FIG. 1. It is 400 μm wide and 1 cm long with a
uniform depth of 40 μm. It has a 40 μm wide constriction in the middle with a length of
200 μm.
2.2.3 Experimental technique
The electrokinetic motion of particles in the microchannel was induced by
applying a DC electric field across the channel, which was supplied by a function
generator (33220A, Agilent Technologies) in conjunction with a high-voltage amplifier
(609E-6, Trek). The electric field was kept no more than 500 V/cm in order to minimize
Joule heating effects.62,63
The pressure-driven motion of particles was eliminated by
balancing the liquid heights in the end reservoirs prior to each test. Particle motions were
visualized through an inverted microscope (Nikon Eclipse TE2000U, Nikon Instruments)
with a CCD camera (Nikon DS-Qi1Mc) at a rate of 15 frames per second. The obtained
digital images were post-processed using the Nikon imaging software (NIS-Elements AR
2.30). Particle velocity was determined through dividing the particle travelling distance
by the corresponding time interval. The error in reading the pixel number of the particle

22
center was around 1 µm, and the error in the measured particle velocity was estimated to
be around 30 µm/s. Particle streak images were obtained by superimposing a sequence of
around 150 images.
2.3 Results and discussion
2.3.1 Comparison of particle electrophoresis in Newtonian and non-Newtonian
fluids
FIG. 2. Sequential images demonstrating the difference of 10 µm particle electrophoresis
in (a) (enhanced) Newtonian (1mM buffer) and (b) (enhanced) non-Newtonian (500 ppm
PEO in 1 mM buffer) fluids through the microchannel constriction under an average DC
electric field of 200 V/cm. The particles under track are highlighted by a circle (for
singles) or an ellipse (for doubles) for a better illustration, where the thin arrows indicate
the particle moving directions at the time instants labeled on the images. The block
arrows indicate the overall moving directions of the fluids and particles in the channel.
t = 0s 0.04s 0.09s 0.15s(a)
t = 0s 0.11s 0.21s 0.27s
0.38s 0.43s 0.53s 0.58s
(b)
100 µm
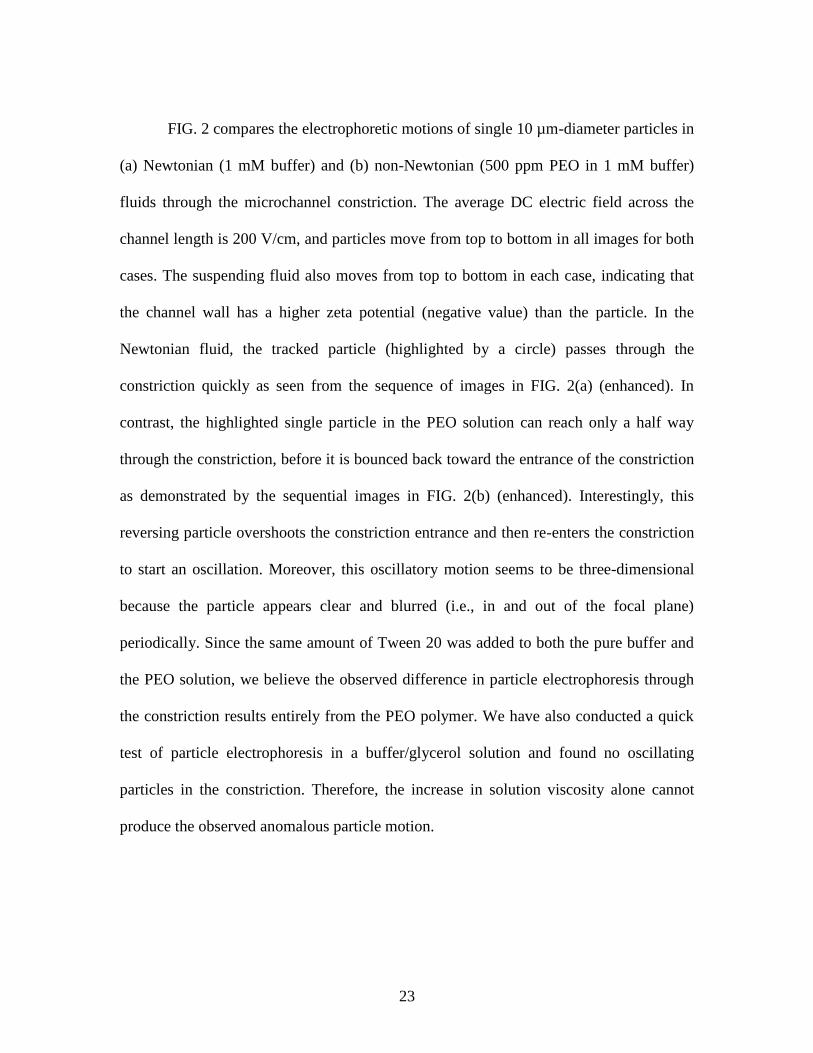
23
FIG. 2 compares the electrophoretic motions of single 10 µm-diameter particles in
(a) Newtonian (1 mM buffer) and (b) non-Newtonian (500 ppm PEO in 1 mM buffer)
fluids through the microchannel constriction. The average DC electric field across the
channel length is 200 V/cm, and particles move from top to bottom in all images for both
cases. The suspending fluid also moves from top to bottom in each case, indicating that
the channel wall has a higher zeta potential (negative value) than the particle. In the
Newtonian fluid, the tracked particle (highlighted by a circle) passes through the
constriction quickly as seen from the sequence of images in FIG. 2(a) (enhanced). In
contrast, the highlighted single particle in the PEO solution can reach only a half way
through the constriction, before it is bounced back toward the entrance of the constriction
as demonstrated by the sequential images in FIG. 2(b) (enhanced). Interestingly, this
reversing particle overshoots the constriction entrance and then re-enters the constriction
to start an oscillation. Moreover, this oscillatory motion seems to be three-dimensional
because the particle appears clear and blurred (i.e., in and out of the focal plane)
periodically. Since the same amount of Tween 20 was added to both the pure buffer and
the PEO solution, we believe the observed difference in particle electrophoresis through
the constriction results entirely from the PEO polymer. We have also conducted a quick
test of particle electrophoresis in a buffer/glycerol solution and found no oscillating
particles in the constriction. Therefore, the increase in solution viscosity alone cannot
produce the observed anomalous particle motion.

24
FIG. 3. Comparison of the transient axial velocities of the single particles tracked in the
Newtonian and non-Newtonian fluids (see FIG. 2) through the microchannel constriction.
Note that the times greater than 0 s correspond to those labeled in FIG. 2 for each fluid.
The dashed-dotted line indicates a zero particle velocity.
These distinguished particle electrophoresis behaviors in the two types of
suspending fluids can be better identified in FIG. 3, where the transient axial velocities of
the two tracked particles in FIG. 2 are compared against time. The time instants greater
than 0 s correspond exactly to those labeled on the images of FIG. 2. The time instants
smaller than 0 s are included to compare the particle velocities in the two fluids distant
from the constriction. The particle in the Newtonian fluid moves at an axial velocity of
about 490 µm/s before approaching the constriction, which is more than 5 times larger
than that of 85 µm/s for the particle in the non-Newtonian fluid. The Reynolds number
based on the particle velocity was thus estimated to be around 0.04 and 3.4103
in these
two fluids. In the constriction region, the particle in the Newtonian fluid experiences an
-1.0
-0.5
0.0
0.5
1.0
1.5
2.0
2.5
-0.5 0 0.5 1 1.5 2
Part
icle
vel
oci
ty (
mm
/s)
Time (s)
500 ppm PEO
Newtonian

25
apparent acceleration followed by a nearly symmetric deceleration, which is consistent
with our earlier study.64
In contrast, the particle in the non-Newtonian fluid undergoes an
oscillation with an approximate period of 0.5 s and a maximum speed of about 550 µm/s
in both the forward and the backward directions. Using this particle velocity, Vp, we
estimated the Weissenberg number (De = 2effVp/w with eff and w being the effective
relaxation time, see Table 1, and constriction width, respectively) or equivalently the
Deborah number inside the constriction to be around 0.5.
FIG. 4. Tracked center position vs. time for oscillating 10 µm particle chains with
various lengths (i.e., the number of particles in the chain) in 500 ppm PEO solution
through the microchannel constriction. The average DC electric field is 200 V/cm across
the channel length. The shaded zone represents the span of the constriction from 0 to 200
µm.
Single particles in the PEO solution oscillate in the microchannel constriction and
are unable to pass through. They can easily get attached to each other forming a particle
chain; for example, FIG. 2(b) shows an oscillating two-particle chain (highlighted by a
-100
-50
0
50
100
150
0 0.5 1 1.5 2
Parti
cle
cha
in c
ente
r (μ
m)
Time (s)
1 particle 2 particles 4 particles
Upstream
Contraction

26
dashed ellipse) in the constriction. The particle chain still oscillates inside the constriction
until its length (i.e., the number of particles in the chain) exceeds a certain threshold
value. This threshold appears to be a function of electric field and particle size etc., which
will be revisited in the parametric study below (see Section C). The oscillating patterns of
particle chains with various lengths are demonstrated in FIG. 4 in the form of their center
position vs. time. The oscillating amplitude increases with the number of particles in the
chain, and so longer chains tend to move through the constriction with a larger
probability. We observed that 10 µm particles can escape from the constriction when a
chain of more than 3 particles is formed in 500 ppm PEO solution under the 200 V/cm
DC electric field. In addition, the oscillating frequency is found to decrease when the
length of the particle chain increases.
2.3.2 Attempted explanation of the observed particle oscillation in the non-
Newtonian fluid
FIG. 5. Schematic illustration of the speculated mechanism for particle oscillation in
electrophoresis through a microchannel constriction with a viscoelastic fluid. The
background color indicates the electric field contour (the darker the larger magnitude).
FVE FEK

27
Anomalous particle motion has been reported in particle sedimentation or rise
(e.g., drops and bubbles that are lighter than the fluid) through still viscoelastic fluids,65-68
which is attributed to either the evolution of a negative wake downstream of the
particle,69-73
or the formation and breakup of flow-induced structures due to the stress-
induced instability.74-78
The precise mechanism for the particle oscillating phenomenon
observed in the PEO solution through the microchannel constriction is currently unknown
and deserves intensive future investigations. We speculate that it may be explained using
the competition of two forces present in the constriction region as schematically shown in
FIG. 5. One is the driving force for the observed electrokinetic particle motion in the
microchannel, FEK, which is a combination of fluid electroosmosis, particle
electrophoresis and dielectrophoresis, and varies with position in the constriction
region.64
Note that the dielectrophoretic component becomes negligible inside the
constriction due to the locally uniform electric field64
). The other force occurs in the
constriction region due to fluid viscoelastic effects (e.g., the flow-induced structures76-78
),
FVE, which resists the fluid shape change (both fluid squeezing and stretching) and hence
acts to impede the electrokinetic particle motion. In the Newtonian fluid, FVE = 0 and so
FEK dominates the particle motion, leading to acceleration and deceleration at the
entrance and exit of the constriction. In the non-Newtonian fluid, FVE increases due to the
stretch of PEO polymers around the particle when the particle moves along the
constriction. Once FVE exceeds FEK, the particle motion is reversed and the particle is
bounced back towards the constriction entrance. With FVE being decreased during the
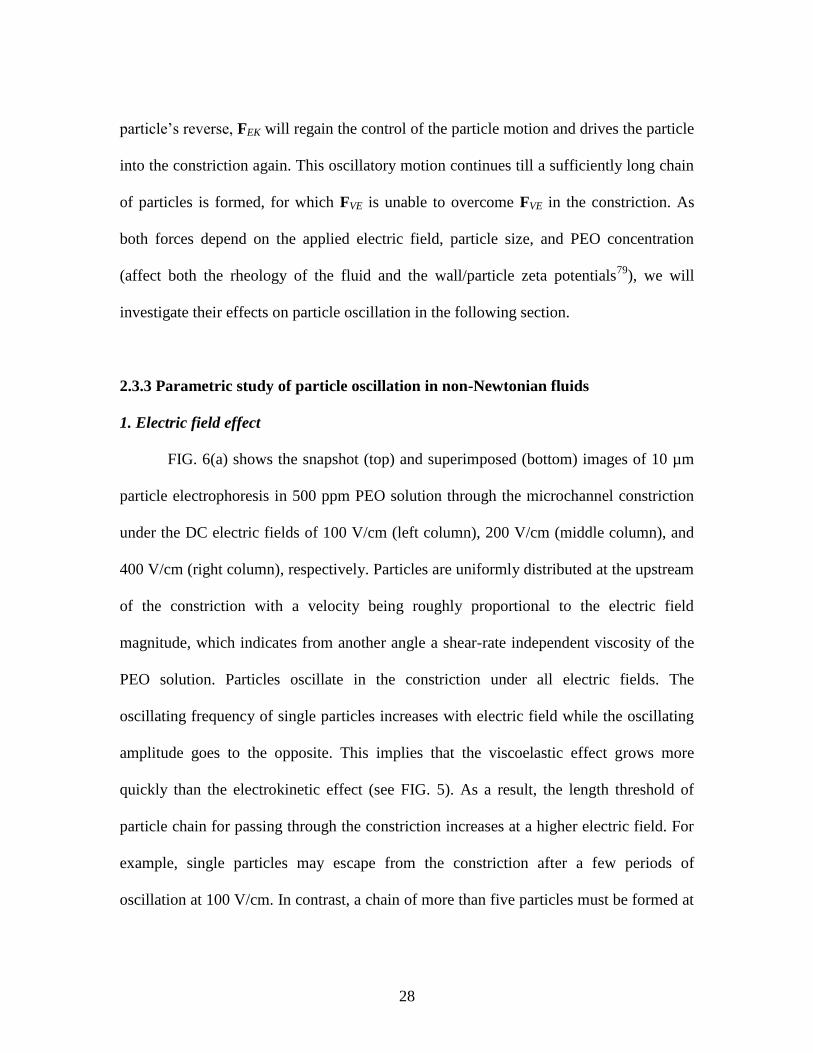
28
particle’s reverse, FEK will regain the control of the particle motion and drives the particle
into the constriction again. This oscillatory motion continues till a sufficiently long chain
of particles is formed, for which FVE is unable to overcome FVE in the constriction. As
both forces depend on the applied electric field, particle size, and PEO concentration
(affect both the rheology of the fluid and the wall/particle zeta potentials79
), we will
investigate their effects on particle oscillation in the following section.
2.3.3 Parametric study of particle oscillation in non-Newtonian fluids
1. Electric field effect
FIG. 6(a) shows the snapshot (top) and superimposed (bottom) images of 10 µm
particle electrophoresis in 500 ppm PEO solution through the microchannel constriction
under the DC electric fields of 100 V/cm (left column), 200 V/cm (middle column), and
400 V/cm (right column), respectively. Particles are uniformly distributed at the upstream
of the constriction with a velocity being roughly proportional to the electric field
magnitude, which indicates from another angle a shear-rate independent viscosity of the
PEO solution. Particles oscillate in the constriction under all electric fields. The
oscillating frequency of single particles increases with electric field while the oscillating
amplitude goes to the opposite. This implies that the viscoelastic effect grows more
quickly than the electrokinetic effect (see FIG. 5). As a result, the length threshold of
particle chain for passing through the constriction increases at a higher electric field. For
example, single particles may escape from the constriction after a few periods of
oscillation at 100 V/cm. In contrast, a chain of more than five particles must be formed at
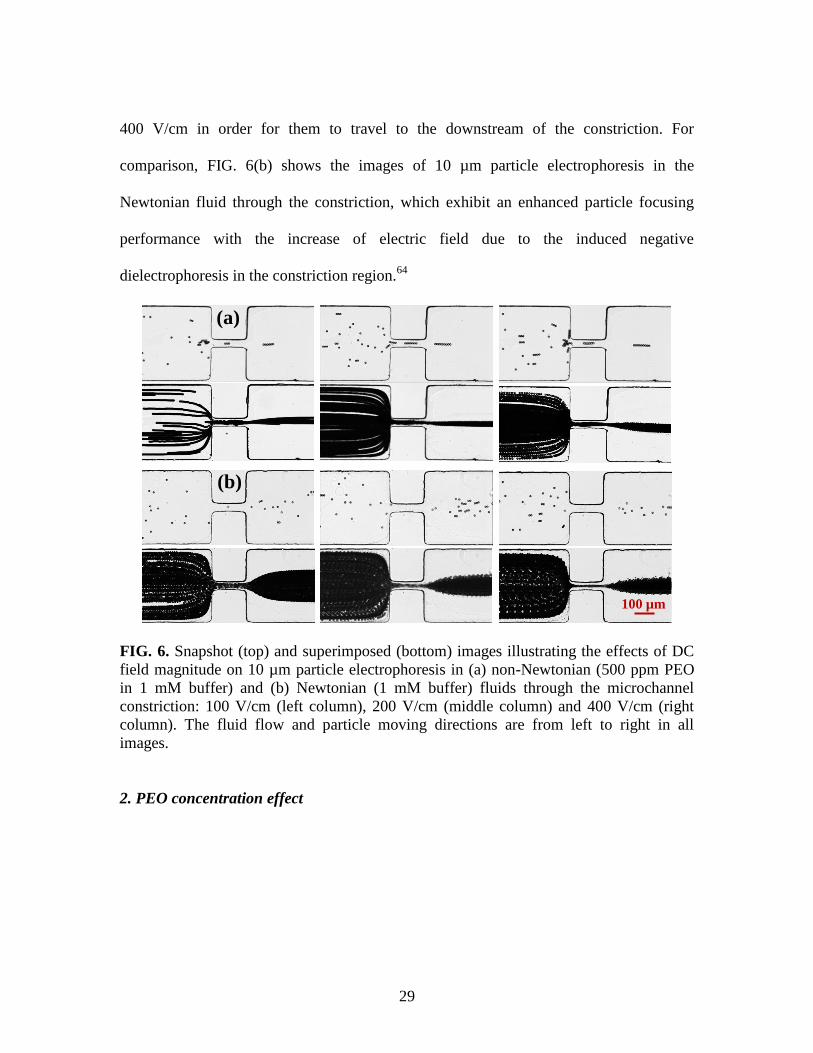
29
400 V/cm in order for them to travel to the downstream of the constriction. For
comparison, FIG. 6(b) shows the images of 10 µm particle electrophoresis in the
Newtonian fluid through the constriction, which exhibit an enhanced particle focusing
performance with the increase of electric field due to the induced negative
dielectrophoresis in the constriction region.64
FIG. 6. Snapshot (top) and superimposed (bottom) images illustrating the effects of DC
field magnitude on 10 µm particle electrophoresis in (a) non-Newtonian (500 ppm PEO
in 1 mM buffer) and (b) Newtonian (1 mM buffer) fluids through the microchannel
constriction: 100 V/cm (left column), 200 V/cm (middle column) and 400 V/cm (right
column). The fluid flow and particle moving directions are from left to right in all
images.
2. PEO concentration effect
(a)
100 µm
(b)

30
FIG. 7. Effects of PEO concentration (50, 100, 200 and 500 ppm) on the oscillation of
single 10 µm particles in the microchannel constriction under 100 V/cm DC electric field.
The shaded zone represents the span of the constriction from 0 to 200 µm.
FIG. 7 shows the effects of PEO concentration on the oscillation of single 10 µm
particles in the microchannel constriction under a 100 V/cm DC field. The variation of
particle position before time 0 (at which the tracked particle enters into the constriction)
indicates that particle velocity decreases with the increase of PEO concentration. In 50
ppm PEO solution, the particle exhibits a similar behavior to that in the Newtonian fluid,
and passes through the constriction without any complication. When the PEO
concentration increases to 100 ppm, weak oscillatory motions are observed where some
particles pass in a short chain while others can do so in singles after few oscillations in
the constriction. For example, the tracked single particle in 100 ppm PEO solution in
FIG. 7 escaped from the constriction after one oscillation only. With the further increase
of PEO concentration to 200 ppm and 500 ppm, particle oscillations become robust and
-100
-50
0
50
100
150
200
250
-1 0 1 2 3 4
Part
icle
posi
tion
(μ
m)
Time (s)
50 ppm
100 ppm
200 ppm
500 ppm
Upstream
Downstream
Contraction

31
stable with an increased frequency while a reduced amplitude as seen from FIG. 7.
Moreover, longer chains must be formed in order for the particles to move through the
constriction. These observations are apparently a consequence of the enhanced
viscoelastic effects with the increasing PEO concentration.
3. Particle size effect
FIG. 8. Effects of particle size (3, 5 and 10 µm in diameter) on the oscillation of single
particles in 200 ppm PEO solution in the microchannel constriction under a 200 V/cm
DC electric field. The shaded zone represents the span of the constriction from 0 to 200
µm.
FIG. 8 compares the oscillation of single particles of 3 µm, 5 µm, and 10 µm in
diameter in 200 ppm PEO solution in the microchannel constriction under a DC electric
field of 200 V/cm. These particles move at a similar velocity before the constriction as
seen from the nearly overlapping profiles of particle position vs. time in the range of 0.5
-100
-50
0
50
100
150
200
-0.5 0 0.5 1 1.5 2 2.5
Part
icle
posi
tion
(μ
m)
Time (s)
3 um 5 um 10 um
Upstream
Contraction

32
s to 0 s. They all undertake oscillations in the constriction. However, larger particles
oscillate faster (i.e., with a higher oscillating frequency) with a smaller amplitude.
Moreover, analogous to the effects of electric field (see FIG. 6) and PEO concentration
(see FIG. 7) that we presented above, larger particles need to form a longer chain in order
to pass through the constriction under the same electric field. Therefore, the viscoelastic
force (see FIG. 5) increases with particle size because larger particles cause greater
distortions to the suspending viscoelastic fluid than smaller ones do. This also implies
that particles with a size smaller than a threshold value may not exhibit the oscillating
phenomenon any more, which will be studied in our future work.
2.4 Conclusions
We have conducted an experimental study of the DC electrophoretic motion of
particles in viscoelastic PEO solutions through a microchannel constriction. In distinct
contrast with the particle electrophoresis in a polymer-free Newtonian fluid, particles in a
dilute PEO solution are found to bounce backward halfway in the constriction and
bounced again towards downstream at the constriction entrance. Such a stream-wise
oscillatory particle motion continues and remains inside the constriction until a sufficient
number of particles are attached to form a chain for them to escape. The exact mechanism
behind this oscillating phenomenon is currently unclear to us, which is speculated to arise
from the competition of a viscoelastic force that is induced in the constriction due to, for
example, the flow-induced structures76-78
and an electrokinetic force. We have also
examined the effects of the electric field magnitude, particle size and PEO concentration
33
on the particle oscillation. The increase of either of these parameters can make it more
difficult for particles to pass through the constriction. Our future work will find out how
the geometry of the constriction may affect the particle electrophoresis in non-Newtonian
fluids.
Acknowledgements
This work was supported in part by NSF under grants CBET-0853873 (Xuan) and
DMS-1319078 (Qian), and by National Research Foundation of Korea under grant 2011-
0014246 (Joo).
References
1 D. Li, Electrokinetics in microfluidics, Elsevier Academic Press, Burlington, MA
(2004).
2 H. C., Chang and L. Y. Yeo, Electrokinetically Driven Microfluidics and Nanofluidics,
Cambridge University Press, New York (2010).
3 S. Qian and Y. Ai Electrokinetic Particle Transport in Micro/Nanofluidics: Direct
Numerical Simulation Analysis, CRC Press (2012).
4 B. J. Kirby, Micro- and Nanoscale Fluid Mechanics: Transport in Microfluidic Devices,
Cambridge University Press (2010).
5 A. Groisman, M. Enzelberger, and S. Quake, Science 300, 955–958 (2003).
6 Y. C. Lam,H. Y. Gan, N. T. Nguyen, and H. Lie, Biomicrofluidics 3, 014106 (2009).
7 K. E. Jensen, P. Szabo, F. Okkels, and M. A. Alves, Biomicrofluidics 6, 044112 (2012).
34
8 D. L. Lee, H. Brenner, J. R. Youn, Y. S. Song, Scientific Reports 3, article number
3258. DOI: 10.1038/srep03258 (2013).
9 O. L. Hemmingera, P. E. Boukany, S. Q. Wang, and L.J. Lee, J. Non-Newton. Fluid
Mech. 165, 1613-1624 (2010).
10 P. C. Sousa, F. T. Pinho, M. S. N. Oliveira, and M. A. Alves, Biomicrofluidics 5,
014108 (2011).
11 K. Kang, S. S. Lee, K. Hyun, S. J. Lee, and J. M. Kim, Nature Communicat. 4, article
number 2567. doi:10.1038/ncomms3567 (2013).
12 Y. J. Kang and S. J. Lee, Biomicrofluidics 7, 054122 (2013).
13 R. B. Bird, R. C. Armstrong, O. Hassager, Dynamics of Polymeric liquids, vol.1 (1977).
14 C. J. Pipe and G. H. McKinley, Mech. Research Communicat. 36, 110-120 (2009).
15 X. Hu, P. E. Boukany, O. L. Hemminger, L. J. Lee, Macromol. Mater. Eng. 296, 308-
320 (2011).
16 A. Karimi, S. Yazdi, and A. M. Ardekani, Biomicrofluidics 7, 021501 (2013).
17 M. S. N. Oliveira, M. A. Alves, and F. T. Pinho, Transport and Mixing in Laminar
Flows: From Microfluidics to Oceanic Currents, 1st Edition. Ed. R. Grigoriev, Wiley-
VCH (2012).
18 C. L. A. Berli, Electrophoresis 34, 622-630 (2013).
19 C. Zhao and C. Yang, Adv. Colloid. Interf. Sci. 201-202, 94-108 (2013).
20 S. Das and S. Chakraborty, Analytica Chim. Acta 559, 15-24 (2006).
21 S. Chakraborty, Analytica Chim. Acta 605, 175-184 (2007).
22 C. L. A. Berli and M. L. Olivares, J. Colloid Interf. Sci 320, 582-589 (2008).

35
23 C. Zhao, E. Zholkovskij, J. H. Masliyah, and C. Yang, J. Colloid Interf. Sci 326, 503-
510 (2008).
24 G. H. Tang, X. F. Li, Y. L. He, and W. Q. Tao, J. Non-Newtonian Fluid Mech. 157,
133-137 (2009).
25 M. L. Olivares, L. Vera-Candioti, and C. L. A. Berli, Electrophoresis 30, 921-929
(2009).
26 C. Zhao and C. Yang, Electrophoresis 31, 973-979 (2010).
27 M. Hadigol, R. Nosrati, and M. Raisee, Colloid Surf. A 374, 142-153 (2011).
28 A. Babaie, A. Sadeghi, and M. H. Saidi, J. Non-Newtonian Fluid Mech. 185-186, 49-57
(2012).
29 Y. J. Chang, P. W. Yang, and H. F. Huang, J. Non-Newtonian Fluid Mech. 194, 32-41
(2013).
30 C. Zhao and C. Yang, Electrophoresis 34, 662-667 (2013).
31 A. M. Afonso, M.A. Alves, and F.T. Pinho, J. Non-Newtonian Fluid Mech. 159, 50-63
(2009).
32 S. Dhinakaran, A. M. Afonso, M. A. Alves, and F.T. Pinho, J. Colloid Interf. Sci 344,
513-520 (2010).
33 J. J. Sousa, A. M. Afonso, F. T. Pinho, and M. A. Alves, Microfluid. Nanofluid. 10,
107-122 (2011).
34 A. M. Afonso, F.T. Pinho, and M. A. Alves, J. Non-Newtonian Fluid Mech. 179-180,
55-68 (2012).
35 W. Choi, S. Woo Joo, and G. Lim, J. Non-Newtonian Fluid Mech. 187-188, 1-7 (2012).

36
36 A. M. Afonso, M. A. Alves, and F. T. Pinho, J. Colloid Interf. Sci 395, 277-286 (2013).
37 W. B. Zimmerman, J. M. Rees, and T. J. Craven, Microfluid. Nanofluid. 2, 481-492
(2006).
38 T. J. Craven, J. M. Rees, and W. B. Zimmerman, Microfluid. Nanofluid. 9, 559-571
(2010).
39 C. Zhao and C. Yang, Biomicrofluidics 5, 014110 (2011).
40 C. Zhao and C. Yang, Appl. Math. Comput. 211, 502-509 (2011).
41 H. M. Park and W. M. Lee, J. Colloid Interf. Sci 317, 631-636 (2008).
42 Q. Liu, Y. Jian, and L. Yang, J. Non-Newtonian Fluid Mech. 166, 478-486 (2011).
43 C. O. Ng, J. Non-Newtonian Fluid Mech. 198, 1-9 (2013).
44 E. Lee, Y. F. Huang, and J. P. Hsu, J. Colloid Interface Sci. 258, 283-288 (2003).
45 E. Lee, C. S. Tsai, J. Hsu, and C. J. Chen, Langmuir 20, 7952-7959 (2004).
46 E. Lee, C. T. Chen, and J. P. Hsu, J. Colloid Interface Sci. 282, 857-864 (2005).
47 J. P. Hsu, L. H. Yeh, and M. H. Ku, Colloid Polym. Sci. 284, 886-892 (2006).
48 J. P. Hsu and L. H. Yeh, Langmuir 23, 8637-8646 (2007).
49 J. P. Hsu, L. H. Yeh, and S. J. Yeh, J. Phys. Chem. B 111, 12351-12631 (2007).
50 L. H. Yeh and J. P. Hsu, Microfluid. Nanofluid. 7, 383-392 (2009).
51 J. P. Hsu, C. Y. Chen, L. H. Yeh, and S. Tseng, Colloid Surface B 69, 8-14 (2009).
52 A. S. Khair, D. E. Posluszny, and L. M. Walker, Phys. Rev. E 85, 016320 (2012).
53 F. A. Morrison, J. Colloid Interface Sci. 34, 210-214 (1970).
54 F. M. Chang and H. K. Tsao, Appl. Phys Lett. 90, 194105, 2007.
55 R. M. Bryce and M. R. Freeman, Phys. Rev. E 81, 036328 (2010).
37
56 R. M. Bryce and M. R. Freeman, Lab Chip 10, 1436-1441 (2010).
57 W.W. Graessley, Polymer 21, 258–262 (1980).
58 D. F. James, Annu. Rev. Fluid Mech. 41, 129-42 (2009).
59 L. E. Rodd, J. J. Cooper-White, D. V. Boger, G. H. McKinley, J. Non-Newtonian Fluid
Mech. 143, 170-191 (2007).
60 M. Rubinstein and R. H. Colby, Polymer Physics, Oxford University Press Inc. (2003).
61 V. Tirtaatmadja, G. H. Mckinley, and J. J. Cooper-White, Phys. Fluid. 19, 043101
(2006).
62 J. Zhu, S. Sridharan, G. Hu, and X. Xuan, J. Micromech. Microeng. 22, 075011 (2012).
63 A. Kale, S. Patel, G. Hu, and X. Xuan, Electrophoresis 34, 674-683 (2013).
64 J. Zhu and X. Xuan, Electrophoresis 30, 2668-2675 (2009).
65 G. H. McKinley, Transport Processes in Bubbles, Drops & Particles, chapter 14, 2nd Ed.
Ed. R. Chhabra, D. De Kee, Taylor & Francis (2001).
66 L. E. Becker, G. H. McKinley, H. K. Rasmussen, and O. Hassager, J. Rheol. 38, 377-
403 (1994).
67 C. Bodart, and M. J. Crochet, J. Non-Newton. Fluid Mech. 54, 303-329 (1994).
68 W.M. Jones, A.H. Price, and K. Walters, J. Non-Newton. Fluid Mech. 53, 175-196
(1994).
69 M J. King and N. D. Waters, J. Phys. D 5, 141-150 (1972).
70 R. Zheng and N. Phan-Thien, Rheol. Acta 31, 323-332 (1992).
71 M. B. Bush, J. Non-Newtonian Fluid Mech. 55, 229-247 (1994).
72 M. T. Arigo and G. H. Mckinley, J. Rheol. 41, 103-128 (1997).

38
73 M. T. Arigo and G. H. Mckinley, Rheol. Acta 37, 307-327 (1998).
74 S. Chen and J. P. Rothstein, J. Non-Newtonian Fluid Mech. 116, 205-234 (2004).
75 S. von Kann, J. H. Snoeijer, and D. van der Meer, Phys. Rev. E 87, 042301 (2013).
76 A. M. Mollinger, E. C. Cornelissen, and B. H. A. A. van den Brule, J. Non-Newtonian
Fluid Mech. 86, 389-393 (1999).
77 N. Kumar, S. Majumdar, A. Sood, R. Govindarajan, S. Ramaswamy, and A. K. Sood,
Soft Matt. 8, 4310-4313 (2012).
78 A. Jayaraman and A. Belmonte, Phys. Rev. E 67, 065301(R) (2003).
79 J. Horvath and V. Dolnik, Electrophoresis 22, 644-655 (2001).
80 L. E. Rodd, T. P. Scott, D. V. Boger, J. J. Cooper-White, and G. H. McKinley, J. Non-
Newtonian Fluid Mech. 129, 1–22 (2005).

39
CHAPTER THREE
VISCOELASTIC EFFECTS ON ELECTROKINETIC PARTICLE FOCUSING IN
A CONSTRICTED MICROCHANNEL
Abstract
Focusing suspended particles in a fluid into a single file is often necessary prior to
continuous-flow detection, analysis and separation. Electrokinetic particle focusing has
been demonstrated in constricted microchannels by the use of the constriction-induced
dielectrophoresis. However, previous studies on this subject have been limited to
Newtonian fluids only. We report in this paper an experimental investigation of the
viscoelastic effects on electrokinetic particle focusing in non-Newtonian polyethylene
oxide (PEO) solutions through a constricted microchannel. The width of the focused
particle stream is found NOT to decrease with the increasing DC electric field, which is
different from that in Newtonian fluids. Moreover, particle aggregations are observed at
relatively high electric fields to first form inside the constriction. They can then either
move forward and exit the constriction in an explosive mode or roll back to the
constriction entrance for further accumulations. These unexpected phenomena are distinct
from the findings in our earlier paper (Lu et al. Biomicrofluidics 2014, 8, 021802), where
particles are observed to oscillate inside the constriction and not to pass through until a
chain of sufficient length is formed. They are speculated to be a consequence of the fluid
viscoelasticity effects.
3.1 Introduction

40
Focusing suspended particles in a fluid into a single file is often important and
necessary in order to continuously detect, analyze and sort them for numerous
applications.1,2
Sheath flow focusing is the most routine particle focusing method in
microfluidic devices because it uses sheath fluids to pinch the particulate solution and
works effectively for particles of essentially any size.3,4
However, a precise control of the
flow rate and a large consumption of the sheath fluid are the drawbacks of this method. In
contrast, sheathless focusing of particles relies on a force field to act directly on the
suspended particles and move them laterally for alignment, which is often flexible in
control and simple in operation. So far a variety of forces have been demonstrated to
focus particles in microfluidic devices, which can be either externally imposed like
acoustic,5 electric,
6 magnetic
7 and optical
8 forces etc. or internally induced like inertial
9,
viscoelastic10-13
, hydrodynamic14
and dielectrophoretic15
forces. However, these methods
often suffer from low effectiveness when working with small particles due to the strong
size-dependence of nearly, if not all, every force field.1,2
Electrokinetic flow is an efficient means to transport fluids and particles in
microfluidic devices under DC electric fields due to its excellent scalability and easy
connection.16,17
It has been exploited to drive both the particulate and sheath solutions in
sheath flow focusing of particles.18,19
It has also been demonstrated to pump the
particulate solution while simultaneously manipulating the suspended particles into
equilibrium position(s) for a sheathless focusing. The latter function is achieved primarily
through the use of a geometry-induced dielectrophoretic motion, which is the translation
of particles (either charged or neutral) in response to electric field gradients.19
Such an

41
insulator-based dielectrophoretic focusing of particles has been demonstrated in both
constricted20,21
and curved22,23
microchannels. However, all these studies have been
limited to Newtonian fluids only, in which fluid electroosmosis and particle
electrophoresis are simply a linear function of the applied DC electric field. As many of
the fluids used in capillary electrophoresis and microfluidic devices, such as polymer
solutions and bodily fluids, are complex,24-32
it is important from the aspects of both
fundamentals and applications to study how electrokinetic particle focusing may be
affected by the fluid non-Newtonian effects.
While a number of theoretical studies have been reported on, for example, the
shear thinning/thickening and viscoelastic effects on fluid electroosmosis and particle
electrophoresis in non-Newtonian fluids,33-45
much less has been done through
experimental investigation and validation. In a recent study from Chang and Tsao46
a
significant drag reduction was observed in electroosmotic flow of polymer solutions. This
was attributed to the polymer depletion in the electric double layer, and the drag
reduction was found to increase with the ratio of the polymer size to the electric double
layer thickness. In a more recent study Bryce and Freeman47
observed an extensional
instability in the electroosmotic flow of dilute polymer solutions through a microchannel
constriction, which, however, was found later by the same group to actually reduce the
fluid mixing as compared to that in polymer-free fluids.48
Very recently we have conducted an experimental study of electrokinetic particle
motion in polyethylene oxide (PEO) solutions through a microchannel constriction.49
No
apparent electrokinetic focusing of particles was observed, which is distinctly different
42
from what has been previously demonstrated in Newtonian fluids.20,21
Instead, an
unexpected particle oscillation occurred in the constriction, which continued until a
particle chain of sufficient length was formed. This phenomenon is found to persist for
particles of different sizes as long as they move along with the electric field. It also holds
true when the applied DC electric field or the PEO concentration is varied. However, as
we will present in this experimental work, particles that move against the electric field in
PEO solutions do not experience such oscillations in a constricted microchannel. They
can be electrokinetically focused with a different trend from that in Newtonian fluids
when the electric field is increased. Moreover, particle aggregations can be formed inside
the constriction with subsequent interesting behaviors.
3.2 Experiment
3.2.1 Preparation of non-Newtonian fluids and particle suspensions
Non-Newtonian fluids were prepared by dissolving PEO powder (Sigma-Aldrich
USA, average molecular weight Mw = 4106 Da) into 1 mM phosphate buffer at
concentrations of 50 ppm (i.e., dissolving 50 mg PEO powder into 1 litre buffer), 100
ppm, 200 ppm, and 500 ppm, respectively. It is important to note that PEO solutions at
similar concentrations have been frequently used in the literature to study the
viscoelasticity effects on hydrodynamic fluid flows50-52
and particle motions53-55
in
microchannels. The concentration we used are all lower than the overlapping
concentration (c* = 547 ppm
49) of the PEO, indicating that all four prepared solutions are
in the dilute regime. The shear viscosities of these solutions were measured in a Couette

43
geometry (ARES LS/M, TA instruments) at room temperature. Nearly constant values of
1.1 mPa∙s, 1.2 mPa∙s, 1.4 mPa∙s and 2.0 mPa∙s, respectively, were obtained for the four
PEO concentrations in the range of shear rate from 50 s1
to 1,000 s1
. The relaxation
times of these solutions were estimated to be 4.07 ms, 6.39 ms, 10.01 ms, and 18.17 ms,
respectively. The detailed process for calculating these values and the list of other
properties of the PEO solutions can be referred to Lu et al.45
The non-Newtonian particle suspensions were made by re-suspending polystyrene
spheres of 3.1 µm, 4.8 µm, and 9.9 µm in diameter (Thermo Scientific) in the PEO
solution(s) to a final concentration of about 106
particles per milliliter. To illustrate the
viscoelastic effects, 9.9 µm particles were also re-suspended in the base fluid of the PEO
solutions, i.e., 1 mM pure buffer, which is a Newtonian fluid, for a direct comparison. A
small amount of Tween 20 (0.5% in volume ratio, Fisher Scientific) was added to both
the Newtonian and non-Newtonian particle suspensions for the purpose of suppressing
particle-wall and particle-particle adhesions. The effective electric conductivity, p, of
particles was calculated from p = 4s/d with s = 1 nS being the particle’s surface
conductance and d the particle diameter.56
It was found to be 12.90, 8.33 and 4.04 µS/cm
for 3.1, 4.8 and 9.9 µm-diameter particles, respectively. Because these conductivity
values are all much smaller than that of the suspending fluid (approximately 200 µS/cm),
negative DEP are expected to occur under the application of DC electric fields in both the
Newtonian and non-Newtonian fluids.
3.2.2 Experimental setup

44
The standard soft lithography method is used in the fabrication of microchannels,
as detailed by Lu et al.49
The polydimethylsiloxane (PDMS) microchannel is sealed from
bottom by a regular glass slide, through which Joule heating can be dissipated relatively
easily to avoid significant temperature rises in the particle suspensions.57
The 40 μm-deep
microchannel is overall 1 cm long and 400 μm wide with a constriction of 200 μm length
and 40 μm width in the middle. The electrokinetic fluid and particle motions in the
microchannel were driven by DC electric fields, supplied by a DC power supply
(Glassman High Voltage Inc., High Bridge) through the end-channel reservoirs. The
electric field magnitude was kept no more than 500 V/cm in order to minimize Joule
heating effects in the constriction region.58
Pressure-driven fluid and particle motions
were eliminated by balancing the liquid heights in the inlet and outlet reservoirs prior to
each test. Particle transport in the microchannel constriction was visualized and recorded
through an inverted microscope (Nikon Eclipse TE2000U, Nikon Instruments) with a
CCD camera (Nikon DS-Qi1Mc) at a rate of 15 frames per second. The videos and
images obtained were post-processed using the Nikon imaging software (NIS-Elements
AR 2.3). Particle streak images were obtained by superimposing a sequence of 600
images.
3.2.3 Measurement of electrokinetic particle mobility
The electrokinetic velocity of particles, UEK, in a microchannel is the vector
addition of electroosmotic fluid velocity, UEO, and electrophoretic particle velocity, UEP,

45
p w
EK EO EP
U U U E (1)
where is the dielectric permittivity of the suspending fluid, p is the zeta potential of the
particle, w is the zeta potential of the channel wall due to the spontaneous formation of
electric double layer at the fluid-wall interface, is the fluid dynamic viscosity, and E is
the applied DC electric field. It was determined from the measured particle travelling
distance over a time interval in the microchannel. The measuring region is distant from
the channel entrance and the constriction so that the local electric field and particle
velocity both remain constant. The electrokinetic mobility of particles, µEK, was
calculated from the electrokinetic velocity divided by the local DC electric field
(numerically computed in COMSOL, Burlington, MA),
p w
EK
(2)
which is apparently a function of the physicochemical properties of the tested fluid-
particle-channel system. In our experiments, particles travel from the cathode to the
anode in both the Newtonian and non-Newtonian solutions, i.e., µEK < 0, which indicates
the dominance of particle electrophoresis over fluid electroosmosis. This is because the
electroosmotic fluid motion is nearly always from the anode to the cathode, i.e., w <
016,17,30
and hence p < w < 0 or |p| > |w|.
The observed direction of the electrokinetic motion of particles from Thermo
Scientific in the current work is contrary to that of the particles from Sigma Aldrich used
in our previous paper.49
Therefore, fluid electroosmosis should dominate over particle

46
electrophoresis in the latter case, leading to w < p < 0 or |w| > |p| based on a similar
analysis to the above. While both types of particles are made of polystyrene as per the
product manuals, only the particles from Thermo Scientific are fluorescently dyed. This
may be responsible for the observed difference in particle zeta potential, p, between the
two types of particles. The electrokinetic particle mobility is found to be nearly
independent of the particle size in all the solutions tested in this work. However, the
addition of PEO into the buffer solution increases the particle mobility, which is also
different from those particles used in our previous paper.49
Specifically, the measured
particle mobility is 2.6×10⁸
m2/(V∙s) in the 500 ppm PEO solution, and found to
decrease by less than 10% when the PEO concentration is varied from 500 ppm to 50
ppm. In contrast, the electrokinetic particle mobility is only 1.3×10⁸
m2/(V∙s) in the
Newtonian buffer solution. Since the viscosity of the 500 ppm PEO solution is nearly
twice that of the Newtonian buffer, the wall zeta potential, w, in the former is anticipated
to be significantly smaller from Eq. (2). This can be attributed to the suppression of
electroosmotic flows as a result of the coating of neutral PEO polymers onto the channel
walls.59
It is important to note that electrophoresis may also be suppressed by the PEO
coating on particle surfaces, which requires a detailed study of the PEO effects on wall
and particle zeta potentials.
3.3 Results and discussion
3.3.1 Comparison of electrokinetic particle focusing in Newtonian and non-
Newtonian fluids

47
FIG. 1 compares in the form of superimposed images the electrokinetic focusing
of 9.9 µm-diameter particles in Newtonian (a, 1 mM buffer) and non-Newtonian (b, 200
ppm PEO in 1 mM buffer) fluids through the microchannel constriction. The applied DC
electric field increases from 100 V/cm to 400 V/cm for the images from left to right. At
100 V/cm particles exit the constriction in a narrower stream in both fluids. This focusing
effect is attributed to the constriction-induced DEP that has been demonstrated in
previous studies with Newtonian fluids.60
As the electric field increases from 100 V/cm
to 300 V/cm, the particle stream width in the pure buffer becomes thinner after the
constriction (see FIG. 1(a)), indicating an enhanced electrokinetic focusing. This
observation is consistent with previous studies20,21,60
and occurs due to the greater
increase in dielectrophoretic motion than in electrokinetic motion at larger electric fields.
Such a decrease in the focused particle stream width also agrees reasonably with the
predictions of a Lagrangian tracking method-based numerical model in COMSOL (data
not shown). In the PEO solution, however, the electrokinetic particle focusing turns out
NOT to increase with the applied electric field. As measured directly from the top edge of
the images (i.e., where particles travel out of the images) in FIG. 1(b), the focused
particle stream width (note the wider particle stream, the worse focusing) actually
increases from 176 µm to 216 µm and 240 µm when the electric field is increased from
100 V/cm to 300 V/cm. Moreover, the particles at the edges of the focused streams are
scattered, which seems not to be a strong function of the applied electric field. This
dispersion phenomenon is not obvious for particles in the Newtonian buffer (see FIG.
1(a)).

48
FIG. 1. Superimposed images illustrating the effects of fluid viscoelasticity on
electrokinetic focusing of 9.9 µm particles in a constricted microchannel under various
DC electric fields: (a) Newtonian fluid (1 mM buffer); (b) non-Newtonian fluid (200 ppm
PEO in 1 mM buffer). The block arrows indicate the particle moving direction, which is
from bottom to top in all images and against the electric field direction. The two dashed
boxes on the right-most images highlight the regions in which the particle trapping is
initiated. A clear demonstration of the observed particle trapping phenomenon in the PEO
solution is presented as snapshot images in FIG. 2. Note that the widths of the focused
particle streams referred to in the text (see also FIG. 3 and FIG. 4) were all measured
directly from the top edge of the images where particles travel out.
To further verify the trend of this reduced particle focusing with electric field, we
also studied the electrokinetic motion of similar sized particles from other companies in
the same PEO solution: one is the 9.9 µm-diameter particle from Duke Scientific, and the
other is the 10.14 µm-diameter particle from Bangs Laboratories. Each type of these
particles moved from the cathode to the anode though at a dissimilar electrokinetic
100
V/cm
200 V/cm 300 V/cm 400 V/cm
(a)
(b)
100µm

49
mobility from the particles in FIG. 1(b). We observed a similar trend of weakened
electrokinetic particle focusing with an increase in electric field for both particles (data
not shown). Thus, the viscoelasticity of the PEO solution is believed to be a factor
contributing to this phenomenon. We speculate that fluid viscoelasticity draws
disturbances to electrokinetic particle motion in the constriction region due to the shear-
induced electroosmotic fluid instability that has been recently demonstrated
experimentally47,48
and numerically.61
Such a de-focusing effect increases more quickly
with electric field than the constriction-induced dielectrophoretic force does, and
consequently the electrokinetic particle focusing gets worse at higher electric fields. In
addition, it is important to note that the reported particle oscillations and formation of
particle chains in our previous paper49
are absent from the constriction in this work for all
the three types of particles under test. This change appears to be associated with the
direction of the electrokinetic particle motion, which may be due to the dominant particle
electrophoresis over fluid electroosmosis in this work as analyzed earlier.
FIG. 2. Sequential images (with the relative time instants labeled) illustrating the forward
ejection (a) and backward rolling (b) of 9.9 µm-diameter particle aggregations in a non-
Newtonian (200 ppm PEO) fluid through the microchannel constriction. The applied DC
0 s 0.18s 0.33s
0.43s 1.49s 2.75
s
0.38s 0.53s
0.58s 0.63s 0.69s
(a) (b) 0 s
100µm

50
electric field is 400 V/cm. The block arrow indicates the overall particle moving direction
in the microchannel, which is from bottom to top in all images and against the electric
field direction (from top to bottom). The thin arrows indicate the moving directions of the
particle clusters that are formed first inside the constriction (Multimedia view).
When the DC electric field applied was further increased to 400 V/cm, particles in
the Newtonian fluid started being trapped at the constriction entrance (highlighted by a
dashed box on the right-most image in FIG. 1(a)). This happens because the constriction-
induced DEP becomes strong enough to counterbalance the electrokinetic motion in the
streamline direction. However, particles cannot be fully trapped until an even higher
electric field is applied because of the influence of the trapped particles on the local
electric field gradients.62
In contrast, electrokinetic particle trapping also occurs in the
200 ppm PEO solution at 400 V/cm but initiates inside the constriction (see the dashed-
box highlighted region on the right-most image in FIG. 1(b)), and proceed in either a
forward or a backward direction. As viewed from the first two images in FIG. 2(a)
(Multimedia view), an aggregation of particles can be formed first inside the constriction,
which was not observed in our previous work for particles moving in the electric-field
direction.49
More interestingly, the particle cluster can then either move forward, albeit
slower than single particles, and exit the constriction in an explosive mode, as illustrated
by the sequential images (see the thin arrows for the moving direction of the particle
cluster) in FIG. 2(a). Or alternatively, the particle cluster can roll back to the constriction
entrance, where it grows continuously bigger and bigger with additional particles trapped.
This process is demonstrated by the image sequence in FIG. 2(b) (Multimedia view),
where, as seen from the labeled time instants, the backward-moving speed of the particle

51
cluster within the constriction is comparable to the forward-moving speed of the particle
cluster in FIG. 2(a). The formation and subsequent movement of particle aggregations in
the constriction are speculated to be a consequence of the combined effects of
viscoelastic instability47,48
and particle-particle interactions.63
The exact mechanisms
behind the observed phenomena in FIG. 1 and FIG. 2 are, however, currently unclear to
us, for which a systematic study (especially theoretical) of the electroosmotic flow field
and the fluid-particle-electric field interactions will be needed.
3.3.2 PEO concentration effect
FIG. 3 shows the effects of PEO concentration on the stream width of
electrokinetically focused 9.9 µm particles in the microchannel constriction. The applied
DC electric field is varied from 100 V/cm to 400 V/cm. The superimposed particle
images in all tested PEO solutions (except for 200 ppm which is shown in FIG. 1) are
presented in FIG. 4. The focused particle stream widths in all tested PEO solutions
(including 50, 100, 200 and 500 ppm) are larger than that in the Newtonian fluid. This is
mainly because the electrokinetic particle mobility in the latter is only approximately half
of that in a PEO solution. Moreover, the constriction-induced particle DEP is smaller in a
PEO solution due to its greater viscosity than the Newtonian buffer. Interestingly
particles in 50 ppm PEO solution behave similar to those in the Newtonian fluid (see
FIG. 1(a)), and achieve an enhanced electrokinetic focusing (i.e., a decreased particle
stream width) at a greater electric field. This indicates a relatively weak viscoelastic
effect at a PEO concentration of 50 ppm, which is consistent with the observation in our
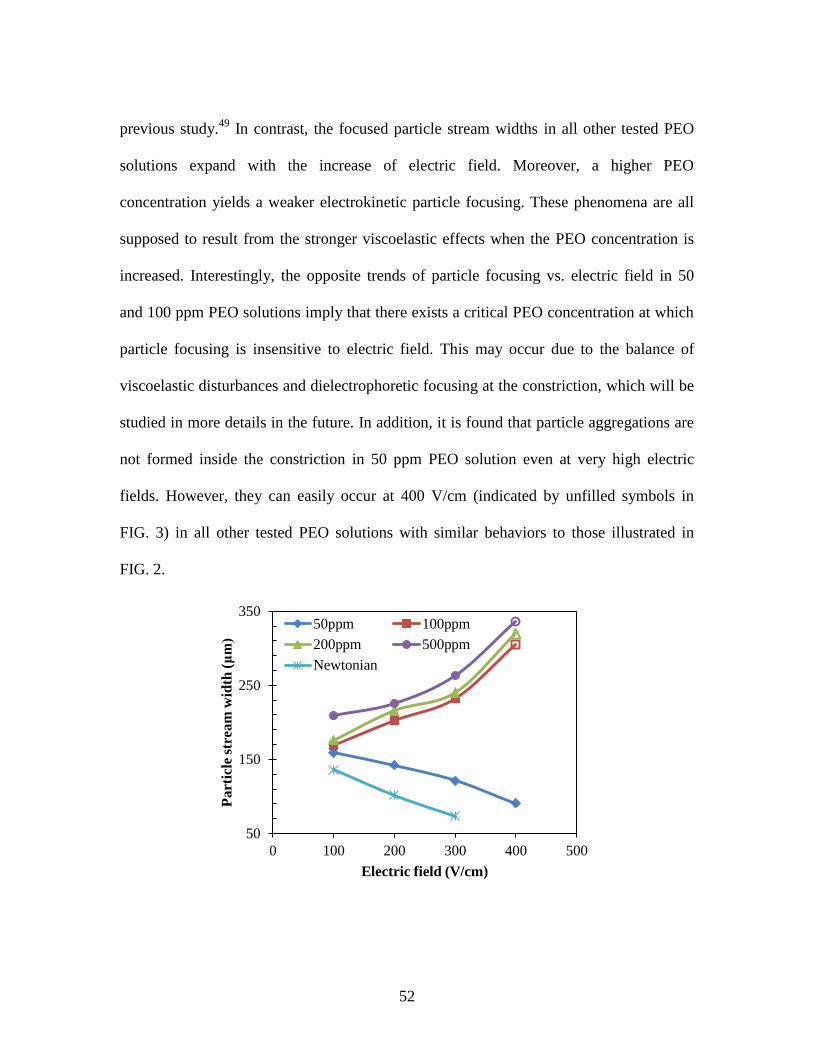
52
previous study.49
In contrast, the focused particle stream widths in all other tested PEO
solutions expand with the increase of electric field. Moreover, a higher PEO
concentration yields a weaker electrokinetic particle focusing. These phenomena are all
supposed to result from the stronger viscoelastic effects when the PEO concentration is
increased. Interestingly, the opposite trends of particle focusing vs. electric field in 50
and 100 ppm PEO solutions imply that there exists a critical PEO concentration at which
particle focusing is insensitive to electric field. This may occur due to the balance of
viscoelastic disturbances and dielectrophoretic focusing at the constriction, which will be
studied in more details in the future. In addition, it is found that particle aggregations are
not formed inside the constriction in 50 ppm PEO solution even at very high electric
fields. However, they can easily occur at 400 V/cm (indicated by unfilled symbols in
FIG. 3) in all other tested PEO solutions with similar behaviors to those illustrated in
FIG. 2.
50
150
250
350
0 100 200 300 400 500
Pa
rtic
le s
trea
m w
idth
(μm)
Electric field (V/cm)
50ppm 100ppm
200ppm 500ppm
Newtonian

53
FIG. 3. Effects of PEO concentration (0, 50, 100, 200 and 500 ppm) on the stream width
of electrokinetically focused 9.9 µm particles in the microchannel constriction at different
DC electric fields. Error bars are included for only the data in the 500 ppm PEO solution
for a better view, which are determined from the reading error in identifying the edges of
the focused particle stream. The unfilled symbols represent the points at which particle
aggregation was observed inside the constriction. The particle stream widths of these
points are each measured from the superimposed images prior to the occurring of particle
aggregation.
FIG. 4. Superimposed images illustrating the electrokinetic focusing of 10 µm-diameter
particles in PEO solutions of various concentrations (0 and 200 ppm are referred to Fig.
1) under four different DC electric fields. The block arrow indicates the particle moving
direction in all images.
3.3.3 Particle size effect
100µm
200 V/cm100 V/cm 300 V/cm 400 V/cm
500 ppm
100 ppm
50 ppm

54
To examine whether particle size contributes to the peculiar electrokinetic
focusing phenomena in non-Newtonian fluids explained above, we also studied the
electrokinetic motions of 3.1 µm and 4.8 µm particles in 200 ppm PEO solution in the
constricted microchannel under various DC electric fields. The superimposed particle
images are presented in FIG. 5. The experimentally measured stream widths of these
particles at different electric fields are presented in FIG. 6 along with the ones for 9.9 µm
particles (see also FIG. 1(b)). The general trend that the electrokinetic focusing
deteriorates with the increase of electric field persists for the two smaller particles. The
extent of variation in the focused particle stream width with electric field, however, turns
out to be dependent on particle size. At low electric fields (e.g., 100 V/cm), larger
particles achieve, as expected, a better focusing than smaller ones because the former
experience a stronger DEP while viscoelastic effects are still relatively weak. At high
electric fields (e.g., 300 V/cm), the relationship among the three focused particle stream
widths becomes complicated, as seen from FIG. 6. This is likely because viscoelastic
effects are a complex function of both electric field and particle size, which requires
further studies. In addition, similar forward and backward motions of particle clusters
(see FIG. 2) are also observed within the constriction for both 3.1 µm and 4.8 µm
particles but under an increased electric field of around 500 V/cm.

55
FIG. 5. Superimposed images illustrating the electrokinetic focusing of 3.1 µm and 4.8
µm-diameter particles (the images for 9.9 µm particles are referred to FIG. 1) in 200 ppm
PEO solution under four different DC electric fields. The block arrow indicates the
particle moving direction in all images.
FIG. 6. Experimentally measured stream widths of the electrokinetically focused
particles with different sizes in 200 ppm PEO solution in the constricted microchannel.
The unfilled symbol for 9.9 µm particles represents the point at which particle
100
200
300
400
0 100 200 300 400 500
Particle stream width (μm)
Electric field (V/cm)
3.1um
4.8um
9.9um

56
aggregation inside the constriction was observed. The particle stream width of this point
is obtained from the superimposed images prior to the occurring of particle aggregation.
3.4 Conclusions
We have experimentally studied the electrokinetic particle focusing in viscoelastic
PEO solutions through a 10:1 ratio microchannel constriction. Particles are found to be
less focused with the increase of the applied DC electric field, which is different from the
focusing trend in Newtonian fluids. Also, particle aggregations are formed first inside the
constriction at high electric fields while the purely dielectrophoretic trapping of particles
in Newtonian fluids only occurs at the entrance of the constriction. More surprisingly, the
particle aggregation can either move forward and be ejected from the constriction in an
explosive manner, or roll back and grow bigger in size at the constriction entrance with
more particles getting trapped. All these interesting phenomena are owed to the fluid
viscoelasticity effects that are speculated to be a stronger function of electric field than
DEP. The exact mechanisms underlying these phenomena deserve intensive future
studies. We have also examined the effects of PEO concentration and particle size on the
electrokinetic particle focusing behavior in the constricted microchannel. The viscoelastic
perturbations to particle focusing and trapping are found to increase with the PEO
concentration for larger particles. Since the observed particle focusing in all tested PEO
solutions is worse than in the Newtonian fluid, we conclude that constriction-induced
DEP is not a good option for electrokinetic focusing of particles suspended in non-
Newtonian fluids. However, the demonstrated particle oscillation49
and aggregation under
relative low electric fields may find applications in bead-based assays.64,65

57
Acknowledgements
This work was partially supported by Clemson University through a departmental
SGER (Small Grants for Exploratory Research) grant to Xuan.
References
1 D. A. Ateya, J. S. Erickson, P B. Howell Jr, L. R. Hilliard, J. P. Golden and F. S.
Ligler Anal. Bioanal. Chem. 391, 1485-1498 (2008).
2 X. Xuan, J. Zhu and C. Church Microfluid. Nanofluid. 9, 1-16 (2010).
3 C. C. Chang, Z. Y. Huang and R. J. Yang J. Micromech. Microeng. 17, 1479-1486
(2007).
4 C. G. Tsai, H. H. Hou and L. M. Fu Microfluid. Nanofluid. 5, 827-836 (2008).
5 J. Shi, X. Mao, D. Ahmed, A. Colletti and T. J. Huang Lab Chip 8, 221-223 (2008).
6 I. F. Cheng, H. C. Chang, D. Hou and H. C. Chang Biomicrofluid. 1, 021503 (2007).
7 L. Liang, J. Zhu and X. Xuan Biomicrofluid. 5, 034110 (2011).
8 Y. Zhao, B. S. Fujimoto, G. D. M. Jeffries, P. G. Schiro and D. T. Chiu Opt. Express
15, 6167-6176 (2007).
9 H. Ramachandraiah, S. Ardabili, A. M. Faridi, J. Gantelius, J. M. Kowalewski, G.
Martensson and A. Russom, Biomicrofluid. 8, 034117 (2014).
10 A. M. Leshansky, A. Bransky, N. Korin and U. Dinnar Phys. Rev. Lett. 98, 234501
(2007).
11 S. Yang, J. Y. Kim, S. J. Lee, S. S. Lee and J. M. Kim Lab Chip 11, 266-273 (2011).
58
12 K. Kang, S. S. Lee, K. Hyun, S. J. Lee and J. M. Kim Nat. Comm. 4, Article number:
2567. doi:10.1038/ncomms3567 (2013).
13 E. J. Lim, T. Ober, J. F. Edd, S. P. Desai, D. Neal, K. W. Bong, P. S. Doyle, G. H.
McKinley, M. Toner Nat. Comm. 5, Article number: 4120. doi:10.1038/ncomms5120
(2014).
14 S. Yan, J. Zhang, H. Chen, G. Alici, H. Du, Y. Zhu and W. Li Biomicrofluid. 8,
064115 (2014).
15 C. P. Jen and W. F. Chen Biomicrofluid. 5, 044105 (2011).
16 D. Li, Electrokinetics in microfluidics, Academic Press (2004).
17 H. C. Chang and L. Y. Yeo Electrokinetically-Driven Microfluidics and Nanofluidics,
Cambridge University Press (2009).
18 L. M. Fu, R. J. Yang and G. B. Lee Anal. Chem. 75, 1905-1910 (2003).
19 H. A. Pohl Dielectrophoresis: The Behavior of Neutral Matter in Non-uniform
Electric Fields, Cambridge University Press, Cambridge (1978).
20 C. Church, J. Zhu, G. Huang, T. R. Tzeng and X. Xuan Biomicrofluid. 4, 44101
(2010).
21 X. Xuan, S. Raghibizadeh and D. Li, J. Colloid Interf. Sci. 296, 743-748 (2006).
22 C. Church, J. Zhu, G. Huang, T. R. Tzeng and X. Xuan Biomicrofluid. 3, 044109
(2009).
23 M. Li, S. B. Li, W. B. Cao, W. H. Li, W. J. Wen, G. Alici, J. Micromech. Microeng.
22, 095001 (2012).
24 Y. C. Lam,H. Y. Gan, N. T. Nguyen, and H. Lie, Biomicrofluidics 3, 014106 (2009).

59
25 K. E. Jensen, P. Szabo, F. Okkels, and M. A. Alves, Biomicrofluidics 6, 044112
(2012).
26 D. L. Lee, H. Brenner, J. R. Youn, Y. S. Song, Scientific Reports 3, article number
3258. DOI: 10.1038/srep03258 (2013).
27 P. C. Sousa, F. T. Pinho, M. S. N. Oliveira, and M. A. Alves, Biomicrofluidics 5,
014108 (2011).
28 Y. J. Kang and S. J. Lee, Biomicrofluidics 7, 054122 (2013).
29 C. J. Pipe and G. H. McKinley, Mech. Research Comm. 36, 110-120 (2009).
30 M. S. N. Oliveira, M. A. Alves and F. T. Pinho, Transport and Mixing in Laminar
Flows: From Microfluidics to Oceanic Currents, 1st Edition. Ed. R. Grigoriev, Wiley-
VCH (2012).
31 C. L. A. Berli, Electrophoresis 34, 622-630 (2013).
32 C. Zhao and C. Yang, Adv. Colloid Interf. Sci. 201-202, 94-108 (2013).
33 S. Das and S. Chakraborty, Analytica Chim. Acta 559, 15-24 (2006).
34 S. Chakraborty, Analytica Chim. Acta 605, 175-184 (2007).
35 C. L. A. Berli and M. L. Olivares, J. Colloid Interf. Sci 320, 582-589 (2008).
36 C. Zhao, E. Zholkovskij, J. H. Masliyah, and C. Yang, J. Colloid Interf. Sci 326, 503-
510 (2008).
37 A. M. Afonso, M.A. Alves, and F.T. Pinho, J. Non-Newtonian Fluid Mech. 159, 50-
63 (2009).
38 S. Dhinakaran, A. M. Afonso, M. A. Alves, and F.T. Pinho, J. Colloid Interf. Sci 344,
513-520 (2010).

60
39 C. Zhao and C. Yang, Biomicrofluidics 5, 014110 (2011).
40 A. M. Afonso, F.T. Pinho, and M. A. Alves, J. Non-Newtonian Fluid Mech. 179-180,
55-68 (2012).
41 A. M. Afonso, M. A. Alves, and F. T. Pinho, J. Colloid Interf. Sci 395, 277-286
(2013).
42 E. Lee, Y. F. Huang, and J. P. Hsu, J. Colloid Interface Sci. 258, 283-288 (2003).
43 J. P. Hsu and L. H. Yeh, Langmuir 23, 8637-8646 (2007).
44 L. H. Yeh and J. P. Hsu, Microfluid. Nanofluid. 7, 383-392 (2009).
45 A. S. Khair, D. E. Posluszny, and L. M. Walker, Phys. Rev. E 85, 016320 (2012).
46 F. M. Chang and H. K. Tsao, Appl. Phys Lett. 90, 194105 (2007).
47 R. M. Bryce and M. R. Freeman, Phys. Rev. E 81, 036328 (2010).
48 R. M. Bryce and M. R. Freeman, Lab Chip 10, 1436-1441 (2010).
49 X. Lu, S. Patel, M. Zhang, S. W. Joo, S. Qian, A. Ogale and X. Xuan Biomocrofluid.
8, 021802 (2014).
50 L. E. Rodd, T. P. Scott, D. V. Boger, J. J. Cooper-White and G. H. McKinley J. Non-
Newtonian Fluid Mech. 129, 1-22 (2005).
51 J. Soulages, M. S. N. Oliveira, P. C. Sousa, M. A. Alves and G. H. McKinley J. Non-
Newtonian Fluid Mech. 163, 9-24 (2009).
52 P. C. Sousa, F. T. Pinho, M. S. N. Oliveira and M. A. Alves J. Non-Newtonian Fluid
Mech. 165, 652-671 (2010).
53 J. Y. Kim, S. W. Ahn, S. S. Lee and J. M. Kim Lab Chip 12, 2807-2814 (2012).
54 J. Nam, H. Lim, D. Kim, H. Jung and S. Shin Lab Chip 12, 1347-1354 (2012).

61
55 K. W. Seo, Y. J. Kang and S. J. Lee Phys. Fluid. 26, 063301 (2014).
56 I. Ermolina and H. Morgan J. Colloid Interf. Sci. 285, 419-428 (2005).
57 J. Zhu, S. Sridharan, G. Hu and X. Xuan J. Micromech. Microeng. 22, 075011 (2012).
58 S. Sridharan, J. Zhu, G. Hu and X. Xuan Electrophoresis 32, 2274-2281 (2011).
59 I. Wong and C. M. Ho Microfluid. Nanofluid. 7, 291-306 (2009).
60 J. Zhu and X. Xuan Electrophoresis 30, 2668-2675 (2009).
61 A. M. Afonso, F.T. Pinho and M. A. Alves, J. Non-Newton. Fluid Mech. 179-180,
55-68 (2012).
62 A. Kale, X. Lu, S. Patel and X. Xuan J. Micromech. Microeng. 24, 075007 (2014).
63 R. Pethig, Biomicrofluid. 4, 022811 (2010).
64 S. Senapati, A. R. Mahon, J. Gordon, C. Nowak S. Sengupta, T. H. Q. Powell, J.
Feder, D. M. Lodge and H. C. Chang, Biomicrofluid. 3, 022407 (2009).
65 I. F. Cheng, S. C. Chiang, C. C. Chung, T. M. Yeh and H. C. Chang, Biomicrofluid. 8,
061102 (2014).
62
CHAPTER FOUR
VISCOELASTIC EFFECTS ON ELECTROOSMOTIC FLOW IN A
CONSTRICTION MICROCHANNLE
Abstract
The viscoelastic effects have been little studied in electrokinetic flow
experimentally. Thus it is critical to unveil the details of electroosmosis in viscoelastic
fluid. Flow visualization is an important tool in experimental fluid mechanics. By
tracking the small particles in the fluid, the flow field can be captured. In the present
paper, the flow visualization study of electrokinetic flow shows significant difference in
Newtonian and viscoelastic fluids through a constriction microchannel. The deflected
particle trajectories are observed near the constriction entrance at the upstream of the
fluid in viscoelastic fluid. They are asymmetric along the centerline and grow with the
electric field. A numerical work is also presented, which predicts smaller velocity in the
middle area of the channel and hence smaller flow rate in Oldroyd-B model as compared
with the Newtonian one.
4.1 Introduction
The unexpected particle electrokinetic motions in the viscoelastic fluids have been
reported in our previous papers.1,2
For a better understanding of the electrokinetic flow in
viscoelastic fluid, the flow field study is highly needed. Most of previous flow
visualization articles of non-Newtonian fluid are focused on pressure driven flow. There

63
are a great number of experimental investigations dealing with the flow patterns in planar
constriction channel in polymer solutions. Rothstein et al.3,4
presented visualized unstable
streamlines and vortices at the upstream in PEO solutions. The vortices grew with
polymer concentration and flow rate, i.e., the Weissenberg number. On the contrary,
vortex at the downstream was generated more easily in Newtonian fluid than in non-
Newtonian solution, because the elastic effect impeded the inertial effect which
contributed the downstream vortex growth. Furthermore, Rodd’s work5 referred to a time
dependent experimental phenomenon. When the Weissenberg number reached to a
critical value, unstable and time dependent flow pattern appeared immediately. In
addition, several researchers3,6-8
observed varied flow patterns in channels of different
constriction ratio and curvature to the reentrant corner.
However, very few flow visualization works have been reported in electroosmosis
of viscoelastic fluid. The only experimental work was from Bryce and Freeman,9,10
who
showed that the flow streams of mixing were unstable in the PAA solution through a 2:1
microchannel constriction experimentally. Afonso11
demonstrated the elastic flow
instabilities in the numerical model of electroosmosis in viscoelastic fluids. Park and
Lee’s work12
achieved smaller flow rate of viscoelastic electroosmotic flow as compared
with that of Newtonian flow under same electric field by a general constitutive equation.
In this paper, we present experimental and numerical studies of the flow field in
viscoelastic fluid. To visualize the flow field, small fluorescent polystyrene particles were
added to the solution. Due to the electrochemical nature, the particles are always
electrical charged in the fluid. The small particle motion we captured was considered as a

64
superposition of electroosmosis (EO), electrophoresis (EP) and dielectrophoresis (DEP).
Even though the instinctive drawback exists, we are able to study the flow flied (EO)
from the particle motion, because the EP and DEP are independent in flow field. The
abnormal particle trajectories were observed in experiment, which indicated the deformed
flow streamlines. But our numerical result failed to predict the deflected particle
trajectories. Velocity decrease in the middle of the channel was found in Oldroyd-B
model as compared to Newtonian one.
4.2 Experiment
4.2.1 Preparation and technique of experiment
The 40 μm-deep microchannel is overall 1 cm-long and 400 μm-wide with a
constriction of 200 μm length and 40 μm width in the middle. Detailed soft lithography
method of fabrication is referred to Lu et al.1 The 500 ppm polyethylene oxide (PEO)
solution was prepared by by dissolving PEO powder (Sigma-Aldrich, average molecular
weight Mw = 4106 Da) into 1 mM phosphate buffer. The viscosity is 2.0 mPa∙s and the
relaxation time is estimated as 18ms.1 The polystyrene spheres of 0.53 µm and 1.01 µm
(Bangs lab) in diameter were suspended in the PEO solution to a final concentration of
about 106
particles per milliliter. To illustrate the viscoelastic effects, the particles were
also re-suspended in the base fluid, i.e., 1 mM pure buffer, which is a Newtonian fluid,
for a direct comparison. A small amount of Tween 20 (0.5% in volume ratio, Fisher
Scientific) was added to both the Newtonian and non-Newtonian particle suspensions for
the purpose of suppressing particle-wall and particle-particle adhesions.

65
The same experimental setup and visualization methods are referred to Lu et al.1
Fluorescent light was used in order to visualize the fluorescent particles. The exposure
time was 100 ms. The superimposed particle images were obtained by stacking a
sequence of around 10 and 40 snapshot images with the maximum intensity projections
for the 1.01 µm and 0.53 µm fluorescent particles respectively.
4.2.2 Electrokinetic mobility and dimensionless number
The measured electrokinetic mobility is -1.6×10⁸
m2/(V∙s) and -2.5×10
8
m2/(V∙s) in the Newtonian buffer solution and the 500 ppm PEO solution, respectively.
By the estimation of wall zeta potential as -80 mV and -20 mV in the Newtonian and
PEO solutions, the zeta potential of particles is -100mV and -55mV in the Newtonian and
PEO solutions, respectively. The electroosmotic and electrophoretic velocities are
comparable and in the same order of magnitude. The Weissenberg number is defined as
the ratio of effective relaxation time and the average shear rate, �̇�,
𝑊𝑖 = 𝜆𝑒�̇� = 𝜆𝑒𝑉𝑝
𝑤/2 (1)
in which 𝜆𝑒 is the effective relaxation times, Vp is the particle velocity at the constriction,
w and h are the width and height of the channel constriction. Reynolds number is defined
as the ratio of the inertial force to the viscous force,
𝑅𝑒 =𝜌𝑉𝑝𝐷ℎ
𝜇 (2)
where 𝜌 is the density, 𝜇 is the fluid dynamic viscosity, and Dh is the hydraulic diameter.
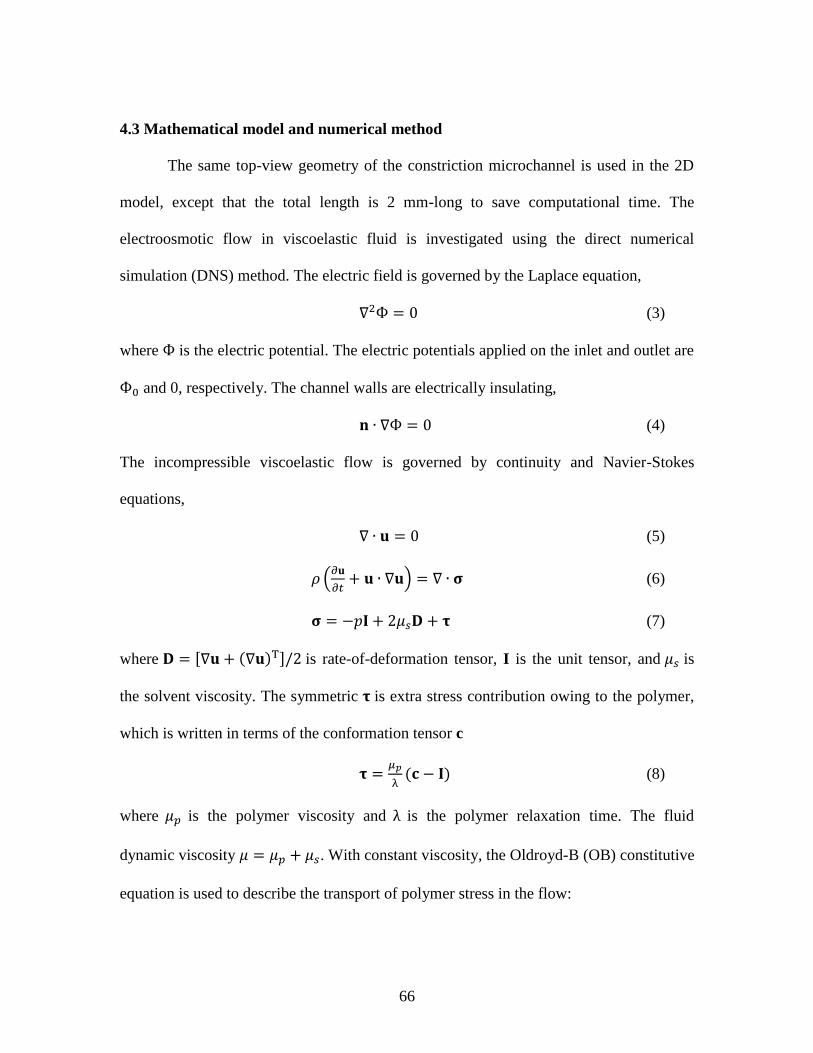
66
4.3 Mathematical model and numerical method
The same top-view geometry of the constriction microchannel is used in the 2D
model, except that the total length is 2 mm-long to save computational time. The
electroosmotic flow in viscoelastic fluid is investigated using the direct numerical
simulation (DNS) method. The electric field is governed by the Laplace equation,
∇2Ф = 0 (3)
where Ф is the electric potential. The electric potentials applied on the inlet and outlet are
Ф0 and 0, respectively. The channel walls are electrically insulating,
𝐧 ∙ ∇Ф = 0 (4)
The incompressible viscoelastic flow is governed by continuity and Navier-Stokes
equations,
∇ ∙ 𝐮 = 0 (5)
𝜌 (𝜕𝐮
𝜕𝑡+ 𝐮 ∙ ∇𝐮) = ∇ ∙ 𝛔 (6)
𝛔 = −𝑝𝐈 + 2𝜇𝑠𝐃 + 𝛕 (7)
where 𝐃 = [∇𝐮 + (∇𝐮)T]/2 is rate-of-deformation tensor, I is the unit tensor, and 𝜇𝑠 is
the solvent viscosity. The symmetric 𝛕 is extra stress contribution owing to the polymer,
which is written in terms of the conformation tensor c
𝛕 =𝜇𝑝
λ(𝐜 − 𝐈) (8)
where 𝜇𝑝 is the polymer viscosity and λ is the polymer relaxation time. The fluid
dynamic viscosity 𝜇 = 𝜇𝑝 + 𝜇𝑠. With constant viscosity, the Oldroyd-B (OB) constitutive
equation is used to describe the transport of polymer stress in the flow:

67
λ
c + 𝐜 − 𝐈 = 0 (9)
where
c is the upper convected derivative
T
t
cc u c u c c u (10)
Smoluchowski slip velocity boundary conditions are imposed on the rigid walls,
𝐮 = −𝜀𝜀0𝜁𝑤𝐄/𝜇 (11)
where 𝜀 and 𝜀0 are the relative and vacuum permittivity, 𝜁𝑤 is the zeta potential of
channel wall, and E is the electric field. 𝑝𝐧 = 𝟎 is imposed on inlet and outlet.
Dimensionless governing equations are respectively
∇′2Ф′ = 0 (12)
∇′ ∙ 𝐮′ = 0 (13)
𝑅𝑒𝑚 (𝜕𝐮′
𝜕𝑡′+ 𝐮′ ∙ ∇′𝐮′) = ∇′ ∙ 𝛔′ (14)
𝑊𝑖𝑚
c ′ + 𝐜′ − 𝐈 + α(𝐜′ − 𝐈)2 = 0 (15)
where 𝑅𝑒𝑚 = 𝜌𝑈0𝑤/𝜇 , 𝑊𝑖𝑚 =λ𝑈0
𝑤, 𝜇𝑠
′ = 𝜇𝑠/𝜇 , 𝜇𝑝′ = 𝜇𝑝/𝜇 , 𝑈0 and w are the
characteristic velocity and length respectively. 𝑈0 = 𝜀𝜀0𝜁𝑝Ф0/(𝜇𝑤) , where Ф0 is the
characteristic potential and 𝜁𝑤 is the zeta potential of particle. Hereinafter, the
dimensionless variables in equations are written without apostrophe.
Due to the difficulty in numerical convergence at relatively high Wi, the
constitutive equation is transformed to equivalent equations in terms of log conformation
tensor s, which is defined as
𝐬 = 𝑙𝑜𝑔(𝐜) (16)
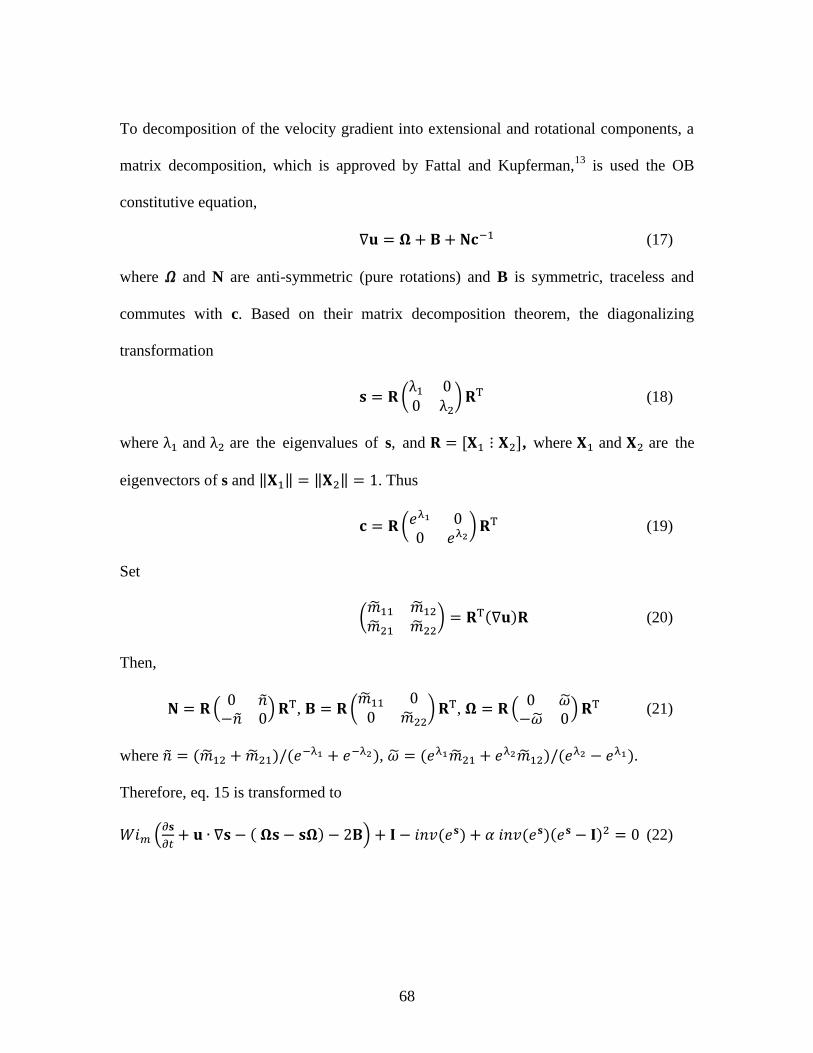
68
To decomposition of the velocity gradient into extensional and rotational components, a
matrix decomposition, which is approved by Fattal and Kupferman,13
is used the OB
constitutive equation,
∇𝐮 = 𝛀 + 𝐁 + 𝐍𝐜−1 (17)
where 𝛺 and N are anti-symmetric (pure rotations) and B is symmetric, traceless and
commutes with c. Based on their matrix decomposition theorem, the diagonalizing
transformation
𝐬 = 𝐑 (λ1 00 λ2
) 𝐑T (18)
where λ1 and λ2 are the eigenvalues of s, and 𝐑 = [𝐗1 ⋮ 𝐗2], where 𝐗1 and 𝐗2 are the
eigenvectors of s and ‖𝐗1‖ = ‖𝐗2‖ = 1. Thus
𝐜 = 𝐑 (𝑒λ1 00 𝑒λ2
) 𝐑T (19)
Set
(�̃�11 �̃�12
�̃�21 �̃�22) = 𝐑T(∇𝐮)𝐑 (20)
Then,
𝐍 = 𝐑 (0 �̃�
−�̃� 0) 𝐑T, 𝐁 = 𝐑 (
�̃�11 00 �̃�22
) 𝐑T, 𝛀 = 𝐑 (0 �̃�
−�̃� 0) 𝐑T (21)
where �̃� = (�̃�12 + �̃�21)/(𝑒−λ1 + 𝑒−λ2), �̃� = (𝑒λ1�̃�21 + 𝑒λ2�̃�12)/(𝑒λ2 − 𝑒λ1).
Therefore, eq. 15 is transformed to
𝑊𝑖𝑚 (∂𝐬
∂𝑡+ 𝐮 ∙ ∇𝐬 − ( 𝛀𝐬 − 𝐬𝛀) − 2𝐁) + 𝐈 − 𝑖𝑛𝑣(𝑒𝐬) + 𝛼 𝑖𝑛𝑣(𝑒𝐬)(𝑒𝐬 − 𝐈)2 = 0 (22)

69
This log-conformation method is to overcome a stability/stiffness problem associated
with the balance between stress advection and stress amplification, and to guarantee
positive definiteness of the recovered conformation tensor.14,15
The particle transport was simulated by Lagrangian particle tracking method16
in
COMSOL 4.4. The particle-particle and particle-fluid interactions were neglected due to
small particle size. The dimensionless particle velocity is given by
𝐔𝑝 = 𝐮 + 𝐄 + 𝜇𝐷𝐸𝑃/𝜇𝐸𝑃(𝐄 ∙ 𝛁𝐄) (23)
where 𝜇𝐸𝑃 = 𝜀𝜀0𝜁𝑝/𝜇 , 𝜇𝐷𝐸𝑃 = 𝜀𝑑2𝑓𝐶𝑀/6𝜇 and the particle diameter d. The Clausius-
Mossotti (CM) factor 𝑓𝐶𝑀 = (𝜎𝑝 − 𝜎𝑓)/(𝜎𝑝 + 2𝜎𝑓). The electric conductivity of particles
𝜎𝑝 = 4 × 10⁻⁹[𝑠]/𝑑 and the electric conductivity of fluid 𝜎𝑓 is 200 𝜇𝑆/𝑐𝑚.
4.4 Results and discussion
Fig. 1(a) shows the results of particle trajectories in the Newtonian solution. The
fluid flows from top to bottom while the particles move in the opposite direction. The
DEP effect is very weak in a large range of electric field since the small particles are
barely focused after passing through the constriction. The particle velocity can be
considered as a liner superposition of flow velocity (EO), EP and DEP velocities, of
which the EP and DEP components are only dependent on the electric field and not
affected by flow field. The particle trajectory can reflect the streamlines of flow field.
Therefore, if there is any abnormal particle trajectory, it is the contribution of flow field
only. In fig.1 (a), the particle trajectories appear similar in a large range of flow field.
Particles flow through the constriction smoothly. The particles get slightly focused at the
70
upstream due to the weak DEP effect. These results of Newtonian fluid agree with
previous work.17
Fig. 1. Particle trajectories of 1.01 μm particles in Newtonian solution (a) and PEO
solution (b) at different voltages. The electroosmotic direction is from top to bottom and
the electrokinetic particle motion is in the opposite direction.
However, the particle trajectories in PEO solution are distinctly different from the
Newtonian case in large range of electric field as shown in fig. 1(b). The trajectories look
similar with the Newtonian one at 100V, but they are slightly deformed and asymmetric
along the centerline at the constriction entrance in the upstream of the fluid at 200V. The
deformation of trajectories becomes larger at 300V and grows with rising electric field.
At 1000V, the particle streams show chaotic pattern. To observe the chaotic pattern more
clearly, two snapshot images are introduced in fig. 2(a). The deformations do not only
exist at the entrance of constriction, but also extend towards the upstream which are
about 100 μm above the constriction. The curved streamlines are unstable and time

71
dependent. In fig. 2 (b), the results of 0.53 μm particles at the same conditions are
provided, in which the curved streamlines are comparable with the 1.01 μm particles.
This demonstrates the size-independence of small particles. We believe that the
extensional viscoelastic instability is the source of this electroosmotic perturbation. The
extensional instability was also reported by Bryce and Freeman7,8
experimentally. The
instability exists primarily at the upstream and grows with electric field/electroosmotic
speed.
Fig. 2. Snapshot images of 1.01 μm (a) and 0.53 μm (b) particles in PEO solution at
1000V.
In our previous works,1,2
the viscoelastic electrokinetic motion of large particles is
more complicated than the present one of small particles, because the DEP effect is
strong and the particle-fluid interaction of large particles significantly affects the
electroosmosis. Although we are still not able to determine the mechanism of the
electrokinetic particle motion by this flow visualization study, the viscoelastic effect is
proved to influence the electroosmosis, which affects the electrokinetic particle motion.
Fig. 3 shows the numerical results in the Newtonian (a) and OB (b) models. The
background color shows the normalized velocity magnitude, V/Vc, where Vc is the slip
72
velocity in the wide channel. The particle trajectories are plotted, which are similar with
the streamlines of flow field in Fig. 1 (a). In the result of OB model (b) with Wim=46,
corresponding to Wi=10 in experiment, no deformed streamlines are observed. The 2D
OB model fails to predict the disturbed particle trajectories in experiment. Fig. 3 (c)
shows that the differences between the Newtonian and OB models are the velocity
magnitude in the middle area of the channel. The velocities predicted by the OB model
are always smaller than those in the Newtonian model. The viscoelastic effect decreases
the flow velocity and flow rate in electroosmosis, which agrees with Park and Lee’s
work.12
Fig. 3. Flow fields of Newtonian model (a) and OB model (b) with Wim=46,
corresponding to Wi=10 in experiment. The background color shows the normalized
velocity magnitude (V/Vc, where Vc is the slip velocity in the wide channel). The black
lines indicate the particle trajectories. The velocity magnitudes are plotted in (c) for
Newtonian model (dash lines) and OB model (solid lines) along the normalized lateral (y)
direction at the places which are 50 μm and 400 μm away from the constriction at the
upstream (indicated by the arrows in (a))
4.5 Conclusion
We have studied the flow visualization of electrokinetic flow in viscoelastic fluid
through a constriction microchannel. It is shown that the electrokinetic particle

73
trajectories, which represent the electroosmotic flow streamlines, are significantly
different between Newtonian and viscoelastic fluids. The deflected particle trajectories
are observed near the constriction entrance at the upstream of the fluid. They are
asymmetric along the centerline and grow with the electric field. At the high electric
field, the deformation of particle trajectories extends towards upstream and become time
dependent. The numerical result of Oldroyd-B model is presented at comparable Wi
number. But it fails to predict the deflected particle trajectories. Instead, the velocity in
the middle area of the channel, and hence the flow rate, in OB model is found smaller
than the Newtonian one.
References
1 X. Lu, S. Patel, M. Zhang, S.W. Joo, S. Qian, A. Ogale, and X. Xuan,
Biomicrofluidics 8, 021802 (2014). 2 X. Lu, J. DuBose, S. W. Joo, S. Qian, and X. Xuan, Biomicrofluidics 9, 014108
(2015). 3 J. P. Rothstein and G. H. Mckinley, J. Non-Newtonian Fluid Mech. 98, 33-63 (2001). 4 L. E. Rodd, T. P. Scott, D. V. Boger, J. J. Cooper-White, and G. H. McKinley, J.
Non-Newtonian Fluid Mech. 129, 1–22 (2005). 5 L. E. Rodd, J. J. Cooper-White, D. V. Boger, and G. H. McKinley, J. Non-Newtonian
Fluid Mech. 143, 170-191 (2007). 6 D. V. Boger, Annu. Rev. Fluid Mech. 19, 157–182 (1987). 7 S. A. White, A. D. Gotsis, and D. G. Baird, J. Non-Newtonian Fluid Mech. 24, 121–
160 (1987). 8 D. V. Boger and R. J. Binnington, J. Rheol. 38, 333–349 (1994). 9 R. M. Bryce and M. R. Freeman, Phys. Rev. E 81, 036328 (2010).
10 R. M. Bryce and M. R. Freeman, Lab Chip 10, 1436-1441 (2010). 11 A. M. Afonso, F.T. Pinho, and M. A. Alves, J. Non-Newtonian Fluid Mech. 179, 55-
68 (2012). 12 H. M. Park and W. M. Lee, Lab on a Chip 8, 1163-1170 (2008). 13 R. Fattal and R. Kupferman, J. Non-Newtonian Fluid Mech. 123, 281-5 (2004).

74
14 R. Guénette, A. Fortin, A. Kane, and J. F. Hétu, J. Non-Newtonian Fluid Mech. 153,
34-45 (2008). 15 A. M. Afonso, P. J. Oliveira, F. T. Pinho, and M. A. Alves, Journal of Fluid Mech.
677, 272-304 (2011). 16 K.H., Kang, X., Xuan, Y. Kang, and D., Li, Journal of Applied Physics 99(6), 064702
(2006). 17 J. Zhu and X. Xuan, Electrophoresis 30(15), 2668-2675 (2009).

75
CHAPTER FIVE
CONTINUOUS MICROFLUIDIC PARTICLE SEPARATION VIA ELASTO-
INERTIAL PINCHED FLOW FRACTIONATION (eiPFF)
Abstract
Many of the fluids encountered in chemical and biomedical applications exhibit
non-Newtonian behavior. However, the majority of current particle separation methods
have been demonstrated in Newtonian fluids only. This work presents an experimental
study of continuous particle separation in viscoelastic solutions via a combined action of
elastic and inertial lift forces, which we term elasto-inertial pinched flow fractionation
(eiPFF). The parametric effects on eiPFF are systematically investigated in terms of
dimensionless numbers. It is found that eiPFF offers much higher particle throughput and
separation resolution than the traditional steric effects-based PFF. Moreover, eiPFF
works most efficiently when the Reynolds number, Re, is of order 1, and hence fills
perfectly into the gap of our recently proposed inertia-enhanced PFF (iPFF) technique
(Anal. Chem. 2015, 87, 4560-4565) that favors Re of order 10 or more. However, the
particle separation via eiPFF does not increase monotonically with the elasticity number
at higher polymer concentrations and is strongly affected by the aspect ratio of channel
width to height, both of which have not been previously reported. More surprisingly, the
elasto-inertial deflection of small particles can be even greater than that of large particles
in a high-aspect-ratio channel for Re less than 1.
5.1 Introduction

76
In the past two decades microfluidic devices have become an attractive platform
for many chemical and biomedical applications due to their enhanced efficiency and
accuracy at a reduced cost.1 Separating target particles (synthetic or biological) from a
mixture in a continuous label-free manner is often a necessary step in these lab-on-a-chip
applications.2 It can be implemented based on the differences in intrinsic particle
properties such as size, shape or deformability through either an externally imposed or an
internally induced force field.3 The former type of active separation methods has been
achieved by the use of electric,4 optical,
5 acoustic,
6 or magnetic
7 field-induced cross-
stream phoretic motions. Additionally, a variety of passive separation methods have been
developed which exploit the confinement-induced electric or hydrodynamic force to
manipulate particles toward differential equilibrium positions.8 This type of approaches
covers insulator-based dielectrophoresis (iDEP),9 deterministic lateral displacement
(DLD),10
hydrodynamic filtration,11
hydrophoresis,12
split-flow thin-cell fractionation
(SPLITT),13
pinched flow fractionation (PFF),14
and inertial microfluidics15
etc.
However, all these continuous particle separation methods have thus far been
demonstrated in Newtonian fluids only.
As a matter of fact, many of the fluids that are encountered in practical
microfluidic applications like polymeric solutions and bodily fluids (e.g., blood and
saliva) are complex, and can exhibit strong non-Newtonian behaviors such as shear
thinning and viscoelasticity.16-18
Early studies of particle motion in non-Newtonian fluids
can be dated back to half a century ago,19-20
which are mostly concerned with the particle
sedimentation in a stationary fluid21
or the particle migration in a pipe flow.22
In the

77
former situation, anomalous particle motion has been reported such as velocity overshoot,
oscillation and even reversal23
due to the evolution of a negative wake.24
For particles in
viscoelastic pipe/slit flows, inward migration to the centerline has been experimentally
observed,25-27
which, as explored both theoretically28
and numerically,29,30
arises from the
normal stress difference in the fluid. However, the effect of shear thinning can cause
particles to migrate away from the centerline at increased flow rates.31,32
Recent studies of particle motion in non-Newtonian fluids have been shifted to
rectangular microchannels that are easily available with state-of-the-art micro-fabrication
techniques.33
The involving flows are three-dimensional, wherein particles have been
demonstrated to migrate toward multiple equilibrium positions including the centerline
and the four corners.34,35
This cross-stream particle migration to the regions of low shear
rate is again a result of the normal stress difference in a viscoelastic fluid. The
equilibrium positions can be reduced to only one along the channel centerline by the
combined action of elastic and inertial effects,36
which, however, is still strongly
influenced by the fluid rheology.37,38
Such a three-dimensional focusing effect has been
demonstrated for a variety of (bio)particles, and can remain effective at extremely high
flow rates in a hyaluronic acid-based weakly elastic fluid.39
It has also been utilized to
selectively enrich and filter the larger particles from a particle mixture.40
In addition,
similar single-line particle focusing has been observed in viscoelastic flows through both
a rectangular microchannel with side-wells41
and a spiral microchannel.42
Besides aligning particles in planar microchannels for detecting and analyzing
purposes,43,44
the cross-stream particle migration in viscoelastic flows has also been
78
demonstrated to separate particles in few recent studies. Yang et al.45
reported that fresh
red blood cells in a polyvinylpyrrolidone (PVP)-based phosphate buffered saline (PBS)
solution can be directed toward the centerline of a straight square microchannel by the
cell deformability-induced lift.46
In contrast, rigidified red blood cells are mostly
entrained along the corners due to the fluid viscoelasticity-induced lift under negligible
inertia. The authors further utilized this phenomenon to isolate white blood cells (which
are more rigid than red blood cells) from dilute whole blood with a high enrichment
ratio.45
Nam et al.47
developed a simple method that exploits the particle size-dependence
of elastic and inertial lift forces in viscoelastic fluids to continuously separate large
particles from a sheath flow-focused particle mixture solution near the walls. This
method was demonstrated to sort platelets from dilute whole blood in a polyethylene
oxide (PEO)-based PBS solution with a purity of close to 99.9%. A similar idea was later
employed by Kang et al.26
to implement a continuous separation of multiple polystyrene
particles in an extremely dilute DNA solution.
The continuous particle separation method developed by Nam et al.47
is similar to
PFF14
in configuration and depends on the combined action of elastic and inertial lift
forces in a viscoelastic fluid, so we term it elasto-inertial pinched flow fractionation
(eiPFF). As compared to inertial microfluidics,15,48
eiPFF is able to separate much smaller
particles such as 1-2 µm in diameter26
and can even potentially separate submicron
particles34
though at a smaller throughput. Moreover, it has the capability of separating
complex samples (e.g.. quaternary mixture of particles26
) and works for biological cells
via the use of biocompatible polymer solutions (e.g., PVP45
and hyaluronic acid39
). Since

79
a direct numerical simulation of particle motion in viscoelastic fluids is currently still
very challenging, this work presents a systematic experimental study of the parametric
effects on continuous particle separation via eiPFF. The aim is to acquire a
comprehensive understanding of the important factor(s) that may impact eiPFF and
provide a useful guidance for future design and control of this novel microfluidic
separation technique.
5.2 Experiment
5.2.1 Preparation of particle suspensions
3.1 µm- and 9.9 µm-diameter (referred to hereafter as 3 µm and 10 µm for
brevity) polystyrene spheres (Thermo Scientific) were used in the separation
experiments. They were mixed at an approximately 2:1 number density ratio and re-
suspended in aqueous Newtonian and non-Newtonian fluids to a final concentration of
about 107
particles per milliliter. The Newtonian fluid was prepared by mixing 21 wt.%
glycerol (Fisher Scientific) with water (Fisher Scientific) to match the mass density of
polystyrene particles (1.05 g/cm3).
49 The non-Newtonian fluids were prepared by
dissolving PEO powder (Sigma-Aldrich USA, molecular weight Mw = 2106 Da) into the
glycerol (21 wt.%)/water solution at the concentrations of 500 ppm, 1000 ppm, and 2000
ppm, respectively. The properties of the prepared Newtonian and non-Newtonian fluids
at 20 °C (the operation temperature of all experiments) are summarized in Table 1. The
process for determining the relaxation times are provided in the Supporting Information
(Appendix A).

80
Table 1. Properties of the 21 wt.% glycerol/water-based Newtonian and non-Newtonian
fluids used in experiments.
Fluid properties (at 20 °C) Newtonian
Non-Newtonian (c, ppm PEO)
500 1000 2000
Density (g/cm3) 1.05 1.05 1.05 1.05
Zero-shear viscosity 𝜂0 (mPa∙s) 1.8 2.8 4.0 10.6
Overlap concentration c* (ppm) 858 858 858
Concentration ratio c/c* 0.58 1.17 2.33
Zimm relaxation time, Zimm (ms) 0.6 0.6 0.6
Effective relaxation time, e (ms) 7.9 12.4 19.5
5.2.2 Experimental setup
Figure 1 shows a picture of the asymmetric T-shaped microchannel used in
experiments, which was fabricated in polydimethylsiloxane (PDMS) using the standard
soft lithography method.50
The channel has a 2 cm-long main-branch and two 4 mm-long
side-branches with a uniform width of 50 µm. There is a 900-µm wide, 2 mm-long
expansion at the end of the main-branch for enhancing and visualizing the particle
separation. Three depths of channels were used for the purpose of examining the effect of
channel aspect ratio on particle separation, which are 25, 40 and 100 µm, respectively.
The prepared sheath fluid (i.e., the pure suspending medium of the particle mixture) and
particle mixture were each pumped through the T-shaped microchannel (see Figure 1) by
an infusion syringe pump (sheath fluid, KDS-100 from KD Scientific; particle
suspension, NE-300 from New Era Pump Systems, Inc.). Particle motion was visualized
at the T-junction and the channel expansion (highlighted by the dashed-box in Figure 1)
through an inverted microscope (Nikon Eclipse TE2000U) with a CCD camera (Nikon

81
DS-Qi1Mc). They were post-processed using the Nikon imaging software (NIS-Elements
AR 3.22).
Figure 1. Top-view picture of the asymmetric T-shaped microchannel (filled with green
food dye for clarity) used in experiments. The block arrows indicate the flow directions
of the sheath fluid (which is the pure suspending medium of the particle mixture) and
particle mixture for particle separation, which is visualized at the 900 µm-wide expansion
region at the end of the 2 cm-long, 50 µm-wide main-branch (highlighted by a dashed-
box highlights).
5.3 Theoretical
5.3.1 Dimensionless numbers
The dynamics of particle motion in non-Newtonian fluids through microchannels
is often characterized by the following dimensionless numbers:15,33,48
Reynolds number,
Weissenberg number and elasticity number. The Reynolds number, Re, is defined as the
ratio of the inertial force to the viscous force,
𝑅𝑒 =𝜌𝑉𝐷ℎ
𝜂0=
2𝜌𝑄
𝜂0(𝑤+ℎ) (1)
where V is the average fluid velocity in the main-branch of the T-shaped microchannel
(see Figure 1), Dh = 2wh/(w+h) is the hydraulic diameter with w and h being the width
and height of the main-branch, and Q is the volumetric flow rate through the main-
Sheath fluid
Particle mixture
2 cm long
50 µm wide 900 µm
Separated particles
82
branch. The Weissenberg number, Wi, measures the fluid elasticity effects and is defined
in terms of the average shear rate, �̇�, in the main-branch,
𝑊𝑖 = 𝜆𝑒�̇� = 𝜆𝑒2𝑉
𝑤=
2𝜆𝑒𝑄
𝑤2ℎ (2)
The elasticity number, El, is defined as the ratio of fluid elasticity to inertia, which is
independent of the flow kinematics,
𝐸𝑙 =𝑊𝑖
𝑅𝑒=
𝜆𝑒𝜂0(𝑤+ℎ)
𝜌𝑤2ℎ (3)
Two other dimensionless numbers are also used in this work to study the parametric
effects on particle separation via eiPFF. One is the flow rate ratio between the sheath
fluid and particle mixture, , in the two side-branches of the T-shaped microchannel,
which measures the sheath flow focusing performance in the main-branch and affects the
particle deflection and dispersion at the channel expansion,
𝛼 =𝑄𝑠ℎ𝑒𝑎𝑡ℎ
𝑄𝑝𝑎𝑟𝑡𝑖𝑐𝑙𝑒 (4)
Note that the definitions of Re and Wi in eq 1 and eq 2, respectively, are both based on
the total flow rate in the main-branch of the microchannel, i.e., 𝑄 = 𝑄𝑠ℎ𝑒𝑎𝑡ℎ + 𝑄𝑝𝑎𝑟𝑡𝑖𝑐𝑙𝑒.
The other dimensionless number is the channel aspect ratio, AR, as mentioned in the
Experimental section,
𝐴𝑅 = 𝑤/ℎ (5)
which has been demonstrated to affect the equilibrium position(s) of particles in inertial
microfluidics with Newtonian fluids.15,48
5.3.2 Mechanism of eiPFF

83
In traditional PFF,14
particles of different sizes must first be aligned against one
sidewall of the pinched branch (i.e., the main-branch of the T-shaped microchannel in
Figure 1) by a strong sheath flow. This forces the centers of the particles to locate at
different streamlines due to steric effects,14,51
i.e., the center of larger particles stays
further away from the wall than that of smaller ones. Subsequently, the spreading laminar
flow profile at the exit of the pinched branch (i.e., the expansion of the main-branch in
Figure 1) yields a continuous separation of particles based on size. For a theoretically
complete separation via PFF, the maximum allowed width of the sheath flow-focused
particulate solution in the main-branch, 𝑤𝑝,𝑚𝑎𝑥, must fulfill (see the clarification in the
Supporting Information),52
𝑤𝑝,𝑚𝑎𝑥 = 𝑟𝑝1 + 𝑟𝑝2 (6)
where 𝑟𝑝1 and 𝑟𝑝2 are the radii of the two types of particles to be separated. This 𝑤𝑝,𝑚𝑎𝑥
corresponds to the limiting situation for which the larger particles share the same center
position as those smaller particles that are most distant from the wall. Since its first
introduction,14
PFF has been improved by either reducing the particle dispersion53
via an
enhanced sheath flow focusing54
or increasing the particle displacement via an extra force
field (e.g., electrical lift,55
inertial lift,56
optical force57
and gravity58
).

84
Figure 2. Schematic illustration (not to scale) of the mechanism for eiPFF. The sheath-
fluid focused particle-mixture solution (highlighted by the background color) has a width
of 𝑤𝑝 in the main-branch, which for traditional PFF should be smaller than the maximum
allowed width, 𝑤𝑝,𝑚𝑎𝑥, given in eq 6. In eiPFF, this constraint is released because the
elastic lift force, 𝐅𝑒𝐿 , and inertial lift force, 𝐅𝑖𝐿, induced in a viscoelastic fluid act together
to deflect particles toward the channel center at a size-dependent rate.
In contrast, eiPFF exploits the inherent elastic and inertial lift forces induced in a
viscoelastic fluid flow to increase the lateral particle deflection for an enhanced
separation. The particles to be separated need not be tightly focused, i.e., the width of the
particulate solution in the main-branch can be (much) greater than the maximum allowed
width, i.e., 𝑤𝑝,𝑚𝑎𝑥 , in eq 6 as we will demonstrate in the results section below.
Consequently, the particle throughput in eiPFF will be significantly higher than that in
the traditional PFF. Figure 2 displays the forces exerted on the particles in a viscoelastic
fluid that have been focused by a sheath fluid to a layer near a sidewall. 𝐅𝑒𝐿 represents the
elastic lift force given by,25,36
𝐅𝑒𝐿~𝑟𝑝3∇𝐍1~𝑟𝑝
3𝑊𝑖�̇�2 (7)
Sheath fluid
Particle mixture

85
where 𝑟𝑝 is the particle radius and 𝐍1 is the first normal stress difference. It increases
with Wi and directs particles toward the regions of lower shear rate, i.e., the centerline
and the four corners in a rectangular channel.33
The inertial lift force, FiL, has the wall-
and the shear gradient-induced components, where the former pushes particles away from
the channel wall and the latter acts to direct particles toward the regions of high shear
rate.15,48
For near-wall particles, 𝐅𝑖𝐿 has been demonstrated to follow59
𝐅𝑖𝐿~ 𝜌𝑉𝑚2𝑟𝑝
6 𝑤4⁄ (8)
with 𝑉𝑚 being the maximum fluid velocity. As indicated by the arrows in Figure 2, 𝐅𝑒𝐿
and 𝐅𝑖𝐿 work together to deflect particles toward the channel center. This is why we term
this particle separation approach eiPFF, which is efficient due to the strong dependence
of both types of lift forces on particle size.
5.4 Results and discussion
5.4.1 Effects of fluid elasticity (Wi) and inertia (Re)
Figure 3 shows the effects of fluid elasticity (in terms of Wi) and inertia (in terms
of Re) on the continuous separation of 3 µm and 10 µm particles in Newtonian (El = 0,
top row) and non-Newtonian (1000 ppm PEO with El = 42.5, bottom row) fluids,
respectively, in a 40-µm deep channel. The flow rate ratio between the sheath fluid and
particle mixture was maintained at = 20. A 3D numerical simulation of the flow field
(COMSOL
) reveals that at this ratio the particle solution is squeezed to a fluid layer
with 𝑤𝑝 = 7 µm (more accurately, varying from 6.5 µm in the middle plane to 7.5 µm
near the top/bottom walls; see the highlighted dimension in Figure 2) in the main-branch.

86
This value is slightly larger than the maximum allowed width of the focused particle
solution, i.e., 𝑤𝑝,𝑚𝑎𝑥 = (3.1+9.9)/2 = 6.5 µm in eq 6, for the traditional PFF. In other
words, the two particles cannot be completely separated by PFF at = 20. This analysis
is consistent with the particle separation in the Newtonian fluid at Qsheath = 0.1 ml/h in
Figure 3 (top row), where both sizes of particles experience a negligible inertial lift in the
main-branch at Re = 0.35 and still overlap with each other at the expansion. With the
increase of Re, 10 µm particles experience a greater inertial lift and are pushed away
from the wall at a visibly higher rate than 3 µm ones. An almost clear gap with only a
few particles of either size present is thus formed in between the two particle streams as
seen from the images at Qsheath = 0.3-1 ml/h in Figure 3 (top row). This separation does
not seem to get apparently better at flow rates higher than 1.0 ml/h (Re = 3.72) due to the
influence of particle dispersion, which is mainly caused by the insufficient particle
focusing and the parabolic fluid velocity profile in the channel depth.
Figure 3. Superimposed images at the expansion of the main-branch comparing the
continuous separation of 3 µm (appearing gray) and 10 µm (appearing black) particles in

87
glycerol/water-based Newtonian (top row, El = 0) and non-Newtonian (bottom row, 1000
ppm PEO, El = 42.5) fluids at various sheath flow rates (indicated on top of the images)
in a 40 µm deep T-shaped microchannel. The flow rate ratio between the sheath fluid and
particle mixture was maintained at = 20. The arrows on the right-most images indicate
the reference points to which the particle stream positions shown in Figures 4 and 8 were
measured. The flow direction is from left to right in all images.
In contrast, the non-Newtonian fluid yields a considerably better separation of 3
µm and 10 µm particles; see the bottom row images in Figure 3. This is attributed to the
elasticity-enhanced deflections of both particles in the viscoelastic fluid. At the sheath
flow rate Qsheath = 0.1 ml/h, 10 µm particles seem to have an (unstable) equilibrium
position near the channel wall (or more accurately, the corner) other than that along the
centerline. This phenomenon is absent from 3 µm particles and happens due to the
dominant elastic lift force at Wi = 7.2 over the inertial lift force at Re = 0.17, which is
consistent with previous observations.34-36
With the increase of both Re and Wi at higher
flow rates, 10 µm particles migrate toward the channel centerline yielding a wide and
clear gap from the stream of 3 µm particles. However, the deflection of 10 µm particles
does not increase monotonically with Re due to the combined effects of viscoelastic and
inertial lift forces, which direct particles toward the channel centerline33-37
and the half-
way (specifically 0.4 times the channel half-width from the wall),15,48,59
respectively. It
achieves the maximum at Qsheath = 1 ml/h with Re = 1.70 among the tested cases in Figure
3 (bottom row), where 10 µm particles are still slightly off the channel center. This
implies that the previously reported elasto-inertial particle focusing along the centerline
of a straight square microchannel36,40,45
is sensitive to the flow kinematics and works
within a narrow range of flow rate.

88
Figure 4. Comparison of the exiting positions of 3 µm and 10 µm particle streams at the
expansion of the main-branch (measured from the images in Figure 3 with reference to
the top sidewall as indicated by the arrows) in Newtonian (dashed lines with unfilled
symbols) and non-Newtonian (solid lines with filled symbols) fluids. Error bars are
included for only 3 µm particles in the Newtonian fluid and 10 µm particles in the non-
Newtonian fluid for a non-blocked view, which encompass the span of each particle
stream. The single data point with a circular symbol near the origin of the plot indicates
an (unstable) equilibrium position at the corner of the channel for 10 µm particles in the
non-Newtonian fluid due to the dominant elastic lift force at a negligible Re. Note that all
lines are used to guide eyes only.
A quantitative comparison of the exiting positions of 3 µm- and 10 µm-particle
streams in the Newtonian and non-Newtonian fluids is shown in Figure 4. The data
(symbols) were measured directly from the particle images in Figure 3, where the top
sidewall of the channel expansion was used as the reference point (see the arrows in
Figure 3) and the center of the particle traces with the lowest intensity (note the lower
intensity, the darker in a gray-scale image) was used as the measuring point. In the
Newtonian fluid, the center position of the 3 µm particle stream changes slightly at
0
100
200
300
400
500
0 1 2 3 4 5
Part
icle
str
eam
posi
tion
(μ
m)
Sheath flow rate (ml/h)
10 µm non-Newton.
3 µm non-Newton.
10 µm Newtonian
3 µm Newtonian

89
around 80 µm (with 50 µm error bars included in Figure 4 to cover the span of the
stream) for the range of flow rates tested. This indicates that 3 µm particles remain
confined within the sheath flow-focused particulate solution, which, as noted above, is
about 7 µm wide in the 50 µm-wide main-branch and should become around 126 µm in
the 900 µm-wide expansion due to the laminar flow feature. In the non-Newtonian fluid,
however, 3 µm particles can travel out of the sheath flow-focused particulate solution due
to the elastic lift force. Their deflection remains nearly unchanged at around 150 µm
when Qsheath 1 ml/h (Re = 1.7; see Figure 3) and decreases slightly at higher flow rates.
The displacement of 10 µm particles increases at a higher flow rate in the Newtonian
fluid, which converges to the previously reported equilibrium position for inertial particle
focusing in a (nearly) square microchannel,15,48,59
i.e., 0.4(900/2) = 180 µm. Moreover,
the 10 µm particle deflection in the non-Newtonian fluid (with error bars included in
Figure 4) seems to approach the same equilibrium position as in the Newtonian fluid at
high flow rates. The former is, however, more than twice larger when Qsheath < 2 ml/h (Re
= 3.40) due to the dominant elasticity over inertia.
5.4.2 Effect of flow rate ratio () between sheath fluid and particle mixture
The effect of flow rate ratio, , between sheath fluid and particle mixture on
particle separation via eiPFF was studied in 1000 ppm PEO solution by fixing the sheath
flow rate at Qsheath = 0.3 ml/h while varying the particle flow rate from 90 µl/h (i.e., =
3.3) to 6 µl/h (i.e., = 50) in a 40 µm deep T-shaped microchannel. Figure 5 shows the
superimposed images of 3 µm and 10 µm particles at the T-junction (top row) and

90
expansion (bottom row) of the main-branch, which clearly demonstrate an enhanced
particle separation with the increase of . Since the total flow rate in the main-branch
does not change significantly, Re (labeled on the images in Figure 5) slightly decreases
from 0.63 to 0.50 when (as labeled on the images) increases from 3.3 to 50.
Accordingly, Wi also decreases slightly to maintain the elasticity number at El = 42.5.
These indicate nearly constant inertial and elastic effects for the cases tested in Figure 5,
which explains why the average deflections of 3 µm and 10 µm particles at the expansion
remain nearly unaffected by the change of (see the two dotted lines across the images
in the bottom row).
Figure 5. Superimposed images at the T-junction (top row) and expansion (bottom row)
of the main-branch illustrating the sheath-flow focusing and elasto-inertial separation of 3
µm and 10 µm particles in 1000 ppm PEO solution through a 40 µm deep T-shaped
microchannel. The volume flow rate of the sheath fluid, Qsheath, was maintained at 0.3
ml/h in all cases. The flow rate ratio between the sheath fluid and particle mixture, , was
varied as seen on the images. The two dotted lines across the images are used to assist
viewing the effects of on the exiting positions of the separated particle streams. The
block arrows indicate the flow directions.
However, as viewed from the images at the T-junction in Figure 5 (top row), the
particle mixture solution is squeezed by the sheath fluid to a narrower layer in the main-
91
branch with the increase of . This enhanced focusing helps aligning both sizes of
particles, especially important for the smaller ones, against the channel wall, leading to a
smaller band of each particle type at the expansion (see the bottom row images in Figure
5). Our 3D flow simulation (COMSOL
) tells that the width of the sheath flow-focused
particulate solution, i.e., 𝑤𝑝 as highlighted in Figure 2, decreases from 15.1 µm to 13.0,
9.9, 7.4 and 5.5 µm for the tested values of at 3.3, 5, 10, 20, and 50 in Figure 5. The
first five width values are all greater than the maximum allowed width, i.e., 𝑤𝑝,𝑚𝑎𝑥 = 6.5
µm, for a theoretically 100% separation via PFF. As a decent separation can be achieved
at as low as 5, eiPFF is able to offer a much higher particle throughput than PFF (which
works only for > 30 based on our 3D flow simulation) at the same sheath flow rate.
5.4.3 Effect of PEO concentration (in terms of El)
Figure 6 shows the effect of PEO concentration on the separation of 3 µm and 10
µm particles via eiPFF in a 40 µm deep T-shaped microchannel. The sheath flow rate,
Qsheath, was varied to include the inertial effect, but the flow rate ratio was maintained at
= 20. Three different PEO concentrations were tested, which are 500 ppm, 1000 ppm
and 2000 ppm. As the fluid viscosity and relaxation time (see Table 1) both increase at a
higher PEO concentration, Re (labeled on the images) decreases while Wi increases
yielding a significantly increasing El as highlighted in Figure 6. To assist viewing the
concentration effect on the particle stream positions, dotted lines, which indicate the
exiting positions of 3 µm and 10 µm particles in 1000 ppm PEO solution (El = 42.5),
have been added onto the images in Figure 6. For the range of flow rates tested (up to

92
Qsheath = 5 ml/h), 3 µm particles attain a larger deflection with the increase of PEO
concentration due to a stronger elastic lift force. Their trajectories, however, do not
change significantly with Re, except in 2000 ppm PEO solution. These behaviors are
better viewed from the exiting stream positions in Figure 7. The deflection of 3 µm
particles in 2000 ppm PEO solution quickly decreases from around 260 µm to 100 µm
with the increase of flow rate. This phenomenon is believed to be a consequence of the
shear thinning effect that gets stronger at a higher PEO concentration and tends to move
particles away from the channel centerline.31,32

93
Figure 6. Superimposed images at the expansion of the main-branch illustrating the
effect of PEO concentration (500, 1000 and 2000 ppm from left to right; in terms of El)
on the separation of 3 µm and 10 µm particles via eiPFF in a 40 µm deep T-shaped
microchannel. The flow rate ratio between sheath fluid (labeled to the left of the images)
and particle mixture was fixed at 20. The dotted lines across the images, which indicate
the exiting positions of the two types of particles in 1000 ppm PEO solution, are drawn to
assist viewing the PEO concentration effect on the particle stream positions at the
expansion.
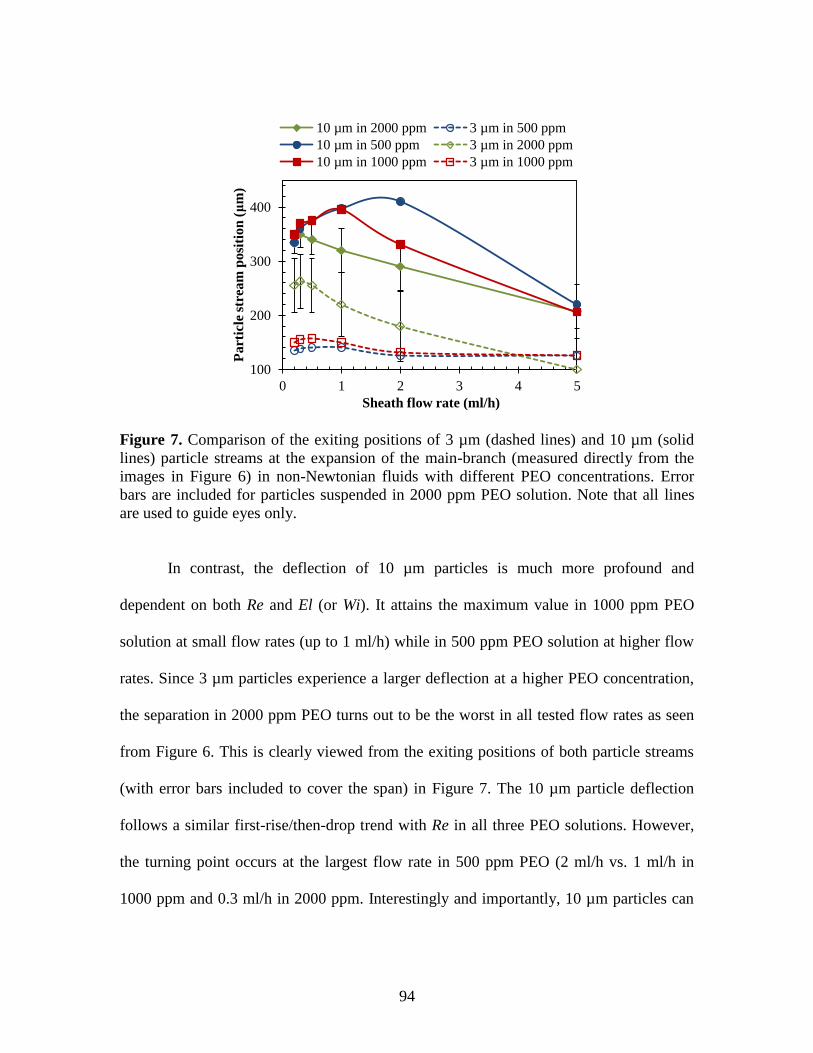
94
Figure 7. Comparison of the exiting positions of 3 µm (dashed lines) and 10 µm (solid
lines) particle streams at the expansion of the main-branch (measured directly from the
images in Figure 6) in non-Newtonian fluids with different PEO concentrations. Error
bars are included for particles suspended in 2000 ppm PEO solution. Note that all lines
are used to guide eyes only.
In contrast, the deflection of 10 µm particles is much more profound and
dependent on both Re and El (or Wi). It attains the maximum value in 1000 ppm PEO
solution at small flow rates (up to 1 ml/h) while in 500 ppm PEO solution at higher flow
rates. Since 3 µm particles experience a larger deflection at a higher PEO concentration,
the separation in 2000 ppm PEO turns out to be the worst in all tested flow rates as seen
from Figure 6. This is clearly viewed from the exiting positions of both particle streams
(with error bars included to cover the span) in Figure 7. The 10 µm particle deflection
follows a similar first-rise/then-drop trend with Re in all three PEO solutions. However,
the turning point occurs at the largest flow rate in 500 ppm PEO (2 ml/h vs. 1 ml/h in
1000 ppm and 0.3 ml/h in 2000 ppm. Interestingly and importantly, 10 µm particles can
100
200
300
400
0 1 2 3 4 5
Part
icle
str
eam
posi
tion
(μ
m)
Sheath flow rate (ml/h)
10 µm in 2000 ppm 3 µm in 500 ppm
10 µm in 500 ppm 3 µm in 2000 ppm
10 µm in 1000 ppm 3 µm in 1000 ppm
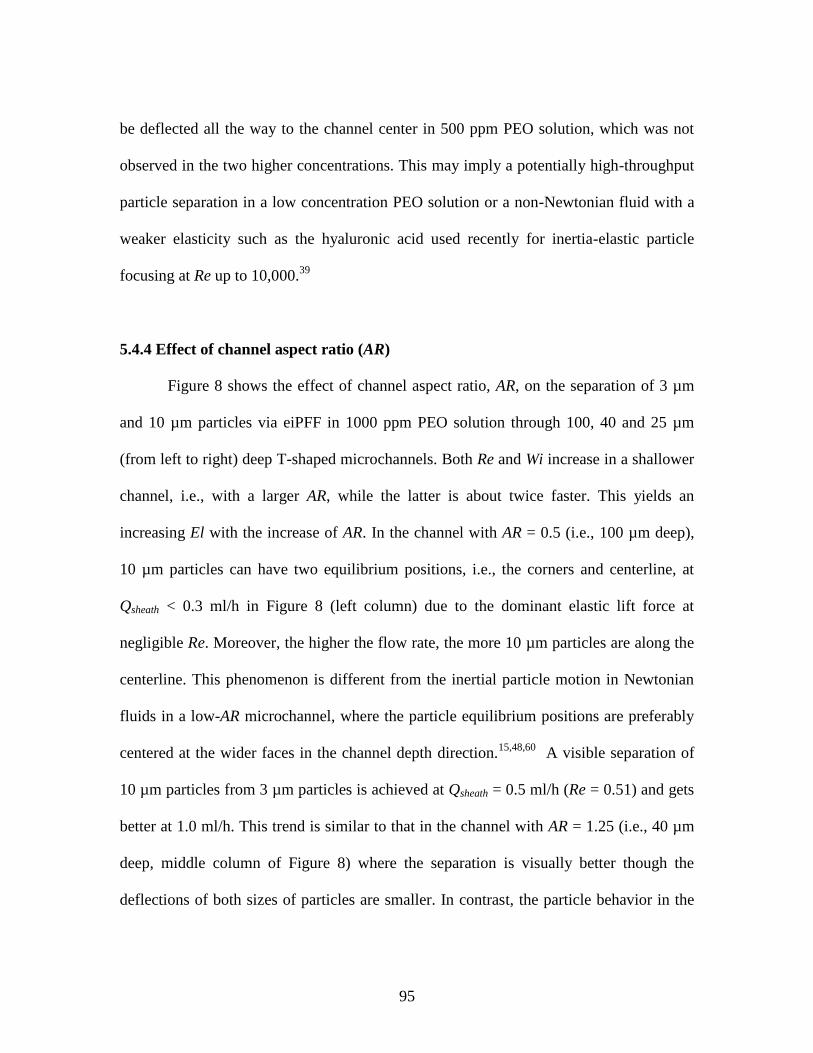
95
be deflected all the way to the channel center in 500 ppm PEO solution, which was not
observed in the two higher concentrations. This may imply a potentially high-throughput
particle separation in a low concentration PEO solution or a non-Newtonian fluid with a
weaker elasticity such as the hyaluronic acid used recently for inertia-elastic particle
focusing at Re up to 10,000.39
5.4.4 Effect of channel aspect ratio (AR)
Figure 8 shows the effect of channel aspect ratio, AR, on the separation of 3 µm
and 10 µm particles via eiPFF in 1000 ppm PEO solution through 100, 40 and 25 µm
(from left to right) deep T-shaped microchannels. Both Re and Wi increase in a shallower
channel, i.e., with a larger AR, while the latter is about twice faster. This yields an
increasing El with the increase of AR. In the channel with AR = 0.5 (i.e., 100 µm deep),
10 µm particles can have two equilibrium positions, i.e., the corners and centerline, at
Qsheath < 0.3 ml/h in Figure 8 (left column) due to the dominant elastic lift force at
negligible Re. Moreover, the higher the flow rate, the more 10 µm particles are along the
centerline. This phenomenon is different from the inertial particle motion in Newtonian
fluids in a low-AR microchannel, where the particle equilibrium positions are preferably
centered at the wider faces in the channel depth direction.15,48,60
A visible separation of
10 µm particles from 3 µm particles is achieved at Qsheath = 0.5 ml/h (Re = 0.51) and gets
better at 1.0 ml/h. This trend is similar to that in the channel with AR = 1.25 (i.e., 40 µm
deep, middle column of Figure 8) where the separation is visually better though the
deflections of both sizes of particles are smaller. In contrast, the particle behavior in the

96
channel with AR = 2.0 (i.e., 25 µm deep) are much more interesting. As seen from the
images in the right column of Figure 8, the deflection of 10 µm particles can be either
smaller (at low flow rates) or larger (at high flow rates) than that of 3 µm particles
depending on the value of Re. This switch takes place at Qsheath = 0.5 ml/h where Re =
1.02. Such a surprising phenomenon also occurs for 500 and 2000 ppm PEO solutions in
the same channel (data not shown). It is, however, absent from the particle motion in
Newtonian fluids, where larger particles always migrate to the channel centerline faster
than smaller ones due to the rotation-induced inertial lift force.61
In addition, the stream
width of each size of particles in the 25 µm deep channel seems to be the narrowest
among the three channels due to perhaps the strongest steric effects from the top/bottom
walls therein.

97
Figure 8. Superimposed images at the expansion of the main-branch illustrating the
effect of aspect ratio, AR, on the 3 µm and 10 µm particle separation via eiPFF in T-
shaped microchannels of various depths (100, 40 and 25 µm from left to right). The
sheath flow rate, Qsheath, was varied as labeled while the flow rate ratio between sheath
fluid and particle mixture was fixed at 20.
Figure 9 compares the exiting positions of 3 µm and 10 µm particle streams (with
error bars included) at the expansion of the main-branch in T-shaped microchannels with
(A) AR = 0.5 (i.e., 100 µm deep) and (B) AR = 2.0 (i.e., 25 µm deep), respectively. These
two graphs can be compared directly to that in Figure 4 for the channel with AR = 1.25
(i.e., 40 µm deep). The deflection of 10 µm particles exhibits a similar trend in all three
0.1
ml/
h
0.3
ml/
h
1.0
ml/
h
Re = 0.10
Wi = 2.9 0
.5 m
l/h
200 µm
Re = 0.17
Wi = 7.2 Re = 0.20
Wi = 11.6
Re = 0.30
Wi = 8.7
Re = 0.51
Wi = 21.7
Re = 0.61
Wi = 34.7
Re = 0.51
Wi = 14.5
Re = 0.85
Wi = 36.2 Re = 1.02
Wi = 57.9
Re = 1.02
Wi = 28.9 Re = 1.70
Wi = 72.3 Re = 2.04
Wi = 115.7

98
depths of channels, which first increases with the rise of flow rate and then decreases at
higher flow rates. However, the maximum deflection decreases from 450 µm (right along
the centerline of the expansion) in the deepest channel to around 340 µm in the
shallowest channel. While the flow rate at which the maximum particle deflection
happens seems to remain at approximately 1 ml/h in all three channels, the slope of the
decreasing particle deflection with flow rate turns out to be the steepest in the 40 µm
deep channel. In contrast, the deflection of 3 µm particles in the 25 µm-deep channel
decreases with the increase of flow rate, which is apparently different from that in the two
deeper channels.
Figure 9. Comparison of the exiting positions (symbols with error bars, measured
directly from the images in Figure 8) of 3 µm and 10 µm particle streams in 1000 ppm
0
100
200
300
400
500
600
0 1 2 3 4 5
Part
icle
str
eam
posi
tion
(μ
m)
Sheath flow rate (ml/h)
10 µm
3 µm
(A)
0
100
200
300
400
0 1 2 3 4 5
Part
icle
str
eam
posi
tion
(μ
m)
Sheath flow rate (ml/h)
10 µm
3 µm
(B)

99
PEO solution at the expansion of the main-branch in T-shaped microchannels with (A)
AR = 0.5 (100 µm deep) and (B) AR = 2.0 (25 µm deep), respectively. The unfilled data
points in (A) represent a secondary equilibrium position (with fewer particles present) at
the corner of the channel for 10 µm particles. Note that all lines are used to guide eyes
only.
5.5 Conclusions
We have conducted a systematic experimental study of the continuous particle
separation in PEO solutions via eiPFF. Five dimensionless numbers, i.e., Re, Wi, El,
and AR, have been used to quantify the parametric effects for a fundamental
understanding of the important factors in device design and control. We have
demonstrated that eiPFF offers a much higher particle throughput and a much better
separation resolution than the traditional PFF. Moreover, as it works most efficiently for
Re of order 1, eiPFF fills perfectly into the gap of our recently proposed inertia-enhanced
PFF (iPFF) technique56
that requires Re of order 10 or more. This feature makes eiPFF
suitable for particle and cell separation in microfluidic devices that typically process a
limited amount of samples.62,63
In addition, eiPFF has the potential to separate particles of
1 µm diameter26
or even smaller34
, which is very hard (if not impossible) for iPFF56
and
other inertia-based separation techniques.15,48
We have also observed two new
phenomena that have not been reported in the literature: one is that the particle focusing
and separation via eiPFF does not increase monotonically with El at higher PEO
concentrations due to the mutual influences of elastic and inertial effects; and the other is
that the channel aspect ratio, AR, strongly affects the particle separation due to its
influence on the particle deflection. More surprisingly, the elasto-inertial deflection of
100
small particles can be even greater than that of large ones in a high-AR channel when Re
is less than 1.
Acknowledgements
This work was partially supported by Clemson University through a departmental
SGER (Small Grants for Exploratory Research) grant.
Supporting Information Available (Appendix A)
Details on how to determine the Newtonian and non-Newtonian fluid properties
in Table 1 and how to understand eq 6. This information is available free of charge via
the Internet at http://pubs.acs.org/.
References
(1) Pamme, N. Lab Chip 2007, 7, 1644-1659.
(2) Gossett, D. R.; Weaver, W. M.; Mach, A. J.; Hur, S. C.; Tse, H. T.; Lee, W.;
Amini, H.; Di Carlo, D. Anal. Bioanal. Chem. 2010, 397, 3249-3267.
(3) Karimi, A.; Yazdi, S.; Ardekani, A. M. Biomicrofluid. 2013, 7, 021501.
(4) Pethig, R. Biomicrofluid. 2010, 4, 022811.
(5) Kim, S. B.; Yoon, S. Y.; Sung. H. J.; Kim, S. S. Anal. Chem. 2008, 80, 2628-2630.
(6) Ding, X.; Li, P.; Lin, P. S. C.; Stratton, Z. S.; Nama, N.; Guo, F.; Slotcavage, D.;
Mao, X. Shi, J.; Costanzo, F.; Huang, T. J. Lab Chip 2013, 13, 3626-3649.
(7) Hejazian, M.; Li, W.; Nguyen, N. T. Lab Chip 2015, 15, 959-970.

101
(8) Watarai, H. Annu. Rev. Anal. Chem. 2013, 6, 353-378.
(9) Regtmeier, J.; Eichhorn, R.; Viefhues, M.; Bogunovic, L.; Anselmetti, D.
Electrophoresis 2011, 32, 2253-2273.
(10) Huang, L.; Cox, E. C.; Austin, R. H.; Sturm, J. C. Science 2004, 304, 987-990.
(11) Yamada, M.; Seki, M. Anal. Chem. 2006, 78, 1357-1362.
(12) Choi, S. Y.; Song , S.; Choi, C.; Park, J. K. Anal. Chem. 2009, 81, 1964-1968.
(13) Giddings, J. C. J. Chromatogr. 1989, 480, 21-33.
(14) Yamada, M.; Nakashima, M.; Seki, M. Anal. Chem. 2004, 76, 5465-5471.
(15) Martel, J. M.; Toner, M. Annu. Rev. Biomed. Eng. 2014, 16, 371-396.
(16) Pipe, C. J.; McKinley, G. H. Mech. Research Comm. 2009, 36, 110-120.
(17) Berli, C. L. A. Electrophoresis 2013, 34, 622-630.
(18) Zhao, C.; Yang, C. Adv. Colloid Interf. Sci. 2013, 201-202, 94-108.
(19) Karnis, A.; Goldsmith, H. L.; Mason, S. G. Nature 1963, 200, 159-160.
(20) Karnis, A.; Mason, S. G. Trans. Soc. Rheol. 1966, 10, 571-592.
(21) McKinley, G. H. Transport Processes in Bubbles, Drops & Particles, 2001,
chapter 14, 2nd Ed. Ed. R. Chhabra, D. De Kee, Taylor & Francis.
(22) Leal, G. J. Non-Newton. Fluid Mech. 1979, 5, 33-78.
(23) Becker, L. E.; McKinley, G. H.; Rasmussen, H. K.; Hassager, O. J. Rheol. 1994,
38, 377-403.
(24) Arigo, M. T.; Mckinley, G. H. Rheol. Acta 1998, 37, 307-327.
(25) Leshansky, A. M.; Bransky, A.; Korin, N.; Dinnar, U. Phys. Rev. Lett. 2007, 98,
234501.
102
(26) Kang, K.; Lee, S. S.; Hyun, K.; Lee, S. J.; Kim, J. M. Nat. Comm. 2013, 4, Article
number: 2567. doi:10.1038/ncomms3567.
(27) Romeo, G.; D’Avino, G.; Greco, F.; Nettiab, P. A.; Maffettone, P. L. Lab Chip
2013, 13, 2802-2807.
(28) Ho, B. P.; Leal, L. G. J. Fluid Mech. 1976, 76, 783-799.
(29) Huang, P. Y.; Feng, J.; Hu, H. H.; Joseph, D. D. J. Fluid Mech. 1997, 343, 73-94.
(30) Villone, M. M.; D’Avino, G.; Hulsen, M. A.; Greco, F.; Maffettone, P. L. J. Non-
Newton. Fluid Mech. 2011, 166, 1396-1405.
(31) Huang, P. Y.; Joseph, D. D. J. Non-Newtonian Fluid Mech. 2000, 90, 159-185.
(32) Seo, K. W.; Byeon, H. J.; Huh, H. K. Lee, S. J. RSC Adv. 2014, 4, 3512-3520.
(33) D’Avino, G.; Maffettone, P. L. J. Non-Newton. Fluid Mech. 2015, 215, 80-104.
(34) Kim, J. Y.; Ahn, S. W.; Lee, S. S.; Kim, J. M. Lab Chip 2012, 12, 2807-2814.
(35) Seo, K. W.; Kang, Y. J.; Lee, S. J. Phys. Fluid. 2014, 26, 063301.
(36) Yang, S. Y.; Kim, J. Y.; Lee, S. J.; Lee, S. S.; Kim, J. M. Lab Chip 2011, 11, 266-
273.
(37) Giudice, F. D.; Romeo, G.; D’Avino, G.; Greco, F.; Netti, P. A.; Maffettone, P. L.
Lab Chip 2013, 13, 4263-4271.
(38) Lim, H.; Nam, J. Shin, S. Microfluid. Nanofluid. 2014, 17, 683-692.
(39) Lim, E. J.; Ober, T.; Edd, J. F.; Desai, S. P.; Neal, D.; Bong, K. W.; Doyle, P. S.;
McKinley, G. H.; Toner, M. Nat. Comm. 2014, 5, Article number: 4120.
doi:10.1038/ncomms5120.
(40) Ahn, S. W.; Lee, S. S.; Lee, S. J.; Kim, J. M. Chem. Eng. Sci. 2015, 126, 237-243.

103
(41) Cha, S.; Kang, K. You, J. B.; Im, S. G.; Kim, Y. Kim, J. M. Rehol. Acta 2014, 53,
927-933.
(42) Lee, D. L.; Brenner, H. Youn, J. R. Song, Y. S. Sci. Rep. 2013, 3, article number
3258. DOI: 10.1038/srep03258.
(43) Cha, S.; Shin, T.; Lee, S. S.; Shim, W.; Lee, G. Lee, S. J.; Kim, Y.; Kim, J. M.
Anal. Chem. 2012, 84, 10471-10477.
(44) Seo, K. W.; Ha, Y. R.; Lee, S. J. Appl. Phys. Lett. 2014, 104, 213702.
(45) Yang, S.; Lee, S. S.; Ahn, S. W.; Kang, K.; Shim, W.; Lee, G.; Hyune, K.; Kim, J.
M. Soft Matt. 2012, 8, 5011-5019.
(46) Geislinger, T. M.; Franke, T. Adv. Colloid Interf. Sci. 2014, 208, 161-176.
(47) Nam, J.; Lim, H.; Kim, D.; Jung, H.; Shin, S. Lab Chip 2012, 12, 1347-1354.
(48) Amini, H.; Lee, W.; Di Carlo, D. Lab Chip 2014, 14, 2739-2761.
(49) Liang, L.; Qian, S.; Xuan, X. J. Colloid Interf. Sci. 2010, 350, 377-379.
(50) Lu, X.; Patel, S.; Zhang, M.; Joo, S.; Qian, S.; Ogale, A.; Xuan, X. Biomicrofluid.
2014, 8, 021802.
(51) Maenaka, H.; Yamada, M.; Yasuda, M.; Seki, M. Langmuir 2008, 24, 4405-4410.
(52) Mortensen, N. A. Anal. Chem. 2007, 79, 9240-9241.
(53) Jain, A.; Posner, J. D. Anal. Chem. 2008, 80, 1641-1648.
(54) Nho, H. W.; Yoon, T. H. Lab Chip 2013, 13, 773-776.
(55) Lu, X.; Hsu, J. P.; Xuan, X. Langmuir 2015, 31, 620-627.
(56) Lu, X.; Xuan, X. Anal. Chem. 2015, 87, 4560-4565.
(57) Lee, K. H.; Kim, S. B.; Lee, K. S.; Sung, H. J. Lab Chip 2011, 11, 354-357.
104
(58) Morijiri, M.; Sunahiro, S.; Senaha, M.; Yamada, M.; Seki, M. Microfluid.
Nanofluid. 2011, 11, 105-110.
(59) Di Carlo, D.; Edd, J. F.; Humphry, K. J.; Stone, H. A.; Toner, M. Phys. Rev. Lett.
2009, 102, 094503.
(60) Bhagat, A. A. S.; Kuntaegowdanahalli, S. S.; Papautsky, I. Phys. Fluid. 2008, 20,
101702.
(61) Zhou, J.; Papautsky, I. Lab Chip 2013, 13, 1121-1132.
(62) Reyes, D. R.; Iossifidis, D.; Auroux, P. A.; Manz, A., Anal. Chem. 2002, 74,
2623-2636.
(63) Auroux, P. A.; Iossifidis, D.; Reyes, D. R.; Manz, A., Anal. Chem. 2002, 74,
2627-2652.
105
CHAPTER SIX
PARTICLE FOCUSING IN VISCOELASTIC FLUIDS THROUGH
RECTANGULAR STRAIGHT MICROCHANNELS
Abstract
Particle transport in non-Newtonian fluids has recently drawn increasing
attentions for Lab-on-a-chip devices due to its potential on particle focusing and sorting.
However, the understanding of the particle equilibrium position and focusing in
experiment and numerical simulation are still incomplete. In this work, we have a
comprehensive study of the elasto-inertial particle focusing in terms of various
parameters, such as particle size, flow rate, channel aspect ratio and polymer solution
type. Multiple equilibrium positions are observed and affected by the parameters stated
above significantly. With aspect ratio increasing from 0.5 to 3.3 at moderate flow rate,
the multiple equilibrium positions (center and walls) shift to one center position, then to
two off-center positions, and finally to multiple equilibrium positions (center and off-
centers) again. In addition, an interesting trend is found that the particle size (blockage
ratio) plays a less significant role on the equilibrium position with the increase of channel
aspect ratio. A size-based particle separation is also achieved. Moreover, the differences
of the equilibrium positions in different types of polymer solution are presented. Further
experiments in polyacrylamide (PAA) solutions of varied glycerol concentrations in a
near-slit channel demonstrate that the shear-thinning effect inhibits the elastic lift and
deflects particles away from the center. The 2D numerical study of the Oldroyd-B and
106
Giesekus models supports our analysis of the viscoelastic and shear thinning effects
qualitatively.
6.1 Introduction
Lab-on-a-chip devices have become effective platforms for many biomedical and
chemical applications because of the advantages of high efficiency, accuracy and low
cost (Stone et al. 2004; Dittrich and Manz 2006). Among the numerous applications,
particle (synthetic or biological) focusing and sorting (Sajeesh and Sen 2014; Shields et
al. 2015) can be implemented based on different characteristics such as size, shape,
deformability, density, charge and polarizability (electric, magnetic and optical) etc,
though a variety of microfluidic approaches. By the use of externally imposed optical
(Jung et al. 2014), acoustic (Ding et al. 2013), electric (Swaminathan et al. 2015), and
magnetic (Zhou et al. 2015) fields, active particle manipulations have been developed.
Additionally, passive particle manipulations have been achieved via confinement-induced
hydrodynamic or electric forces, which cover approaches of hydrodynamic filtration
(HDF) (Yamada and Seki 2005), deterministic lateral displacement (DLD) (Huang et al.
2004), hydrophoresis (Choi and Park 2007), pinched flow fractionation (PFF) (Yamada et
al. 2004), inertia (Lu and Xuan 2015a), elasto-inertia (Kang et al. 2013; Nam et al. 2012;
Lu and Xuan 2015b), and insulator-based dielectrophoresis (DuBose et al. 2014). Among
them, elasto-inertial technique has demonstrated effective particle manipulations and
draws increasing attentions from scientists and engineers.

107
Particle transport in viscoelastic fluid has been studied for half a century. In the
1960s and 1970s, Karnis et al (Karnis and Mason 1966; Gauthier F et al. 1971) studied
the particle cross-stream migration in a pipe flow, where inward migration to centerline
was observed. The nonzero normal stress in a viscoelastic fluid was reported as the
source of the cross-stream particle migration. With the rapid development of state-of-the-
art micro-fabrication technologies, recent studies have been shifted to rectangular
microchannels (Leshansky et al. 2007; Kang et al. 2011; Lim et al. 2014; Del Giudice et
al. 2013; Del Giudice et al. 2015). Multiple equilibrium positions (centerline and corners)
were observed for rigid colloidal particles in the viscoelastic flow (Kim and Yoo 2008;
Kim et al. 2012), which were influenced by a combined effect of inertia and
viscoelasticity (Seo et al. 2014). The elasto-inertial particle migration has also been used
for particle separation in a few recent studies. Separation was demonstrated for different
particles of different features, such as size (Liu et al. 2015), shape (Lu et al. 2016c), and
deformability (Yang et al. 2012).
A few Numerical studies have predicted the viscoelastic particle focusing.
Different non-Newtonian constitutive equations were used, such as Oldroyd-B (OB)
(Huang et al. 2000), Giesekus (Villone et al. 2011a), and PTT model (Villone et al.
2013). The OB model has constant viscosity, i.e., the so-called Boger fluids (James
2009), while the others have shear thinning effect. Due to the high computational
expanse, most works were in 2D Poiseuille flows. Lee et al. (2010) predicted that
cylinder particle migrated to the center by OB model. Trofa et al. (2015) predicted both
center and wall equilibrium positions with consideration of shear thinning effect by

108
Giesekus model. Villone et al. (2011b), Villone et al. (2013) and Li et al. (2015) studied
viscoelastic and shear thinning effects in three dimensional channels. They stated that the
shear thinning reduced the particle center focusing. Consistently, most of those works
agreed that the increases of shear thinning, flow rate and particle size affect the migration
speed. In addition, some models neglected the inertial term, which has been demonstrated
appropriate by Trofa et al. (2015). They presented that the inertial effect was not relevant
until the Reynolds number is two orders of magnitudes higher than Weissenberg number.
This work presents a systematic study of particle focusing in non-Newtonian fluid
through a rectangular straight channel as functions of flow rate, blockage ratio, channel
aspect ratio, and polymer type which affects shear thinning and viscoelasticity. It is
demonstrated that the focusing phenomenon is highly dependent on these parameters.
Two interesting phenomena, equilibrium position change and blockage ratio dependence,
in terms of aspect ratio are observed as stated in the abstract. Meanwhile, the focusing
study guides us to achieve a size-based elasto-inertial separation. In addition, the
experiment of the polymer type effect in a near-slit channel explores the differences
between the fluids with only viscoelastic effect and that with both viscoelastic and shear-
thinning effects. The shear-thinning effect is demonstrated to suppress the elastic lift and
drive particles towards the wall. The numerical results also support our conclusion
qualitatively. In the following parts, we first briefly describe the preparations of
microchannel and particle suspension, experimental setup, and dimensionless number
involved in experiment. The modelling governing equations, methods and code validation
are followed. Then, we present the result section of parametric studies on particle
109
focusing in terms of the defined dimensionless numbers, a size-based separation,
comparison of polymer type effect, and the numerical analysis. Finally, we present the
conclusion.
6.2 Experiment
6.2.1 Microchannel fabrication and particle suspensions
2 cm-long straight microchannels were used in experiment with 50 µm width and
different depths, which were 15, 25, 40, 100, and 340 µm. At the end of the channel, a
900 µm-wide and 2 mm-long expansion was added to enhance and visualize particle
separation. The microchannels were fabricated through standard soft lithography method
with polydimethylsiloxane (PDMS). The detailed procedure was referred to Lu et al
(2014). The 100 µm-deep channel was fabricated by a double-layer soft lithography
method. After coating the 40 µm-thick SU-8-25 photoresist (MicroChem) and a two-step
soft bake (65 °C for 4 min and 95 °C for 8 min) in a hot plate (HP30A, Torrey Pines
Scientific), another layer of photoresist was coated onto the first layer using the same
coating. By measuring through the microscope (Nikon Eclipse TE2000U, Nikon
Instruments), the thickness of the two layers was around 100 µm. The 340 µm-deep
channel was fabricated with the SU-8-2100 photoresist (MicroChem). The coating speed
started at 500 rpm for 10 s and ramped by 300 rpm/s to the terminal spin speed of 1000
rpm with a dwelling of 30 s. After a two-step soft bake (65 °C for 7 min and 95 °C for 60
min) on the hot plate, the photoresist film was exposed through the photo mask to a 365
nm UV light (ABM Inc., San Jose, CA) for 50 seconds. It then underwent a two-step hard
110
bake (65 °C for 5 min and 95 °C for 15 min) before being submerged into a SU-8
developer solution (MicroChem) for 20 min. Following a brief rinse with isopropyl
alcohol (Fisher Scientific) and another two-step hard bake (65 °C for 1 min and 95 °C for
5 min), a positive replica of photoresist was left on the glass slide with 340 µm thickness
by measuring through the microscope.
3.1, 4.8 and 9.9 µm-diameter spherical polystyrene particles (Thermo Scientific)
were used in experiment. The particles were suspended in water-based Newtonian
solution and three types of dilute non-Newtonian solutions with concentration of about
106 particles/ml. The non-Newtonian solutions are 1000 ppm polyethylene oxide (PEO,
molecular weight Mw = 2106 Da, Sigma-Aldrich), 50 ppm polyacrylamide (PAA, Mw =
18106 Da, Polysciences) and 8% Polyvinylpyrrolidone (PVP, Mw = 0.3610
6 Da,
Sigma-Aldrich) solutions. 0.5% (v/v) Tween 20 (Fisher Scientific) was added to all
solutions to reduce the influences of particle aggregations and adhesions to channel walls.
Table 1 lists the solution properties. The calculation of effective relaxation time of the
1000 ppm PEO solution is provided in Supplementary Material (Appendix B). The
effective relaxation times of PVP (Del Giudice et al. 2013) and PAA (Campo-Deaño et
al. 2011) solutions and the zero-shear viscosities of PEO (Rodd et al. 2005), PVP (Del
Giudice et al. 2013), and PAA (Galindo-Rosales et al. 2012) solutions were obtained
from previous work. The PVP (Del Giudice et al. 2013) and dilute PEO (Cox and
Brenner 1968; Rodd et al. 2005; Rodd et al. 2007) solutions exhibit non- or mild shear-
thinning effect, while the PAA solution (Galindo-Rosales et al. 2012) shows strong shear-
thinning effect.

111
Table 1. Properties of water-based non-Newtonian fluids used in experiments.
Fluid properties (at 20 °C) 1000ppm
PEO 8% PVP
50ppm
PAA
Density (g/cm3) 1.0 1.0 1.0
Zero-shear viscosity 𝜂0 (mPa∙s) 2.3 90 30
Effective relaxation time, e (ms) 6.8 1.3 10
6.2.2 Experimental setup
The particle suspension was stored in a 100 µl air-tight glass syringe (SGE Analytical
Science) and driven through the microchannel by an infusion syringe pump (KDS-100,
KD Scientific). The glass syringe and microchannel was connected via a PFA (perfluoro
alkoxy alkane) tubing (IDEX Health & Science). Particle motion was visualized and
recorded by an inverted microscope (Nikon Eclipse TE2000U, Nikon Instruments) with a
CCD camera (Nikon DS-Qi1Mc) at frame rate of 15 frames per second. The 3.1 µm
fluorescent particles were observed under fluorescent light for better visualization. The
lens had magnification of 10 times, numerical aperture of 0.3 and the depth of field of
around 8 µm. Post-processing was made by Nikon imaging software (NIS-Elements AR
3.22). Particle streak images were used to illustrate particle transport, which were
obtained by superimposing a sequence of around 500 snapshot images with minimum and
maximum intensity projections for the plain and 3.1 µm fluorescent particles
respectively. Particle analysis with ImageJ software package (NIH) was used to measure
the particle positions along the lateral direction by conducting for about 500 images
(more than 200 particles). The probability distribution function (PDF) was calculated
based on the particle positions.

112
6.2.3 Dimensionless numbers
Four dimensionless numbers are used to characterize the flow dynamics of non-
Newtonian fluid. Usually measuring the fluid elasticity, Weissenberg number is defined
as the ratio of effective relaxation time and the average shear rate, �̇�,
𝑊𝑖 = 𝜆𝑒�̇� = 𝜆𝑒𝑉
𝑤/2=
2𝜆𝑒𝑄
𝑤2ℎ (1)
in which 𝜆𝑒 is the effective relaxation times, V is the average fluid velocity, w and h are
the width and height of the straight channel, and Q is the volumetric flow rate. Reynolds
number is defined as the ratio of the inertial force to the viscous force,
𝑅𝑒 =𝜌𝑉𝐷ℎ
𝜂0=
2𝜌𝑄
𝜂0(𝑤+ℎ) (2)
where Dh is the hydraulic diameter. The channel aspect ratio is the ratio of channel width
to height, which affects the particle equilibrium positions in non-Newtonian fluid,
𝐴𝑅 = 𝑤/ℎ (3)
The channel depths used in experiment are 15, 25, 40,100, and 340 µm corresponding to
AR = 3.3, 2, 1.25, 0.5, and 0.15. The blockage ratio, the ratio of the particle diameter and
the hydraulic diameter of microchannel, is given by
𝛽 = 𝑑/𝐷ℎ (4)
6.3 Numerical modeling
6.3.1 Mathematical model and numerical method

113
Fig. 1 shows the schematic diagram of the computational model: a rigid, non-
Brownian, circular particle (2D) suspended in a straight channel in Poiseuille flow. The
flow domain sigma denotes the rectangular channel with width w and length L (L>100w)
subtracted by the circular particle with diameter d. The external boundaries are denoted
by 𝛤1−4, and the internal particle boundary is denoted by 𝛤5(𝑡). The Cartesian x and y
coordinates with the origin located at the center of the microchannel are illustrated in Fig.
1. A parabolic velocity profile is imposed on the left boundary, driving fluid flowing
along the x-direction, and the upper and lower boundaries are channel walls.
Fig. 1. Sketch of the flow cell
The elasto-inertial particle motion in viscoelastic fluid is investigated using the direct
numerical simulation (DNS) method. The hydrodynamic force and torque acting on the
particle are computed from the flow field which is fully coupled with the particle
translational and rotational motions. The incompressible viscoelastic flow is governed by
continuity and Navier-Stokes equations,
∇ ∙ 𝐮 = 0 (5)
𝜌 (𝜕𝐮
𝜕𝑡+ 𝐮 ∙ ∇𝐮) = ∇ ∙ 𝛔 (6)
𝛔 = −𝑝𝐈 + 2𝜇𝑠𝐃 + 𝛕 (7)

114
where 𝐃 = [∇𝐮 + (∇𝐮)T]/2 is rate-of-deformation tensor, I is the unit tensor, and 𝜇𝑠 is
the solvent viscosity. The symmetric 𝛕 is extra stress contribution owing to the polymer,
which is written in terms of the conformation tensor c
𝛕 =𝜇𝑝
λ(𝐜 − 𝐈) (8)
where 𝜇𝑝 is the polymer viscosity and λ is the polymer relaxation time. The fluid
dynamic viscosity 𝜇 = 𝜇𝑝 + 𝜇𝑠. The Giesekus constitutive equation is used to describe
the transport of polymer stress in the flow:
λ
c + 𝐜 − 𝐈 + α(𝐜 − 𝐈)2 = 0 (9)
where
c is the upper convected derivative
T
t
cc u c u c c u (10)
α is the mobility parameter that accounts for the shear thinning behavior. It reduces to the
Oldroyd-B model at α=0, which can be used to simulate viscoelastic fluids with a
constant viscosity. Dimensionless governing equations are respectively
∇′ ∙ 𝐮′ = 0 (11)
𝑅𝑒𝑚 (𝜕𝐮′
𝜕𝑡′+ 𝐮′ ∙ ∇′𝐮′) = ∇′ ∙ 𝛔′ (12)
𝑊𝑖𝑚
c ′ + 𝐜′ − 𝐈 + α(𝐜′ − 𝐈)2 = 0 (13)
where 𝑅𝑒𝑚 = 𝜌𝑈0𝑤/𝜇, 𝑊𝑖𝑚 =λ𝑈0
𝑤= 𝑊𝑖/2, 𝜇𝑠
′ = 𝜇𝑠/𝜇, 𝜇𝑝′ = 𝜇𝑝/𝜇, and 𝑈0 and w are
the characteristic velocity and length respectively, i.e., the average flow velocity and
channel width. Hereinafter, the dimensionless variables in equations are written without
apostrophe.

115
Non-slip boundary conditions are imposed on the rigid walls and on the particle
boundary,
𝐮 = 𝟎 on 𝛤1 and 𝛤3 (14)
𝐮 = 𝐮𝑝 + 𝛚𝑧 × (𝐱 − 𝐱𝑝) on 𝛤5(𝑡) (15)
A parabolic velocity profile is imposed on 𝛤2 with average velocity 1, i.e., u𝑥 =
3
2(1 − 2𝑦)2 , and u𝑦 = 0 . 𝑝𝐧 = 𝟎 is imposed on 𝛤4 . The translational and rotational
velocity of particle is governed by Newton’s second law and Euler’s equation on 𝛤5(𝑡)
respectively,
𝑚𝑝𝑑𝐮𝑝
𝑑𝑡= ∫ 𝛔 ∙ 𝐧d𝛤 (16)
𝐼𝑝𝑑𝝎𝑝
𝑑𝑡= ∫(𝐱 − 𝐱𝒑) × (𝛔 ∙ 𝐧)d𝛤 (17)
where 𝑚𝑝 =𝜋𝑑2𝜌𝑈0
4𝜇𝑤 and 𝐼𝑝 =
𝑑2
8𝑤2 𝑚𝑝 are the dimensionless mass and moment of inertia
of particle. The dimensionless particle center 𝐱𝒑 is computed from
𝑑𝐱𝒑
𝑑𝑡= 𝐮𝑝 (18)
Due to the difficulty in numerical convergence at relatively high Wi, the
constitutive equation is transformed to equivalent equations in terms of log conformation
tensor s, which is defined as
𝐬 = 𝑙𝑜𝑔(𝐜) (19)
To decomposition of the velocity gradient into extensional and rotational components, a
matrix decomposition, which is approved by Fattal and Kupferman (2004), is used the
Giesekus constitutive equation is transformed to

116
𝜕𝐬
𝜕𝑡+ 𝐮 ∙ ∇𝒔 = 𝑔(∇𝐮𝑇 , 𝐬) (20)
This log-conformation method is to overcome a stability/stiffness problem associated
with the balance between stress advection and stress amplification, and to guarantee
positive definiteness of the recovered conformation tensor (Guénette et al. 2008; Afonso
et al. 2011).
The coupled fluid and particle equations will be numerically solved using the
Arbitrary Lagrangian-Eulerian (ALE) method with a moving, unstructured finite element
mesh (Hu et al. 2001). In an ALE formulation, the material time derivative of velocity at
a given point x in the physical domain and at a time instant t is written as
𝐷
𝐷𝑡𝐮(𝐱, 𝑡) =
𝜕𝐮
𝜕𝑡+ (𝐮 − �̂�) ∙ ∇𝐮 (21)
where
𝜕
𝜕𝑡𝐮(𝐱, 𝑡) =
𝜕
𝜕𝑡𝐮[𝐱(𝛘, 𝑡), 𝑡] (22)
is described in the referential domain coordinate 𝝌. The function 𝐱(𝛘, 𝑡) can be viewed as
a mapping from the fixed referential domain to the physical domain. The mesh velocity
(velocity of the domain) �̂� is defined as
𝑑
𝑑𝑡𝐱(𝛘, 𝑡) = �̂� (23)
When the mesh velocity coincides with the velocity of particle in physical domain, �̂� =
𝐮, and the referential time derivative recovers the Lagrangian time derivative. When the
referential domain coincides with the physical domain at the current time 𝛘 = 𝐱, the
referential time derivative reduces to the local Eulerian time derivative with �̂� = 0.
The mesh velocity �̂� is governed by Laplace equation,

117
∇ ∙ (𝜀∇ �̂�) = 0 (24)
where 𝜀 is the inverse of the local element volume.
�̂� = 0 on 𝛤1 to 𝛤4 (25)
�̂� = 𝐮𝑝 on 𝛤5(𝑡) (26)
Once the mesh quality is below a critical value 0.5 due to the distortion of the moving
particle, a new mesh will be generated upon which the solution on the old mesh is
projected. At each time step, the moving mesh and the particle’s motion are updated
explicitly, while the flow field, particle velocity, and mesh velocity are solved implicitly.
The ALE method is implemented in COMSOL® using the built-in finite-element-method
(FEM)-based functions, which are controlled by custom-written MATLAB® scripts. In
this study, quadratic triangular elements are generated in fluid domains. A finer mesh is
created around the particles to accurately capture the nearby flow field for precise
calculation of the force and torque exerting on each particle. The total element number is
typically around 16,000 to obtain converged and mesh-independent results.
6.3.2 Code validation
Fig. 2 compares the predicted lateral particle position, Yp, (normalized by the channel
width) vs. time, t, (dimensionless) with the result of Trofa et al. (2015) under identical
conditions (i.e., a 2D particle motion in a straight channel with blockage ratio β=d/w=0.1,
α=0.2, 𝜇𝑠/𝜇𝑝 = 0.1, neutral buoyant, Rem=1, and Wim=1). The particle position Yp starts
at 0.3, where 0 indicates the center and 0.5 indicates the channel wall. They are predicted
to migrate towards the channel center with a close agreement.

118
Fig. 2. Code validation for case Yp0=0.3, β=0.1, α=0.2, 𝜇𝑠/𝜇𝑝 = 0.1, Rem=1, and Wim=1
6.4 Results and discussion
6.4.1 Effects of particle size (β) and flow rate (Wi)
Fig. 3 shows the focusing patterns of the 3.1, 4.8, and 9.9 µm particles in the 1000
ppm PEO solution through the 40 µm-deep microchannel. The red dashed box highlights
the region to be used as cropped image in this and the following figures. As the flow rate
grows, Re and Wi both increase (see the labeled values in fig. 3). In a large range of Wi,
the 3.1 µm particles are barely focused to the center. It indicates a very weak elasto-
inertial effect on small particles (β=0.07) in a near-square channel. For the 4.8 and 9.9
µm particles, the focusing at center and corner equilibrium positions are observed at low
Wi=3.8. With Wi increasing to 11.3, the corner equilibrium positions disappears for both
sizes of particles due to the stronger wall lift force (Di 2009). But the focusing of the 9.9
µm particles focusing improves dramatically. The focusing of large particles is better
than the small ones, which agrees with previous observation (Seo et al. 2014). At Wi =
37.8, a clear transition from center equilibrium position to two off-center ones is

119
observed for the 9.9 µm particles. Three corresponding probability distribution function
(PDF) plots are provided for different particles respectively at Wi = 37.8. Invisible from
the superimposed image, the PDF of 4.8 µm particles shows three peaks, a center one and
two off-center ones, although there are particles between these peaks. For the 3.1 µm
particles, the probability of particles in the center is higher than that of particles close to
the wall. When Wi reaches 75.6, the particle positions barely vary.
Fig. 3. Focusing patterns of the 3.1, 4.8, and 9.9 µm particles in the 1000 ppm PEO
solution through the 40 µm-deep microchannel at different flow rates. At 1000 µL/h,
PDF plots are provided for different particles. The red dashed box highlights the region to
be used as cropped image in this and the following figures if applicable.
It is concluded that the focusing equilibrium positions is highly dependent on the
blockage ratio (particle size). Because the elastic lift force is proportional to the third
order of particle size (Tehrani 1996), FeL~d3∇N1, the small particle is much more weakly
deflected by the elastic lift as compared to large particles. In addition, the elasto-inertial
focusing is not monotonously affected by the flow rate (Wi). As fig. 3 shows, the best

120
center-focusing of the 9.9 µm particles happens at 300 µL/h (Wi=11.3), and it is worse at
500 µL/h (Wi=18.9). It is noticed that the equilibrium positions becomes complicated at
high flow rate (Wi) as discussed in the PDF plot in Fig. 3, i.e., the 9.9 µm particles have
two off-center positions and the 4.8 µm particles show three peaks. We speculate that this
is a result of the competition between the elastic lift and the shear-induced inertial lift.
The elastic lift force can be expressed as 𝐅𝑒𝐿~𝜆𝑒(𝑑 𝑤⁄ )3𝑄3 (Lu et al. 2015d), and the
shear-induced inertial lift force is given by 𝐅𝑖𝐿_𝑠~𝜌(𝑑 𝑤⁄ )4𝑄2 (Asmolov 1999) which
drives particle away from the channel center. 𝐅𝑖𝐿_𝑠 is negligible at low flow rate (Re) but
until Re is higher than one. And the inertial lift is more sensitive to particle size than the
elastic lift force, i.e., it is proportional to the forth order of particle diameter while the
elastic lift is proportional to the third order. So the 9.9 µm particles starts to be deflected
away from the center at high flow rate (Re= 2.68), while the shear-induced inertial lift is
not able to eliminate the center particle equilibrium position for the other two smaller
particles.
6.4.2 Effect of channel aspect ratio (AR)
The channel aspect ratio (AR) plays a significant role on the elasto-inertial particle
equilibrium positions. Fig. 4 shows the focusing pattern of the three types of particles at
300 µL/h in the 50 µm-wide channels with AR varying from 0.5 to 3.3. PDF plots of 9.9
µm particles are presented. At AR=0.5, Corner equilibrium positions exist for both 9.9
and 4.8 µm particles. The 3.1 µm particles (β=0.05) are barely focused to any equilibrium
positions. The center focusing of all particles are weak at low AR channel. At AR=1.25,

121
the center focusing is better than that at AR=0.5. It also shows a trend that larger particles
have stronger focusing effect. At AR=2, the particles are focused to off-center equilibrium
positions. Therefore, a size-based particle separation can be achieved between 9.9 and 3.1
µm particles under this condition. At AR=3.3, three equilibrium positions are observed
for all of the particles, with the center one reappearing. It is observed that the three
focusing equilibrium positions of 9.9, 4.8, and 3.1 (β=0.13) µm particles are similar.
Accordingly, the effect of blockage ratio is less significant on the equilibrium positions at
high-AR channel when β is no less than 0.13. In another word, the differences of particle
positions between particles of different sizes decrease with rising AR. The particle
separation cannot be achieved in high-AR channels (AR≥3.3) due to similar equilibrium
positions.
Fig. 4. Focusing patterns of AR effect for the 3.1, 4.8, and 9.9 µm particles in the 1000
ppm PEO solution at 300 µL/h. The PDF plots show the positions of 9.9 µm particles.
We have also studied the flow rate effect on the particle focusing in channel
AR=0.5, 2, and 3 (see Fig. S1-3 in the Supplementary Material). At AR=0.5, the smallest
particles can also be focused at the corner equilibrium positions. The corner equilibrium
positions exist even at 500 µL/h. At AR=1.25, the corner equilibrium positions can be
observed at 100µL/h only for 9.9 and 4.8 µm particles. At AR=2, the corner equilibrium

122
positions are observed only for 9.9 µm particles at 100µL/h. At AR=3.3, no corner
equilibrium positions appear. Therefore, the lower AR and larger size of particles lead to
the higher possibility of corner equilibrium positions. In addition, particles in channel of
AR=0.5 are always able to reach the channel core despite of strong or weak center
focusing. But at high AR≥2, only off-center equilibrium positions can be seen at moderate
ranges of flow rate. With the increase in flow rate, 4.8 µm particles at AR=2 experience
first a transition from single center equilibrium position (at 100µL/h) to dual off-center
equilibrium positions (at 300µL/h) and then to triple equilibrium positions (at 500µL/h)
at both the centerline and two sides. This is consistent with our previous study of 4.2 µm
particles under similar condition (Lu et al. 2015d).
It should be noticed that the mechanisms of particle vacancy in the channel core
region are different for high AR channel at low flow rate (Re<1) and the 9.9 µm particles
at high flow rate (Re>1). As stated above, the latter case (Re>1, in near-squared channel)
happens due to the nontrivial shear-induced inertial lift. However, the former one (Re<1,
in high AR channel) results from a dominated elastic lift. Different from the square
channel, in which there are one center and four corner elastic equilibrium positions, the
elastic lift is too weak to deflect particles to the corner equilibrium positions in high AR
channel under most conditions. And the elastic lift in high AR channel is able to drive
particle to two off-center equilibrium positions between the center and walls in a large of
flow rate (Wi). Based on the trend of two off-center equilibrium positions with respect to
particle size (β), a size based separation is presented in the following paragraph.

123
Fig. 5 shows the size based separation between 9.9 and 3.1 µm particles at 200
µL/h at AR=2. Calculated from the PDF plot, 95.4% 3.1 µm particles are in the region
with normalized lateral position from 0.29 to 0.73, out of which 95.6% 9.9 µm particles
distribute. Huang et al. (1997) and Liu et al. (2015) stated that larger particle has greater
deflection to the wall due to enhanced compressive normal stress at the near-center side
of the particle. The 9.9 µm particles with larger blockage ratio deform the Poiseuille flow
more intensively, resulting to a more enhanced compressive normal stress at the near-
center side.
Fig. 5. Particle separation between 3.1 and 9.9 µm particles in the 1000 ppm PEO
solution at 200 µL/h at AR=2. In the PDF plot, the blue bars indicate 9.9 µm particles and
the red bars indicate 3.1 µm particles.
6.4.3 Effects of polymer type and shear-thinning
Fig. 6 shows the effect of polymer type of 9.9 µm particles in the PEO, PVP and
PAA solutions at comparable Wi in low aspect ratio channels (AR=0.5 and 0.15). Due to
the complicated mechanisms of elasto-inertial effect in different non-Newtonian
solutions, we studied the polymer type effect from the near-slit microchannels. With
AR=0.15, the channel can be nearly considered as a slit channel. Three types of solutions

124
were prepared at different concentrations to match the effective relaxation time. Different
flow rates were chosen to match the Wi number. In the Newtonian fluid, weak focusing
effect were observed for both channels because of inertial wall lift. The results in all three
non-Newtonian solutions shows three equilibrium positions, one in the center and two
near the walls, at similar Wi from 6.67 to 8.67 at AR=0.5. Due to the extremely high
viscosity and hence low Re, particles are able to migrate to the wall in the PVP solution at
3000 µL/h. At such high flow rate, the wall equilibrium positions disappear in the PAA
and PEO solutions resulting from the growing inertial wall lift. However, in the near-slit
channel, the wall equilibrium positions only show in PAA solution. It is also noticed that
the center focusing of PAA solution are weaker than those of PEO and PVP solutions in
both channels. The 2D numerical results of different constitutive equations are provided
in the later part to analysis the mechanism of the experimental differences between the
PEO/PVP and the PAA solutions qualitatively.
With a further observation of the wall equilibrium positions at AR=0.5,
differences are found between the PAA with the other two solutions. In the PAA solution,
particles near the wall are all well focused. It indicates that all particles at the near-wall
positions are in the same focal plane. However, in both PEO and PVP solutions, some
particles are well focused while others are not as shown in the zoom-in image (image
taken in the PEO solution) in fig. 6. In experiment, two focal planes were confirmed by
adjusting the height of lens. After an adjustment of the focal plane about 70 µm, the
previous blurry/out-of-focused ones could be well focused and the previous focused ones
became blurry. It indicates that the near-wall particles are located near the channel

125
corners in the PEO and PVP solutions. Because the near-slit channel is close to an ideal
2D channel which has no corners, the corner positions vanish at AR=0.15 in the PEO and
PVP solutions.
Fig. 6. Experimental results of 9.9 µm particles in the Newtonian, PEO, PVP, and PAA
solutions with AR=0.5 (the first row) and 0.15 (the second row). The arrows above
images indicate the existence of particles near the wall. At AR=0.5, wall equilibrium
positions are observed for all non-Newtonian solutions. However in the near-slit channel
(AR=0.15), they only exist for PAA solution. A snapshot image near the wall is provided
for the PEO solution to illustrate the particle focal planes at AR=0.5.
It is believed that the weaker center-focusing and wall equilibrium positions in the
near-slit channel result from the shear-thinning effect of PAA solution. The result of wall
equilibrium positions looks different from previous work in PAA solution with highly
concentrated glycerol (Leshansky et al. 2007), which only showed center-focusing in a
slit channel. Fig. 7 shows the results of PAA solutions with different glycerol
concentrations to study the deviation and shear-thinning effect. The viscosities of 23w%
and 76w% glycerol are 2 and 40 mPa∙s respectively (Segur and Oberstar 1951). The shear
viscosity of the 50 ppm PAA solution varies from 30 to 1.5 mPa∙s over the range of shear
rates 1-5000 s-1
(Galindo-Rosales et al. 2012). By a coarse estimation of simple
summation of the two viscosity values of PAA and glycerol solutions at the same shear

126
rate, The shear viscosity of the 50 ppm PAA solution with 23w% glycerol varies from 32
to 3.5 mPa∙s, and that of 76w% glycerol varies from 70 to 41.5 mPa∙s over the range of
shear rates 1-5000 s-1
. Thus the shear-thinning effect of the PAA solution decreases with
rising glycerol concentration. Compared with the 0% glycerol PAA solution, the 23w%
glycerol solution has fewer particles migrating to the wall equilibrium positions. We use
narrower arrows to distinguish them. Moreover, no particles are observed near the wall in
the 76w% glycerol solution. Meanwhile, the center-focusing in the two glycerol solutions
are also better than the pure PAA solution. The shear viscosity ratio at shear rate 1 s-1
and
5000 s-1
in the three solutions are 20, 9.1, and 1.7 respectively. The weaker shear-
thinning effect, the better elastic center-focusing the PAA solution has. Therefore, we
conclude that the shear-thinning effect suppresses the elastic lift and deflects particle
away from the center.
Fig. 7. Shear-thinning effect in 50 ppm PAA solutions in near-slit channel (AR=0.15) for
9.9 µm particles. The glycerol concentrations in the images from left to right are 0,
23wt%, and 76wt%. The arrows above images indicate the existence of particles near the
wall. The thickness of the arrow corresponds to the amount of particles near the wall
qualitatively.
Fig. 8 presents the 2D numerical results of 10 µm particles for Newtonian, OB
and Giesekus models. Because of the convergence problem at relatively high Wi, the
relaxation time in the model was chosen as the Zimm relaxation time, 𝜆𝑍𝑖𝑚𝑚 = 0.34𝑚𝑠,
of the 1000 ppm PEO solutions as provided in Supplementary Material. With comparable
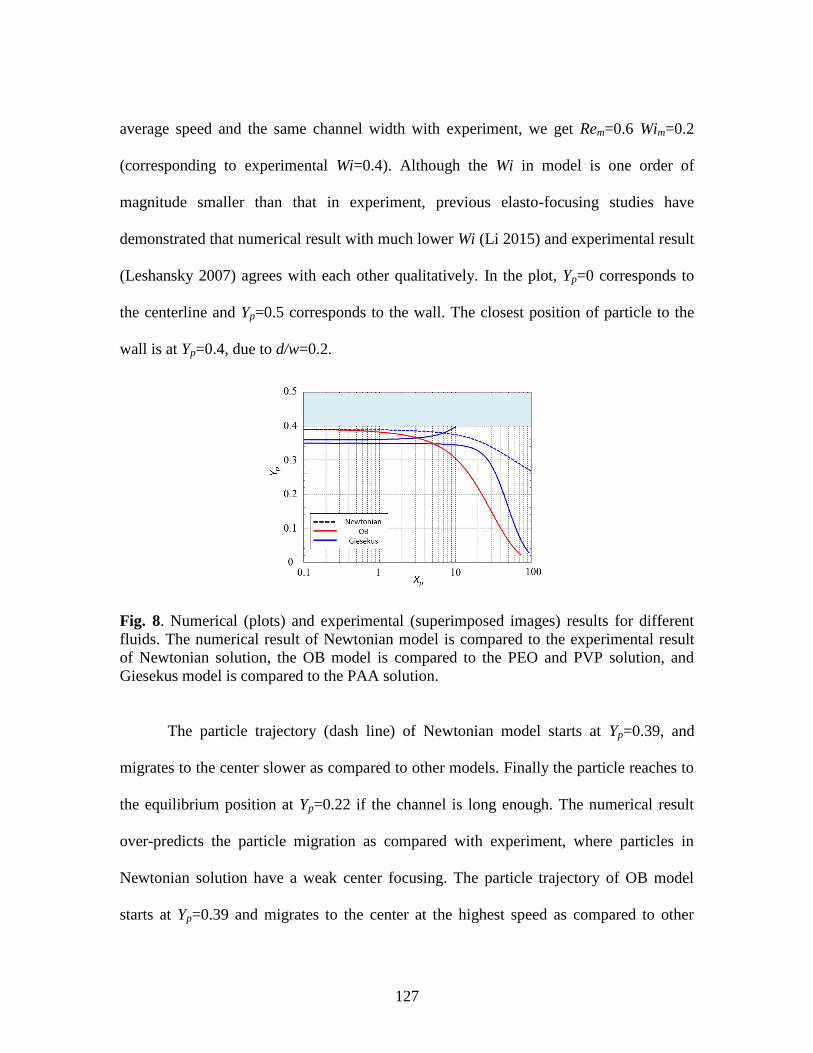
127
average speed and the same channel width with experiment, we get Rem=0.6 Wim=0.2
(corresponding to experimental Wi=0.4). Although the Wi in model is one order of
magnitude smaller than that in experiment, previous elasto-focusing studies have
demonstrated that numerical result with much lower Wi (Li 2015) and experimental result
(Leshansky 2007) agrees with each other qualitatively. In the plot, Yp=0 corresponds to
the centerline and Yp=0.5 corresponds to the wall. The closest position of particle to the
wall is at Yp=0.4, due to d/w=0.2.
Fig. 8. Numerical (plots) and experimental (superimposed images) results for different
fluids. The numerical result of Newtonian model is compared to the experimental result
of Newtonian solution, the OB model is compared to the PEO and PVP solution, and
Giesekus model is compared to the PAA solution.
The particle trajectory (dash line) of Newtonian model starts at Yp=0.39, and
migrates to the center slower as compared to other models. Finally the particle reaches to
the equilibrium position at Yp=0.22 if the channel is long enough. The numerical result
over-predicts the particle migration as compared with experiment, where particles in
Newtonian solution have a weak center focusing. The particle trajectory of OB model
starts at Yp=0.39 and migrates to the center at the highest speed as compared to other

128
models. The center focusing trends in the modelling and experiment in the PEO and PVP
solutions are consistent, although the numerical result over-predicts the particle migration
as well. Two trajectories of Giesekus model were predicted at Yp=0.35 and 0.36, one of
which moves to the center while the other one migrates to the channel wall. The wall and
center equilibrium positions are consistent with experiment in pure PAA solution. As
compared with OB model, the one to the center has lower migration speed. It agrees with
the experimental trend that the center focusing of the PEO/PVP solution is better than
that of PAA solution. Therefore loosely speaking, the OB model is likely to qualitatively
predict the center focusing trend of the PEO and PVP solution, and the Giesekus model
can predict both of the center and wall focusing trends of PAA solutions in the near-slit
channel. For the numerical over-prediction on the migration to the experiment, the main
reason we speculate is the deviation of particle geometry, which is an infinite long
cylinder in the modeling but is a sphere in the experiment.
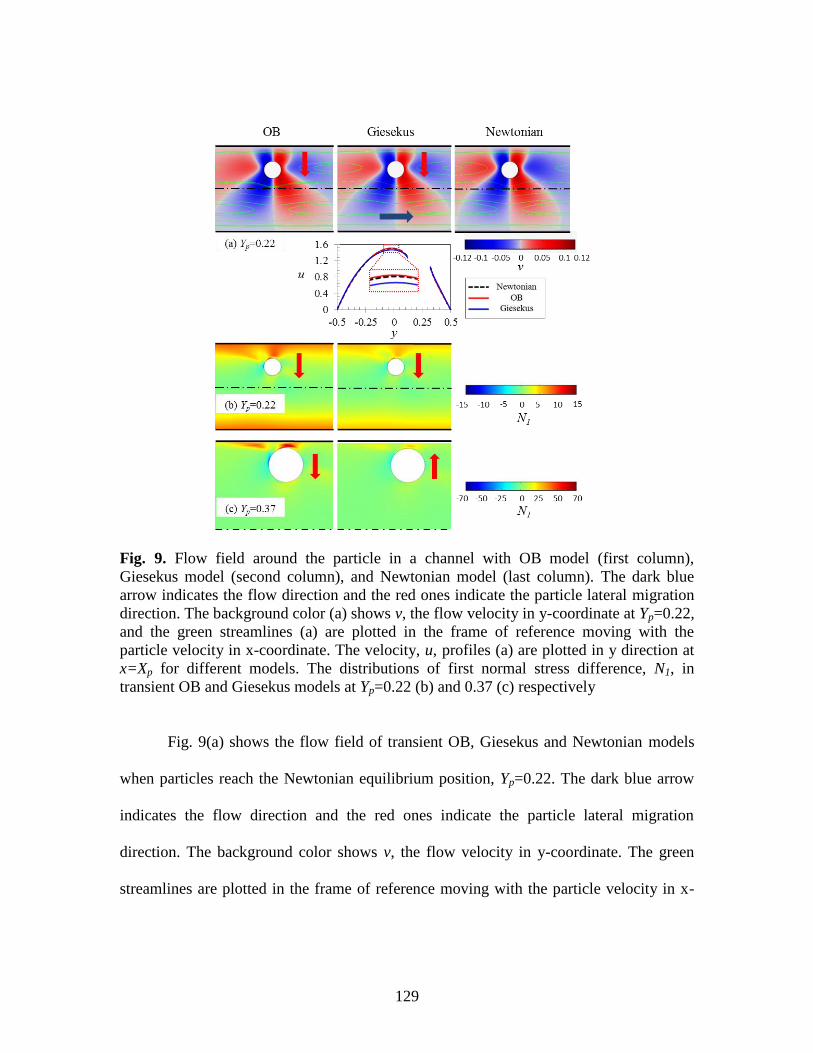
129
Fig. 9. Flow field around the particle in a channel with OB model (first column),
Giesekus model (second column), and Newtonian model (last column). The dark blue
arrow indicates the flow direction and the red ones indicate the particle lateral migration
direction. The background color (a) shows v, the flow velocity in y-coordinate at Yp=0.22,
and the green streamlines (a) are plotted in the frame of reference moving with the
particle velocity in x-coordinate. The velocity, u, profiles (a) are plotted in y direction at
x=Xp for different models. The distributions of first normal stress difference, N1, in
transient OB and Giesekus models at Yp=0.22 (b) and 0.37 (c) respectively
Fig. 9(a) shows the flow field of transient OB, Giesekus and Newtonian models
when particles reach the Newtonian equilibrium position, Yp=0.22. The dark blue arrow
indicates the flow direction and the red ones indicate the particle lateral migration
direction. The background color shows v, the flow velocity in y-coordinate. The green
streamlines are plotted in the frame of reference moving with the particle velocity in x-

130
coordinate. In all three cases, several streamlines are reversed, which indicate a particle-
induced convection along the flow direction (Zurita-Gotor et al. 2007). The velocity, u,
profiles are plotted in y direction at x=Xp for different models. In general, the flow fields
of three models are similar, except that the velocity of Giesekus at the peak is slightly
smaller. Fig. 9(b) and (c) show the distributions of first normal stress difference, N1, in
the OB and Giesekus models at Yp=0.22 and 0.37 respectively. At Yp=0.22, both models
predict particle migration to the center. But at Yp=0.37, particle in Giesekus model
migrates to the wall. The Newtonian case is needless due to null N1. Under the same
range of color bar, N1 of OB model is much larger than that of Giesekus model. This is
consistent with previous work (Li et al. 2015), which states that the shear-thinning
property of Giesekus model reduces the elastic force. Experimentally, it explains the
weaker focusing in the PAA solution than the PEO and PVP solutions. We also speculate
that the key factor of the wall equilibrium position for Giesekus model and experimental
result in PAA solution is the strong shear-thinning effect, which restrains the first normal
stress difference and hence the elastic lift, and deflects the particle away from the center.
In addition, we observe that a wake of the first normal stress difference exists at the
upper-left of the particle in each case of (b) and (c). It indicates the memory effect on the
normal stress of non-Newtonian fluid, which leaves a negative wake behind the particle
that needs time to be recovered.
6.5 Conclusions

131
We have studies the elasto-inertial particle focusing systematically in terms of
various parameters. Multiple equilibrium positions (center and off-center) are observed in
the near-square straight channel in the PEO solution. The larger particles have stronger
center focusing. In the AR effect study, it has been found that the particle size (blockage
ratio) plays a less significant role on the particle focusing equilibrium position with the
increasing AR in the PEO solution. At AR=3.3, those positions for 3.1 and 9.9 µm
particles are similar at different flow rates. For 9.9 µm particles at 300 µL/h, an
interesting trend of AR effect is observed that with AR increasing from 0.5 to 3.3, the
multiple equilibrium positions (center and corners) shift to one center position, then to
two off-center positions, and finally to multiple equilibrium positions (center and off-
centers, but which are not at corners) again. Meanwhile, the corner equilibrium positions
appear more easily in the lower AR channel and for larger size of particles. Guiding from
the AR effect, a size-based particle separation is achieved in the channel with AR=2 at
moderate flow rate.
In addition, polymer types are studied in low AR channel and compared with
different numerical models. The center focusing in the PAA solution with strong shear-
thinning effect is weaker than those in the PEO and PVP solution with no or very weak
shear-thinning effect. At AR=0.5, it is found that the near-wall equilibrium positions for
the PAA and PEO/PVP solutions are different. In the PAA solution, particles near the
wall are all located in one certain focal plane, while in the PEO/PVP solutions particles
are located at corner positions in two focal planes. At AR=0.15, the near-slit channel, the
wall equilibrium positions only exist in PAA solution. Further experiments of varied

132
glycerol concentrations in the PAA solutions in near-slit channels have demonstrated that
the shear-thinning effect of the pure PAA solution inhibits the elastic lift and deflects
particles away from the center towards the walls. The 2D numerical studies of the particle
motion via Oldroyd-B and Giesekus models qualitatively consistent with our
experimental observations of the viscoelastic and shear thinning effects on the elasto-
inertial particle focusing. The shear-thinning effect of the Giesekus model is able to
reduce the normal stress difference and hence the elastic lift force. The OB model
without shear-thinning effect successfully predicts the trend of particle center focusing in
the PEO and PVP solutions in the near-slit channel. And the Giesekus model is
speculated more representative to predict the wall and center focusing trends in the PAA
solution. In the numerical flow study, the flow fields look similar between the
Newtonian, OB and Giesekus models. A negative wake of the first normal stress
difference appears behind the particle in the transient OB and Giesekus models.
Reference
Afonso AM, Oliveira PJ, Pinho FT, Alves MA (2011) Dynamics of high-Deborah-
number entry flows: a numerical study. Journal of Fluid Mechanics 677:272-
304
Asmolov ES (1999) The inertial lift on a spherical particle in a plane Poiseuille flow at
large channel Reynolds number. Journal of Fluid Mechanics 381:63-87
Campo-Deaño L, Galindo-Rosales FJ, Pinho FT, Alves MA, Oliveira MS (2011) Flow of
low viscosity Boger fluids through a microfluidic hyperbolic contraction.
Journal of Non-Newtonian Fluid Mechanics 166(21):1286-96
Choi S, Park JK (2007) Continuous hydrophoretic separation and sizing of microparticles
using slanted obstacles in a microchannel. Lab on a Chip 7(7):890-7
Cox RG and Brenner H (1968) The lateral migration of solid particles in Poiseuille
flow—I Theory. Chemical Engineering Science 23(2):147-73.

133
Del Giudice F, D’Avino G, Greco F, Netti PA, Maffettone PL (2015) Effect of fluid
rheology on particle migration in a square-shaped microchannel.
Microfluidics and Nanofluidics 19(1):95-104
Del Giudice F, Romeo G, D'Avino G, Greco F, Netti PA, Maffettone PL (2013) Particle
alignment in a viscoelastic liquid flowing in a square-shaped microchannel.
Lab on a Chip 13(21):4263-71
Di Carlo D (2009) Inertial microfluidics. Lab on a Chip 9(21):3038-46.
Ding X, Li P, Lin SC, Stratton ZS, Nama N, Guo F, Slotcavage D, Mao X, Shi J,
Costanzo F, Huang TJ (2013) Surface acoustic wave microfluidics. Lab on a
Chip 13(18):3626-49
Dittrich PS, Manz A (2006) Lab-on-a-chip: microfluidics in drug discovery. Nature
Reviews Drug Discovery 5(3):210-8
DuBose J, Lu X, Patel S, Qian S, Joo SW, Xuan X (2014) Microfluidic electrical sorting
of particles based on shape in a spiral microchannel. Biomicrofluidics
8(1):014101
Fattal R, Kupferman R (2004) Constitutive laws for the matrix-logarithm of the
conformation tensor. Journal of Non-Newtonian Fluid Mechanics 123(2):281-
5
Galindo-Rosales FJ, Campo-Deaño L, Pinho FT, Van Bokhorst E, Hamersma PJ,
Oliveira MS, Alves MA (2012) Microfluidic systems for the analysis of
viscoelastic fluid flow phenomena in porous media. Microfluidics and
nanofluidics 12(1-4):485-98
Gauthier F, Goldsmith HL, Mason SG (1971) Particle Motions in Non‐Newtonian
Media. II. Poiseuille Flow. Transactions of The Society of Rheology (1957-
1977) 15(2):297-330
Guénette R, Fortin A, Kane A, Hétu JF (2008) An adaptive remeshing strategy for
viscoelastic fluid flow simulations. Journal of Non-Newtonian Fluid
Mechanics 153(1):34-45
Hu HH, Patankar NA, Zhu MY (2001) Direct numerical simulations of fluid–solid
systems using the arbitrary Lagrangian–Eulerian technique. Journal of
Computational Physics 169(2):427-62.
Huang PY, Feng J, Hu HH, Joseph DD (1997) Direct simulation of the motion of solid
particles in Couette and Poiseuille flows of viscoelastic fluids. Journal of
Fluid Mechanics 343:73-94.
Huang LR, Cox EC, Austin RH, Sturm JC (2004) Continuous particle separation through
deterministic lateral displacement. Science 304(5673):987-90

134
Huang PY, Joseph DD (2000) Effects of shear thinning on migration of neutrally buoyant
particles in pressure driven flow of Newtonian and viscoelastic fluids. Journal
of non-newtonian fluid mechanics 90(2):159-85
James DF (2009) Boger fluids. Annual Review of Fluid Mechanics 41:129-42
Jung JH, Lee KH, Lee KS, Ha BH, Oh YS, Sung HJ (2014) Optical separation of droplets
on a microfluidic platform. Microfluidics and nanofluidics 16(4):635-44
Kang AR, Ahn SW, Lee SJ, Lee B, Lee SS, Kim JM (2011) Medium viscoelastic effect
on particle segregation in concentrated suspensions under rectangular
microchannel flows. Korea-Australia Rheology Journal 23(4):247-54
Kang K, Lee SS, Hyun K, Lee SJ, Kim JM (2013) DNA-based highly tunable particle
focuser. Nature communications 4
Karnis A, Mason SG (1966) Particle motions in sheared suspensions. XIX. Viscoelastic
media. Transactions of The Society of Rheology (1957-1977). 10(2):571-92
Kim JY, Ahn SW, Lee SS, Kim JM (2012) Lateral migration and focusing of colloidal
particles and DNA molecules under viscoelastic flow. Lab on a Chip
12(16):2807-14
Kim YW, Yoo JY (2008) The lateral migration of neutrally-buoyant spheres transported
through square microchannels. Journal of Micromechanics and
Microengineering (6):065015.
Lee EF, Koch DL, Joo YL (2010) Cross-stream forces and velocities of fixed and freely
suspended particles in viscoelastic poiseuille flow: Perturbation and numerical
analyses. Journal of Non-Newtonian Fluid Mechanics 165(19):1309-27
Leshansky AM, Bransky A, Korin N, Dinnar U (2007) Tunable nonlinear viscoelastic
“focusing” in a microfluidic device. Physical review letters 98(23):234501
Li G, McKinley GH, Ardekani AM (2015) Dynamics of particle migration in channel
flow of viscoelastic fluids. Journal of Fluid Mechanics 785:486-505
Lim EJ, Ober TJ, Edd JF, Desai SP, Neal D, Bong KW, Doyle PS, McKinley GH, Toner
M (2014) Inertio-elastic focusing of bioparticles in microchannels at high
throughput. Nature communications 5
Liu C, Xue C, Chen X, Shan L, Tian Y, Hu G (2015) Size-based separation of particles
and cells utilizing viscoelastic effects in straight microchannels. Analytical
chemistry (12):6041-8
Lu X, Patel S, Zhang M, Joo SW, Qian S, Ogale A, Xuan X (2014) An unexpected
particle oscillation for electrophoresis in viscoelastic fluids through a
microchannel constriction. Biomicrofluidics 8(2):021802
Lu X, Xuan X (2015a) Inertia-Enhanced Pinched Flow Fractionation. Analytical
chemistry 87(8):4560-5
135
Lu X, Xuan X (2015b) Continuous Microfluidic Particle Separation via Elasto-Inertial
Pinched Flow Fractionation. Analytical chemistry 87(12):6389-96
Lu X, Xuan X (2015c) Elasto-Inertial Pinched Flow Fractionation for Continuous Shape-
Based Particle Separation. Analytical chemistry 87(22):11523-30
Lu X, Zhu L, Hua RM, Xuan X (2015d) Continuous sheath-free separation of particles by
shape in viscoelastic fluids. Applied Physics Letters 107(26):264102
Nam J, Lim H, Kim D, Jung H, Shin S (2012) Continuous separation of microparticles in
a microfluidic channel via the elasto-inertial effect of non-Newtonian fluid.
Lab on a chip 12(7):1347-54
Rodd LE, Cooper-White JJ, Boger DV, McKinley GH (2007) Role of the elasticity
number in the entry flow of dilute polymer solutions in micro-fabricated
contraction geometries. Journal of Non-Newtonian Fluid Mechanics
143(2):170-91.
Rodd LE, Scott TP, Boger DV, Cooper-White JJ, McKinley GH (2005) The inertio-
elastic planar entry flow of low-viscosity elastic fluids in micro-fabricated
geometries. Journal of Non-Newtonian Fluid Mechanics 129(1):1-22
Rodd LE, Scott TP, Boger DV, Cooper-White JJ, McKinley GH (2005) The inertio-
elastic planar entry flow of low-viscosity elastic fluids in micro-fabricated
geometries. Journal of Non-Newtonian Fluid Mechanics 129(1):1-22
Sajeesh P, Sen AK (2014) Particle separation and sorting in microfluidic devices: a
review. Microfluidics and nanofluidics 17(1):1-52
Segur JB, Oberstar HE (1951) Viscosity of glycerol and its aqueous solutions. Industrial
& Engineering Chemistry 43(9):2117-20
Seo KW, Kang YJ, Lee SJ (2014) Lateral migration and focusing of microspheres in a
microchannel flow of viscoelastic fluids. Physics of Fluids (1994-present)
26(6):063301
Shields IV CW, Reyes CD, López GP (2015) Microfluidic cell sorting: a review of the
advances in the separation of cells from debulking to rare cell isolation. Lab
on a Chip 15(5):1230-49
Stone HA, Stroock AD, Ajdari A (2004) Engineering flows in small devices:
microfluidics toward a lab-on-a-chip. Annu Rev Fluid Mech 36:381-411
Swaminathan VV, Shannon MA, Bashir R (2015) Enhanced sub-micron colloidal particle
separation with interdigitated microelectrode arrays using mixed AC/DC
dielectrophoretic scheme. Biomedical microdevices 17(2):1-9
Tehrani MA (1996) An experimental study of particle migration in pipe flow of
viscoelastic fluids. Journal of Rheology (1978-present) 40(6):1057-77
Trofa M, Vocciante M, D’Avino G, Hulsen MA, Greco F, Maffettone PL (2015)
Numerical simulations of the competition between the effects of inertia and

136
viscoelasticity on particle migration in Poiseuille flow. Computers & Fluids
107:214-23
Villone MM, D’avino G, Hulsen MA, Greco F, Maffettone PL (2011a) Numerical
simulations of particle migration in a viscoelastic fluid subjected to Poiseuille
flow. Computers & Fluids 42(1):82-91
Villone MM, D’Avino G, Hulsen MA, Greco F, Maffettone PL (2011b) Simulations of
viscoelasticity-induced focusing of particles in pressure-driven micro-slit
flow. Journal of Non-Newtonian Fluid Mechanics 166(23):1396-405
Villone MM, D’Avino G, Hulsen MA, Greco F, Maffettone PL (2013) Particle motion in
square channel flow of a viscoelastic liquid: Migration vs. secondary flows.
Journal of Non-Newtonian Fluid Mechanics 195:1-8
Yamada M, Nakashima M, Seki M (2004) Pinched flow fractionation: continuous size
separation of particles utilizing a laminar flow profile in a pinched
microchannel. Analytical chemistry 76(18):5465-71
Yamada M, Seki M (2005) Hydrodynamic filtration for on-chip particle concentration
and classification utilizing microfluidics. Lab on a Chip 5(11):1233-9
Yang S, Lee SS, Ahn SW, Kang K, Shim W, Lee G, Hyun K, Kim JM (2012)
Deformability-selective particle entrainment and separation in a rectangular
microchannel using medium viscoelasticity. Soft Matter 8(18):5011-9
Zhou Y, Kumar DT, Lu X, Kale A, DuBose J, Song Y, Wang J, Li D, Xuan X (2015)
Simultaneous diamagnetic and magnetic particle trapping in ferrofluid
microflows via a single permanent magnet. Biomicrofluidics 9(4):044102
Zurita-Gotor M, Bławzdziewicz J, Wajnryb E (2007) Swapping trajectories: A new wall-
induced cross-streamline particle migration mechanism in a dilute suspension
of spheres. Journal of Fluid Mechanics 592:447-69

137
CHAPTER SEVEN
ELASTO-INERTIAL PINCHED FLOW FRACTIONATION (eiPFF) FOR
CONTINUOUS SHAPE-BASED PARTICLE SEPARATION
Abstract
Shape is an important passive marker in label-free particle and cell separation for
chemical, biomedical and environmental applications. We demonstrate herein a
continuous-flow shape-based separation of spherical and peanut-shaped rigid particles of
equal volume (or equivalent spherical diameter) via elasto-inertial pinched flow
fractionation (eiPFF). This microfluidic technique exploits the shape-dependence of the
flow-induced elasto-inertial lift (and hence the cross-stream migration) in viscoelastic
fluids to increase the displacement of a sheath flow-focused particle mixture for a high-
purity separation. The parametric effects on this shape-based particle separation via
eiPFF are systematically investigated in terms of five dimensionless numbers. It is found
that the separation is strongly affected by the flow rate, fluid elasticity and channel aspect
ratio. Interestingly, the elasto-inertial deflection of the peanut particles can be either
greater or smaller than that of equally-volumed spherical particles. This phenomenon is
speculated to correlate with the rotational effects of peanut particles.
7.1 Introduction
Shape is a fundamental property of particles and cells that can influence their
interactions with the environment and determine their functional capabilities.1 can be an
important factor for characterizing cellular biospecies, for instance, prokaryotes are

138
classified into different groups by shape such as rod-shaped, spiral-shaped and spherical
ones.2 Shape has been found to play a significant role in phagocytosis where
macrophages internalize pathogens and airborne particles of various shapes.3 It can also
be used to identify cell cycle stages. For example, budding yeasts undergo shape changes
from spheres to bi-spherical twins or larger aggregates during cell division.4 Moreover,
shape is a good indicator of cell states that can provide useful information for disease
diagnostics. It has been long known that the shape change of red blood cells is often
accompanied with a disease such as sickle-cell disease5 or malaria.
6 Therefore, shape is
an important intrinsic marker for label-free cell and particle sorting, which may find
applications in pathogen isolation from biological fluids for disease diagnostics,
classification of environmental bacteria and elimination of aggregates from synthesized
particles etc.
A variety of microfluidic techniques have thus far been demonstrated to separate
particles and cells in continuous flows.7,8
However, the majority of these techniques are
focused on particle separation by size.9,10
Only until very recently has the particle shape
been exploited as a passive sorting marker in a limited number of studies. Sugaya et al.11
exploited the dissimilar rotation at fluid branch points to separate spherical particles from
non-spherical particles and single yeasts from budding yeasts. This hydrodynamic
filtration12
technique requires the use of a network of microchannels. Valero et al.13
utilized multi-frequency dielectrophoresis to synchronize yeast cell division, which
requires the integration of in-channel microelectrodes and also a precise control of the
medium electric conductivity. Beech et al.14
used deterministic lateral displacement15
to

139
classify morphologically altered red blood cells based on shape. This technique, which
has also been investigated by Zeming et al.16
for shape-based separation, requires the
fabrication of a high-resolution array of posts. Masaeli et al.17
utilized differential inertial
focusing18
to sort spheres and rods as well as yeast cells at various stages in a long
straight microchannel. This separation relies on high flow speed-induced inertial lift and
is thus restricted from handling small amount of samples. Recently, our group has used
curvature-induced dielectrophoresis (C-iDEP)19-21
to separate particles by shape in an
asymmetric double-spiral microchannel.22
This electrokinetic method suffers from a low
throughput and may be harmful to cells due to potential electrical damages.23
In this work we demonstrate the use of a recently developed size-based particle
separation technique in viscoelastic fluids,24,25
which we termed elasto-inertial pinched
flow fractionation or eiPFF in short,26
to continuously separate particles based on shape
in straight rectangular microchannels. As illustrated by the schematic (not to scale) in
Figure 1, eiPFF exploits the strong size-dependence of the flow-induced elasto-inertial
lift (and hence the cross-stream migration) to increase the displacement of a sheath flow-
focused particle mixture for a significantly enhanced separation than the traditional steric
effects-based PFF.27,28
We hypothesize that the elasto-inertial lift induced particle
migration in viscoelastic fluids are also a function of particle shape, which will be
demonstrated in this work by the continuous deflection and separation of spherical and
peanut-shaped particles of equal volume. The observations will also be directly compared
with those for particles suspended in a Newtonian fluid under identical experimental
conditions. Moreover, a systematic study of the parametric effects such as flow rate, fluid

140
elasticity and channel aspect ratio will be carried out for a comprehensive understanding
of the important factors that may impact the shape-based particle separation via eiPFF.
Figure 1 Schematic illustration (not to scale) of the mechanism for shape-based particle
separation via eiPFF. The flow-induced elasto-inertial lift force (which can be simply
viewed as a combination of elastic lift and inertial lift) in a viscoelastic fluid significantly
increases the displacement of a sheath flow-focused mixture of spherical and peanut-
shaped particles for a high-purity separation.
7.2 Experimental
7.2.1 Preparation of particle suspensions
Fluorescent spherical polystyrene particles of 4.18 µm diameter (Bangs
Laboratories, Inc.) and plain peanut-shaped polystyrene particles of 3.5 µm-diameter/6
µm-length (Magsphere, Inc.) were used to demonstrate the shape-based separation. The
peanut particles are obtained by fusing two 3.5 µm-diameter spherical particles, whose
overall volume was calculated to be 39.84 µm3 using the geometry package in
COMSOL
. This volume corresponds to an equivalent spherical diameter of 4.23 µm,
which deviates from that of the spherical particles by only 1.2%; see a zoom-in picture of
both particles in Figure 2(A). The two types of particles were mixed at a 1:1 ratio and re-
suspended in water-based Newtonian and non-Newtonian fluids to a final concentration
Viscoelastic
sheath fluid
Particle mixture in
viscoelastic fluid
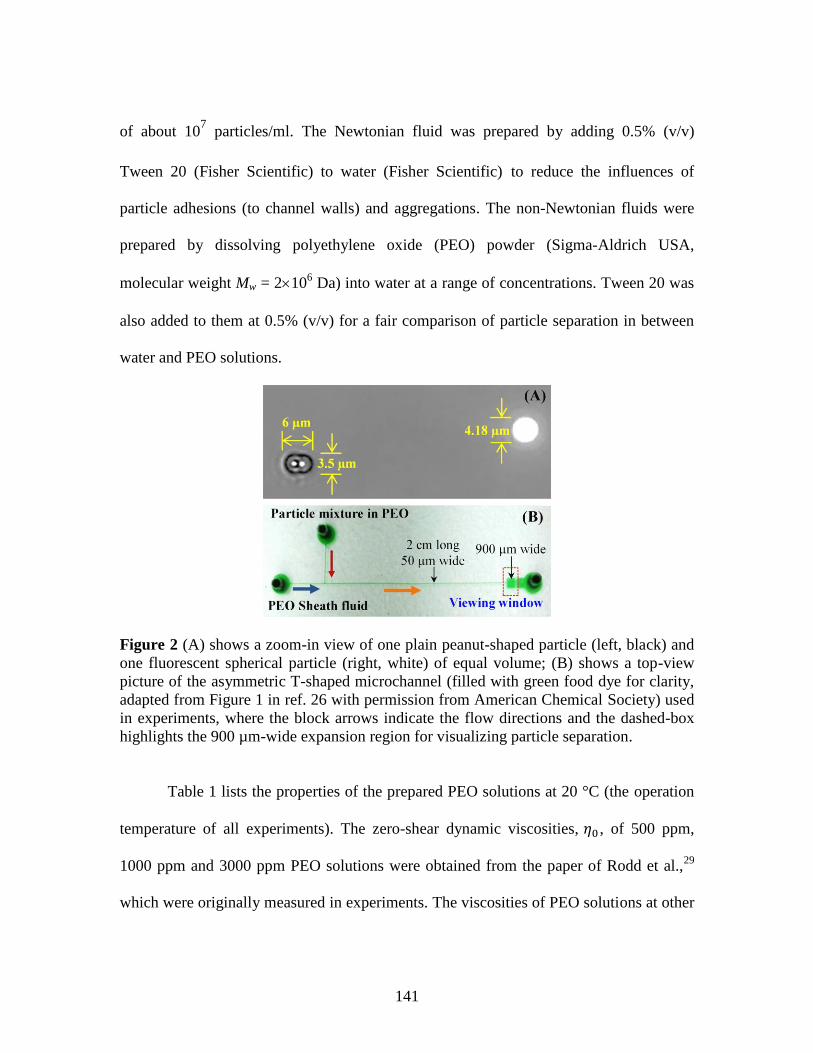
141
of about 107 particles/ml. The Newtonian fluid was prepared by adding 0.5% (v/v)
Tween 20 (Fisher Scientific) to water (Fisher Scientific) to reduce the influences of
particle adhesions (to channel walls) and aggregations. The non-Newtonian fluids were
prepared by dissolving polyethylene oxide (PEO) powder (Sigma-Aldrich USA,
molecular weight Mw = 2106 Da) into water at a range of concentrations. Tween 20 was
also added to them at 0.5% (v/v) for a fair comparison of particle separation in between
water and PEO solutions.
Figure 2 (A) shows a zoom-in view of one plain peanut-shaped particle (left, black) and
one fluorescent spherical particle (right, white) of equal volume; (B) shows a top-view
picture of the asymmetric T-shaped microchannel (filled with green food dye for clarity,
adapted from Figure 1 in ref. 26 with permission from American Chemical Society) used
in experiments, where the block arrows indicate the flow directions and the dashed-box
highlights the 900 µm-wide expansion region for visualizing particle separation.
Table 1 lists the properties of the prepared PEO solutions at 20 °C (the operation
temperature of all experiments). The zero-shear dynamic viscosities, 𝜂0 , of 500 ppm,
1000 ppm and 3000 ppm PEO solutions were obtained from the paper of Rodd et al.,29
which were originally measured in experiments. The viscosities of PEO solutions at other
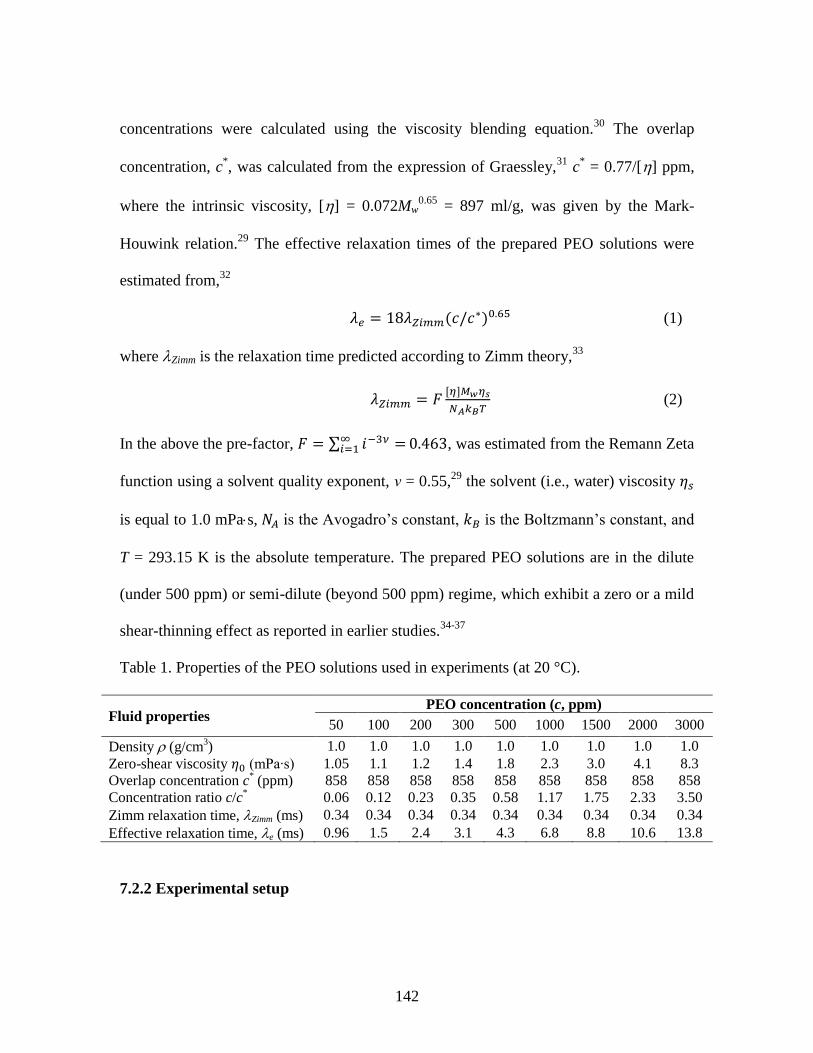
142
concentrations were calculated using the viscosity blending equation.30
The overlap
concentration, c*, was calculated from the expression of Graessley,
31 c
* = 0.77/[] ppm,
where the intrinsic viscosity, [] = 0.072Mw0.65
= 897 ml/g, was given by the Mark-
Houwink relation.29
The effective relaxation times of the prepared PEO solutions were
estimated from,32
𝜆𝑒 = 18𝜆𝑍𝑖𝑚𝑚(𝑐/𝑐∗)0.65 (1)
where Zimm is the relaxation time predicted according to Zimm theory,33
𝜆𝑍𝑖𝑚𝑚 = 𝐹[𝜂]𝑀𝑤𝜂𝑠
𝑁𝐴𝑘𝐵𝑇 (2)
In the above the pre-factor, 𝐹 = ∑ 𝑖−3𝜈 =∞𝑖=1 0.463, was estimated from the Remann Zeta
function using a solvent quality exponent, ν = 0.55,29
the solvent (i.e., water) viscosity 𝜂𝑠
is equal to 1.0 mPas, 𝑁𝐴 is the Avogadro’s constant, 𝑘𝐵 is the Boltzmann’s constant, and
T = 293.15 K is the absolute temperature. The prepared PEO solutions are in the dilute
(under 500 ppm) or semi-dilute (beyond 500 ppm) regime, which exhibit a zero or a mild
shear-thinning effect as reported in earlier studies.34-37
Table 1. Properties of the PEO solutions used in experiments (at 20 °C).
Fluid properties PEO concentration (c, ppm)
50 100 200 300 500 1000 1500 2000 3000
Density (g/cm3) 1.0 1.0 1.0 1.0 1.0 1.0 1.0 1.0 1.0
Zero-shear viscosity 𝜂0 (mPa∙s) 1.05 1.1 1.2 1.4 1.8 2.3 3.0 4.1 8.3
Overlap concentration c* (ppm) 858 858 858 858 858 858 858 858 858
Concentration ratio c/c* 0.06 0.12 0.23 0.35 0.58 1.17 1.75 2.33 3.50
Zimm relaxation time, Zimm (ms) 0.34 0.34 0.34 0.34 0.34 0.34 0.34 0.34 0.34
Effective relaxation time, e (ms) 0.96 1.5 2.4 3.1 4.3 6.8 8.8 10.6 13.8
7.2.2 Experimental setup

143
The standard soft lithography method was used to fabricate microchannels with
polydimethylsiloxane (PDMS); see a top-view picture of the channel in Figure 2(B). The
details of the fabrication procedure are referred to Lu et al.26,38
The asymmetric T-shaped
microchannel has two 4 mm-long side-branches followed by a 2 cm-long main-branch
with a uniform width of 50 µm. At the end of the main-branch there is a 900-µm wide, 2
mm-long expansion for enhancing and visualizing the particle separation. Four depths of
channels were fabricated for the purpose of examining the effect of channel aspect ratio
on particle separation, which are 15, 25, 40 and 100 µm, respectively. Infusion syringe
pumps were used to drive the sheath fluid (New Era Pump Systems, Inc.) and particle
mixture (KD Scientific). Particle motion was recorded through an inverted microscope
(Nikon Eclipse TE2000U, Nikon Instruments) with a CCD camera (Nikon DS-Qi1Mc) at
a frame rate of around 15 Hz. Fluorescent and bright-field lights were simultaneously
used in order to visualize both the fluorescent spherical particles and the plain peanut-
shaped particles. Images were post-processed using the Nikon imaging software (NIS-
Elements AR 3.22). Superimposed particle images were obtained by stacking a sequence
of around 800 snapshot images with the maximum and minimum intensity projections for
the fluorescent and plain particles, respectively.
7.2.3 Dimensionless numbers
We study the parametric effects on particle separation via eiPFF in terms of five
dimensionless numbers.26
The Reynolds number is defined as the ratio of the inertial
force to the viscous force,
144
𝑅𝑒 =𝜌𝑉𝐷ℎ
𝜂0=
2𝜌𝑄
𝜂0(𝑤+ℎ) (3)
where is the fluid density, V is the average fluid velocity in a rectangular microchannel
of width w and height h, Dh = 2wh/(w+h) is the hydraulic diameter, and Q is the
volumetric flow rate. The Weissenberg number measures the fluid elasticity effects and is
defined as
𝑊𝑖 = 𝜆𝑒�̇� = 𝜆𝑒2𝑉
𝑤=
2𝜆𝑒𝑄
𝑤2ℎ (4)
where �̇� is the average fluid shear rate in the microchannel. The elasticity number is
defined as the ratio of fluid elasticity to inertia and is hence independent of the flow
kinematics,
𝐸𝑙 =𝑊𝑖
𝑅𝑒=
𝜆𝑒𝜂0(𝑤+ℎ)
𝜌𝑤2ℎ. (5)
The flow rate ratio between the sheath fluid and particle mixture in the two side-branches
measures the sheath flow focusing performance in the main-branch, which affects the
particle deflection and dispersion at the channel expansion,
𝛼 =𝑄𝑠ℎ𝑒𝑎𝑡ℎ
𝑄𝑝𝑎𝑟𝑡𝑖𝑐𝑙𝑒. (6)
Note that the definitions of Re in eq 1 and Wi in eq 2 are both based on the total flow rate
in the main-branch of the microchannel, i.e., 𝑄 = 𝑄𝑠ℎ𝑒𝑎𝑡ℎ + 𝑄𝑝𝑎𝑟𝑡𝑖𝑐𝑙𝑒. The channel aspect
ratio is the channel width to height ratio,
𝐴𝑅 = 𝑤/ℎ (7)
Which, as recently reported,39
affects the particle focusing position in non-Newtonian
fluids through straight microchannels.

145
7.3 Results and discussion
7.3.1 Effects of fluid elasticity (Wi)
Figure 3 compares the shape-based separation of fluorescent spherical particles
and plain peanut particles in water (A, Wi = 0) and 1000 ppm PEO solution (B, Wi = 6.35)
through a 25 µm deep microchannel (AR = 2.0). The sheath flow rate is 100 µl/h in both
experiments and the flow rate ratio between the sheath fluid and particle mixture is fixed
at = 20. In the Newtonian water solution, the spherical (appearing white) and peanut
(appearing black) particles both move near the channel sidewall and overlap with each
other without a visible separation; see the snapshot (left) and superimposed (middle for
peanuts and right for spheres) images in Figure 3(A). In contrast, they are both
significantly deflected away from the sidewall by the flow-induced elasto-inertial
(primarily elastic) lift in the viscoelastic PEO solution. Moreover, as demonstrated in
Figure 2(B), the exiting positions of spherical particles are much closer to the channel
centerline and are thus clearly separated from the peanut particles with only very few
particles scattered in between the two streams.

146
Figure 3 Comparison of shape-based separation of fluorescent spherical (white) and
plain peanut-shaped particles (black) in water (A) and 1000 ppm PEO solution (B)
through a 25 µm deep microchannel under the sheath flow rate of 100 µl/h and the flow
rate ratio of 20. The images in the left, middle and right columns are the snapshot images
of both particles, superimposed images of peanut particles, and superimposed images of
spherical particles at the channel expansion, respectively. The two dashed boxes in (B)
highlight the regions to be used as cropped images in the following figures if applicable.
The flow direction is from left to right in all images.
As suggested by the recent work from Masaeli et al.17
, we tracked the orientation
of peanut particles in the above two experiments using a high-speed camera (Photron SA-
4, Motion Capture Technologies) at a frame rate of 3600/s. Figure 4(A) displays two
superimposed images of single peanut particle traveling through the 50 µm-wide main-
branch in water (top) and 1000 ppm PEO solution (bottom), respectively. The images
were each obtained by superimposing every other frame of a short video, i.e., the time
interval between neighboring particle positions on the images is fixed at 1/1800 s. The
peanut particle in water seems to undergo a periodic three-dimensional rotation, both in-
plane and out-of-plane, which has also been observed by Masaeli et al.17
In contrast, the
Water200 µm
PEO
Spheres
Peanuts
(A)
(B)
Wi = 6.35
Re = 0.34
Wi = 0
Re = 0.78

147
rotation in the PEO solution appears to be primarily in plane and happens at an
apparently lower speed than in water.
Figure 4 Comparison of the rotation of peanut particles in water and 1000 ppm PEO
solution through a 25 µm deep microchannel under a sheath flow rate of 100 µl/h: (A)
shows the superimposed images of single peanut particle in water (top) and PEO
(bottom), where the time interval between neighboring particle positions is 1/1800 s and
the block arrow indicates the particle traveling direction; (B) shows the time-varied
orientations of the long axis of peanut particles (markers) with respect to the flow
direction (see the definition of angle on the schematic) in the two suspending fluids,
which were estimated from the images in (A) (note that not all the particle orientations
are included in the plot). The schematics of peanut particles on the plot are used to
highlight the particle orientations at different angles. The solid lines are used to connect
the markers only.
Figure 4(B) compares the time-varied orientations of the long axis of peanut
particles (markers) in the two suspending fluids, which were estimated with respect to the
flow direction from the top-view images in Figure 4(A). The period of the peanut particle
0
45
90
135
180
225
0 0.005 0.01 0.015 0.02
Pa
rtic
le o
rien
tati
on
(d
egre
e)
Travel time (s)
(B)Flow
Water
PEO
Water
PEO
50 µm(A)
148
rotation in water is around 3 ms, which is consistent with the theoretical prediction of the
orbit period, Torbit, for an inertialess ellipsoid, 17,40
Torbit =2π
γ̇(α +
1
α) (8)
where γ̇ is the local fluid shear rate, and α is the particle aspect ratio. Specifically, if it
is viewed as an approximate ellipsoid, the peanut particle has an aspect ratio of = 3.5/6.
The local shear rate can be estimated from the average flow velocity at 100 µl/h (i.e.,
0.022 m/s) divided by the equivalent spherical diameter of the peanut particle (i.e., 4.23
µm), which gives γ̇ = 5201 s-1. Substituting these parameters into eq 8 yields an orbit
period of Torbit = 2.8 ms for the peanut particle rotation in water, which is at least an
order of magnitude shorter than that in PEO. Such a substantially extended period of
particle rotation in a viscoelastic solution is consistent with the experimental observation
of Bartram et al.41
, who found a significant increase in the period of rotational rods in
polyacrylamide (PAA) solution over that predicted by a Newtonian fluid-based theory.
Moreover, this difference grows with increasing shear rate due to likely the existence of
an elastic restoring torque opposing that from the viscous deformation of the fluid.41
It is also noticed in Figure 4(B) that the peanut particle in the PEO solution tends
to travel with its long axis aligned towards the flow direction, i.e., 0 or 180 degree
orientation. This can be viewed from the slope of the particle orientation vs. time curve,
which indicates that the rotational speed is around 10 degree/ms and 2.4 degree/ms when
the long axis of the peanut particle is perpendicular (i.e., 90 degree orientation) and
parallel to the flow direction, respectively. Such a preferred parallel orientation renders
the elasto-inertial lift force more dependent on the shorter dimension of the peanut

149
particle (i.e., 3.5 µm), which is smaller than the diameter of the spherical particle (i.e.,
4.18 µm). Furthermore, the peanut particle experiences a greater drag force due to its
larger surface area,42
yielding a smaller deflection than that of the spherical one as
demonstrated in Figure 3.
7.3.2 Effects of fluid inertia (Re)
Figure 5 shows the effect of flow rate (in terms of Re) on the shape-based
separation in water (A) and 1000 ppm PEO solution (B) in a 25 µm deep microchannel.
The sheath flow rate is varied from 20 µl/h to 400 µl/h while the flow rate ratio between
the sheath fluid and particle mixture is fixed at = 20. In the Newtonian fluid, the
equilibrium positions of spherical (white) and peanut (black) particles both appear to
migrate away from the wall slightly with the increase of Re. This is a result of the
increasing inertial lift force, though weak for small particles at Re of order 1, that acts to
push particles away from walls.43,44
However, as seen from Fig. 5(A), there is no particle
separation observed in all the tested flow rates (up to 1 ml/h with Re = 7.76, image not
shown). In contrast, the effect of Re on the equilibrium positions and separation of
spherical/peanut particles in the PEO solution is much more complicated as demonstrated
in Figure 5(B). At the lowest sheath flow rate of 20 µl/h with Re = 0.07, each type of
particles already attain a much larger deflection than that in water due to the action of the
dominant elastic lift force at Wi = 1.27. While the deflection of spherical particles (white)
is apparently greater than that of peanut particles (black), the two particle streams still
partially overlap with each other rendering the separation incomplete. Moreover, there
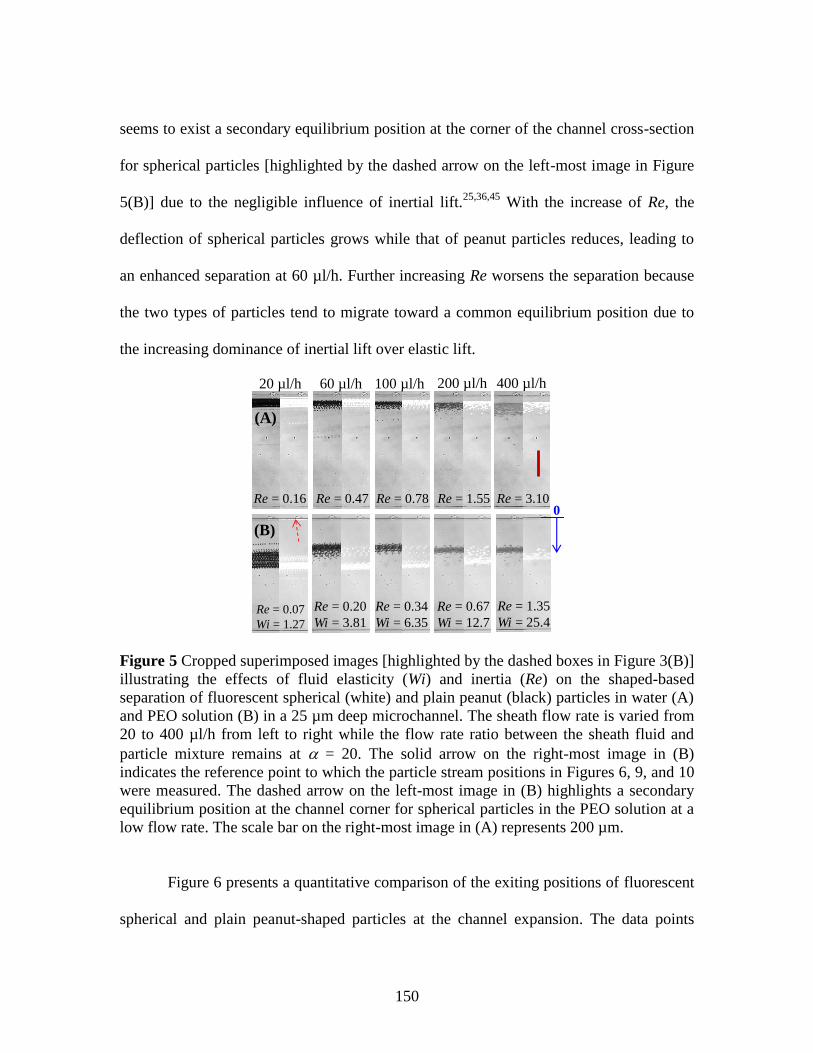
150
seems to exist a secondary equilibrium position at the corner of the channel cross-section
for spherical particles [highlighted by the dashed arrow on the left-most image in Figure
5(B)] due to the negligible influence of inertial lift.25,36,45
With the increase of Re, the
deflection of spherical particles grows while that of peanut particles reduces, leading to
an enhanced separation at 60 µl/h. Further increasing Re worsens the separation because
the two types of particles tend to migrate toward a common equilibrium position due to
the increasing dominance of inertial lift over elastic lift.
Figure 5 Cropped superimposed images [highlighted by the dashed boxes in Figure 3(B)]
illustrating the effects of fluid elasticity (Wi) and inertia (Re) on the shaped-based
separation of fluorescent spherical (white) and plain peanut (black) particles in water (A)
and PEO solution (B) in a 25 µm deep microchannel. The sheath flow rate is varied from
20 to 400 µl/h from left to right while the flow rate ratio between the sheath fluid and
particle mixture remains at = 20. The solid arrow on the right-most image in (B)
indicates the reference point to which the particle stream positions in Figures 6, 9, and 10
were measured. The dashed arrow on the left-most image in (B) highlights a secondary
equilibrium position at the channel corner for spherical particles in the PEO solution at a
low flow rate. The scale bar on the right-most image in (A) represents 200 µm.
Figure 6 presents a quantitative comparison of the exiting positions of fluorescent
spherical and plain peanut-shaped particles at the channel expansion. The data points
Re = 0.20
Wi = 3.81Re = 0.07
Wi = 1.27
Re = 0.34
Wi = 6.35
Re = 0.67
Wi = 12.7
Re = 1.35
Wi = 25.4
20 µl/h 60 µl/h 100 µl/h 200 µl/h 400 µl/h
Re = 0.47 Re = 0.78 Re = 1.55 Re = 3.100
Re = 0.16
(A)
(B)
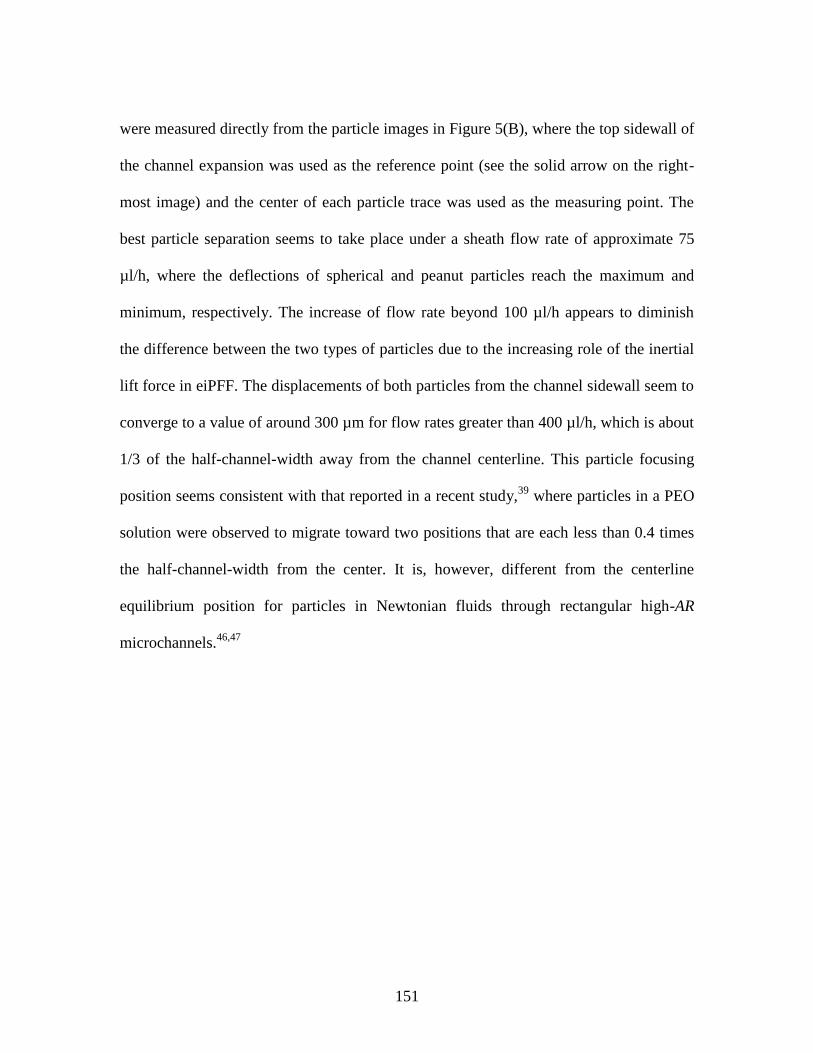
151
were measured directly from the particle images in Figure 5(B), where the top sidewall of
the channel expansion was used as the reference point (see the solid arrow on the right-
most image) and the center of each particle trace was used as the measuring point. The
best particle separation seems to take place under a sheath flow rate of approximate 75
µl/h, where the deflections of spherical and peanut particles reach the maximum and
minimum, respectively. The increase of flow rate beyond 100 µl/h appears to diminish
the difference between the two types of particles due to the increasing role of the inertial
lift force in eiPFF. The displacements of both particles from the channel sidewall seem to
converge to a value of around 300 µm for flow rates greater than 400 µl/h, which is about
1/3 of the half-channel-width away from the channel centerline. This particle focusing
position seems consistent with that reported in a recent study,39
where particles in a PEO
solution were observed to migrate toward two positions that are each less than 0.4 times
the half-channel-width from the center. It is, however, different from the centerline
equilibrium position for particles in Newtonian fluids through rectangular high-AR
microchannels.46,47
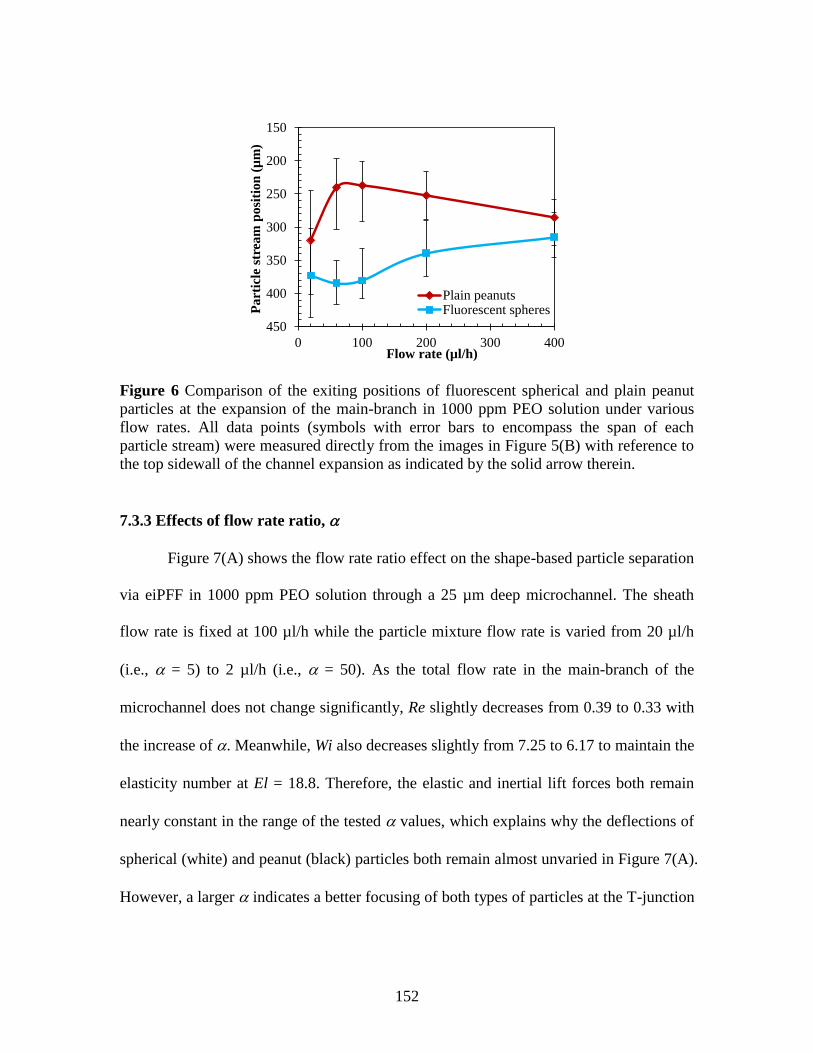
152
Figure 6 Comparison of the exiting positions of fluorescent spherical and plain peanut
particles at the expansion of the main-branch in 1000 ppm PEO solution under various
flow rates. All data points (symbols with error bars to encompass the span of each
particle stream) were measured directly from the images in Figure 5(B) with reference to
the top sidewall of the channel expansion as indicated by the solid arrow therein.
7.3.3 Effects of flow rate ratio,
Figure 7(A) shows the flow rate ratio effect on the shape-based particle separation
via eiPFF in 1000 ppm PEO solution through a 25 µm deep microchannel. The sheath
flow rate is fixed at 100 µl/h while the particle mixture flow rate is varied from 20 µl/h
(i.e., = 5) to 2 µl/h (i.e., = 50). As the total flow rate in the main-branch of the
microchannel does not change significantly, Re slightly decreases from 0.39 to 0.33 with
the increase of . Meanwhile, Wi also decreases slightly from 7.25 to 6.17 to maintain the
elasticity number at El = 18.8. Therefore, the elastic and inertial lift forces both remain
nearly constant in the range of the tested values, which explains why the deflections of
spherical (white) and peanut (black) particles both remain almost unvaried in Figure 7(A).
However, a larger indicates a better focusing of both types of particles at the T-junction
150
200
250
300
350
400
450
0 100 200 300 400
Pa
rtic
le s
trea
m p
osi
tio
n (
µm
)
Flow rate (µl/h)
Plain peanutsFluorescent spheres

153
of the microchannel [see Figure 1 and Figure 2(B)],24-28
which yields a smaller dispersion
of either particles and hence an enhanced separation. The separation purity was
determined by manually counting the percentages of spherical and peanut particles below
and above the dashed-dotted line in Figure 7(A), respectively, using the Nikon imaging
software. This line was drawn right in the middle of the two separated particle streams
because their center positions are both fixed in the range of the tested flow rate ratios. As
seen from Figure 7(B), the separation purity of either type of particles increases with
and is over 90% even for the smallest of 5. Interestingly, the separation purity of
peanut particles is higher than that of spherical particles at all the tested values due
partially to a smaller dispersion, for which the reason is currently unclear.
Figure 7 Flow rate ratio effect on the shape-based separation of fluorescent spherical
(white) and plain peanut (black) particles via eiPFF in 1000 ppm PEO solution through a
25 µm deep microchannel under a constant 100 µl/h sheath flow rate: (A) shows the
cropped superimposed images at the channel expansion, where the dashed-dotted line is
= 20 = 5 = 10 = 33 = 50
Re = 0.38
Wi = 7.25
Re = 0.35
Wi = 6.65
Re = 0.34
Wi = 6.35
Re = 0.33
Wi = 6.23
Re = 0.33
Wi = 6.17
(A)
0.86
0.88
0.9
0.92
0.94
0.96
0.98
1
5 10 20 33 50
Sep
ara
tio
n p
uri
ty
Flow rate ratio,
Spheres Peanuts(B)

154
right in the middle of the two separated particle streams; (B) shows the column plot for
the measured separation purity (i.e., percentage) of spherical and peanut particles below
and above the dashed-dotted line in (A), respectively. The scale bar on the right-most
image in (A) represents 200 µm.
7.3.4 Effects of PEO concentration (El)
Figure 8 shows the PEO concentration effect on the shape-based particle
separation via eiPFF in a 25 µm deep microchannel. The sheath flow rate and flow rate
ratio are fixed at 100 µl/h and 20, respectively. The PEO concentration is increased from
0 (i.e., water with El = 0) to 3000 ppm (El = 138) with eight other concentrations in
between. Due to the increase of viscosity at higher PEO concentrations (see Table 1), Re
decreases from 0.78 to 0.09 indicating a continuously weakened inertial lift force. As
illustrated in Figure 8, the deflections of fluorescent spherical (white) and plain peanut
(black) particles both appear to increase with the PEO concentration due to the dominant
elastic lift force. However, since the trend differs between the two types of particles, the
particle separation exhibits an interesting concentration-dependent pattern. Specifically,
peanut particles (black) obtain a greater deflection than spherical particles (white) when
the PEO concentration is below 300 ppm. Within this range, the center-to-center
separation gap between the two particle streams first increases with the PEO
concentration till 100 ppm and then decreases to zero at 300 ppm. In contrast, when the
PEO concentration is over 300 ppm, spherical particles (white) experience a larger
deflection than peanut particles (black). However, similar to the lower concentration
range (i.e., < 300 ppm), the particle separation gap also undergoes a first-increase-then-
decrease trend with the maximum taking place at around 1000 ppm. These interesting

155
phenomena are speculated to be a consequence of the complicated PEO concentration
effects on the rotation of peanut particles, which requires further intensive studies.
Figure 8 PEO concentration effect on the shape-based separation of fluorescent spherical
(white) and plain peanut (black) particles via eiPFF in a 25 µm deep microchannel under
a 100 µl/h sheath flow rate with a fixed flow rate ratio of 20. The scale bar on the right-
most image of the top row represents 200 µm.
The effect of PEO concentration on particle deflection and separation in eiPFF
can be viewed more clearly from the quantitative comparison of the exiting particle
positions in Figure 9. The deflection of spherical particles quickly grows from 70 µm to
405 µm with the increase of PEO concentration until 1000 ppm, which then gradually
levels off for concentrations over 1000 ppm with a seemingly equilibrium position near
the channel centerline (i.e., particle stream position at 450 µm). In contrast, three regimes
are observed for the deflection of peanut particles as the PEO concentration increases.
From 0 ppm to 100 ppm (El = 2.0), the deflection rapidly increases from 80 µm to 220
µm, which is faster than that of spherical particles as viewed from the slopes of the two
El = 31.8El = 9.3 El = 51.7
El = 0
El = 18.8 El = 138
El = 2.0 El = 3.5 El = 5.2El = 1.2
100 ppm0 ppm 50 ppm 200 ppm 300 ppm
1500 ppm500 ppm 1000 ppm 2000 ppm 3000 ppm

156
curves in Figure 9. It then remains nearly constant at 225 µm (5 µm) from 100 ppm to
500 ppm (El = 9.3), which is about half-way from the channel centerline. Beyond that,
the deflection of peanut particles follows a nearly linear relationship for PEO
concentration up to 3000 ppm (the highest under test). It may be safe to assume that the
spherical and peanut particles will eventually both migrate along the channel centerline at
even higher PEO concentrations. Under the experimental conditions, the largest
separation gap between the two types of particles occurs in 1000 ppm PEO solution (El =
18.8).
Figure 9 Comparison of the exiting positions of fluorescent spherical and plain peanut-
shaped particles at the expansion of the main-branch for different PEO concentrations.
All data points (symbols with error bars to encompass the span of each particle stream)
were measured directly from the images in Figure 8.
7.3.5 Effects of channel aspect ratio, AR
Figure 10 shows the channel aspect ratio effect on the separation of spherical
(white) and peanut (black) particles in 1000 ppm PEO solution through microchannels
with depths of 100 µm (AR = 0.5), 40 µm (AR = 1.25), 25 µm (AR = 2.0) and 15 µm (AR
0
100
200
300
400
500
0 500 1000 1500 2000 2500 3000
Pa
rtic
le s
trea
m p
osi
tio
n (
µm
)
PEO concentration (ppm)
Plain peanutsFluorescent spheres

157
= 3.3) from left to right. Under the fixed sheath flow rate of 100 µl/h and flow rate ratio
of 20, Re and Wi both increase with AR while the latter grows faster, yielding an
increasing El. In the 100 µm- and 40 µm-deep channels, the equilibrium position of
peanut particles (black) is farther away from the wall than that of spherical particles
(white) as demonstrated in Figure 10(A). Moreover, part of the spherical particles choose
to move near the corner in the 100 µm-deep channel, which is consistent with our recent
observation in a similar microchannel.26
The separation of the two types of particles is,
however, weak in both of these low-AR channels due to the strong influence of particle
dispersion. On the contrary, the deflection of spherical particles (white) surpasses that of
peanut particles (black) in both the 25 µm and 15 µm deep channels. This is speculated to
be due to the reduced rotational effects of the peanut particles, especially out-of-plane, in
shallower microchannels, the consequence of which has been explained above (see
Figure 4).
Re = 0.34
Wi = 6.35
Re = 0.39
Wi = 10.6
Re = 0.28
Wi = 3.97
Re = 0.17
Wi = 1.59
AR = 2.0AR = 0.5 AR = 1.25 AR = 3.3(A)
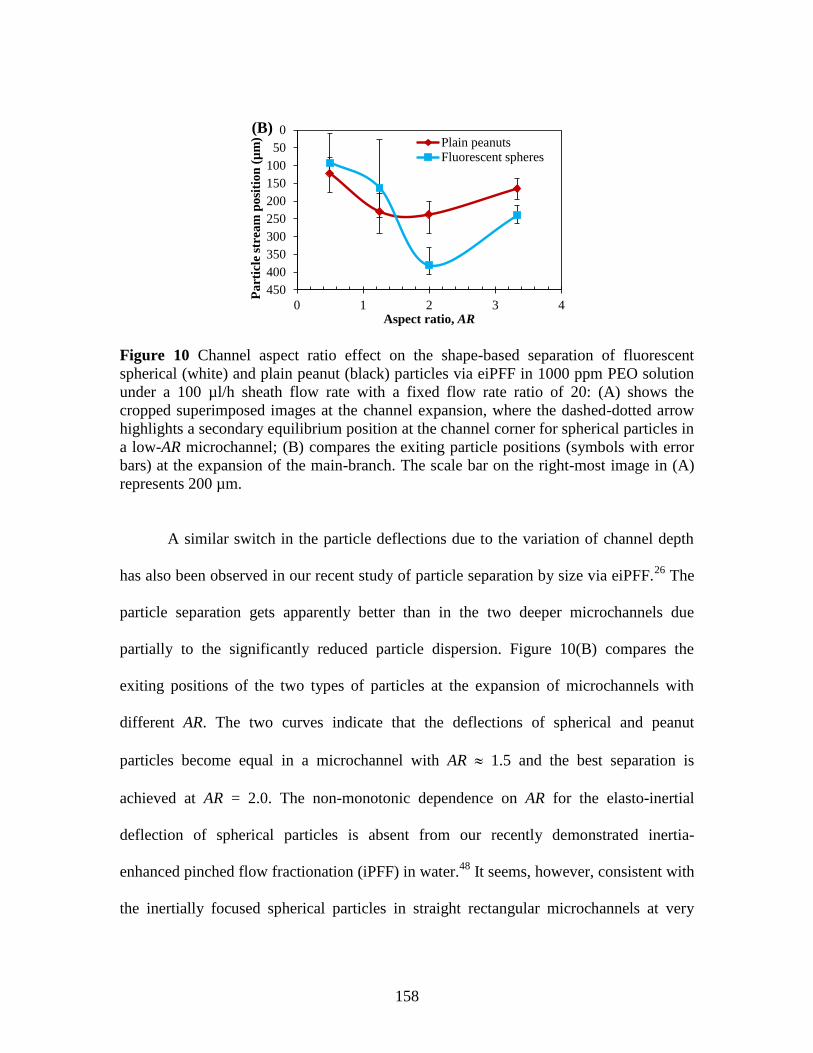
158
Figure 10 Channel aspect ratio effect on the shape-based separation of fluorescent
spherical (white) and plain peanut (black) particles via eiPFF in 1000 ppm PEO solution
under a 100 µl/h sheath flow rate with a fixed flow rate ratio of 20: (A) shows the
cropped superimposed images at the channel expansion, where the dashed-dotted arrow
highlights a secondary equilibrium position at the channel corner for spherical particles in
a low-AR microchannel; (B) compares the exiting particle positions (symbols with error
bars) at the expansion of the main-branch. The scale bar on the right-most image in (A)
represents 200 µm.
A similar switch in the particle deflections due to the variation of channel depth
has also been observed in our recent study of particle separation by size via eiPFF.26
The
particle separation gets apparently better than in the two deeper microchannels due
partially to the significantly reduced particle dispersion. Figure 10(B) compares the
exiting positions of the two types of particles at the expansion of microchannels with
different AR. The two curves indicate that the deflections of spherical and peanut
particles become equal in a microchannel with AR 1.5 and the best separation is
achieved at AR = 2.0. The non-monotonic dependence on AR for the elasto-inertial
deflection of spherical particles is absent from our recently demonstrated inertia-
enhanced pinched flow fractionation (iPFF) in water.48
It seems, however, consistent with
the inertially focused spherical particles in straight rectangular microchannels at very
0
50
100
150
200
250
300
350
400
450
0 1 2 3 4
Parti
cle
str
eam
posi
tion
(µ
m)
Aspect ratio, AR
Plain peanutsFluorescent spheres
(B)

159
high Re, where the equilibrium particle position can leave the channel center and shift
towards the wall with the increase of AR.47
7.4 Conclusions
We have demonstrated a continuous separation of spherical and peanut particles
of equal volume via a recently developed eiPFF technique.26
This separation arises from
the shape-dependent elasto-inertial lift-induced particle migration in viscoelastic fluids,
which is speculated to correlate with the particle rotation effects. We have also performed
a systematic experimental study of the parametric effects on such a label-free separation
in terms of five dimensionless numbers, i.e., Re, Wi, El, and AR. It has been found that
the separation is significantly affected by the flow rate and works effectively at Re of
order 1. The separation purity is high for both the peanut and spherical particles even at a
relatively small flow rate ratio . Moreover, the separation has been found to show a
strong dependence on both the fluid elasticity, El, and the channel aspect ratio, AR. These
phenomena happen because the two types of particles follow apparently different trends
when the PEO concentration or the channel depth is varied. Interestingly, the elasto-
inertial deflection of peanut particles can be equal to or greater/smaller than that of
spherical particles, depending on the values of El and AR. A similar correlation with AR
has also been recently reported by our group for size-based particle separation via
eiPFF.26
To further verify the hypothesis of shape-dependent elasto-inertial lift force, we
are currently fabricating ellipsoidal particles of various aspect ratios using the protocol
reported earlier3,17
for additional test of shape-based particle separation via eiPFF.
160
Acknowledgements
This work was supported in part by NSF under grant CBET-1150670 and by
Clemson University through an SGER (Small Grants for Exploratory Research) grant.
Supporting Information. Movies (at both the T-junction and outlet of the microchannel)
for the shape-based particle separation in water and 1000 ppm PEO solution, respectively.
References
(1) Jadhao, V.; Thomas, C. K.; de la Cruza, M. O. Porc. Natl. Acad. Sci. USA 2014,
111, 12673-12678.
(2) Bauman, R. W. Microbiology: With Diseases by Body System. Chapters 4 and 11,
Benjamin Cummings, 4 edition, 2014.
(3) Champion, J. A.; Mitragotri, S. Proc. Natl. Acad. Sci. 2006, 103, 4930-4934.
(4) Martin, S. Cell Cycle 2009, 8, 3643-3647.
(5) Ebert, E. C.; Nagar, M.; Hagspiel, K. D. Clinc. Gastroenterol. Hepatol. 2010, 8,
483-489.
(6) Anstey, N. M.; Russell, B.; Yeo, T. W.; Price, R. N. Trend. Parasitol. 2009, 25,
220-227.
(7) Lenshof, A.; Laurell, T. Chem. Soc. Rev. 2010, 39, 1203-1217.
(8) Plouffe, B. D.; Murthy, S. K. Anal. Chem. 2014, 86, 11481-11488.
(9) Shields IV, C. W.; Reyes, C. D.; Lopez, G. P. Lab Chip, 2015, 15, 1230-1249.

161
(10) Gossett, D. R.; Weaver, W. M.; Mach, A. J.; Hur, S. C.; Tse, H. T.; Lee, W.;
Amini, H.; Di Carlo, D. Anal. Bioanal. Chem. 2010, 397, 3249-3267.
(11) Sugaya, S.; Yamada, M.; Seki, M. Biomicrofluid. 2011, 5, 24103.
(12) Yamada, M; Seki, M. Anal. Chem. 2006, 78, 1357-1362.
(13) Valero, A.; Braschler, T.; Rauch, A.; Demierre, N.; Barral, Y.; Renaud, P. Lab
Chip 2011, 11, 1754-60.
(14) Beech, J. P.; Holm, S. H.; Adolfsson, K.; Tegenfeldt, J. O. Lab Chip 2012, 12,
1048-1051.
(15) Green, J. V.; Radisic, M.; Murthy, S. K. Anal. Chem. 2009, 81, 9178-9182.
(16) Zeming, K. K.; Ranjan, S.; Zhang, Y. Nat. Communicat. 2013, 4, article number
1625, doi:10.1038/ncomms2653.
(17) Masaeli, M.; Sollier, E.; Amini, H.; Mao, W.; Camacho, K.; Doshi, N.; Mitragotri,
S.; Alexeev, A.; Di Carlo, D. Phys. Rev. X 2012, 2, 031017.
(18) Hur, S. C.; Choi, S. E.; Kwon, S.; Di Carlo, D. Appl. Phys. Lett. 2011, 99, 044101.
(19) Zhu, J.; Tzeng, T. J.; Xuan, X. Electrophoresis 2010, 31, 1382-1388.
(20) Zhu, J.; Xuan, X. Biomicrofluid. 2011, 5, 024111.
(21) DuBose, J.; Zhu, J.; Patel, S.; Lu, X.; Tupper, N.; Stonaker, J. M.; Xuan, X. J.
Micromech. Microeng. 2014, 24, 115018.
(22) DuBose, J.; Lu, X.; Patel, S.; Qian, S.; Joo, S. W.; Xuan, X. Biomicrofluid. 2014,
8, 014101.
(23) Voldman, J. Annu. Rev. Biomed. Eng. 2006, 8, 425-454.
(24) Nam, J.; Lim, H.; Kim, D.; Jung, H.; Shin, S. Lab Chip 2012, 12, 1347-1354.

162
(25) Kang, K.; Lee, S. S.; Hyun, K.; Lee, S. J.; Kim, J. M. Nat. Comm. 2013, 4, Article
number: 2567. doi:10.1038/ncomms3567.
(26) Lu, X.; Xuan, X. Anal. Chem. 2015, 87, 6389-6396.
(27) Yamada, M.; Nakashima, M.; Seki, M. Anal. Chem. 2004, 76, 5465-5471.
(28) Mortensen, N. A. Anal. Chem. 2007, 79, 9240-9241.
(29) Rodd, L. E.; Scott, T. P.; Boger, D. V.; Cooper-White, J. J.; McKinley, G. H. J.
Non-Newtonian Fluid Mech. 2005, 129, 1-22.
(30) Maples, R. E. Petroleum Refinery Process Economics, 1993, Pennwell,
Publishing, Tulsa.
(31) Graessley, W. W. Polymer 1980, 21, 258–262.
(32) Tirtaatmadja, V.; Mckinley, G. H.; Cooper-White, J. J. Phys. Fluid. 2006, 19,
043101.
(33) Rubinstein, M.; Colby, R. H. Polymer Physics 2003, Oxford University Press Inc.
(34) Rodd, L. E.; Cooper-White, J. J.; Boger, D. V.; McKinley, G. H. J. Non-
Newtonian Fluid Mech. 2007, 143, 170-191.
(35) Rodd, L. E.; Lee, D.; Ahn, K. H.; Cooper-White, J. J. J. Non-Newton. Fluid Mech.
2010, 165, 1189-1203.
(36) Yang, S. Y.; Kim, J. Y.; Lee, S. J.; Lee, S. S.; Kim, J. M. Lab Chip 2011, 11, 266-
273.
(37) Kim, J. Y.; Ahn, S. W.; Lee, S. S.; Kim, J. M. Lab Chip 2012, 12, 2807-2814.
(38) Lu, X.; Patel, S.; Zhang, M.; Joo, S.; Qian, S.; Ogale, A.; Xuan, X. Biomicrofluid.
2014, 8, 021802.

163
(39) Liu, C.; Xue, C.; Chen, X.; Shan, L.; Tian, Y.; Hu, G. Anal. Chem. 2015, 87,
6041-6048.
(40) Jeffery, G. B. Proc. R. Soc. A 1922, 102, 161-179.
(41) Bartram, E.; Goldsmith, H. L.; Mason, S. G. Rheol. Acta 1975, 14, 776-782.
(42) Happel, J.; Brenner, H. Low Reynolds Number Hydrodynamics, Noordhoff
International Publishing, Leyden, Netherlands, 1973.
(43) Amini, H.; Lee, W.; Di Carlo, D. Lab Chip 2014, 14, 2739-2761.
(44) Martel, J. M.; Toner, M. Annu. Rev. Biomed. Eng. 2014, 16, 371-396.
(45) Giudice, F. D.; Romeo, G.; D’Avino, G.; Greco, F.; Netti, P. A.; Maffettone, P. L.
Lab Chip 2013, 13, 4263-4271.
(46) Zhou, J.; Papautsky, I. Lab Chip 2013, 13, 1121-1132.
(47) Liu, C.; Hu, G.; Jiang, X.; Sun, J. Lab Chip 2015, 15, 1168-1177.
(48) Lu, X.; Xuan, X. Anal. Chem. 2015, 87, 4560-4565.
164
CHAPTER EIGHT
CONTINUOUS SHETH-FREE SEPARATION OF PARTICLES BY SHAPE IN
VISCOELASTIC FLUIDS
Abstract
Shape is an important indicator of cell type, cycle and state etc., and can thus
serve as a specific marker for label-free bioparticle separation. We demonstrate in this
work a shape-based separation of equal-volumed spherical and peanut particles in
viscoelastic fluids through straight rectangular microchannels. This continuous sheath-
free separation arises from the shape-dependent equilibrium particle position(s) as a
result of the flow-induced elasto-inertial lift and shear thinning effects. A continuous
transition from single to dual and to triple equilibrium positions is observed for both
types of particles with the increase of flow rate. However, the flow rate at which the
transition takes place differs with the particle shape. This phenomenon occurs only in
microchannels with a large aspect ratio (width/height) and has not been reported before.
It is speculated to correlate with the dissimilar dependences of elastic and inertial lift
forces on particle size and flow rate as well as the rotational effects of non-spherical
particles.
8.1 Introduction
Shape is an important indicator of cell type,1 cycle
2 and state
3 etc. It provides
useful information in, for example, bioparticle identification,4 cell synchronization
5 and
165
disease diagnostics6 etc. Therefore, shape can be a specific marker for label-free
bioparticle separation. It may also serve as a new intrinsic marker for fractionation of
synthetic micro/nanoparticles with immense potential applications to both academics and
industry. However, most of current microfluidic techniques have been developed to
separate particles by size.7-10
Only recently has shape-based particle separation been
investigated in a few studies. It can be implemented through hydrodynamic filtration11
in
a complex network of microchannels12
or through deterministic lateral displacement in
high-resolution arrays of posts.13,14
It has also been demonstrated by the use of
dielectrophoresis that can be either electrode-5 or insulator-based.
15,16 The throughput of
this electrical method is, however, very low with the Reynolds number (𝑅𝑒 = 𝜌𝑉𝐷ℎ 𝜂⁄
where is the fluid density, V is the average fluid velocity, 𝐷ℎ is the hydraulic diameter,
and is the fluid viscosity) smaller than 0.1. In contrast, differential inertial focusing17
can separate particles by shape at a high throughput where the Reynolds number must be
over 10.18
Very recently our group has demonstrated a continuous separation of equal-
volumed spherical and peanut-shaped particles19
via a method we termed elasto-inertial
pinched flow fractionation (eiPFF).20
This method exploits the shape-dependent elasto-
inertial lift force in viscoelastic fluids to increase the particle displacement for a high-
purity separation at the Reynolds number of order 1. However, a sheath fluid is required
to pre-focus the particle mixture which complicates the flow control and dilutes the
separated particles. We demonstrate in this work that the flow-induced elasto-inertial
lift21
can direct particles towards shape-dependent equilibrium positions in straight

166
rectangular microchannels for a continuous sheath-free separation at the Reynolds
number of order 1. Such a cross-stream particle migration in viscoelastic fluids22-26
has
been recently demonstrated to focus,27-38
filtrate39,40
and separate (by size41-45
and
deformability46
) particles in microchannels.
8.2 Experiment
We used 4.18 µm-diameter spherical (green fluorescent, Bangs Laboratories, Inc.)
and 3.5 µm-diameter/6 µm-length peanut-shaped (plain, Magsphere, Inc.) polystyrene
particles to demonstrate the shape-based separation. The peanuts particles have a
calculated total volume of 39.84 µm3, which corresponds to an equivalent spherical
diameter of 4.23 µm. The original aqueous suspensions of spherical (1% solid) and
peanut-shaped (10% solid) particles were first mixed at a 10:1 ratio and then re-
suspended in a polyethylene oxide (PEO) solution to a final concentration of 106
particles/mL. Three concentrations of PEO solutions, 500 ppm, 1000 ppm and 2000 ppm,
were prepared by dissolving PEO powder (Sigma-Aldrich USA, molecular weight 2106
Da) in water. The particle mixture was also re-suspended in water for a control
experiment. A small amount of Tween 20 (0.5% v/v, Fisher Scientific) was added to each
prepared particle suspension for the purpose of reducing particle aggregations and
adhesions (to channel walls). The rheological properties of the PEO solutions are
summarized in Table 1. The process for determining their relaxation times are provided
in the Supplementary Information (Appendix C).47
Table 1. Rheological properties of the prepared PEO solutions.

167
Properties (at 20 °C) PEO solution (c, ppm)
500 1000 2000
Zero-shear viscosity 𝜂 (mPa∙s) 1.8 2.3 4.1
Overlap concentration c* (ppm) 858 858 858
Concentration ratio c/c* 0.58 1.17 2.33
Zimm relaxation time, Zimm (ms) 0.34 0.34 0.34
Effective relaxation time, e (ms) 4.3 6.8 10.6
Four depths of 2 cm long and 50 µm wide straight rectangular microchannels are
used in our experiments, which are 15, 25, 40 and 100 µm, respectively. They were
fabricated with polydimethylsiloxane (PDMS) by the standard soft lithography
method.20,48
At the end of each channel, a 2 mm long and 900 µm wide expansion was
designed to enhance the particle separation and facilitate the visualization. The particle
suspension was driven through the microchannel by an infusion syringe pump (KDS-100,
KD Scientific). Particle motion was recorded through an inverted microscope (Nikon
Eclipse TE2000U, Nikon Instruments) with a CCD camera (Nikon DS-Qi1Mc) at a rate
of 15 frames/s. Fluorescent and bright-field lights were used simultaneously to identify
fluorescent spherical (appear bright) and plain peanut (appear dark) particles. Images
were post-processed in Nikon Imaging Software (NIS-Elements AR 3.22). Superimposed
images of fluorescent and plain particles were obtained by stacking a sequence of
snapshot images (around 800) with the maximum and minimum intensity projections,
respectively. The function of Particle Analysis in ImageJ software package (National
Institute of Health) was used to measure the transverse particle positions at the channel
outlet (i.e., the channel expansion), which were then used to calculate the probability
distribution function (PDF) for each type of particles.

168
8.3 Results and discussion
Fig. 1 shows the shape-based separation of plain peanut and fluorescent spherical
particles in 1000 ppm PEO solution through a 25 µm deep microchannel at a flow rate of
150 µL/h. The two types of particles are uniformly dispersed at the channel inlet in Fig.
1(a1) (Multimedia view), but split to dissimilar streams at the outlet in Fig. 1(a2)
(Multimedia view). As viewed from the two superimposed images in Fig. 1(b1,b2),
spherical particles are focused to a single band along the channel centerline while peanut
particles migrate to two equilibrium positions that are each one quarter of the channel
width away from the centerline. Such a continuous shape-based separation can be
evaluated by the plot of particle PDF in Fig. 1(c), where over 1500 particles are counted
for each type. The separation efficiency (defined as the particle percentage at a preferred
outlet) is 95.2% and 95.1% for spherical and peanut particles inside and outside the
region with an off-center distance of 130 µm in the expansion, respectively. The
corresponding separation purity (defined as the ratio of the targeted to the total collected
particles at an outlet) is also greater than 95% for each type of particles.
0 0.1 0.2 0.3
-450-350-250-150-5050
150250350450
Off
-cen
ter
dis
tan
ce (
µm
)
SpheresPeanuts
Peanuts Spheres
(a1) (a2)
(b1) (b2)
(c)
Wi = 9.1
Re = 0.48200 µm
(d)

169
FIG. 1. Demonstration of shape-based separation of plain peanut (dark) and fluorescent
spherical (bright) particles in 1000 ppm PEO solution through a 50 µm wide and 25 µm
deep straight rectangular microchannel at a flow rate of 150 µL/h: (a1) and (a2) snapshot
images at the channel inlet (Multimedia view) and outlet (Multimedia view),
respectively, where the broken-line ellipses highlight the separated spherical and peanut
particles; (b1) and (b2) superimposed images of peanut and spherical particles at the
channel outlet, where the two dashed boxes highlight the regions to be used as cropped
images in Figs. 2-4; (c) the plot of particle PDF at the channel outlet; (d) Force analysis
of elastic lift, 𝐅𝑒𝐿, wall-induced inertial lift, 𝐅𝑖𝐿_𝑤, and shear gradient-induced inertial lift,
𝐅𝑖𝐿_𝑠, on a particle in a viscoelastic fluid flow through a rectangular microchannel, where
the background color shows the contour of fluid shear rate (the darker the larger). The
flow direction is from left to right in (a1,a2,b1,b2).
We have also done a control experiment of the same peanut and spherical
particles in water under identical conditions (see Fig. S1 in the Supplementary
Information47
). Neither type of particles experiences a significant inertial focusing
because of the small Reynolds number (𝑅𝑒 = 2𝜌𝑄 𝜂(𝑤 + ℎ)⁄ = 1.11 where Q is the
flow rate, w and h are the channel width and height),49-51
and hence no inertial separation
is observed. The Reynolds number is even smaller in the PEO solution [𝑅𝑒 = 0.48 as
labeled in Fig. 1(a1)] due to the increased viscosity. Therefore, our recently demonstrated
shape-dependence of the elastic lift,19
𝐅𝑒𝐿, is the primary reason for the observed particle
separation in Fig. 1. As seen from the schematic in Fig. 1(d), 𝐅𝑒𝐿 directs particles towards
the low-shear-rate regions, i.e., the centerline and four corners of a rectangular
channel21,29,52
, and is characterized by the Weissenberg number ( 𝑊𝑖 = 𝜆𝑒�̇� =
2𝜆𝑒𝑄 𝑤2ℎ⁄ = 9.1 where 𝜆𝑒 is the effective relaxation time in Table 1 and �̇� is the fluid
shear rate). This force competes with the shear gradient-induced inertial lift, 𝐅𝑖𝐿_𝑠, and the
wall-induced inertial lift, 𝐅𝑖𝐿_𝑤 , which direct a particle to the chanter wall and center,
respectively, as illustrated in Fig. 1(d). The elastic and inertial lift forces are each a
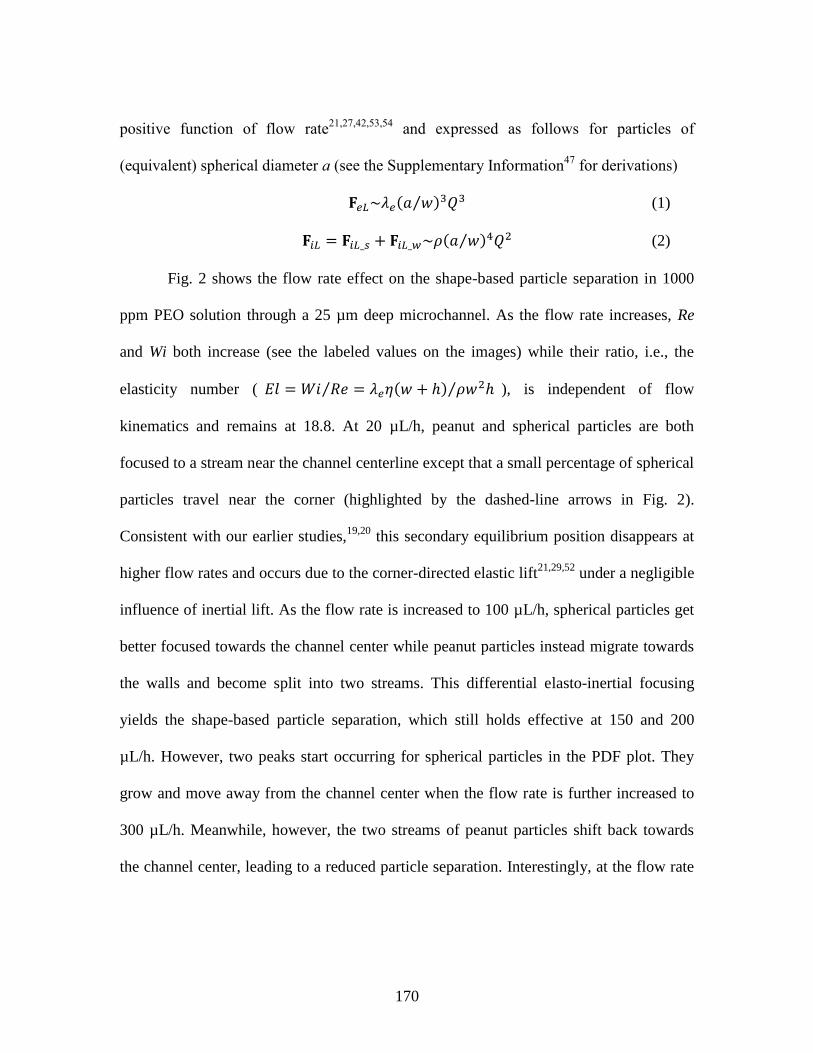
170
positive function of flow rate21,27,42,53,54
and expressed as follows for particles of
(equivalent) spherical diameter a (see the Supplementary Information47
for derivations)
𝐅𝑒𝐿~𝜆𝑒(𝑎 𝑤⁄ )3𝑄3 (1)
𝐅𝑖𝐿 = 𝐅𝑖𝐿_𝑠 + 𝐅𝑖𝐿_𝑤~𝜌(𝑎 𝑤⁄ )4𝑄2 (2)
Fig. 2 shows the flow rate effect on the shape-based particle separation in 1000
ppm PEO solution through a 25 µm deep microchannel. As the flow rate increases, Re
and Wi both increase (see the labeled values on the images) while their ratio, i.e., the
elasticity number ( 𝐸𝑙 = 𝑊𝑖 𝑅𝑒⁄ = 𝜆𝑒𝜂(𝑤 + ℎ) 𝜌𝑤2ℎ⁄ ), is independent of flow
kinematics and remains at 18.8. At 20 µL/h, peanut and spherical particles are both
focused to a stream near the channel centerline except that a small percentage of spherical
particles travel near the corner (highlighted by the dashed-line arrows in Fig. 2).
Consistent with our earlier studies,19,20
this secondary equilibrium position disappears at
higher flow rates and occurs due to the corner-directed elastic lift21,29,52
under a negligible
influence of inertial lift. As the flow rate is increased to 100 µL/h, spherical particles get
better focused towards the channel center while peanut particles instead migrate towards
the walls and become split into two streams. This differential elasto-inertial focusing
yields the shape-based particle separation, which still holds effective at 150 and 200
µL/h. However, two peaks start occurring for spherical particles in the PDF plot. They
grow and move away from the channel center when the flow rate is further increased to
300 µL/h. Meanwhile, however, the two streams of peanut particles shift back towards
the channel center, leading to a reduced particle separation. Interestingly, at the flow rate

171
of 300 µL/h (and higher) where Re is about 1, an additional equilibrium position appears
for each type of particles which eventually breaks down this shape-based separation..
FIG. 2. Flow rate effect (in terms of the Reynolds number, Re, and Weissenberg number,
Wi) on shape-based separation of plain peanut (dark) and fluorescent spherical (bright)
particles in 1000 ppm PEO solution through a 50 µm wide and 25 µm deep straight
rectangular microchannel: (top row) cropped superimposed particle images at the channel
outlet [highlighted by the dashed-line boxes in Fig. 1(b1,b2)]); (bottom row) plots of
particle PDF at the channel outlet. The dashed-line arrows highlight a secondary
equilibrium position for spherical particles near the channel corner at a flow rate of 20
µL/h.
A similar trend can be identified from Fig. 2 for the elasto-inertial focusing
between peanut and spherical particles. With the increase of flow rate (or Re), each type
of particles experiences first a transition from single equilibrium position at the channel
centerline to dual equilibrium positions on the two sides of the centerline, and then to
triple equilibrium positions at both the centerline and its two sides. However, the two
0 0.2
-450
-350
-250
-150
-50
50
150
250
350
450
0 0.2 0 0.2 0 0.2 0 0.2 0 0.2 0 0.2
Spheres
Peanuts
50 ul/h 100 ul/h 150 ul/h 200 ul/h 300 ul/h 400 ul/h
Re = 0.16
Wi = 3.0
Re = 0.32
Wi = 6.0
Re = 0.48
Wi = 9.1
Re = 0.64
Wi = 12.1
Re = 0.96
Wi = 18.1
Re = 1.29
Wi = 24.2
20 ul/h
Re = 0.06
Wi = 1.2
200 µm
El
= 1
8.8

172
transitions for peanut particles both take place at smaller flow rates than for spherical
particles, which yields the shape-based separation demonstrated in Fig. 1 and Fig. 2. The
exact mechanism behind this phenomenon is currently unclear, which is speculated to
correlate with the rotational effects of peanut particles. As demonstrated in our earlier
study,19
the preferentially parallel orientation of peanut particles to the flow direction
renders the elastic and inertial lift forces more dependent on their shorter dimension (i.e.,
3.5 µm), smaller than the diameter of spherical particles (i.e., 4.18 µm). Hence, the
dissimilar dependences of 𝐅𝑒𝐿 in Eq. (1) and 𝐅𝑖𝐿 in Eq. (2) on particle size and flow rate
may lead to the observed phenomenon in Fig. 2.
Fig. 3 shows the PEO concentration effect (in terms of the elasticity number, El)
on the shape-based particle separation in a 25 µm deep microchannel under a fixed flow
rate of 150 µL/h. Due to the increased viscosity, Re decreases (from 0.62 to 0.48 and 0.27
for 500, 1000 and 2000 ppm) at higher PEO concentrations indicating a weakened inertial
lift. In contrast, Wi increases due to the extended relaxation time at higher PEO
concentrations. The separation is barely visible in 500 ppm PEO because both peanut and
spherical particles are still at the state of single equilibrium position along the channel
centerline. It is significantly improved in 1000 ppm PEO due to the enhanced elasto-
inertial particle focusing, a consequence of the increased elastic lift and the decreased
inertial lift. In 2000 ppm PEO, spherical particles experience an improved focusing
towards the single equilibrium position along the channel centerline. However, since the
two equilibrium positions of peanut particles both shift towards the centerline, the
separation gets diminished in 2000 ppm PEO.
173
FIG. 3. PEO concentration effect (in terms of the elasticity number, El) on shape-based
separation of plain peanut (dark) and fluorescent spherical (bright) particles in a 50 µm
wide and 25 µm deep straight rectangular microchannel under a flow rate of 150 µL/h:
the left and right halves of each panel show the cropped superimposed particle images
and the corresponding PDF plots at the channel outlet, respectively.
We have also studied the flow rate effect on the shape-based particle separation in
500 ppm and 2000 ppm PEO solutions (see Fig. S2 in the Supplementary Information47
).
Similar to that in Fig. 2, a continuous transition from single to dual and to triple
equilibrium positions is found in both PEO concentrations for peanut and spherical
particles. Moreover, the two transitions for peanut particles still happen ahead of
spherical ones with the increase of low rate. However, the flow rates at which the
transitions take place depend on the PEO concentration due to its effect on 𝐅𝑒𝐿 in Eq. (1)
via the relaxation time, 𝜆𝑒 . This phenomenon is also believed to be related to the
enhanced shear thinning effects at higher PEO concentrations, which has been
demonstrated in earlier works25,26,33,44
to direct particles away from the channel
centerline. The best separation in 500 ppm and 2000 ppm PEO (see Fig. S2 in the
Supplementary Information47
) takes place at 200-300 µL/h and 100-150 µL/h,
respectively, which seem consistent with the flow rate of 150-200 µL/h in 1000 ppm PEO
0 0.2 0.4
SpheresPeanuts
0 0.2 0.4 0 0.2 0.4
500 ppm 1000 ppm 2000 ppm
200 µm
El = 9.3 El = 18.8 El = 52.3PDF

174
(see Fig. 2). Among these three PEO concentrations, 1000 ppm is found to offer the best
separation performance in terms of particle PDF.
FIG. 4. Channel aspect ratio (AR) effect on shape-based separation of plain peanut (dark)
and fluorescent spherical (bright) particles in 50 µm wide straight rectangular
microchannels under a flow rate of 150 µL/h. The left and right halves of each panel
show the cropped superimposed particle images and the corresponding PDF plots at the
channel outlet.
Fig. 4 shows the effect of channel aspect ratio, 𝐴𝑅 = 𝑤/ℎ, on the shape-based
particle separation in 1000 ppm PEO solution through microchannels of 40 µm (AR =
1.25), 25 µm (AR = 2.0) and 15 µm (AR = 3.3) deep, respectively. Under a constant flow
rate of 150 µL/h, a larger AR corresponds to an increased Re and Wi. In the nearly square
microchannel with AR = 1.25 (left panel in Fig. 4), peanut and spherical particles are each
focused towards the channel centerline. This single equilibrium particle position remains
unvaried with the increase of flow rate (up to 1 mL/h), which seems to be consistent with
previous studies in square microchannels (AR = 1.0).34,39,42,44
Since no transition to dual
equilibrium positions is observed (see Fig. S3 in the Supplementary Information47
),
shape-based particle separation is unavailable in a nearly square microchannel. This is
also true in a 100 µm deep channel with a low AR (= 0.5, data not shown). In the 15 µm
0 0.2
Spheres
Peanuts
0 0.20 0.2
AR = 3.3AR = 2.0AR = 1.25
Re = 0.56
Wi = 15.1
Re = 0.40
Wi = 5.67
Re = 0.48
Wi = 9.07
200 µm
175
deep microchannel with a high AR (= 3.3, see the right panel in Fig. 4), peanut particles
are focused to three equilibrium positions under a flow rate of 150 µL/h while spherical
particles have only two equilibrium positions. In this high AR microchannel, a transition
from single to dual and to triple equilibrium positions still exists for both types of
particles (see Fig. S4 in the Supplementary Information47
). Moreover, as the transition for
peanut particles also happens at a smaller flow rate than for spherical particles, the best
separation happens at a flow rate of 50-100 µL/h, which is only one half of that in the 25
µm deep microchannel with AR = 2.0.
8.4 Conclusions
In summary, we have demonstrated a continuous sheath-free separation of
spherical and peanut-shaped rigid particles of equal volume via the elasto-inertial
focusing effect in straight rectangular microchannels. This separation exploits the gap
between the flow rates at which the two types of particles switch from single to dual
equilibrium positions, respectively. It can only take place in large aspect-ratio
microchannels, which is AR 2 in our tests, because both types of particles migrate
towards the single equilibrium position at the centerline of microchannels with an
intermediate or low AR. The separation is also found to be strongly dependent on PEO
concentration because of its influence on the elastic (via the fluid relaxation time) and
inertial (via the fluid viscosity) lifts as well as the shear thinning effects. If necessary, the
PEO polymer can be removed by rinsing the separated particle suspension with water or
other buffer solutions via centrifugation. Future work will be on the theoretical

176
understanding and numerical prediction of shape-based particle separation in viscoelastic
fluids. Moreover, the effects of other experimental parameters such as channel length and
polymer type [e.g., polyvinylpyrrolidone (PVP)39,46
and polyacrylamide (PAA)27,43
] will
be investigated. In addition, we are developing an apparatus to fabricate spheroidal
particles of various aspect ratios using the protocol reported earlier18
for further tests of
shape-based particle separation in viscoelastic fluids.
This work was partially supported by NSF under grant CBET-1150670.
References
1 S. Mitragotri, and J. Lahann, Nature Mater. 8, 15 (2009).
2 S. Martin, Cell Cycle 8, 3463-3647 (2009).
3 E. C. Ebert, M. Nagar, and K. D. Hagspiel, Clin. Gastroenterol. Hepatol. 8, 483-489
(2010).
4 J. Janca, V. Halabalova, and J. Rzicka, J. Chromatograph. A 1217, 8062-8071 (2010).
5 A. Valero, T. Braschler, A. Rauch, N. Demierre, Y. Barral, and P. Renaud, Lab Chip
11, 1754-60 (2011).
6 N. M. Anstey, B. Russell, T. W. Yeo, and R. N. Price, Trend. Parasitol. 25, 220-227
(2009).
7 A. Karimi, S. Yazai, and A.M. Ardekani, Biomicrofluid. 7, 021501 (2013).
8 P. Sajeesh, and A. K. Sen, Microfluid. Nanofluid. 17, 1-52 (2014).
9 Z. T. Yu, K. M. Yong, J. Fu, Small 10, 1687-1703 (2014).

177
10 C. W. Shields IV, C. D. Reyes, and G. P. Lopez, Lab Chip 15, 1230-1249 (2015).
11 Yamada, M; Seki, M. Anal. Chem. 78, 1357-1362 (2006).
12 S. Sugaya, M. Yamada, and M. Seki, Biomicrofluid. 5, 24103 (2011).
13 J. P. Beech, S. H. Holm, K. Adolfsson, and J. O. Tegenfeldt, Lab Chip 12, 1048-1051
(2012).
14 K. K. Zeming, S. Ranjan, and Y. Zhang, Nat. Communicat. 4, article number 1625,
doi:10.1038/ncomms2653 (2013).
15 Y. Song, J. Yang, X. Shi, H. Jiang, Y. Wu, R. Peng, Q. Wang, N. Gong, X. Pan, Y. Sun,
and d. Li, Sci. China, 55, 524-530 (2012).
16 J. DuBose, X. Lu, X., S. Patel, S. Qian, S. W. Joo, and X. Xuan, Biomicrofluid. 8,
014101 (2014).
17 S. C. Hur, S. E. Choi, S. Kwon, and D. Di Carlo, Appl. Phys. Lett. 99, 044101 (2011).
18 M. Masaeli, E. Sollier, H. Amini, W. Mao, K. Camacho, N. Doshi, S. Mitragotri, A.
Alexeev, and D. Di Carlo, Phys. Rev. X 2, 031017 (2012).
19 X. Lu, and X. Xuan, Anal. Chem. 87, 11523–11530 (2015).
20 X. Lu, and X. Xuan, X. Anal. Chem. 87, 6389-6396 (2015).
21 G. D’Avino, and P. L. Maffettone, J. Non-Newton. Fluid Mech. 215, 80-104 (2015).
22 A. Karnis, H. L. Goldsmith, and S. G. Mason, S. G., Nature 200, 159-160 (1963).
23 B. P. Ho, and L. G. Leal, J. Fluid Mech. 76, 783-799 (1976).
24 G. Leal, J. Non-Newton. Fluid Mech. 5, 33-78 (1979).
25 P. Y. Huang, J. Feng, H. H. Hu, and D. D. Joseph, J. Fluid Mech. 343, 73-94 (1997).
26 P. Y. Huang, and D. D. Joseph, J. Non-Newtonian Fluid Mech. 90, 159-185 (2000).

178
27 A. M. Leshansky, A. Bransky, N. Korin, and U. Dinnar, Phys. Rev. Lett. 98, 234501
(2007).
28 G. D’Avino, G. Romeo, M. Villone, F. Greco, F., P. A. Netti, and P. L. Maffettone, Lab
Chip 12, 1638-1645 (2012).
29 J. Y. Kim, S. W. Ahn, S. S. Lee, and J. M. Kim, Lab Chip 12, 2807-2814 (2012).
30 S. Cha, T. Shin, S. S. Lee, W. Shim, G. Lee, S. J. Lee, Y. Kim, and J. M. Kim, Anal.
Chem. 84, 10471-10477 (2012).
31 D. L. Lee, H. Brenner, J. R. Youn, and Y. S. Song, Sci. Rep. 3, article number 3258
(2013).
32 F. D. Giudice, G. Romeo, G. D’Avino, F. Greco, P. A. Netti, and P. L. Maffettone, Lab
Chip 13, 4263-4271 (2013).
33 K. W. Seo, H. J. Byeon, H. K. Huh, and S. J. Lee, RSC Adv. 4, 3512-3520 (2014).
34 E. J. Lim, T. Ober, J. F. Edd, S. P. Desai, D. Neal, K. W. Bong, P. S. Doyle, G. H.
McKinley, and M. Toner, Nat. Comm. 5, Article number: 4120 (2014).
35 S. Cha, K., Kang, J. B. You, S. G. Im, Y. Kim, and J. M. Kim, Rehol. Acta 53, 927-933
(2014).
36 K. W. Seo, Y. R. Ha, and S. J. Lee, Appl. Phys. Lett. 104, 213702 (2014).
37 F. D. Giudice, G. D’Avino, F. Greco, P. A. Netti, and P. L. Maffettone, Microfluid.
Nanofluid. 19, 95-104 (2015).
38 D. Yuan, J. Zhang, S. Yan, C. Pan, G. Alici, N. T. Nguyen, and W. H. Li,
Biomicrofluid. 9, 044108 (2015).

179
39 S. Y. Yang, J. Y. Kim, S. J. Lee, S. S. Lee, and J. M. Kim, Lab Chip 11, 266-273
(2011).
40 S. W. Ahn, S. S. Lee, S. J. Lee, and J. M. Kim, Chem. Eng. Sci. 126, 237-243 (2015).
41 J. Nam, H. Lim, D. Kim, H. Jung, and S. Shin, Lab Chip 12, 1347-1354 (2012).
42 K. Kang, S. S. Lee, K. Hyun, S. J. Lee, and J. M. Kim, Nat. Comm. 4, Article number:
2567 (2013).
43 H. Lim, J. Nam, and S. Shin, Microfluid. Nanofluid. 17, 683-692 (2014).
44 C. Liu, C. Xue, X. Chen, L. Shan, Y. Tian, and G. Hu, Anal. Chem. 87, 6041–6048
(2015).
45 J. Nam, B. Namgung, C. T. Lim, J. Bae, H. L. Leo, K. S. Cho, and S. Kim, J.
Chromatography A 1406, 244-250 (2015).
46 S. Yang, S. S. Lee, S. W. Ahn, K. Kang, W. Shim, G. Lee, K. Hyune, and J. M. Kim,
Soft Matt. 8, 5011-5019 (2012).
47 See supplementary material at [URL will be inserted by AIP] for the determination of
PEO solution properties, control experiment of shape-based particle separation in water,
derivation of Eqs. (1) and (2), and flow rate effects on shape-based particle separation in
different PEO solutions through microchannels of different aspect ratios.
48 X. Lu, S. Patel, M. Zhang, S. Joo, S. Qian, A. Ogale, and X. Xuan, Biomicrofluid. 8,
021802 (2014).
49 H. Amini, W. Lee, and D. Di Carlo, Lab Chip 14, 2739-2761 (2014).
50 J. M. Martel, and M. Toner, M., Annu. Rev. Biomed. Eng. 16, 371-396 (2014).

180
51 J. Zhang, S. Yan, D. Yuan, G. Alici, N. T. Nguyen, M. E. Warkiani, and W.
Li, Lab Chip, in press. DOI: 10.1039/C5LC01159K (2015).
52 K. W. Seo, Y. J. Kang, and S. J. Lee, Phys. Fluid. 26, 063301 (2014).
53 E. S. Asmolov, J. Fluid Mech. 381, 63-87 (1999).
54 D. Di Carlo, J. F. Edd, K. J. Humphry, H. A. Stone, and M. Toner, Phys. Rev. Lett. 102,
094503 (2009).

181
CHAPTER NINE
CONCLUSIONS AND FUTURE WORK
9.1 Conclusions
This dissertation has extensively investigated the particle motions in non-
Newtonian fluids in both electric field- and pressure-driven flows through microchannels.
The first part focuses on the electrokinetic transport phenomena in viscoelastic fluids
though a constricted microchannel. An oscillatory particle motion has been observed in
the first experimental investigation of particle electrophoresis, for particles moving in the
same direction of fluid electroosmosis. Then the electrokinetic particle focusing in
viscoelastic fluids has been studied under the same experimental condition but with
particles moving against fluid electroosmosis. Particles are found to have an opposite
focusing trend to that in the Newtonian fluid with respect to electric field. The flow
visualization study of electrokinetic flow in a viscoelastic fluid has shown that the small
particle trajectories, which represent the electroosmotic flow streamlines, are
significantly different from those in the Newtonian fluid at the upstream of the
microchannel constriction. These phenomena are speculated to be a consequence of the
fluid viscoelasticity effects. The second part of this dissertation concentrates on the
particle transport in pressure driven flows through straight rectangular microchannels.
Both size- and shape-based separations have been demonstrated by both eiPFF and
sheath-free techniques in non-Newtonian fluids. These separations are found to be
significantly dependent on the dimensionless numbers, i.e., Re, Wi, El and AR. Moreover,
we have systematically studied the elasto-inertial particle focusing in straight rectangular

182
microchannels. The detailed conclusion and major contribution of each chapter in this
dissertation are listed as follows.
1. In chapter 2, an oscillatory particle motion has been observed in the experimental
investigation of particle electrophoresis in viscoelastic PEO solutions through a
microchannel constriction. In distinct contrast with that in a Newtonian fluid, an
oscillatory particle motion is observed in the constriction region. Such a stream-
wise particle oscillation continues and remains inside the constriction until a
sufficient number of particles are attached to form a chain for them to escape.
This oscillatory motion is affected by the electric field magnitude, particle size
and PEO concentration. We speculate that the particle oscillation arises from the
competition of the viscoelastic force induced in the constriction and the
electrokinetic force.
2. In chapter 3, the effects of particle charge on the electrokinetic motion of particles
in viscoelastic fluids have been studied under the same experimental conditions as
in chapter 2. While particles moving along with the fluid exhibit the bouncing
phenomenon, particles that move against the fluid get focused when passing the
microchannel constriction. However, this electrokinetic focusing is found to
decrease with the increase of the applied DC electric field, which is different from
the focusing trend in Newtonian fluids. In addition, particle aggregations are
formed inside the constriction at high electric fields. They can then either move
forward and exit the constriction in an explosive manner or roll back to the
constriction entrance for further accumulations. These observed phenomena are

183
speculated to be a consequence of the fluid viscoelastic effects. We conclude that
the constriction-induced DEP is not a good option for electrokinetic focusing of
particles suspended in non-Newtonian fluids.
3. In chapter 4, we have conducted the flow visualization study of electrokinetic
flow in viscoelastic fluids as inspired by the electrokinetic particle motions. The
particle trajectories which represent the flow streamlines are found to be deflected
and asymmetric near the constriction entrance at the upstream in the viscoelastic
fluid. The perturbation of particle trajectories grows with the electric field, and
extends towards upstream at high electric fields. The numerical result of Oldroyd-
B model obtains a smaller flow rate than that of the Newtonian one.
4. In chapter 5, a systematic experimental study has been conducted for continuous
particle separation in PEO solutions via eiPFF. It is found that eiPFF offers a
much higher particle throughput and a much better separation resolution than the
traditional PFF. Two new phenomena have been observed: one is that the particle
focusing and separation via eiPFF do not increase monotonically with El; and the
other is that the channel aspect ratio strongly affects the particle separation. We
have also found that the elasto-inertial deflection of small particles can be even
greater than that of large ones in a high-AR channel when Re is less than 1.
5. In chapter 6, we have comprehensively studied the elasto-inertial particle focusing
through straight rectangular microchannels in terms of various parameters.
Multiple equilibrium particle positions are observed, which are affected by the
particle size, flow rate, channel aspect ratio and polymer solution type. In addition,
184
an interesting trend has been found that the particle size (blockage ratio) plays a
less important role on the equilibrium position with the increasing channel aspect
ratio. A size-based particle separation has also been achieved without a sheath
flow focusing. Further experiments in PAA solutions of varied glycerol
concentrations in a near-slit channel have demonstrated that the shear-thinning
effect inhibits the elastic lift and deflects particles away from the center. The 2D
numerical studies of the particle motion via Oldroyd-B and Giesekus models are
qualitatively consistent with our experimental observations of the viscoelastic and
shear thinning effects on the elasto-inertial particle focusing.
6. In chapter 7, we have achieved a continuous separation of spherical and peanut-
shaped rigid particles of equal volume as inspired by the size-based separation via
the eiPFF technique. This separation arises from the shape-dependent elasto-
inertial lift induced particle migration in viscoelastic fluids, which is speculated to
correlate with the particle rotation effects. It is found that the separation is
strongly affected by the flow rate, fluid elasticity, and channel aspect ratio.
Interestingly, the elasto-inertial deflection of the peanut particles can be either
greater or smaller than that of equally-volumed spherical particles.
7. In chapter 8, we have demonstrated a continuous sheath-free shape-based
separation via the elasto-inertial focusing effect in straight rectangular
microchannels. This separation can only take place in large aspect-ratio
microchannels, which is AR 2 in our tests, because both types of particles
migrate towards the single equilibrium position at the centerline of microchannels
185
with an intermediate or low AR. The separation is also strongly dependent on PEO
concentration because of its influence on the elastic and inertial lift forces.
9.2 Future work
In the first part, the electrokinetic transport phenomena have been studied in
viscoelastic fluids though a constricted microchannel. In future work we will continue the
parametric study to find out how other critical factors, such as channel aspect ratio and
constriction ratio, affect the flow and particle transport. These will help us getting closer
to the mechanisms of the phenomena. Intensive future studies of numerical simulation are
required to verify and predict the experimental observations. In the second part, the
elasto-inertial particle focusing and separation have been studied in non-Newtonian
fluids. The future work can be extended to submicron particle manipulation. Meanwhile,
a 3D numerical model will be implemented to study the elasto-inertial lift and particle
equilibrium position. In addition, to further verify the hypothesis of shape-dependent
elasto-inertial lift force, we will work with ellipsoidal particles of various aspect ratios.
The numerical prediction of the shape-based particle separation in viscoelastic fluids will
also be carried out. Moreover, we will extend the experimental and numerical studies to
biological particles in body fluids.

186
APPENDICES

187
Appendix A
SUPPORTING INFORMATION FOR CONTINUOUS MICROFLUIDIC PARTICLE
SEPARATION VIA ELASTO-INERTIAL PINCHED FLOW FRACTIONATION
(eiPFF)
Determination of the fluid properties in Table 1 in the main text
The zero-shear viscosity, 𝜂0, of the glycerol/water-based PEO solutions was calculated
using the viscosity blending equation1 via the reported viscosity values of aqueous PEO
2
and glycerol3 solutions. The obtained values appear to be consistent with the
experimental data reported by Yang et al.,4 Nam et al.
5 and Rodd et al.
6,7 The overlap
concentration, c*, for PEO solutions was calculated from the expression of Graessley,
8 c
*
= 0.77/[] ppm where [] = 0.072Mw0.65
= 897 ml/g is the intrinsic viscosity given by the
Mark-Houwink relation.2 We noticed that adding glycerol into the aqueous PEO solution
had been found by Rodd et al.6 to decrease the intrinsic viscosity and hence increase the
overlap concentration. This effect was, however, estimated to be less than 10% for the
solvent we used. Therefore, the prepared non-Newtonian fluids are in the dilute (500 ppm
PEO/glycerol solution) or semi-dilute (all others) regime. They all exhibit a mild shear-
thinning effect as reported in earlier studies.4-7
The effective relaxation time of the
prepared PEO solutions was estimated from the following empirical formula,9
𝜆𝑒 = 18𝜆𝑍𝑖𝑚𝑚(𝑐/𝑐∗)0.65 (1)
where Zimm is the relaxation time predicted according to Zimm theory,10
𝜆𝑍𝑖𝑚𝑚 = 𝐹[𝜂]𝑀𝑤𝜂𝑠
𝑁𝐴𝑘𝐵𝑇 (2)

188
In the above 𝐹 = 0.463 is the pre-factor estimated from the Remann Zeta function using
a solvent quality exponent 0.55,2 𝜂𝑠 = 1.8 mPas is the solvent (i.e., 21 wt.%
glycerol/water) viscosity,3 𝑁𝐴 is the Avogadro’s constant, 𝑘𝐵 is the Boltzmann’s constant,
and T is the absolute temperature.
Clarification of eq 6 in the main text
Figure S1. Schematic explanation on how eq 6 in the main text is obtained. The symbols
𝑤𝑝 , 𝑤𝑐ℎ𝑎𝑛𝑛𝑒𝑙 and 𝑤𝑒𝑥𝑝𝑎𝑛𝑠𝑖𝑜𝑛 represent the widths of the sheath-fluid focused particle
solution, the main-branch, and the channel expansion, respectively. The symbols 𝑟𝑝1 and
𝑟𝑝2 are the radii of the two types of particles to be separated via PFF.
The particle separation in traditional PFF arises from the dissimilar center positions for
particles of different sizes in a laminar flow. 11
As seen from Figure S1, when the larger
particles of radius 𝑟𝑝1 are aligned by the sheath fluid, their center is 𝑟𝑝1 away from the
sidewall. Since the center of the smaller particles with radius 𝑟𝑝2 can at most overlap with
that of the larger ones for separation via PFF, as indicated by the dashed-dotted line in

189
Figure S1, the width of the particle solution in the main-branch (highlighted by the
background color) should be no more than 𝑟𝑝1 + 𝑟𝑝2 . This latter value is exactly the
𝑤𝑝,𝑚𝑎𝑥 in eq 6 in the main text.
References
(1) R.E. Maples, Petroleum Refinery Process Economics, 1993, Pennwell, Publishing,
Tulsa.
(2) L. E. Rodd, T. P. Scott, D. V. Boger, J. J. Cooper-White and G. H. McKinley, J.
Non-Newtonian Fluid Mech., 2005, 129, 1-22.
(3) N. S. Cheng, Indust. Eng. Chem. Res., 2008, 47, 3285-3288.
(4) S. Y. Yang, J. Y. Kim, S. J. Lee, S. S. Lee and J. M. Kim, Lab Chip, 2011, 11,
266-273.
(5) J. Nam, H. Lim, D. Kim, H. Jung and S. Shin, Lab Chip, 2012, 12, 1347-1354.
(6) L. E. Rodd, J. J. Cooper-White, D. V. Boger and G. H. McKinley, J. Non-
Newtonian Fluid Mech., 2007, 143, 170-191.
(7) L. E. Rodd, D. Lee, K. H. Ahn, and J. J. Cooper-White, J. Non-Newton. Fluid
Mech., 2010, 165, 1189-1203.
(8) W. W. Graessley, Polymer, 1980, 21, 258–262.
(9) V. Tirtaatmadja, G. H. Mckinley and J. J. Cooper-White, Phys. Fluid., 2006, 19,
043101.
(10) M. Rubinstein and R. H. Colby, Polymer Physics, 2003, Oxford University Press
Inc.

190
(11) M. Yamada, M. Nakashima and M. Seki, Anal. Chem., 2004, 76, 5465-5471.

191
Appendix B
SUPPLEMENTARY MATERIAL FOR PARTICLE FOCUSING IN VISCOELASTIC
FLUIDS THROUGH RECTANGULAR STRAIGHT MICROCHANNELS
Rheology of PEO solution
Zimm relaxation times were calculated from Zimm theory (Rubinstein and Colby 2003)
𝜆𝑍𝑖𝑚𝑚 = 𝐹[𝜂]𝑀𝑤𝜂𝑠
𝑁𝐴𝑘𝐵𝑇= 0.34𝑚𝑠
where 𝐹 = ∑ 𝑖−3𝜈 =∞𝑖=1 0.463 was estimated from Remann Zeta function using a solvent
quality exponent, ν = 0.55 (Rodd et al. 2005); the solvent viscosity 𝜂𝑠 = 1 mPas; 𝑁𝐴 is
the Avogadro’s constant; 𝑘𝐵 is the Boltzmann’s constant; the absolute temperature T =
293.15 K. The effective relaxation times of PEO solutions were estimated according to
(Tirtaatmadja et al. 2006)
𝜆𝑒 = 18𝜆𝑍𝑖𝑚𝑚 (𝑐
𝑐∗)
0.65
= 6.8𝑚𝑠
where the overlap concentration c* was calculated from (Graessley1980), c
* = 0.77/[] =
858 ppm. The intrinsic viscosity, [] = 0.072Mw0.65
= 897 ml/g, was given by the Mark-
Houwink relation (Rodd et al. 2005). The dilute PEO solution exhibits non- or a mild
shear-thinning effect as reported in earlier work (Cox and Brenner 1968; Rodd et al.
2005; Rodd et al. 2007).
Results of AR effect

192
Fig. S1. Focusing patterns of AR=0.5 for the 3.1, 4.8, and 9.9 µm particles in the 1000
ppm PEO solution at different flow rate.
Fig. S2. Focusing patterns of AR=2 for the 3.1, 4.8, and 9.9 µm particles in the 1000 ppm
PEO solution at different flow rate.
Fig. S3. Focusing patterns of AR=3.3 for the 3.1, 4.8, and 9.9 µm particles in the 1000
ppm PEO solution at different flow rate.

193
Reference
Graessley WW (1980) Polymer chain dimensions and the dependence of viscoelastic
properties on concentration, molecular weight and solvent power. Polymer
21(3):258-62
Rodd LE, Scott TP, Boger DV, Cooper-White JJ, McKinley GH (2005) The inertio-
elastic planar entry flow of low-viscosity elastic fluids in micro-fabricated
geometries. Journal of Non-Newtonian Fluid Mechanics 129(1):1-22
Rubinstein M and Colby RH (2003) Polymer Physics, Oxford University Press Inc
Tirtaatmadja V, McKinley GH, Cooper-White JJ (2006) Drop formation and breakup of
low viscosity elastic fluids: Effects of molecular weight and concentration.
Physics of Fluids (1994-present) 18(4):043101

194
Appendix C
SUPPLEMENTARY MATERIAL FOR CONTINUOUS SHETH-FREE SEPARATION
OF PARTICLES BY SHAPE IN VISCOELASTIC FLUIDS
1. Determination of the fluid properties in Table 1 in the main text
The zero-shear viscosities, 𝜂, of 500 ppm and 1000 ppm PEO solutions were obtained
from the experimental measurements of Rodd et al.1 That of 2000 ppm PEO was
calculated using the viscosity blending equation,2 with the reported experimental values
of 1000 ppm and 3000 ppm.1 The overlap concentration, c
*, of PEO solutions was
calculated from the expression of Graessley,3 c
* = 0.77/[] = 858 ppm, where [] =
0.072Mw0.65
= 897 mL/g is the intrinsic viscosity given by the Mark-Houwink relation
with Mw = 2106 Da being the molecular weight of PEO polymser.
1 The Zimm relaxation
time of PEO solutions was calculated from Zimm theory4
𝜆𝑍𝑖𝑚𝑚 = 𝐹[𝜂]𝑀𝑤𝜂𝑠
𝑁𝐴𝑘𝐵𝑇 (S1)
where 𝐹 = ∑ 𝑖−3𝜈 =∞𝑖=1 0.463 was estimated from Remann Zeta function using a solvent
quality exponent, ν = 0.55,1 𝜂𝑠 = 1 mPas is the solvent viscosity, 𝑁𝐴 is the Avogadro
constant, 𝑘𝐵 is the Boltzmann constant, and T = 293.15 K is the fluid temperature. The
effective relaxation times of PEO solutions were then estimated according to the
following forumla5
𝜆𝑒 = 18𝜆𝑍𝑖𝑚𝑚(𝑐/𝑐∗)0.65 (S2)
2. Control experiment of shape-based particle separation in water

195
FIG. S1. Demonstration of shape-based separation of fluorescent spherical (bright) and
plain peanut-shaped (dark) particles in water through a 25 µm-deep microchannel at a
flow rate of 150 µl/h: (a1) and (a2) snapshot images at the channel inlet and outlet,
respectively; (b1) and (b2) superimposed images of peanut and spherical particles,
respectively, at the channel outlet; (c) the plot of particle PDF at the channel outlet. The
flow direction is from left to right.
3. Derivations of Eq. (1) and Eq. (2) in the main text
Assuming an Oldroyd-B model for the constitutive equation, the elastic lift force, 𝐅𝑒𝐿,
experienced by a particle in a viscoelastic fluid is given by,6,7
𝐅𝑒𝐿~𝑎3∇𝐍1~𝑎3𝑊𝑖�̇�2 (S1)
where 𝐍1 is the first normal stress difference and �̇� = 2 𝑉 𝑤⁄ is the fluid shear rate with 𝑉
being the average fluid velocity. Substituting the definition of Wi in the main text into Eq.
(S1) yields
𝐅𝑒𝐿~𝑎3𝜆𝑒�̇�3 = 𝑎3𝜆𝑒 (2𝑉
𝑤)
3
= 𝑎3𝜆𝑒 (2𝑄
𝑤2ℎ)
3
= 8 (𝑎
𝑤)
3
𝜆𝑒𝑄3
(𝑤ℎ)3 ~𝜆𝑒(𝑎 𝑤⁄ )3𝑄3 (S2)
The total inertial lift force, 𝐅𝑖𝐿, scales as8
𝐅𝑖𝐿~ 𝜌𝑉2𝑎4 𝑤2⁄ = 𝜌 (𝑄
𝑤ℎ)
2
𝑎4 𝑤2⁄ = 𝜌𝑄2
ℎ2(𝑎 𝑤⁄ )4~𝜌(𝑎 𝑤⁄ )4𝑄2 (S3)
4. Flow rate effects on shape-based particle separation in different PEO solutions
0 0.1 0.2 0.3
0100200300400500600700800900
SpheresPeanuts
(a1)
200 µm
(a2) (b1) (b2) (c)
Peanuts SpheresRe = 1.11

196
FIG. S2. PDF plots for the flow effects on shape-based particle separation in 500 ppm (a)
and 2000 ppm (b) PEO solutions through a 50 µm wide, 25 µm deep straight rectangular
microchannel.
5. Flow rate effects on shape-based particle separation in microchannels of different
AR
FIG. S3. Cropped superimposed particle images at the channel outlet for the flow rate
effect on shape-based separation of plain peanut (dark) and fluorescent spherical (bright)
100150
200300400
-45
0
-35
0
-25
0
-15
0
-50
50
150
250
350
450
0
0.1
0.2
0.3-4
50
-35
0
-25
0
-15
0
-50
50
150
250
350
450
PD
F
Peanuts Spheres
(a)
0
0.1
0.2
0.3
0.4
-45
0
-35
0
-25
0
-15
0
-50
50
150
250
350
450
PD
F
100150
200300400
-45
0
-35
0
-25
0
-15
0
-50
50
150
250
350
450
Peanuts Spheres(b)
Re = 0.13
Wi = 1.89
Re = 0.27
Wi = 3.78
Re = 0.40
Wi = 5.67
Re = 0.54
Wi = 7.56
Re = 0.80
Wi = 11.3
200 µm
150 µL/h100 µL/h50 µL/h 200 µL/h 300 µL/h

197
particles in 1000 ppm PEO solution through a 50 µm wide and 40 µm deep (i.e., AR =
1.25) straight rectangular microchannel. The scale bar represents 200 µm.
FIG. S4. Flow rate effect (in terms of the Reynolds number, Re, and Weissenberg
number, Wi) on shape-based separation of plain peanut (dark) and fluorescent spherical
(bright) particles in 1000 ppm PEO solution through a 50 µm wide and 15 µm deep (i.e.,
AR = 3.3) straight rectangular microchannel: (top row) cropped superimposed particle
images at the channel outlet; (bottom row) plots of particle PDF at the channel outlet. The
scale bar represents 200 µm.
References
1 L. E. Rodd, T. P. Scott, D. V. Boger, J. J. Cooper-White, and G. H. McKinley, J. Non-
Newtonian Fluid Mech. 129, 1-22 (2005).
2 R.E. Maples, Petroleum Refinery Process Economics, 1993, Pennwell Books, Tulsa,
Okla.
3 W. W. Graessley, Polymer 21, 258-262 (1980).
4 M. Rubinstein, and R. H. Colby, Polymer Physics, Oxford University Press Inc. (2003).
0 0.2 0.4 0 0.2 0.4
Re = 0.19 Re = 0.37 Re = 0.56 Re = 0.74 Re = 1.1
0 0.2 0.4 0 0.2 0.40 0.2 0.4
-450
-350
-250
-150
-50
50
150
250
350
450
Off
-cen
ter
dis
tan
ce (
µm
)
Wi = 5.04 Wi = 10.1 Wi = 15.1 Wi = 20.1 Wi = 30.2
150 µL/h100 µL/h50 µL/h 200 µL/h 300 µL/h
198
5 V. Tirtaatmadja, G. H. Mckinley, and J. J. Cooper-White, Phys. Fluid. 19, 043101
(2006).
6 A. M. Leshansky, A. Bransky, N. Korin, and U. Dinnar, Phys. Rev. Lett. 98, 234501
(2007).
7 S. Y. Yang, J. Y. Kim, S. J. Lee, S. S. Lee, and J. M. Kim, Lab Chip 11, 266-273
(2011).
8 E. S. Asmolov, J. Fluid Mech. 381, 63-87 (1999).
Recommended