DETAILED PROJECT REPORT ON
AIR FUEL RATIO CONTROL WITH OXYGEN SENSOR HOWRAH CLUSTER
Bureau of Energy Efficiency
Prepared By
Reviewed By

AIR FUEL RATIO CONTROL WITH OXYGEN SENSOR
HOWRAH GALVANIZING
AND WIRE DRAWING CLUSTER
BEE, 2010
Detailed Project Report on Air Fuel Ratio Control with Oxygen Sensor
Galvanizing and Wire Drawing SME Cluster,
Howrah, West Bengal (India)
New Delhi: Bureau of Energy Efficiency;
Detail Project Report No.: HWR/WDG/AFC/03
For more information
Bureau of Energy Efficiency
Ministry of Power, Government of India
4th Floor, Sewa Bhawan, Sector - 1
R. K. Puram, New Delhi -110066
Ph: +91 11 26179699 Fax: 11 26178352
Email: [email protected]
WEB: www.bee-india.nic.in
Acknowledgement
We are sincerely thankful to the Bureau of Energy Efficiency, Ministry of Power, for giving us
the opportunity to implement the ‘BEE SME project in “Howrah Galvanizing and Wire Drawing
Cluster, Howrah, West Bengal”. We express our sincere gratitude to all concerned officials for
their support and guidance during the conduct of this exercise.
Dr. Ajay Mathur, Director General, BEE
Smt. Abha Shukla, Secretary, BEE
Shri Jitendra Sood, Energy Economist, BEE
Shri Pawan Kumar Tiwari, Advisor (SME), BEE
Shri Rajeev Yadav, Project Economist, BEE
Indian Institute of Social Welfare and Business Management(IISWBM) is also thankful to
District Industry Center(DIC), Howrah chamber of Commerce & Industry (HCCI), Bengal
National Chamber of commerce & Industry(BNCCI), Federation of Small & Medium
Industry(FOSMI) and West Bengal Renewable Energy Development Agency(WBREDA) for
their valuable inputs, co-operation, support and identification of the units for energy use and
technology audit studies and facilitating the implementation of BEE SME program in Howrah
Galvanizing and Wire Drawing Cluster.
We take this opportunity to express our appreciation for the excellent support provided by
Galvanizing and Wire Drawing Unit Owners, Local Service Providers, and Equipment
Suppliers for their active involvement and their valuable inputs in making the program
successful and in completion of the Detailed Project Report (DPR).
IISWBM is also thankful to all the SME owners, plant in charges and all workers of the SME
units for their support during the energy use and technology audit studies and in
implementation of the project objectives.
Indian Institute of Social Welfare and Business
Management Kolkata
Contents
List of Annexure vii
List of Tables vii
List of Figures viii
List of Abbreviation viii
Executive summary ix
About BEE’S SME program xi
1 INTRODUCTION........................................................................................................... 1
1.1 Brief Introduction about cluster ..................................................................................... 1
1.2 Energy performance in existing system ........................................................................ 8
1.2.1 Fuel consumption .......................................................................................................... 8
1.2.2 Average annual production ........................................................................................... 9
1.2.3 Specific energy consumption ........................................................................................ 9
1.3 Existing technology/equipment ................................................................................... 10
1.3.1 Description of existing technology ............................................................................... 10
1.3.2 Role in process ........................................................................................................... 11
1.4 Baseline establishment for existing technology ........................................................... 11
1.4.1 Design and operating parameters ............................................................................... 11
1.4.2 Operating efficiency analysis ....................................................................................... 13
1.5 Barriers in adoption of proposed equipment ............................................................... 13
1.5.1 Technological barrier ................................................................................................... 13
1.5.2 Financial barrier .......................................................................................................... 13
1.5.3 Skilled manpower ........................................................................................................ 13
2. PROPOSED EQUIPMENT FOR ENERGY EFFICENCY IMPROVEMENT ................. 14
2.1 Description of proposed equipment ............................................................................ 14
2.1.1 Details of proposed equipment .................................................................................... 14
2.1.2 Equipment/technology specification ............................................................................ 14
2.1.3 Integration with existing equipment ............................................................................. 14
2.1.4 Superiority over existing system .................................................................................. 15
2.1.5 Source of equipment ................................................................................................... 15
2.1.6 Availability of technology/equipment ........................................................................... 15
2.1.7 Service providers ........................................................................................................ 15
2.1.8 Terms and conditions in sales of equipment................................................................ 15
2.1.9 Process down time ...................................................................................................... 15
2.2 Life cycle assessment and risks analysis .................................................................... 15
2.3 Suitable unit for Implementation of proposed technology ............................................ 15
3. ECONOMIC BENEFITS FROM PROPOSED TECHNOLOGY .................................... 16
3.1 Technical benefit ........................................................................................................ 16
3.1.1 Fuel saving.................................................................................................................. 16
3.1.2 Electricity saving ......................................................................................................... 16
3.1.3 Improvement in product quality ................................................................................... 16
3.1.4 Increase in production ................................................................................................. 16
3.1.5 Reduction in raw material ............................................................................................ 16
3.1.6 Reduction in other losses ............................................................................................ 16
3.2 Monetary benefits ....................................................................................................... 16
3.3 Social benefits ............................................................................................................ 17
3.3.1 Improvement in working environment .......................................................................... 17
3.3.2 Improvement in workers skill ....................................................................................... 17
3.4 Environmental benefits ............................................................................................... 17
3.4.1 Reduction in effluent generation .................................................................................. 17
3.4.2 Reduction in GHG emission ........................................................................................ 17
3.4.3 Reduction in other emissions like SOX ........................................................................ 17
4. INSTALLATION OF PROPOSED EQUIPMENT ......................................................... 18
4.1 Cost of project ............................................................................................................ 18
4.1.1 Equipment cost ........................................................................................................... 18
4.1.2 Erection, commissioning and other misc. cost ............................................................. 18
4.2 Arrangements of funds ............................................................................................... 18
4.2.1 Entrepreneur’s contribution ......................................................................................... 18
4.2.2 Loan amount. .............................................................................................................. 19
4.2.3 Terms & conditions of loan .......................................................................................... 19
4.3 Financial indicators ..................................................................................................... 19
4.3.1 Cash flow analysis ...................................................................................................... 19
4.3.2 Simple payback period ................................................................................................ 19
4.3.3 Net Present Value (NPV) ............................................................................................ 19
4.3.4 Internal rate of return (IRR) ......................................................................................... 19
4.3.5 Return on investment (ROI) ........................................................................................ 19
4.4 Sensitivity analysis...................................................................................................... 20
4.5 Procurement and implementation schedule ................................................................ 20
vii
List of Annexure
Annexure -1: Energy audit data used for baseline establishment ......................................... 21
Annexure -2: Process flow diagram after project implementation ......................................... 22
Annexure -3: Detailed technology assessment report .......................................................... 23
Annexure -4 Drawings for proposed electrical & civil works ................................................ 25
Annexure -5: Detailed financial analysis ............................................................................... 26
Annexure:-6 Procurement and implementation schedule .................................................... 30
Annexure -7: Details of technology service providers ........................................................... 31
Annexure -8: Quotations or Techno-commercial bids for new technology/equipment ........... 32
Annexure -9: SIDBI financing scheme for energy saving projects in MSME sector .................. 39
List of Table
Table 1.1a Details of annual energy consumption in the wire drawing units .............................. 1
Table 1.1b Details of annual energy consumption in the galvanizing units ................................ 1
Table 1.2 Average fuel and electricity consumption in typical wire drawing units ....................... 8
Table 1.3 Average fuel and electricity consumption in typical galvanizing units ......................... 8
Table 1.4 Typical average annual production in wire drawing units ........................................... 9
Table 1.5 Typical average annual production in galvanizing units ............................................. 9
Table 1.6: Specific Energy Consumption in Galvanizing and Wire-drawing Units ...................... 9
Table 1.7 Cluster specifications of present furnaces................................................................ 10
Table 1.8 Electricity charges for WBSEDCL ............................................................................ 11
Table 1.9 Electricity charges for CESC.................................................................................... 11
Table 1.10 Present furnace specifications ............................................................................... 12
Table 1.11 Fuel consumption at a typical galvanizing unit using furnace oil ............................ 12
Table 2.1 Technical specification of a excess air control using O2 sensor ............................... 14
Table 3.1 Energy and monetary benefit ................................................................................... 16
Table 4.1 Details of proposed technology project cost ............................................................. 18
Table 4.2 Financial indicators of proposed technology/equipment ........................................... 20
viii
Table 4.3 Sensitivity analysis at different scenarios ................................................................. 20
List of Figures
Figure 1.1 : Product Wise Classification of Galvanizing Units .................................................... 2
Figure 1.2: Product Wise Classification of Wire-drawing Units .................................................. 3
Figure 1.3: Production Wise Classification of Galvanizing Units ................................................ 4
Figure 1.4: Production Wise Classification of Wire-drawing Units .............................................. 4
Figure 1.5 Process flow diagram of a typical wire drawing unit .................................................. 6
Figure 1.6: Process Flow diagram for a typical galvanizing unit ................................................. 7
List of Abbreviation
BEE Bureau of Energy Efficiency
CDM Clean Development Mechanism
DPR Detailed Project Report
DSCR Debt Service Coverage Ratio
GHG Green House Gases
IRR Internal Rate of Return
MT Million Ton
MW Mega Watt
NPV Net Present Value
ROI Return on Investment
SHC Coal Semi Hard Coke Coal
SIDBI Small Industrial Development Bank of India
MoMSME Ministry of Micro Small and Medium Enterprises
ix
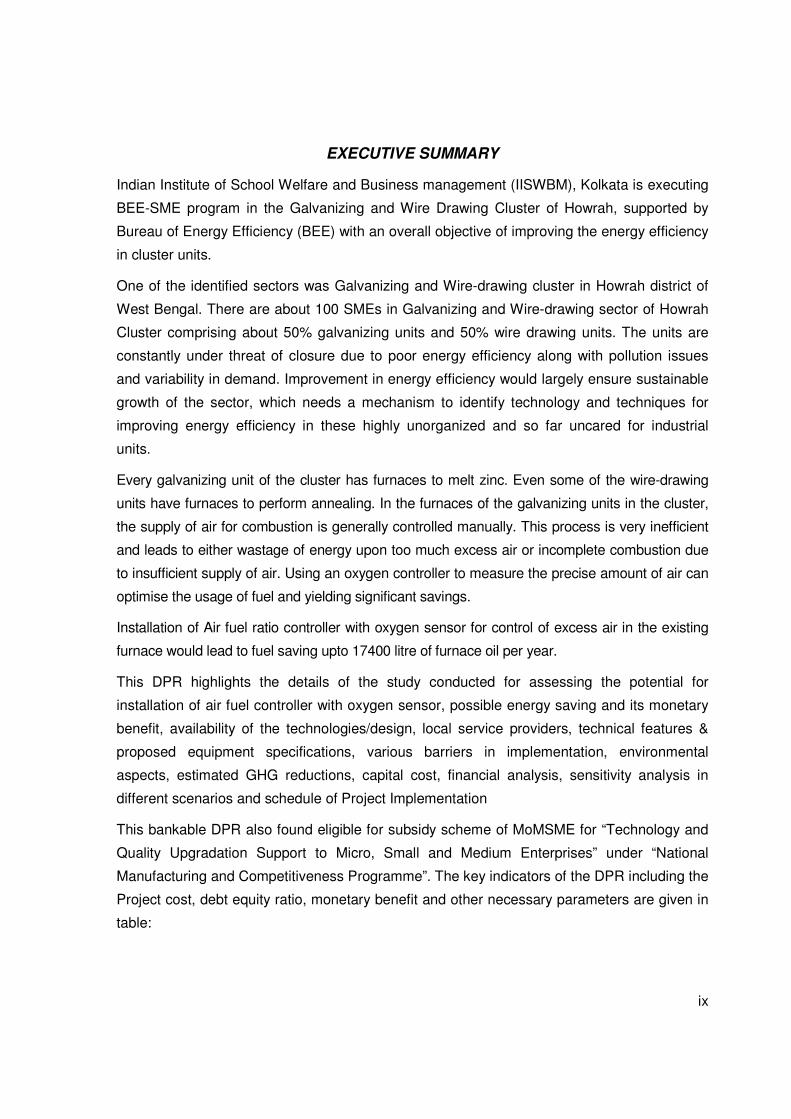
EXECUTIVE SUMMARY
Indian Institute of School Welfare and Business management (IISWBM), Kolkata is executing
BEE-SME program in the Galvanizing and Wire Drawing Cluster of Howrah, supported by
Bureau of Energy Efficiency (BEE) with an overall objective of improving the energy efficiency
in cluster units.
One of the identified sectors was Galvanizing and Wire-drawing cluster in Howrah district of
West Bengal. There are about 100 SMEs in Galvanizing and Wire-drawing sector of Howrah
Cluster comprising about 50% galvanizing units and 50% wire drawing units. The units are
constantly under threat of closure due to poor energy efficiency along with pollution issues
and variability in demand. Improvement in energy efficiency would largely ensure sustainable
growth of the sector, which needs a mechanism to identify technology and techniques for
improving energy efficiency in these highly unorganized and so far uncared for industrial
units.
Every galvanizing unit of the cluster has furnaces to melt zinc. Even some of the wire-drawing
units have furnaces to perform annealing. In the furnaces of the galvanizing units in the cluster,
the supply of air for combustion is generally controlled manually. This process is very inefficient
and leads to either wastage of energy upon too much excess air or incomplete combustion due
to insufficient supply of air. Using an oxygen controller to measure the precise amount of air can
optimise the usage of fuel and yielding significant savings.
Installation of Air fuel ratio controller with oxygen sensor for control of excess air in the existing
furnace would lead to fuel saving upto 17400 litre of furnace oil per year.
This DPR highlights the details of the study conducted for assessing the potential for
installation of air fuel controller with oxygen sensor, possible energy saving and its monetary
benefit, availability of the technologies/design, local service providers, technical features &
proposed equipment specifications, various barriers in implementation, environmental
aspects, estimated GHG reductions, capital cost, financial analysis, sensitivity analysis in
different scenarios and schedule of Project Implementation
This bankable DPR also found eligible for subsidy scheme of MoMSME for “Technology and
Quality Upgradation Support to Micro, Small and Medium Enterprises” under “National
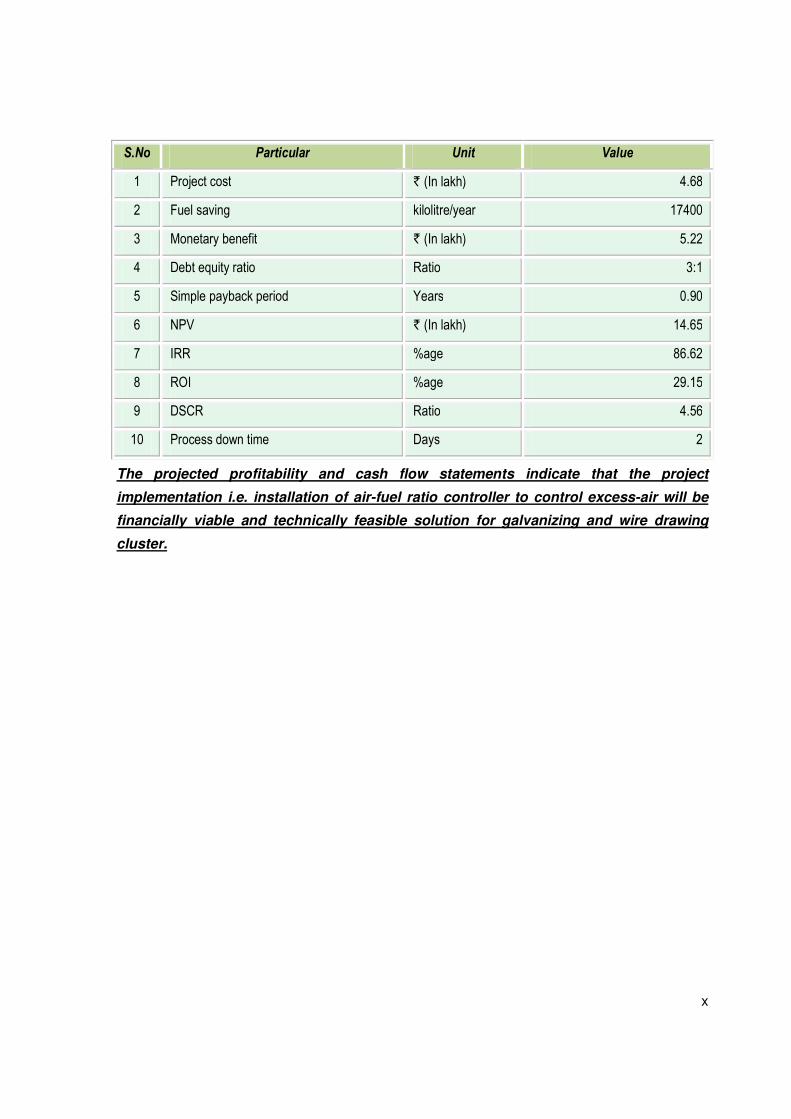
Manufacturing and Competitiveness Programme”. The key indicators of the DPR including the
Project cost, debt equity ratio, monetary benefit and other necessary parameters are given in
table:
x
S.No Particular Unit Value
1 Project cost ` (In lakh) 4.68
2 Fuel saving kilolitre/year 17400
3 Monetary benefit ` (In lakh) 5.22
4 Debt equity ratio Ratio 3:1
5 Simple payback period Years 0.90
6 NPV ` (In lakh) 14.65
7 IRR %age 86.62
8 ROI %age 29.15
9 DSCR Ratio 4.56
10 Process down time Days 2
The projected profitability and cash flow statements indicate that the project
implementation i.e. installation of air-fuel ratio controller to control excess-air will be
financially viable and technically feasible solution for galvanizing and wire drawing
cluster.
xi
ABOUT BEE’S SME PROGRAM
The Bureau of Energy Efficiency (BEE) is implementing a BEE-SME Programme to improve
the energy performance in 25 selected SMEs clusters. Howrah Galvanizing and Wire Drawing
Cluster is one of them. The SME Programme of BEE intends to enhance the awareness
about energy efficiency in each cluster by funding/subsidizing need based studies and giving
energy conservation recommendations. For addressing the specific problems of these SMEs
and enhancing energy efficiency in the clusters, BEE will be focusing on energy efficiency,
energy conservation and technology up-gradation through studies and pilot projects in these
SMEs clusters.
Major activities in the BEE -SME program are furnished below:
Activity 1: Energy use and technology audit
The energy use technology studies would provide information on technology status, best
operating practices, gaps in skills and knowledge on energy conservation opportunities,
energy saving potential and new energy efficient technologies, etc for each of the sub sector
in SMEs.
Activity 2: Capacity building of stake holders in cluster on energy efficiency
In most of the cases SME entrepreneurs are dependent on the locally available technologies,
service providers for various reasons. To address this issue BEE has also undertaken
capacity building of local service providers and entrepreneurs/ managers of SMEs on energy
efficiency improvement in their units as well as clusters. The local service providers will be
trained in order to be able to provide the local services in setting up of energy efficiency
projects in the clusters
Activity 3: Implementation of energy efficiency measures
To implement the technology up-gradation project in the clusters, BEE has proposed to
prepare the technology based detailed project reports (DPRs) for a minimum of five
technologies in three capacities for each technology.
Activity 4: Facilitation of innovative financing mechanisms for implementation of
energy efficiency projects
The objective of this activity is to facilitate the uptake of energy efficiency measures through
innovative financing mechanisms without creating market distortion
Air Fuel Ratio Control With Oxygen Control
1
1 INTRODUCTION
1.1 Brief Introduction about cluster
The Galvanizing and Wire-drawing cluster in Howrah district of West Bengal is a very large
cluster. There are about 100 SMEs in the Howrah Cluster and comprising of about 50%
galvanizing units and 50% wire drawing units. The units are constantly under threat of closure
due to poor energy efficiency along with pollution issues and variability in demand.
Improvement in energy efficiency would largely ensure sustainable growth of the sector. It
needs a mechanism to identify technology and techniques for improving energy efficiency in
this highly unorganized and so far uncared for industrial units.
The major raw materials for the Galvanizing industry are zinc, ammonium chloride,
hydrochloric acid, and di-chromate powder. On the other hand, the raw materials used in
Wire-drawing units are MS / Copper / Aluminium Wires of gauges varying from 14 to 4 gauge
i.e. 1.6 to 5.1 mm dia., while Uni-Lab powder (Predington company based in Bombay) or
Grommet–44 is used for lubrication (eg.).
The main form of energy used by the cluster units are grid electricity, Furnace Oil, SHC Coal,
LPG and Diesel oil. Major consumptions of energy are in the form of Furnace Oil and Diesel.
Details of total energy consumption at Howrah cluster are furnished in Tables 1.1a and 1.1b:
Table 1.1a Details of annual energy consumption in the wire drawing units
Table 1.1b Details of annual energy consumption in the galvanizing units
S. No Type of Fuel Unit Value % contribution
1 Electricity GWh/year 2.24 76
2 Wood Ton/year 300 5
3 LPG Ton/year 70.5 19
S. No Type of Fuel Unit Value % contribution
1 Electricity MWh/year 867.3 13
2 Diesel kl/year 19.2 2
3 Furnace Oil kl/year 731.7 62.5
4 SHC Coal Ton/year 1161 18.5
5 Wood Ton/year 600 4
Air Fuel Ratio Control With Oxygen Control
2
Classification of Units
The Galvanizing and Wire Drawing units can be broadly classified on the basis of the
following criteria
1) Product wise
2) Production capacity wise
Products Manufactured
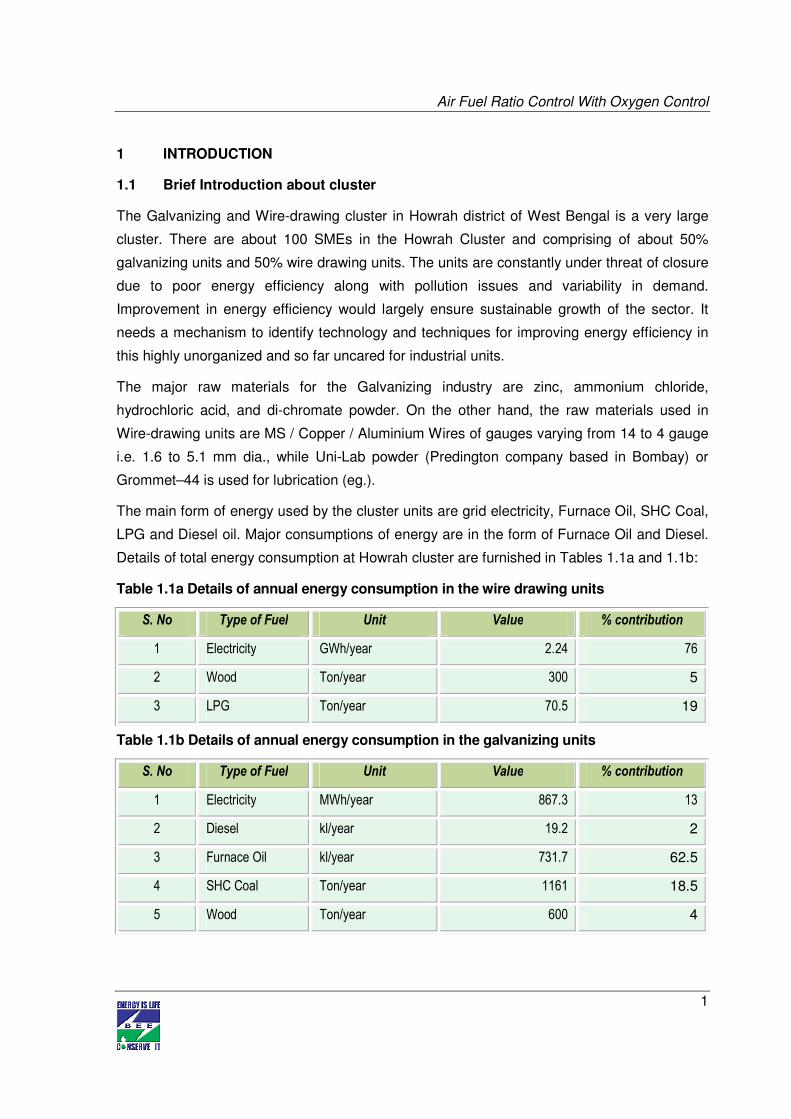
The galvanizing units can be classified on the basis of products into 5 basis groups. Those
are
a) Units producing transmission tower structures
b) Units producing fastener items
c) Units producing angles and channels
d) Units working on scrap iron
e) Units producing wires
Figure 1.1 : Product Wise Classification of Galvanizing Units
Air Fuel Ratio Control With Oxygen Control
3
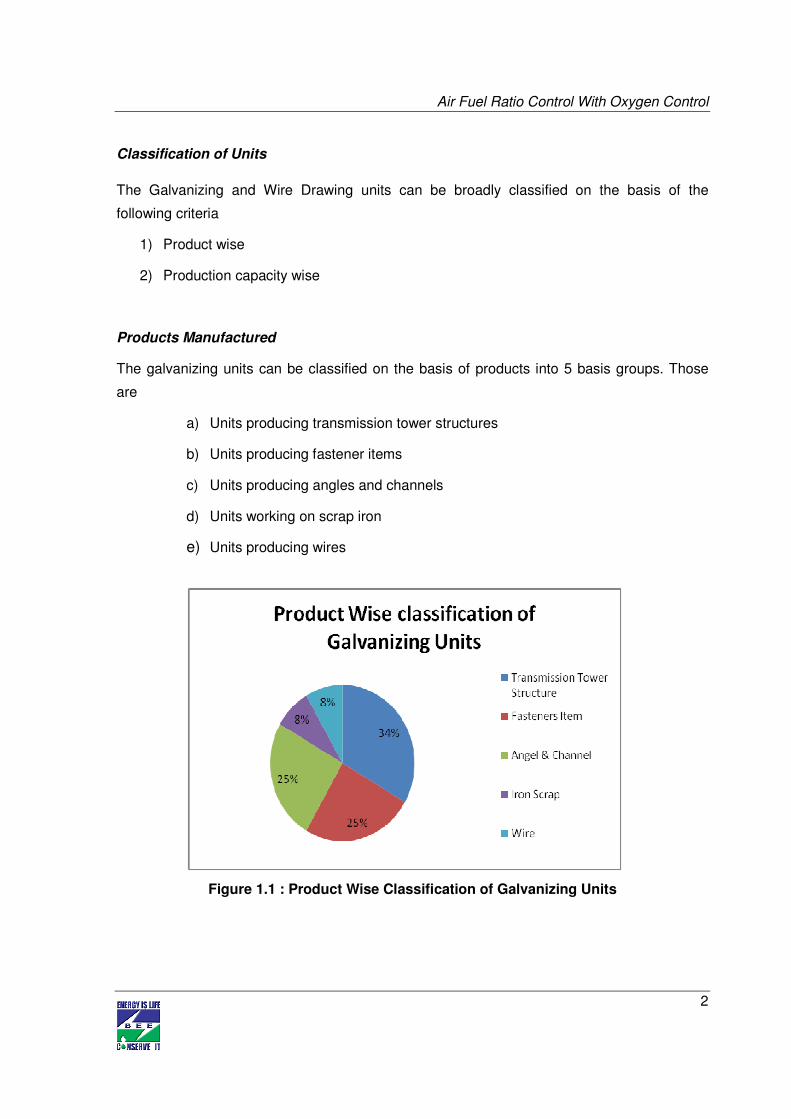
Similarly, the wire drawing units are mainly classified into the following categories on the
basis of products manufactured as units which produce
a) MS wire
b) Copper Wire
c) High carbon wire
d) Aluminium wire
Figure 1.2: Product Wise Classification of Wire-drawing Units
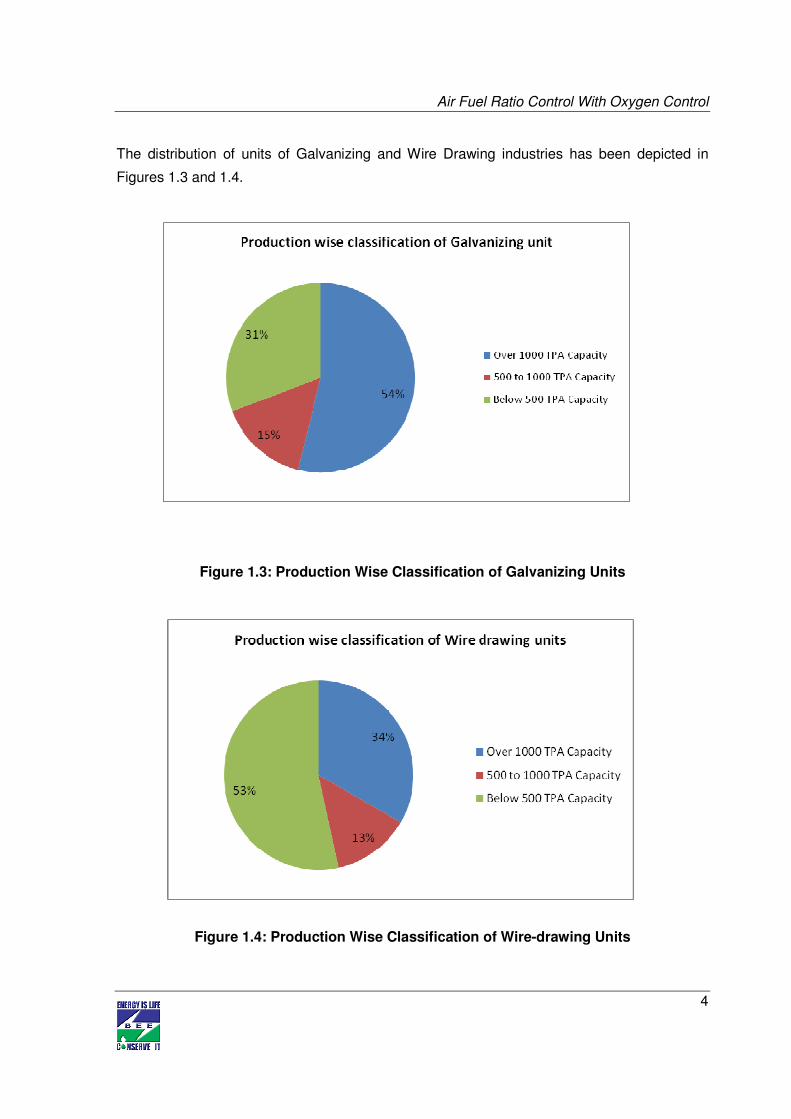
Capacity wise production
In both Wiredrawing and Galvanizing units in Howrah, the production capacity has been found
to vary more than 10 folds. In the units where detailed audit has been performed, there are
Wire-drawing units producing as low as 241 Ton/year to as high as 3500 Ton/year. Similarly,
the production from Galvanizing units where audit was performed has been found to be within
the range of 890 to 7500 Ton per annum. Both the Galvanizing and the Wire Drawing units
have been classified on the basis of production into three categories, namely 1-500 TPA
(calling small scale), 500-1000 TPA (medium scale) and above 1000 TPA (large scale)
capacities.
Air Fuel Ratio Control With Oxygen Control
4
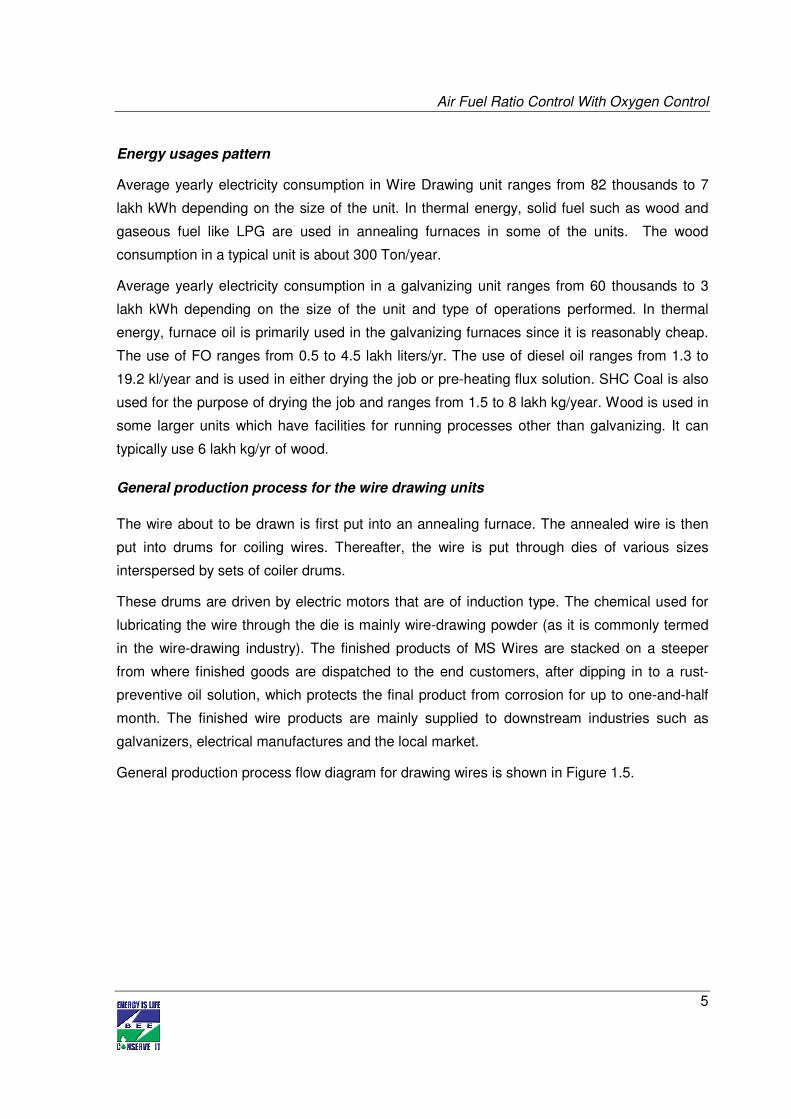
The distribution of units of Galvanizing and Wire Drawing industries has been depicted in
Figures 1.3 and 1.4.
Figure 1.3: Production Wise Classification of Galvanizing Units
Figure 1.4: Production Wise Classification of Wire-drawing Units
Air Fuel Ratio Control With Oxygen Control
5
Energy usages pattern
Average yearly electricity consumption in Wire Drawing unit ranges from 82 thousands to 7
lakh kWh depending on the size of the unit. In thermal energy, solid fuel such as wood and
gaseous fuel like LPG are used in annealing furnaces in some of the units. The wood
consumption in a typical unit is about 300 Ton/year.
Average yearly electricity consumption in a galvanizing unit ranges from 60 thousands to 3
lakh kWh depending on the size of the unit and type of operations performed. In thermal
energy, furnace oil is primarily used in the galvanizing furnaces since it is reasonably cheap.
The use of FO ranges from 0.5 to 4.5 lakh liters/yr. The use of diesel oil ranges from 1.3 to
19.2 kl/year and is used in either drying the job or pre-heating flux solution. SHC Coal is also
used for the purpose of drying the job and ranges from 1.5 to 8 lakh kg/year. Wood is used in
some larger units which have facilities for running processes other than galvanizing. It can
typically use 6 lakh kg/yr of wood.
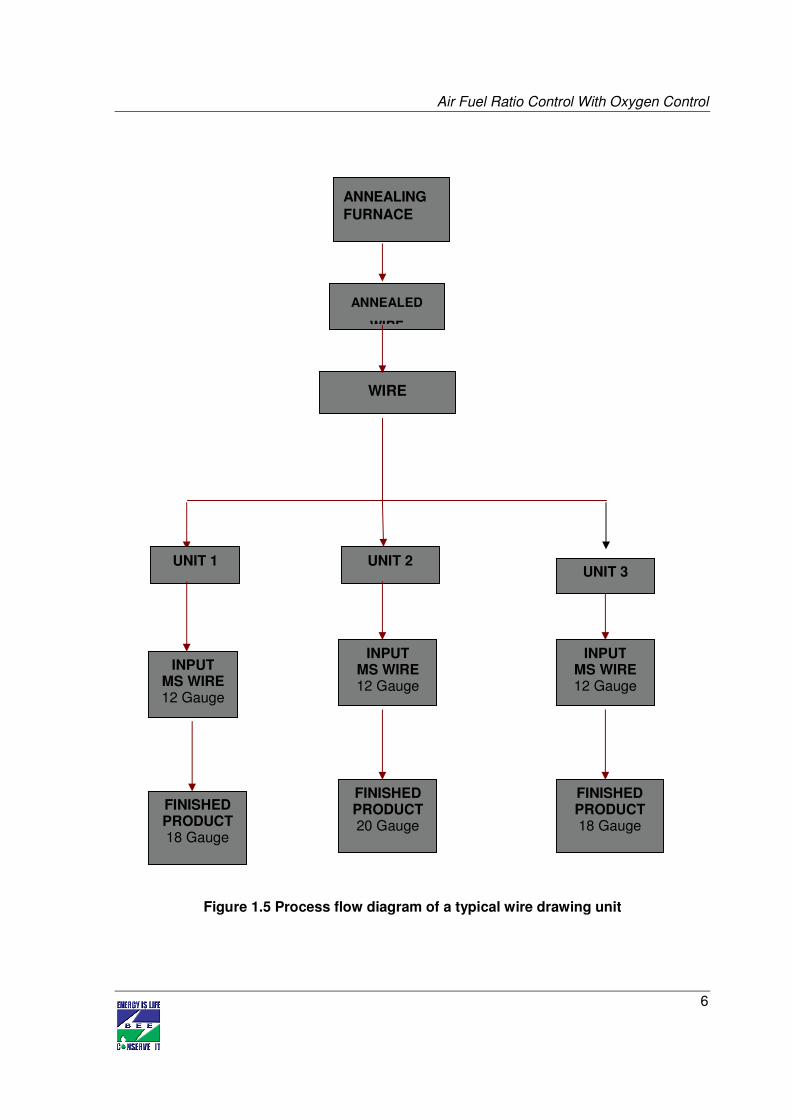
General production process for the wire drawing units
The wire about to be drawn is first put into an annealing furnace. The annealed wire is then
put into drums for coiling wires. Thereafter, the wire is put through dies of various sizes
interspersed by sets of coiler drums.
These drums are driven by electric motors that are of induction type. The chemical used for
lubricating the wire through the die is mainly wire-drawing powder (as it is commonly termed
in the wire-drawing industry). The finished products of MS Wires are stacked on a steeper
from where finished goods are dispatched to the end customers, after dipping in to a rust-
preventive oil solution, which protects the final product from corrosion for up to one-and-half
month. The finished wire products are mainly supplied to downstream industries such as
galvanizers, electrical manufactures and the local market.
General production process flow diagram for drawing wires is shown in Figure 1.5.
Air Fuel Ratio Control With Oxygen Control
6
Figure 1.5 Process flow diagram of a typical wire drawing unit
WIRE
ANNEALING
FURNACE
ANNEALED
WIRE
UNIT 1 UNIT 2
INPUT MS WIRE 12 Gauge
FINISHED PRODUCT 18 Gauge
INPUT MS WIRE 12 Gauge
FINISHED PRODUCT 20 Gauge
INPUT MS WIRE 12 Gauge
FINISHED PRODUCT 18 Gauge
UNIT 3
Air Fuel Ratio Control With Oxygen Control
7
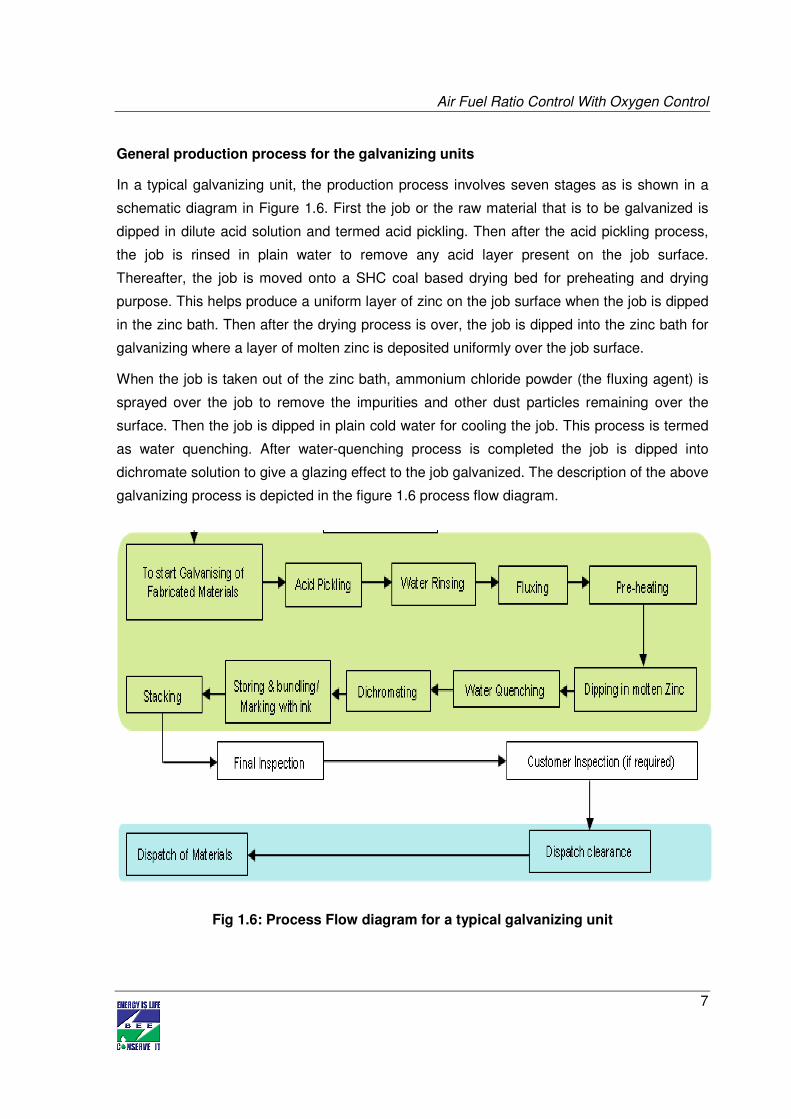
General production process for the galvanizing units
In a typical galvanizing unit, the production process involves seven stages as is shown in a
schematic diagram in Figure 1.6. First the job or the raw material that is to be galvanized is
dipped in dilute acid solution and termed acid pickling. Then after the acid pickling process,
the job is rinsed in plain water to remove any acid layer present on the job surface.
Thereafter, the job is moved onto a SHC coal based drying bed for preheating and drying
purpose. This helps produce a uniform layer of zinc on the job surface when the job is dipped
in the zinc bath. Then after the drying process is over, the job is dipped into the zinc bath for
galvanizing where a layer of molten zinc is deposited uniformly over the job surface.
When the job is taken out of the zinc bath, ammonium chloride powder (the fluxing agent) is
sprayed over the job to remove the impurities and other dust particles remaining over the
surface. Then the job is dipped in plain cold water for cooling the job. This process is termed
as water quenching. After water-quenching process is completed the job is dipped into
dichromate solution to give a glazing effect to the job galvanized. The description of the above
galvanizing process is depicted in the figure 1.6 process flow diagram.
Fig 1.6: Process Flow diagram for a typical galvanizing unit
Air Fuel Ratio Control With Oxygen Control
8
1.2 Energy performance in existing system
1.2.1 Fuel consumption
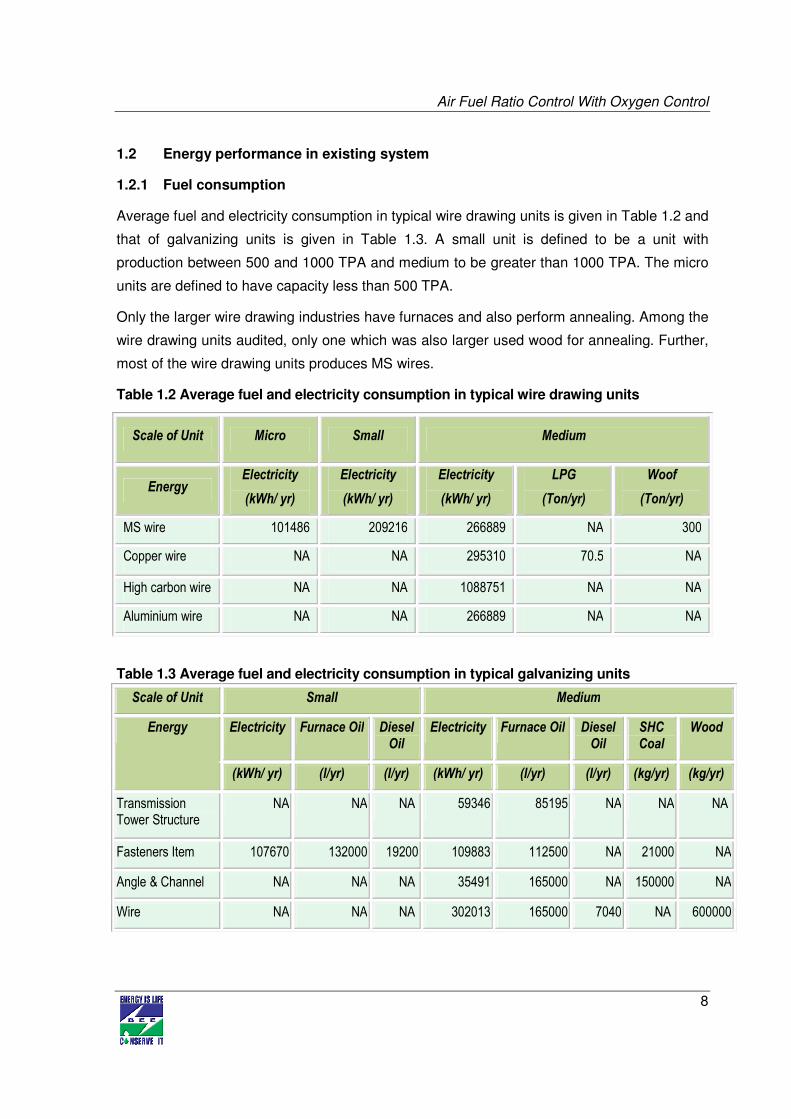
Average fuel and electricity consumption in typical wire drawing units is given in Table 1.2 and
that of galvanizing units is given in Table 1.3. A small unit is defined to be a unit with
production between 500 and 1000 TPA and medium to be greater than 1000 TPA. The micro
units are defined to have capacity less than 500 TPA.
Only the larger wire drawing industries have furnaces and also perform annealing. Among the
wire drawing units audited, only one which was also larger used wood for annealing. Further,
most of the wire drawing units produces MS wires.
Table 1.2 Average fuel and electricity consumption in typical wire drawing units
Table 1.3 Average fuel and electricity consumption in typical galvanizing units
Scale of Unit Small Medium
Energy Electricity Furnace Oil Diesel Oil
Electricity Furnace Oil Diesel Oil
SHC Coal
Wood
(kWh/ yr) (l/yr) (l/yr) (kWh/ yr) (l/yr) (l/yr) (kg/yr) (kg/yr)
Transmission Tower Structure
NA NA NA 59346 85195 NA NA NA
Fasteners Item 107670 132000 19200 109883 112500 NA 21000 NA
Angle & Channel NA NA NA 35491 165000 NA 150000 NA
Wire NA NA NA 302013 165000 7040 NA 600000
Scale of Unit Micro Small Medium
Energy Electricity
(kWh/ yr)
Electricity
(kWh/ yr)
Electricity
(kWh/ yr)
LPG
(Ton/yr)
Woof
(Ton/yr)
MS wire 101486 209216 266889 NA 300
Copper wire NA NA 295310 70.5 NA
High carbon wire NA NA 1088751 NA NA
Aluminium wire NA NA 266889 NA NA
Air Fuel Ratio Control With Oxygen Control
9
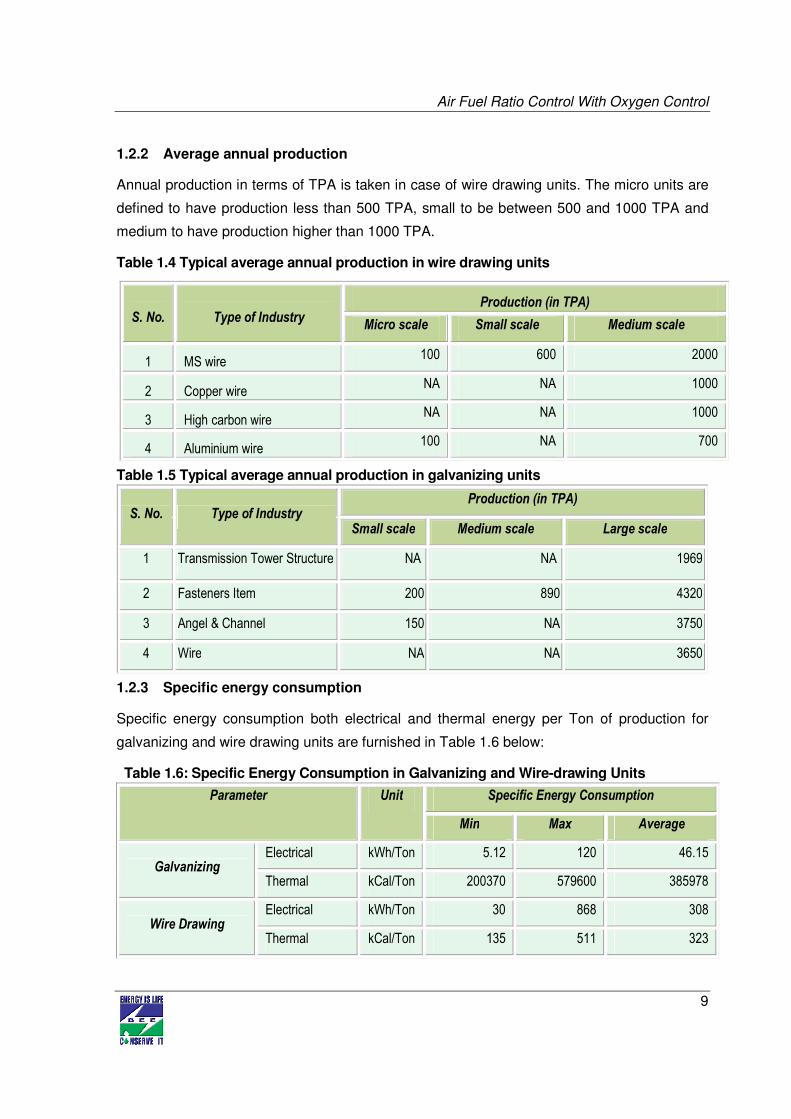
1.2.2 Average annual production
Annual production in terms of TPA is taken in case of wire drawing units. The micro units are
defined to have production less than 500 TPA, small to be between 500 and 1000 TPA and
medium to have production higher than 1000 TPA.
Table 1.4 Typical average annual production in wire drawing units
Table 1.5 Typical average annual production in galvanizing units
S. No. Type of Industry Production (in TPA)
Small scale Medium scale Large scale
1 Transmission Tower Structure NA NA 1969
2 Fasteners Item 200 890 4320
3 Angel & Channel 150 NA 3750
4 Wire NA NA 3650
1.2.3 Specific energy consumption
Specific energy consumption both electrical and thermal energy per Ton of production for
galvanizing and wire drawing units are furnished in Table 1.6 below:
Table 1.6: Specific Energy Consumption in Galvanizing and Wire-drawing Units
Parameter Unit Specific Energy Consumption
Min Max Average
Galvanizing Electrical kWh/Ton 5.12 120 46.15
Thermal kCal/Ton 200370 579600 385978
Wire Drawing Electrical kWh/Ton 30 868 308
Thermal kCal/Ton 135 511 323
S. No. Type of Industry Production (in TPA)
Micro scale Small scale Medium scale
1 MS wire 100 600 2000
2 Copper wire NA NA 1000
3 High carbon wire NA NA 1000
4 Aluminium wire 100 NA 700
Air Fuel Ratio Control With Oxygen Control
10
Specific energy consumptions are found to vary widely for wire-drawing and galvanizing
processes in the Howrah cluster as shown in the above table. This is because of the variation
in size of units, size & type of job, fuels types and volume of process, as, for example, some
of the Galvanizing units, manufacturing the microwave tower and high-tension electricity
transmission towers, have extensive fabrication activity as a part of the process.
1.3 Existing technology/equipment
1.3.1 Description of existing technology
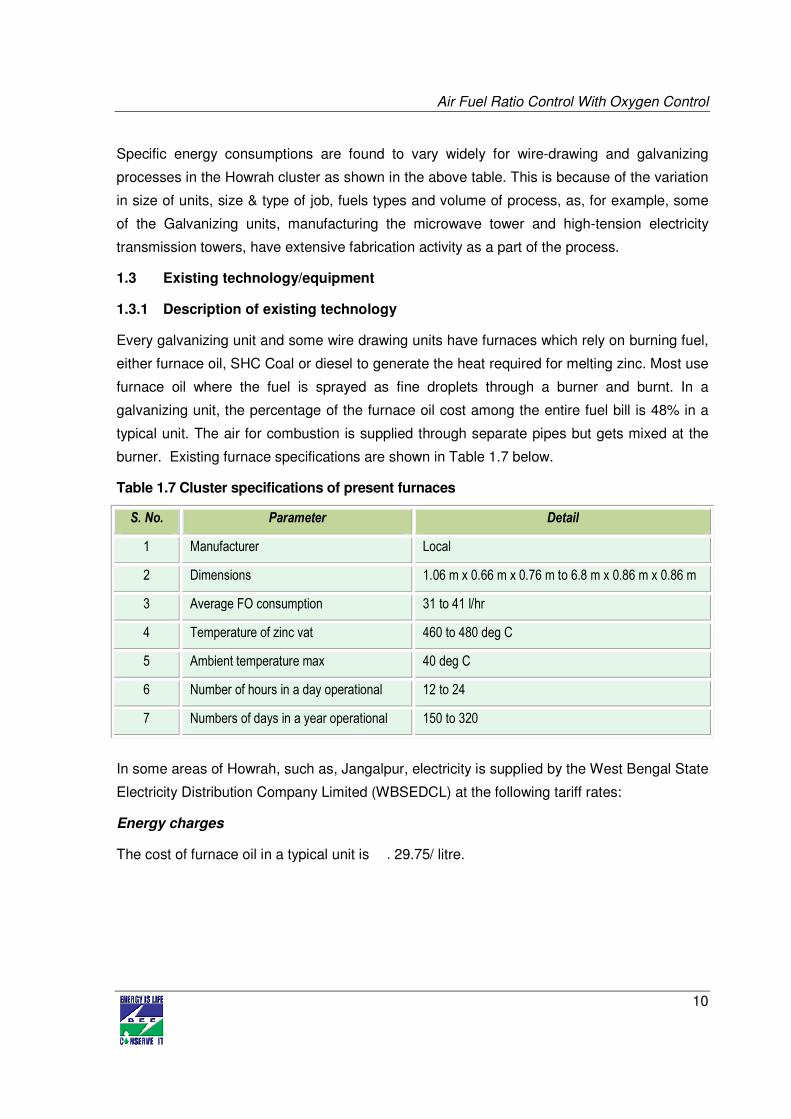
Every galvanizing unit and some wire drawing units have furnaces which rely on burning fuel,
either furnace oil, SHC Coal or diesel to generate the heat required for melting zinc. Most use
furnace oil where the fuel is sprayed as fine droplets through a burner and burnt. In a
galvanizing unit, the percentage of the furnace oil cost among the entire fuel bill is 48% in a
typical unit. The air for combustion is supplied through separate pipes but gets mixed at the
burner. Existing furnace specifications are shown in Table 1.7 below.
Table 1.7 Cluster specifications of present furnaces
S. No. Parameter Detail
1 Manufacturer Local
2 Dimensions 1.06 m x 0.66 m x 0.76 m to 6.8 m x 0.86 m x 0.86 m
3 Average FO consumption 31 to 41 l/hr
4 Temperature of zinc vat 460 to 480 deg C
5 Ambient temperature max 40 deg C
6 Number of hours in a day operational 12 to 24
7 Numbers of days in a year operational 150 to 320
In some areas of Howrah, such as, Jangalpur, electricity is supplied by the West Bengal State
Electricity Distribution Company Limited (WBSEDCL) at the following tariff rates:
Energy charges
The cost of furnace oil in a typical unit is Rs. 29.75/ litre.
Air Fuel Ratio Control With Oxygen Control
11
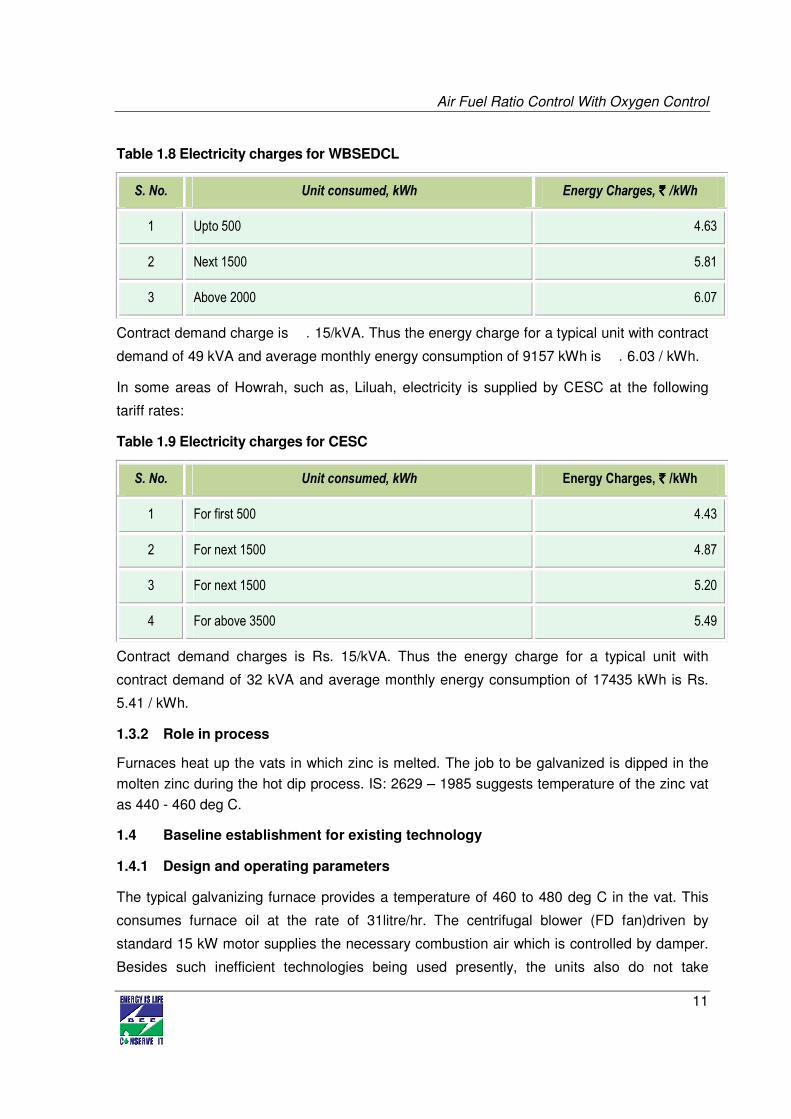
Table 1.8 Electricity charges for WBSEDCL
Contract demand charge is Rs. 15/kVA. Thus the energy charge for a typical unit with contract
demand of 49 kVA and average monthly energy consumption of 9157 kWh is Rs. 6.03 / kWh.
In some areas of Howrah, such as, Liluah, electricity is supplied by CESC at the following
tariff rates:
Table 1.9 Electricity charges for CESC
Contract demand charges is Rs. 15/kVA. Thus the energy charge for a typical unit with
contract demand of 32 kVA and average monthly energy consumption of 17435 kWh is Rs.
5.41 / kWh.
1.3.2 Role in process
Furnaces heat up the vats in which zinc is melted. The job to be galvanized is dipped in the
molten zinc during the hot dip process. IS: 2629 – 1985 suggests temperature of the zinc vat
as 440 - 460 deg C.
1.4 Baseline establishment for existing technology
1.4.1 Design and operating parameters
The typical galvanizing furnace provides a temperature of 460 to 480 deg C in the vat. This
consumes furnace oil at the rate of 31litre/hr. The centrifugal blower (FD fan)driven by
standard 15 kW motor supplies the necessary combustion air which is controlled by damper.
Besides such inefficient technologies being used presently, the units also do not take
S. No. Unit consumed, kWh Energy Charges, ` ` ` ` /kWh
1 Upto 500 4.63
2 Next 1500 5.81
3 Above 2000 6.07
S. No. Unit consumed, kWh Energy Charges, ` ` ` ` /kWh
1 For first 500 4.43
2 For next 1500 4.87
3 For next 1500 5.20
4 For above 3500 5.49
Air Fuel Ratio Control With Oxygen Control
12
precaution for infiltration of atmospheric air in to the system. Since furnace operate in forced
draft mode (there is no ID fan) and also the natural draft of the chimney is not utilized to the
fullest extent, a negative pressure exists in it and infiltration takes place near the chimney
base, while flue gas leaks to environment before that.
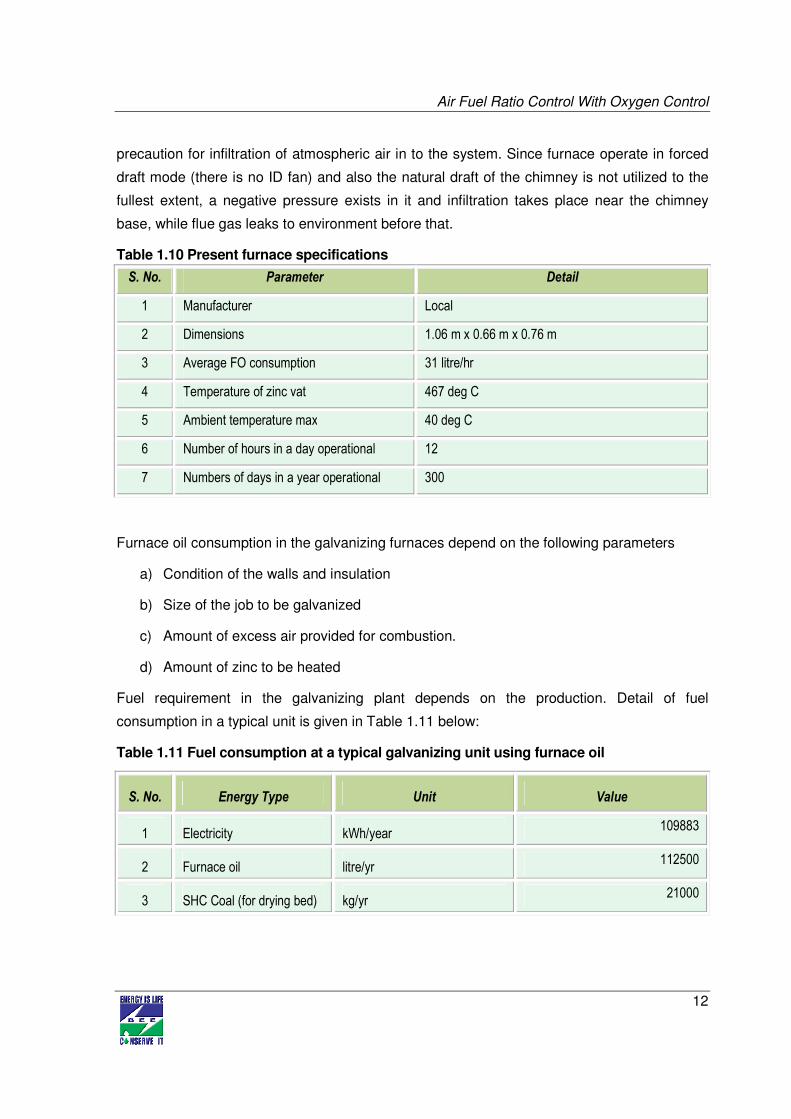
Table 1.10 Present furnace specifications
S. No. Parameter Detail
1 Manufacturer Local
2 Dimensions 1.06 m x 0.66 m x 0.76 m
3 Average FO consumption 31 litre/hr
4 Temperature of zinc vat 467 deg C
5 Ambient temperature max 40 deg C
6 Number of hours in a day operational 12
7 Numbers of days in a year operational 300
Furnace oil consumption in the galvanizing furnaces depend on the following parameters
a) Condition of the walls and insulation
b) Size of the job to be galvanized
c) Amount of excess air provided for combustion.
d) Amount of zinc to be heated
Fuel requirement in the galvanizing plant depends on the production. Detail of fuel
consumption in a typical unit is given in Table 1.11 below:
Table 1.11 Fuel consumption at a typical galvanizing unit using furnace oil
S. No. Energy Type Unit Value
1 Electricity kWh/year 109883
2 Furnace oil litre/yr 112500
3 SHC Coal (for drying bed) kg/yr 21000
Air Fuel Ratio Control With Oxygen Control
13
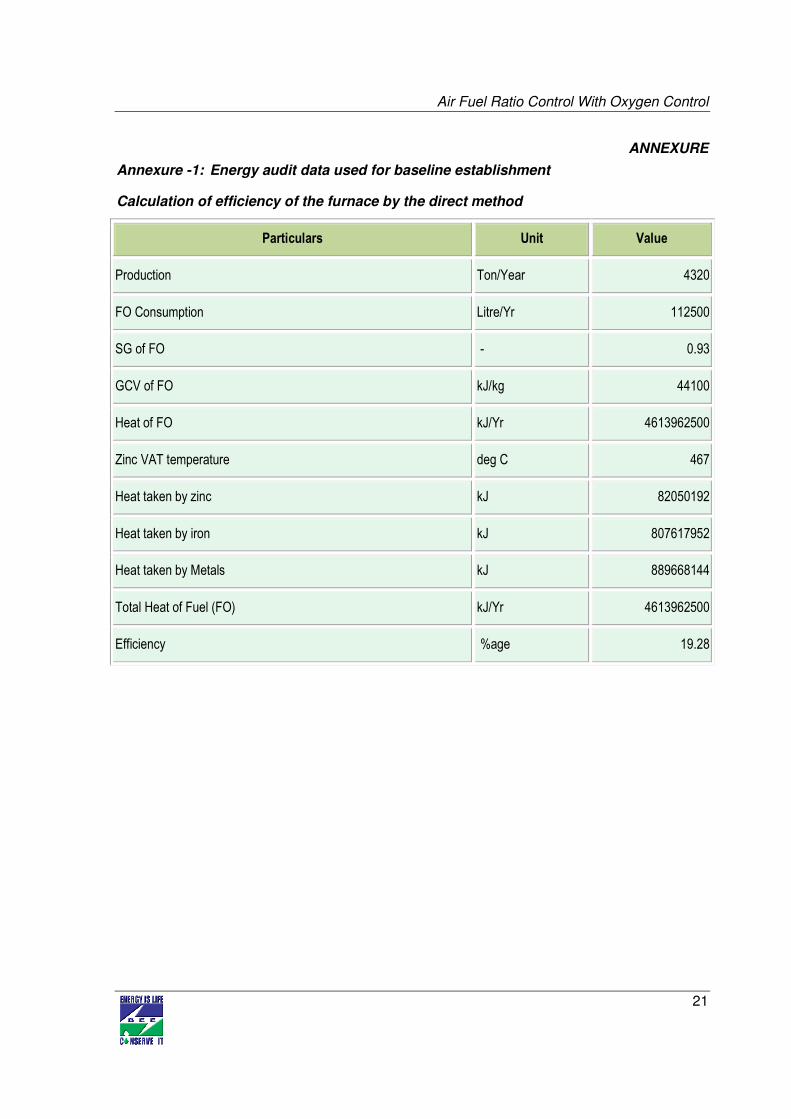
1.4.2 Operating efficiency analysis
Operating efficiency for the furnace is found to be 19.28%. The calculations are shown in
Annexure-1.
1.5 Barriers in adoption of proposed equipment
1.5.1 Technological barrier
In Howrah cluster, the technical understanding of the wire drawing process has been
excellent with several committed technical personnel having detailed know-how of the
processes involved. Some of them are visiting countries like China and European ones to find
the best possible technological solutions to the challenges in their units. Indeed there is
committed effort on the part of the management in such units to grasp alterations which may
give them benefits however with the caveat that the advantages be proven without any doubt.
People are generally reluctant to invest in an experimental scheme particularly if the sufficient
savings are not guaranteed. Hence, finding the first person, who is willing to implement a
change is still a challenge. While carrying out the audits and presenting the Energy audit
reports to the units, in the discussion with the plant owners & other personnel, many of them
agreed with many of the identified energy saving measures and technologies but they
demanded demonstration of the energy saving technologies in any plant and thereafter they
have readiness to follow.
1.5.2 Financial barrier
Discussions of financial issues with the units concluded that they are not scared of
investments. The larger units are confident of financing their own alterations while the smaller
units are certain to find good schemes from the banks to fund their respective efficiency
measures. However, the good part of the discussions was that more and more units are
taking energy conservation measures seriously and willing to go the distance. A mention
must be made of SIDBI whose schemes have attracted attention and can play a catalytic role
in the implementation of the measures.
1.5.3 Skilled manpower
Technical personnel in employed in the units are generally skilled workers but not engineers.
Thus the production process remains traditional. This is one of the main hindrances in
adopting newer technology. Specialized training among the workforce and local experts can
circumvent the problem significantly. Effective dissemination can enhance replication potential
in the various units. The gains obtained by one plant can inspire other units to follow suit.
Air Fuel Ratio Control With Oxygen Control
14
2. PROPOSED EQUIPMENT FOR ENERGY EFFICENCY IMPROVEMENT
2.1 Description of proposed equipment
2.1.1 Details of proposed equipment
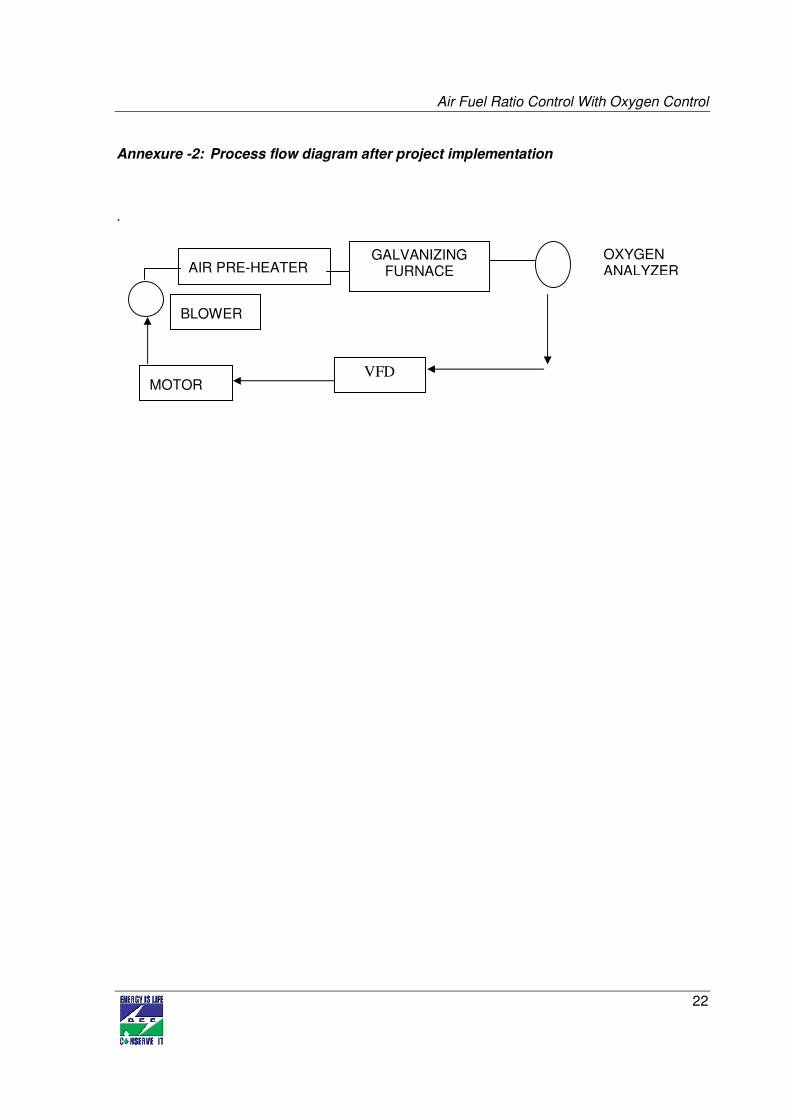
The suggested change measures the amount of oxygen in the flue gas and appropriately
controls the speed of a blower that adjusts the amount of air supplied to the furnace for
combustion. The VFD on the blower motor is programmable and changes the motor speed
according to the set conditions.
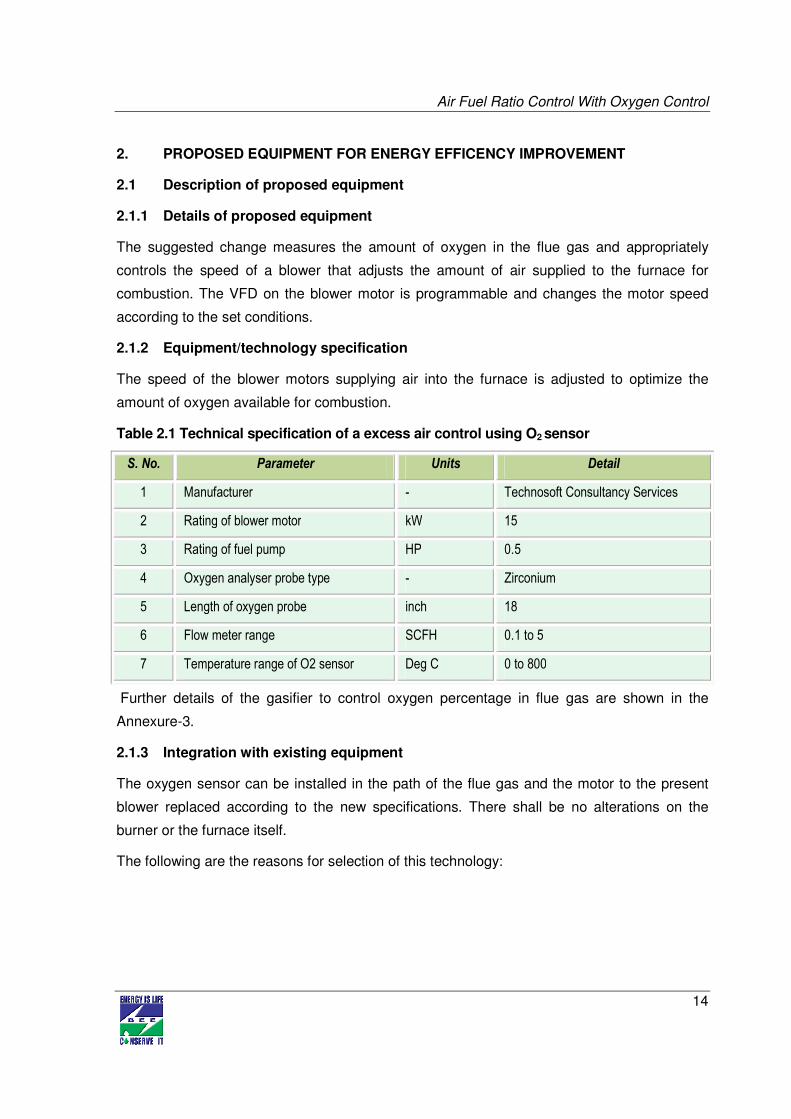
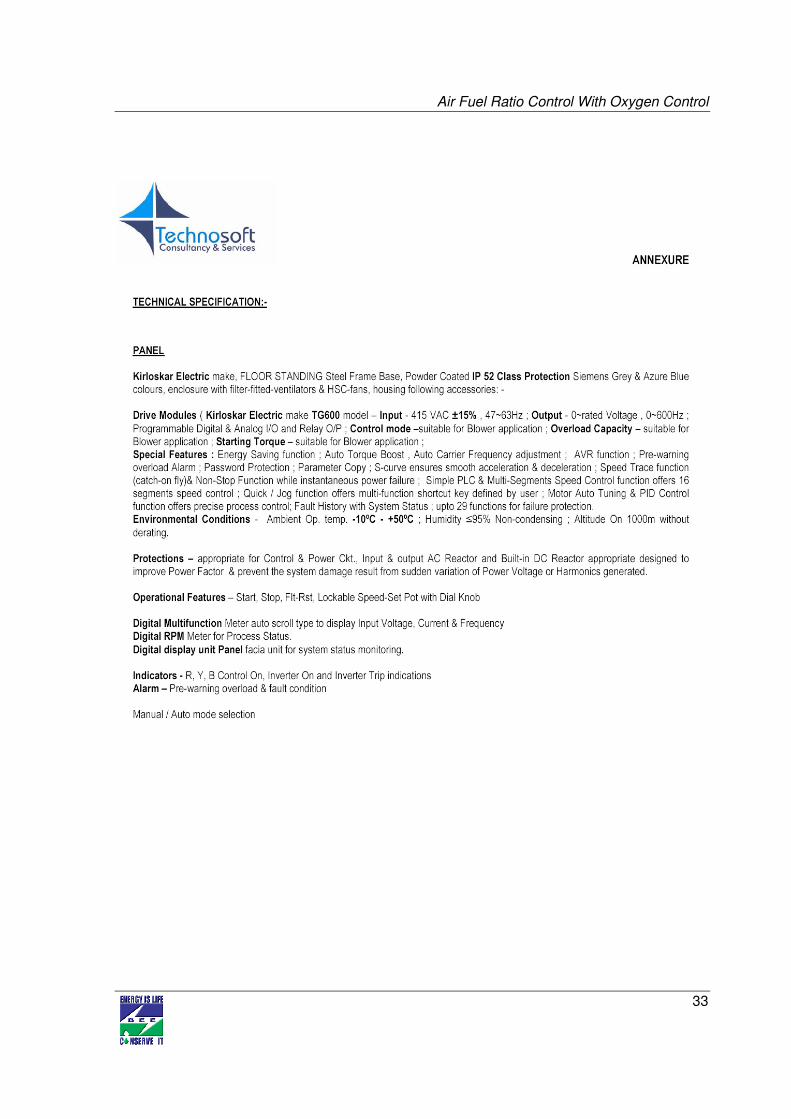
2.1.2 Equipment/technology specification
The speed of the blower motors supplying air into the furnace is adjusted to optimize the
amount of oxygen available for combustion.
Table 2.1 Technical specification of a excess air control using O2 sensor
S. No. Parameter Units Detail
1 Manufacturer - Technosoft Consultancy Services
2 Rating of blower motor kW 15
3 Rating of fuel pump HP 0.5
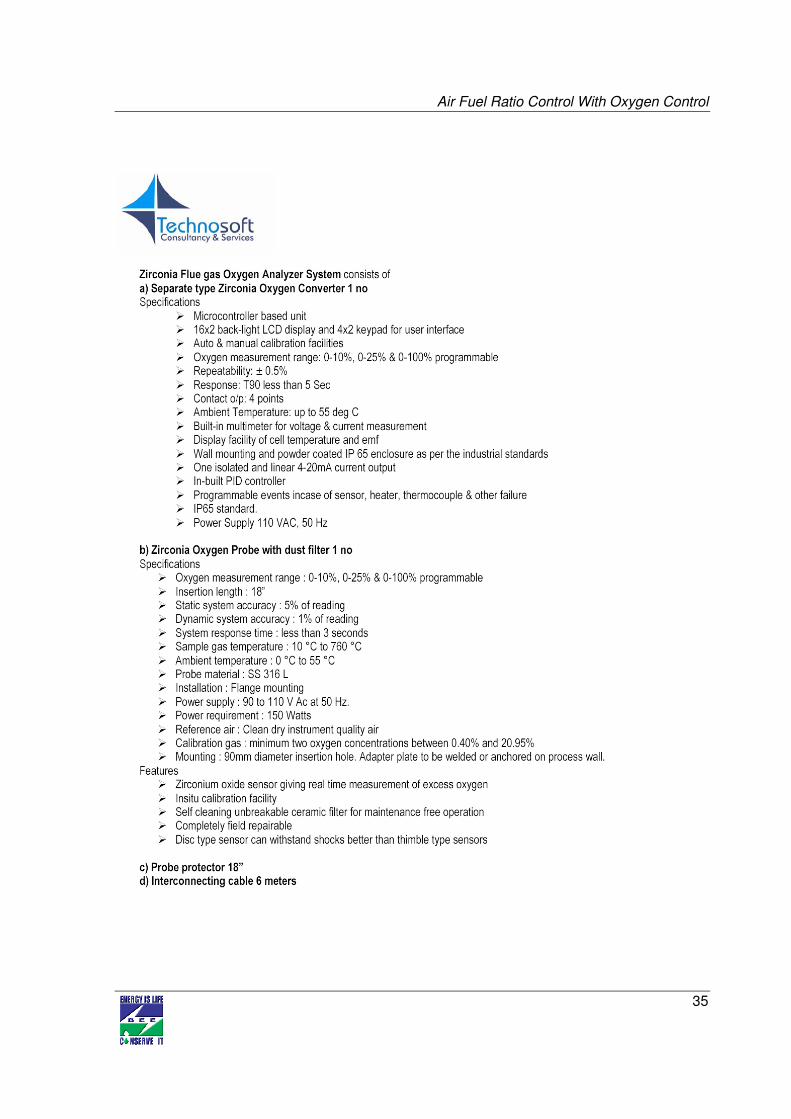
4 Oxygen analyser probe type - Zirconium
5 Length of oxygen probe inch 18
6 Flow meter range SCFH 0.1 to 5
7 Temperature range of O2 sensor Deg C 0 to 800
Further details of the gasifier to control oxygen percentage in flue gas are shown in the
Annexure-3.
2.1.3 Integration with existing equipment
The oxygen sensor can be installed in the path of the flue gas and the motor to the present
blower replaced according to the new specifications. There shall be no alterations on the
burner or the furnace itself.
The following are the reasons for selection of this technology:
Air Fuel Ratio Control With Oxygen Control
15
• It will reduce the total amount of fuel required and saves money.
• It reduces the GHG emissions and pollution because the combustion will be complete.
• This project is also applicable for getting the carbon credit benefits.
2.1.4 Superiority over existing system
Use of this technology reduces the amount of fuel required, not to mention the reduction in
GHG and toxic gases.
2.1.5 Source of equipment
Proposed technology has successfully been adopted and implemented throughout the
country and benefits reaped been established beyond doubt. There are no concerns of
scarcity of such devices and the prices are reasonable as well.
2.1.6 Availability of technology/equipment
Suppliers of this technology are available at local level as well as at national level very easily.
Such units supplied are found running in a number of applications for more than four decades
in India.
2.1.7 Service providers
Details of technology service providers are shown in Annexure-7.
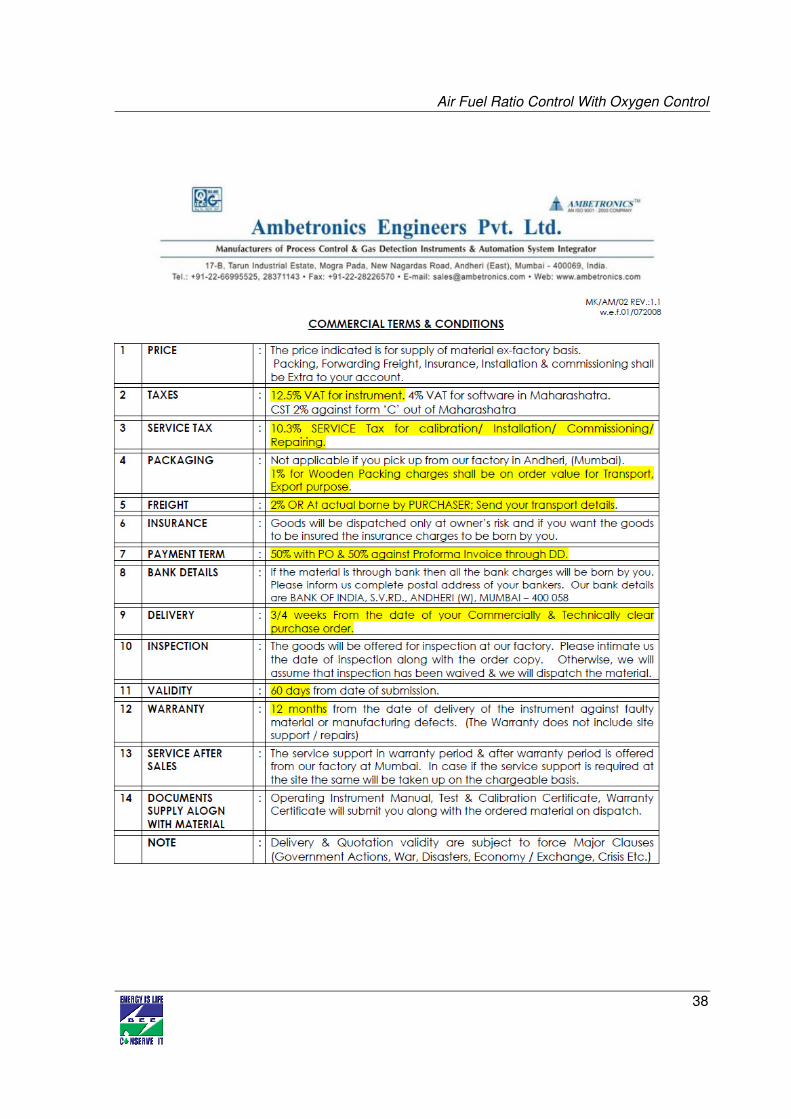
2.1.8 Terms and conditions in sales of equipment
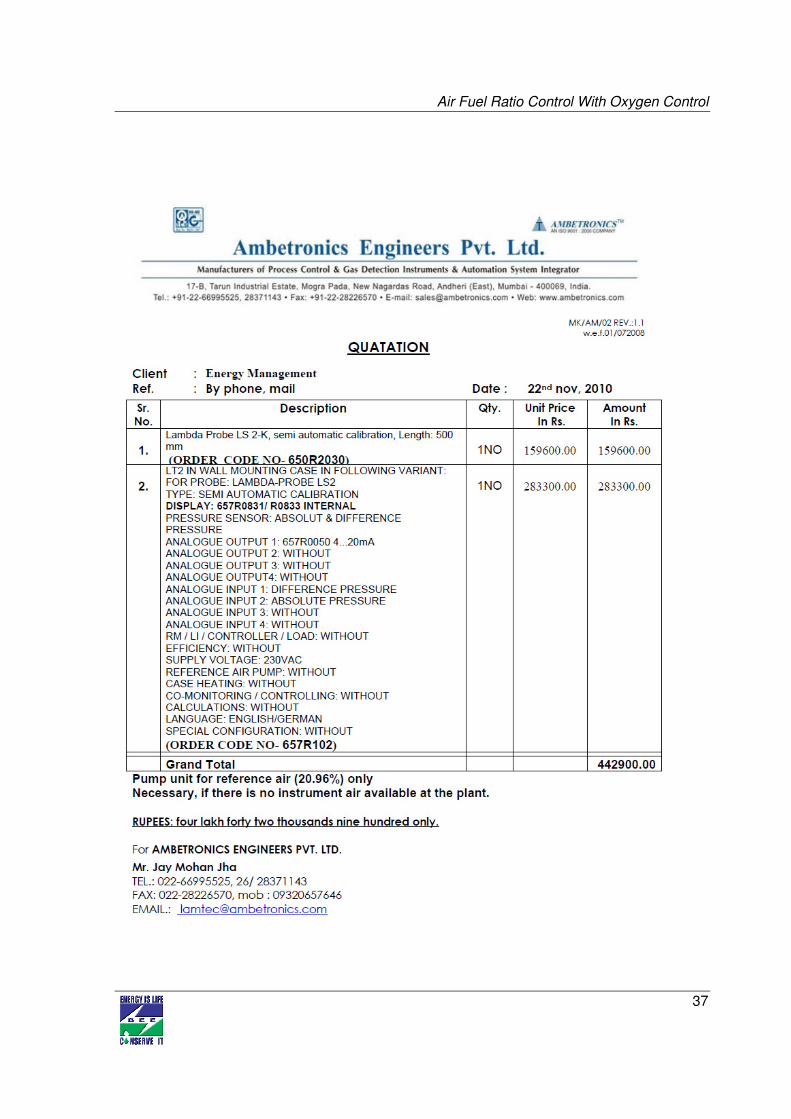
The company seeks 50% of the amount to be paid along with P.O. and the balance with taxes
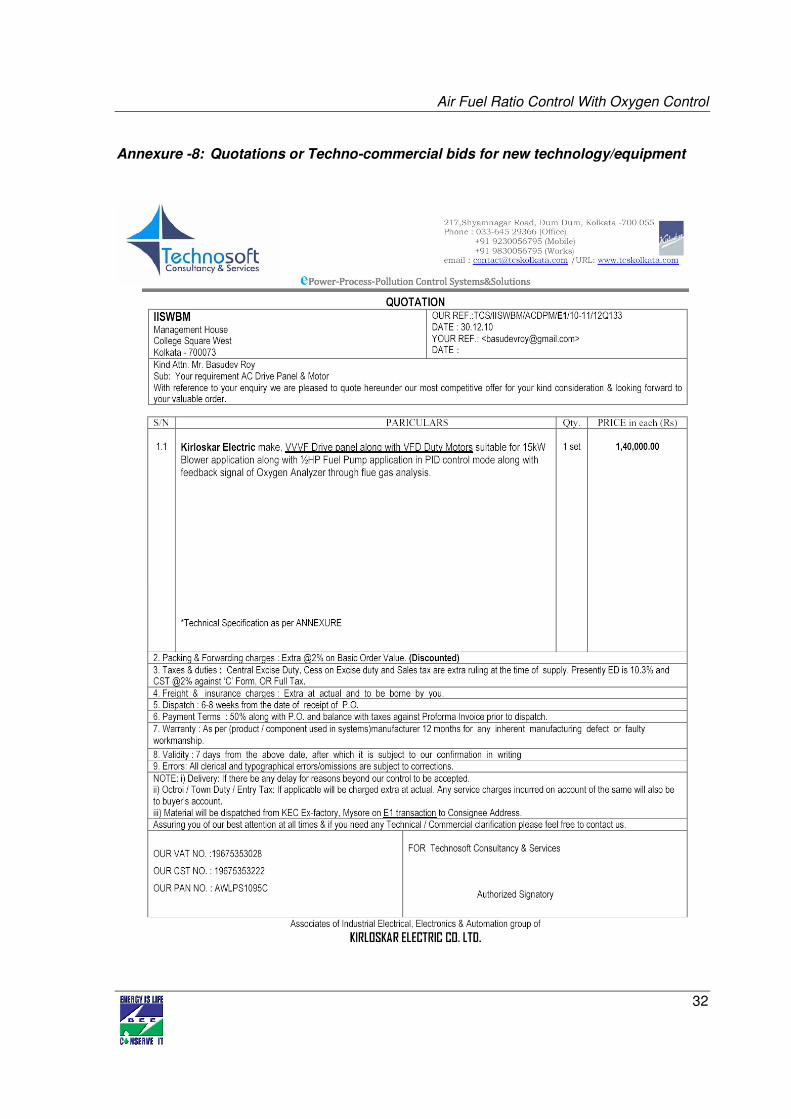
against Performa Invoice prior to dispatch as given in the Annexure-8.
2.1.9 Process down time
The down time might be 2-3 days for installing the oxygen sensor and placing a VFD on the
new blower motor. Detail of break up for process down time is given in Annexure 6.
2.2 Life cycle assessment and risks analysis
Life of the equipment is about 8 years. Risk involved in the implementation of proposed
project is the loss of flue gas at the position of induction of the oxygen sensor. This needs to
be plugged very carefully.
2.3 Suitable unit for Implementation of proposed technology
Suitable unit for implementation of this technology is a galvanizing unit having the production
capacity of about 4320 Ton/yr and having total furnace oil consumption about112500
litre/year. The unit is currently using SHC Coal for preheating but furnace oil for galvanizing.
Air Fuel Ratio Control With Oxygen Control
16
3. ECONOMIC BENEFITS FROM PROPOSED TECHNOLOGY
3.1 Technical benefit
3.1.1 Fuel saving
Installing the new system to detect the oxygen percentage in flue gas and adjust blower motor
speed accordingly saves 17400 litre of furnace oil per year as shown in Annexure – 3.
3.1.2 Electricity saving
Electricity saving would be possible due to installation of proposed technology but on the
safer side only fuel saving has been consider for calculating monetary benefit.
3.1.3 Improvement in product quality
The quality of the product would be improved on account of better heating.
3.1.4 Increase in production
The production will improve upon better combustion regulation from quality point of view and
that may also lead to little improvement in quantity as well as the rejection/repetition
decreases.
3.1.5 Reduction in raw material
The wastage of zinc during the process would be lower upon better combustion regulation.
3.1.6 Reduction in other losses
The other losses shall not be affected upon implementation of proposed technology.
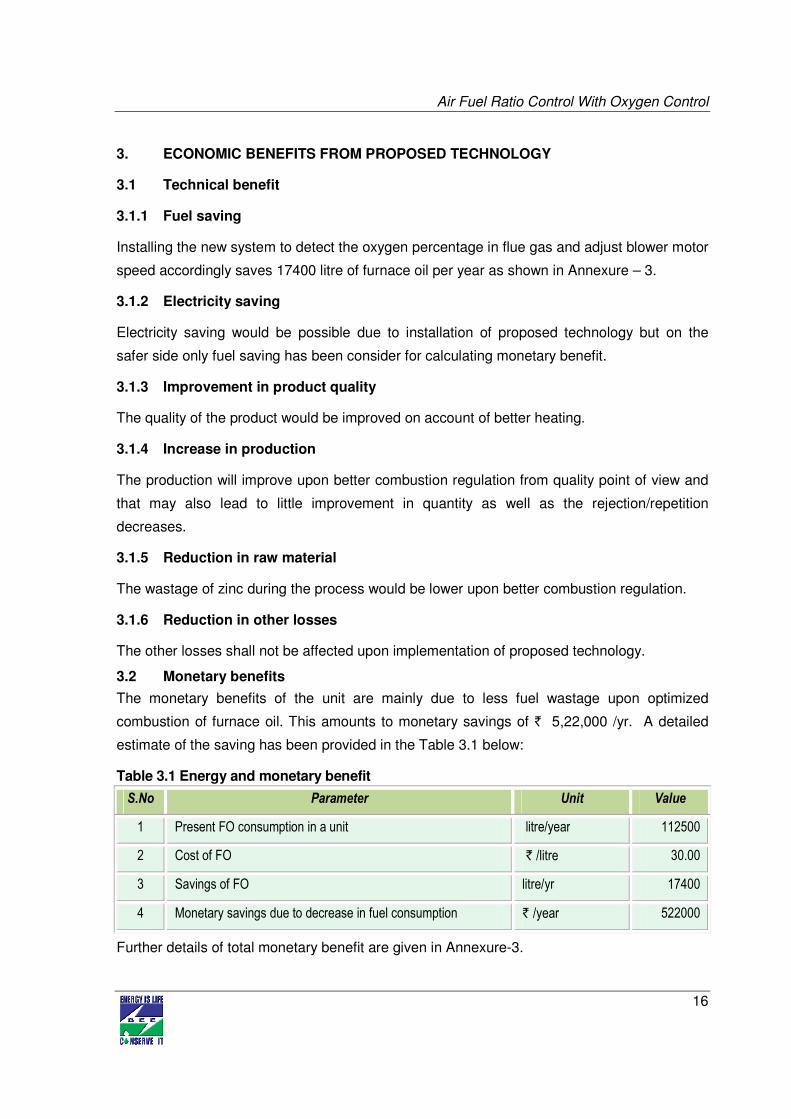
3.2 Monetary benefits
The monetary benefits of the unit are mainly due to less fuel wastage upon optimized
combustion of furnace oil. This amounts to monetary savings of ` 5,22,000 /yr. A detailed
estimate of the saving has been provided in the Table 3.1 below:
Table 3.1 Energy and monetary benefit
S.No Parameter Unit Value
1 Present FO consumption in a unit litre/year 112500
2 Cost of FO ` /litre 30.00
3 Savings of FO litre/yr 17400
4 Monetary savings due to decrease in fuel consumption ` /year 522000
Further details of total monetary benefit are given in Annexure-3.
Air Fuel Ratio Control With Oxygen Control
17
3.3 Social benefits
3.3.1 Improvement in working environment
The working environment will improve due to prevention of leakage from base of chimney.
3.3.2 Improvement in workers skill
The workers have to be trained according to the needs of the system.
3.4 Environmental benefits
3.4.1 Reduction in effluent generation
There would be less effluent generation since there would less fuel burned in the furnace.
Moreover, the generation of dross is reduced due to better temperature regulation.
3.4.2 Reduction in GHG emission
The measure helps in reducing CO2 emission upon burning less fuel and making the
combustion process more efficient. Total CO2 emission reduction would be about 55 ton per
year.
3.4.3 Reduction in other emissions like SOX
Significant amount of SOX and NOx emission will be reduced due to less fuel burned in the
new process.
Air Fuel Ratio Control With Oxygen Control
18
4. INSTALLATION OF PROPOSED EQUIPMENT
4.1 Cost of project
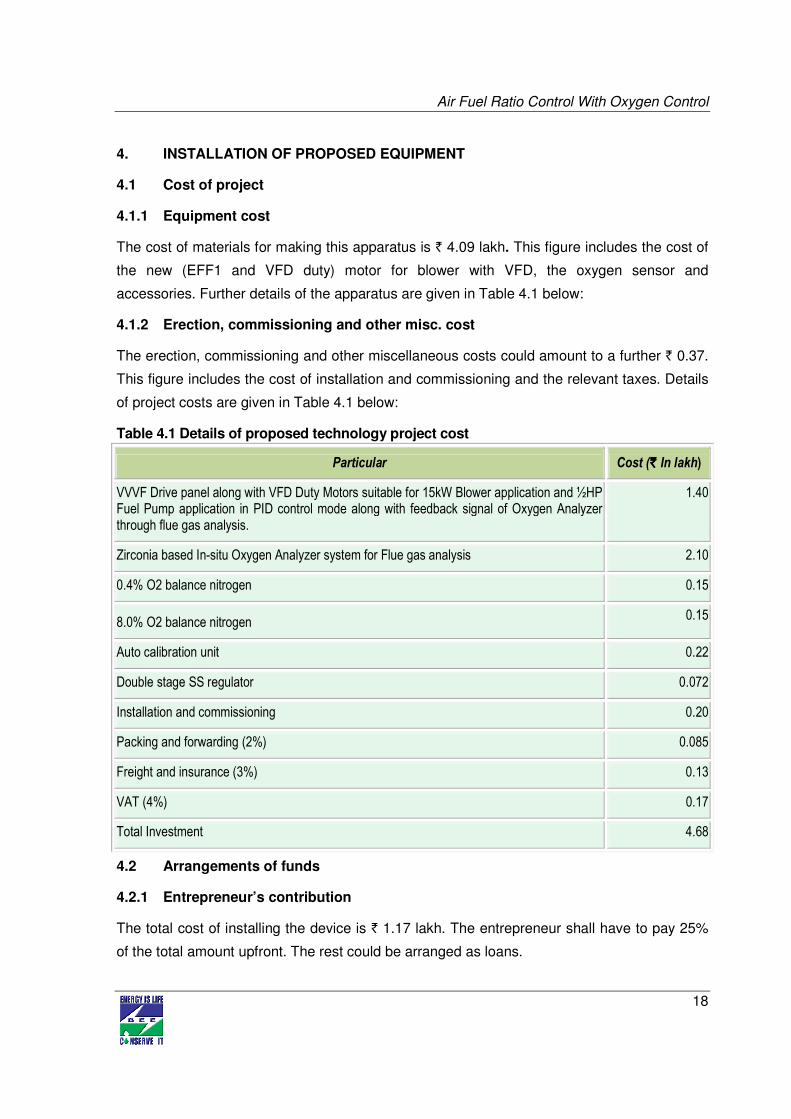
4.1.1 Equipment cost
The cost of materials for making this apparatus is ` 4.09 lakh. This figure includes the cost of
the new (EFF1 and VFD duty) motor for blower with VFD, the oxygen sensor and
accessories. Further details of the apparatus are given in Table 4.1 below:
4.1.2 Erection, commissioning and other misc. cost
The erection, commissioning and other miscellaneous costs could amount to a further ` 0.37.
This figure includes the cost of installation and commissioning and the relevant taxes. Details
of project costs are given in Table 4.1 below:
Table 4.1 Details of proposed technology project cost
Particular Cost (`̀̀̀ In lakh)
VVVF Drive panel along with VFD Duty Motors suitable for 15kW Blower application and ½HP Fuel Pump application in PID control mode along with feedback signal of Oxygen Analyzer through flue gas analysis.
1.40
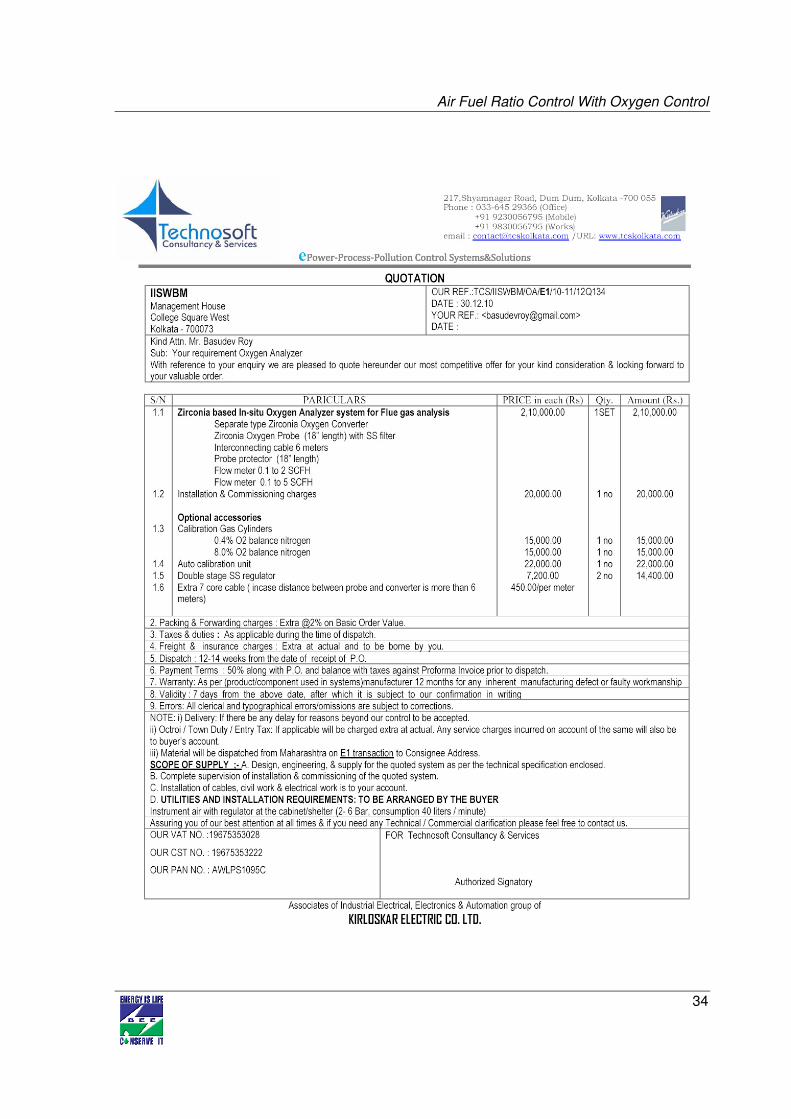
Zirconia based In-situ Oxygen Analyzer system for Flue gas analysis 2.10
0.4% O2 balance nitrogen 0.15
8.0% O2 balance nitrogen 0.15
Auto calibration unit 0.22
Double stage SS regulator 0.072
Installation and commissioning 0.20
Packing and forwarding (2%) 0.085
Freight and insurance (3%) 0.13
VAT (4%) 0.17
Total Investment 4.68
4.2 Arrangements of funds
4.2.1 Entrepreneur’s contribution
The total cost of installing the device is ` 1.17 lakh. The entrepreneur shall have to pay 25%
of the total amount upfront. The rest could be arranged as loans.
Air Fuel Ratio Control With Oxygen Control
19
4.2.2 Loan amount.
The loan amount is ` 3.51 lakh and from the MSME of the Government of India, which have
25% subsidy in some schemes.
4.2.3 Terms & conditions of loan
The interest rate is considered at 10%, which is SIDBI’s rate of interest for energy efficient
projects as shown in Annexure-9. The loan tenure is 5 years excluding initial moratorium
period for 6 months from the date of first disbursement of loan.
4.3 Financial indicators
4.3.1 Cash flow analysis
Profitability and cash flow statements have been worked out for a period of 8 years as given
in Annexure-4. The financials have been worked out on the basis of certain reasonable
assumptions, which are outlined below.
The project is expected to achieve monetary savings of ` 5.22 lakh/year.
• The Operation and Maintenance cost is estimated at 4% of cost of total project with
5% increase in every year as escalations.
• Interest on term loan is estimated at 10%.
• Depreciation is provided as per the rates provided in the companies act.
4.3.2 Simple payback period
The total cost of implementing the proposed technology is ` 4.68 lakh and monetary savings
is ` 5.22 lakh/year. Hence the simple payback period works out to be 11 months.
4.3.3 Net Present Value (NPV)
The net present value of the investment works out to be ` 14.65 lakh.
4.3.4 Internal rate of return (IRR)
The Internal rate of return of the project would be 86.62 %
4.3.5 Return on investment (ROI)
The average return on investment of the project activity works out at 29.15%.
Details of financial indicator are shown in Table 4.2 below:
Air Fuel Ratio Control With Oxygen Control
20
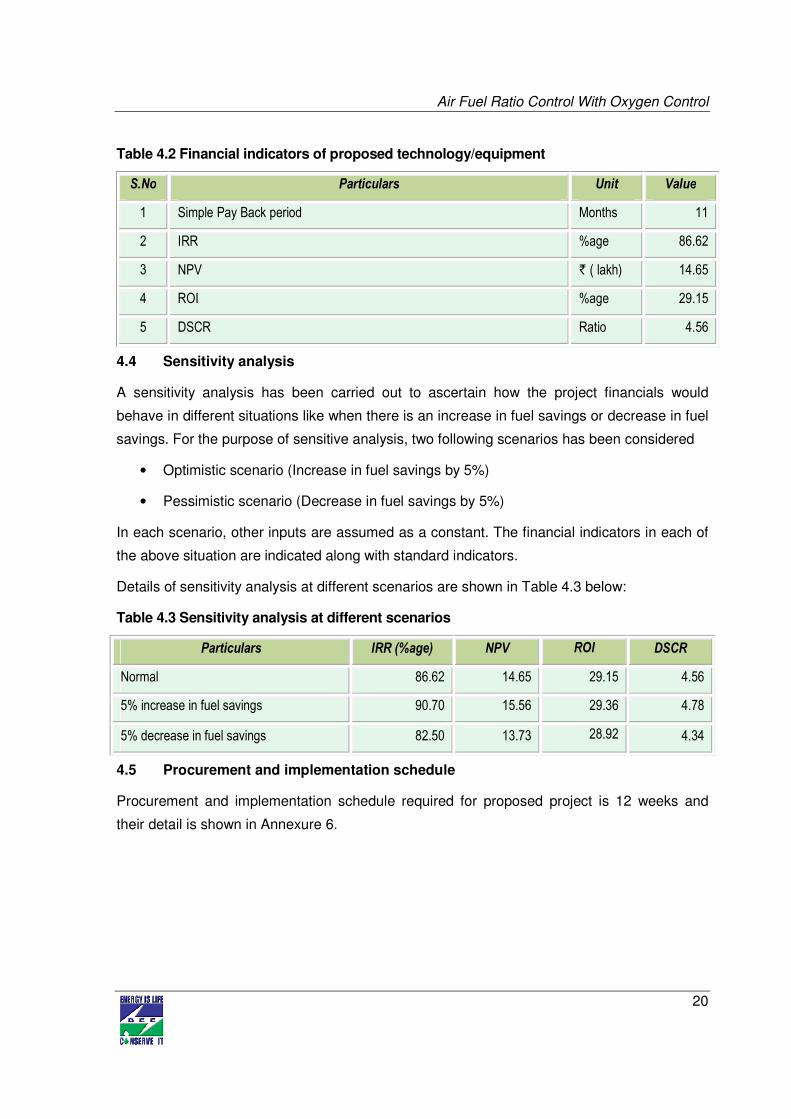
Table 4.2 Financial indicators of proposed technology/equipment
S.No Particulars Unit Value
1 Simple Pay Back period Months 11
2 IRR %age 86.62
3 NPV ` ( lakh) 14.65
4 ROI %age 29.15
5 DSCR Ratio 4.56
4.4 Sensitivity analysis
A sensitivity analysis has been carried out to ascertain how the project financials would
behave in different situations like when there is an increase in fuel savings or decrease in fuel
savings. For the purpose of sensitive analysis, two following scenarios has been considered
• Optimistic scenario (Increase in fuel savings by 5%)
• Pessimistic scenario (Decrease in fuel savings by 5%)
In each scenario, other inputs are assumed as a constant. The financial indicators in each of
the above situation are indicated along with standard indicators.
Details of sensitivity analysis at different scenarios are shown in Table 4.3 below:
Table 4.3 Sensitivity analysis at different scenarios
Particulars IRR (%age) NPV ROI DSCR
Normal 86.62 14.65 29.15 4.56
5% increase in fuel savings 90.70 15.56 29.36 4.78
5% decrease in fuel savings 82.50 13.73 28.92 4.34
4.5 Procurement and implementation schedule
Procurement and implementation schedule required for proposed project is 12 weeks and
their detail is shown in Annexure 6.
Air Fuel Ratio Control With Oxygen Control
21
ANNEXURE
Annexure -1: Energy audit data used for baseline establishment
Calculation of efficiency of the furnace by the direct method
Particulars Unit Value
Production Ton/Year 4320
FO Consumption Litre/Yr 112500
SG of FO - 0.93
GCV of FO kJ/kg 44100
Heat of FO kJ/Yr 4613962500
Zinc VAT temperature deg C 467
Heat taken by zinc kJ 82050192
Heat taken by iron kJ 807617952
Heat taken by Metals kJ 889668144
Total Heat of Fuel (FO) kJ/Yr 4613962500
Efficiency %age 19.28
Air Fuel Ratio Control With Oxygen Control
22
Annexure -2: Process flow diagram after project implementation
.
AIR PRE-HEATER GALVANIZING
FURNACE
VFD
OXYGEN ANALYZER
MOTOR
BLOWER
Air Fuel Ratio Control With Oxygen Control
23
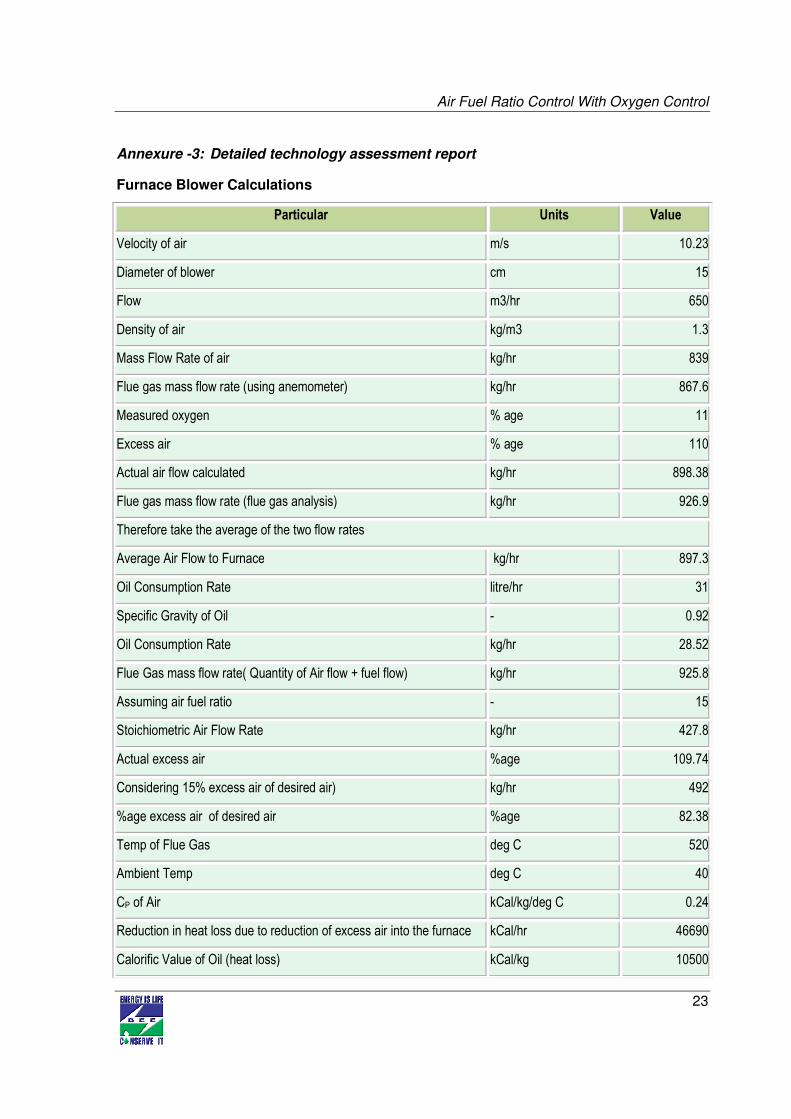
Annexure -3: Detailed technology assessment report
Furnace Blower Calculations
Particular Units Value
Velocity of air m/s 10.23
Diameter of blower cm 15
Flow m3/hr 650
Density of air kg/m3 1.3
Mass Flow Rate of air kg/hr 839
Flue gas mass flow rate (using anemometer) kg/hr 867.6
Measured oxygen % age 11
Excess air % age 110
Actual air flow calculated kg/hr 898.38
Flue gas mass flow rate (flue gas analysis) kg/hr 926.9
Therefore take the average of the two flow rates
Average Air Flow to Furnace kg/hr 897.3
Oil Consumption Rate litre/hr 31
Specific Gravity of Oil - 0.92
Oil Consumption Rate kg/hr 28.52
Flue Gas mass flow rate( Quantity of Air flow + fuel flow) kg/hr 925.8
Assuming air fuel ratio - 15
Stoichiometric Air Flow Rate kg/hr 427.8
Actual excess air %age 109.74
Considering 15% excess air of desired air) kg/hr 492
%age excess air of desired air %age 82.38
Temp of Flue Gas deg C 520
Ambient Temp deg C 40
CP of Air kCal/kg/deg C 0.24
Reduction in heat loss due to reduction of excess air into the furnace kCal/hr 46690
Calorific Value of Oil (heat loss) kCal/kg 10500
Air Fuel Ratio Control With Oxygen Control
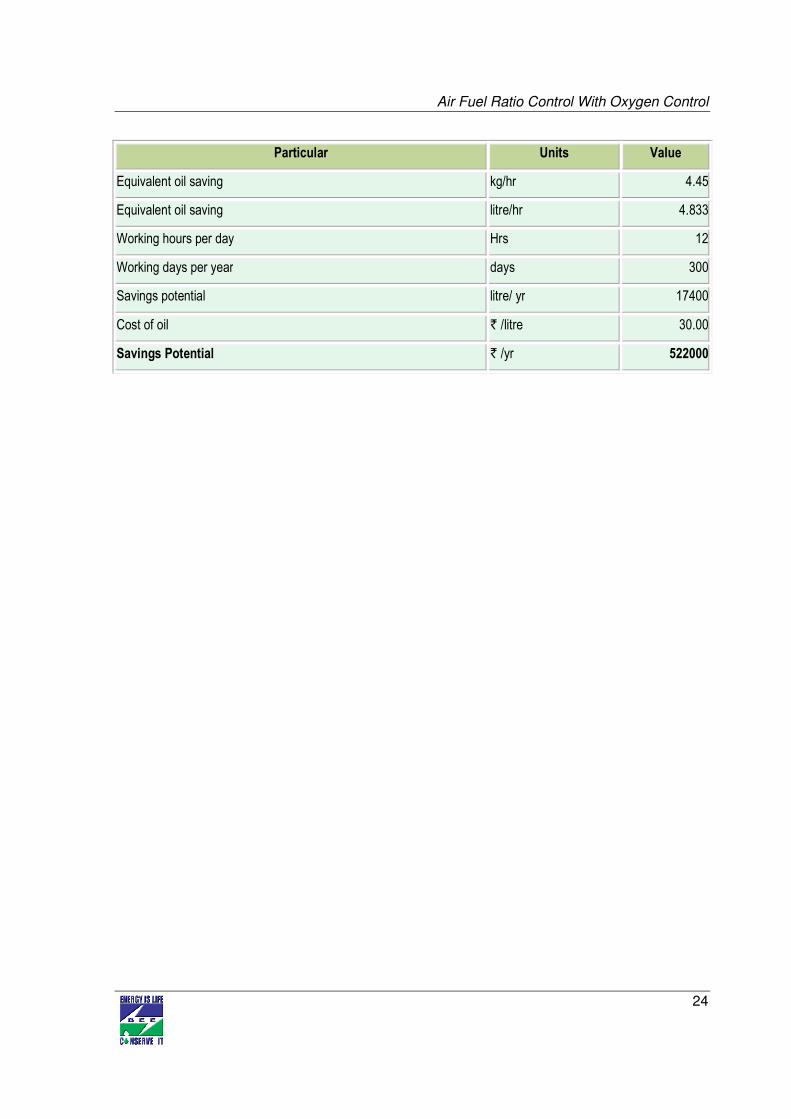
24
Particular Units Value
Equivalent oil saving kg/hr 4.45
Equivalent oil saving litre/hr 4.833
Working hours per day Hrs 12
Working days per year days 300
Savings potential litre/ yr 17400
Cost of oil ` /litre 30.00
Savings Potential ` /yr 522000
Air Fuel Ratio Control With Oxygen Control
25
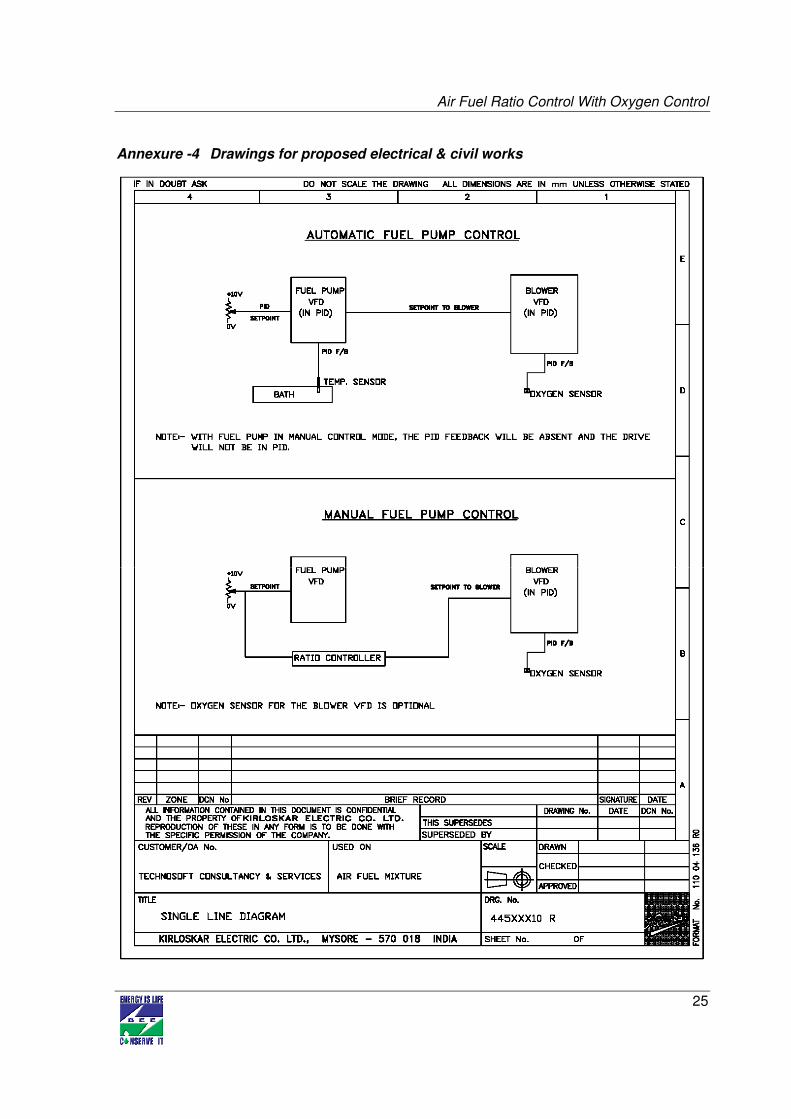
Annexure -4 Drawings for proposed electrical & civil works
Air Fuel Ratio Control With Oxygen Control
26
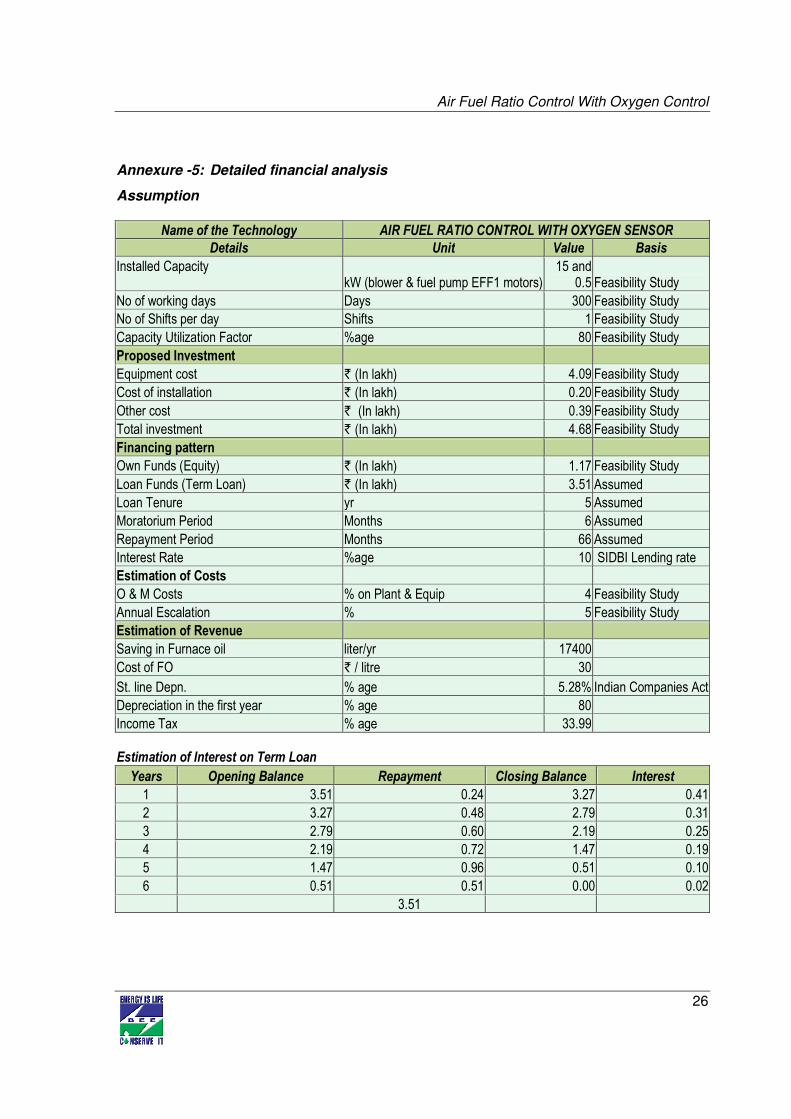
Annexure -5: Detailed financial analysis
Assumption
Name of the Technology AIR FUEL RATIO CONTROL WITH OXYGEN SENSOR
Details Unit Value Basis
Installed Capacity kW (blower & fuel pump EFF1 motors)
15 and 0.5 Feasibility Study
No of working days Days 300 Feasibility Study
No of Shifts per day Shifts 1 Feasibility Study
Capacity Utilization Factor %age 80 Feasibility Study
Proposed Investment
Equipment cost ` (In lakh) 4.09 Feasibility Study
Cost of installation ` (In lakh) 0.20 Feasibility Study
Other cost ` (In lakh) 0.39 Feasibility Study
Total investment ` (In lakh) 4.68 Feasibility Study
Financing pattern
Own Funds (Equity) ` (In lakh) 1.17 Feasibility Study
Loan Funds (Term Loan) ` (In lakh) 3.51 Assumed
Loan Tenure yr 5 Assumed
Moratorium Period Months 6 Assumed
Repayment Period Months 66 Assumed
Interest Rate %age 10 SIDBI Lending rate
Estimation of Costs
O & M Costs % on Plant & Equip 4 Feasibility Study
Annual Escalation % 5 Feasibility Study
Estimation of Revenue
Saving in Furnace oil liter/yr 17400
Cost of FO ` / litre 30
St. line Depn. % age 5.28% Indian Companies Act
Depreciation in the first year % age 80
Income Tax % age 33.99
Estimation of Interest on Term Loan
Years Opening Balance Repayment Closing Balance Interest
1 3.51 0.24 3.27 0.41
2 3.27 0.48 2.79 0.31
3 2.79 0.60 2.19 0.25
4 2.19 0.72 1.47 0.19
5 1.47 0.96 0.51 0.10
6 0.51 0.51 0.00 0.02
3.51
Air Fuel Ratio Control With Oxygen Control
27
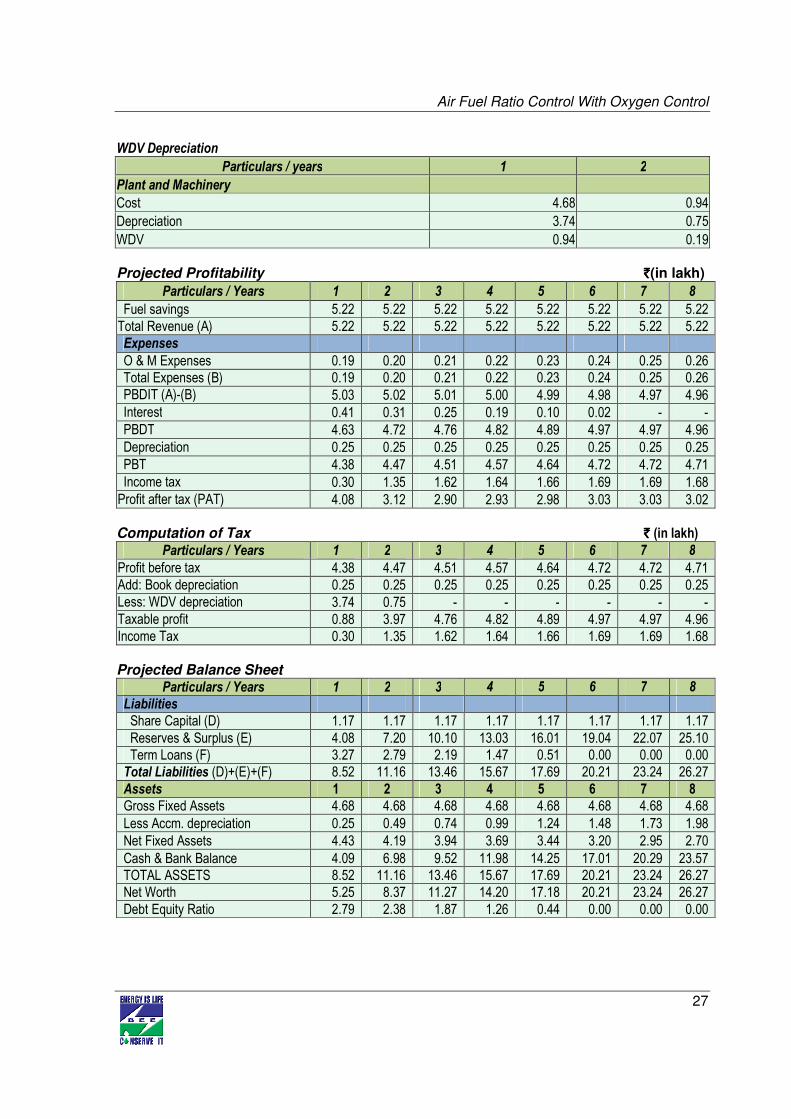
WDV Depreciation
Particulars / years 1 2
Plant and Machinery
Cost 4.68 0.94
Depreciation 3.74 0.75
WDV 0.94 0.19
Projected Profitability RsRsRsRs`̀̀̀(in lakh)
Particulars / Years 1 2 3 4 5 6 7 8
Fuel savings 5.22 5.22 5.22 5.22 5.22 5.22 5.22 5.22
Total Revenue (A) 5.22 5.22 5.22 5.22 5.22 5.22 5.22 5.22
Expenses
O & M Expenses 0.19 0.20 0.21 0.22 0.23 0.24 0.25 0.26
Total Expenses (B) 0.19 0.20 0.21 0.22 0.23 0.24 0.25 0.26
PBDIT (A)-(B) 5.03 5.02 5.01 5.00 4.99 4.98 4.97 4.96
Interest 0.41 0.31 0.25 0.19 0.10 0.02 - -
PBDT 4.63 4.72 4.76 4.82 4.89 4.97 4.97 4.96
Depreciation 0.25 0.25 0.25 0.25 0.25 0.25 0.25 0.25
PBT 4.38 4.47 4.51 4.57 4.64 4.72 4.72 4.71
Income tax 0.30 1.35 1.62 1.64 1.66 1.69 1.69 1.68
Profit after tax (PAT) 4.08 3.12 2.90 2.93 2.98 3.03 3.03 3.02
Computation of Tax RsRsRsRs`̀̀̀ (in lakh)
Particulars / Years 1 2 3 4 5 6 7 8
Profit before tax 4.38 4.47 4.51 4.57 4.64 4.72 4.72 4.71
Add: Book depreciation 0.25 0.25 0.25 0.25 0.25 0.25 0.25 0.25
Less: WDV depreciation 3.74 0.75 - - - - - -
Taxable profit 0.88 3.97 4.76 4.82 4.89 4.97 4.97 4.96
Income Tax 0.30 1.35 1.62 1.64 1.66 1.69 1.69 1.68
Projected Balance Sheet
Particulars / Years 1 2 3 4 5 6 7 8
Liabilities
Share Capital (D) 1.17 1.17 1.17 1.17 1.17 1.17 1.17 1.17
Reserves & Surplus (E) 4.08 7.20 10.10 13.03 16.01 19.04 22.07 25.10
Term Loans (F) 3.27 2.79 2.19 1.47 0.51 0.00 0.00 0.00
Total Liabilities (D)+(E)+(F) 8.52 11.16 13.46 15.67 17.69 20.21 23.24 26.27
Assets 1 2 3 4 5 6 7 8
Gross Fixed Assets 4.68 4.68 4.68 4.68 4.68 4.68 4.68 4.68
Less Accm. depreciation 0.25 0.49 0.74 0.99 1.24 1.48 1.73 1.98
Net Fixed Assets 4.43 4.19 3.94 3.69 3.44 3.20 2.95 2.70
Cash & Bank Balance 4.09 6.98 9.52 11.98 14.25 17.01 20.29 23.57
TOTAL ASSETS 8.52 11.16 13.46 15.67 17.69 20.21 23.24 26.27
Net Worth 5.25 8.37 11.27 14.20 17.18 20.21 23.24 26.27
Debt Equity Ratio 2.79 2.38 1.87 1.26 0.44 0.00 0.00 0.00
Air Fuel Ratio Control With Oxygen Control
28
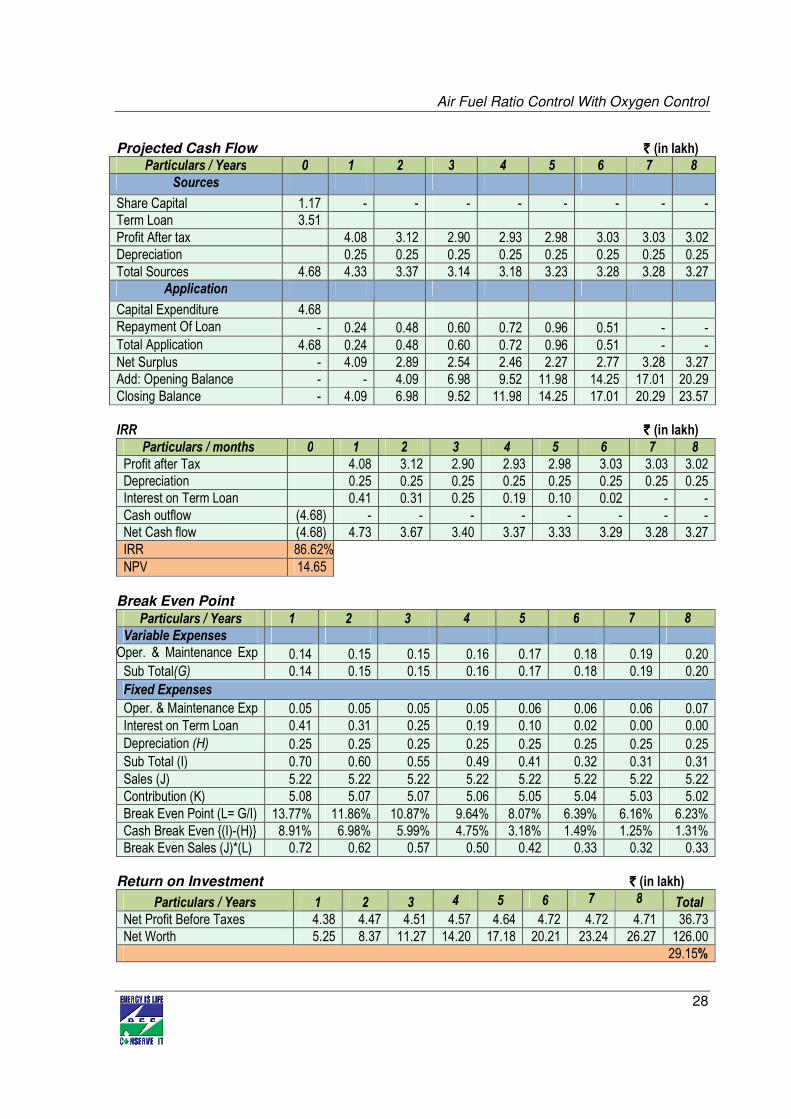
Projected Cash Flow RsRsRsRs`̀̀̀ (in lakh) Particulars / Years 0 1 2 3 4 5 6 7 8
Sources
Share Capital 1.17 - - - - - - - -
Term Loan 3.51
Profit After tax 4.08 3.12 2.90 2.93 2.98 3.03 3.03 3.02
Depreciation 0.25 0.25 0.25 0.25 0.25 0.25 0.25 0.25
Total Sources 4.68 4.33 3.37 3.14 3.18 3.23 3.28 3.28 3.27
Application
Capital Expenditure 4.68
Repayment Of Loan - 0.24 0.48 0.60 0.72 0.96 0.51 - -
Total Application 4.68 0.24 0.48 0.60 0.72 0.96 0.51 - -
Net Surplus - 4.09 2.89 2.54 2.46 2.27 2.77 3.28 3.27
Add: Opening Balance - - 4.09 6.98 9.52 11.98 14.25 17.01 20.29
Closing Balance - 4.09 6.98 9.52 11.98 14.25 17.01 20.29 23.57
IRR RsRsRsRs`̀̀̀ (in lakh)
Particulars / months 0 1 2 3 4 5 6 7 8
Profit after Tax 4.08 3.12 2.90 2.93 2.98 3.03 3.03 3.02
Depreciation 0.25 0.25 0.25 0.25 0.25 0.25 0.25 0.25
Interest on Term Loan 0.41 0.31 0.25 0.19 0.10 0.02 - -
Cash outflow (4.68) - - - - - - - -
Net Cash flow (4.68) 4.73 3.67 3.40 3.37 3.33 3.29 3.28 3.27
IRR 86.62%
NPV 14.65
Break Even Point
Particulars / Years 1 2 3 4 5 6 7 8
Variable Expenses
Oper. & Maintenance Exp (75%)
0.14 0.15 0.15 0.16 0.17 0.18 0.19 0.20
Sub Total(G) 0.14 0.15 0.15 0.16 0.17 0.18 0.19 0.20
Fixed Expenses
Oper. & Maintenance Exp (25%)
0.05 0.05 0.05 0.05 0.06 0.06 0.06 0.07
Interest on Term Loan 0.41 0.31 0.25 0.19 0.10 0.02 0.00 0.00
Depreciation (H) 0.25 0.25 0.25 0.25 0.25 0.25 0.25 0.25
Sub Total (I) 0.70 0.60 0.55 0.49 0.41 0.32 0.31 0.31
Sales (J) 5.22 5.22 5.22 5.22 5.22 5.22 5.22 5.22
Contribution (K) 5.08 5.07 5.07 5.06 5.05 5.04 5.03 5.02
Break Even Point (L= G/I) 13.77% 11.86% 10.87% 9.64% 8.07% 6.39% 6.16% 6.23%
Cash Break Even {(I)-(H)} 8.91% 6.98% 5.99% 4.75% 3.18% 1.49% 1.25% 1.31%
Break Even Sales (J)*(L) 0.72 0.62 0.57 0.50 0.42 0.33 0.32 0.33
Return on Investment `̀̀̀ (in lakh)
Particulars / Years 1 2 3 4 5 6 7 8 Total
Net Profit Before Taxes 4.38 4.47 4.51 4.57 4.64 4.72 4.72 4.71 36.73
Net Worth 5.25 8.37 11.27 14.20 17.18 20.21 23.24 26.27 126.00
29.15%
Air Fuel Ratio Control With Oxygen Control
29
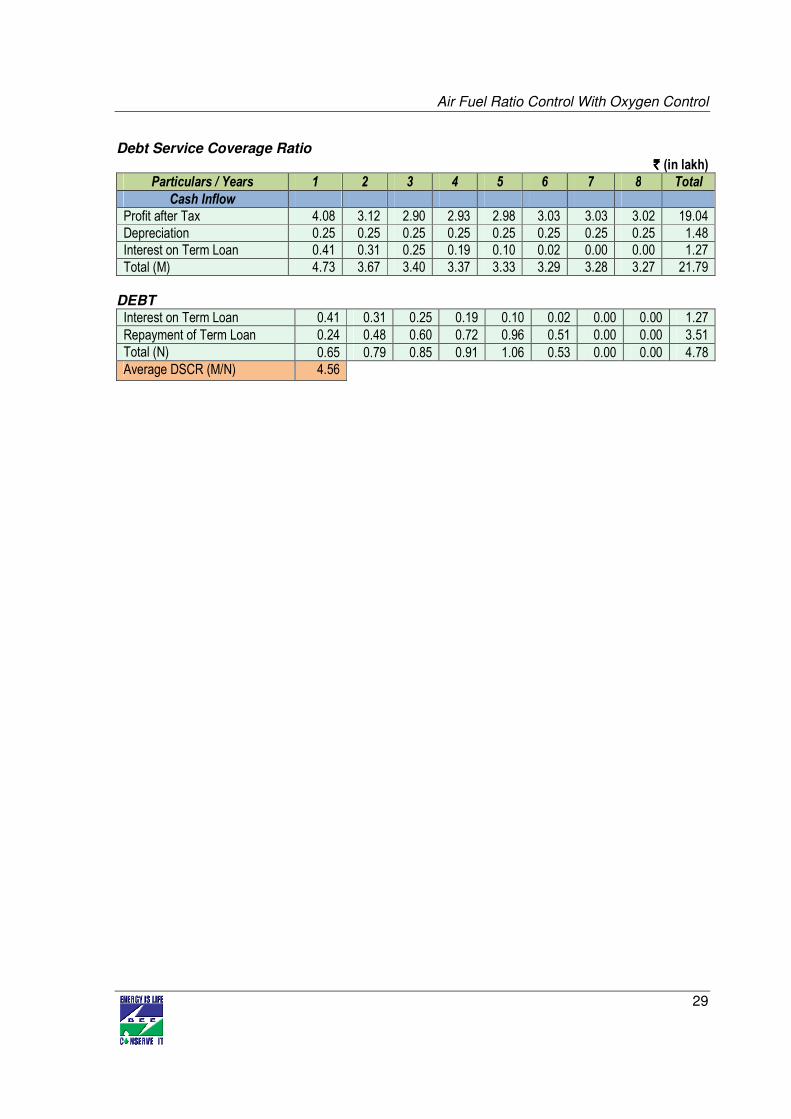
Debt Service Coverage Ratio `̀̀̀ (in lakh)
Particulars / Years 1 2 3 4 5 6 7 8 Total
Cash Inflow
Profit after Tax 4.08 3.12 2.90 2.93 2.98 3.03 3.03 3.02 19.04
Depreciation 0.25 0.25 0.25 0.25 0.25 0.25 0.25 0.25 1.48
Interest on Term Loan 0.41 0.31 0.25 0.19 0.10 0.02 0.00 0.00 1.27
Total (M) 4.73 3.67 3.40 3.37 3.33 3.29 3.28 3.27 21.79
DEBT Interest on Term Loan 0.41 0.31 0.25 0.19 0.10 0.02 0.00 0.00 1.27
Repayment of Term Loan 0.24 0.48 0.60 0.72 0.96 0.51 0.00 0.00 3.51
Total (N) 0.65 0.79 0.85 0.91 1.06 0.53 0.00 0.00 4.78
Average DSCR (M/N) 4.56
Air Fuel Ratio Control With Oxygen Control
30
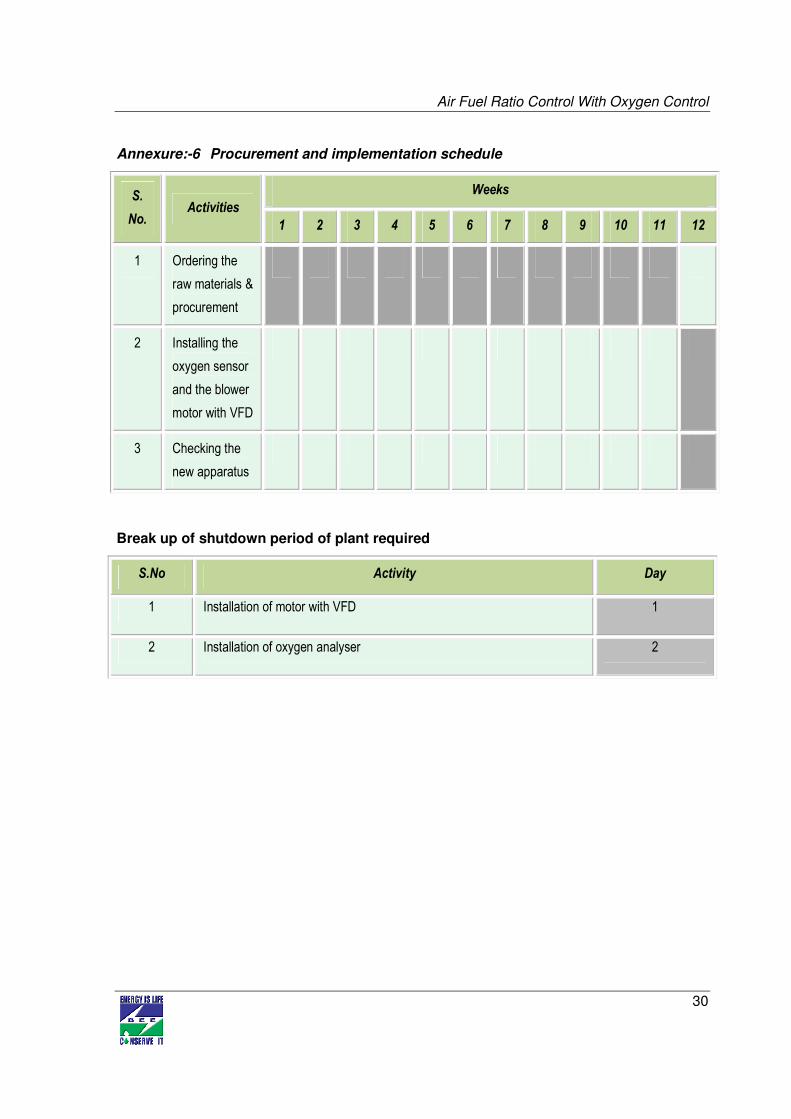
Annexure:-6 Procurement and implementation schedule
S.
No. Activities
Weeks
1 2 3 4 5 6 7 8 9 10 11 12
1 Ordering the
raw materials &
procurement
2 Installing the
oxygen sensor
and the blower
motor with VFD
3 Checking the
new apparatus
Break up of shutdown period of plant required
S.No Activity Day
1 Installation of motor with VFD 1
2 Installation of oxygen analyser 2
Air Fuel Ratio Control With Oxygen Control
31
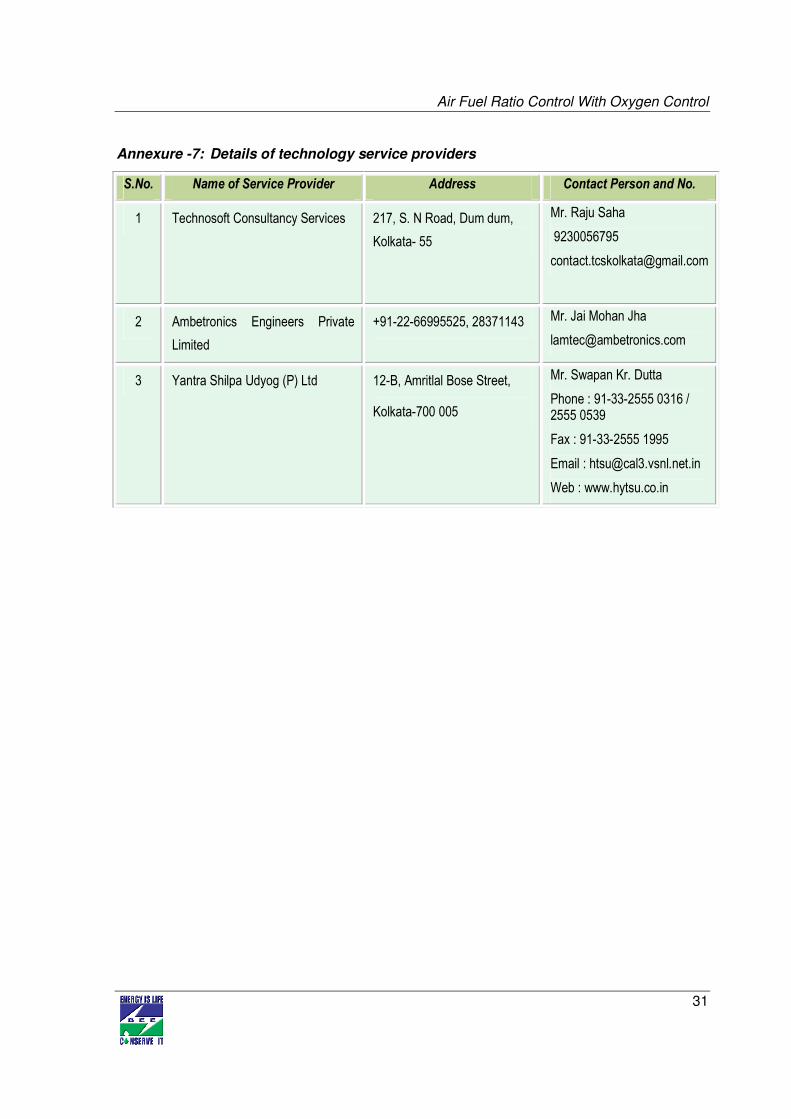
Annexure -7: Details of technology service providers
S.No. Name of Service Provider Address Contact Person and No.
1 Technosoft Consultancy Services 217, S. N Road, Dum dum,
Kolkata- 55
Mr. Raju Saha
9230056795
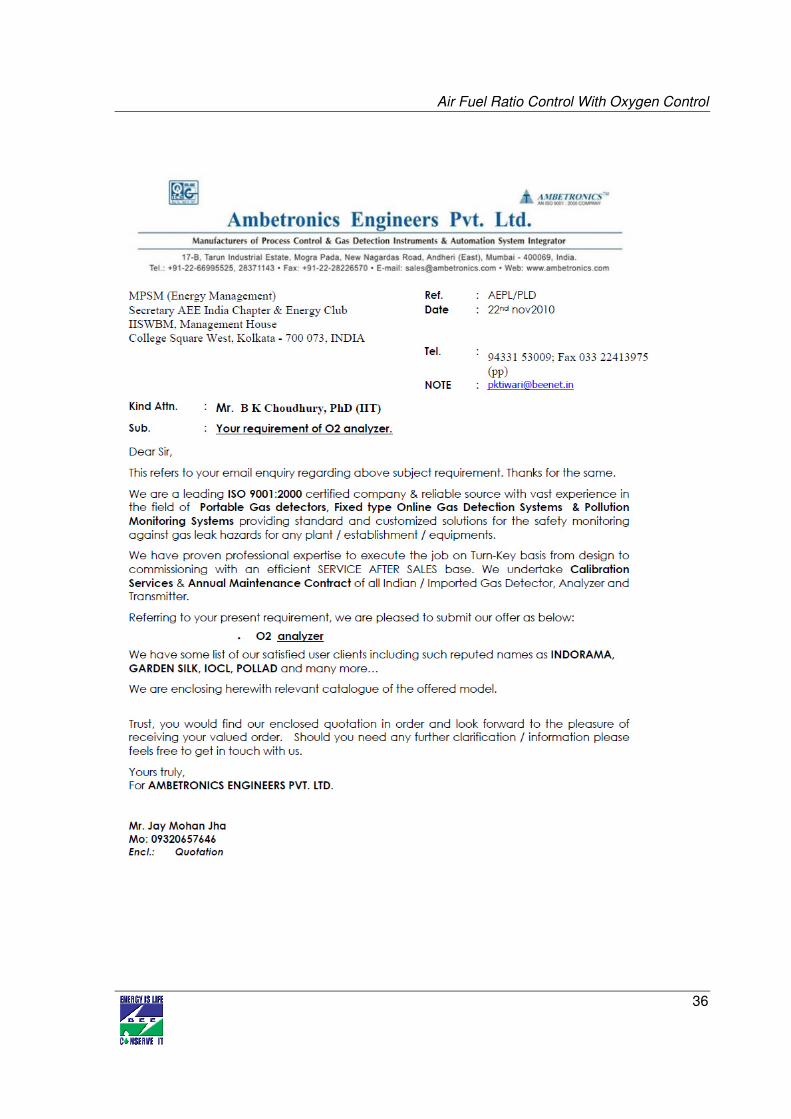
2 Ambetronics Engineers Private
Limited
+91-22-66995525, 28371143 Mr. Jai Mohan Jha
3 Yantra Shilpa Udyog (P) Ltd 12-B, Amritlal Bose Street,
Kolkata-700 005
Mr. Swapan Kr. Dutta
Phone : 91-33-2555 0316 / 2555 0539
Fax : 91-33-2555 1995
Email : [email protected]
Web : www.hytsu.co.in
Air Fuel Ratio Control With Oxygen Control
32
Annexure -8: Quotations or Techno-commercial bids for new technology/equipment
Air Fuel Ratio Control With Oxygen Control
33
Air Fuel Ratio Control With Oxygen Control
34
Air Fuel Ratio Control With Oxygen Control
35
Air Fuel Ratio Control With Oxygen Control
36
Air Fuel Ratio Control With Oxygen Control
37
Air Fuel Ratio Control With Oxygen Control
38
Air Fuel Ratio Control With Oxygen Control
39
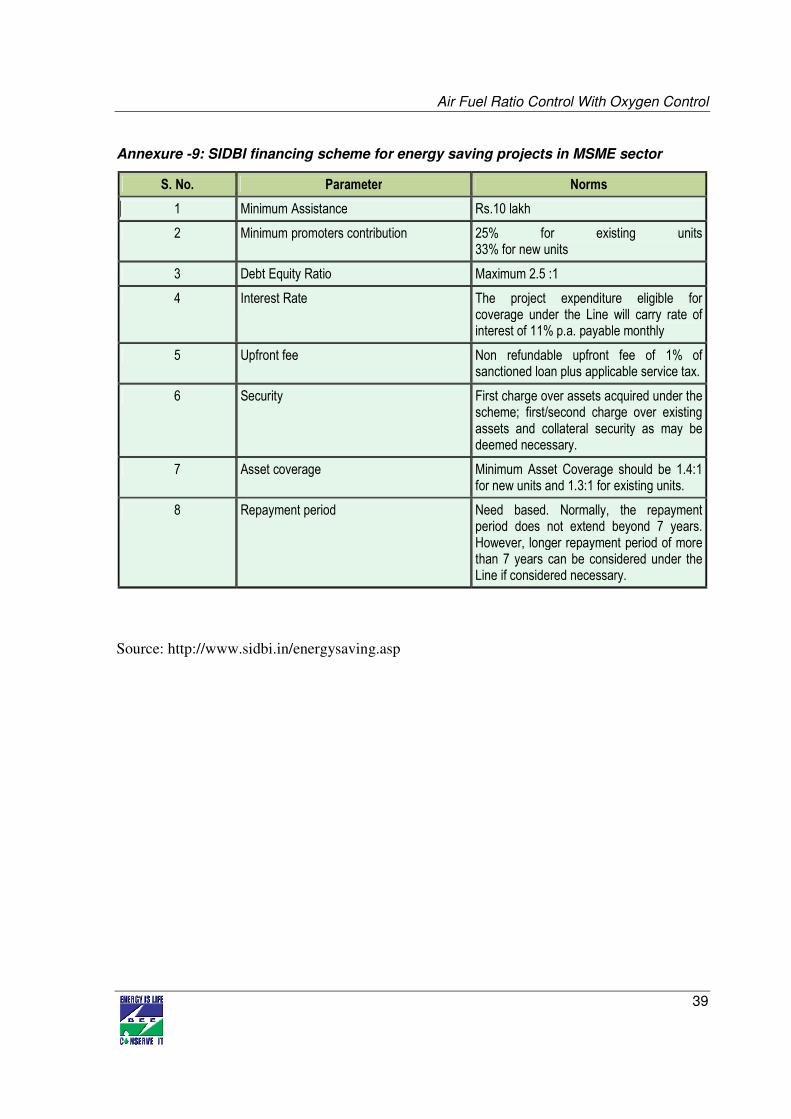
Annexure -9: SIDBI financing scheme for energy saving projects in MSME sector
S. No. Parameter Norms
1 Minimum Assistance Rs.10 lakh
2 Minimum promoters contribution 25% for existing units 33% for new units
3 Debt Equity Ratio Maximum 2.5 :1
4 Interest Rate The project expenditure eligible for coverage under the Line will carry rate of interest of 11% p.a. payable monthly
5 Upfront fee Non refundable upfront fee of 1% of sanctioned loan plus applicable service tax.
6 Security First charge over assets acquired under the scheme; first/second charge over existing assets and collateral security as may be deemed necessary.
7 Asset coverage Minimum Asset Coverage should be 1.4:1 for new units and 1.3:1 for existing units.
8 Repayment period Need based. Normally, the repayment period does not extend beyond 7 years. However, longer repayment period of more than 7 years can be considered under the Line if considered necessary.
Source: http://www.sidbi.in/energysaving.asp

India SME Technology Services Ltd DFC Building, Plot No.37-38, D-Block, Pankha Road, Institutional Area, Janakpuri, New Delhi-110058 Tel: +91-11-28525534, Fax: +91-11-28525535 Website: www.techsmall.com
Bureau of Energy Efficiency (BEE) (Ministry of Power, Government of India) 4th Floor, Sewa Bhawan, R. K. Puram, New Delhi – 110066 Ph.: +91 – 11 – 26179699 (5 Lines), Fax: +91 – 11 – 26178352
Websites: www.bee-india.nic.in, www.energymanagertraining.com
Recommended