Roadshow Presentation
31 October – 2 November 2016
The information contained herein has been prepared by ASELSAN (the Company). The opinionspresented herein are based on general information gathered at the time of writing and are subjectto change without notice.
These materials contain statements about future events and expectations that are forward-lookingstatements. Any statement in these materials that is not a statement of historical fact is a forward-looking statement that involves known and unknown risks, uncertainties and other factors whichmay cause our actual results, performance or achievements to be materially different from anyfuture results, performance or achievements expressed or implied by such forward-lookingstatements. Except to the extent required by law, we assume no obligations to update the forward-looking statements contained herein to reflect actual results, changes in assumptions or changes infactors affecting these statements.
This presentation does not constitute an offer or invitation to sell, or any solicitation of any offer tosubscribe for or purchase any securities and nothing contained herein shall form the basis of anycontract or commitment whatsoever. No reliance may be placed for any purposes whatsoever onthe information contained in this presentation or on its completeness, accuracy or fairness. None ofthe Company nor any of its shareholders, directors, officers or employees nor any other personaccepts any liability whatsoever for any loss howsoever arising from any use of this presentation orits contents or otherwise arising in connection therewith.
FORWARD LOOKING STATEMENTS
Global Defense Market & Business Overview
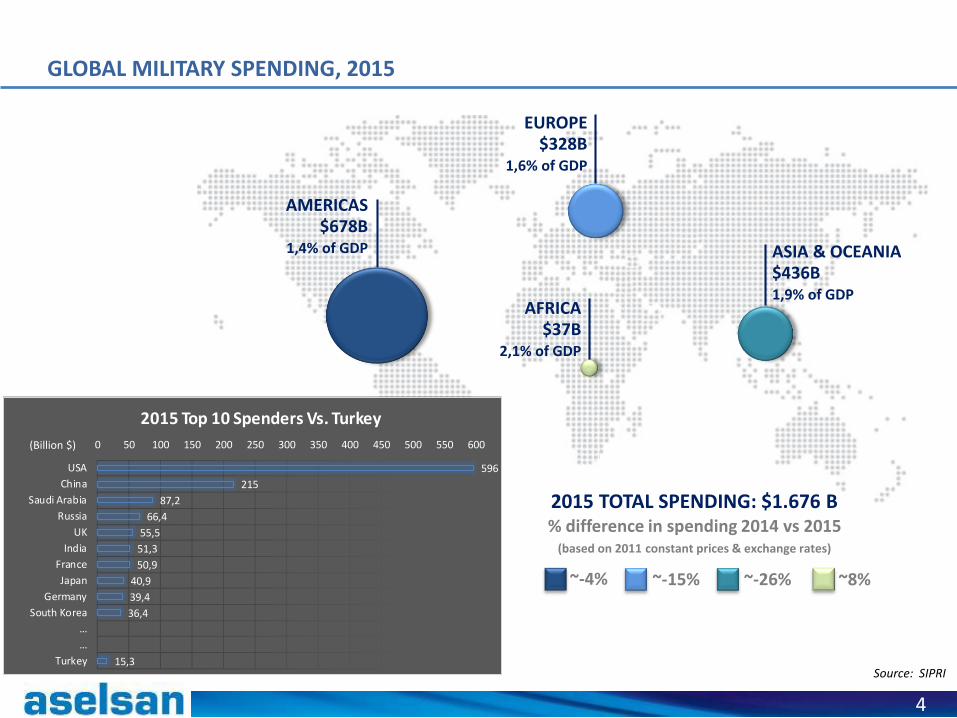
AMERICAS$678B
1,4% of GDP
EUROPE$328B
1,6% of GDP
AFRICA$37B
2,1% of GDP
ASIA & OCEANIA$436B1,9% of GDP
4
GLOBAL MILITARY SPENDING, 2015
Source: SIPRI
2015 TOTAL SPENDING: $1.676 B% difference in spending 2014 vs 2015
(based on 2011 constant prices & exchange rates)
~-15% ~-26% ~8%~-4%
596
215
87,2
66,4
55,5
51,3
50,9
40,9
39,4
36,4
15,3
0 50 100 150 200 250 300 350 400 450 500 550 600
USA
China
Saudi Arabia
Russia
UK
India
France
Japan
Germany
South Korea
…
…
Turkey
2015 Top 10 Spenders Vs. Turkey
(Billion $)

Source: SIPRI
As being the 2nd biggest army in NATO, Turkey has healthy growth rate of defense budget.
MILITARY SPENDING as % of GDP (TURKEY)
5
2,5%
2,3% 2,3%
2,6%
2,4%
2,2%2,3% 2,3%
2,2%2,1%
0
200
400
600
800
1.000
1.200
1.400
0,00%
1,00%
2,00%
3,00%
2006 2007 2008 2009 2010 2011 2012 2013 2014 2015
GD
P (B
illi
on
$ -
no
min
al t
erm
s)
Mili
tary
Sp
en
din
g a
s %
of G
DP
BALANCED GROWTH OF TURKISH MILITARY SPENDING

345
510 505
666 672
772
926 887 904
1.200
0
200
400
600
800
1.000
1.200
1.400
2007 2008 2009 2010 2011 2012 2013 2014 2015 2016E
Mill
ion
US
$
Defense Sector R&D Expenditure
0,620,78 0,83 0,85
1,091,26
1,57
1,86 1,93 2,00
0,00
0,50
1,00
1,50
2,00
2,50
2007 2008 2009 2010 2011 2012 2013 2014 2015 2016E
Bill
ion
US
$
Defense Sector Export Revenue
2,443,09 2,90
3,714,38
4,76 5,08 5,10 4,90
8,00
0,00
2,00
4,00
6,00
8,00
10,00
2007 2008 2009 2010 2011 2012 2013 2014 2015 2016E
Bill
ion
US
$
Defense Sector Revenue
Source: SASAD
RealizedGovernment Goal
6
Turkey’s defense procurement strategy targeting self sufficiency and fostering local production.
TURKISH DEFENSE INDUSTRY GROWING OVER YEARS
36,7%41,6% 44,2% 45,7%
52,1% 54,0%
70,0%
0%
10%
20%
30%
40%
50%
60%
70%
80%
2006 2007 2008 2009 2010 2011 … 2016E
Local Content in UDI's Procurement

Source: Defense News Top 100 Worldwide List
7
ASELSAN CONTINUING TO CLIMB UP
20062007
20082009
20102011
20122013
20142015
……
… 20XX
ASELSAN Global Defense Ranking
97.
90. 93.
86.
80.76.
74.
67.62.
50.
58.

TAFF BOARD OF TRUSTEES
- Minister of National Defense (Chairman)
- Deputy Chief of General Staff
- Undersecretary of the Ministry of National Defense
- Undersecretary of Defense Industry
TAFF
ASELSAN TAI ROKETSAN HAVELSAN ASPİLSAN İŞBİR
• TAFF was established by the merger of Land, Navy and Air Forces Foundations.• TAFF’s objective is to enhance the warfare capability of Turkish Armed Forces through national defense
industry.• TAFF owns several defense companies operating in separate fields.• The only privilege TAFF has is nominating 6 members of the 9 members of Board of Directors.
8
MAIN SHAREHOLDER - TURKISH ARMED FORCES FOUNDATION (TAFF)

9
KEY ACHIEVEMENTS TO DATE IN 2016
Outstanding level of new contracts in 2016: 5,2 Billion TL ( ̴ 2 Billion USD)
Outstanding level of backlog as of 2016: 19,3 Billion TL ( ̴ 6 Billion USD)
236 Million USD worth of new export contracts awarded in 15 countries
Ongoing negotiations for a strategic JV in Saudi Arabia (Electronic Warfare + Radar)
Major air defense system serial production contract awarded
Major public security (non-defense) contract signed
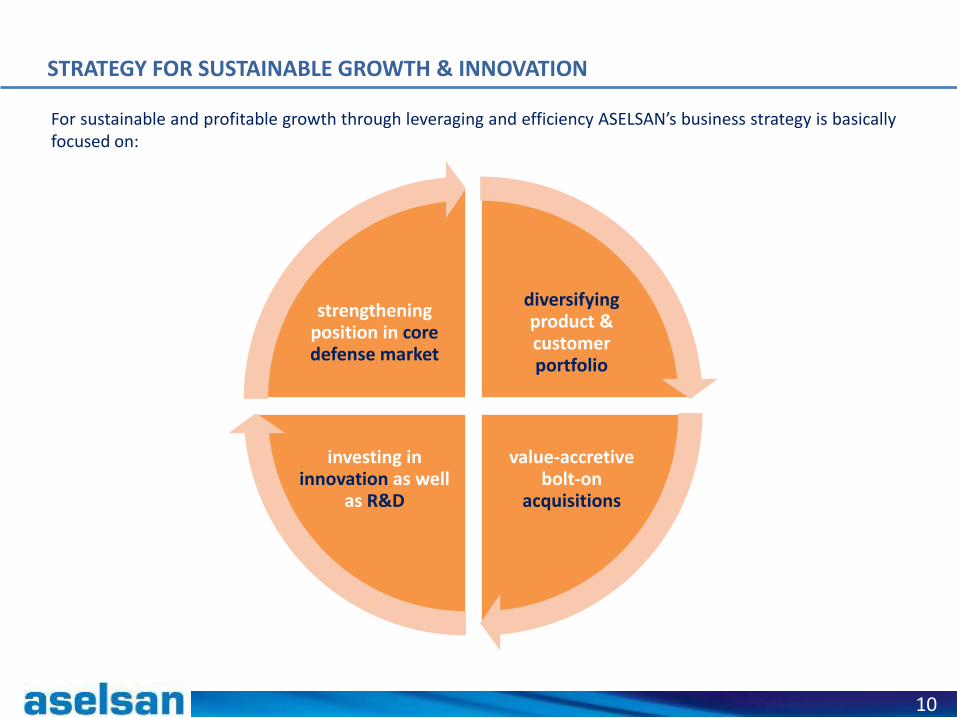
For sustainable and profitable growth through leveraging and efficiency ASELSAN’s business strategy is basicallyfocused on:
10
STRATEGY FOR SUSTAINABLE GROWTH & INNOVATION
diversifyingproduct &customerportfolio
value-accretivebolt-on
acquisitions
investing in innovation as well
as R&D
strengthening position in coredefense market

11
Communication
• Software Defined Radios
• Frequency Hopping Radio Link Device (Ethernet Radio link 100 Megabit)
• Tactical Area Broadband Network System
• Public Safety And EmergencyCommunication Systems (APCO25, DMR, TETRA)
Satellite Systems
• Satellite Transponders(X-band, Ku-band)
• Satellite Communication Terminals(X-band, Ku-band)
• Land and Naval Platform/Ground Stations
IT & Cyber Security
• Cryptographic Algorithms and Protocols
• Cryptographic Device Design
• Communications and Information Security
• Cyber Security
• Cloud Based Solutions
COMMUNICATION & INFORMATION TECHNOLOGIES SECTOR
12
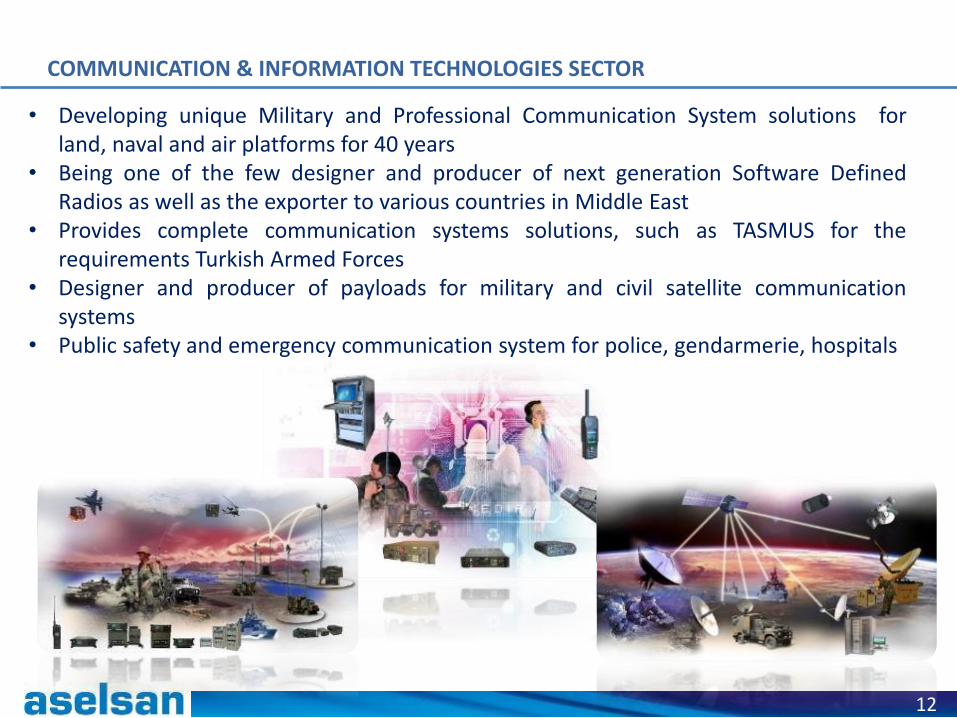
• Developing unique Military and Professional Communication System solutions forland, naval and air platforms for 40 years
• Being one of the few designer and producer of next generation Software DefinedRadios as well as the exporter to various countries in Middle East
• Provides complete communication systems solutions, such as TASMUS for therequirements Turkish Armed Forces
• Designer and producer of payloads for military and civil satellite communicationsystems
• Public safety and emergency communication system for police, gendarmerie, hospitals
COMMUNICATION & INFORMATION TECHNOLOGIES SECTOR

13
Avionic
•Avionic MissionComputers
•Electro-OpticalTargeting System
•CDU Flight Management System
•Multifunction Displays
• Inertial Navigation Systems (INS) for air and land platforms
Electro-Optic
•Common Aperture Targeting System (CATS)
•Cooled and uncooled thermal cameras
•Day and night vision (image intensifier) devices
•Laser range finders
•Laser designators and warning systems
Guidance & Unmanned Systems
•Laser and Precision Guidance Kits
•Unmanned Vehicles
• IR Seeker
Microelectronics
• Inertial Sensors
• Image IntensifierTubes
•Accelerators Tachometers
•MEMS
•Electro-OpticalDetectors
MICROELECTRONICS, GUIDANCE & ELECTRO-OPTICS SECTOR
14
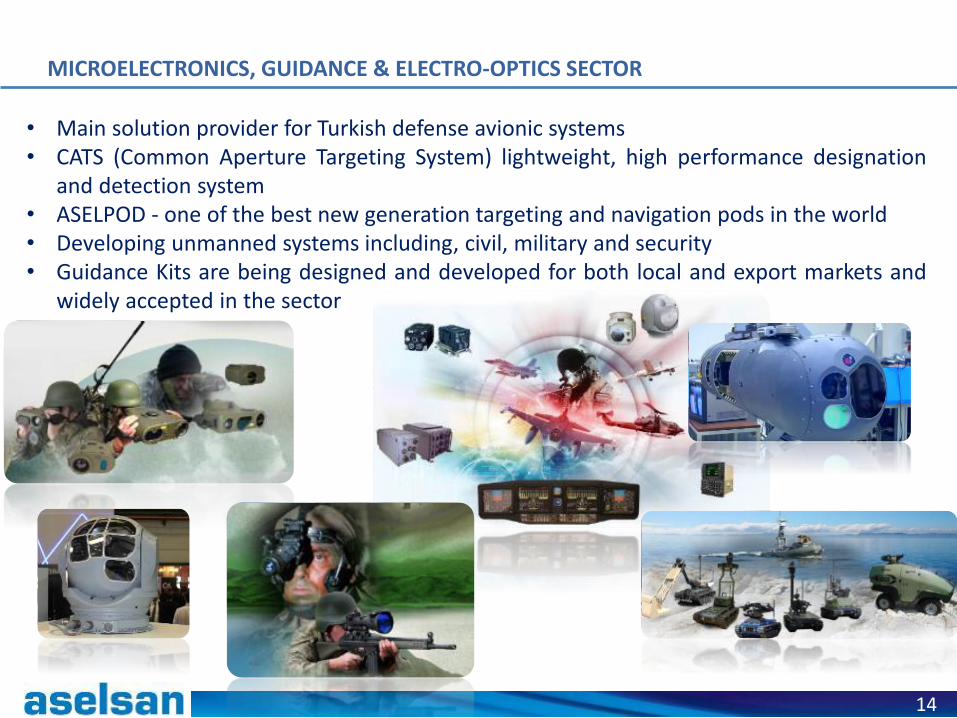
• Main solution provider for Turkish defense avionic systems• CATS (Common Aperture Targeting System) lightweight, high performance designation
and detection system• ASELPOD - one of the best new generation targeting and navigation pods in the world• Developing unmanned systems including, civil, military and security• Guidance Kits are being designed and developed for both local and export markets and
widely accepted in the sector
MICROELECTRONICS, GUIDANCE & ELECTRO-OPTICS SECTOR

15
Radar Systems
• Air Defense Radars
• Naval Platform Radars
• Reconnaissance- Surveillance Radars
• Fire Control Radars
• Counter Mortar Radars
Electronic Warfare
• Electronic Intelligence (ELINT)
• Communications Intelligence (COMINT)
• Self Protection
• Radar Electronic Attack
• Communications Electronic Attack
• Jammer Systems
• Countering Improvised Explosive Devices (C-IED)
Microwave Products
• Microwave modules up to 110 GHz
• GaAs and GaN based Transmit/Receive Modules
RADAR & ELECTRONIC WARFARE SECTOR

16
• ASELSAN EW solutions are being actively used worldwide• Radar solutions for different platforms ships, fixed and rotary wing aircrafts, land vehicles
as well as for different purposes such as low and medium altitude air defense systems,fire control systems, civil radars
• Self protection systems for fixed and rotary wing aircrafts• Developed and producing in GaN transistors for Radar and EW Systems• One of the few companies globally to develop and produce strategic technologies in
radar & electronic warfare sector
RADAR & ELECTRONIC WARFARE SECTOR
17
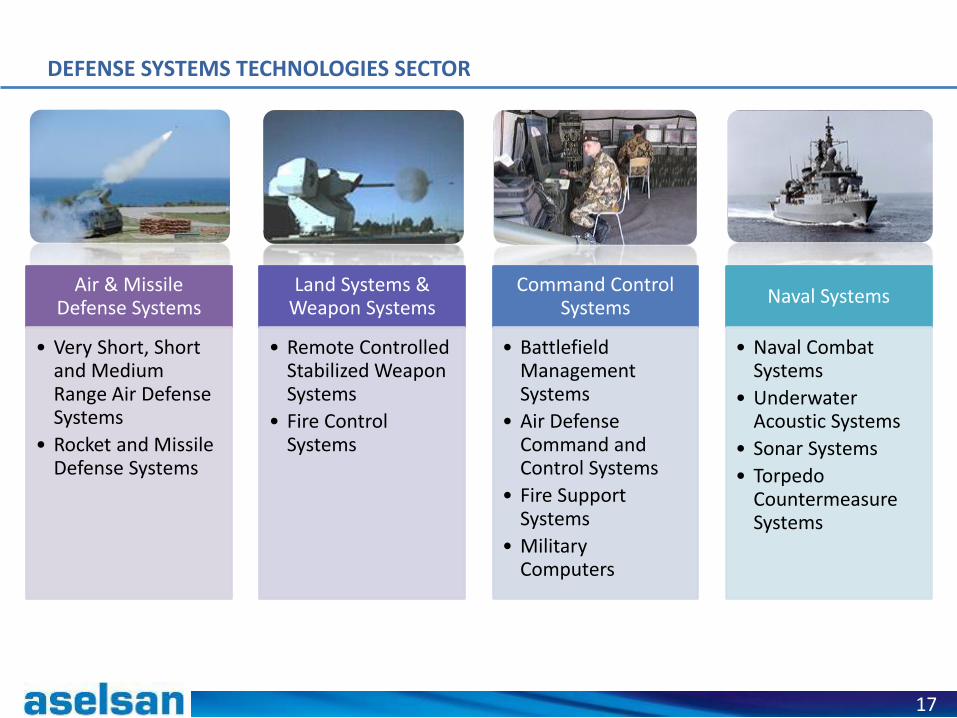
DEFENSE SYSTEMS
TECHNOLOGIES
Air & Missile Defense Systems
• Very Short, Shortand Medium Range Air Defense Systems
• Rocket and Missile Defense Systems
Land Systems &Weapon Systems
• Remote Controlled Stabilized Weapon Systems
• Fire Control Systems
Command Control Systems
• Battlefield Management Systems
• Air Defense Command and Control Systems
• Fire Support Systems
• Military Computers
Naval Systems
• Naval Combat Systems
• Underwater Acoustic Systems
• Sonar Systems
• Torpedo CountermeasureSystems
DEFENSE SYSTEMS TECHNOLOGIES SECTOR

18
• System of Systems Engineering expertise; architecture, design, integration and testcapabilities for combat effective and robust solutions
• Solution provider for TAF and global customers in Air & Missile Defense for 25 years• System integrator for land, air and naval platforms; providing cost efficient and turn-key
solutions including in-house designed subsystems• Special purpose weapon system designer for land, naval, coastal and border security
operations against asymmetric threats
DEFENSE SYSTEMS TECHNOLOGIES SECTOR

19
Security
• Border Security and Surveillance Systems
• Coastal Security and Surveillance Systems
• Public Security and Surveillance Systems
Transportation
• Rail Vehicle and Control Systems
• Electric Vehicle Systems
Traffic & Automation
• Toll Collection Systems
• Traffic Management Systems
• Vehicle and License Plate Recognition Systems
• Precision Farming Systems
• Emergency Management Systems
Energy
• Energy and Power Management Systems
• Renewable EnergySystems
TRANSPORTATION, SECURITY, ENERGY & AUTOMATION SECTOR

20
• The business sector was established in 2014, in order to gather the company’s non-militaryexpertise under one management and for exploiting the know-how and experience gained inthe defense industry in non-defense applications
• Field proven traffic management systems deployed nationwide are also being exported• Collaboration has been established with leading platform suppliers for both railway and
electrical vehicle systems• Accepted as the sole solution provider for advanced homeland security systems (i.e. public,
border, coast, military bases and critical facilities), the business sector has been granted thelargest national security project in Turkey to date
• The business sector has positioned itself as a technology provider for nationwide smart gridsystems and renewable energy systems
TRANSPORTATION, SECURITY, ENERGY & AUTOMATION SECTOR
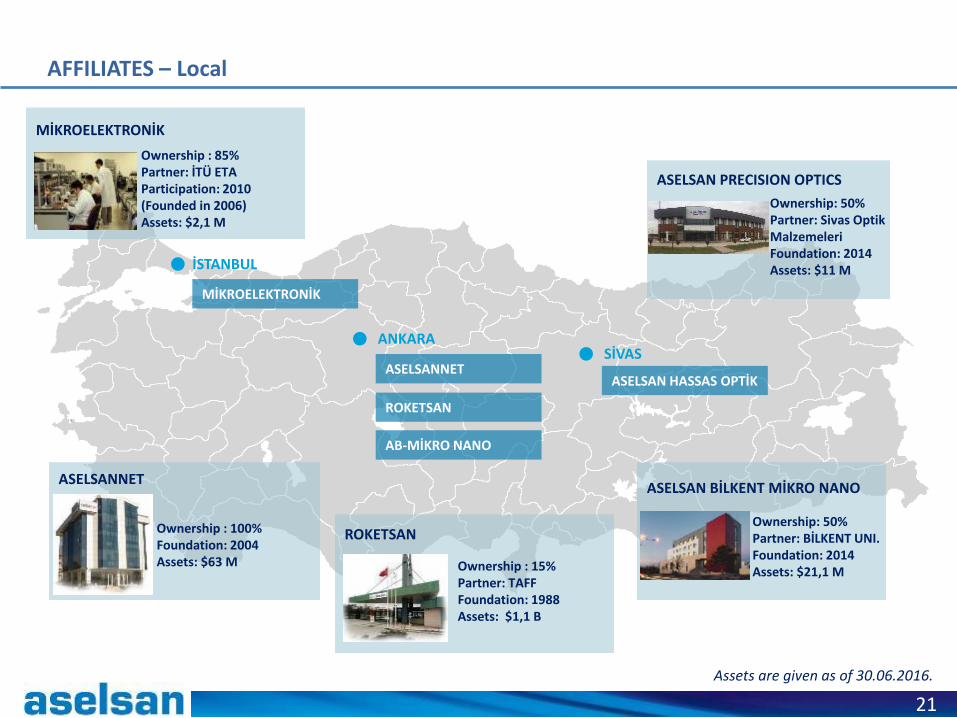
SİVAS
ASELSAN HASSAS OPTİK
ANKARA
ASELSANNET
ROKETSAN
AB-MİKRO NANO
İSTANBUL
MİKROELEKTRONİK
21
Ownership: 50%Partner: Sivas OptikMalzemeleriFoundation: 2014Assets: $11 M
ASELSAN PRECISION OPTICS
ASELSANNET
Ownership : 100%Foundation: 2004Assets: $63 M Ownership : 15%
Partner: TAFFFoundation: 1988Assets: $1,1 B
ROKETSAN
MİKROELEKTRONİK
Ownership : 85%Partner: İTÜ ETAParticipation: 2010(Founded in 2006)Assets: $2,1 M
ASELSAN BİLKENT MİKRO NANO
Ownership: 50%Partner: BİLKENT UNI.Foundation: 2014Assets: $21,1 M
Assets are given as of 30.06.2016.
AFFILIATES – Local

ASELSAN SOUTH AFRICA BRANCH
IGG ASELSAN INTEGRATED SYSTEMS
ASELSAN MIDDLE EAST
ASELSAN BAKÜ
KAZAKHSTAN ASELSAN ENGINEERING
22
ASELSAN MIDDLE EAST (JORDAN)
Ownership: 49%Partner: KADDB Investment GroupFoundation: 2012Assets: $22,9 M
ASELSAN-BAKU (AZERBAIJAN)
Ownership: 100%Foundation: 1998Assets: $2,2 M
IGG ASELSAN INTEGRATED SYSTEMS(UAE)
Ownership: 49%Partner: IGGFoundation: 2011Assets: $1,9 M
KAZAKHSTAN ASELSAN ENGINEERING (KAZAKHSTAN)
Ownership: 49%Partner: Kazakhstan EngineeringFoundation: 2011Assets: $44,7 M
SOUTH AFRICA BRANCH
Ownership: 100%Foundation: 2011
AFFILIATES – Global
Assets are given as of 30.06.2016.
ASELSAN - SAUDI ARABIA
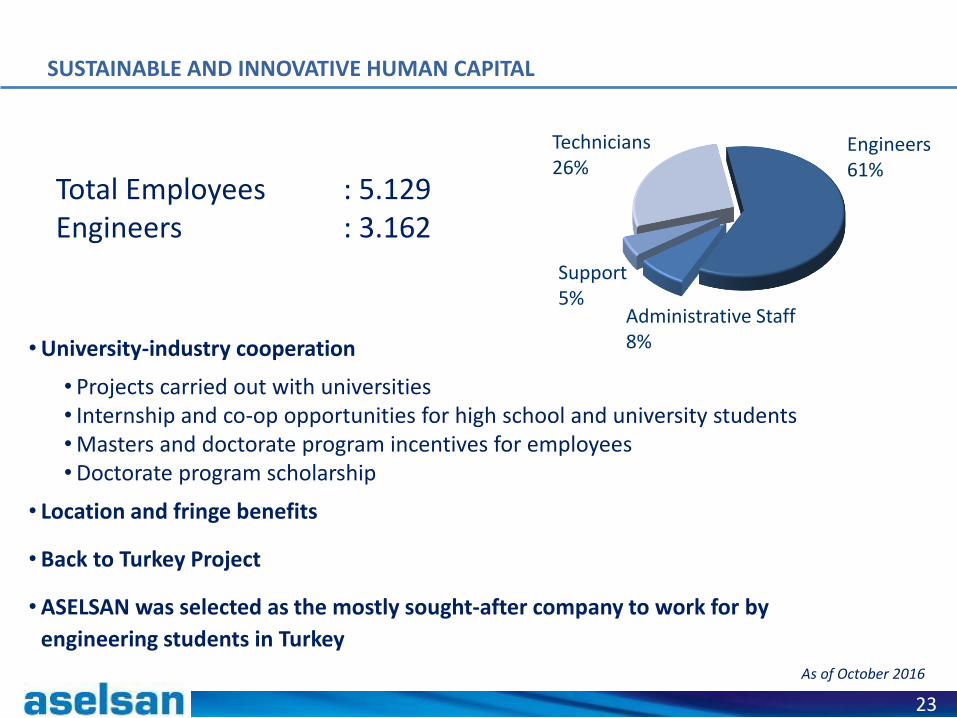
Total Employees : 5.129Engineers : 3.162
Engineers61%
Administrative Staff 8%
Technicians26%
Support5%
As of October 2016
23
SUSTAINABLE AND INNOVATIVE HUMAN CAPITAL
•University-industry cooperation
• Projects carried out with universities• Internship and co-op opportunities for high school and university students•Masters and doctorate program incentives for employees•Doctorate program scholarship
• Location and fringe benefits
• Back to Turkey Project
•ASELSAN was selected as the mostly sought-after company to work for by
engineering students in Turkey

24
ASELSAN, the largest R&D spender in Turkey, has a share of 43% in the total Turkish defense sector R&D spending.
ASELSAN will not pay any corporate taxes till 2023 due to tax incentives on R&D activities.
AN R&D COMPANY
585660
712
304364
143
147
200
89
109
0
100
200
300
400
500
600
700
800
900
1000
2013 2014 2015 2015 1H 2016 1H
R&D Spending
Client Financed Self Financed
728807
912
393
473
Million TL

FINANCIAL PERFORMANCE

26
1H – KEY FINANCIAL FIGURES
Gross Profit margin: 26%
EBIT margin: 15%
EBITDA margin: 19% (in line with the year-end target 18-20%)
Net Cash Position at the year-end level: +77 Million TL
Free Cash Flow: +13 Million TL
Net Sales (Jan-Jun): + 8%
Exports: + 16%
SustainableRevenue Growth
Solid Margins
Improving Cash Flow
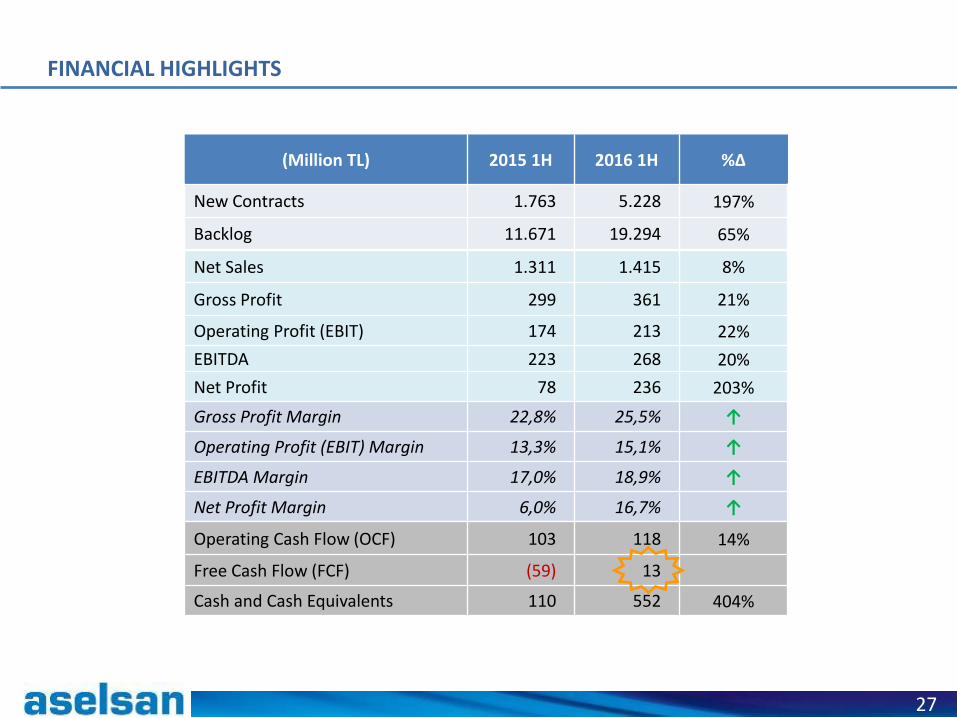
Gross Profit Margin 22,8% 25,5% ↑
Operating Profit (EBIT) Margin 13,3% 15,1% ↑
EBITDA Margin 17,0% 18,9% ↑
Net Profit Margin 6,0% 16,7% ↑
27
FINANCIAL HIGHLIGHTS
Operating Cash Flow (OCF) 103 118 14%
Free Cash Flow (FCF) (59) 13
Cash and Cash Equivalents 110 552 404%
(Million TL) 2015 1H 2016 1H %∆
New Contracts 1.763 5.228 197%
Backlog 11.671 19.294 65%
Net Sales 1.311 1.415 8%
Gross Profit 299 361 21%
Operating Profit (EBIT) 174 213 22%
EBITDA 223 268 20%
Net Profit 78 236 203%

28
INCREASING TREND IN NET SALES
497 639 619935
1.1351.419 1.361
1.7732.075
2.233
1.075 1.18616
29 87
102
78
83 272
398
460
548
197228
0
500
1.000
1.500
2.000
2.500
3.000
2006 2007 2008 2009 2010 2011 2012 2013 2014 2015 2015 1H 2016 1H
Millon TL
Domestic Sales Exports
513669
706
1.0381.212
1.5021.633
2.171
2.535
2.780
1.3111.415
CAGR21%
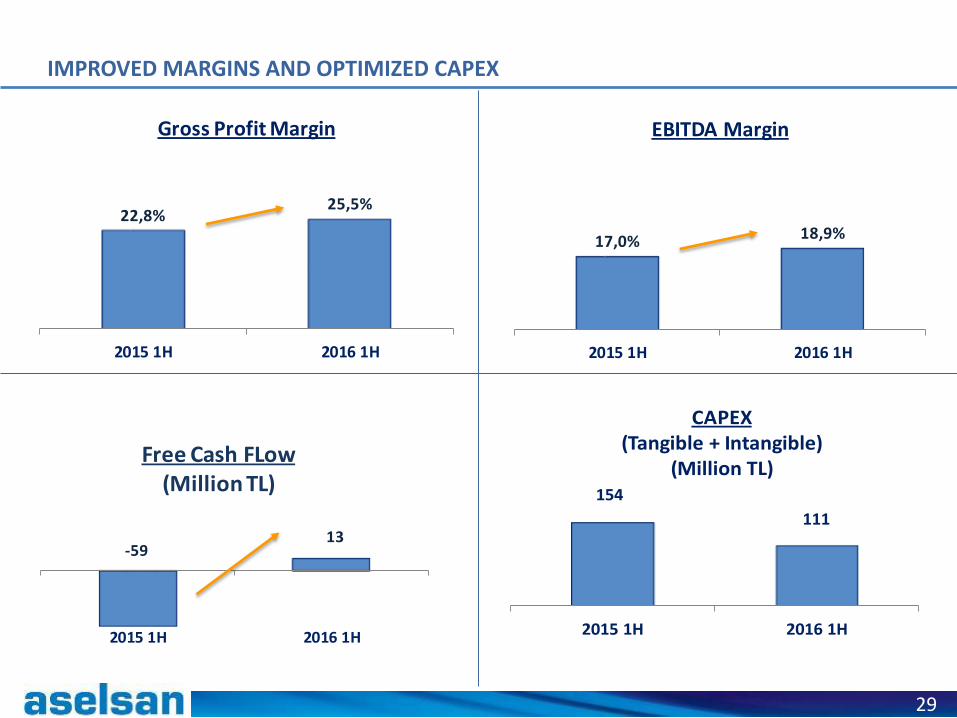
154
111
2015 1H 2016 1H
CAPEX(Tangible + Intangible)
(Million TL)
17,0% 18,9%
2015 1H 2016 1H
EBITDA Margin
22,8%25,5%
2015 1H 2016 1H
Gross Profit Margin
29
-5913
2015 1H 2016 1H
Free Cash FLow(Million TL)
IMPROVED MARGINS AND OPTIMIZED CAPEX
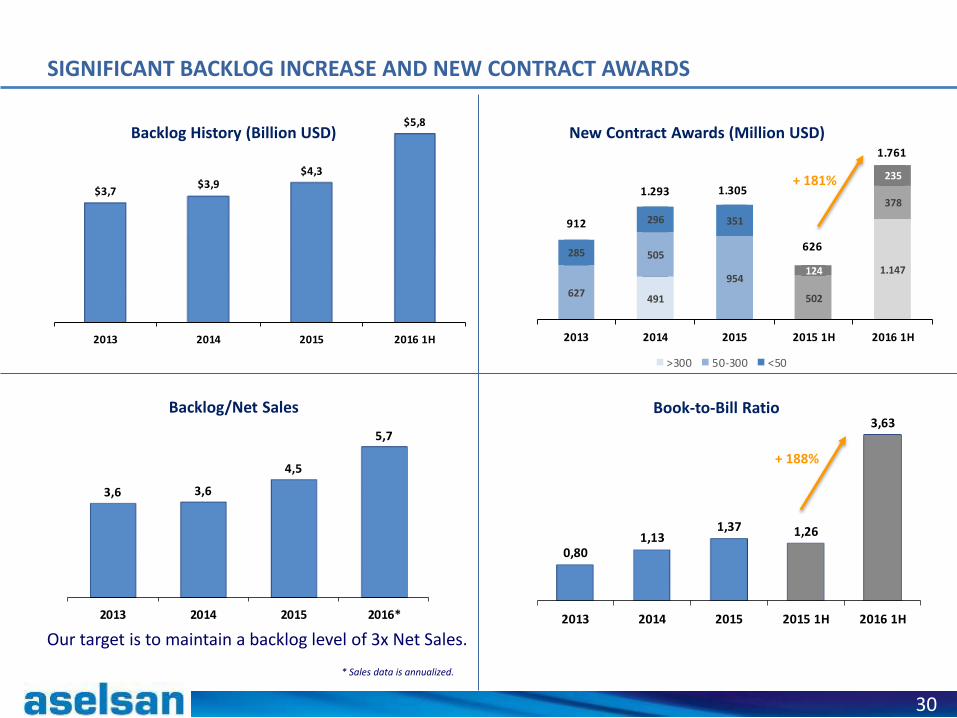
3,6 3,6
4,5
5,7
2013 2014 2015 2016*
0,801,13
1,37 1,26
3,63
2013 2014 2015 2015 1H 2016 1H
491
1.147
627
505
954
502
378
285
296 351
124
235
2013 2014 2015 2015 1H 2016 1H
>300 50-300 <50
912
1.293 1.305
1.761
626
30
$3,7$3,9
$4,3
$5,8
2013 2014 2015 2016 1H
SIGNIFICANT BACKLOG INCREASE AND NEW CONTRACT AWARDS
Our target is to maintain a backlog level of 3x Net Sales.
* Sales data is annualized.
New Contract Awards (Million USD)
Book-to-Bill RatioBacklog/Net Sales
+ 181%
+ 188%
Backlog History (Billion USD)

Undersecretariat for Defense Industries
64,6%
Ministry of National Defense
5,1%
TAI8,1%
Other14,7%
Middle East 4,2%
Caspian Region2,1% Americas and
Europe1,2%Exports
7,5%
GendarmerieSedef ShipyardGeneral Directorate of Civil Registration and NationalityROKETSAN
TL 21%
USD 51%
EUR 28%
BACKLOG DISTRIBUTION (CURRENCY)
BACKLOG DISTRIBUTION (CLIENT)
31
TL 40%
USD 40%
EUR 20%
TOTAL EXPENSE DISTRIBUTION (CURRENCY)
Labor 22%
Fixed Assets 6%
Operating Expenses
9%
Material63%
TOTAL EXPENSE BREAKDOWN (TYPE)
BACKLOG

32
STRONG CASH FLOW AND NET CASH POSITION
June 30, 2016 Net Cash Position
Cash & Cash Equivalents552 Million TL
Financial Debt475 Million TL
Net Cash = Cash - Short/Long Term Debt
77 Million TL
December 31, 2015 Net Cash Position
Cash & Cash Equivalents681 Million TL
Financial Debt603 Million TL
Net Cash = Cash - Short/Long Term Debt
78 Million TL
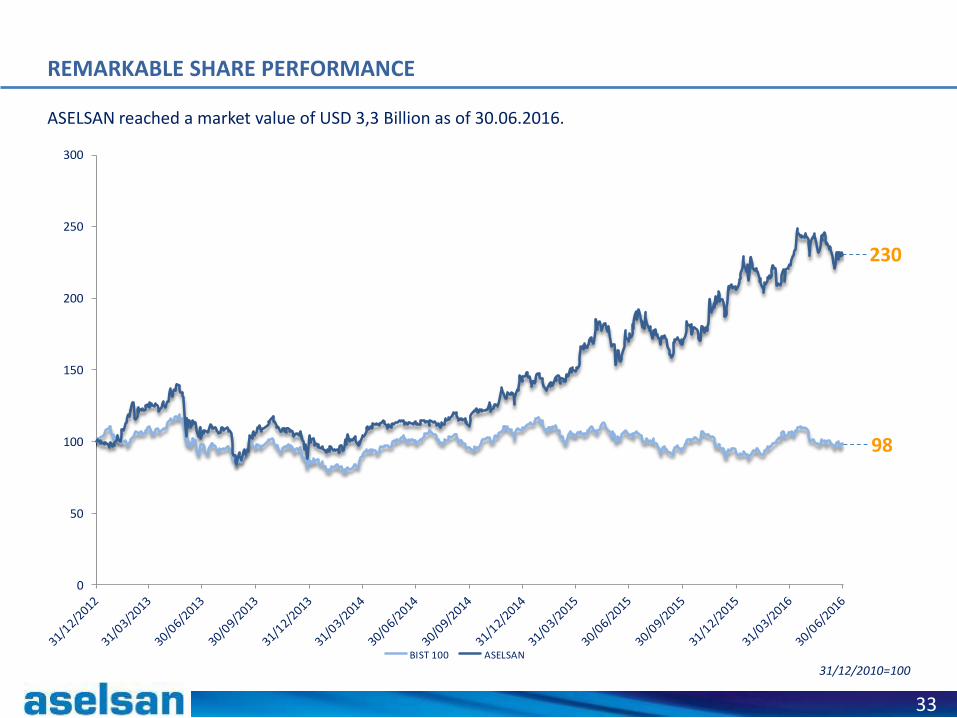
0
50
100
150
200
250
300
BIST 100 ASELSAN
31/12/2010=100
33
ASELSAN reached a market value of USD 3,3 Billion as of 30.06.2016.
REMARKABLE SHARE PERFORMANCE
230
98

34
DIVIDENDS
0,198 TL
0,157 TL
0,050 TL
0,130 TL
0,084 TL
0,000 TL
0,050 TL
0,100 TL
0,150 TL
0,200 TL
0,250 TL
2011 2012 2013 2014 2015
Dividend/Share
28,9% 26,8% 10,5% 16,6% 19,7%Pay-out Ratio
Board targeting a pay-out ratio of at least 10%
of net profit
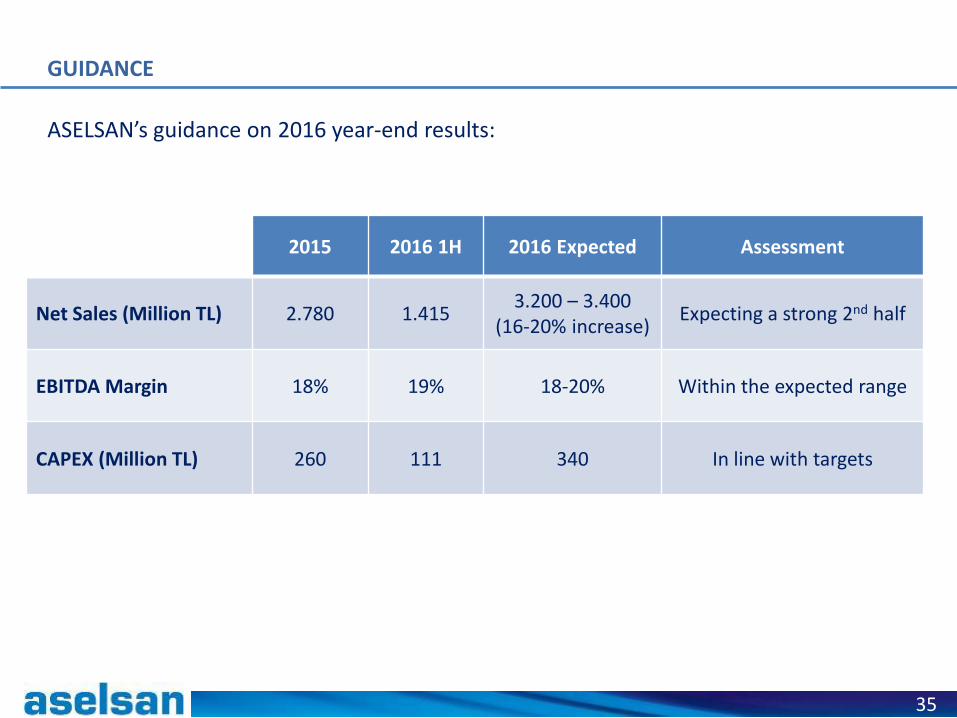
GUIDANCE
35
ASELSAN’s guidance on 2016 year-end results:
2015 2016 1H 2016 Expected Assessment
Net Sales (Million TL) 2.780 1.4153.200 – 3.400
(16-20% increase)Expecting a strong 2nd half
EBITDA Margin 18% 19% 18-20% Within the expected range
CAPEX (Million TL) 260 111 340 In line with targets

Prospective Projects & Long Term Priorities

PROSPECTIVE PROJECTS
37
• Air Defense System Modernization Serial Production
• HAVASOJ (Stand-off Jammer)
• Long Range Air Defense Missile System
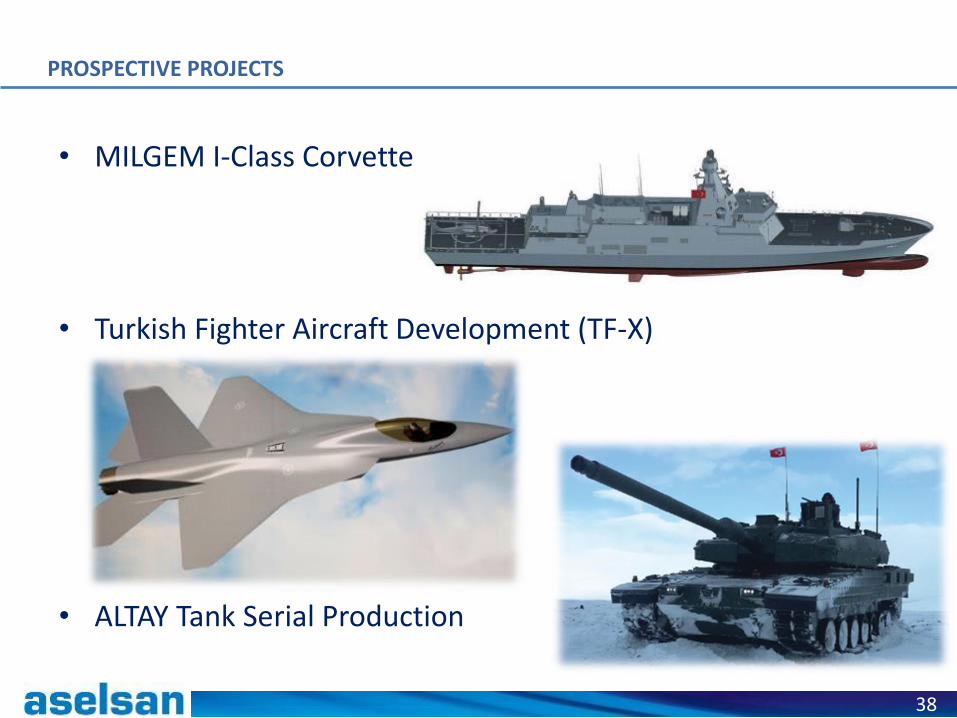
38
• MILGEM I-Class Corvette
• Turkish Fighter Aircraft Development (TF-X)
• ALTAY Tank Serial Production
PROSPECTIVE PROJECTS
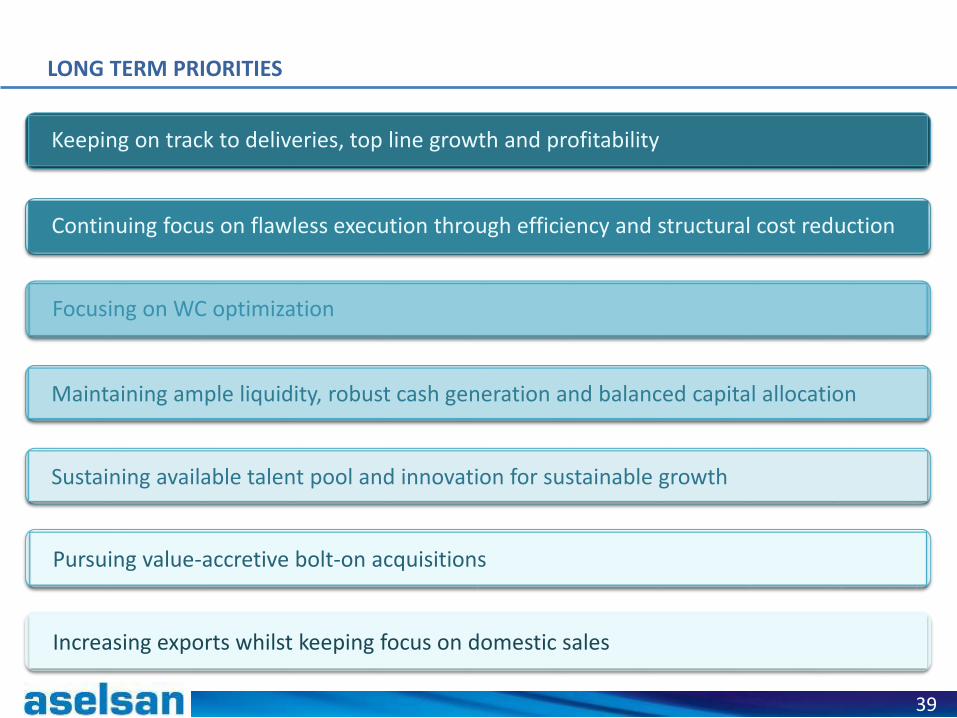
39
Keeping on track to deliveries, top line growth and profitability
Continuing focus on flawless execution through efficiency and structural cost reduction
Focusing on WC optimization
Maintaining ample liquidity, robust cash generation and balanced capital allocation
Sustaining available talent pool and innovation for sustainable growth
Pursuing value-accretive bolt-on acquisitions
Increasing exports whilst keeping focus on domestic sales
LONG TERM PRIORITIES

40
Contact Persons
Okan TURAN
Chief Financial Officer
Aykan ÜRETEN
Finance Director
Pınar ÇELEBİ
Investor Relations Manager
Başak YÜCEKAYALI
Investor Relations Associate
Address
ASELSAN Elektronik Sanayi ve Ticaret A.Ş.
Mehmet Akif Ersoy Mah. 296. Cad. No:16
06370 Yenimahalle, Ankara, TURKEY
Tel: +90 312 592 10 00
Web
www.aselsan.com
CONTACT

APPENDIX

• ASELSAN holds OHSAS 18001:2007 Occupational Health and SafetyManagement System and ISO 14001:2004 EnvironmentalManagement System Certificates since 2009.
• ASELSAN has been in the “Highest” category in Carbon DisclosureProject (CDP) since 2012.
• ASELSAN, is one of the companies to be listed on the BISTSustainability Index since its launch in November 2014.
• As per ASELSAN Enterprise Risk Management System, the potentialrisks are systematically identified, analyzed, monitored andmitigated while focusing on efficiency and sustainable growth.
SUSTAINABILITY
‘‘Sustainability’’ is not a new concept for ASELSAN.
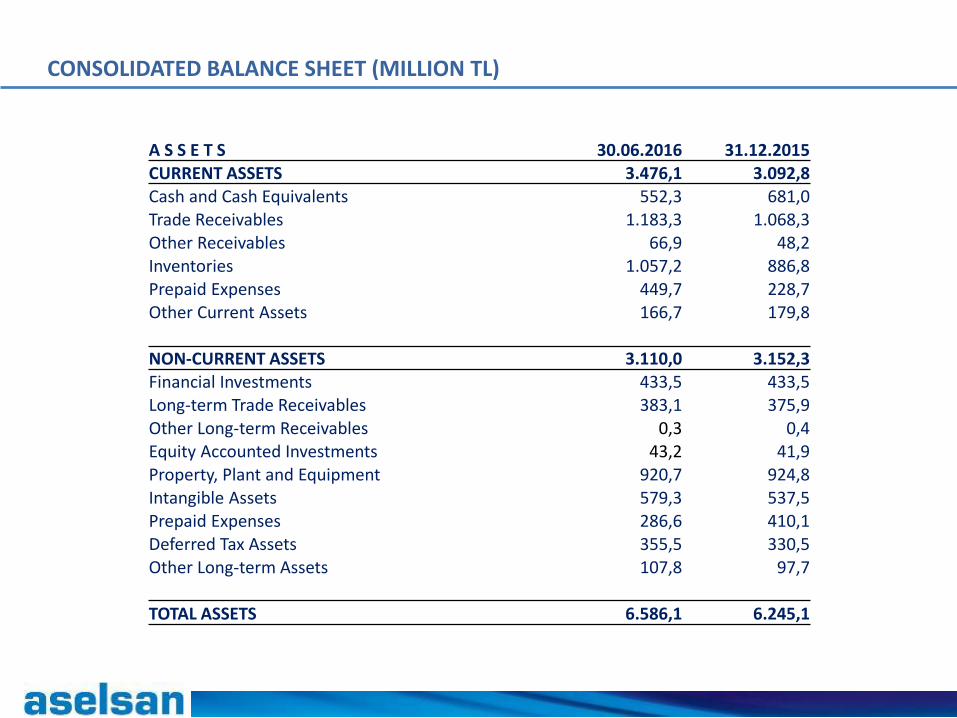
CONSOLIDATED BALANCE SHEET (MILLION TL)
A S S E T S 30.06.2016 31.12.2015CURRENT ASSETS 3.476,1 3.092,8Cash and Cash Equivalents 552,3 681,0Trade Receivables 1.183,3 1.068,3Other Receivables 66,9 48,2Inventories 1.057,2 886,8Prepaid Expenses 449,7 228,7Other Current Assets 166,7 179,8
NON-CURRENT ASSETS 3.110,0 3.152,3Financial Investments 433,5 433,5Long-term Trade Receivables 383,1 375,9Other Long-term Receivables 0,3 0,4Equity Accounted Investments 43,2 41,9Property, Plant and Equipment 920,7 924,8Intangible Assets 579,3 537,5Prepaid Expenses 286,6 410,1Deferred Tax Assets 355,5 330,5Other Long-term Assets 107,8 97,7
TOTAL ASSETS 6.586,1 6.245,1

CONSOLIDATED BALANCE SHEET (MILLION TL)
L I A B I L I T I E S 30.06.2016 31.12.2015
CURRENT LIABILITIES 1.578,9 1.568,9
Short-term Financial Liabilities 274,7 357,8
Short-term Portion of Long-term Financial Liabilities 65,7 89,4
Trade Payables 518,9 577,2
Employee Benefit Obligations 19,8 21,6
Other Payables 36,1 2,9
Government Grants and Incentives 23,0 22,6
Deferred Income 388,8 261,5
Corporate Tax Liability 0,50 2,6
Short-term Provisions 242,2 220,0
Other Short-Term Liabilities 9,2 13,3
NON-CURRENT LIABILITIES 1.970,1 1.835,4
Long-term Financial Liabilities 134,4 156,1
Long-term Trade Payables 184,8 222,9
Deferred Income 1.415,6 1.269,5
Long-term Provisions 235,3 186,9

CONSOLIDATED BALANCE SHEET (MILLION TL)
30.06.2016 31.12.2015
EQUITY 3.037,1 2.840,7
Equity attributable to equity holders of the parent 3.036,7 2.840,2
Share Capital 1.000,0 500,0
Share Capital Adjustment 98,6 100,3
Other Reserves 610,3 607,9
Restricted Profit Reserves 94,2 86,9
Retained Earnings 997,6 1.332,2
Net Profit for the Period 236,0 212,9
Non-controlling Interests 0,4 0,5
TOTAL LIABILITIES AND EQUITY 6.586,1 6.245,0

CONSOLIDATED INCOME STATEMENT (MILLION TL)
01.01.2016-30.06.2016
01.01.2015-30.06.2015
PROFIT OR LOSS
Net Sales 1.414,8 1.311,4
Cost of sales (-) (1.053,7) (1.012,0)
GROSS PROFIT 361,1 299,4
General administrative expenses (-) (81,1) (67,3)
Marketing expenses (-) (30,1) (28,3)
Research and development expenses (-) (36,6) (29,5)
Other operating income 112,6 206,7
Other operating expenses (-) (127,1) (278,5)
OPERATING PROFIT 198,8 102,5
Income from investing activities 8,4 0,0
Share of Losses of Equity-Accounted Investments (0,2) -
OPERATING PROFIT BEFORE FINANCIAL EXPENSE 207 102,5
Financial income 46,1 5,1
Financial expenses (-) (42,2) (77,5)
PROFIT BEFORE TAX FROM CONTINUING OPERATIONS 210,9 30,1
Tax income/ (expense) from continuing operations 25,0 48,0
- Current tax expense (0,5) (0,6)
- Deferred tax income / (expense) 25,5 48,6
PROFIT FOR THE PERIOD FROM CONTINUING OPERATIONS 235,9 78,1
Profit for the period attributable to:
Non-controlling interest 0,0 -
Shareholders of the parent 236,0 78,1
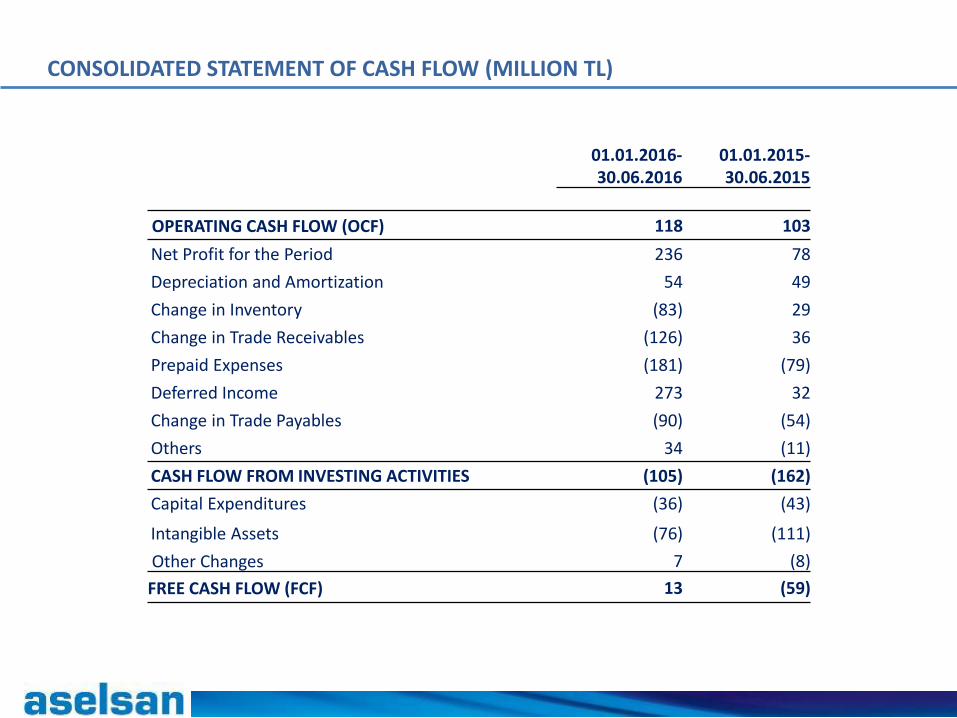
CONSOLIDATED STATEMENT OF CASH FLOW (MILLION TL)
01.01.2016-30.06.2016
01.01.2015-30.06.2015
OPERATING CASH FLOW (OCF) 118 103
Net Profit for the Period 236 78
Depreciation and Amortization 54 49
Change in Inventory (83) 29
Change in Trade Receivables (126) 36
Prepaid Expenses (181) (79)
Deferred Income 273 32
Change in Trade Payables (90) (54)
Others 34 (11)
CASH FLOW FROM INVESTING ACTIVITIES (105) (162)
Capital Expenditures (36) (43)
Intangible Assets (76) (111)
Other Changes 7 (8)
FREE CASH FLOW (FCF) 13 (59)
Recommended