Pediatric Applications of MRSPediatric Applications of MRS
A Trans-NIH Workshop on Pediatric Functional A Trans-NIH Workshop on Pediatric Functional NeuroimagingNeuroimaging
Stephen R Dager, MDStephen R Dager, MDDepartment of RadiologyDepartment of RadiologyUniversity of WashingtonUniversity of Washington
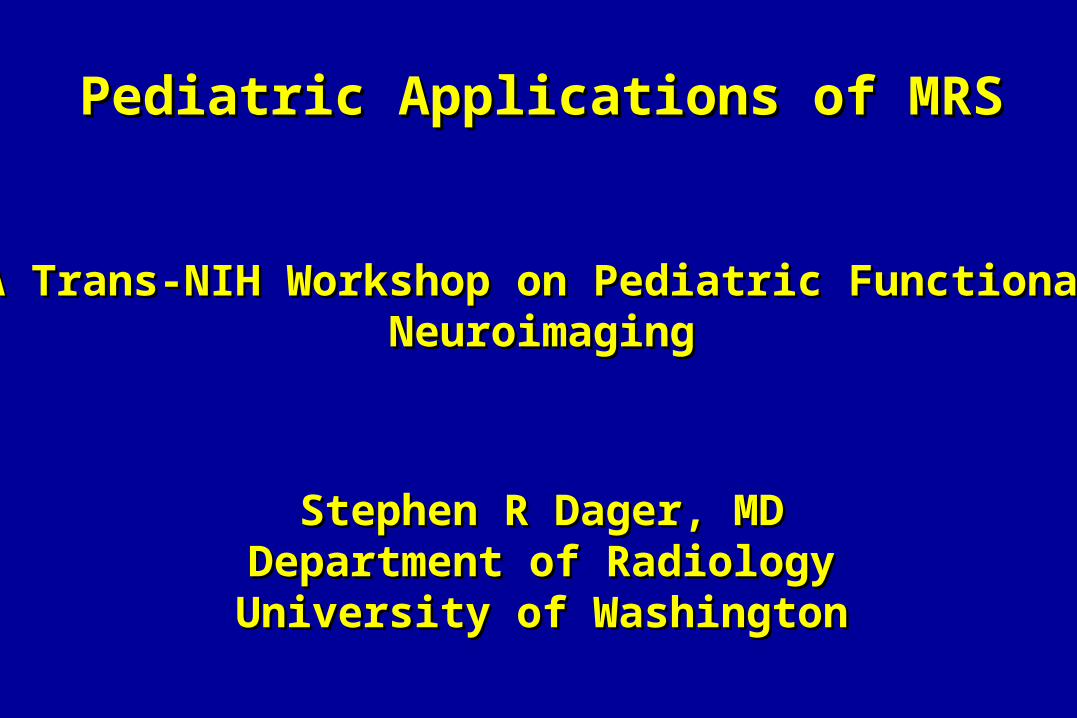
Outline of TalkOutline of Talk
1. Methodological considerations- to sedate or not to sedate?1. Methodological considerations- to sedate or not to sedate?
2. What can 2. What can 11H MRS inform us about brain development gone awry?H MRS inform us about brain development gone awry?
3. Beyond 3. Beyond 11H MRS- a brief overview of H MRS- a brief overview of 1919F pediatric applications. F pediatric applications.
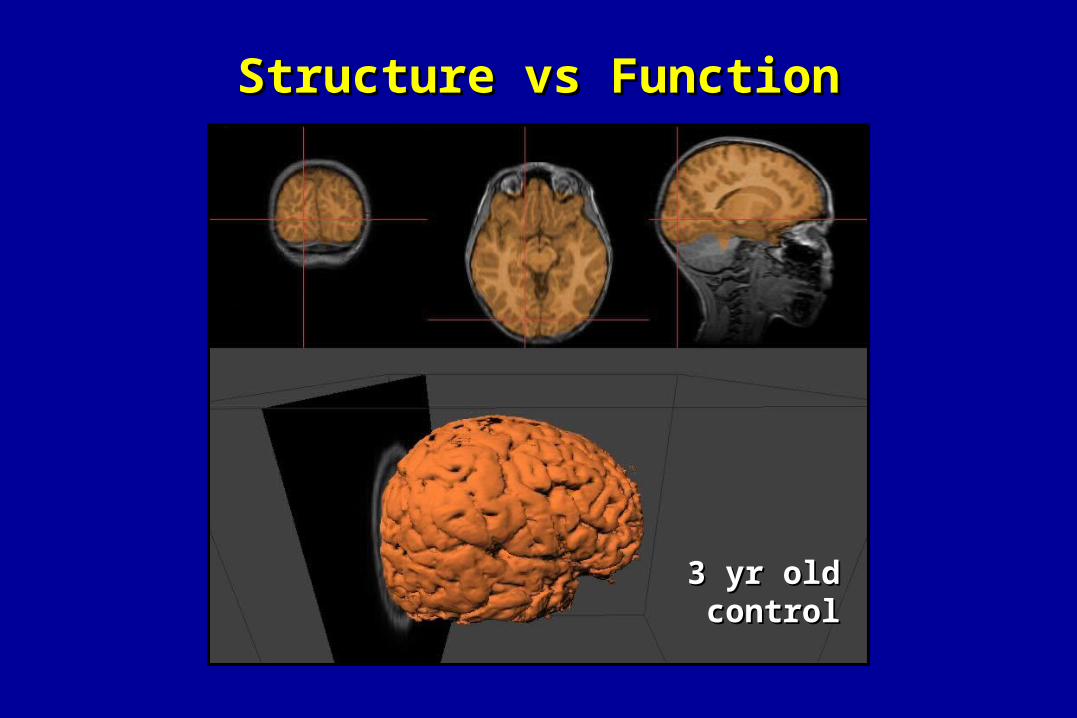
Structure vs FunctionStructure vs Function
3 yr old 3 yr old controlcontrol
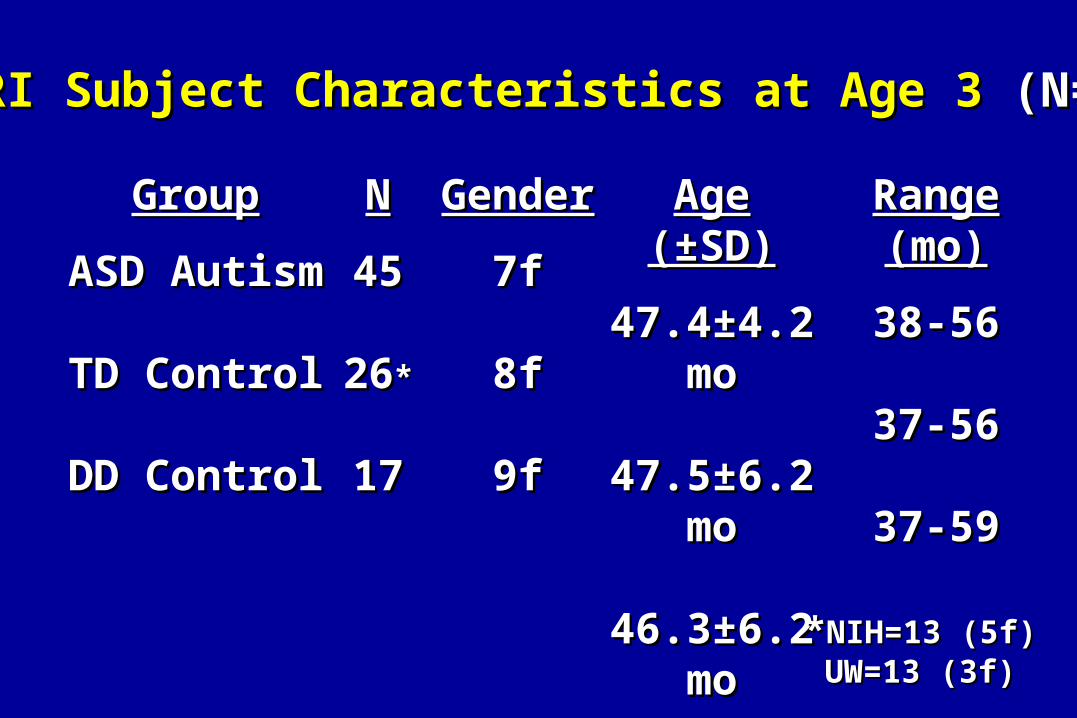
MRI Subject Characteristics at Age 3 MRI Subject Characteristics at Age 3 (N=88)(N=88)
GroupGroup
ASD AutismASD Autism
TD ControlTD Control
DD ControlDD Control
NN
4545
2626**
1717
GenderGender
7f7f
8f8f
9f9f
Age (±SD)Age (±SD)
47.4±4.2 mo47.4±4.2 mo
47.5±6.2 mo47.5±6.2 mo
46.3±6.2 mo46.3±6.2 mo
Range (mo)Range (mo)
38-5638-56
37-5637-56
37-5937-59
**NIH=13 (5f)NIH=13 (5f)UW=13 (3f)UW=13 (3f)
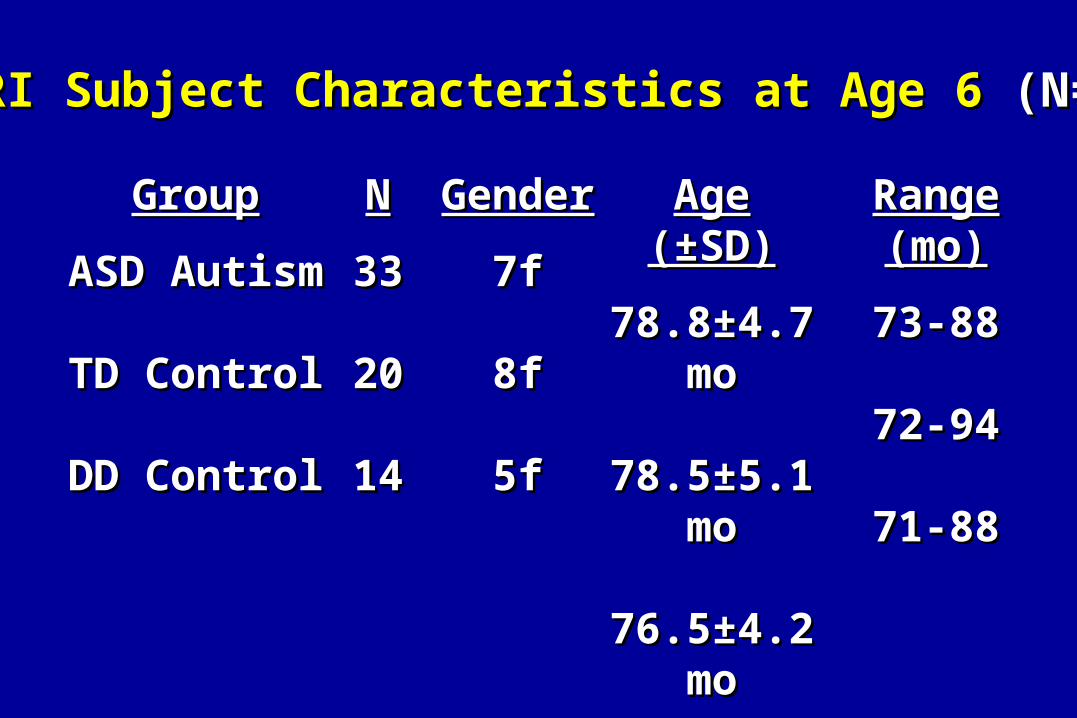
MRI Subject Characteristics at Age 6 MRI Subject Characteristics at Age 6 (N=67)(N=67)
GroupGroup
ASD AutismASD Autism
TD ControlTD Control
DD ControlDD Control
NN
3333
2020
1414
GenderGender
7f7f
8f8f
5f5f
Age (±SD)Age (±SD)
78.8±4.7 mo78.8±4.7 mo
78.5±5.1 mo78.5±5.1 mo
76.5±4.2 mo76.5±4.2 mo
Range (mo)Range (mo)
73-8873-88
72-9472-94
71-8871-88
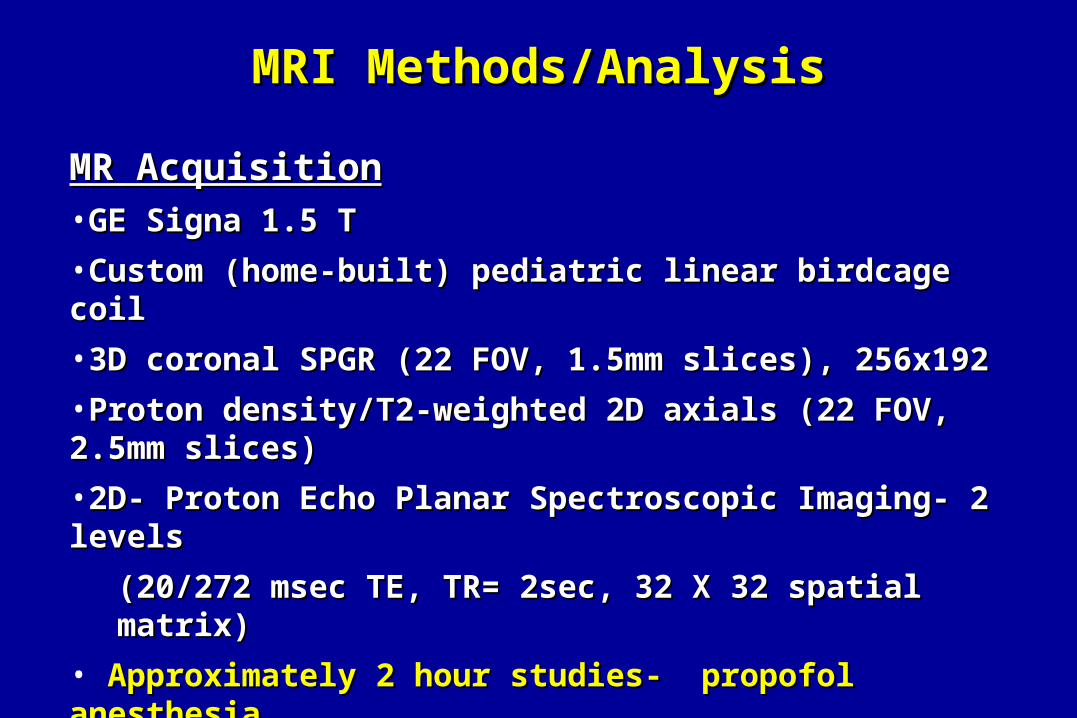
MRI Methods/AnalysisMRI Methods/Analysis
MR AcquisitionMR Acquisition•GE Signa 1.5 T GE Signa 1.5 T
•Custom (home-built) pediatric linear birdcage coilCustom (home-built) pediatric linear birdcage coil
•3D coronal SPGR (22 FOV, 1.5mm slices), 256x1923D coronal SPGR (22 FOV, 1.5mm slices), 256x192
•Proton density/T2-weighted 2D axials (22 FOV, 2.5mm slices)Proton density/T2-weighted 2D axials (22 FOV, 2.5mm slices)
•2D- Proton Echo Planar Spectroscopic Imaging- 2 levels2D- Proton Echo Planar Spectroscopic Imaging- 2 levels
(20/272 msec TE, TR= 2sec, 32 X 32 spatial matrix) (20/272 msec TE, TR= 2sec, 32 X 32 spatial matrix)
• Approximately 2 hour studies- propofol anesthesiaApproximately 2 hour studies- propofol anesthesia
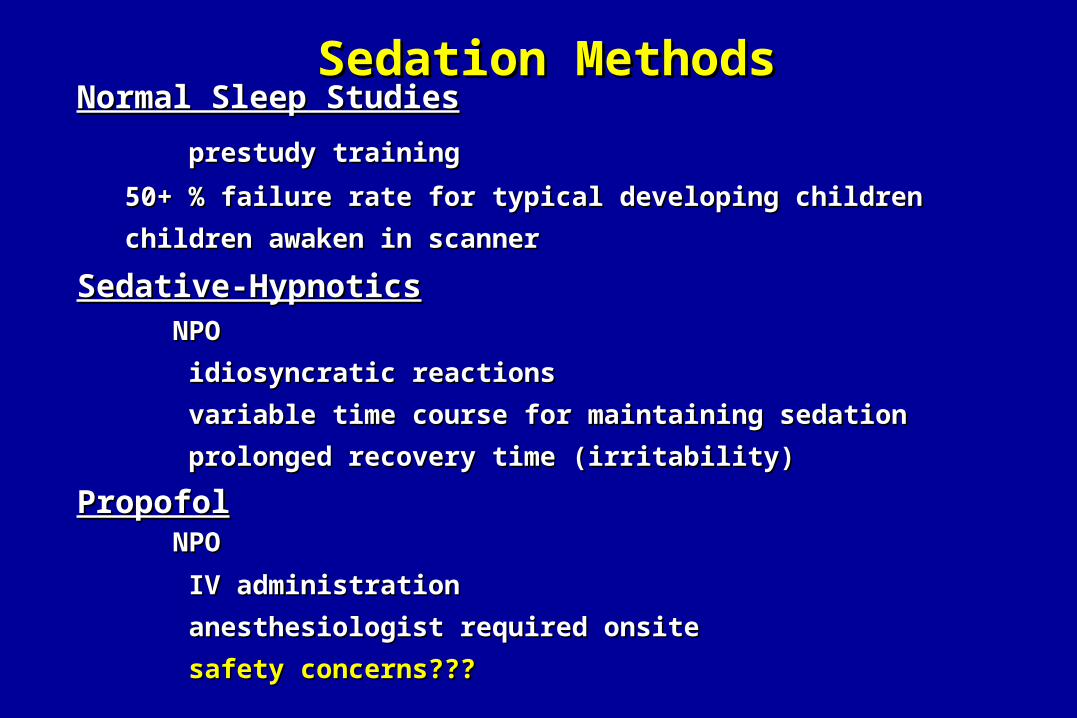
Sedation MethodsSedation MethodsNormal Sleep StudiesNormal Sleep Studies
prestudy trainingprestudy training
50+ % failure rate for typical developing children50+ % failure rate for typical developing children
children awaken in scannerchildren awaken in scanner
Sedative-HypnoticsSedative-Hypnotics
NPO NPO
idiosyncratic reactionsidiosyncratic reactions
variable time course for maintaining sedationvariable time course for maintaining sedation
prolonged recovery time (irritability)prolonged recovery time (irritability)
PropofolPropofol NPO NPO
IV administrationIV administration
anesthesiologist required onsiteanesthesiologist required onsite
safety concerns???safety concerns???
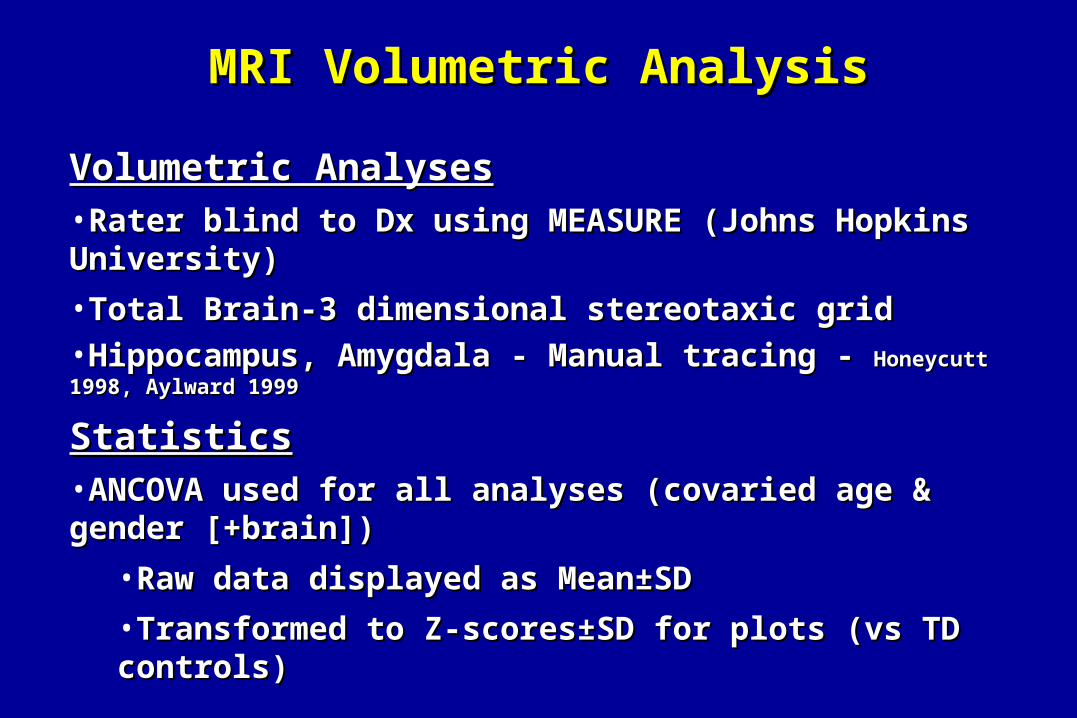
MRI Volumetric AnalysisMRI Volumetric Analysis
Volumetric AnalysesVolumetric Analyses•Rater blind to Dx using MEASURE (Johns Hopkins University) Rater blind to Dx using MEASURE (Johns Hopkins University)
•Total Brain-3 dimensional stereotaxic gridTotal Brain-3 dimensional stereotaxic grid
•Hippocampus, Amygdala - Manual tracing - Hippocampus, Amygdala - Manual tracing - Honeycutt 1998, Aylward 1999Honeycutt 1998, Aylward 1999
StatisticsStatistics•ANCOVA used for all analyses (covaried age & gender [+brain])ANCOVA used for all analyses (covaried age & gender [+brain])
•Raw data displayed as Mean±SDRaw data displayed as Mean±SD
•Transformed to Z-scores±SD for plots (vs TD controls)Transformed to Z-scores±SD for plots (vs TD controls)
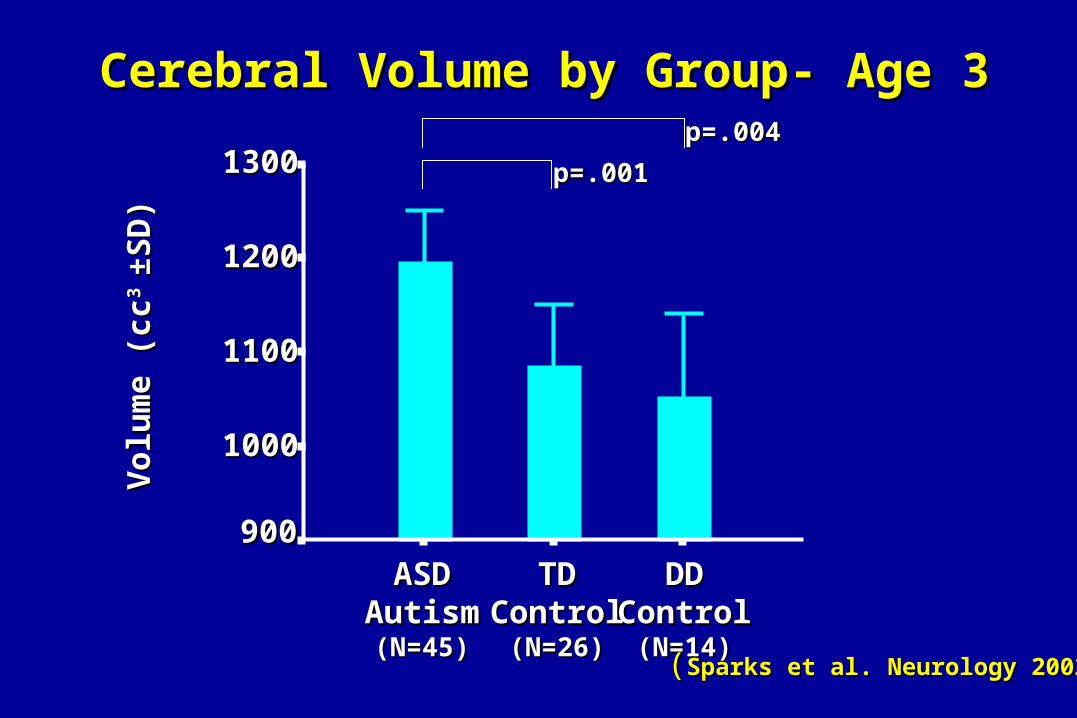
Cerebral Volume by Group- Age 3Cerebral Volume by Group- Age 3
DDDDControlControl
(N=14)(N=14)
TDTDControlControl
(N=26)(N=26)
ASDASDAutismAutism(N=45)(N=45)
Vol
um
e (c
cV
olu
me
(cc3 3
±SD
)±S
D)
13001300
12001200
11001100
10001000
900900
p=.001p=.001
p=.004p=.004
((SparksSparks et al. Neurology 2002)et al. Neurology 2002)
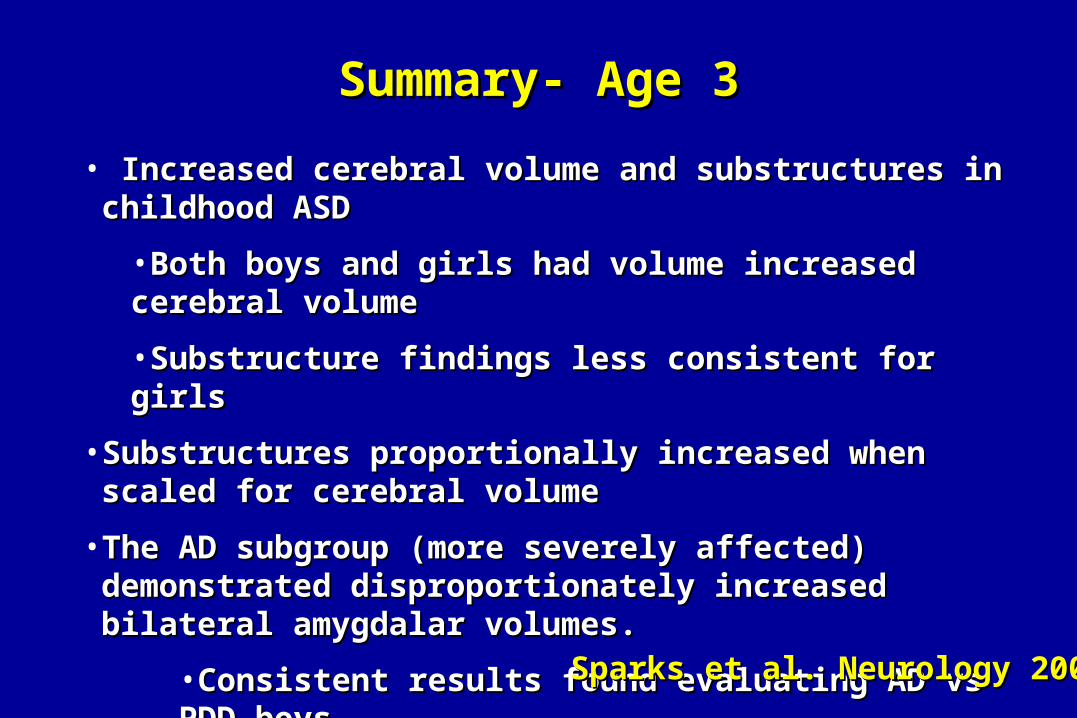
• Increased cerebral volume and substructures in childhood ASD Increased cerebral volume and substructures in childhood ASD
•Both boys and girls had volume increased cerebral volumeBoth boys and girls had volume increased cerebral volume
•Substructure findings less consistent for girlsSubstructure findings less consistent for girls
• Substructures proportionally increased when scaled for cerebral Substructures proportionally increased when scaled for cerebral volumevolume
• The AD subgroup (more severely affected) demonstrated The AD subgroup (more severely affected) demonstrated disproportionately increased bilateral amygdalar volumes.disproportionately increased bilateral amygdalar volumes.
•Consistent results found evaluating AD vs PDD boysConsistent results found evaluating AD vs PDD boys
• Marked structural differences between DD and ASD/ TD childrenMarked structural differences between DD and ASD/ TD children
Summary- Age 3Summary- Age 3
Sparks et al. Neurology 2002Sparks et al. Neurology 2002
Structure/ Neurochemical Relationships Structure/ Neurochemical Relationships in Childhood Autismin Childhood Autism
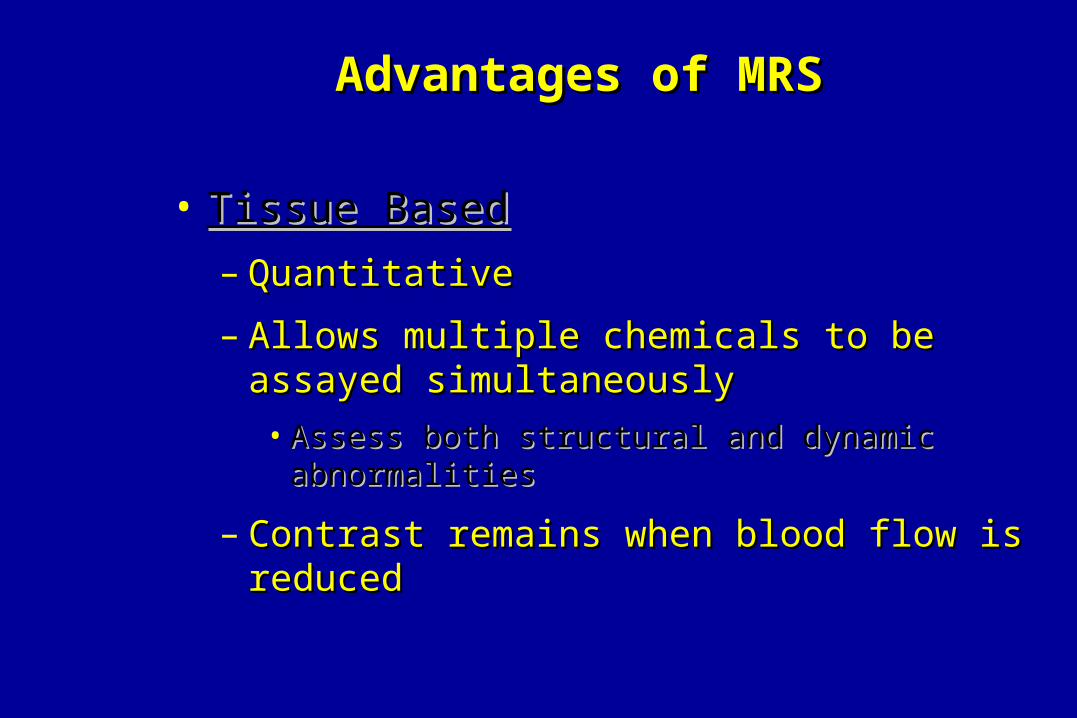
Advantages of MRSAdvantages of MRS
• Tissue BasedTissue Based
– QuantitativeQuantitative
– Allows multiple chemicals to be assayed Allows multiple chemicals to be assayed simultaneouslysimultaneously
• Assess both structural and dynamic abnormalitiesAssess both structural and dynamic abnormalities
– Contrast remains when blood flow is reducedContrast remains when blood flow is reduced
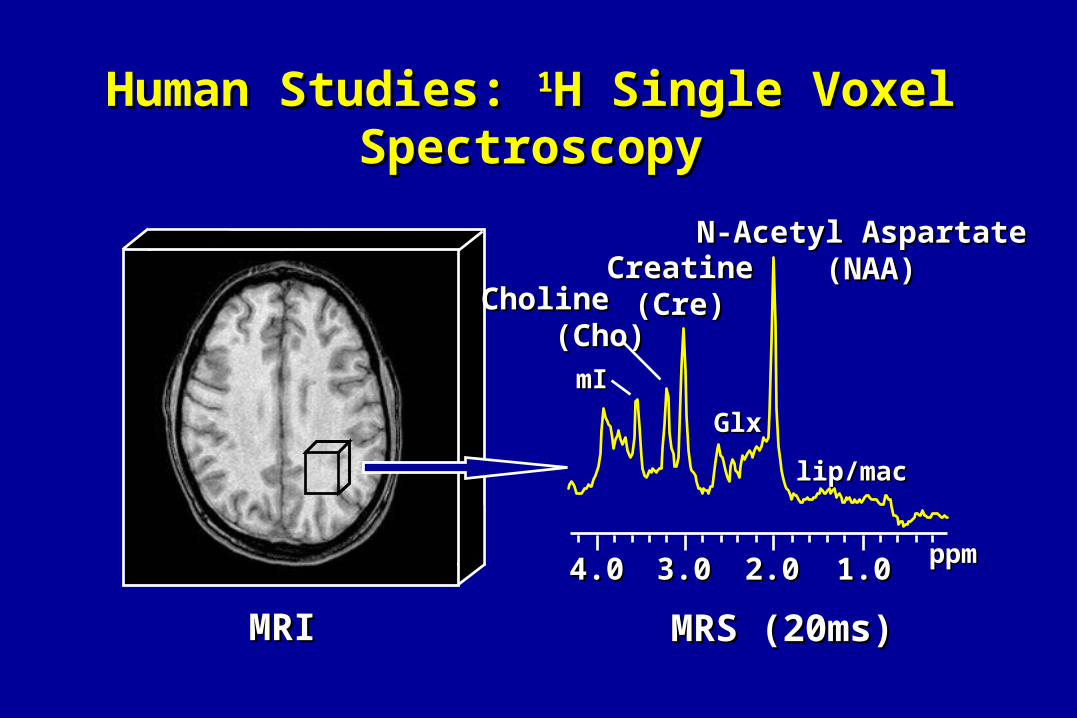
Human Studies: Human Studies: 11H Single Voxel SpectroscopyH Single Voxel Spectroscopy
MRIMRI MRS (20ms)MRS (20ms)
lip/maclip/mac
mImI
GlxGlx
2.02.03.03.0 1.01.0
N-Acetyl Aspartate N-Acetyl Aspartate (NAA)(NAA)CreatineCreatine
(Cre)(Cre)CholineCholine (Cho)(Cho)
4.04.0 ppmppm
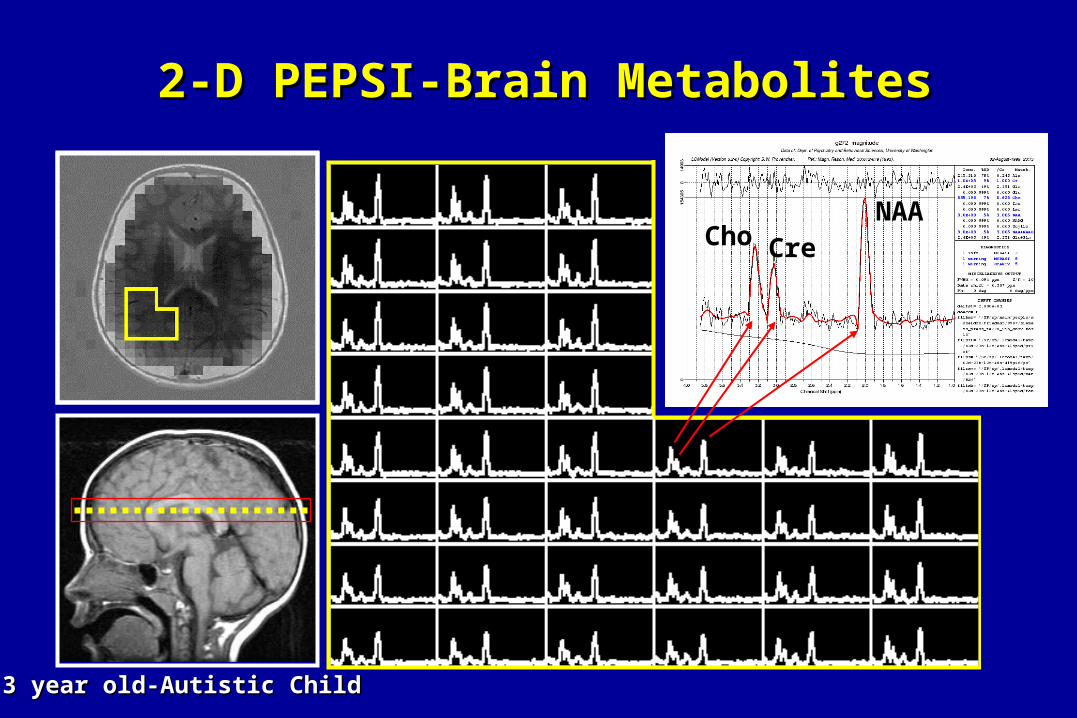
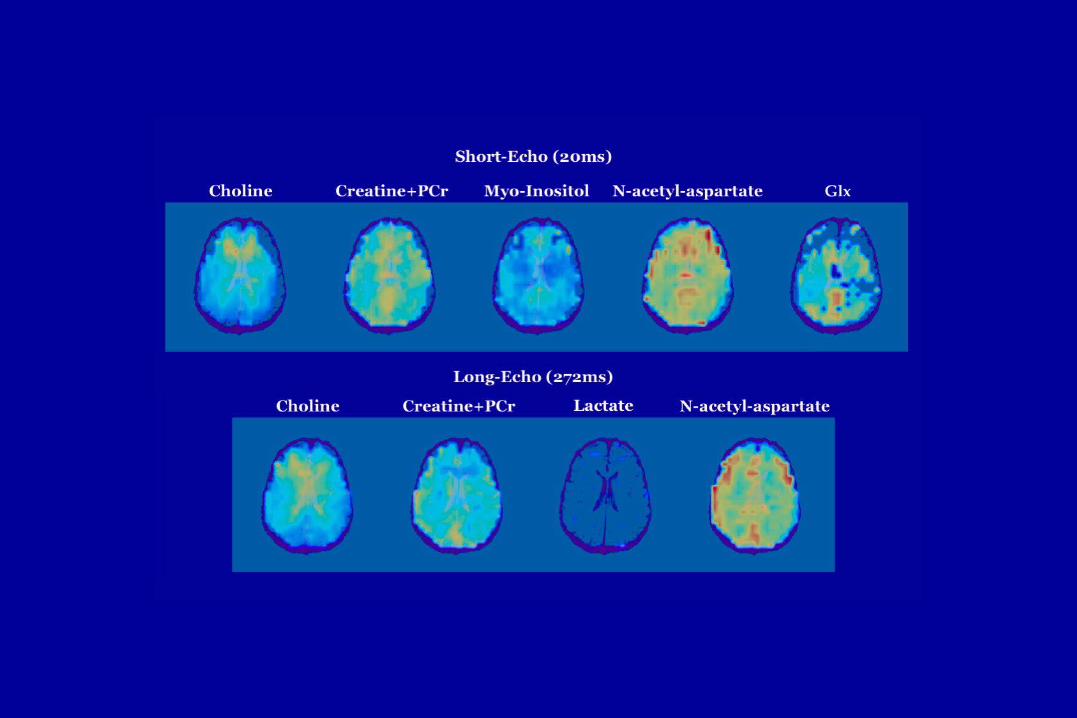
2-D PEPSI-Brain Metabolites2-D PEPSI-Brain Metabolites
Cho CreNAA
3 year old-Autistic Child3 year old-Autistic Child
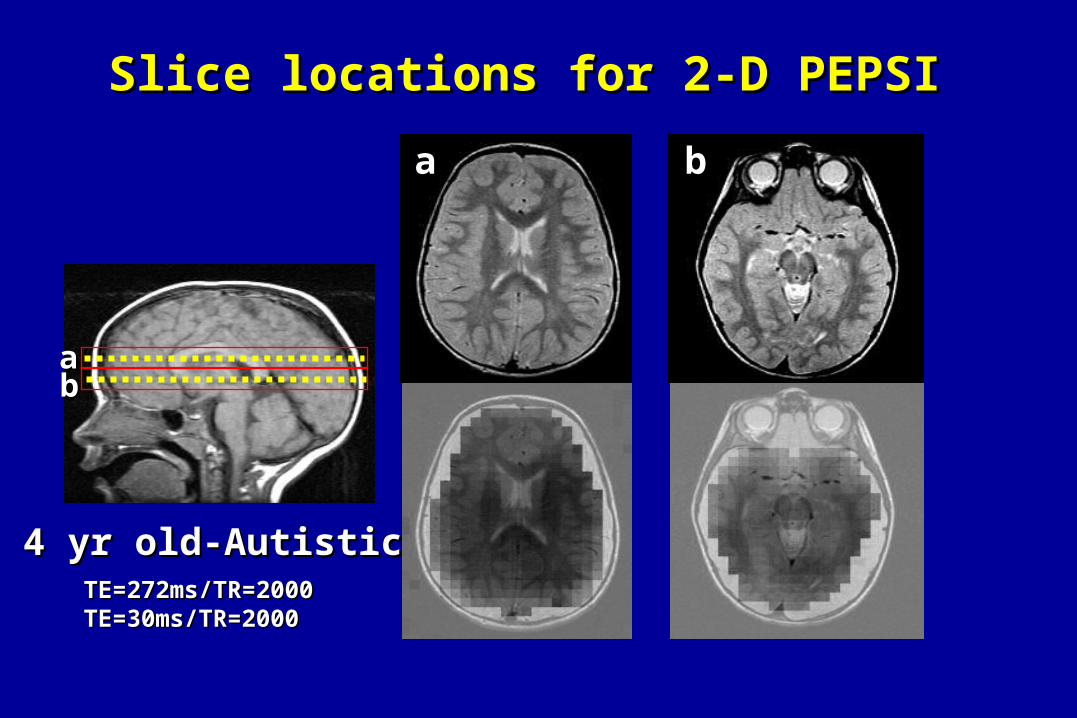
Slice locations for 2-D PEPSI Slice locations for 2-D PEPSI
aabb
aa bb
4 yr old-Autistic4 yr old-AutisticTE=272ms/TR=2000TE=272ms/TR=2000TE=30ms/TR=2000TE=30ms/TR=2000
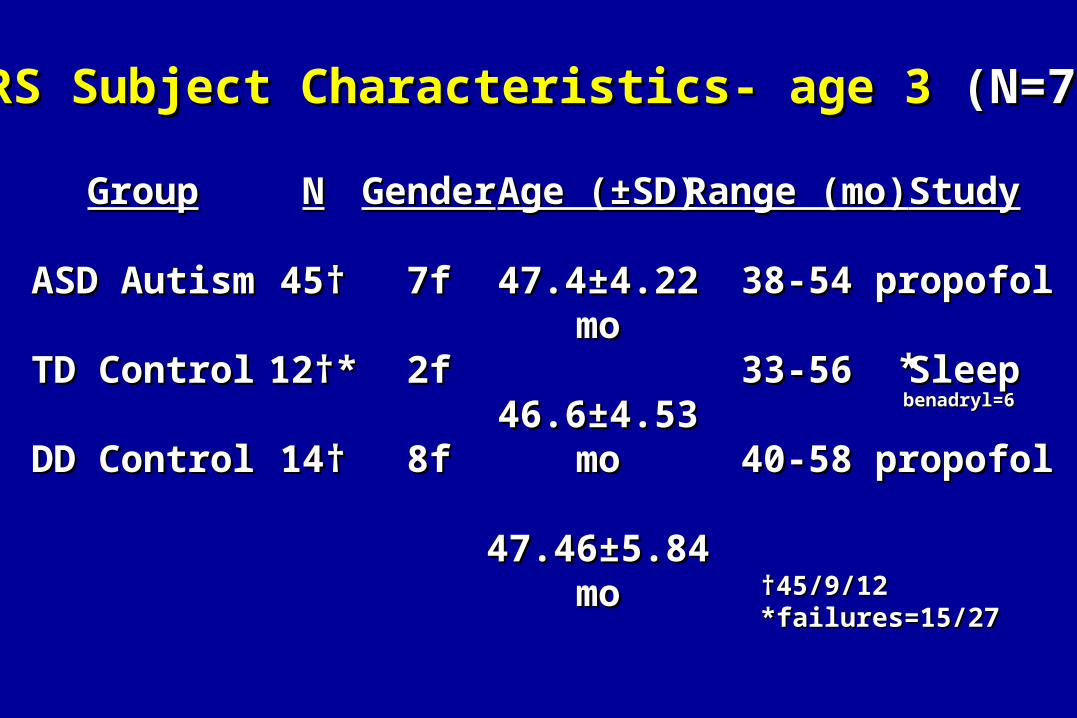
††45/9/12 45/9/12 *failures=15/27*failures=15/27
MRS Subject Characteristics- age 3 MRS Subject Characteristics- age 3 (N=71)(N=71)
GroupGroup
ASD AutismASD Autism
TD ControlTD Control
DD ControlDD Control
NN
45†45†
12†*12†*
14†14†
GenderGender
7f7f
2f2f
8f8f
Age (±SD)Age (±SD)
47.4±4.22 mo47.4±4.22 mo
46.6±4.53 mo46.6±4.53 mo
47.46±5.84 mo47.46±5.84 mo
Range (mo)Range (mo)
38-5438-54
33-5633-56
40-5840-58
**
StudyStudy
propofolpropofol
SleepSleep
propofolpropofol
benadryl=6benadryl=6
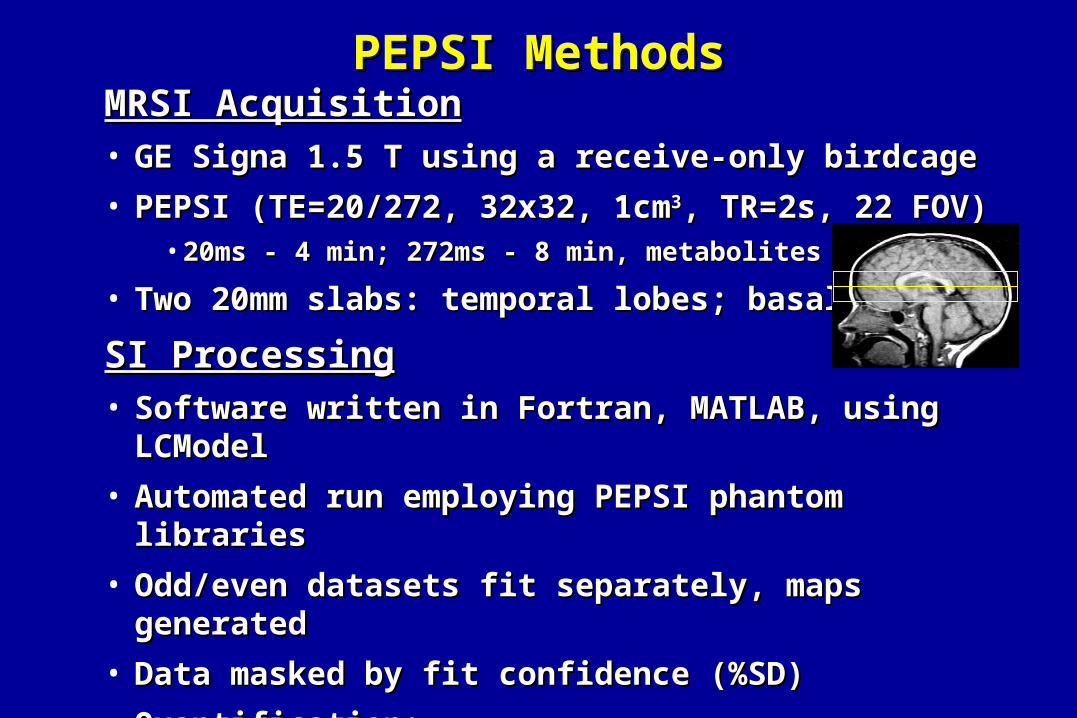
PEPSI MethodsPEPSI MethodsMRSI AcquisitionMRSI Acquisition• GE Signa 1.5 T using a receive-only birdcageGE Signa 1.5 T using a receive-only birdcage
• PEPSI (TE=20/272, 32x32, 1cmPEPSI (TE=20/272, 32x32, 1cm33, TR=2s, 22 FOV) , TR=2s, 22 FOV) • 20ms - 4 min; 272ms - 8 min, metabolites and water20ms - 4 min; 272ms - 8 min, metabolites and water
• Two 20mm slabs: temporal lobes; basal gangliaTwo 20mm slabs: temporal lobes; basal ganglia
SI ProcessingSI Processing• Software written in Fortran, MATLAB, using LCModelSoftware written in Fortran, MATLAB, using LCModel
• Automated run employing PEPSI phantom librariesAutomated run employing PEPSI phantom libraries
• Odd/even datasets fit separately, maps generatedOdd/even datasets fit separately, maps generated
• Data masked by fit confidence (%SD)Data masked by fit confidence (%SD)
• Quantification: Quantification: • Corrected for R1/R2/TG, referenced to brain water corrected for %tissueCorrected for R1/R2/TG, referenced to brain water corrected for %tissue
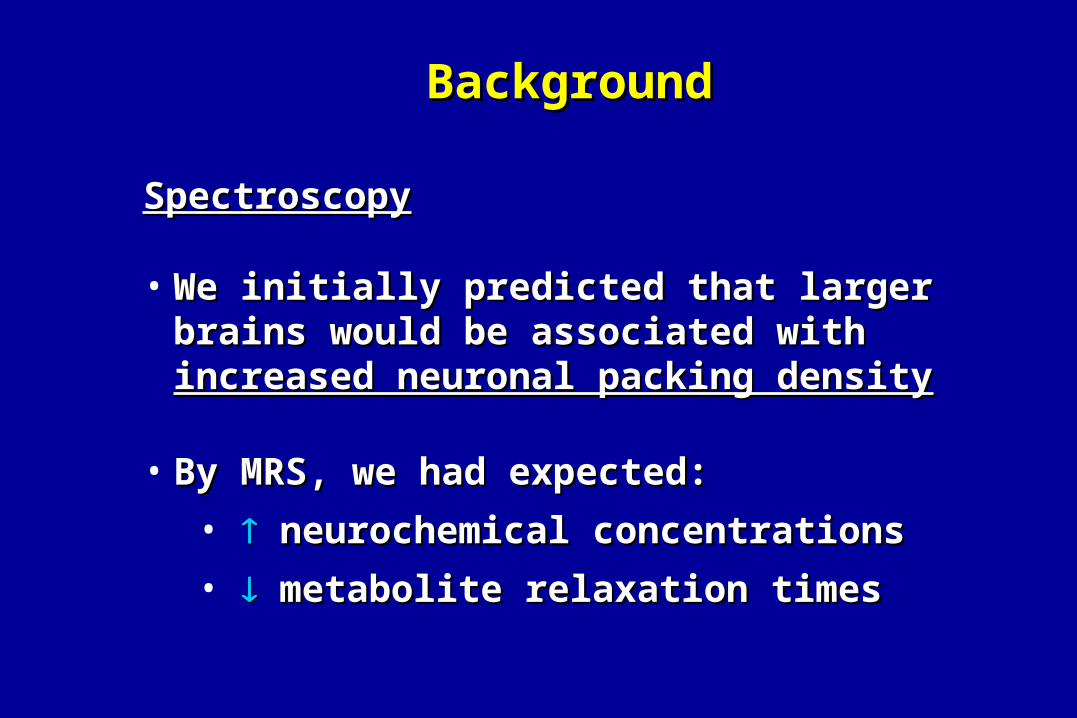
SpectroscopySpectroscopy
• We initially predicted that larger brains would be We initially predicted that larger brains would be associated with associated with increased neuronal packing densityincreased neuronal packing density
• By MRS, we had expected:By MRS, we had expected:
• neurochemical concentrations neurochemical concentrations
• metabolite relaxation timesmetabolite relaxation times
BackgroundBackground
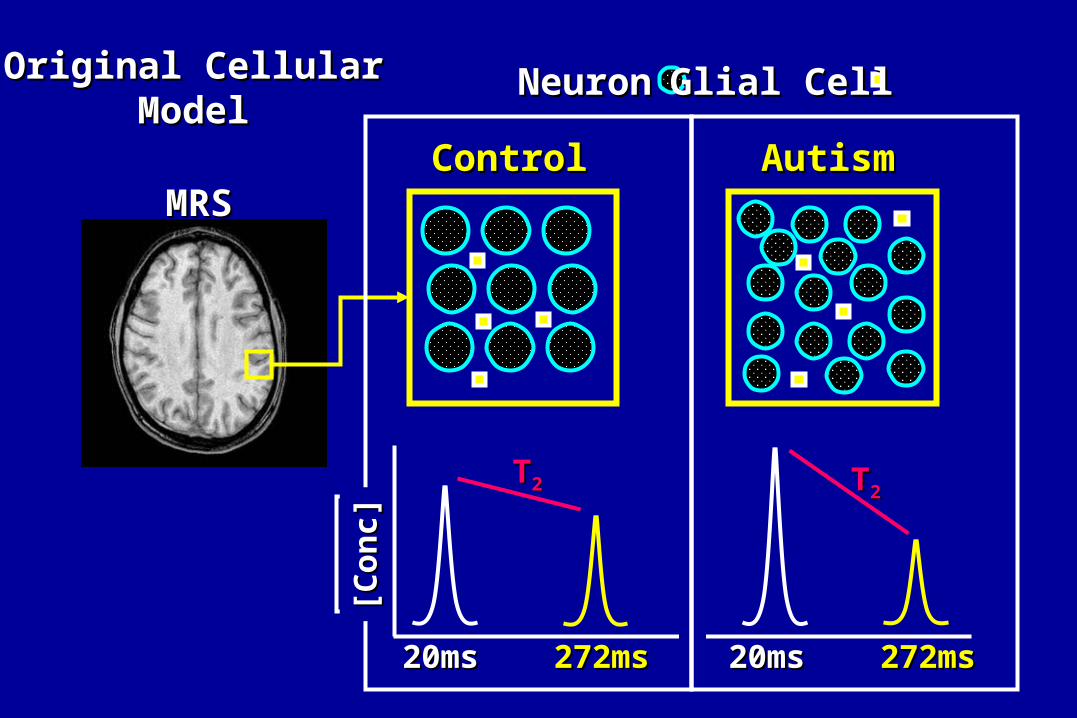
272ms272ms 272ms272ms
TT22 TT22
ControlControl AutismAutism
20ms20ms
NeuronNeuron Glial CellGlial Cell
MRSMRS
20ms20ms
[Con
c][C
onc]
Original CellularOriginal CellularModelModel
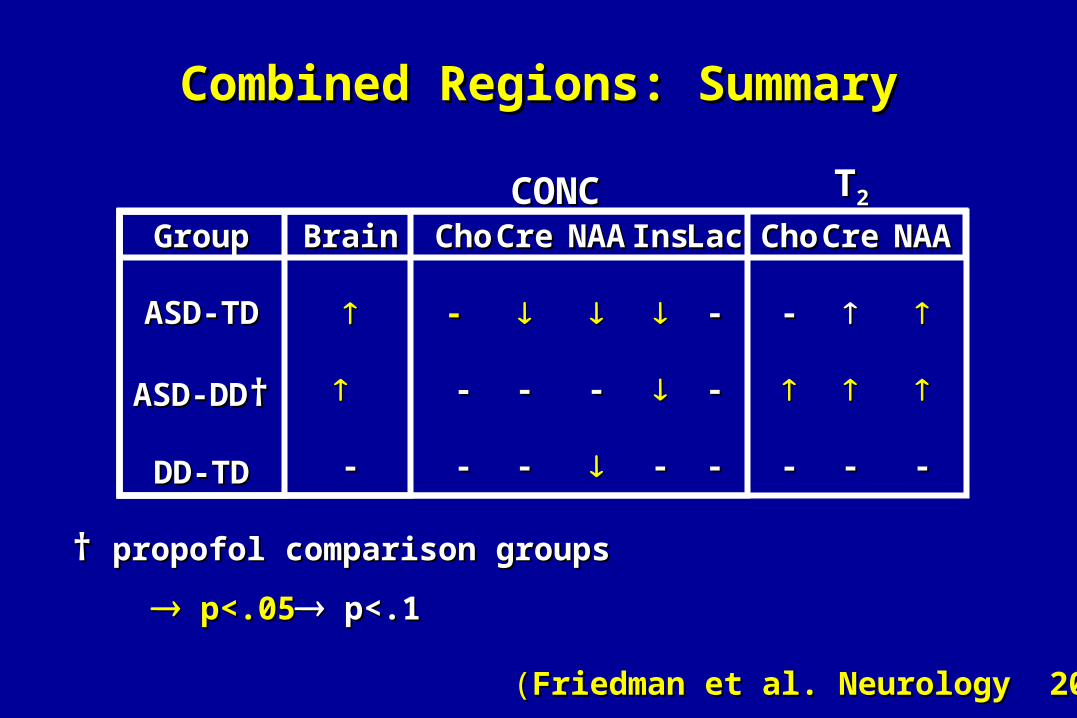
Combined Regions: SummaryCombined Regions: Summary
GroupGroup
ASD-TDASD-TD
ASD-DDASD-DD††
DD-TDDD-TD
BrainBrain
--
ChoCho
- -
--
--
CreCre
--
--
NAANAA
--
InsIns
--
ChoCho
--
--
CreCre
--
NAANAA
--
CONCCONC TT22
p<.05p<.05 p<.1p<.1
†† propofol comparison groupspropofol comparison groups
LacLac
--
--
--
((FriedmanFriedman et al. Neurology 2003)et al. Neurology 2003)
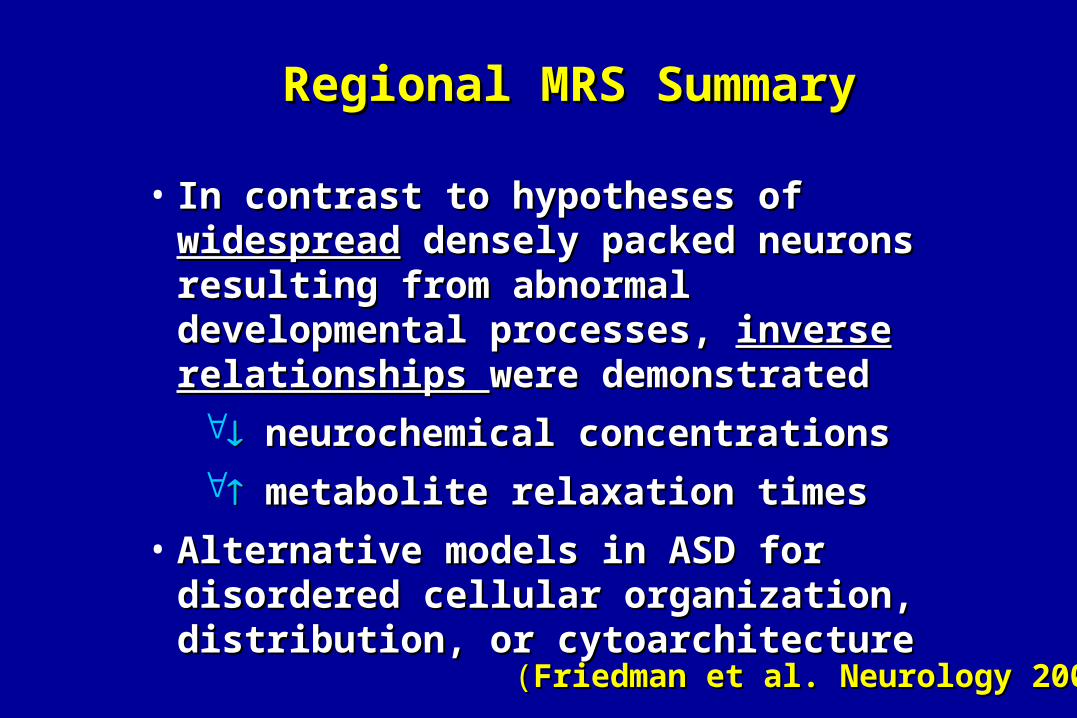
• In contrast to hypotheses of In contrast to hypotheses of widespreadwidespread densely densely packed neurons resulting from abnormal packed neurons resulting from abnormal developmental processes, developmental processes, inverse relationships inverse relationships were demonstratedwere demonstrated
neurochemical concentrations neurochemical concentrations
metabolite relaxation timesmetabolite relaxation times
• Alternative models in ASD for disordered cellular Alternative models in ASD for disordered cellular organization, distribution, or cytoarchitectureorganization, distribution, or cytoarchitecture
Regional MRS SummaryRegional MRS Summary
((FriedmanFriedman et al. Neurology 2003)et al. Neurology 2003)
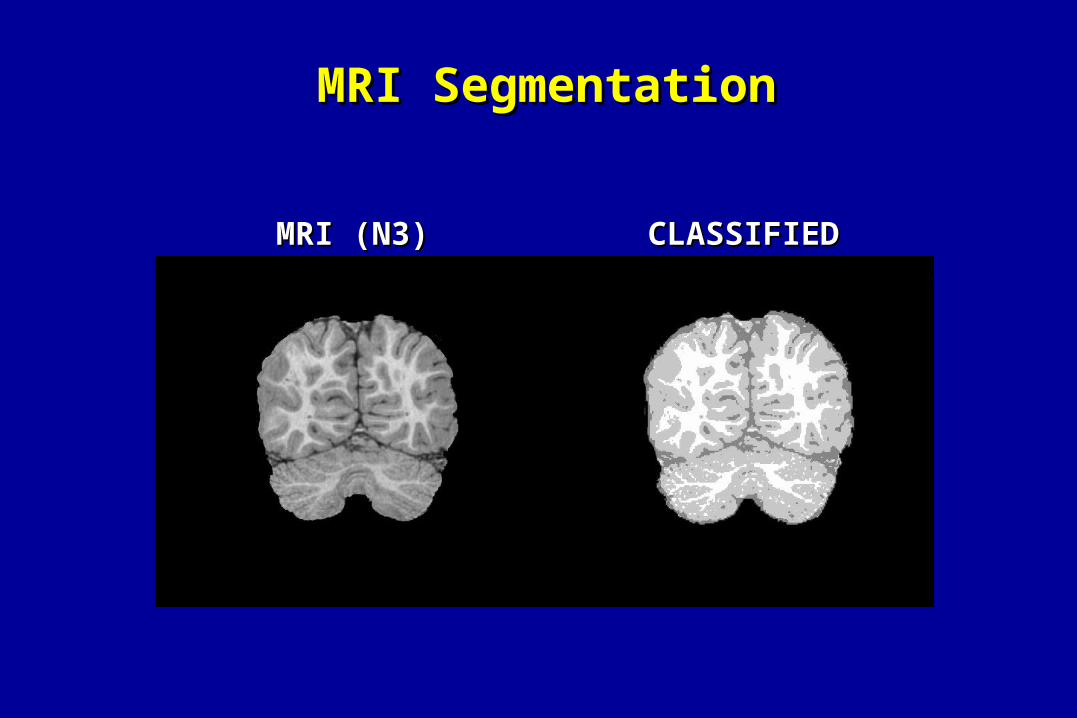
MRI SegmentationMRI Segmentation
CLASSIFIEDCLASSIFIEDMRI (N3)MRI (N3)
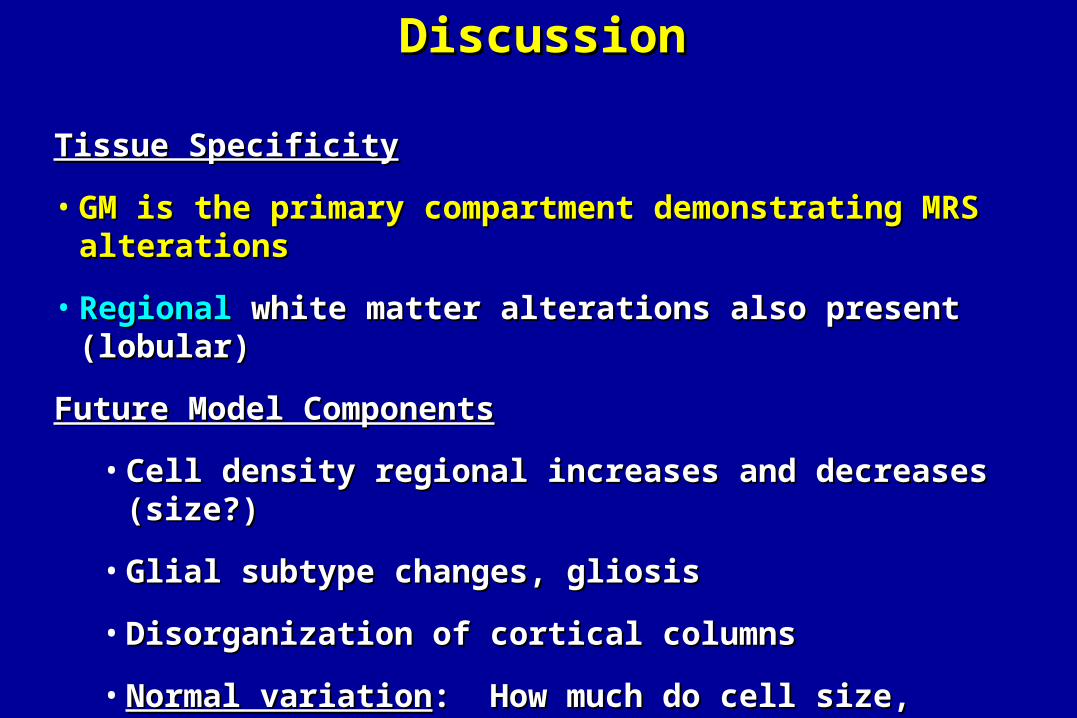
Tissue SpecificityTissue Specificity
• GMGM is the primary compartment demonstrating MRS alterationsis the primary compartment demonstrating MRS alterations
• RegionalRegional white matter alterations also present (lobular) white matter alterations also present (lobular)
Future Model ComponentsFuture Model Components
• Cell density regional increases and decreases (size?)Cell density regional increases and decreases (size?)
• Glial subtype changes, gliosisGlial subtype changes, gliosis
• Disorganization of cortical columnsDisorganization of cortical columns
• Normal variationNormal variation: How much do cell size, distribution : How much do cell size, distribution (neurons/glia), terminal density, and packing ratio (neurons/glia), terminal density, and packing ratio (intra/extracellular fractions) differ with increasing brain size?(intra/extracellular fractions) differ with increasing brain size?
DiscussionDiscussion
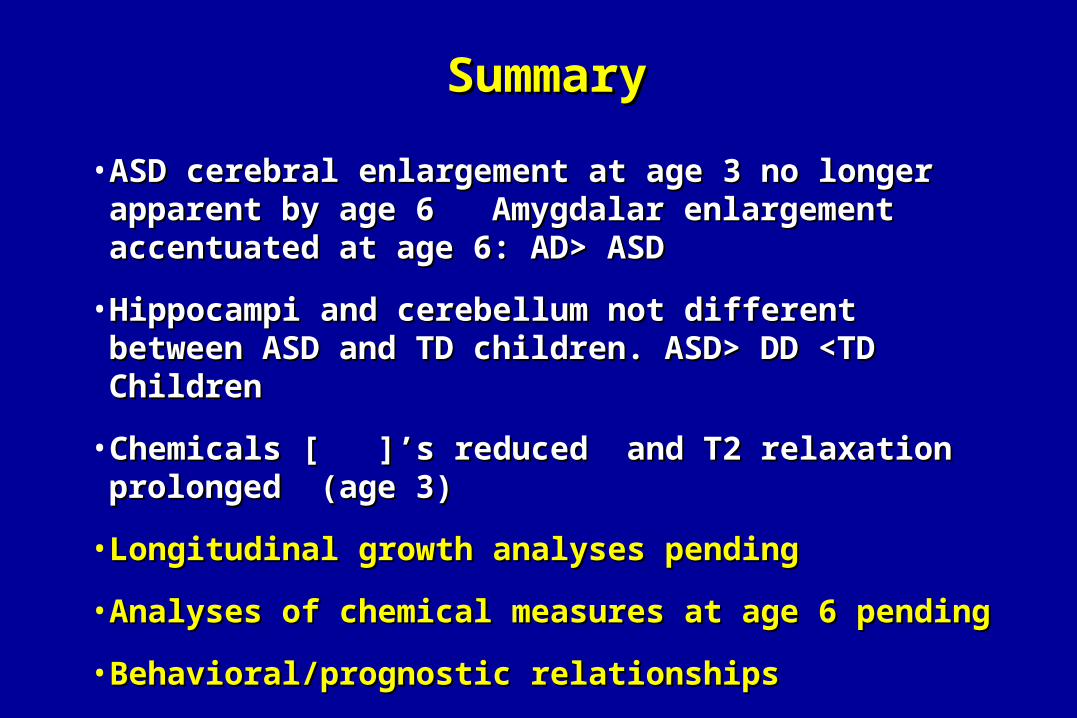
• ASD cerebral enlargement at age 3 no longer apparent by age 6 ASD cerebral enlargement at age 3 no longer apparent by age 6 Amygdalar enlargement accentuated at age 6: AD> ASDAmygdalar enlargement accentuated at age 6: AD> ASD
• Hippocampi and cerebellum not different between ASD and TD Hippocampi and cerebellum not different between ASD and TD children. ASD> DD <TD Childrenchildren. ASD> DD <TD Children
• Chemicals [ ]’s reduced and T2 relaxation prolonged (age 3)Chemicals [ ]’s reduced and T2 relaxation prolonged (age 3)
• Longitudinal growth analyses pendingLongitudinal growth analyses pending
• Analyses of chemical measures at age 6 pendingAnalyses of chemical measures at age 6 pending
• Behavioral/prognostic relationshipsBehavioral/prognostic relationships
SummarySummary
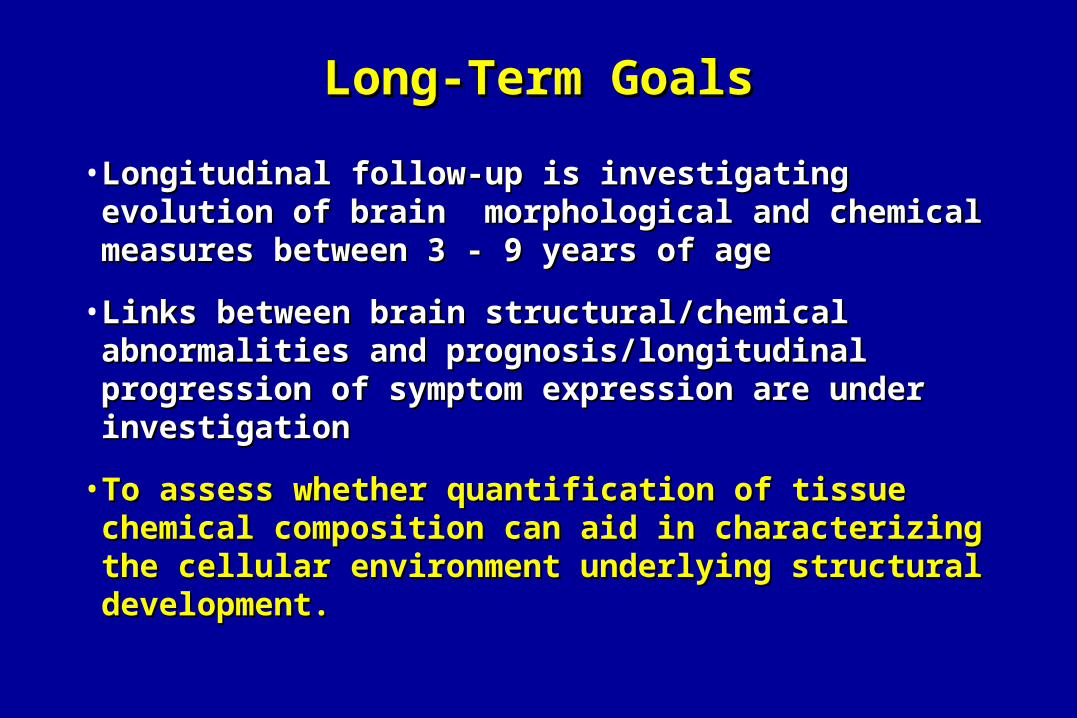
• Longitudinal follow-up is investigating evolution of brain Longitudinal follow-up is investigating evolution of brain morphological and chemical measures between 3 - 9 years of agemorphological and chemical measures between 3 - 9 years of age
• Links between brain structural/chemical abnormalities and Links between brain structural/chemical abnormalities and prognosis/longitudinal progression of symptom expression are prognosis/longitudinal progression of symptom expression are under investigationunder investigation
• To assess whether quantification of tissue chemical composition To assess whether quantification of tissue chemical composition can aid in characterizing the cellular environment underlying can aid in characterizing the cellular environment underlying structural development.structural development.
Long-Term GoalsLong-Term Goals

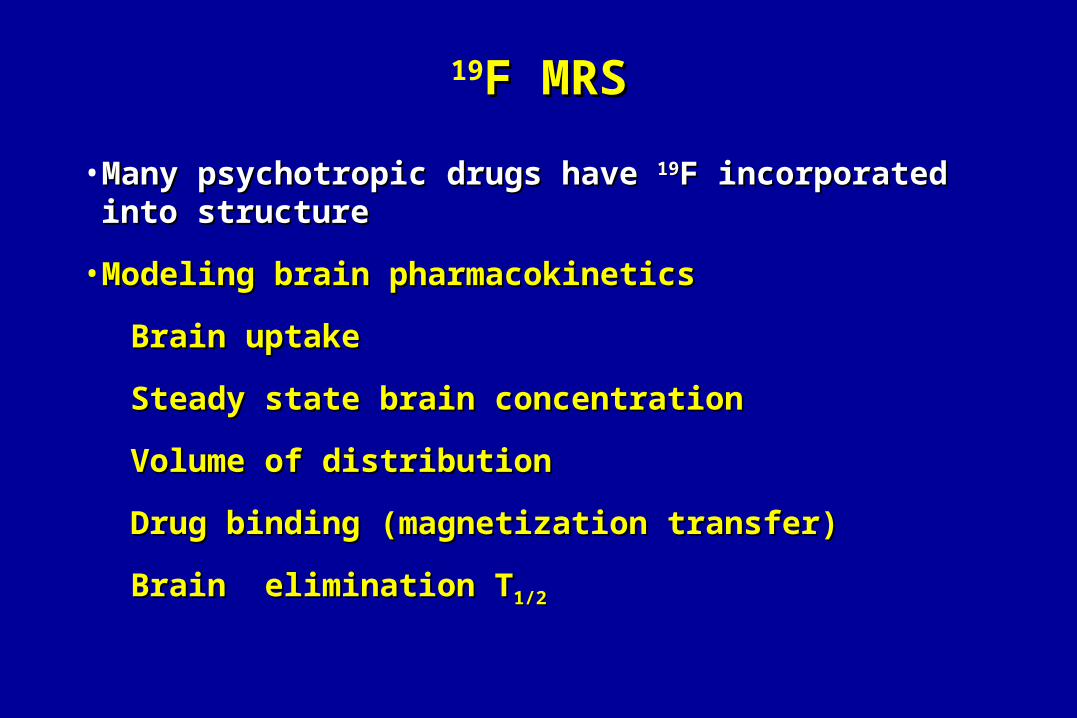
• Many psychotropic drugs have Many psychotropic drugs have 1919F incorporated into structureF incorporated into structure
• Modeling brain pharmacokineticsModeling brain pharmacokinetics
Brain uptakeBrain uptake
Steady state brain concentrationSteady state brain concentration
Volume of distributionVolume of distribution
Drug binding (magnetization transfer)Drug binding (magnetization transfer)
Brain elimination TBrain elimination T1/21/2
19F MRSF MRS
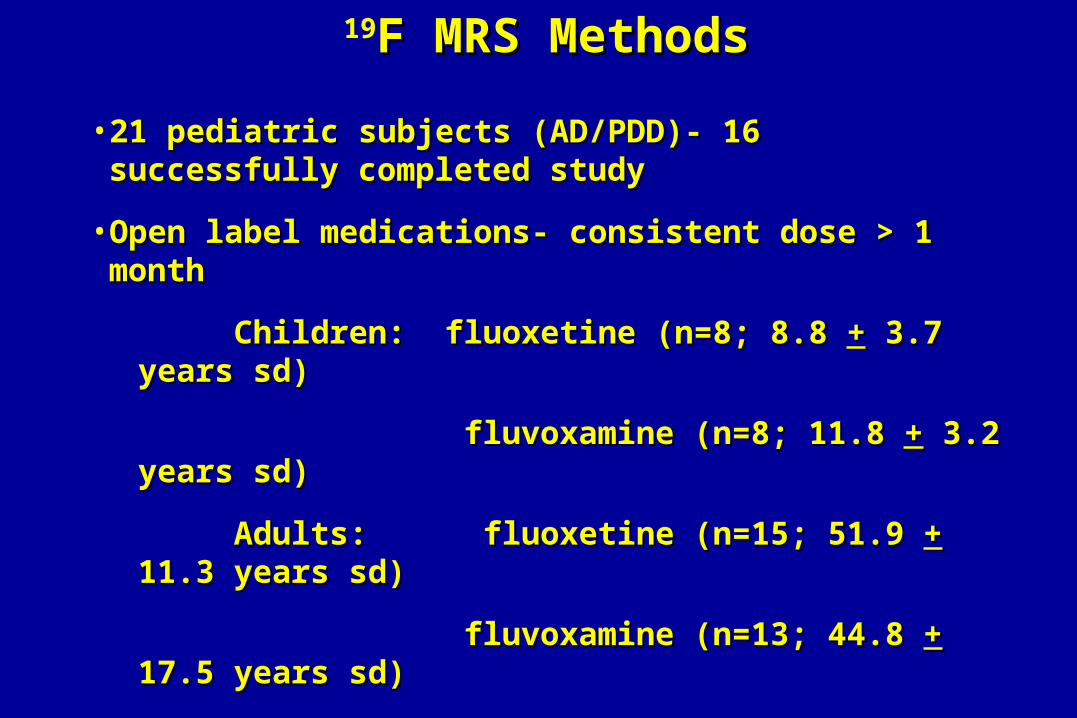
• 21 pediatric subjects (AD/PDD)- 16 successfully completed study21 pediatric subjects (AD/PDD)- 16 successfully completed study
• Open label medications- consistent dose > 1 monthOpen label medications- consistent dose > 1 month
Children: fluoxetine (n=8; 8.8 Children: fluoxetine (n=8; 8.8 ++ 3.7 years sd) 3.7 years sd)
fluvoxamine (n=8; 11.8 fluvoxamine (n=8; 11.8 ++ 3.2 years sd) 3.2 years sd)
Adults: fluoxetine (n=15; 51.9 Adults: fluoxetine (n=15; 51.9 ++ 11.3 years sd) 11.3 years sd)
fluvoxamine (n=13; 44.8 fluvoxamine (n=13; 44.8 ++ 17.5 years sd) 17.5 years sd)
• Elimination T1/2 for 2 children discontinued from fluoxetineElimination T1/2 for 2 children discontinued from fluoxetine
• Whole brain drug [ ] determined using a GE Signa 1.5TWhole brain drug [ ] determined using a GE Signa 1.5T
• Home built Home built 1919F quadrature birdcage headcoilF quadrature birdcage headcoil
drug [ ] determined relative to NaF phantom at each sessiondrug [ ] determined relative to NaF phantom at each session
19F MRS MethodsF MRS Methods
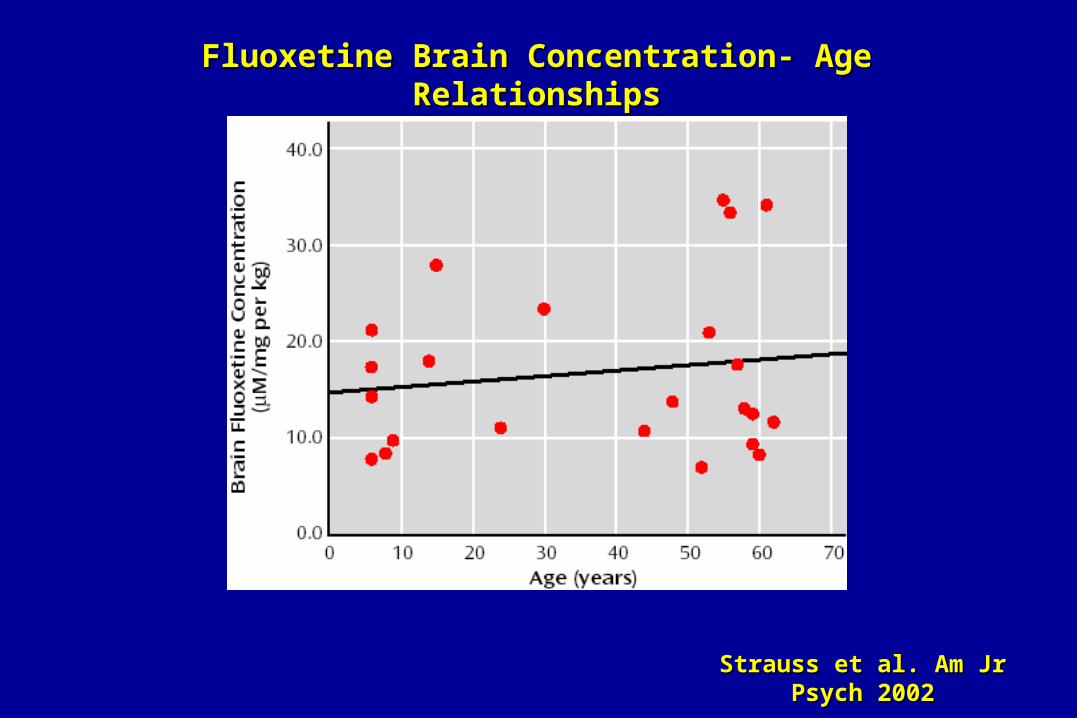
Strauss et al. Am Jr Psych 2002Strauss et al. Am Jr Psych 2002
Fluoxetine Brain Concentration- Age RelationshipsFluoxetine Brain Concentration- Age Relationships
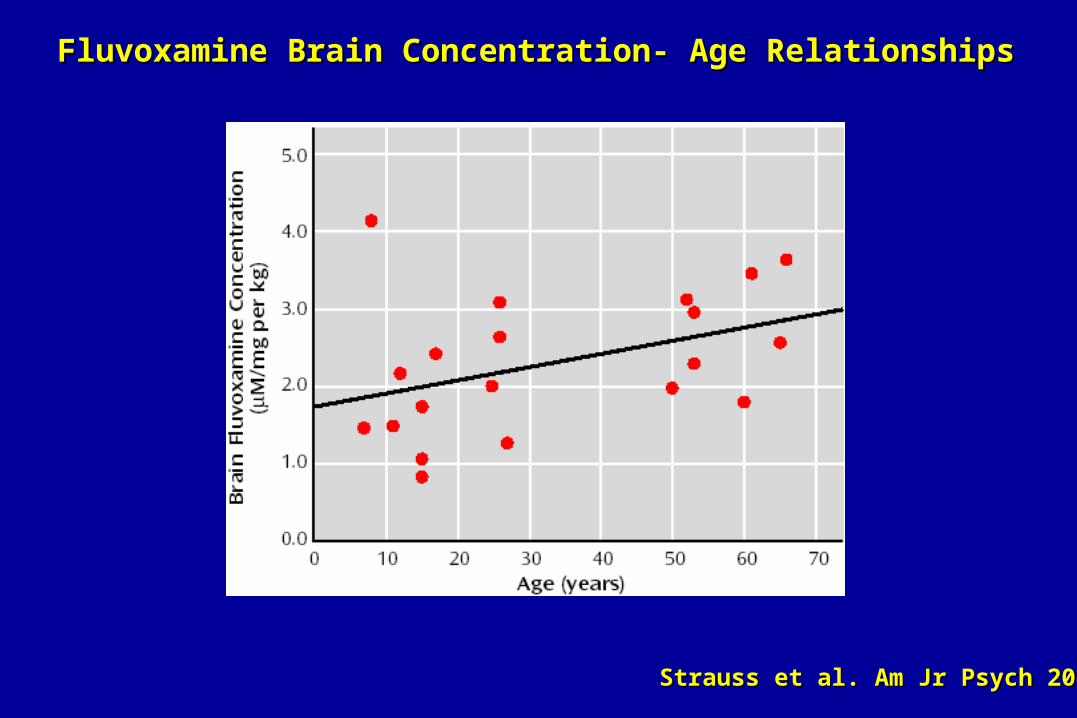
Fluvoxamine Brain Concentration- Age RelationshipsFluvoxamine Brain Concentration- Age Relationships
Strauss et al. Am Jr Psych 2002Strauss et al. Am Jr Psych 2002
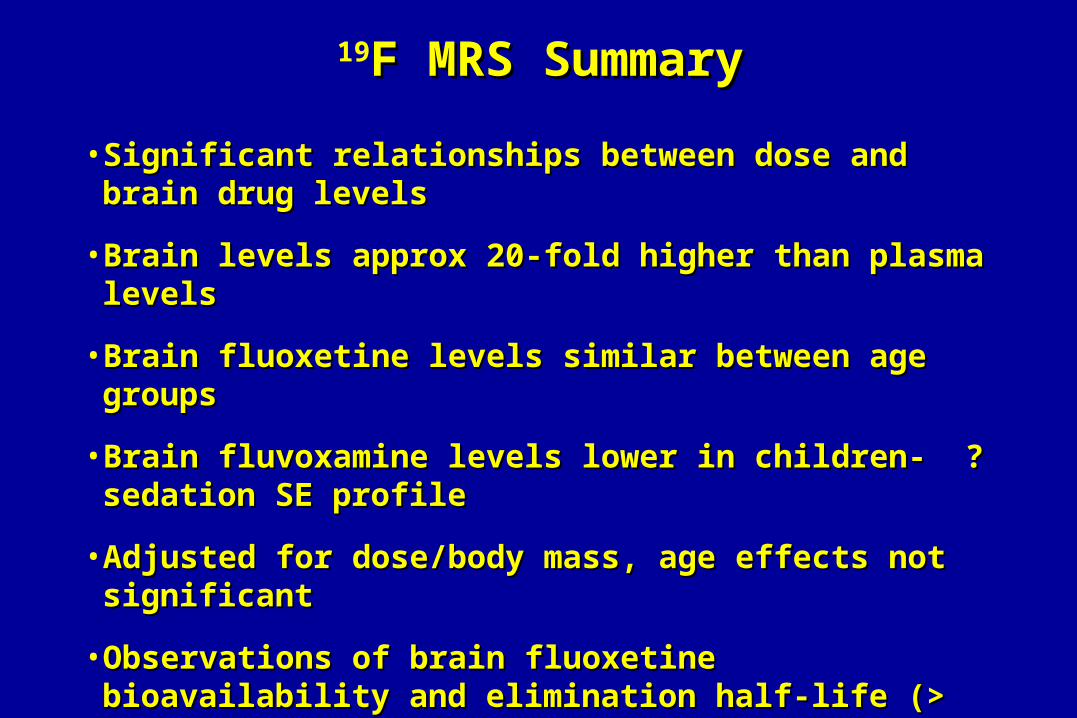
• Significant relationships between dose and brain drug levelsSignificant relationships between dose and brain drug levels
• Brain levels approx 20-fold higher than plasma levelsBrain levels approx 20-fold higher than plasma levels
• Brain fluoxetine levels similar between age groupsBrain fluoxetine levels similar between age groups
• Brain fluvoxamine levels lower in children- ? sedation SE profileBrain fluvoxamine levels lower in children- ? sedation SE profile
• Adjusted for dose/body mass, age effects not significantAdjusted for dose/body mass, age effects not significant
• Observations of brain fluoxetine bioavailability and elimination Observations of brain fluoxetine bioavailability and elimination half-life (> 16 days) similar between age groupshalf-life (> 16 days) similar between age groups
• More efficient hepatic clearance in children-More efficient hepatic clearance in children-
Brain drug levels relatively invisible to liver vs plasma levels Brain drug levels relatively invisible to liver vs plasma levels
19F MRS SummaryF MRS Summary
Key PersonnelKey Personnel
Seth Friedman, PhDSeth Friedman, PhDDennis Shaw, MD Dennis Shaw, MD Jeff Munson, PhD Jeff Munson, PhD Sarah Webb, PhDSarah Webb, PhDAlan Artru, MD Alan Artru, MD Bobbi Sparks, BSBobbi Sparks, BSTodd Richards, PhDTodd Richards, PhDKenneth Maravilla, MDKenneth Maravilla, MDJill Gardner, PhDJill Gardner, PhDCecil Hayes, PhDCecil Hayes, PhDGeri Dawson, PhDGeri Dawson, PhD
RadiologyRadiologyRadiologyRadiologyPsychologyPsychologyPsychologyPsychologyAnesthesiologyAnesthesiologyRadiology Radiology RadiologyRadiologyRadiologyRadiologyRadiologyRadiologyRadiologyRadiologyPsychologyPsychology
Collaborators:Collaborators:
Jay Giedd, MDJay Giedd, MDStefan Posse, PhDStefan Posse, PhD
Supported by:Supported by:
NICHD (PO1- HD34565)NICHD (PO1- HD34565)
NAAR Neuropharmacology FellowshipNAAR Neuropharmacology Fellowship
University of WashingtonUniversity of Washington
Wayne Strauss, MD PhD BioengineeringWayne Strauss, MD PhD Bioengineering
We gratefully acknowledge support from the We gratefully acknowledge support from the NICHD (PO1- NICHD (PO1- HD34565)HD34565)..
We wish also to extend our thanks to the parents and children We wish also to extend our thanks to the parents and children who participated in this study.who participated in this study.
AcknowledgmentsAcknowledgments
Recommended