PERCEPTION OF THE THERMAL ENVIRONMENT IN
LIBRARY CENTRE AT UTeM: SUBJECTIVE
PREFERENCES AND THERMAL COMFORT
DUE TO AIR CONDITIONING SYSTEM
NADIAH ZAFIRAH BINTI AL-AZMI
B071110328
UNIVERSITI TEKNIKAL MALAYSIA MELAKA
2015

UNIVERSITI TEKNIKAL MALAYSIA MELAKA
PERCEPTION OF THE THERMAL ENVIRONMENT IN
LIBRARY CENTRE AT UTeM: SUBJECTIVE
PREFERENCES AND THERMAL COMFORT
DUE TO AIR CONDITONING SYSTEM
This report submitted in accordance with requirement of the Universiti Teknikal
Malaysia Melaka (UTeM) for the Bachelor of Mechanical Engineering Technology
(Refrigeration & Air-Conditioning Systems) (Hons.)
by
NADIAH ZAFIRAH BINTI AL-AZMI
B071110328
920722-14-6522
FACULTY OF ENGINEERING TECHNOLOGY
2015
UNIVERSITI TEKNIKAL MALAYSIA MELAKA
BORANG PENGESAHAN STATUS LAPORAN PROJEK SARJANA MUDA
TAJUK: Perception of the Thermal Environment in Library Centre at UTeM: Subjective Preferences and Thermal Comfort due to Air Conditioning Systems SESI PENGAJIAN: 2014/15 Semester 2 Saya NADIAH ZAFIRAH BINTI AL-AZMI Mengaku membenarkan Laporan PSM ini disimpan di Perpustakaan Universiti Teknikal Malaysia Melaka (UTeM) dengan syarat-syarat kegunaan seperti berikut: 1. Laporan PSM adalah hak milik Universiti Teknikal Malaysia Melaka dan penulis. 2. Perpustakaan Universiti Teknikal Malaysia Melaka dibenarkan membuat salinan
untuk tujuan pengajian sahaja dengan izin penulis. 3. Perpustakaan dibenarkan membuat salinan laporan PSM ini sebagai bahan
pertukaran antara institusi pengajian tinggi. 4. **Sila tandakan ( )
SULIT
TERHAD
TIDAK TERHAD
(Mengandungi maklumat yang berdarjah keselamatan atau kepentingan Malaysia sebagaimana yang termaktub dalam AKTA RAHSIA RASMI 1972)
(Mengandungi maklumat TERHAD yang telah ditentukan oleh organisasi/badan di mana penyelidikan dijalankan)
Alamat Tetap: Lot 4206-1, Jalan Kerdas 4,
Batu 5 ¾, Gombak,
53100 Selangor Darul Ehsan. Tarikh: ________________________
Disahkan oleh:
Cop Rasmi: Tarikh: _______________________
** Jika Laporan PSM ini SULIT atau TERHAD, sila lampirkan surat daripada pihak berkuasa/organisasi berkenaan dengan menyatakan sekali sebab dan tempoh laporan PSM ini perlu dikelaskan sebagai SULIT atau TERHAD.
ABSTRAK
Keselesaan terma merupakan adaptasi daripada tubuh badan manusia cenderung
untuk menerima keadaan persekitaran. Persepsi seseorang terhadap keselesaan terma
adalah dipengaruhi oleh suhu udara, kelembapan relatif, halaju udara, suhu pancaran
persekitaran, kadar metabolisme bagi aktiviti-aktiviti kerja dan penebat pakaian.
Sistem penyaman udara bangunan yang cekap dan kondusif akan memberi impak
persekitaran yang baik bagi keselesaan penghuni dan menigkatkan prestasi
produktiviti kerja serta mengurangkan kadar tidak puas hati pengguna. Setelah
mengenalpasti akan kepentingan keselesaan terma kepada penghuni, objektif utama
kajian adalah untuk mengenalpasti persepi staf perpustakaan UTeM terhadap haba
persekitaran di tempat kerja mereka kepada sistem penyaman udara yang sedia ada
dengan menggunakan pendekatan kualitatif dan kuantitatif. Penentuan persepsi
penghuni terhadap keselesaan terma telah diperolehi melalui kaedah pemerhatian dan
analisis yang berkaitan dengan soal selidik keselesaan terma serta hubungkait dengan
hasil daripada pengukuran objektif. Pengukuran sebenar keselesaan terma dalam
unit-unit kerja telah dilaksanakan menggunakan pengukuran pemantauan bacaan
terusan oleh instrumen keselesaan terma bagi menentukan nilai-nilai PMV dan PPD.
Lanjutan daripada kajian ini menunjukkan persepsi kakitangan perpustakaan
terhadap persekitan haba di ruang kerja mereka adalah pada tahap sederhana
(melebihi 60%). Selain daripada faktor persekitaran, penyesuaian terma dan
psikologi penghuni kuat mempengaruhi keselesaan terma manusia. Penyelenggaraan
pada sistem penyaman udara bangunan perlu diambil kira bagi menghasilkan
persekitaran haba yang baik.
i
ABSTRACT
Thermal comfort is an adaptation of the human body, tends to accept environmental
conditions. A person’s perception of thermal comfort is affected by air temperature,
relative humidity, air velocity, mean radiant temperature, metabolic rate for work
activities and clothing insulation. The demand for conducive high efficient air
conditioned office building provides a thermally acceptable environment for human
comfort and work that would in order to enable better work productivity performance
and less occupant’s thermal dissatisfaction. In recognizing the significance of
thermal comfort level to occupants, the main objective of the study is to determine
the thermal environment perception among UTeM’s library staffs to the existing air
conditioning system in their workplace by means of both qualitative and quantitative
approaches. Determination of occupants’ perception on thermal comfort was
obtained through observation and analysis method associated with a questionnaire on
thermal comfort with respect to findings of objective measurement. Measurement of
actual thermal comfort in work units was conducted by direct reading monitoring
linked with thermal comfort instruments to determine the PMV and PPD values.
Further to this study, it shown that the perception of library staffs on thermal
environment in their workspace is at moderate level (more than 60%). The result
indicated besides the substantial role of environmental factors, thermal adaptation
and psychological parameters strongly affect human thermal comfort. Maintaining
on AC system of the research building should be taken into consideration to produce
good thermal environment.
ii
DEDICATION
I would like to express my deepest appreciation and special thanks to everyone,
especially to both of my beloved parents and family who have given their support,
encouragement and good advice to me. Not forgotten, to my project supervisor,
panel, lecturer and friends that were helped directly or indirectly in this study.
iii
ACKNOWLEDGEMENT
First and foremost, I am grateful to Allah S.W.T for establishing me to complete this
Bachelor Degree’s Project. I would like to express the deepest gratitude to my
supervisor, Mr Azwan Bin Aziz for his full support, expert guidance, understanding
and encouragement throughout my study and research. Without his incredible
patience and timely wisdom and counsel, my thesis work would have been a
frustrating and overwhelming pursuit. I would also like to thank to laboratory
technician, Mr Khairul Fitri for helping me with my process to borrow the thermal
comfort equipments. In addition, I express my appreciation to my panel, Dr. Ahmed
Salemn Bin Ghooth. His thoughtful question and comment were valued greatly. It
would be impossible to write this thesis without the help and support of the kind
people around me, to only some of whom it possible to give particular mention here.
Special thanks go to my numerous friends who helped me throughout this academic
exploration. Finally, I would like to thank my family for their unconditional love and
support in my life. I would not have been able to complete this thesis without their
continuous love and encouragement.
iv
TABLE OF CONTENT
Abstrak i
Abstract ii
Dedication iii
Acknowledgement iv
Table of Content v
List of Tables x
List of Figures xii
List Abbreviations, Symbols and Nomenclatures xiv
CHAPTER 1: INTRODUCTION 1
1.1 Background Of Study 1
1.2 Problems Statements 2
1.3 Research Objectives 3
1.4 Limitations Of Study 4
CHAPTER 2: LITERATURE REVIEW 5
2.1 Introduction To Thermal Comfort 5
2.2 Research And Observations Of Thermal Comfort 7
2.3 Main Factors Affecting Thermal Comfort 8
2.3.1 The Effect Of Air Temperature 8
2.3.2 The Effect Of Relative Humidity 8
2.3.3 The Effect Of Air Velocity 9
2.3.4 The Effect Of Mean Radiant Temperature 9
2.3.5 The Effect Of Clothing Insulation 10
2.3.6 The Effect Of Metabolic Rate 10
2.4 Secondary Factors Affecting Thermal Comfort 11
2.4.1 Day-To-Day Variations 11
2.4.2 Age 11
v
2.4.3 Adaptation 12
2.4.4 Gender 12
2.5 Prediction Thermal Comfort 13
2.5.1 Predicted Mean Vote (PMV) And Predicted Percentage Of 13
Dissatisfied (PPD) Model
2.5.2 Adaptive Model 15
2.6 General Thermal Comfort Considerations For Determining Comfort Zone 16
2.6.1 Operative Temperature 16
2.62 Humidity Limits 17
2.6.3 Elevated Air Velocity 17
2.6.4 Local Thermal Discomfort 18
2.6.5 Temperature Variations With Time 19
CHAPTER 3: METHODOLOGY 20
3.1 Study Design 20
3.2 Target Population 20
3.3 Sample Frame 21
3.4 Data Collection Methods 22
3.4.1 Walk-Through Inspection On AC System 22
3.4.2 Self-Administered Questionnaire 22
3.4.3 Field Measurement Of Thermal Environmental Parameters 24
3.5 Analysis Of Findings 25
3.6 Ethical Considerations 25
CHAPTER 4: RESULT & DISCUSSION 26
4.1 Specific Thermal Comfort Environmental Parameters Analysis 26
4.1.1 Air Temperature 28
4.1.2 Air Velocity 29
4.1.3 Relative Humidity 31
4.2 Questionnaire Response Analysis 32
4.2.1 Building Occupant Background 32
4.2.1 1 Distribution Percentage On Age And Gender 33
4.2.1 2 Distribution Percentage On Period Of Years Worked 34 vi
4.2.1 3 Distribution Percentage On Average Hours Spend In 35
Workspace
4.2.2 Personal Workspace Location 36
4.2.2.1 Distribution Percentage On Location Near Exterior 36
Wall
4.2.2.2 Distribution Percentage On Location Near Window 37
4.2.3 Office Layout And Visual Comfort 38
4.2.3.1 Distribution Percentage Of Perception On Amount Of 39
Space Available
4.2.3.2 Distribution Percentage Of Perception On Level Of 40
Visual Privacy
4.2.3.3 Distribution Percentage Of Perception On Ease Of 41
Interaction
4.2.3.4 Relationship Between Office Layout And Privacy 42
Satisfaction And Self-Assessed Productivity
4.2.4 Thermal Comfort 43
4.2.4.1 Distribution Percentage Of Perception On Air 44
Temperature
4.2.4.2 Distribution Percentage Of Perception On Air Velocity 45
4.2.4.3 Distribution Percentage Of Perception On Surrounding 46
Humidity
4.2.4.4 Relationship Between Thermal Comfort Satisfaction 47
And Self-Assessed Productivity
4.2.5 Air Quality 48
4.2.5.1 Distribution Percentage Of Perception On Air Quality 48
4.2.5.2 Relationship Between IAQ Satisfaction And 50
Self-Assessed Productivity
4.2.6 Lighting Quality 51
4.2.6.1 Distribution Percentage Of Perception On Amount Of 52
Light
4.2.6.2 Distribution Percentage Of Perception On 53
Visual Comfort Of Lighting
vii
4.2.6.3 Relationship Between Lighting Satisfaction And 54
Self-Assessed Productivity
4.2.7 Acoustic Quality 55
4.2.7.1 Distribution Percentage Of Perception On Acoustic 56
Level
4.2.7.2 Distribution Percentage Of Perception On Sound 57
Privacy
4.2.7.3 Relationship Between Acoustic Satisfaction And 58
Self-Assessed Productivity
4.2.8 Information On Perception Of Environmental Conditions Of 59
Workspace
4.2.8.1 Distribution Percentage Of Perception On Overall 60
Environmental Conditions
4.2.8.2 Distribution Percentage Of Perception On Overall 61
Productivity Affect By Environmental Condition
4.2.8.3 Additional Comments And Recommendations From 62
Respondents
4.3 Predicted Mean Vote (PMV) And Predicted Percentage Of Dissatisfied 62
(PPD) Analysis
4.4 Correlation Between Thermal Comfort And Subjective Responses 65
4.4.1 Perception On Air Temperature 65
4.4.2 Perception On Air Velocity 66
4.4.3 Perception On Relative Humidity 67
4.5 Comparative Analysis On Objective And Subjective Approaches 69
CHAPTER 5: CONCLUSION & FUTURE WORK 71
5.1 Conclusion 71
5.2 Recommendations 72
REFERENCES 73
APPENDICES
A1 Clothing Insulation Values For Typical Ensembles viii
A2 Garment Insulation
B Metabolic Rates For Typical Tasks
C Conceptual Framework Of Study
D Research Flowchart
E Floor Plan For Research Building
F Walk-Through Inspection Checklist
G A Set Of Questionnaire
H Process of Quantitative Data Collection
I Detailed Values Of Specific Thermal Comfort Environmental Parameters Of
Six Units
ix
LIST OF TABLES
2.1 ASHRAE thermal sensation scale 14
2.2 Acceptable thermal environment for general comfort 15
2.3 Acceptable range for main physical parameters ICOP 1AQ (2010)
and ASHRAE (2004)
19
3.1 Detailed sampling area of research building 21
3.2 Operating hours for UTeM Main Library Centre 21
3.3 List of equipment 24
3.4 Recommended minimum number of sampling points for indoor air
quality assessment
24
4.1 Specific thermal comfort environmental parameters results for
ground floor to second floor
27
4.2 Comparison between specific thermal comfort environmental
parameters results with ICOP 2010 and ASHRAE standard for
ground floor to second floor
27
4.3 Detailed values for average air temperature results 28
4.4 Detailed values for average air velocity results 29
4.5 Detailed values for average relative humidity results 31
4.6 Detailed analysis response for age and gender 33
4.7 Detailed analysis response for period of years worked 34
4.8 Detailed analysis response for average hours spend in workspace 35
4.9 Detailed analysis response for location near exterior wall 36
4.10 Detailed analysis response for location near window 37
4.11 Detailed analysis response for perception on amount of space
available
39
4.12 Detailed analysis response for perception on level of visual
privacy
40
4.13 Detailed analysis response for perception on ease of interaction 41
x
4.14 Detailed analysis response for relationship between office layout
and visual privacy satisfaction and self-assessed productivity
42
4.15 Detailed analysis response for perception on air temperature 44
4.16 Detailed analysis response for perception on air velocity 45
4.17 Detailed analysis response for perception on surrounding humidity 46
4.18 Detailed analysis response for relationship between thermal
comfort satisfaction and self-assessed productivity
47
4.19 Detailed analysis response for perception on air quality 48
4.20 Detailed analysis response for relationship between indoor air
quality satisfaction and self-assessed productivity
50
4.21 Detailed analysis response for perception on amount of light 52
4.22 Detailed analysis response for perception on visual comfort of
lighting
53
4.23 Detailed analysis response for relationship between lighting
satisfaction and self-assessed productivity
54
4.24 Detailed analysis response for perception on acoustic level 56
4.25 Detailed analysis response for perception on sound privacy 57
4.26 Detailed analysis response for relationship between acoustic
satisfaction and self-assessed productivity
58
4.27 Detailed analysis response for perception on overall environmental
conditions
60
4.28 Detailed analysis response for perception on overall productivity
affected by environmental conditions
61
4.29 Detailed PMV and PPD analysis 63
4.30 Detailed analysis for relationship between temperature satisfaction
vote and mean temperature
65
4.31 Detailed analysis for relationship between velocity satisfaction
vote and mean velocity
66
4.32 Detailed analysis for relationship between humidity satisfaction
vote and mean humidity
67
4.33 Summary of relationship between findings on objective and
subjective approaches
69
xi
LIST OF FIGURES
2.1 Predicted percentage of dissatisfied (PPD) as a function of
predicted mean vote (PMV)
14
2.2 Air speed required to offset increased temperature 18
4.1 Graph of average air temperature against time measurement for
eight hours in every level
28
4.2 Graph of average air movement against time measurement for
eight hours in every level
30
4.3 Graph of average relative humidity against time measurement for
eight hours in every level
31
4.4 Bar chart of distribution percentage for age and gender 33
4.5 Bar chart of distribution percentage for period of years worked 34
4.6 Bar chart of distribution percentage for average hours spend in
workspace
35
4.7 Bar chart of distribution percentage for location near exterior wall 37
4.8 Bar chart of distribution percentage for location near window 38
4.9 Bar chart of distribution percentage for perception on amount of
space available
39
4.10 Bar chart of distribution percentage for perception on level of
visual privacy
40
4.11 Bar chart of distribution percentage for perception on ease of
interaction
41
4.12 Scatter plot of relationship between office layout and visual
privacy satisfaction and self-assessed productivity
43
4.13 Bar chart of distribution percentage for perception on air
temperature
44
4.14 Bar chart of distribution percentage for perception on air velocity 45
4.15 Bar chart of distribution percentage for perception on surrounding
humidity
46
xii
4.16 Scatter plot of relationship between thermal comfort satisfaction
and self-assessed productivity
48
4.17 Bar chart of distribution percentage for perception on air quality 49
4.18 Scatter plot of relationship between IAQ satisfaction and self-
assessed productivity
51
4.19 Bar chart of distribution percentage for perception on amount of
light
52
4.20 Bar chart of distribution percentage for perception on visual
comfort of lighting
53
4.21 Scatter plot of relationship between lighting satisfaction and self-
assessed productivity
55
4.22 Bar chart of distribution percentage for perception on acoustic
level
56
4.23 Bar chart of distribution percentage for perception on sound
privacy
57
4.24 Scatter plot of relationship between acoustic satisfaction and self-
assessed productivity
59
4.25 Bar chart of distribution percentage for perception on overall
environmental conditions
60
4.26 Bar chart of distribution percentage for perception on overall
productivity affected by environmental conditions
61
4.27 Summarizes the compliance of every floor level in comfort zone 63
4.28 Scatter plot of relationship between PMV and PPD 64
4.29 Scatter plot of relationship between temperature satisfaction and
mean temperature
66
4.30 Scatter plot of relationship between velocity satisfaction and mean
velocity
67
4.31 Scatter plot of relationship between humidity satisfaction and
mean humidity
68
xiii
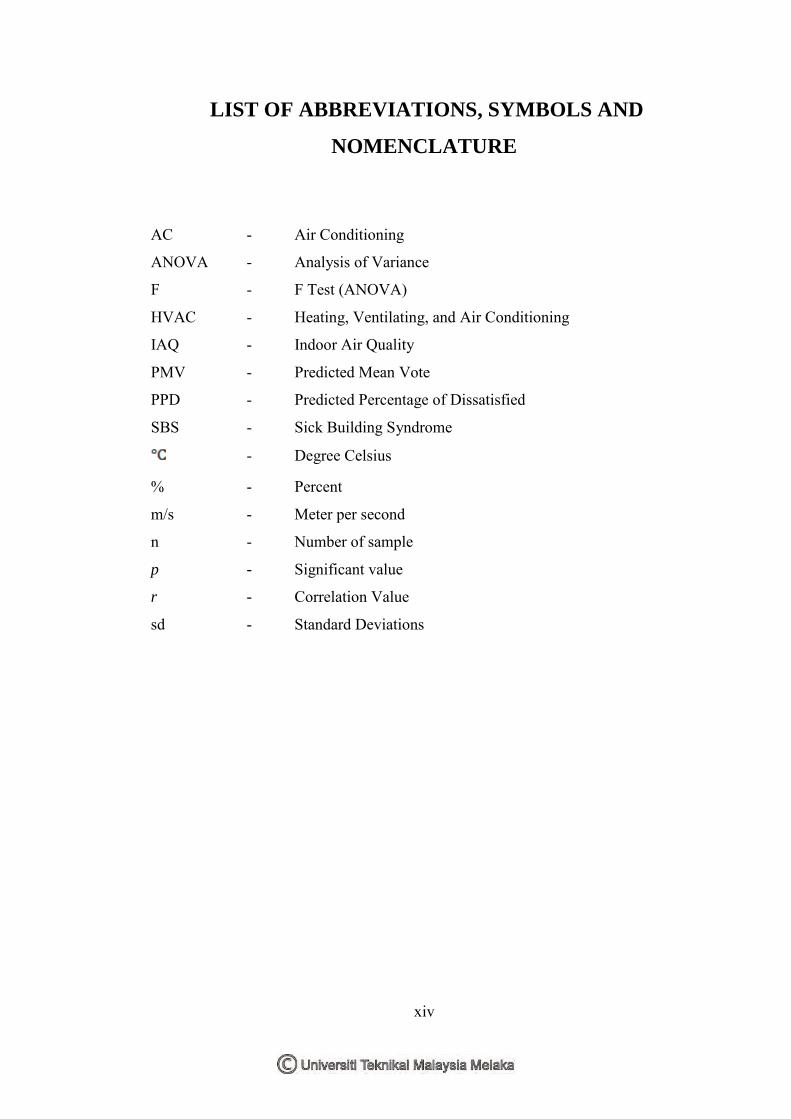
LIST OF ABBREVIATIONS, SYMBOLS AND
NOMENCLATURE
AC - Air Conditioning
ANOVA - Analysis of Variance
F - F Test (ANOVA)
HVAC - Heating, Ventilating, and Air Conditioning
IAQ - Indoor Air Quality
PMV - Predicted Mean Vote
PPD - Predicted Percentage of Dissatisfied
SBS - Sick Building Syndrome
- Degree Celsius
% - Percent
m/s - Meter per second
n - Number of sample
p - Significant value
r - Correlation Value
sd - Standard Deviations
xiv
This chapter is intended to provide background information of the study
conducted. It covers the background of study, problem statements, research
objectives and limitations of the study.
1.1 Background Of Study
Fanger (1986) defined “Thermal comfort is the condition of mind which expresses
satisfaction and comfortable international human body with complex thermal factors.
Thermal comfort is affected by the environmental parameters or personal factors and
the combination both of them. Hussin et al. (2013) studies highlighted that there are
four primary factors that can affect human comfort, which should be considered by
the HVAC design engineers before designing air conditioning systems are effective
air temperature, relative humidity, air velocity and mean radiant temperature.
Havenith et al. (2002) also added about the personal factors include clothing
properties and metabolic heat production that will contribute to achieve human
comfort. Kosonen and Tan (2004) claimed that high efficient air conditioned office
buildings provide a thermally acceptable environment for human comfort and work
that would in order to enable better work productivity and less thermal
dissatisfaction. Zailani et al. (2012) continued saying that occupant’s attention,
concentration, learning, hearing, and performances will be improved by high
environmental quality.
INTRODUCTION
CHAPTER 1
1
Thermal comfort is difficult to define because it is needed to take into account a
range of environmental parameters and personal factors when deciding on the
temperatures and ventilation that will make occupants feel comfortable. It is a
psychological where it may affect our overall emotional. For example, in industrial
field, the employee complaints may increase when they work in uncomfortable
conditions. Some parameters of the thermal environment such as bad air temperature,
poor relative humidity, worse mean radiant temperature and uncontrolling air
movement (velocity) may contribute human discomfort which can lead to the
symptoms of sick building syndrome (SBS). Then, their productivity in an
organization may fall down and maybe in some cases, they refuse to work in a
particular environment if they are still working under dissatisfied environment.
1.2 Problem Statements
Thermal comfort is an adaptation of the human body, tends to accept the
environment conditions. Thermal indoor environment is essential not only because of
the amount of time spent in the building, but because there are indoor sources of
contaminants (Aziah et al., 2010). Even in optimal conditions, some individuals may
experience discomfort. Budaiwi (2007) revealed that undesirable thermal comfort
conditions may lead to occupant dissatisfaction which will directly affect their
health, productivity, and efficiency. Ismail et al. (2009) also stated that high level of
thermal comfort will meet the needs of occupational health, safety concern and
environmental impact.
Individual thermal comfort can be affected by environmental and personal factors.
Crowded working areas, the job being undertaken, physical exertion, radiant
temperatures and penetration also may cause people to feel discomfort. In a research
carried out by Wagner (2007), in the workplace which have different capacities, it
was reported that the level of thermal comfort conditions during high occupant
density periods were very poor. Staff with existing medical problems such as bad
respiratory conditions can be more susceptible to adverse health effects from
working in conditions that are not ideal. Thermal discomfort such as temperature in 2
the workplace is too hot or too cold can be related to physical stress, which be
responsible for poor health and bad productivity of the occupants (Wong and Khoo,
2003). Good indoor environment quality will encompass high quality in the
dimensions of thermal comfort, indoor air quality, acoustical comfort, visual
comfort. Last, this study will undergoes further detailed about the parameters that
can impart to high level of thermal comfort environment. This study is conducted
due to less information and statistics on thermal comfort level in UTeM’s Library
Centre among staffs.
1.3 Research Objectives
The aim of the research is to determine the thermal environment perception among
staffs in Library Centre, University Teknikal Malaysia Melaka (UTeM) to the
existing air conditioning (AC) system in their workplace by means of both a
qualitative and a quantitative approach. The specific objectives of the research are
listed below:
(a) To measure the thermal comfort environmental parameters by field
measurement.
(b) To determine the status of thermal comfort perception among library
staffs by subjective approach.
(c) To analyze the result of experimental and subjective approach.
(d) To associate the relationship between results from field measurement
and subjective approach to be thermally acceptable by the staffs.
3
1.4 Limitations Of Study
A cross-sectional study was carried out among UTeM’s library staffs from October
2014 to November 2014. In this study, 54 staffs (28 male and 26 female) were
selected as the respondents by using the universal sampling. They are permanent
employees who work for a minimum of three months. The respondents were selected
is from their work unit. There are six units were selected purposively based on the
Library Staff Directory. There are two types of measurement method that the data
were collected; 1. By field measurement, and 2. By subjective assessment. The
specific thermal comfort parameters were measured continuously for 8-hours Time
Weighted Average (TWA) which 40-hours per week.
The background study and introduction of thermal comfort, previous research and
observation of thermal comfort, secondary factors affecting comfort, predictions
thermal comfort, are just an additional knowledge for the readers. However, this
study was conducted in order to determine the thermal comfort status of the building
occupants with the correct setting of an existing air conditioning system based on
primary thermal comfort parameters in UTeM library centre.
4
While the first chapter clarified the background of the study, this chapter
proceeds with a fully-referenced review from the relevant literature. It covers
introduction to thermal comfort, research and observation of thermal comfort,
factors affecting thermal comfort, secondary factor affecting comfort, prediction
thermal comfort and general thermal comfort conditions for determining comfort
zone.
2.1 Introduction To Thermal Comfort
Human has always striven to create a thermally acceptable environment. Thermal
comfort becomes a worldwide attention due to its relevance with all life fields. The
development of human civilization in creating comfort environment in doing a daily
work has evolved. From ancient history until today, man has created a lot of facilities
in creating and achieving comfort, especially in technology thermal comfort to their
environment. Nowadays, in the process of designing buildings, one of the important
parameters that need to be considered is creating a thermally acceptable environment
by occupants.
Comfort is feeling of human body that tends to accept the thermal of surroundings.
According to ASHRAE (1992), thermal comfort is described as a condition of mind
which expresses satisfaction with the surrounding thermal environment. Fanger
(1986) also defined that “Thermal comfort is the condition of mind which expresses
satisfaction and comfortable international human body with their thermal
LITERATURE REVIEW
CHAPTER 2
5
environment which is influenced by environmental or personal factors, or the
combination both of them. Kilic et al. (2006) also revealed environmental parameters
that affecting thermal environment are air temperature, relative humidity, air velocity
and radiant conditions such as mean temperature or solar intensity in their studies.
The personal factors such as clothing properties and activity level (Candido et al.,
2010). Furthermore, there are some secondary factors affecting comfort such as
human factors of different stage or ages among children, adults, and elderly. Gender
factor is also calculated for the type of skin between male and female in terms of skin
temperature, evaporation loss, metabolic rate and type of clothing worn. Then,
human adaptation to the environment, for example, the ability of people from warm
climates may adapt to the hot environment. This explanation in terms of thermal
comfort basically describes a person’s psychological state of mind where a person
feels too hot or too cold.
Modern technology in achieving thermal comfort in buildings has been made to
provide comfort to all occupants and maintaining health and improving the
productivity of occupants. Heating, ventilating and air conditioning (HVAC) is
sometimes referred as climate control and is particularly important for the design of
industrial buildings and large office buildings, which the conditions inside the
buildings are safe and healthy where it is arranged with reference to relative humidity
and air temperature of the building using the fresh air of nature, both factors should
be closely regulated while maintaining the comfort environment. ASHRAE (2009)
stated the main purpose of HVAC system is to provide conditions for human thermal
comfort. Indoor air should minimize the occupant discomfort, irritation, and illness.
Sick building syndrome symptoms, discomfort and irritation can result from poor
indoor air quality, bad environmental factors such as noise, poor quality or
inadequate lighting, and also the other environmental factors.
6
2.2 Research And Observations Of Thermal Comfort
Thermal comfort is a complex phenomenon which is subjective by several thermal
comfort parameters: environmental parameters, personal factors and psychological.
Parson (2002) highlighted the two common methods to quantitatively expressing
thermal comfort and thermal sensation is Predicted Mean Vote (PMV) and Predicted
Percentage Dissatisfied (PPD) after Fanger (1970) studies.
Corgnati (2007) claimed in his studies that in the middle of 1950, the first scientific
studies about the effect of the thermal environmental quality in classrooms on the
students’ performances were conducted by Pepler and Warner. An interesting
analysis of the results of the first studies, lots of them performed as field studies.
After this period, the Fanger theory was developed about thermal comfort based on
the results from a fully controlled climate chamber, which broke the developing of
new field researches on thermal comfort. Then, Corgnati (2009) stated that the
growing interest in the last years about adaptive theory of thermal comfort has again
stimulated researches by field studies aimed at qualifying the thermal environment,
both objectively (by measurements) and subjectively (by occupants judgements)
must be done.
De Dear and Brager (1998) summarized that the PMV model works best only in
buildings that have HVAC systems. The studies also described that in naturally
ventilated buildings (no mechanical systems), people seem can adapt and accept
higher indoor temperature than the predicted temperature by the PMV model
calculation. They discourage the use of naturally ventilated passive solar building
because of the narrow band of comfort limits. Occupants in this type of buildings
have more relaxed expectations and can tolerate with a wider temperature change.
Furthermore, occupants in air conditioned buildings have a narrow rigid thermal
environment and are more sensitive to thermal surroundings (ASHRAE, 2009).
7
Recommended


![Thermal Separation Library: Examples of Use · Thermal Separation Library: Examples of Use ... DYNSIM was developed by [3] and is a tool for design and analysis of chemical processes](https://img.pdfslide.net/doc/110x75/5ad8144d7f8b9ab8378ce75f/thermal-separation-library-examples-of-separation-library-examples-of-use-.jpg)