1
1
Performance Measuresfor Machine Learning
2
Performance Measures
• Accuracy• Weighted (Cost-Sensitive) Accuracy• Lift• ROC
– ROC Area
• Precision/Recall– F– Break Even Point
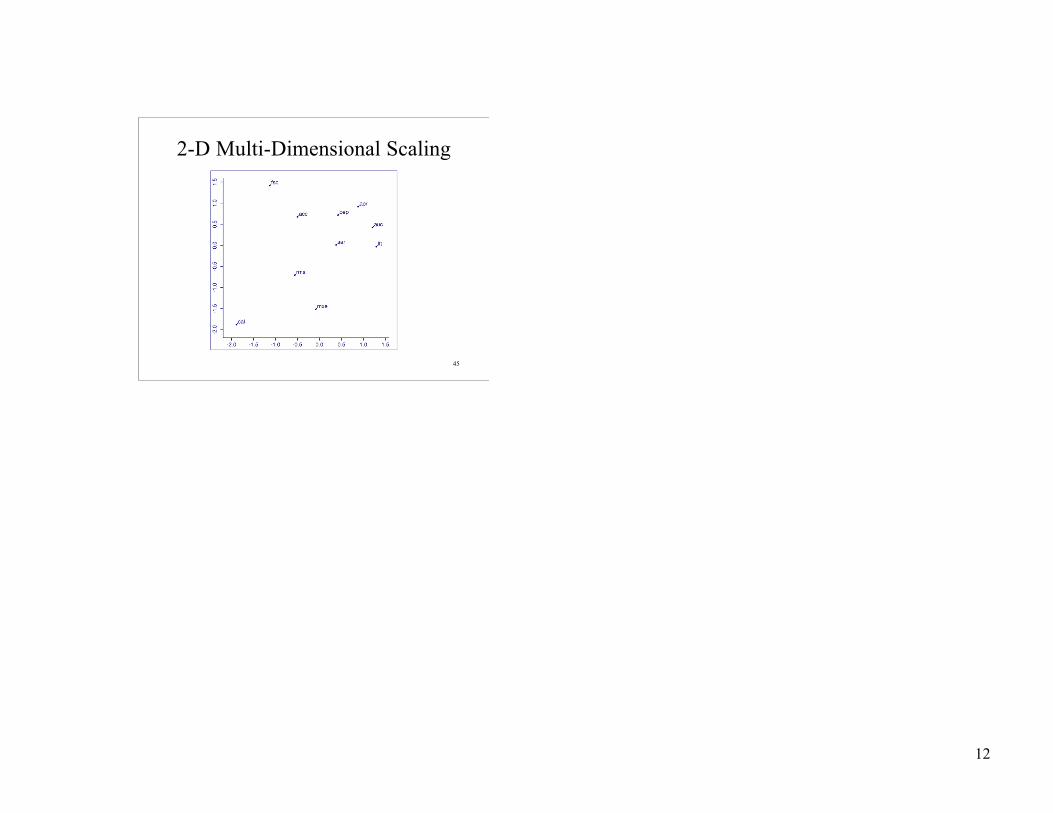
• Similarity of Various Performance Metrics viaMDS (Multi-Dimensional Scaling)
3
• Target: 0/1, -1/+1, True/False, …
• Prediction = f(inputs) = f(x): 0/1 or Real• Threshold: f(x) > thresh => 1, else => 0
• If threshold(f(x)) and targets both 0/1:
• #right / #total• p(“correct”): p(threshold(f(x)) = target)
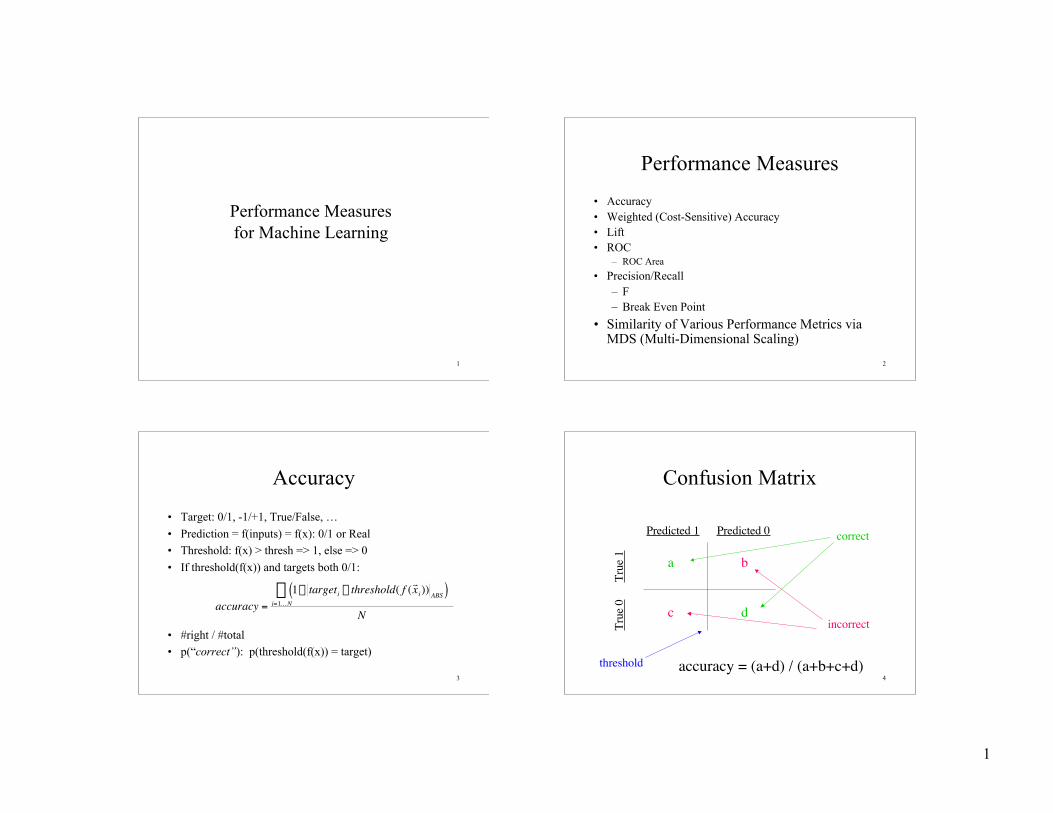
Accuracy
†
accuracy =
1- targeti - threshold( f (r x i)) ABS( )i=1KNÂ
N
4
Confusion Matrix
Predicted 1 Predicted 0
True
0
Tr
ue 1 a b
c d
correct
incorrect
accuracy = (a+d) / (a+b+c+d)threshold
2
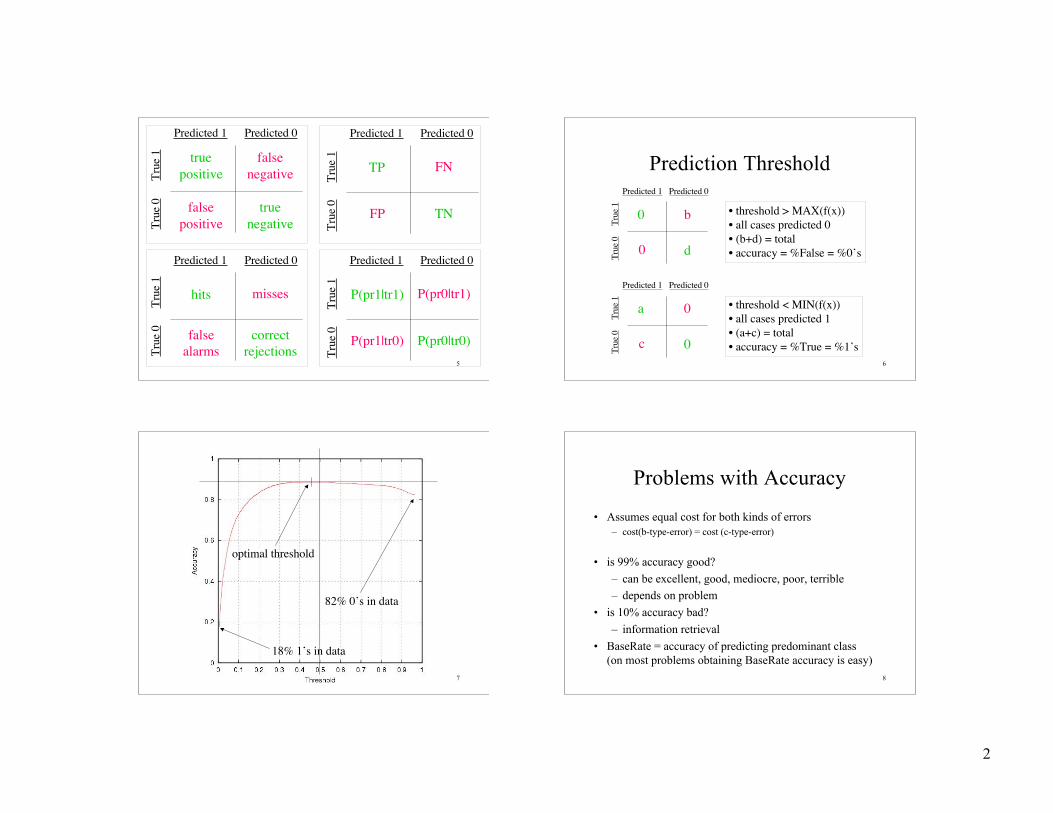
5
Predicted 1 Predicted 0
True
0
Tr
ue 1 true
positivefalse
negative
falsepositive
truenegative
Predicted 1 Predicted 0
True
0
Tr
ue 1
hits misses
falsealarms
correctrejections
Predicted 1 Predicted 0
True
0
Tr
ue 1
P(pr1|tr1) P(pr0|tr1)
P(pr0|tr0)P(pr1|tr0)
Predicted 1 Predicted 0
True
0
Tr
ue 1
TP FN
TNFP
6
Prediction ThresholdPredicted 1 Predicted 0
True
0
Tru
e 1 0 b
0 d
• threshold > MAX(f(x))• all cases predicted 0• (b+d) = total• accuracy = %False = %0’s
Predicted 1 Predicted 0
True
0
Tru
e 1 a 0
c 0
• threshold < MIN(f(x))• all cases predicted 1• (a+c) = total• accuracy = %True = %1’s
7
18% 1’s in data
82% 0’s in data
optimal threshold
8
Problems with Accuracy
• Assumes equal cost for both kinds of errors– cost(b-type-error) = cost (c-type-error)
• is 99% accuracy good?
– can be excellent, good, mediocre, poor, terrible– depends on problem
• is 10% accuracy bad?
– information retrieval
• BaseRate = accuracy of predicting predominant class(on most problems obtaining BaseRate accuracy is easy)
3
9
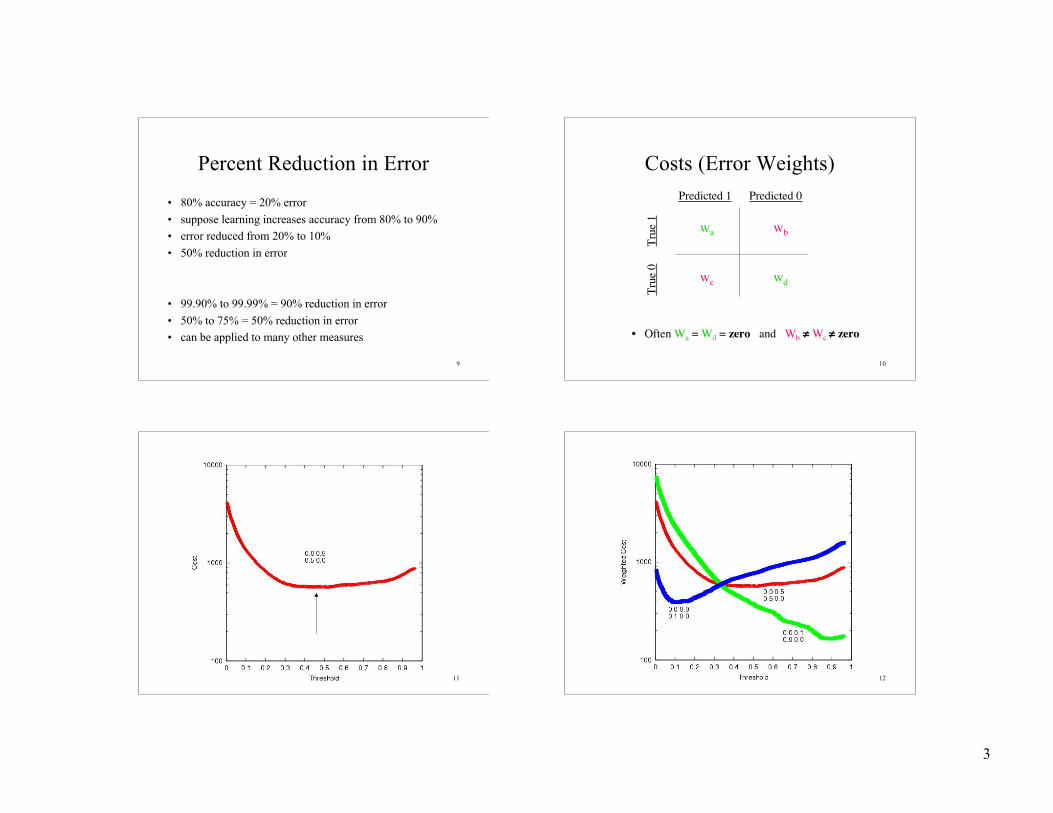
Percent Reduction in Error
• 80% accuracy = 20% error
• suppose learning increases accuracy from 80% to 90%• error reduced from 20% to 10%
• 50% reduction in error
• 99.90% to 99.99% = 90% reduction in error
• 50% to 75% = 50% reduction in error• can be applied to many other measures
10
Costs (Error Weights)Predicted 1 Predicted 0
True
0
Tr
ue 1 wa wb
wc wd
• Often Wa = Wd = zero and Wb ≠ Wc ≠ zero
11 12
4
13
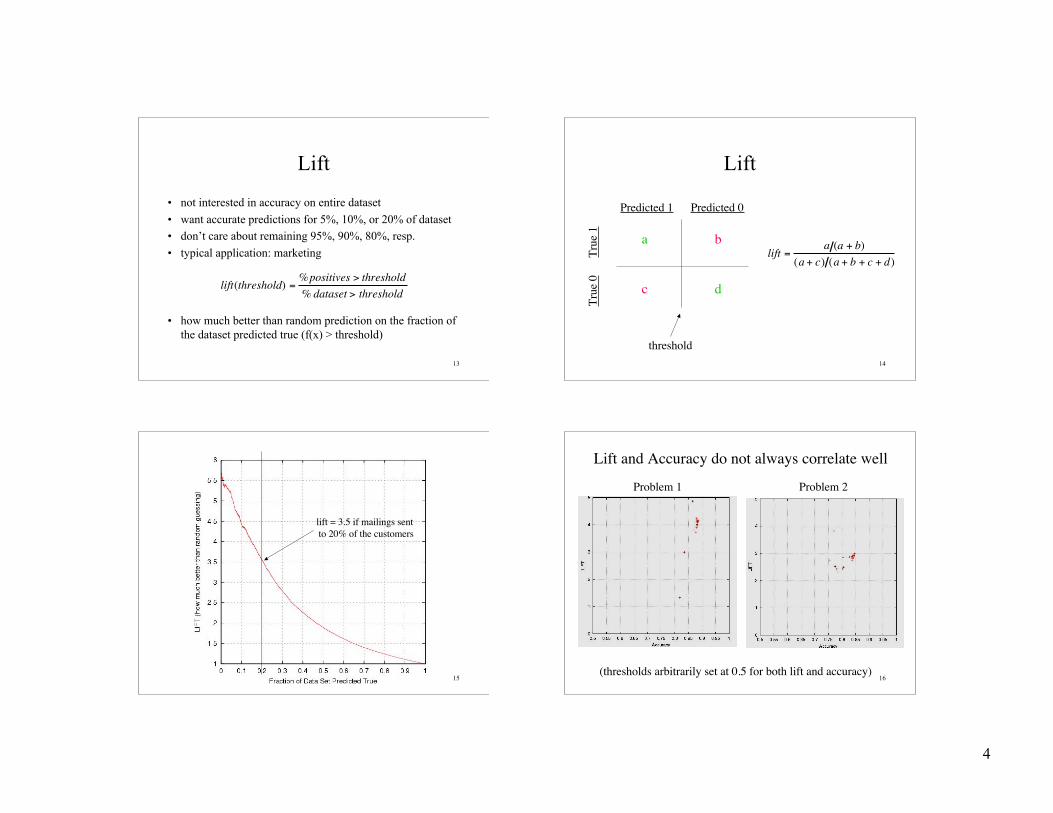
Lift
• not interested in accuracy on entire dataset
• want accurate predictions for 5%, 10%, or 20% of dataset• don’t care about remaining 95%, 90%, 80%, resp.
• typical application: marketing
• how much better than random prediction on the fraction ofthe dataset predicted true (f(x) > threshold)
lift(threshold) =%positives > threshold% dataset > threshold
14
Lift
Predicted 1 Predicted 0
True
0
Tr
ue 1 a b
c d
threshold
lift =a (a + b)
(a + c) (a + b + c + d)
15
lift = 3.5 if mailings sent to 20% of the customers
16
Lift and Accuracy do not always correlate well
Problem 1 Problem 2
(thresholds arbitrarily set at 0.5 for both lift and accuracy)
5
17
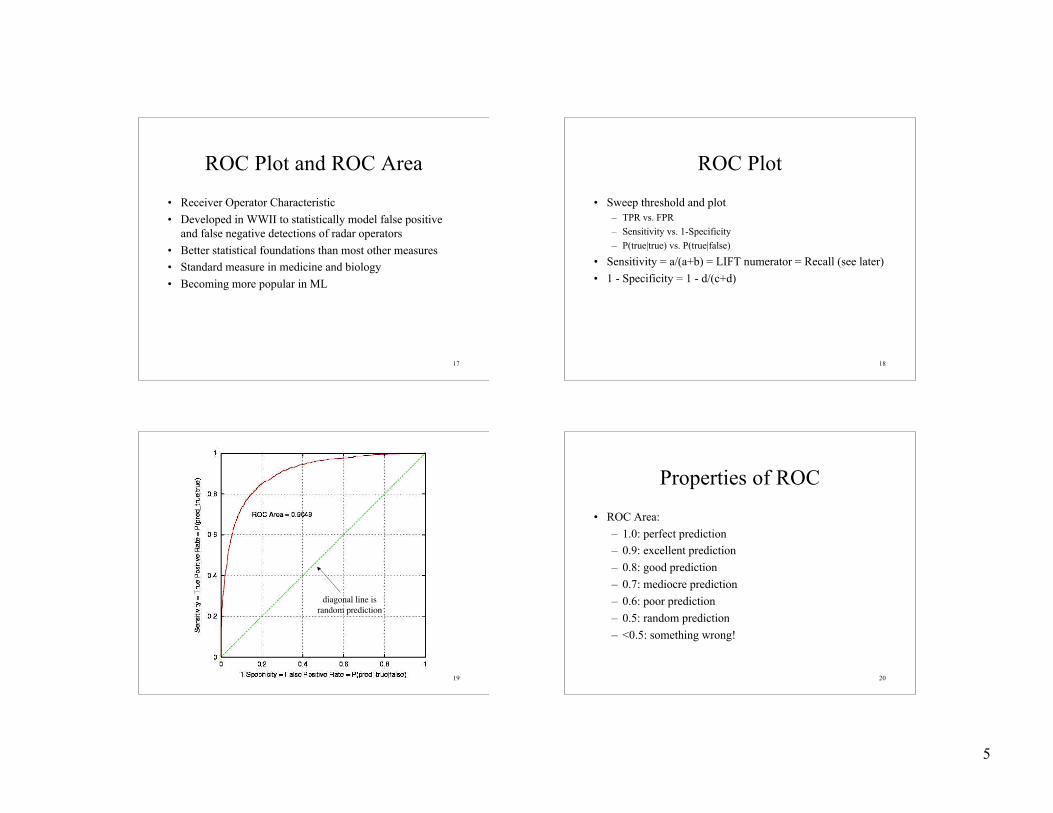
ROC Plot and ROC Area
• Receiver Operator Characteristic
• Developed in WWII to statistically model false positiveand false negative detections of radar operators
• Better statistical foundations than most other measures• Standard measure in medicine and biology
• Becoming more popular in ML
18
ROC Plot
• Sweep threshold and plot– TPR vs. FPR
– Sensitivity vs. 1-Specificity
– P(true|true) vs. P(true|false)
• Sensitivity = a/(a+b) = LIFT numerator = Recall (see later)
• 1 - Specificity = 1 - d/(c+d)
19
diagonal line israndom prediction
20
Properties of ROC
• ROC Area:
– 1.0: perfect prediction– 0.9: excellent prediction
– 0.8: good prediction
– 0.7: mediocre prediction
– 0.6: poor prediction
– 0.5: random prediction
– <0.5: something wrong!
6
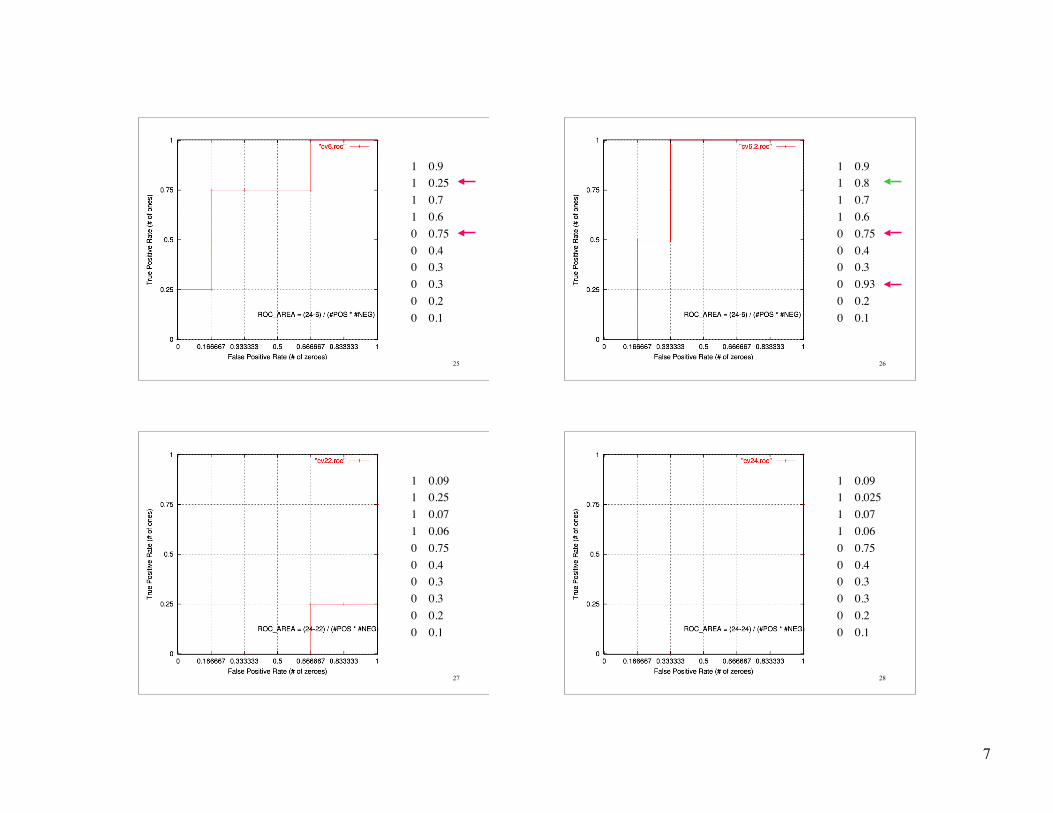
21
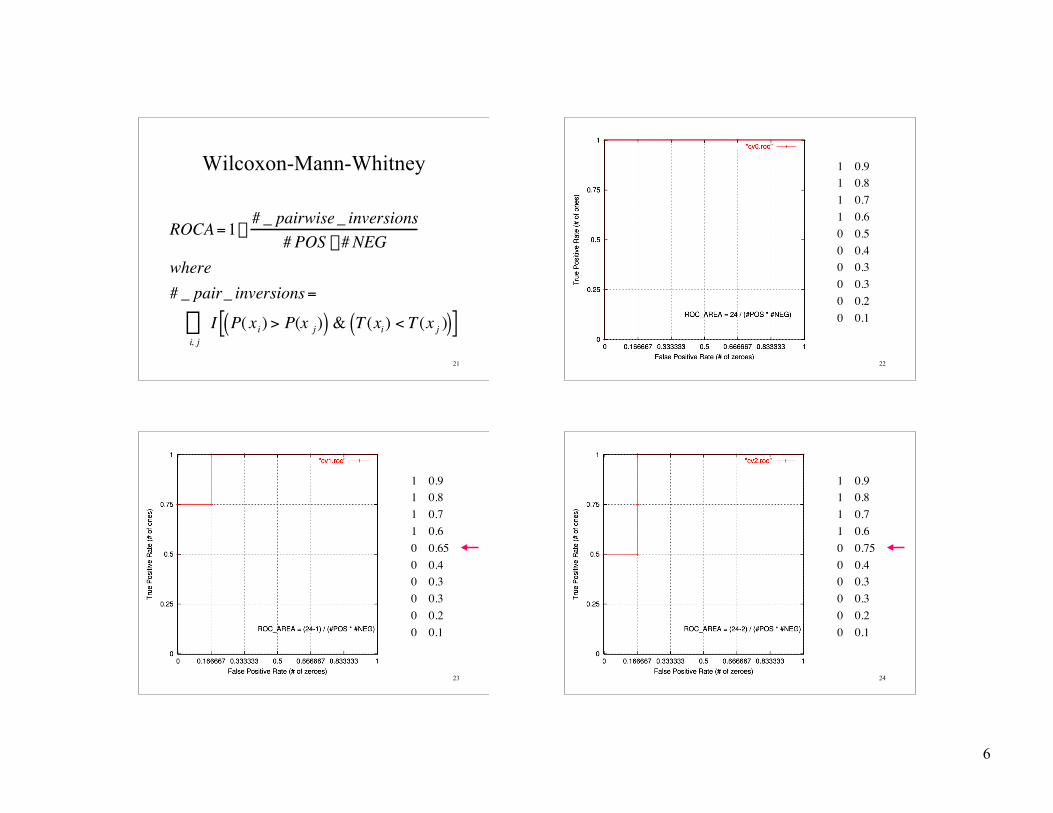
Wilcoxon-Mann-Whitney
†
ROCA =1-# _ pairwise _ inversions
# POS * # NEGwhere# _ pair_ inversions =
I P( xi) > P(x j)( ) & T (xi) < T (x j )( )[ ]i, jÂ
22
1 0.91 0.81 0.71 0.60 0.50 0.40 0.30 0.30 0.20 0.1
23
1 0.91 0.81 0.71 0.60 0.650 0.40 0.30 0.30 0.20 0.1
24
1 0.91 0.81 0.71 0.60 0.750 0.40 0.30 0.30 0.20 0.1
7
25
1 0.91 0.251 0.71 0.60 0.750 0.40 0.30 0.30 0.20 0.1
26
1 0.91 0.81 0.71 0.60 0.750 0.40 0.30 0.930 0.20 0.1
27
1 0.091 0.251 0.071 0.060 0.750 0.40 0.30 0.30 0.20 0.1
28
1 0.091 0.0251 0.071 0.060 0.750 0.40 0.30 0.30 0.20 0.1
8
29
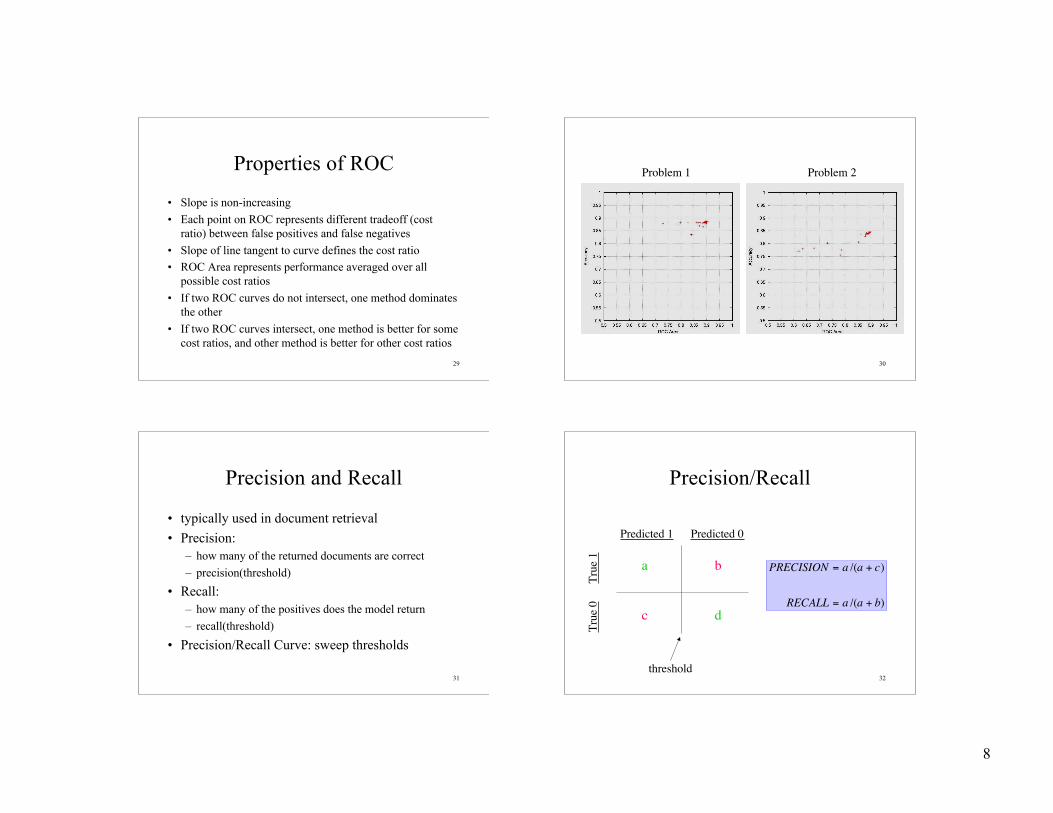
Properties of ROC
• Slope is non-increasing
• Each point on ROC represents different tradeoff (costratio) between false positives and false negatives
• Slope of line tangent to curve defines the cost ratio• ROC Area represents performance averaged over all
possible cost ratios
• If two ROC curves do not intersect, one method dominatesthe other
• If two ROC curves intersect, one method is better for somecost ratios, and other method is better for other cost ratios
30
Problem 1 Problem 2
31
Precision and Recall
• typically used in document retrieval
• Precision:– how many of the returned documents are correct
– precision(threshold)
• Recall:– how many of the positives does the model return
– recall(threshold)
• Precision/Recall Curve: sweep thresholds
32
Precision/Recall
Predicted 1 Predicted 0
True
0
Tr
ue 1 a b
c d
PRECISION = a /(a + c)
RECALL = a /(a + b)
threshold
9
33 34
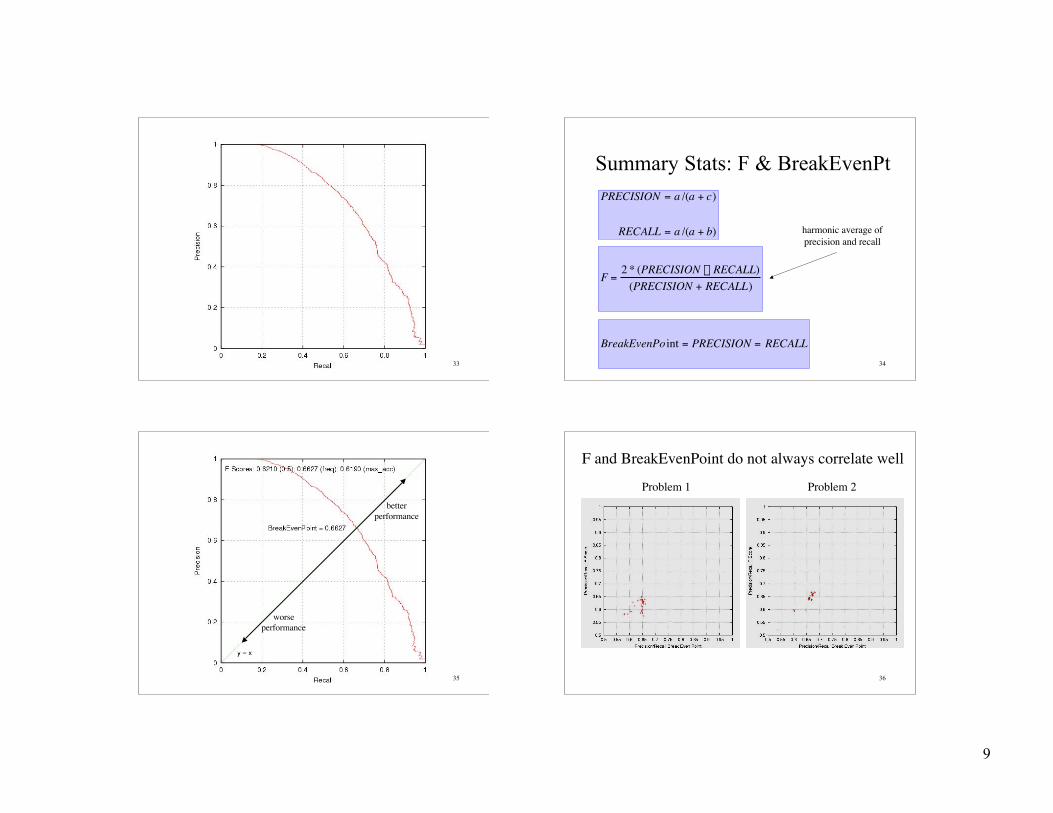
Summary Stats: F & BreakEvenPtPRECISION = a /(a + c)
RECALL = a /(a + b)
F =2 * (PRECISION ¥ RECALL)
(PRECISION + RECALL)
BreakEvenPo int = PRECISION = RECALL
harmonic average ofprecision and recall
35
betterperformance
worseperformance
36
F and BreakEvenPoint do not always correlate well
Problem 1 Problem 2
10
37
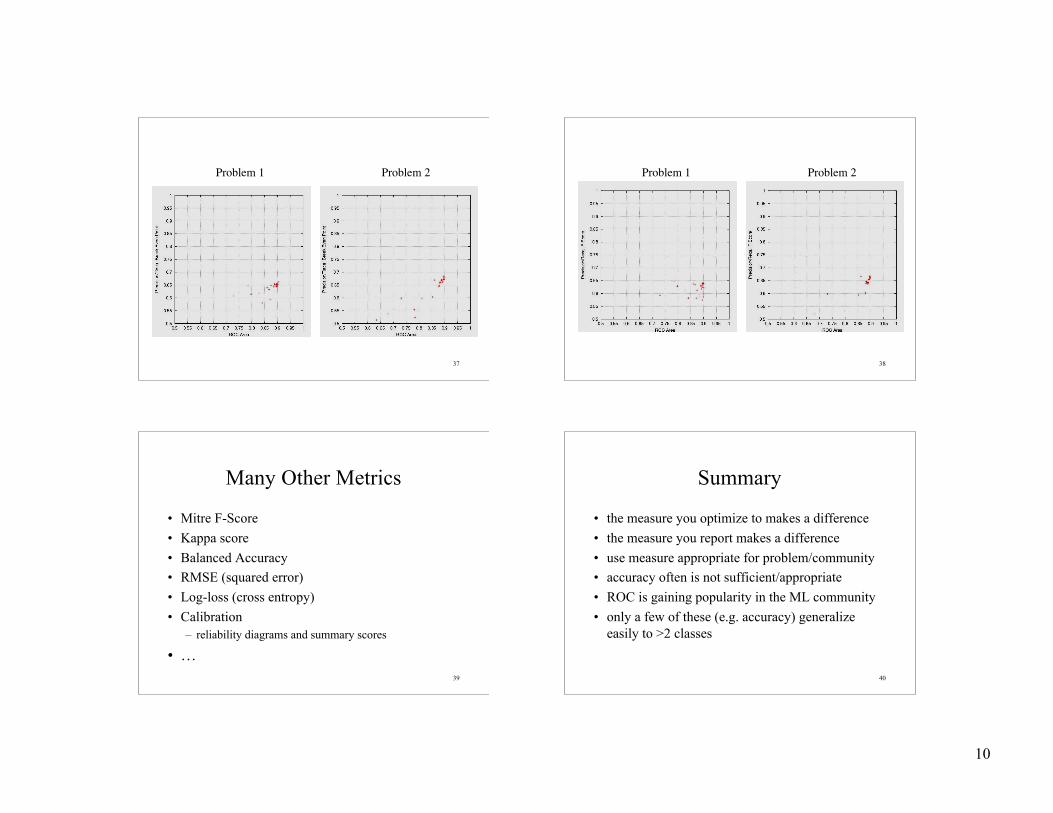
Problem 1 Problem 2
38
Problem 1 Problem 2
39
Many Other Metrics
• Mitre F-Score
• Kappa score
• Balanced Accuracy
• RMSE (squared error)
• Log-loss (cross entropy)
• Calibration– reliability diagrams and summary scores
• …40
Summary
• the measure you optimize to makes a difference
• the measure you report makes a difference
• use measure appropriate for problem/community
• accuracy often is not sufficient/appropriate
• ROC is gaining popularity in the ML community
• only a few of these (e.g. accuracy) generalizeeasily to >2 classes
11
41
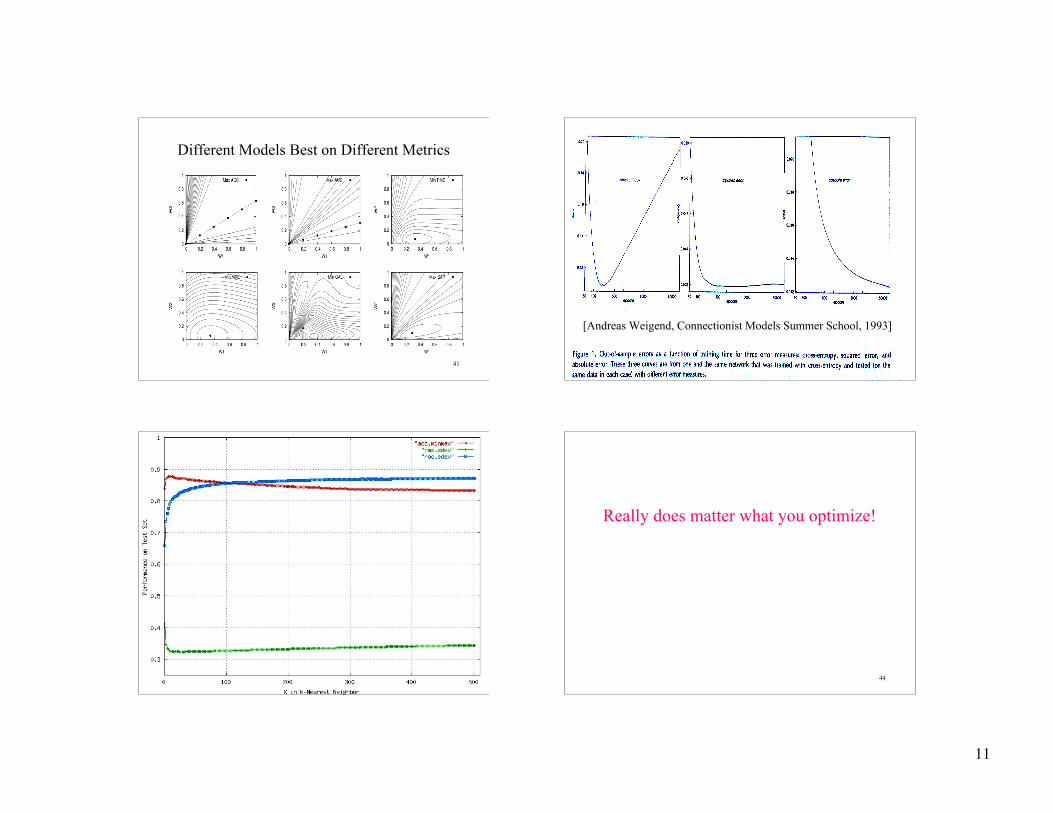
Different Models Best on Different Metrics
42
[Andreas Weigend, Connectionist Models Summer School, 1993]
43 44
Really does matter what you optimize!
12
45
2-D Multi-Dimensional Scaling
Recommended