1
PETROCHEMICAL AROMATICS FROM LIQUID HYDROCARBONSA TECHNOECONOMIC ASSESSMENT
K.M.WAGIALLADEPARTMENT OF CHEMICAL ENGINEERING
KING SAUD UNIVERSITY
7TH SAUDI ENGINEERING CONFERENCECOLLEGE OF ENGINEERING
KING SAUD UNIVERSITYRIYADH
NOVEMBER, 2007

2
ABSTRACT
This paper investigates some technical and economic aspects regarding liquid feedstocks processing inthe Kingdom of Saudi Arabia. A review of present and potential petrochemical feedstocks is undertaken.Several commercial and potential processing routes are examined. A conceptual petrochemical complexcomprising 12 down stream petrochemical derivative plants in the Kingdom is then economicallyevaluated. The complex cracks naphtha and produces ethylene, LDPE, LLDPE, HDPE, propylene,propylene glycol, ethylene glycol, benzene, styrene, and polystyrene. Realistic capital and operating costdata were obtained from international consultative sources and then adjusted for local Saudi conditions. Acash flow analysis was carried out over a 20 year period taking into account the effect of inflation. Thecomplex has an ethylene annual production capacity of 680,400 tons. The total capital investment isestimated at 5,382.46 million dollars.
1. INTRODUCTIONThe Kingdom of Saudi Arabia is expected to become the world’s largest producer and exporter ofpetrochemicals and plastics in the near future. The Kingdom has been forecast to produce 100 milliontons per year of petrochemicals by 2015 [1]. Both the public and private industrial sectors are expandingtheir petrochemical operations in order to diversify their economies and strengthen their industries. Theyenjoy access to abundant and competitively priced feedstocks. Saudi Arabia’s proven natural gas reserves,including both associated and non-associated gas, are estimated at 230 trillion standard cubic feet as ofJanuary 2003. More than 60% of these reserves (i.e. about 140 trillion cubic feet) consist of associatedgas. According to governmental and industrial sources, The Kingdom has more than 530 trillion standardcubic feet of undiscovered reserves as well as 40 billion barrels of condensate.The industrial sector in the Kingdom can claim access to modern production facilities and first classexport infrastructures and logistics which are continually being upgraded and maintained. The Kingdomis not only endowed with abundant hydrocarbon resources it is also becoming the centre of the world’spetrochemical production because it offers:(1) Proactive policies committed to rapid industrialization.(2) Well-built infrastructures for industries to operate and thrive.(3) Financial incentives in the form of low cost project finance.(4) Tax incentives for foreign partners.(5) A well-trained work force – both indigenous and expatriate.The growth of petrochemical production in the Kingdom in the past two decades was phenomenal. Thecontinued expansion of basic petrochemicals will propel SABIC and the Kingdom as a top producer in thekey products of polyethylene, ethylene glycol, methanol and styrene. Overall, SABIC is the world’s 4th
largest producer of polymers.However, most of the petrochemical industries in the Kingdom at the present time are natural gas-based. The aim of this study is to explore the techno-economic feasibility of liquid-based petrochemicalprocessing in the Kingdom.
2. PETROCHEMICAL FEEDSTOCKS OVERVIEW:2.1 Natural Gas Liquids
Natural gas liquids (NGLs) are composed mainly of ethane, propane and normal butanes. Isobutane is nottypically cracked for petrochemical production. Downstream processing is based on both normal andcryogenic distillation. The cracked gas from gaseous feedstocks (ethane, propane, butane) is fed into thetransfer-line-exchanger (TLE) followed by direct quench with water, and multistage compression, typically

3
in four to six stages with intermediate cooling. Before the last compression stages, acid gas (mainlyhydrogen sulfide and carbon dioxide) is removed. After the last compressor stage, water removal takesplace by chilling and drying over zeolites. Subsequent fractionation of the cracked gas is based oncryogenic (temperature less than 273 K) and conventional distillation under pressure (15 – 35 bar).Cryogenic distillation requires a lot of energy due to the need for a refrigeration system.
2.2 NaphthaNaphtha is obtained in petroleum refineries as one of the intermediate products from the distillation ofcrude oil. It is a liquid intermediate between the light gases in the crude oil and the heavier liquidkerosene. Naphthas are volatile, flammable and have a specific gravity of 0.7.The naphthas are distinguished by density and PONA, PIONA or PIANO analysis (i.e. Paraffin,Isoparaffin, Olefins, Naphthenes and Aromatics contents). The main application of paraffinic naphthas isas a feedstock in the petrochemical production of olefins. This type of naphtha is also referred to as “lightdistillate feedstock (LDF), “straight run gasoline” (SRG), or “light virgin naphtha” (LVN”). The heaviertypes are usually richer in naphthenes and aromatics and are sometimes referred to as “straight runbenzene” (SRB) or “heavy virgin naphtha” (HVN). These denser types are also used in the petrochemicalindustry but more are used as a feedstock for refinery catalytic reformers where the lower octane naphthais converted to a higher octane product called reformate which is a precursor for motor gasolineproduction. This common dependence of gasoline and petrochemicals on the same feedstock (naphtha),explains the effect of the market demand and price changes of gasoline on the production economics andprices of petrochemicals (specially aromatics).Naphthas are also used as an unprocessed component in gasoline production, as industrial solvents, as anoil painting medium, and as an ingredient in shoe polish.Naphthas are also commonly classified as full range naphtha (FRN), Medium range naphtha (MRN) andlight virgin naphtha (LVN). Full rang naphtha is a hydrocarbon mixture that boils in the gasoline boilingrange (i.e. C5-430oF boiling range). Naphtha composition varies with source and refinery operatingconditions. Table (2.1) gives a typical naphtha composition [1].
Table (2.1): Typical naphtha composition
Component Analysis (% of total)C3, C4 8.0
C5 22.4C6 19.9C7 17.2C8 12.4C9 11.5
C10 – C15 8.6Total 100.0
n-Alkanes 30.5Iso-Alkanes 39.9Naphthenes 17.7Aromatics 11.9
Total 100.0

4
2.3 Gas OilGas Oils are classified as either atmospheric or vacuum according to their origin, either from an
atmospheric crude tower or a crude bottoms vacuum column. Atmospheric Gas Oil boils in the range 400-800oF; vacuum gas oil boils at 800-1000oF and higher. Vacuum gas oils are not usually crackedcommercially. However, hydrotreated vacuum oils can be commercially exploited as cracking feedstocksfor olefins and aromatics production.Figure (2.1) shows a simplified process flow diagram for producing ethylene via liquid (e.g. naphtha orgas oil) cracking. Downstream processing of cracked gas from liquid feedstocks (naphtha and gas oil) issomewhat more complex than processing of gaseous feedstocks because heavier components are present.In this case a primary fractionator is installed upstream the compressor stages in order to remove fuel oil,which is produced in considerable amounts when cracking naphtha or gas oil. This fuel is partly used inthe direct quench operation, while the remainder may be sold or used as fuel for the cracking furnace. Theprimary fractionator also produces a gasoline stream, called pyrolysis gasoline or pygas which is rich inaromatics (benzene, toluene and gasoline). Pygas may be processed to separate the BTX components. C4
hydrocarbons are produced in sufficient amounts to justify their separate recovery, and therefore usually abutanizer is installed. Modifications of Figure (2.1) are possible depending on the type of feedstock andthe degree of recovery desired for the different products.
Figure (2.1): Simplified process flow diagram for producing ethylenevia liquid (e.g. naphtha or gas oil) cracking [2].
Cracking
TLE
Oil Quench
Compression
Compression
Demethanizer
Deethanizer
Hydrogenation EthyleneFractionation
PropyleneFractionation
HydrogenationDeproponizer
GasDrying
Ethylene
Propylene
LiquidFeedstock
Steam
H2SCO2
Water
HydrogenMethane
C4
Pygas
Fuel Oil
Ethane and Propane Recycle
PrimaryFractionator
Acid GasRemoval
Debutanizer
5
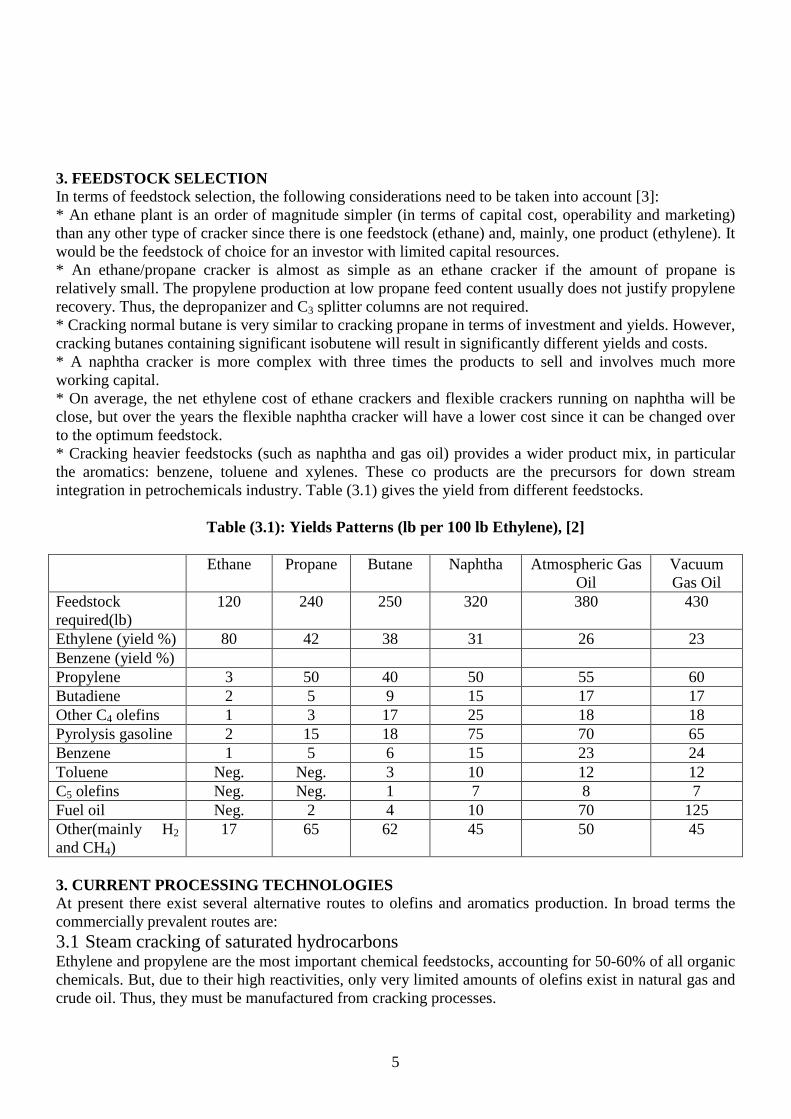
3. FEEDSTOCK SELECTIONIn terms of feedstock selection, the following considerations need to be taken into account [3]:* An ethane plant is an order of magnitude simpler (in terms of capital cost, operability and marketing)than any other type of cracker since there is one feedstock (ethane) and, mainly, one product (ethylene). Itwould be the feedstock of choice for an investor with limited capital resources.* An ethane/propane cracker is almost as simple as an ethane cracker if the amount of propane isrelatively small. The propylene production at low propane feed content usually does not justify propylenerecovery. Thus, the depropanizer and C3 splitter columns are not required.* Cracking normal butane is very similar to cracking propane in terms of investment and yields. However,cracking butanes containing significant isobutene will result in significantly different yields and costs.* A naphtha cracker is more complex with three times the products to sell and involves much moreworking capital.* On average, the net ethylene cost of ethane crackers and flexible crackers running on naphtha will beclose, but over the years the flexible naphtha cracker will have a lower cost since it can be changed overto the optimum feedstock.* Cracking heavier feedstocks (such as naphtha and gas oil) provides a wider product mix, in particularthe aromatics: benzene, toluene and xylenes. These co products are the precursors for down streamintegration in petrochemicals industry. Table (3.1) gives the yield from different feedstocks.
Table (3.1): Yields Patterns (lb per 100 lb Ethylene), [2]
Ethane Propane Butane Naphtha Atmospheric GasOil
VacuumGas Oil
Feedstockrequired(lb)
120 240 250 320 380 430
Ethylene (yield %) 80 42 38 31 26 23Benzene (yield %)Propylene 3 50 40 50 55 60Butadiene 2 5 9 15 17 17Other C4 olefins 1 3 17 25 18 18Pyrolysis gasoline 2 15 18 75 70 65Benzene 1 5 6 15 23 24Toluene Neg. Neg. 3 10 12 12C5 olefins Neg. Neg. 1 7 8 7Fuel oil Neg. 2 4 10 70 125Other(mainly H2
and CH4)17 65 62 45 50 45
3. CURRENT PROCESSING TECHNOLOGIESAt present there exist several alternative routes to olefins and aromatics production. In broad terms thecommercially prevalent routes are:
3.1 Steam cracking of saturated hydrocarbonsEthylene and propylene are the most important chemical feedstocks, accounting for 50-60% of all organicchemicals. But, due to their high reactivities, only very limited amounts of olefins exist in natural gas andcrude oil. Thus, they must be manufactured from cracking processes.
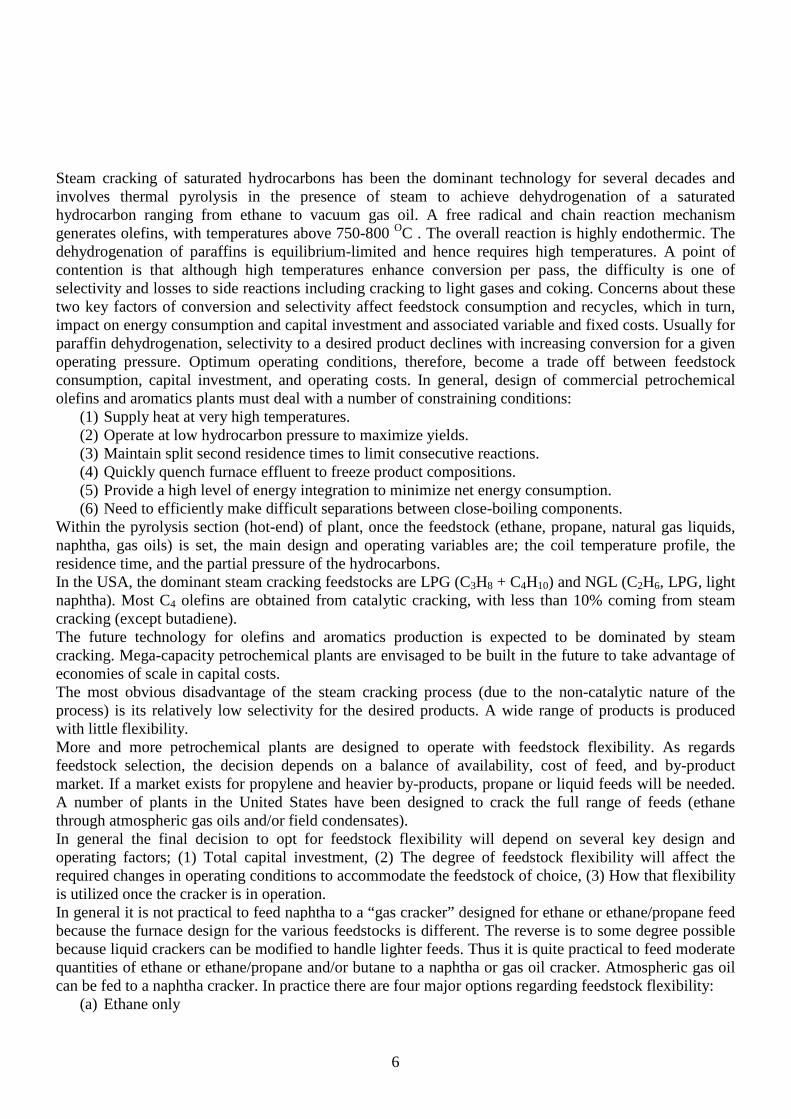
6
Steam cracking of saturated hydrocarbons has been the dominant technology for several decades andinvolves thermal pyrolysis in the presence of steam to achieve dehydrogenation of a saturatedhydrocarbon ranging from ethane to vacuum gas oil. A free radical and chain reaction mechanismgenerates olefins, with temperatures above 750-800 OC . The overall reaction is highly endothermic. Thedehydrogenation of paraffins is equilibrium-limited and hence requires high temperatures. A point ofcontention is that although high temperatures enhance conversion per pass, the difficulty is one ofselectivity and losses to side reactions including cracking to light gases and coking. Concerns about thesetwo key factors of conversion and selectivity affect feedstock consumption and recycles, which in turn,impact on energy consumption and capital investment and associated variable and fixed costs. Usually forparaffin dehydrogenation, selectivity to a desired product declines with increasing conversion for a givenoperating pressure. Optimum operating conditions, therefore, become a trade off between feedstockconsumption, capital investment, and operating costs. In general, design of commercial petrochemicalolefins and aromatics plants must deal with a number of constraining conditions:
(1) Supply heat at very high temperatures.(2) Operate at low hydrocarbon pressure to maximize yields.(3) Maintain split second residence times to limit consecutive reactions.(4) Quickly quench furnace effluent to freeze product compositions.(5) Provide a high level of energy integration to minimize net energy consumption.(6) Need to efficiently make difficult separations between close-boiling components.
Within the pyrolysis section (hot-end) of plant, once the feedstock (ethane, propane, natural gas liquids,naphtha, gas oils) is set, the main design and operating variables are; the coil temperature profile, theresidence time, and the partial pressure of the hydrocarbons.In the USA, the dominant steam cracking feedstocks are LPG (C3H8 + C4H10) and NGL (C2H6, LPG, lightnaphtha). Most C4 olefins are obtained from catalytic cracking, with less than 10% coming from steamcracking (except butadiene).The future technology for olefins and aromatics production is expected to be dominated by steamcracking. Mega-capacity petrochemical plants are envisaged to be built in the future to take advantage ofeconomies of scale in capital costs.The most obvious disadvantage of the steam cracking process (due to the non-catalytic nature of theprocess) is its relatively low selectivity for the desired products. A wide range of products is producedwith little flexibility.More and more petrochemical plants are designed to operate with feedstock flexibility. As regardsfeedstock selection, the decision depends on a balance of availability, cost of feed, and by-productmarket. If a market exists for propylene and heavier by-products, propane or liquid feeds will be needed.A number of plants in the United States have been designed to crack the full range of feeds (ethanethrough atmospheric gas oils and/or field condensates).In general the final decision to opt for feedstock flexibility will depend on several key design andoperating factors; (1) Total capital investment, (2) The degree of feedstock flexibility will affect therequired changes in operating conditions to accommodate the feedstock of choice, (3) How that flexibilityis utilized once the cracker is in operation.In general it is not practical to feed naphtha to a “gas cracker” designed for ethane or ethane/propane feedbecause the furnace design for the various feedstocks is different. The reverse is to some degree possiblebecause liquid crackers can be modified to handle lighter feeds. Thus it is quite practical to feed moderatequantities of ethane or ethane/propane and/or butane to a naphtha or gas oil cracker. Atmospheric gas oilcan be fed to a naphtha cracker. In practice there are four major options regarding feedstock flexibility:
(a) Ethane only

7
(b) Ethane/propane(c) Liquids: naphtha or gas oil or a combination of both(d) Flexible cracking with any combination of the foregoing modes
If the demand is for ethylene only, then straight ethane cracking represents the lowest unit capital choice(for the plant itself and for the related infrastructure) and the simplest co-product mix. Moving to heavierfeeds increases the unit capital cost and the complexity of the co-product mix. The battery limits andoffsites costs increase still further if a wide range of flexibility is desired. In this case the plant must beoperated optimally to take advantage of feedstock choice options in order to maximize return oninvestment.Cracker feedstock prices can have a dynamic pattern and are usually driven by (1) the value of energy, (2)the seasonal factors of feedstocks and (3) the variations in ethylene co-product values. In this respect thekey driving forces for feedstock prices are mainly natural gas and crude oil, which themselves areinterrelated. At low crude oil prices, naphtha is favored, whereas at high crude oil values light liquidscracking becomes relatively more attractive. When co-product prices are low, naphtha cracking yieldshigher cost ethylene. At times of high co-product values, the relationship is exactly reversed: naphthabecomes the lowest cost feedstock.At present the consensus among major technology licensors is that the technology of ethylene productionwill continue to be dominated by steam cracking. The over-riding consideration being design of stilllarger plants to take advantage of economies of scale in capital costs. The following are some of thefuture design considerations:(a) Single train capacities of 1 to 2 million metric tons per annum (MMTA) are envisioned, withindividual furnace capacities of up to 300,000 metric tons per annum (KTA) for gas feedstocks and230,000 KTA for liquid feedstocks.(b) Quench towers for 1.8 MMTA will be smaller and lighter than vessels presently used in refinery andpetrochemical plants.(c) Refrigeration, heat pump, and cracked gas compressors can be single train for capacities of 1.4 to 1.8MMTA.(d) Chilling-train plate-fin heat exchangers will require multiple shells/cores, possibly leading tointegration of heat exchanger surface within multi-purpose vessels.(e) Gas driers and acetylene converters may need to be in parallel.(f) Dilution steam generators may need to be in parallel for liquid feedstocks.(g) Pressure profiles may be adjusted to limit actual volumetric flow rates at compressor inlets tocapacities in the 300 to 350 thousand cubic meters per hour (KCMH) range. Pressure drops in pipelinesmay be increased to minimize the size and cost of valves and fittings.(h) In order to optimize the design of mega-capacity olefin plants, certain adjustments in processtemperature, pressure, and concentration profiles may be desirable.(i) Feedstock selection will be a crucial element regarding ethylene plant capacity and location. The long-term availability and price of the feedstocks will be an over-riding factor because of their dominant effecton cost and profitability of plants.(j) Plants processing liquid feedstocks will be affected strongly by the market demand and valueobtainable for the plant’s co-product slate.
3.2 Fischer-Tropsch SynthesisThe Fischer-Tropsch process converts catalytically synthesis gas (obtained from natural gas or coal) into awide range of hydrocarbons and oxygenates:
Coal CO/H2 hydrocarbons + alcohols

8
It has mainly been used for the production of liquid fuels (gasoline, diesel, and jet fuel) but, in principle,the process can be tuned for the production of light olefins by using different catalysts. However, lowselectivity towards ethylene, high methane formation, and insufficient catalyst activity and life areproblems as yet to be overcome for route for it to be commercially exploited. This route (discovered in1923), in hydrocarbon synthesis, it has never been able to compete economically with conventionalpetroleum-based fuels and chemicals.
3.3 Refinery off-gas recoveryIn what is called a refinery-petrochemical complex, ethylene recovery design may be integrated with theethylene unit of its adjacent refinery. Fluid Catalytic Cracking (FCC) units in oil refineries are builtprimarily to produce motor gasoline to supplement gasoline produced from other refinery units such ascatalytic reformer units. A modern oil refinery will typically include a cat cracker, particularly atrefineries in the USA due to the high demand for gasoline. In general, oil refinery cracking processesallow the production of light products (such as liquefied petroleum gas (LPG) and gasoline) from heaviercrude oil distillation fractions (such as gas oils) and residue. FCC units produce a high yield of gasolineand LPG, while hydrocracking is a major source of jet fuel, kerosene, diesel, relatively high octane ratinggasoline components and LPG. All these products have a very low content of sulfur and contaminants.
3.4 Selective Dehydrogenation of AlkanesIn recent years the demand for propylene and butylenes has increased much more rapidly than the demandfor ethylene and this situation is expected to continue [3]. In addition, the growth of refinery sources (e.g.from FCC) for these products have not kept pace with this growing demand. Moreover, cracking furnacesare very capital intensive and it is expected that in the next decades many have to be replaced because oftheir age. Therefore, direct production methods for these specific alkenes receive increasingly moreattention. A logical choice of process is the catalytic selective dehydrogenation of the correspondingalkanes.The following are 4 commercially available processes for the dehydrogenation of propane and iso-butane:
(a) Oleflex (UOP) Process(b) Catofin (ABB Lummus crest)(c) STAR (Phillips Petroleum)(d) FBD-4 (Snamprogetti)
In principle, catalytic dedydrogenation of ethane is also possible, but up to now a commerciallyattractive process has not been realized [4,5,6].
3.5 Methanol to olefinsFluidized bed technology using newly developed catalysts based on SAPO-34(a silico-alumino-phosphatemolecular sieve) is used in the Methanol to Olefins (MTO) technology for the conversion of methanol toethylene and propylene. The MTO process has developed from Mobil’s Methanol-to–Gasoline (MTG)process, which converts methanol into gasoline with alkenes as intermediates. An important considerationhere is to enhance the formation of lower alkenes and to suppress the formation of aromatics. This can beachieved through the used of certain zeolite-based catalysts. The reaction scheme is as follows:
2CH3OH H3C-O-CH3 + H2O
H3C-O-CH3 H2C=CH2 + H2O

9
H2C=CH2 + CH3OH CH2=CH-CH3 + H2O
The main disadvantages of the MTO process are:(a) The need for frequent catalyst regeneration due to substantial coke formation.(b) The need for robust temperature control because of the highly exothermic nature of the process.
For this reason it has been suggested to carry out the reaction in two fluidized bed reactors, one forreaction and one for catalyst regeneration [7,8].In 1995 a demonstration plant of the MTO process came on stream [2]. The economics of the MTOprocess is highly location-specific such as availability and price of methanol and transportation distancesinvolved.
4. DEVELOPING PROCESSING TECHNOLOGIES
4.1 Catalytic ethane partial oxidationParaffinic hydrocarbons can be catalytically cracked in the presence of oxygen to form mono-olefins.Partial oxidation implies one or both oxidative dehydrogenation and cracking. Under autothermal reactionconditions, the feed is partially combusted and the heat generated during combustion drives theendothermal cracking process. Some patents were awarded for this route but autothermal processes areyet to be commercialized.
4.2 Deep catalytic cracking/catalytic pyrolysis processThis technology involves the cracking of naphtha-range feedstocks in the presence of various catalysts.Several processes in this category have been patented and yet to be commercialized. The maindisadvantage of this route is its tendency to produce higher amounts of carbon oxides than normally foundin conventional processes. The yield per pass of the Asahi Chemical process is about 22% ethylene. Incomparison conventional yields from steam cracking of light naphtha is about 25-33% ethylene.Although the yield from the Asahi catalytic process is about 25% less than in the conventionaltechnology, the propylene yield is 20-40 percent higher and the aromatics yield is 2-4 times greater thanfrom conventional steam cracking.
4.3 Oxidative Coupling of MethaneMethane is the largest constituent of natural gas. This fact makes the direct conversion of methane intovaluable chemicals, such as ethylene, very attractive. The direct conversion of methane into ethylene ispossible by applying so-called ‘oxidative coupling’, i.e. the catalytic reaction of methane with oxygenaccording to the following reaction scheme:
2 CH4 + 1/2O2 CH3CH3 + H2O
CH3CH3 + 1/2O2 CH2CH2 + H2O
Undesirable reactions [2]:
CH4, CH3CH3 , etc + O2 CO2,CO

10
The reaction produces ethane (CH3CH3), which is converted in situ, while through sequential reactionshigher hydrocarbons are also formed in small amounts. The main problem with oxidative coupling ofmethane is the formation of large amounts of CO2 and CO by oxidative reactions. This not only reducesthe selectivity towards ethane, the high exothermicity also presents formidable heat removal problems [9].Since its invention in 1982, oxidative coupling has receive considerable attention [10,11]. The earlyresearch effort was in development of suitable catalysts. However, the best combinations of conversionand selectivity through this effort (ca. 30% and 80%, respectively) thus far achieved in laboratory fixed-bed reactors are still well below those considered economically acceptable. Accordingly, the emphasis inoxidative coupling research has shifted somewhat to innovative reactor designs, such as staged oxygenaddition and membrane reactors for combined reaction and ethylene removal [11,12,13].
6. ECONOMIC ANALYSIS
6.1 Projects’ BasisLocation : Jubail Industrial City (KSA)Year of Analysis : 2nd Quarter 2007Stream Time : 330 days/yearIncome tax rate : 2.5%Project Life Time : 20 years
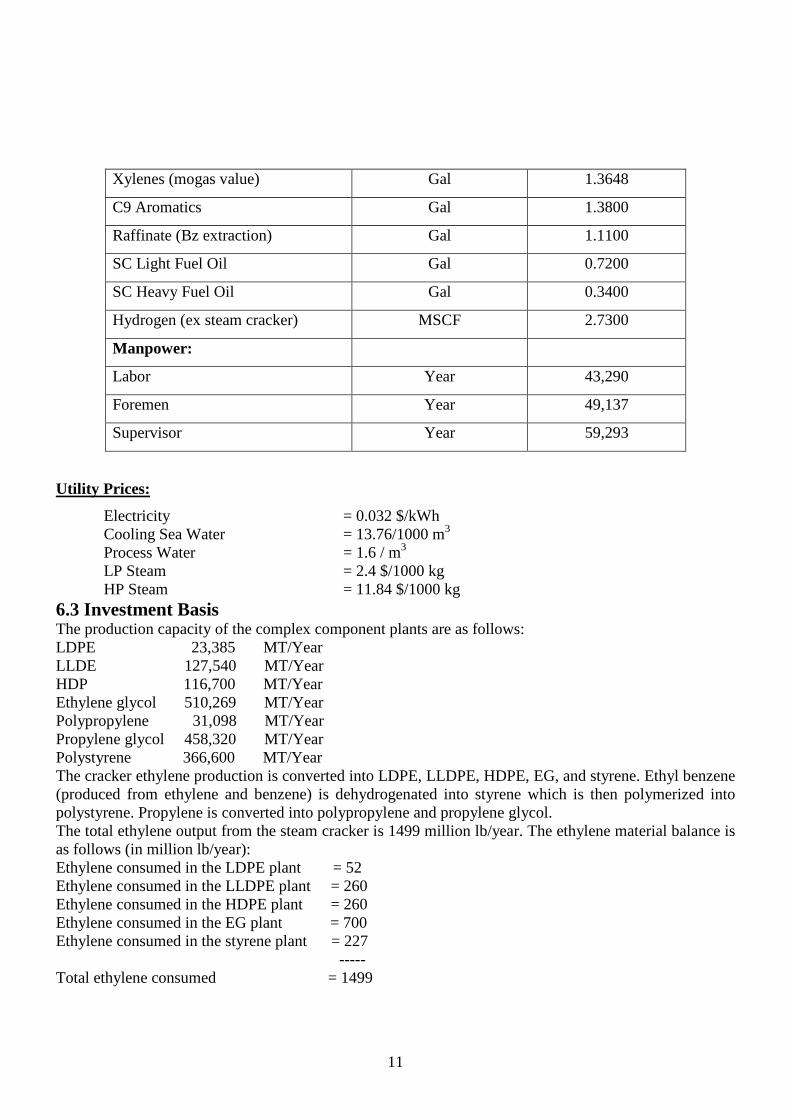
6.2 Pricing BasisThe pricing basis for the economic analysis that follows is summarized in table (6.1) for the secondquarter of 2007 for Jubail location in the Kingdom of Saudi Arabia.
Table (6.1): Average Chemical Prices Basis,(Jubail, 2nd Quarter 2007)
Unit $/Unit
Feedstock/By-product:
Ethane Gal 0.4885
Propane Gal 0.7455
Light Virgin Naphtha Gal 1.1100
Atmospheric Gas Oil Gal 1.2900
Propylene (poly grade) Lb 0.4463
Propylene (Refinery grade) Lb 0.3932
Butadiene Lb 0.3925
Raffinate-1 Gal 1.0892
Benzene Gal 2.8805
Toluene (mogas value) Gal 1.3535
11
Xylenes (mogas value) Gal 1.3648
C9 Aromatics Gal 1.3800
Raffinate (Bz extraction) Gal 1.1100
SC Light Fuel Oil Gal 0.7200
SC Heavy Fuel Oil Gal 0.3400
Hydrogen (ex steam cracker) MSCF 2.7300
Manpower:
Labor Year 43,290
Foremen Year 49,137
Supervisor Year 59,293
Utility Prices:
Electricity = 0.032 $/kWhCooling Sea Water = 13.76/1000 m3
Process Water = 1.6 / m3
LP Steam = 2.4 $/1000 kgHP Steam = 11.84 $/1000 kg
6.3 Investment BasisThe production capacity of the complex component plants are as follows:LDPE 23,385 MT/YearLLDE 127,540 MT/YearHDP 116,700 MT/YearEthylene glycol 510,269 MT/YearPolypropylene 31,098 MT/YearPropylene glycol 458,320 MT/YearPolystyrene 366,600 MT/YearThe cracker ethylene production is converted into LDPE, LLDPE, HDPE, EG, and styrene. Ethyl benzene(produced from ethylene and benzene) is dehydrogenated into styrene which is then polymerized intopolystyrene. Propylene is converted into polypropylene and propylene glycol.The total ethylene output from the steam cracker is 1499 million lb/year. The ethylene material balance isas follows (in million lb/year):Ethylene consumed in the LDPE plant = 52Ethylene consumed in the LLDPE plant = 260Ethylene consumed in the HDPE plant = 260Ethylene consumed in the EG plant = 700Ethylene consumed in the styrene plant = 227
-----Total ethylene consumed = 1499

12
ST
EA
MC
RA
CK
ER
NAPHTHA
LDPELLDPEHDPEEO EG
ETHYLENE
PROPYLENE
FUEL GAS
POLYPROPYLENE
PO PG
BENZENE ETHYLE BENZENE STYRENEPOLYSTYRENE
TOLUENE
Butadiene, Raffinate, Hydrogen, C9 Aromatics,Fuel Oil
All the toluene from the steam cracker is converted into benzene. The total benzene converted into styreneis obtained from the benzene cracker plus that from toluene. The feedstock to each plant within thecomplex is assumed to have a transfer price of product cost plus 20% ROI.Figure (6.1) shows a general flow diagram of the petrochemical complex under assessment.
Figure (6.1): Flow Diagram of Petrochemical complex
7. PRODUCTION COST ESTIMATESThe EXCEL spreadsheet cost estimate computations and the sensitivity analysis were carried out usingVisual Basic for Applications software. The fixed capital investment (FCI) estimates were based onNEXANT data and were adjusted for Saudi location in 2007 via the following correlation:
TIMESTREAMUSA
TIMESTREAMSAUDI
CAPACITYUSA
CAPACITYSAUDI
YEARBASEINDEXCOST
INDEXCOSTFACTORLOCATIONUSAFCIJUBAILFCI *
2007**)()(
6.0
Table (7.1) shows the petrochemical project totals. Tables (7.2) to (7.5) show the individual plant costestimates.

13
TABLE (7.1): PROJECT TOTALS
ANALYSIS DATE 2007LOCATION SAUDI ARABIA
PRODUCTION CAPACITY 680400 MT/Year ETHYLENE (=1500 Million Pounds per Year)
TOTAL CAPITAL INVESTMENT 5180.21 $ MillionCOST OF PRODUCTION 3267.65 $ Million/Year
ANNUAL SALES 3923.36 $ Million/YearANNUAL NET PROFITS 701.15 $ Million/Year
PLANT SERVICE LIFE 20 Years
RETURN ON INVESTMENT (ROI) 21.10%PAY BACK PERIOD 4.93 YearsNET PRESENT VALUE (AT 8.0% ) 8232.43 $ Million
DICOUNTED CASH FLOW RATE OF RETURN (IRR) 30.97%
SAUDI CAPITAL INVESTMENT DATA (BASED ON SOURCE BELOW)CAPITAL COST MILLION US $
ANALYSIS DATE 2007 ISBL 2478.8LOCATION OSBL 1285.4
1499.6016 TOTAL PLANT CAPITAL 3764.3680.4 OTHER PROJECT COSTS 995.9
OPERATING RATE 100 TOTAL PROJECT INVESTMENT 4541.2WORKING CAPITAL 639.03
TOTAL CAPITAL INVESTMENT 5180.2
USA CAPITAL INVESTMENT DATASource:NEXANT, PERP Report, Ethylene/Propylene 00/01-4, Page 93, Process: "FRN (MODERATE SEVERITY)
CAPITAL COST MILLION US $ISBL 545.7
OSBL 272.9ANALYSIS DATE 2000 TOTAL PLANT CAPITAL 818.6
LOCATION US Gulf Coast OTHER PROJECT COSTS 204.71499.6016 TOTAL PROJECT INVESTMENT 1023.3
680.4 WORKING CAPITAL 110.7OPERATING RATE 100 TOTAL CAPITAL INVESTMENT 1134.0
LOCATION FACTOR (SAUDI ARABIA / USA) 1.25CHEM. ENG. COST INDEX 2000 470
CHEM. ENG. COST INDEX 2007 500 1.0638298USA STREAM TIME (Hours/Year) 8000
SAUDI STREAM TIME (Hours/Year) 7800 1.025641
PROJECT: FULL RANGE NAPHTHA (MODERATE SEVERITY)
Thousand MT/Y
SAUDI ARABIA
CAPACITY: MM Lb/YearThousand MT/Y
CAPACITY: MM Lb/Year
14
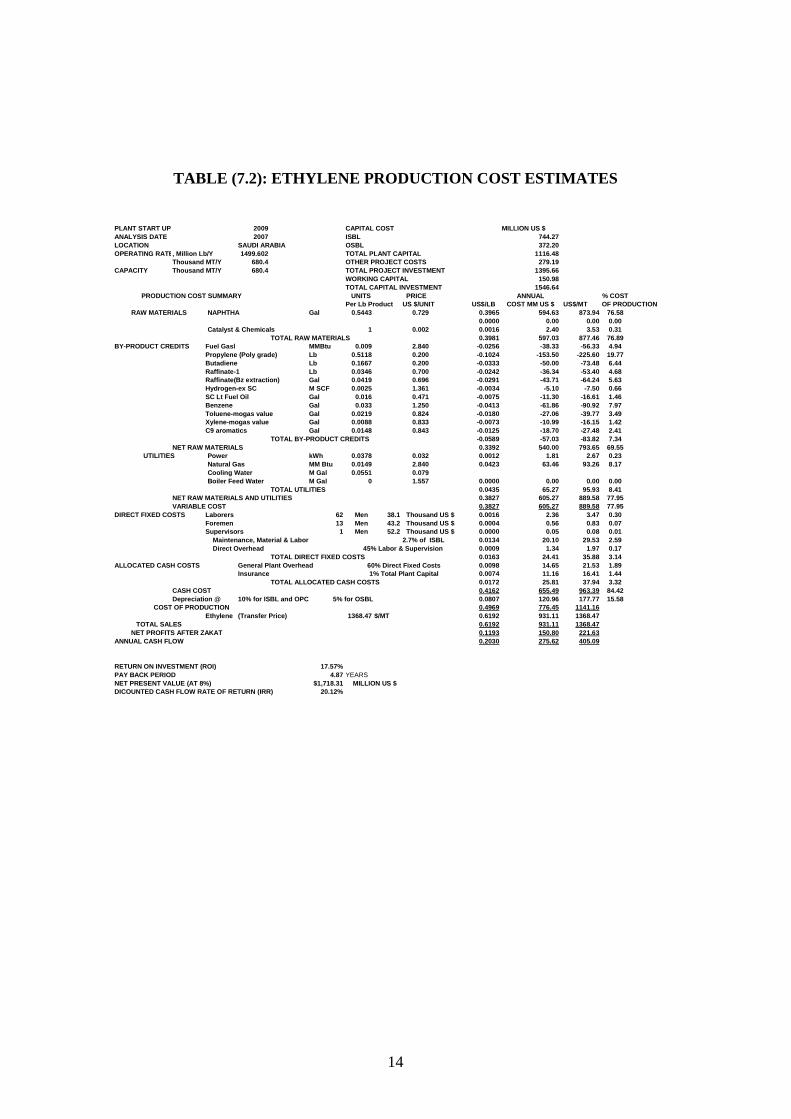
TABLE (7.2): ETHYLENE PRODUCTION COST ESTIMATES
2009 CAPITAL COST MILLION US $
ANALYSIS DATE 2007 ISBL 744.27
LOCATION SAUDI ARABIA OSBL 372.20
OPERATING RATE, Million Lb/Y 1499.602 TOTAL PLANT CAPITAL 1116.48
Thousand MT/Y 680.4 OTHER PROJECT COSTS 279.19
CAPACITY Thousand MT/Y 680.4 TOTAL PROJECT INVESTMENT 1395.66
WORKING CAPITAL 150.98
TOTAL CAPITAL INVESTMENT 1546.64
UNITS PRICE ANNUAL % COST
Per Lb Product US $/UNIT US$/LB COST MM US $ US$/MT OF PRODUCTION
NAPHTHA Gal 0.5443 0.729 0.3965 594.63 873.94 76.58
0.0000 0.00 0.00 0.00
Catalyst & Chemicals 1 0.002 0.0016 2.40 3.53 0.31
TOTAL RAW MATERIALS 0.3981 597.03 877.46 76.89
BY-PRODUCT CREDITS Fuel Gasl MMBtu 0.009 2.840 -0.0256 -38.33 -56.33 4.94
Propylene (Poly grade) Lb 0.5118 0.200 -0.1024 -153.50 -225.60 19.77
Butadiene Lb 0.1667 0.200 -0.0333 -50.00 -73.48 6.44
Raffinate-1 Lb 0.0346 0.700 -0.0242 -36.34 -53.40 4.68
Raffinate(Bz extraction) Gal 0.0419 0.696 -0.0291 -43.71 -64.24 5.63
Hydrogen-ex SC M SCF 0.0025 1.361 -0.0034 -5.10 -7.50 0.66
SC Lt Fuel Oil Gal 0.016 0.471 -0.0075 -11.30 -16.61 1.46
Benzene Gal 0.033 1.250 -0.0413 -61.86 -90.92 7.97
Toluene-mogas value Gal 0.0219 0.824 -0.0180 -27.06 -39.77 3.49
Xylene-mogas value Gal 0.0088 0.833 -0.0073 -10.99 -16.15 1.42
C9 aromatics Gal 0.0148 0.843 -0.0125 -18.70 -27.48 2.41
TOTAL BY-PRODUCT CREDITS -0.0589 -57.03 -83.82 7.34
NET RAW MATERIALS 0.3392 540.00 793.65 69.55
Power kWh 0.0378 0.032 0.0012 1.81 2.67 0.23
Natural Gas MM Btu 0.0149 2.840 0.0423 63.46 93.26 8.17
Cooling Water M Gal 0.0551 0.079
Boiler Feed Water M Gal 0 1.557 0.0000 0.00 0.00 0.00
TOTAL UTILITIES 0.0435 65.27 95.93 8.41
NET RAW MATERIALS AND UTILITIES 0.3827 605.27 889.58 77.95
VARIABLE COST 0.3827 605.27 889.58 77.95
DIRECT FIXED COSTS Laborers 62 Men 38.1 Thousand US $ 0.0016 2.36 3.47 0.30
Foremen 13 Men 43.2 Thousand US $ 0.0004 0.56 0.83 0.07
Supervisors 1 Men 52.2 Thousand US $ 0.0000 0.05 0.08 0.01
Maintenance, Material & Labor 2.7% of ISBL 0.0134 20.10 29.53 2.59
Direct Overhead 0.0009 1.34 1.97 0.17
TOTAL DIRECT FIXED COSTS 0.0163 24.41 35.88 3.14
ALLOCATED CASH COSTS General Plant Overhead 0.0098 14.65 21.53 1.89
Insurance 0.0074 11.16 16.41 1.44
TOTAL ALLOCATED CASH COSTS 0.0172 25.81 37.94 3.32
CASH COST 0.4162 655.49 963.39 84.42
Depreciation @ 10% for ISBL and OPC 5% for OSBL 0.0807 120.96 177.77 15.58
0.4969 776.45 1141.16
Ethylene (Transfer Price) 1368.47 $/MT 0.6192 931.11 1368.47
0.6192 931.11 1368.47
0.1193 150.80 221.63
ANNUAL CASH FLOW 0.2030 275.62 405.09
RETURN ON INVESTMENT (ROI) 17.57%
PAY BACK PERIOD 4.87 YEARS
NET PRESENT VALUE (AT 8%) $1,718.31 MILLION US $
DICOUNTED CASH FLOW RATE OF RETURN (IRR) 20.12%
PLANT START UP
PRODUCTION COST SUMMARY
RAW MATERIALS
UTILITIES
45% Labor & Supervision
60% Direct Fixed Costs
1% Total Plant Capital
COST OF PRODUCTION
TOTAL SALES
NET PROFITS AFTER ZAKAT

15
TABLE (7.3): BENZENE PRODUCTION COST ESTIMATES
2009 CAPITAL COST MILLION US $
ANALYSIS DATE 2007 ISBL 28.28
LOCATION SAUDI ARABIA OSBL 11.34
OPERATING RATE, Million Gal/Y 35.54725 TOTAL PLANT CAPITAL 39.63
Thousand MT/Y 118.6567 OTHER PROJECT COSTS 9.89
CAPACITY Million Gal/Y 35.54725 TOTAL PROJECT INVESTMENT 49.52
WORKING CAPITAL 0.35469174 9.09
TOTAL CAPITAL INVESTMENT 58.60
UNITS PRICE ANNUAL % COST
Per Gal Product US $/UNIT US$/Gal COST MM US $ US$/MT OF PRODUCTION
Toluene-mogas value Gal 2.3856 0.4859 1.1592 41.21 347.26 77.52
Catalyst & Chemicals 1 0.0162 0.0162 0.58 4.85 1.08
TOTAL RAW MATERIALS 1.1754 41.78 352.12 78.61
BY-PRODUCT CREDITS Fuel Gas MM Btu 0.0301 0.75 -0.0226 -0.80 -6.76 1.51
C9 Aromatics Gal 0.2278 0.5099 -0.1162 -4.13 -34.80 7.77
Mixed Xylenes Gal 0.9435 0.62 -0.5850 -20.79 -175.25 39.12
0.0000 0.00 0.00 0.00
TOTAL BY-PRODUCT CREDITS -0.6075 -0.80 -6.76 1.51
NET RAW MATERIALS 0.5678 40.98 345.35 77.10
Power kWh 0.106 0.032 0.0034 0.12 1.02 0.23
Cooling Water M GALS 1.106 0.083 0.0918 3.26 27.50 6.14
Steam(Gas),50 psig M Lb 0 1.1816 0.0000 0.00 0.00 0.00
Natural Gas MM Btu 0.0007 0.75 0.0005 0.02 0.16 0.04
0.0000 0.00 0.00 0.00
Steam(Gas),200 psig M Lb 0.0113 1.19967 0.0136 0.48 4.06 0.91
Steam(Gas), 600 psig M Lb 0.0099 1.2479 0.0124 0.44 3.70 0.83
0.0000 0.00 0.00 0.00
0.0000 0.00 0.00 0.00
0.0000 0.00 0.00 0.00
TOTAL UTILITIES 0.1216 4.32 36.44 8.13
NET RAW MATERIALS AND UTILITIES 0.6894 45.30 381.79 85.23
VARIABLE COST 0.6894 45.30 381.79 85.23
DIRECT FIXED COSTS Laborers 10 Men 43.3 Thousand US $ 0.0122 0.43 3.65 0.81
Foremen 5 Men 49.1 Thousand US $ 0.0069 0.25 2.07 0.46
Supervisors 1 Men 59.3 Thousand US $ 0.0017 0.06 0.50 0.11
Maintenance, Material & Labor 3% of ISBL 0.0239 0.85 7.15 1.60
Direct Overhead 0.0093 0.33 2.80 0.62
TOTAL DIRECT FIXED COSTS 0.0540 1.92 16.17 3.61
ALLOCATED CASH COSTS General Plant Overhead 0.0324 1.15 9.70 2.17
Insurance 0.0111 0.40 3.34 0.75
TOTAL ALLOCATED CASH COSTS 0.0435 1.55 13.04 2.91
CASH COST 0.7869 48.77 411.00 91.75
Depreciation @ 10% for ISBL and OPC 5% for OSBL 0.1233 4.38 36.95 8.25
0.9103 53.15 447.95
509.7755 $/MT 1.7016 60.49 509.78
1.7016 60.49 509.78
0.7716 7.15 60.28
ANNUAL CASH FLOW 0.9147 11.72 98.78
RETURN ON INVESTMENT (ROI) 22.43%
PAY BACK PERIOD 4.87 YEARSNET PRESENT VALUE (AT 8%) $95.60 MILLION US $
DICOUNTED CASH FLOW RATE OF RETURN (IRR) 27.96%
PLANT START UP
PRODUCTION COST SUMMARY
RAW MATERIALS
UTILITIES
45% Labor & Supervision
60% Direct Fixed Costs
1% Total Plant Capital
Benzene Transfer Price(or Sales Price)
COST OF PRODUCTION
TOTAL SALES
NET PROFITS AFTER ZAKAT

16
TABLE (7.4): STYRENE PRODUCTION COST ESTIMATES
2009 CAPITAL COST MILLION US $ANALYSIS DATE 2007 ISBL 295.08LOCATION SAUDI ARABIA OSBL 126.29OPERATING RATE, Million Lb/Y 794.91 TOTAL PLANT CAPITAL 421.38
Thousand MT/Y360.67 OTHER PROJECT COSTS 105.34CAPACITYThousand MT/Y360.67 165.2 118.657 TOTAL PROJECT INVESTMENT 526.72
WORKING CAPITAL0.354692 55.86TOTAL CAPITAL INVESTMENT 582.59
UNITS PRICE ANNUAL % COSTPer Lb Product US $/UNIT US$/LBCOST MM US $US$/MT OF PRODUCTION
Ethylene Lb 0.286 0.622034 0.1779 141.42 392.10 26.75Benzene Lb 0.787 0.504 0.3966 315.30 874.21 59.64FEEDSTOCK "C" Lb 0 0 0.0000 0.00 0.00 0.00FEEDSTOCK "D" Lb 0 0 0.0000 0.00 0.00 0.00FEEDSTOCK "E" Lb 0 0 0.0000 0.00 0.00 0.00FEEDSTOCK "F" Lb 0 0 0.0000 0.00 0.00 0.00Catalyst & Chemicals 0 0 0.0000 0.00 0.00 0.00
TOTAL RAW MATERIALS 0.5745 456.71 1266.31 86.40TOTAL BY-PRODUCT CREDITS 0.0000 0.00 0.00 0.00
NET RAW MATERIALS 0.5745 456.71 1266.31 86.40Power kWh 0.03502 0.032 0.0011 0.89 2.47 0.17Cooling Water M GALS 0.01922 0.083 0.0016 1.27 3.52 0.24Steam(Gas),50 psig M Lb 0.00057 1.1816 0.0007 0.54 1.48 0.10Steam(Gas),200 psig M Lb 0.00047 1.19967 0.0006 0.45 1.24 0.08Steam(Gas), 600 psig M Lb 0.00005 1.2479 0.0001 0.05 0.14 0.01Process Water M GALS 0.00025 0.9758 0.0002 0.19 0.54 0.04Heat Rransfer Fluid MM Btu 0.00052 0.75 0.0004 0.31 0.86 0.06Fuel Lb 0 0.02 0.0000 0.00 0.00 0.00
TOTAL UTILITIES 0.0046 3.70 10.25 0.70NET RAW MATERIALS AND UTILITIES 0.5792 460.41 1276.56 87.10VARIABLE COST 0.5792 460.41 1276.56 87.10
DIRECT FIXED COSTSLaborers 24 Men 43.3 Thousand US $ 0.0013 1.04 2.88 0.20Foremen 7 Men 49.1 Thousand US $ 0.0004 0.34 0.95 0.07Supervisors 2 Men 59.3 Thousand US $ 0.0001 0.12 0.33 0.02
Maintenance, Material & Labor 3% of ISBL 0.0111 8.85 24.54 1.67Direct Overhead 0.0009 0.68 1.87 0.13
TOTAL DIRECT FIXED COSTS 0.0139 11.03 30.58 2.09ALLOCATED CASH COSTSGeneral Plant Overhead 0.0083 6.62 18.35 1.25
Insurance 0.0053 4.21 11.68 0.80TOTAL ALLOCATED CASH COSTS 0.0136 10.83 30.03 2.05
CASH COST 0.6067 482.27 1337.17 91.23Depreciation @10% for ISBL and OPC 5% for OSBL 0.0583 46.36 128.53 8.77
0.6650 528.63 1465.70Styrene Transfer Price 1788.765 $/MT 0.8094 645.15 1788.76
0.8094 645.15 1788.760.1408 113.60 314.99
ANNUAL CASH FLOW 0.2027 162.88 451.60
RETURN ON INVESTMENT (ROI) 29.28%
PAY BACK PERIOD 4.87 YEARS
NET PRESENT VALUE (AT 8%) $1,267.39 MILLION US $
DICOUNTED CASH FLOW RATE OF RETURN (IRR) 33.02%
PLANT START UP
PRODUCTION COST SUMMARY
RAW MATERIALS
UTILITIES
45% Labor & Supervision
60% Direct Fixed Costs1% Total Plant Capital
COST OF PRODUCTION
TOTAL SALESNET PROFITS AFTER ZAKAT
17
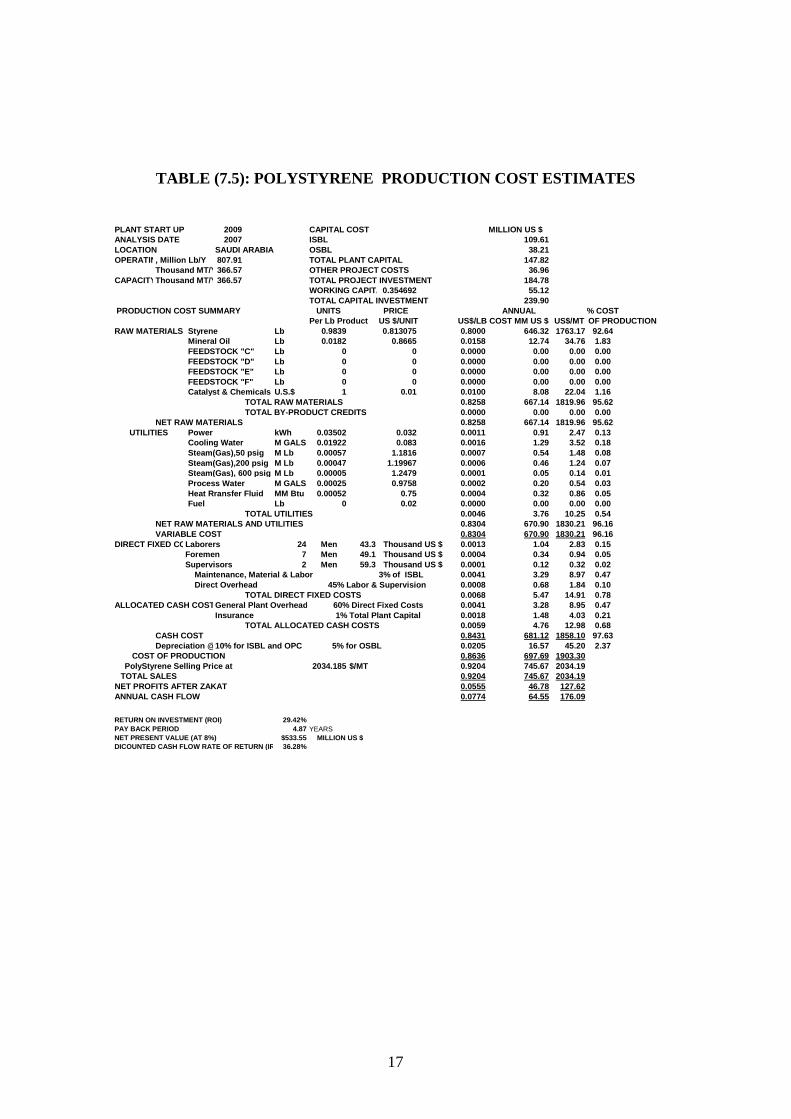
TABLE (7.5): POLYSTYRENE PRODUCTION COST ESTIMATES
2009 CAPITAL COST MILLION US $ANALYSIS DATE 2007 ISBL 109.61LOCATION SAUDI ARABIA OSBL 38.21OPERATING RATE, Million Lb/Y 807.91 TOTAL PLANT CAPITAL 147.82
Thousand MT/Y366.57 OTHER PROJECT COSTS 36.96CAPACITYThousand MT/Y366.57 TOTAL PROJECT INVESTMENT 184.78
WORKING CAPITAL0.354692 55.12TOTAL CAPITAL INVESTMENT 239.90
UNITS PRICE ANNUAL % COSTPer Lb Product US $/UNIT US$/LB COST MM US $ US$/MT OF PRODUCTION
Styrene Lb 0.9839 0.813075 0.8000 646.32 1763.17 92.64Mineral Oil Lb 0.0182 0.8665 0.0158 12.74 34.76 1.83FEEDSTOCK "C" Lb 0 0 0.0000 0.00 0.00 0.00FEEDSTOCK "D" Lb 0 0 0.0000 0.00 0.00 0.00FEEDSTOCK "E" Lb 0 0 0.0000 0.00 0.00 0.00FEEDSTOCK "F" Lb 0 0 0.0000 0.00 0.00 0.00Catalyst & Chemicals U.S.$ 1 0.01 0.0100 8.08 22.04 1.16
TOTAL RAW MATERIALS 0.8258 667.14 1819.96 95.62TOTAL BY-PRODUCT CREDITS 0.0000 0.00 0.00 0.00
NET RAW MATERIALS 0.8258 667.14 1819.96 95.62Power kWh 0.03502 0.032 0.0011 0.91 2.47 0.13Cooling Water M GALS 0.01922 0.083 0.0016 1.29 3.52 0.18Steam(Gas),50 psig M Lb 0.00057 1.1816 0.0007 0.54 1.48 0.08Steam(Gas),200 psig M Lb 0.00047 1.19967 0.0006 0.46 1.24 0.07Steam(Gas), 600 psig M Lb 0.00005 1.2479 0.0001 0.05 0.14 0.01Process Water M GALS 0.00025 0.9758 0.0002 0.20 0.54 0.03Heat Rransfer Fluid MM Btu 0.00052 0.75 0.0004 0.32 0.86 0.05Fuel Lb 0 0.02 0.0000 0.00 0.00 0.00
TOTAL UTILITIES 0.0046 3.76 10.25 0.54NET RAW MATERIALS AND UTILITIES 0.8304 670.90 1830.21 96.16VARIABLE COST 0.8304 670.90 1830.21 96.16
DIRECT FIXED COSTSLaborers 24 Men 43.3 Thousand US $ 0.0013 1.04 2.83 0.15Foremen 7 Men 49.1 Thousand US $ 0.0004 0.34 0.94 0.05Supervisors 2 Men 59.3 Thousand US $ 0.0001 0.12 0.32 0.02
Maintenance, Material & Labor 3% of ISBL 0.0041 3.29 8.97 0.47Direct Overhead 0.0008 0.68 1.84 0.10
TOTAL DIRECT FIXED COSTS 0.0068 5.47 14.91 0.78ALLOCATED CASH COSTSGeneral Plant Overhead 0.0041 3.28 8.95 0.47
Insurance 0.0018 1.48 4.03 0.21TOTAL ALLOCATED CASH COSTS 0.0059 4.76 12.98 0.68
CASH COST 0.8431 681.12 1858.10 97.63Depreciation @10% for ISBL and OPC 5% for OSBL 0.0205 16.57 45.20 2.37
0.8636 697.69 1903.302034.185 $/MT 0.9204 745.67 2034.19
0.9204 745.67 2034.19NET PROFITS AFTER ZAKAT 0.0555 46.78 127.62ANNUAL CASH FLOW 0.0774 64.55 176.09
RETURN ON INVESTMENT (ROI) 29.42%
PAY BACK PERIOD 4.87 YEARS
NET PRESENT VALUE (AT 8%) $533.55 MILLION US $
DICOUNTED CASH FLOW RATE OF RETURN (IRR)36.28%
TOTAL SALESPolyStyrene Selling Price at
COST OF PRODUCTION
1% Total Plant Capital60% Direct Fixed Costs
45% Labor & Supervision
PLANT START UP
PRODUCTION COST SUMMARY
RAW MATERIALS
UTILITIES

18
Figures (7.1) to (7.7) show the sensitivity of plant profitability measures in relation to different operatingparameters.
FIGURE (7.1):EFFECT OF PLANT OPERATING RATE ON ROI
0%
5%
10%
15%
20%
25%
68 136 204 272 340 408 476 544 612 680
PLANT OPERATING RATE MT/Y OF ETHYLENE
RO
I
FIGURE (7.2):EFFECT OF PLANT OPERATING RATE ON PAY BACK PERIOD
0.0
1.0
2.0
3.0
4.0
5.0
6.0
7.0
68.04 136.08 204.12 272.16 340.2 408.24 476.28 544.32 612.36 680.4
PLANT OPERATING RATE MT/Y OF ETHYLENE
PA
YB
AC
KP
ER
IOD
,Y
EA
RS

19
FIGURE (7.3):EFFECT OF PLANT OPERATING RATE ON NPV
0
1000
2000
3000
4000
5000
6000
7000
8000
9000
10000
68.04 136.08 204.12 272.16 340.2 408.24 476.28 544.32 612.36 680.4
PLANT OPERATING RATE, MT/Y OF ETHYLENE
NP
V,
$M
illi
on
FIGURE (7.4):EFFECT OF PLANT OPERATING RATE ON IRR
28%
28%
29%
29%
30%
30%
31%
31%
68.04 136.08 204.12 272.16 340.2 408.24 476.28 544.32 612.36 680.4
PLANT OPERATING RATE, MT/Y OF ETHYLENE
IRR

20
FIGURE (7.5):EFFECT OF OPERATING RATE ON PROFITABILITY
1400
1900
2400
2900
3400
3900
4400
4900
5400
5900
374 408 442 476 510 544 578 612 646 680
OPERATING RATE, MT/YEAR
MIL
LIO
N$
/YE
AR
PLANT DESIGN CAPACITY = 680,400 MT/YEAR
SALES
OPERATING COSTS
NET PROFITS
FIGURE (7.6):EFFECT OF NAPHTHA FEEDSTOCK PRICE ON ON NET ANNUAL PROFITS
0.0
200.0
400.0
600.0
800.0
1000.0
1200.0
1400.0
0.7 0.8 0.9 1 1.1 1.2 1.3 1.4 1.5
NAPHTHA FEEDSTOCK PRICE, $/Gallon
NE
TA
NN
UA
LP
RO
FIT
SM
ILL
ION
$/Y
PLANT DESIGN CAPACITY = 680,400 MT/Y OF ETYHLENE
OPERATING RATE = 680,400 MT/YEAR
OPERATING RATE = 544,320 MT/YEAR
OPERATING RATE = 408,240 MT/YEAR

21
FIGURE (7.7):EFFECT OF CHANGES IN ANNUAL SALES ON PROFITABILITY
-800
-600
-400
-200
0
200
400
600
800
1000
1200
0.55 0.60 0.65 0.70 0.75 0.80 0.85 0.90 0.95 1.00
FRACTIONAL CHANGE IN ANNUAL SALES, $/MT
AN
NU
AL
PR
OF
ITS
,M
ILL
ION
DO
LL
AR
S
PLANT DESIGN CAPACITY =680,400 MT /Y
8. CONCLUSIONSThe assessment of liquids cracking in the Kingdom of Saudi Arabia has been shown to be highlyprofitable. The use of gaseous feedstocks, such as NGL, limits down stream product integration. In theexample undertaken in this study, ethylene was reacted with benzene (which is essentially not availablefrom gaseous cracking) to produce styrene and subsequently the important polymer polystyrene. Theproject’s profitability is especially sensitive to naphtha feedstock and products selling prices as well as theoperating rate. A rise in naphtha cost from 0.73 $/gallon to 1.02 $/gallon (i.e. an increase of 39.7%)results in a drop in annual profits from 1153.41 $ million to 1124.34 $ million (i.e. a drop of 29.07 $million per year). The sensitivity analysis also showed that the project’s profitability is particularlysensitive to annual operating rate. A decrease in operating rate (due to a drop in market demand forexample) from 680,400 tons/year to 544,320 ton/year (i.e. a drop of 20%) will decrease annual profitsfrom 1153.41 $ million to 676.78 $ million (i.e. a decrease of 41%).
9. REFERENCES1. Jean-Francois Seznec, 41st Middle East Policy Council Capitol Hill Conference, Washington, on
“Saudi Arabia’s WTO Accession Panel”,3rd January 2006, www.saudi-us-relations.org/articles/2006/ioi/060122-mepc-seznec.html.
2. Moulijn JA, Makkee M., Van Diepen A., “Chemical Process Technology”, Wiley, New York, pp.122, 2001.
3. NEXANT PERP Report 04/05-7,”Ethylene”, September 2005.4. Moulijn JA, Makkee M., Van Diepen A., “Chemical Process Technology”, Wiley, New York, pp.
123-125, 2001.5. Zehnder S, “What are Western Europe’s petrochemical feedstock options?”, Hydroc. Process.
77(2), pp. 59-65, 1998.6. Grantom RL and Royer DJ,”Ethylene” in: Gerhartz W, et al (eds.) Ullman’s Encyclopedia of
Industrial Chemistry A10, 5th ed., VCH Weinheim, pp. 45-93.
22
7. Calamur N and Carrera M, ”Propylene” in: Kroschwitz JI, Howe-Grant M (eds.) Kirk-OthmerEncyclopedia of Chemical Technology, vol 20, 4th ed., Wiley, New York, pp. 249-271.
8. Sundaram KM, Shreehan MM and Olszewski EF, “Ethylene” in: Kroschwitz JI, Howe-Grant M(eds.) Kirk-Othmer Encyclopedia of Chemical Technology, vol 9, 4th ed., Wiley, New York, pp.877-915.
9. Bos Anr and Tromp PJJ,”Conversion of methanol to lwer olefins. Kinetic modeling, reactorsimulation, and selection”,Ind. Eng.Chem.Res. 34 3808-3816,1995.
10. Nilsen, HR,”The UOP/Hydro Methanol to olefin process:its potential as opposed to the presentapplication of natural gas as feedstock”, Proceedings of the 20th World GasConference,Copenhagen, Denmark, 10-13 June, FRT 1-05, 1997
11. Keller GE and Bhasin MM, “Synthesis of ethylene via oxidative coupling of methane. I.Determination of active catalysts”, J. Catal. 73 9-19, 1982.
12. Lunsford JH,”Oxidative coupling of methane and related reactions”, in: Ertl G., Knozinger H andWeitkamp J (eds.) Handbook of Heterogenous Catalysis, VCH, Weinheim, pp. 1843-1856 andreferences therein, 1997.
13. Androulakis IP and Reyes SC,” Role of distributed oxygen addition and product removal in theoxidative coupling of methane”, AIChE J, 45 860-868 and references therein.
Recommended