Pharmacodynamic Paradigms in Early-Phase Cancer Clinical Trials
WorkshopPhase 0 Trials In Oncologic Drug
Development
Hilary CalvertNorthern Institute for Cancer Research

Methodology for Phase I and Phase 0 (translational) Trials
Develop trial methodology designed for targeted agents in trials with pharmacodynamic endpoints
The use of pharmacodynamic or toxic endpoints present similar problems – magnitude, reproducibility, variability
Endpoints– To develop methods that utilise continuously variable
(scalar) endpoints rather than yes/no (Boolean) endpoints
– To extend these techniques to combination Phase I trials
1. Traditional– Starting dose– Modified Fibonacci escalation– Maximum Tolerated Dose (MTD) as
an endpoint– Disadvantages
• Patient inefficient• Many patients at ineffective doses• Safety risk as MTD is approached• No built-in confidence intervals
2. Pharmacokinetically-guided (Collins)– Establish Target Area Under the Curve (AUC)
from preclinical studies– Monitor Pharmacokinetics at starting dose– Escalate in large increments to achieve
target AUC in patients• Inter-patient variability in PKs
– Disadvantages• Assumes linearity• Metabolites• May not be feasible
3. Continual Reassessment (O’Quigley)– Stochastic model to predict probability of
DLT vs dose– Starting dose– Dose doubling– Add data to model– Predict dose with desired probability of DLT– Disadvantages
• Methodologically complex• Needs constraints for safety• May take time to converge
4. Accelerated Phase I Design (Simon)– Starting dose– Single patient dose doubling– Increase patients per cohort and
reduce dose increments when mild (Grade II) toxicity is seen
– Disadvantages• Could be hazardous with a steep
dose/toxicity relationship• Little data at lower dose levels
Classical Methodology for Phase I and Translational Trials

Classical Methodology for Phase I and Translational Trials
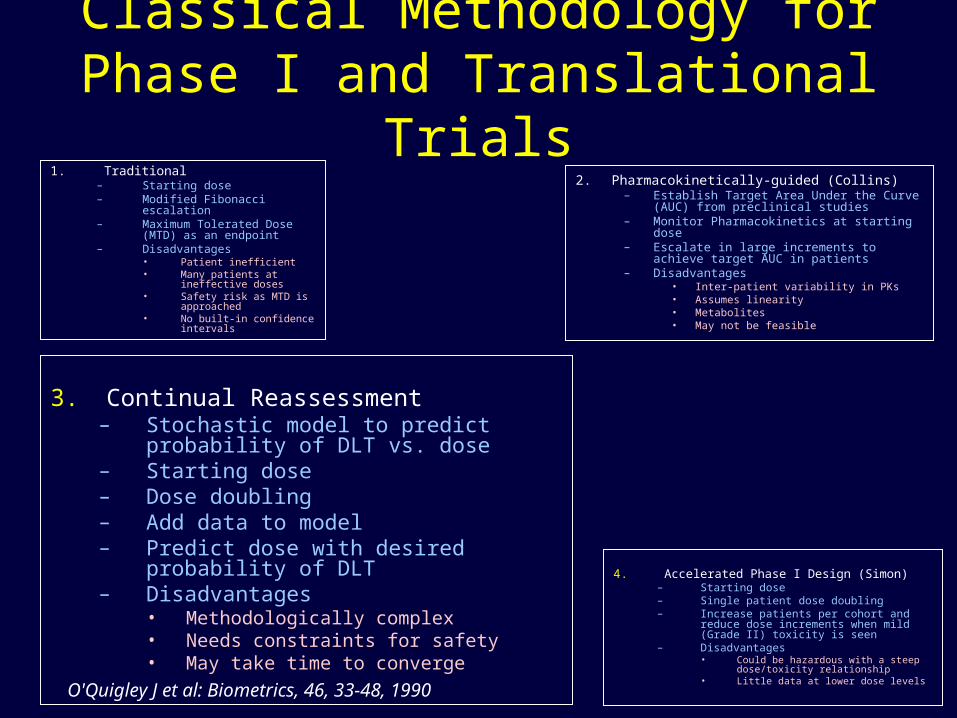
1. Traditional– Starting dose– Modified Fibonacci
escalation– Maximum Tolerated Dose
(MTD) as an endpoint– Disadvantages
• Patient inefficient• Many patients at
ineffective doses• Safety risk as MTD is
approached• No built-in confidence
intervals
2. Pharmacokinetically-guided (Collins)– Establish Target Area Under the Curve
(AUC) from preclinical studies– Monitor Pharmacokinetics at starting dose– Escalate in large increments to achieve
target AUC in patients– Disadvantages
• Inter-patient variability in PKs• Assumes linearity• Metabolites• May not be feasible
3. Continual Reassessment (O’Quigley)– Stochastic model to predict probability of
DLT vs. dose– Starting dose– Dose doubling– Add data to model– Predict dose with desired probability of DLT– Disadvantages
• Methodologically complex• Needs constraints for safety• May take time to converge
4. Accelerated Phase I Design (Simon)– Starting dose– Single patient dose doubling– Increase patients per cohort and
reduce dose increments when mild (Grade II) toxicity is seen
– Disadvantages• Could be hazardous with a steep
dose/toxicity relationship• Little data at lower dose levels
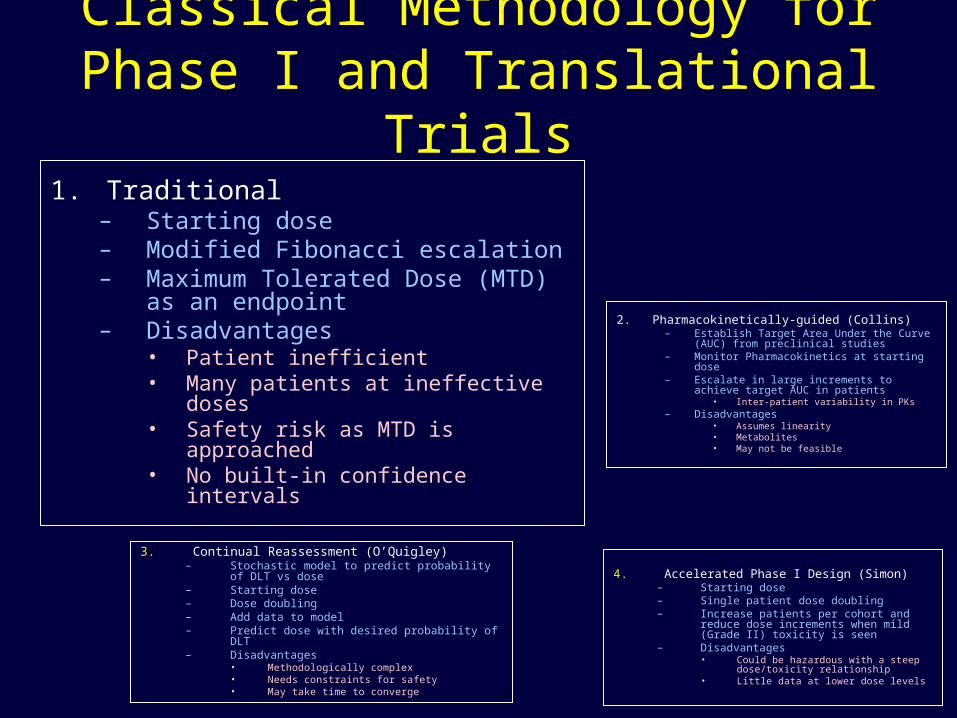
CI-941 – DMP-941 - Losoxantrone
• Similar to mitoxantrone• Animal models
– Activity equal to or better than doxorubicin– No or little cardiotoxicity
• One of 3 analogues submitted for clinical development by Warner Lambert• Candidate for AUC-based dose escalation
– Preclinical pharmacology established “target” AUC and linearity up to 45 mg/m2
N N
OH O NNH
OH
NHOH

Foster et al, Br J Cancer 28(213):463-469, 1992
Recommended Phase II dose
Target AUC
Classical Methodology for Phase I and Translational Trials
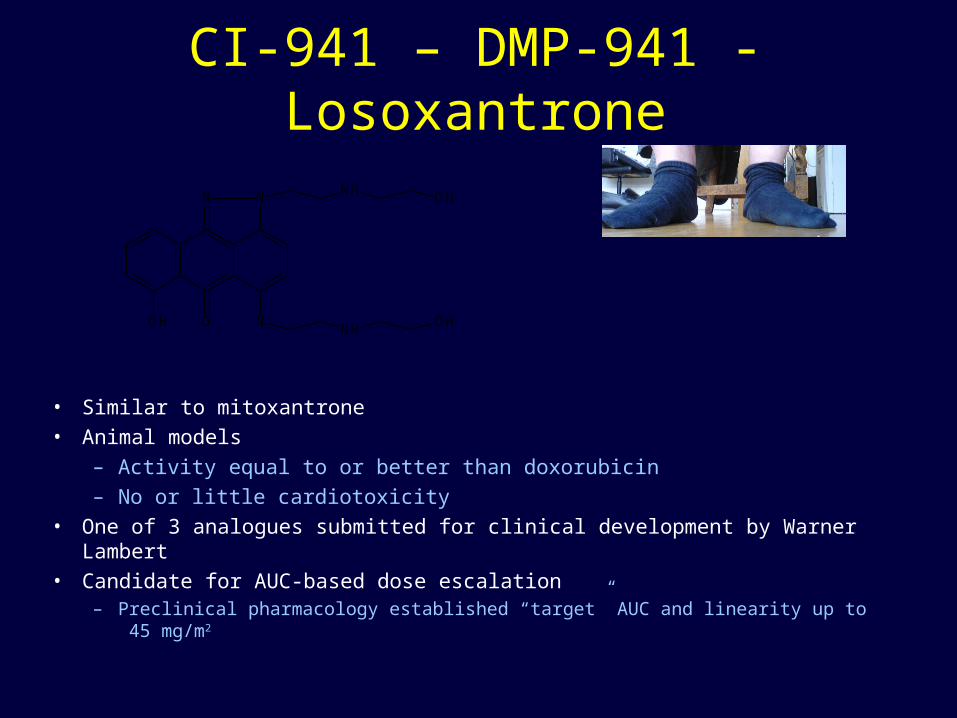
1. Traditional– Starting dose– Modified Fibonacci
escalation– Maximum Tolerated Dose
(MTD) as an endpoint– Disadvantages
• Patient inefficient• Many patients at
ineffective doses• Safety risk as MTD is
approached• No built-in confidence
intervals
2. Pharmacokinetically-guided (Collins)– Establish Target Area Under the Curve (AUC)
from preclinical studies– Monitor Pharmacokinetics at starting dose– Escalate in large increments to achieve
target AUC in patients– Disadvantages
• Inter-patient variability in PKs• Assumes linearity• Metabolites• May not be feasible
3. Continual Reassessment– Stochastic model to predict probability
of DLT vs. dose– Starting dose– Dose doubling– Add data to model– Predict dose with desired probability of
DLT– Disadvantages
• Methodologically complex• Needs constraints for safety• May take time to converge
4. Accelerated Phase I Design (Simon)– Starting dose– Single patient dose doubling– Increase patients per cohort and
reduce dose increments when mild (Grade II) toxicity is seen
– Disadvantages• Could be hazardous with a steep
dose/toxicity relationship• Little data at lower dose levelsO'Quigley J et al: Biometrics, 46, 33-48, 1990

Comparison of mCRM1 Method with Traditional Method - Pemetrexed
Proc ASCO 1997, Abs no 733
Schedule Q21D2 WQ4x6W3 Dx5Q21D4
Escalation Method mCRM mCRM Traditional
Doses mg/m2 50-700 10-40 0.2-5.2
No. Dose levels 7 4 10
MTD 600 30 4
Months to MTD 9 12 29
Pts near Phase II dose
20/37 16/24 11/38
1. Rinaldi DA et al: Cancer Chemotherapy and Pharmacology 44 (5): 372-380, 19992. Rinaldi DA et al: Journal of Clinical Oncology 13 (11): 2842-2850, 19953. McDonald AC et al: Clinical Cancer Research 4 (3): 605-610, 19984. Faries D: J Biopharm Stat 4:147-164, 1994

Classical Methodology for Phase I and Translational Trials
1. Traditional– Starting dose– Modified Fibonacci
escalation– Maximum Tolerated Dose
(MTD) as an endpoint– Disadvantages
• Patient inefficient• Many patients at
ineffective doses• Safety risk as MTD is
approached• No built-in confidence
intervals
2. Pharmacokinetically-guided (Collins)– Establish Target Area Under the Curve (AUC)
from preclinical studies– Monitor Pharmacokinetics at starting dose– Escalate in large increments to achieve
target AUC in patients– Disadvantages
• Inter-patient variability in PKs• Assumes linearity• Metabolites• May not be feasible
3. Continual Reassessment (O’Quigley)– Stochastic model to predict
probability of DLT vs. dose– Starting dose– Dose doubling– Add data to model– Predict dose with desired
probability of DLT– Disadvantages
• Methodologically complex• Needs constraints for safety• May take time to converge
4. Accelerated Phase I Design (Simon)– Starting dose– Single patient dose doubling– Increase patients per cohort and
reduce dose increments when mild (Grade II) toxicity is seen
– Disadvantages• Could be hazardous with a steep
dose/toxicity relationship• Little data at lower dose levels
Simon R et al: Journal of the National Cancer Institute 89 (15): 1138-1147, 1997

Methodology for Phase I and Translational Trials
• Traditional– Starting dose– Modified Fibonacci escalation– Maximum Tolerated Dose (MTD)
as an endpoint– Disadvantages
• Patient inefficient• Many patients at ineffective doses• Safety risk as MTD is approached• No built-in confidence intervals
• Pharmacokinetically-guided (Collins)– Establish Target Area Under the
Curve (AUC) from preclinical studies– Monitor Pharmacokinetics at starting
dose– Escalate in large increments to
achieve target AUC in patients– Disadvantages
• Inter-patient variability in PKs• Assumes linearity• Metabolites• May not be feasible
• Continual Reassessment (O’Quigley)– Stochastic model to predict probability
of DLT vs dose– Starting dose– Dose doubling– Add data to model– Predict dose with desired probability of
DLT– Disadvantages
• Methodologically complex• Needs constraints for safety• May take time to converge
• Accelerated Phase I Design (Simon)– Starting dose– Single patient dose doubling– Increase patients per cohort and
reduce dose increments when mild (Grade II) toxicity is seen
– Disadvantages• Could be hazardous with a steep
dose/toxicity relationship• Little data at lower dose levels
SLOW AND STEADY
HARD TO GET
FAST AND LOOSE
CHEAP AND CHEERFUL

Use of Pharmacodynamic Endpoints
• Almost always useful as a secondary endpoint– Clinical “proof of principle”
of an effect on the target• May be useful as a primary
endpoint if– Target is known, is single
and is known to mediate the therapeutic effect
– Level of target suppression needed is known (50%, 90%, 99%?)
– Required duration of target effect is known
– It is possible to measure all of the above
• Methodology required for trials with a Pharmacodynamic endpoint– Requires definition of a dose
where an effect of sufficient magnitude is present for sufficiently long in a sufficiently high proportion of the patients
– Endpoint is scalar (e.g., 95%) rather than Boolean (e.g., DLT present or not)
– Interpatient variability and confidence intervals
– Prediction of duration of effect
• Use of a scalar (continuously variable) methodology will also be of value where toxicity is used as an endpoint

PARP Inhibitor Phase 1 (0.5?) Trial: AG014699
• Potent inhibitor, IV administration• Not expected to be active as a single agent (BRCA data
not known at the time of design)• Expected to potentiate monomethylating agents and
Topoisomerase I active compounds• Tumour biopsies required for PD endpoint• Desire for single agent data on PARP inhibitor• Combination study with temozolomide undertaken
– PARP inhibitors potentiate temozolomide– Temozolomide active in melanoma– Melanoma patients have multiple lesions, biopsies
relatively easy– Single dose of AG14699 scheduled 1 week before combo
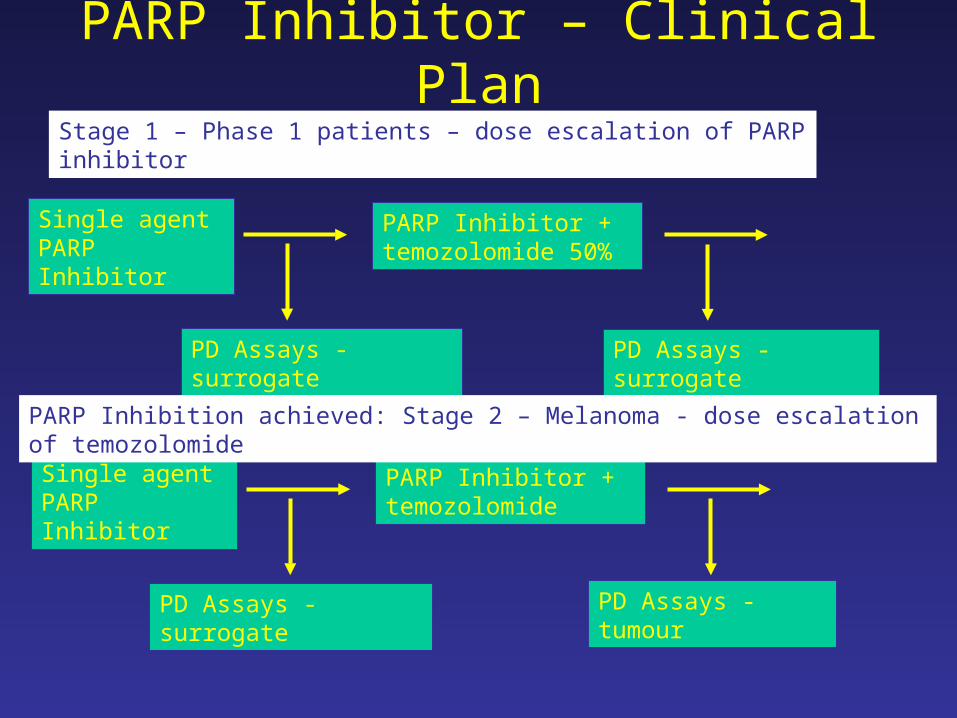
PARP Inhibitor – Clinical Plan
Single agent PARP Inhibitor
PARP Inhibitor + temozolomide 50%
PD Assays - surrogate PD Assays - surrogate
Stage 1 – Phase 1 patients – dose escalation of PARP inhibitor
Single agent PARP Inhibitor
PARP Inhibitor + temozolomide
PD Assays - surrogate PD Assays - tumour
PARP Inhibition achieved: Stage 2 – Melanoma - dose escalation of temozolomide
PD End point
• PARP Inhibitory Dose (PID)• Dose of AG-014699 causing ≥50%
inhibition on PARP-1 ex vivo in peripheral blood lymphocytes 24 hours after 1st dose, with a plateau in the degree of inhibition between dose levels.
• Validated quantified immunoblot using monoclonal antibody against PAR

Median RTV
0 10 20 30 40 50 60 700.0
2.5
5.0
7.5
10.0
12.5
Control
TM 136
TM 68
TM 68 + 699 0.1
TM 68 + 699 1.0
699 10
TM 68 + 699 10
Day
Med
ian
RT
V(SW620 xenografts)

Plasma and tumour [447] and tumour PARP activityafter 1.0 mg/kg
30 min 6 hr 24 hr0
20
40
60
80
100
120
140
[Plasma]
PARP activity
[Tumour]
0
20
40
60
80
100
Time after injection
[699
] n
g/m
lP
AR
P activity: %
Co
ntro
l

PARP immunoblot assay with grateful thanks and credit to Alex
Bürkle and Ruth Plummerpermeabilised cell suspension
expose to NAD+ and oligonucleotide for 6 min
stop reaction with ice-cold 12.5µM 699
blot known number of cells on to nylon membrane
probe with 1° anti-PAR antibody
probe with 2° HRP-conjugated antibody
expose to ECL and measure luminescence
PAR formed

PARP Assay Validation• Minimise / explain variability
– Enzyme stable with freezing??– Inhibition stable with freezing– Can inhibition be measured in PBMCs?
• Establish procedures for handling samples– Does sampling and transport affect result?– Consistency of assay reagents
• Provide standards for acceptability of results– Control samples– Intra- and inter-assay variability
• Thanks to Ruth Plummer• Probably 1-2 person years

Schedule: 28 day cycle
-10 to -4 1 4 8 15 22 28
↑ ↑ ↑
PK PK PK
PD PD PD
PK PK
Comet Comet
:Temozolomide
:AG014699
Day:
Biopsy Biopsy in Part 2 (melanoma patients) only
PK (plasma) and PD (lymphocytes) in Part 1 (any tumour) and 2 (melanoma)First cycle only

Part 1 Part 2
Number 17 15
Male:female 3:4 8:7
Mean age (range) 56 (31-72) 48 (32-68)
Performance status 0:1:2
7:10:0 9:6:0
Tumour type Sarcoma 3 Melanoma 15
Melanoma 3 (13 cutaneous, 1 ocular, 1clear cell sarcoma of soft
tissue)
Colorectal 3
Others 8
Previous treatment Pretreated but no DTIC/Temozolomide
Chemonaive
Patient Demographics

Dosing and toxicityCohort 699 dose
(mg/m2)TMZ dose (mg/m2)
n DLT
Part 1(n=18)
1 1 100 3 None
2 2 100 4 None
3 4 100 4 None
4 8 100 4 None
5 12 100 3 None
Part 2(n=15)
6 12 135 3 None
7 12 170 3 None
8 12 200 3 None
9 18 200 6 1/6 plus 3 C2 dose delays

DN04 - PBL PARP activity after AG014699 3.72mg (2 mg/m2)
31 271 14630
10
20
30
40
50
60
70
80
90
100
110
120
33 273 1463 30 270 1467
day -7 day 1 day 4
time after start of infusion (minutes)
PA
R f
orm
ed p
er 1
06 P
BL
(p
mo
l m
on
om
er)

AH27 - PBL PARP activity after AG014699 27.8 mg (12 mg/m2)
39 281 14410
100
200
300
400
500
600
700
800
900
1000
38 242 1602 45 283 1448 Day 8
day -7 day 1 day 4 day 8
time after start of infusion (minutes)
PA
R f
orm
ed p
er 1
06 P
BL
(pm
ol
mo
no
mer
)
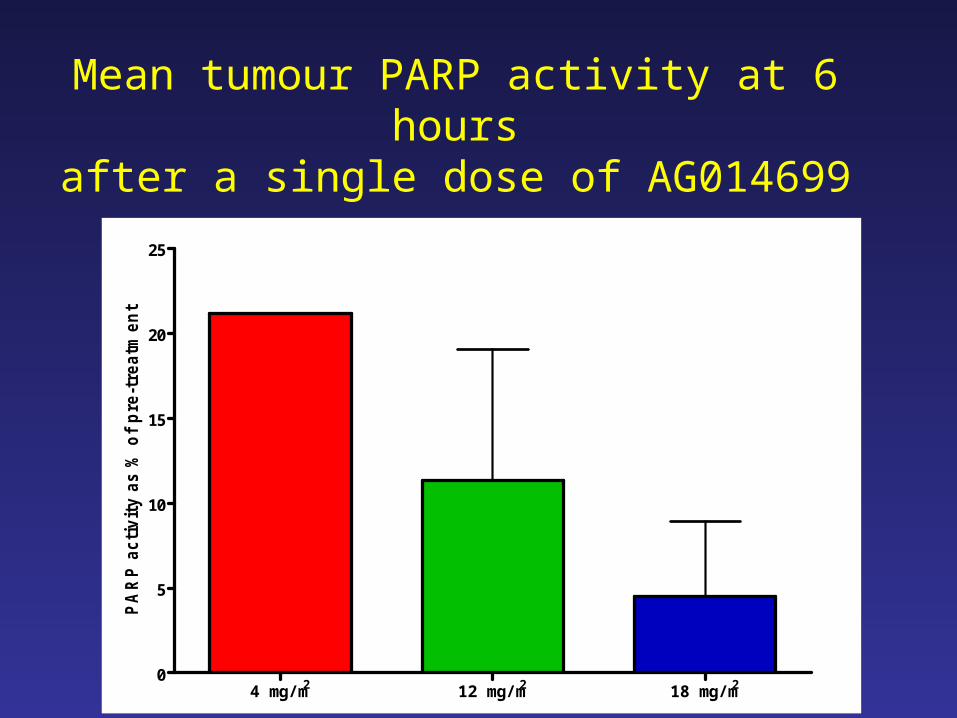
4 mg/m2 12 mg/m2 18 mg/m2
0
5
10
15
20
25
PA
RP
act
ivit
y as
% o
f p
re-t
reat
men
tMean tumour PARP activity at 6 hours
after a single dose of AG014699

AG14699 Phase 0/1 TrialInterpretation
• 12 mg/m2 AG14699 causes profound inhibition of PARP in PBMCs and ~90% inhibition in melanoma
• 12 mg/m2 AG14699 can be given with a “full” dose of temozolomide
• Protocol criteria have been met, but:– Might 18 mg/m2 with a dose-reduction for
temozolomide work better?– What would be the variability of the level and
duration of tumour inhibition?– Do we need a longer period of inhibition for
single agent treatment of BRCA tumours?– What might the effects on PARP homologues be?
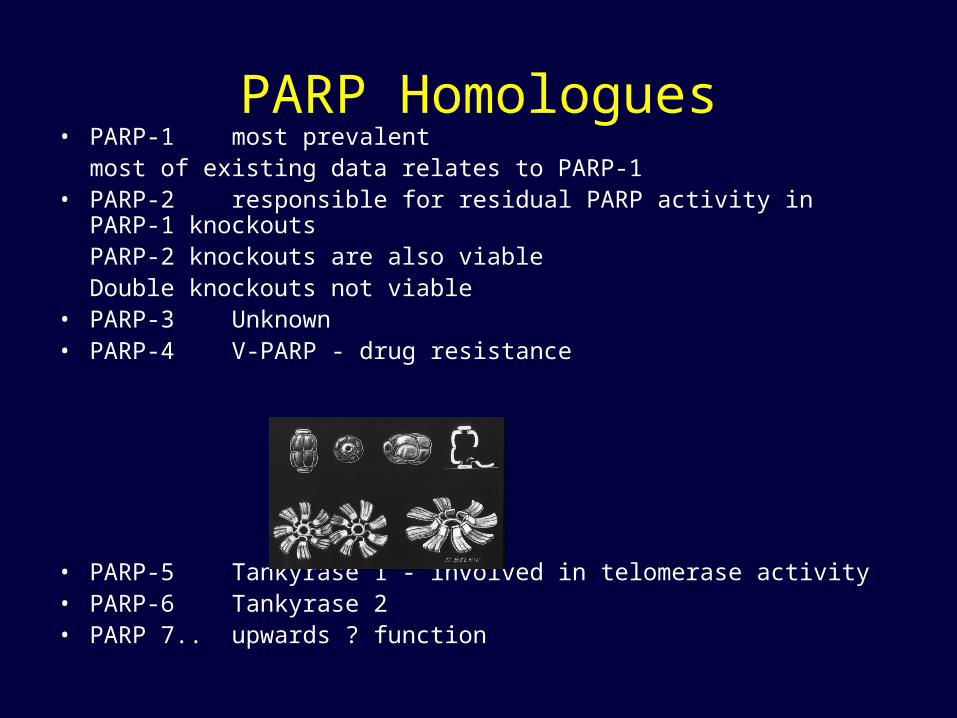
PARP Homologues• PARP-1 most prevalent
most of existing data relates to PARP-1• PARP-2 responsible for residual PARP activity in
PARP-1 knockouts PARP-2 knockouts are also viable
Double knockouts not viable• PARP-3 Unknown• PARP-4 V-PARP - drug resistance
• PARP-5 Tankyrase 1 - involved in telomerase activity• PARP-6 Tankyrase 2• PARP 7.. upwards ? function

Two Dimensional CRM MethodDeveloped in house by James Wright
• New targeted agents will be used in combination with both traditional cytotoxics and other targeted agents
– “Multikinase inhibitors”
• For every single agent Phase I there will be many combination Phase Is
• Toxicities may potentiate or antagonise
• For any two drugs, there is a range of maximum tolerated dose pairs
MTD of Drug A
MTD
of
Dru
g B
Toxic AntagonismToxic Additivity
Toxic Synergy

D1
D2
0.00 0.25 0.4 0.6 0.8 0.95
0.00 0.00 0.16 0.22 0.30 0.40 0.48
0.25 0.16 0.24 0.30 0.40 0.51 0.620.40 0.22 0.30 0.37 0.49 0.60 0.680.60 0.30 0.40 0.49 0.60 0.70 0.770.80 0.40 0.51 0.60 0.70 0.79 0.840.95 0.48 0.62 0.68 0.77 0.84 0.88
Priors are constructed showing the probability of dose limiting toxicity for each pair of doses
Two Dimensional CRM MethodDeveloped by James Wright, PhD Student, 1997-2000
• CRM Methodology requires that the probability of DLT at each level is estimated before the start of the trial (priors)
• A model relating the probability of DLT to dose is created using the estimated data points• As real data accumulate during the course of the trial they are used to modify the model• A problem for single agent studies is that the initial estimates may be way out• For combination Phase I studies, single agent data are already available, facilitating the
estimation of priors
• Hypothetical example:
Data derived from single agent Phase I Studies
Data estimated from mechanistic knowledge and experience

CRM Method – Illustration with Completed Trial
• OSI 211 in combination Phase I with carboplatin
OPt
OO
O
H3N
H3N
OSI211 – Liposomal LurtotecanCarboplatin
O
O N
N
NMe
NO
O
OEtHO
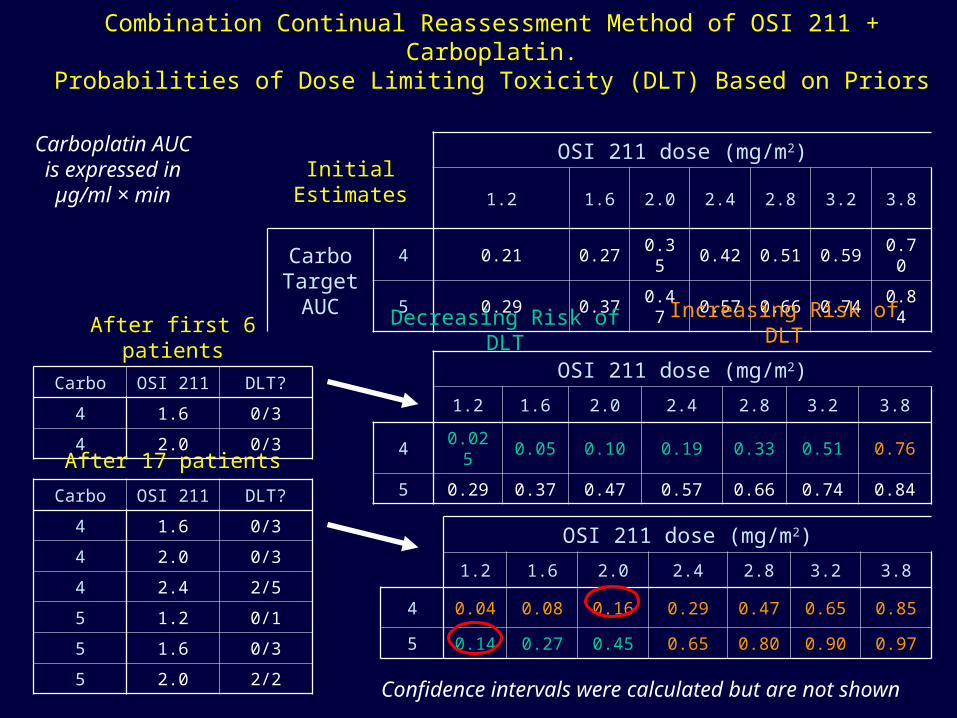
Combination Continual Reassessment Method of OSI 211 + Carboplatin.Probabilities of Dose Limiting Toxicity (DLT) Based on Priors
OSI 211 dose (mg/m2)
1.2 1.6 2.0 2.4 2.8 3.2 3.8
4 0.04 0.08 0.16 0.29 0.47 0.65 0.85
5 0.14 0.27 0.45 0.65 0.80 0.90 0.97
Initial Estimates
OSI 211 dose (mg/m2)
1.2 1.6 2.0 2.4 2.8 3.2 3.8
Carbo Target AUC
4 0.21 0.27 0.35 0.42 0.51 0.59 0.70
5 0.29 0.37 0.47 0.57 0.66 0.74 0.84
OSI 211 dose (mg/m2)
1.2 1.6 2.0 2.4 2.8 3.2 3.8
4 0.025 0.05 0.10 0.19 0.33 0.51 0.76
5 0.29 0.37 0.47 0.57 0.66 0.74 0.84
After first 6 patients
Carbo OSI 211 DLT?
4 1.6 0/3
4 2.0 0/3
After 17 patients
Carbo OSI 211 DLT?
4 1.6 0/3
4 2.0 0/3
4 2.4 2/5
5 1.2 0/1
5 1.6 0/3
5 2.0 2/2
Decreasing Risk of DLT Increasing Risk of DLT
Carboplatin AUC is
expressed in µg/ml × min
Confidence intervals were calculated but are not shown

Proposed Enhancements of 2-Dimensional Phase I Methodology
• Use a scalar rather than a Boolean endpoint (e.g., reduction in neutrophil count rather than MTD)
• Modify for use with Pharmacodynamic endpoints
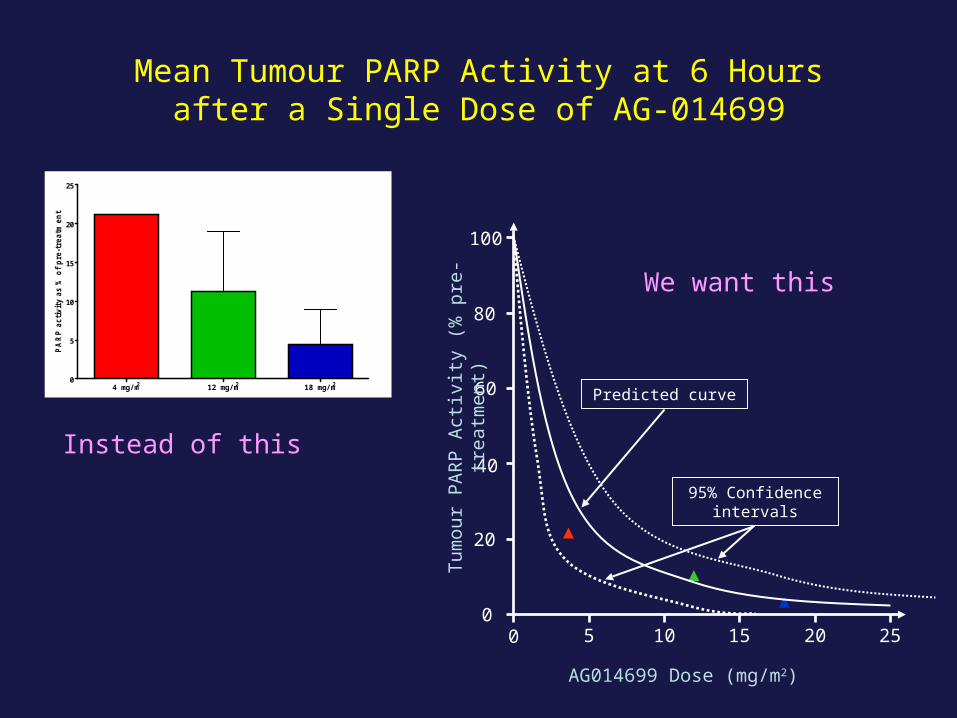
4 mg/m2 12 mg/m2 18 mg/m20
5
10
15
20
25
PA
RP
act
ivit
y as
% o
f p
re-t
reat
men
t
Mean Tumour PARP Activity at 6 Hoursafter a Single Dose of AG-014699
0
20
40
60
80
100
0 5 10 15 20 25
AG014699 Dose (mg/m2)
Tum
ou
r PA
RP A
ctiv
ity (
% p
re-
treatm
ent)
▲
▲▲
Predicted curve
95% Confidence intervals
Instead of this
We want this

Methodology for Phase I and Translational Trials - Needs
• Trial methodology designed for targeted agents in trials with pharmacodynamic endpoints methods that utilise continuously variable (scalar) endpoints rather than yes/no (Boolean) endpoints
• Extension of these techniques to combination Phase I trials– Models to detect trends may be more appropriate than
hypothesis-testing
• We need to use these methods where available and develop new mathematical models where they are not
• Early investment in PD assay development and validation

Agouron/PfizerHeidi SteinfeldtZdenek HostomskyRaz DwejiGerrit LosCancer Research UK
NewcastlePatientsResearch nursesRuth PlummerNicola CurtinHerbie NewellRoger GriffinChris JonesAlan BoddyBarbara DurkaczBernard GoldingPlus the other clinical investigators
Acknowledgements
Recommended