Places to Hide:
Terrain, Ethnicity, and Civil War
David B. Carter, Andrew C. Shaver, and Austin L. Wright
November 13, 2015
Word Count: 9,937
Abstract
Terrain is central to understanding why some countries have contentious ethnic divisions, whileothers do not. We argue that access to variable rugged terrain facilitated the development andsurvival of more distinct ethnic groups, even in the face of government repression. We showthat the persistence of greater ethnic diversity in highly variable rugged areas as well as theseethnic groups tendency to be politically excluded also makes civil war more likely in such areas.In other words, ethnicity mediates some of the effect that terrain has on civil war, a pointoverlooked by most of the literature. Using province-level geo-coded data on civil war, terrainand both the distribution and political status of ethnic groups, we demonstrate that terrain thatis variable and rugged directly and indirectly affects the onset and incidence of civil conflict.A substantively important proportion of terrain’s indirect effects are transmitted through thedistribution and political status of politically relevant ethnic groups. We further explore thehistorical and contemporary relationships between terrain, ethnicity and conflict with numerousexamples and an historical examination of Colombia.
The views expressed in this article are those of the author and do not reflect the official policy or position of the Department of Defense or the U.S. Government.
Introduction
Terrain ruggedness and geographic variation are central to understanding why some countries have
contentious ethnic divisions while others do not. Historically, rugged terrain is associated with
ethnic diversity for two key reasons. Rugged terrain facilitates the formation of distinct ethnic
identities by restricting interaction between the populations in rugged areas and nearby territories.
While many early communities of individuals resided in spatial proximity, their “effective distance”
from one another was significant. Northern Chinese peasants, for instance, “were once effectively
closer to Mongolian pastoralists nearly eight hundred miles to the north than to Chinese cities
scarcely a tenth of that distance to the south: pasture-fed camels could transport grain across
the Mongolian steppes more cheaply than stall-fed oxen could haul it to the city” (Canfield, 1973,
p. 1519). This remains true in the 20th century. For instance, James Scott’s critique of the 9/11
Commission’s conclusion that the terrorist threat emanates from “sanctuaries in the least governed,
most lawless, most remote, vast un-policed regions, in very difficult terrain” correctly points out
that the Commission had “failed to note... that much of the existing population in such areas of
sanctuary were there precisely because these areas had historically been an area of refuge from
state power” (Scott, 2014, p. 127).
Second, rugged terrain also facilitates the persistence of ethnic groups by complicating state
repression. States like Argentina in the 19th century produced conditions of relative ethnic homo-
geneity through the effective assimilation of immigrants from a diverse set of European countries and
the deliberate elimination of the indigenous population. In contrast, ethnic groups like the Quechua
in Peru were resilient despite widespread repression and attempts to assimilate them during state-
building periods. While Argentinian efforts to repress and eliminate indigenous populations in
Patagonia were quite “successful” during General Julio Argentino Roca’s nineteenth century “con-
quest of the desert,” Spanish and later Peruvian efforts to subjugate indigenous groups in Peru
enjoyed limited success as the Quechua (and others) retreated into rugged areas that the central
government struggled to reach (Hasbrouck, 1935; Dodds, 1993). Consequently, although indige-
nous populations in both countries are coded as either “discriminated against” or “powerless” by
Wimmer, Cederman and Min (2009), the largest population in Peru remains the “indigenous high-
1
lands” population, making up about 44% of the Peruvian population after 1946, while indigenous
populations in Argentina make up only around 1% of the population.
We argue and demonstrate that the influence of rugged terrain on ethnic divisions both direct
and indirect effects on a state’s propensity for civil conflict. Existing literature focuses on rugged
terrain’s direct effect in limiting state power, e.g., Collier and Hoeffler (1998, 2004) or Fearon and
Laitin (2003). A wide range of evidence suggests weak states’ inabilities to effectively apply force
across the whole of their territories allow rebel groups to escalate conflicts to civil war. Existing
work makes clear that this dynamic is compounded for weak states when rugged terrain provides
difficult-to-reach safe havens for rebel groups (Fearon and Laitin, 2003; Buhaug and Gates, 2002;
Buhaug, Gates and Lujala, 2009). Despite the impressive body of evidence that rough terrain aids
rebellion and weakens state forces, a key mechanism underpinning this finding remains unexplored:
rugged terrain has historically facilitated ethnic diversity and the maintenance of groups with
contentious relations with the state. Rugged terrain’s indirect effects on civil war help explain why
Peru experienced over 20 years of civil war after 1946 while Argentina had no conflict escalate
to civil war.1 Moreover, to understand the role of terrain in Peru’s civil wars, it is important to
understand not only how the Shining Path used terrain to survive in its fight with the state for so
long but why large numbers of Peruvians live within the country’s rugged areas and have long had
contentious relations with the state.
We assess our ideas with spatial data on terrain ruggedness, the location of politically relevant
ethnic groups and where civil wars have been fought, all measured at the province-level for every
country in the world during the post-Cold War era.2 We demonstrate that terrain ruggedness
has both direct and indirect effects on the risk of civil conflict, even during the post-Cold War
era, a period long past the initial state-building efforts of many states. Specifically, we show that
a significant proportion of the effects of geography are indirectly transmitted through an ethnic
mechanism. The rest of the article proceeds as follows. In the next section of this article, we review
relevant ideas and findings connecting terrain, ethnicity, and civil conflict. We then theorize about
1We use the UCDP/PRIO civil war data for these statistics (Gleditsch et al., 2002; Pettersson and Wallensteen,2015).
2By province, we refer to the every state’s first-level administrative unit, which is sometimes called a province andsometimes has a different term, e.g., a “state” in the United States. Our temporal sample starts in 1989.
2
the complex relationship between these variables. Next, we describe our data and empirical strategy
and assess the empirical implications of our argument through a series of statistical tests. We find
substantively significant and robust support for our central claims, and leverage the relatively
arbitrary location of political boundaries in Africa to conduct a robustness check on our mediation
analysis. To probe our argument in greater detail in an important case, we consider terrain’s effect
in shaping the distribution of ethnic groups in Colombia and trace this development to civil war
outbreak following World War II. Finally, we conclude and provide suggestions for future research.
Terrain, Ethnicity, and Civil War
A large and growing literature debates the causes of civil war. Influential work by Collier and
Hoeffler (1998; 2004) emphasizes economic conditions associated with civil war onset, while Fearon
and Laitin (2003) examine a broad set of political, economic and ethnic explanations. Echoing
Buhaug and Gates’ (2002) study of the political geography of conflict, Fearon and Laitin identify
a large and robust effect of mountainous terrain on conflict onset. Contrary to a large body of
qualitative work on intrastate conflict, however, they find little evidence for a link between ethnic
fractionalization and civil war onset.3 The latter finding surprised many scholars in part because
history is littered with examples of violence amongst distinct ethnic groups (Dyrstad, Ellingsen
and Rød, 2015). In his seminal treatment, Horowitz (1985, p. 3) notes that recent examples alone
include “recurrent hostilities in Northern Ireland, Chad, and Lebanon”; secessionist conflict in
“Burma, Bangladesh, the Sudan, Nigeria, Iraq, and the Philippines”; “Sikh[,] Basque[,] Corsican[,]
[and] Palestinian terrorism”; and “ethnic riots in India, Sri Lanka, Malayasia, Zaire, Guyana, and
a score of other countries.”
Recent work on ethnicity and civil conflict suggests that null findings are the result of poor con-
ceptualization of when and why ethnicity matters in civil conflict. Cederman, Wimmer and Min
(2010) point out that the widely used ethnic fractionalization measure does not indicate whether
politically relevant ethnic groups have grievances with the state. Accordingly, more recent work
3See Sambanis (2001) for a prominent study that does find a linkage. He shows that ethnic heterogeneity influencesethnic civil war, but not other types of civil war, a finding that Fearon and Laitin (2003) do not replicate. See alsoCunningham and Weidmann (2010); Lilja and Hultman (2011).
3
considers whether relevant ethnic groups are excluded from power, underrepresented, or subject to
relative political and economic inequalities and finds that such group-specific measures are impor-
tant to civil war (Cederman, Wimmer and Min, 2010; Cederman, Gleditsch and Buhaug, 2013).
Cederman, Gleditsch and Buhaug (2013) also argue that using the country as the unit of analysis
is particularly problematic, as aggregation issues (amongst others) obscure theoretically key rela-
tionships between ethnic groups and the state. We propose a relatively unexplored mechanism by
which ethnicity influences civil conflict by specifying how terrain features historically shaped the
distribution of both ethnic diversity and more specifically the distribution of ethnic groups that
have contentious relations with the state.4
Why More Difficult Terrain is Not Always Better
The importance of terrain to civil conflict is widely recognized. Difficult terrain provides protection
for less powerful guerilla forces. Weak and outmatched, insurgents can base themselves in rugged
terrain, where incursions by state forces are often limited by poorly serviced infrastructure. A num-
ber of studies show that rebel groups strategically select where to fight, preferring locations distant
from the centers of state power, often exploiting natural terrain characteristics. In their seminal
treatment of this topic, Fearon and Laitin (2003) focus on how mountainous terrain impedes the
application of state power, providing conditions conducive to relatively weak insurgents. Consistent
with the importance of terrain, Buhaug and Gates (2002) find that rebels fight in areas with the
greatest absolute distance from government strongholds.5 Buhaug, Gates and Lujala (2009) clarify
that rebels also use rough terrain and inaccessible regions to stave off attacks from stronger state
opponents.
Yet, we argue that there are clear limits to the benefits of rough terrain. While rough terrain’s
benefits are intuitive, it is not obvious that “rougher” or “more rugged” terrain is consistently
better for rebels. For instance, there is evidence that rebel groups thrive in areas where they enjoy
support among the local populace. Kalyvas (2006) shows that cooperation with rebels among
4Cederman (2004) also argues that terrain affects ethnic identity and the state’s ability to repress, although hisargument differs from ours in several respects and he focuses on a theoretical computational model rather thanempirical analysis.
5For a related critique of concept measurement, see Buhaug and Lujala (2005).
4
the population helps groups maintain their organization and avoid state forces. Areas with co-
ethnics are important in this regard, as groups often have a comparative advantage in monitoring
co-ethnics, and co-ethnics often share similar grievances (Kalyvas and Kocher, 2007; Lyall, 2010).
Thus, groups do not simply flee to the most rugged areas to fight the state; rather, they fight from
areas where they enjoy networks of support among the local population.
Maximally rugged areas are also not likely to be habitable in the long-term for even modestly
sized populations. The most highly and uniformly rugged areas are often not suitable long-term
bases for rebel groups. While the degree of protection from state power may increase in the difficulty
of the terrain, such areas are also both less well-suited for long-term settlement and as a staging
grounds for militant operations. If a rebel group is to base its operations in an area and successfully
take on the state, it must be able to the following. First, to successfully carry out attacks on the
state, the group needs to be able to reach state forces or strongholds. Maximally rugged areas
might be maximally effective at blocking state attacks, but they are also likely to impede the
group’s ability to target state forces or strongholds. Second, the group must be able to supply itself
with weapons, equipment, and basic provisions like food. While states typically have access to
reliable revenue sources like taxes, groups have to control areas with supportive population, which
often involves co-ethnics.6 Uniformly rugged areas are difficult to supply and often not hospitable
to a large enough populations that can serve as a base of support and source of resources for rebel
groups.
Instead, areas with significant variation in terrain ruggedness are more hospitable in the long-
term to rebel groups. Regions with high variability in terrain ruggedness offer both refuge from
state attack as well as less rugged areas more amenable to long-term settlement. The Cuzco
province in Peru, for instance, contains both highly rugged mountainous terrain and the fertile
Sacred Valley, which has been the breadbasket of the region for centuries. The terrain of Cuzco
allowed the Quechua to produce a food surplus while simultaneously providing sanctuary from
Spanish incursions. The areas in Afghanistan where the Taliban has had the most success also
illustrate this point. That organization benefits the most from rugged terrain that is proximate to
6There is only limited evidence that outside support from states is all that helpful to groups (Asal and Rethemeyer,2008; Carter, 2012; Phillips, 2014).
5
population centers, which are typically situated in relatively less rugged areas. In such zones of
high terrain variance, the Taliban enjoys both the protection of mountainous terrain and proximity
to targets. Were the Taliban to position itself deep within the Hindu Kush for the long-term, it
would likely incur significant costs associated with sourcing supplies and traversing vast distances
to launch attacks. These arguments suggest that a measure of the variation in rugged terrain in
a sub-state area is a better measure of whether it is likely to serve as a long-term home to ethnic
groups with historically hostile relations with the state.
The Origins of Ethnic Diversity
While the linkages between ethnic heterogeneity and armed conflict are contested, the origins of
ethnic diversity have received much less attention. Yet, a set of qualitative work across disciplines
and recent work in development economics suggest that geography is essential to understanding
the emergence and persistence of ethnic and ethnolinguistic diversity. This work suggests that
terrain ruggedness plays an important role in both the development and survival of ethnic groups.
Following this work, we tie the origins of ethnic diversity to ethnic grievances and civil conflict.
Ethnic diversity’s association with rugged terrain is noted by historians, anthropologists, and
geographers. Many of the world’s remaining indigenous populations reside within the rugged pe-
riphery of their states. The central Andean highlands, for instance, are highly rugged and have
long been home to one of the largest “indigenous” populations in the Western hemisphere. Gelles
(2000, p. 1) describes the difficult terrain in this region, noting that its inhabitants
“live at over 10,000 feet above sea level, in thousands of hamlets, towns, and cities
spread over a rugged and vertical terrain. Found in warm fertile valleys, on steep
mountainsides, and on frigid high plains, indigenous peasant communities control vast
territories in the highlands of Ecuador, Peru, and Bolivia.”
Rugged areas host a plurality or majority of many countries’ ethnic groups. Vietnam’s northern
highlands, for instance, comprise only eleven of the country’s 58 provinces; yet, “31 of the officially
recognized 54 ethnic groups of Vietnam live in [that] area, speaking languages that belong to seven
distinct linguistic groups...” (Michaud, Turner and Roche, 2002, p. 306). In Nigeria, a similar
6
pattern is apparent. The country’s central highlands, which has as its apex the Jos plauteau, are
home to the most complex cluster of the country’s 250 or so ethnic groups. Gandonu (1978) notes
that “[t]he nature of the rugged topography combines with the history of interethnic conflicts which
deprived the groups of less difficult land areas earlier on, to produce the observed conglomerate of
diverse ethnic groups in this region...” (Gandonu, 1978, p. 257).
The blessings of variable and rugged terrain for ethnic diversity operate through two key, non-
exclusive, channels. First, rugged terrain has historically fostered ethnic and linguistic diversity by
reducing interactions among the communities living in rugged and difficult to traverse areas. In
many rugged areas, communities of individuals in close spatial proximity were nonetheless isolated
by the effective distance imposed by local terrain. Effective distance can produce greater ethnic
diversity than areas of comparable size but without such inhibiting terrain. As Fagan (1999)
explains, rough topography reduces communal mobility and contact across groups, which leads
to cultural drift. Consistent with this claim, Michalopoulos (2012, 1509) finds that areas of the
world with greater heterogeneity in land quality and more difficult terrain tend to have greater
ethnolinguistic diversity relative to other areas. The highly rugged terrain of the modern day
Mexican state Oaxaca, for instance, kept the Zapotec peoples isolated from one another and is
presumed to have “contributed to the development of... [the] remarkable linguistic diversity” of
that area (Yannakakis, 2008, p. 21). Moreover, once established, distinct ethnic identities are likely
to persist so long as the costs associated with transiting such effective distance remain high. Thus,
we expect that areas with greater variability in terrain ruggedness have a greater number of ethnic
groups.
The second way in which terrain affects ethnic diversity is by providing refuge to groups from
hostile powerful actors. Ethnic groups that the state or other powerful actors would otherwise have
eliminated with force are simply too difficult to reach. Groups can end up in areas with highly
variable rugged terrain because they fled to these areas, or they can have always been housed
in rugged areas (Nunn and Puga, 2012).7 A key implication is that areas with highly variable
7In a study of the slave trade in Africa, Nunn and Puga (2012) show that rugged terrain provided protection tomany ethnic groups, effectively insulating the most rugged regions of the continent from extensive slave trade activityand contributing to greater ethnic diversity.
7
rugged terrain will tend not only to contain greater ethnic diversity but to host groups that have
contentious relations with the dominant groups that control the state. Writing about the Middle
East, Canfield (1973, p. 1511) observes that “dominant sects... are found in the central places,
usually lowlands, while diverse ‘heretical’ groups. . . occupy marginal territories such as mountains,
deserts, and marshes.” The idea that highly variable rugged terrain contributes to ethnic diversity
by preventing hostile and more powerful groups, often in control of the state, from forceful repression
of groups housed in these areas suggests that areas with greater variability in terrain ruggedness
have a greater number of politically excluded ethnic groups.
These two processes by which rugged variable terrain hosts greater ethnic diversity are not
mutually exclusive. Rather, both may work in tandem to produce both greater ethnic diversity
and a greater number of politically excluded or targeted ethnic groups. For example, the Liangshan
region of southern China, which is described by its “rugged, often vertical topography sandwiched
between the high plateaus of Tibet to the west and the gentle hills of fertile plains of central China
to the east and northeast,” is home to a variety of distinct ethnic groups (Harrell, 1995, p. 97).
This area is home to ethnic groups that lived in the region prior to it being under either Tibetan
or Chinese influence and power, e.g., Quangic-speaking groups formerly known as Xifan, as well as
groups that fled there to take refuge from fighting, e.g., Yi-speaking groups from the neighboring
regions of Yunnan and Guizhou (Harrell, 1995).
How Ethnicity Mediates the Effect of Terrain Ruggedness
Areas with highly variable rugged terrain should house both more distinct ethnic groups and a
higher number of politically marginalized groups that have contentious relations with the state.
If so, the implications for civil conflict are clear. Existing literature focuses on the direct effect
of terrain on civil conflict – rugged terrain is associated with civil war because it is conducive to
relatively weak rebel groups’ abilities to fend off and combat the state. Although we take issue
with the common conceptualization of what kind of rugged terrain is most conducive to long-term
rebel resistance in the face of state power, we agree that terrain directly affects conflict.8 However,
8Recall our argument that highly variable rugged terrain is more conducive to rebel groups than uniformly ruggedor mountainous terrain.
8
existing work largely overlooks an important indirect effect of highly variable rugged terrain on
civil wars.
The indirect effect of highly variable rugged terrain on civil war operates through terrain’s
historical influence on the geographic distribution of ethnic groups. Evidence that areas of highly
variable terrain tend to host more politically marginalized ethnic groups suggests that such groups
have more historical and contemporary grievances with the state. These grievances increase civil
conflict likelihood in their home areas for three main reasons. First, rebel groups are relatively likely
to emerge in areas with politically marginalized ethnic groups (Cederman, Gleditsch and Buhaug,
2013). Second and relatedly, rebel groups fighting the state are relatively likely to find a hospitable
population in areas where ethnic groups have long been marginalized. Support from the local
population is essential, as this provides access to resources and provides important informational
advantages relative to the state (Kalyvas, 2006; Kalyvas and Kocher, 2007).
Finally, technological innovations of the last century have increased states’ efforts and ability
to extend control over their territories while increasing interactions amongst ethnic groups, in-
tensifying frictions in historically difficult-to-rule areas. Ethnic groups in areas of highly variable
rugged terrain historically experienced limited interaction amongst themselves and with the state.
Although fighting amongst ethnic groups within rugged spaces is a well documented historical phe-
nomenon (Scott, 2014), recent changes brought about by technological innovation – the paving
of roads, introduction of vehicles and aircraft, and the spread of information and communication
devices, for instance – have increased interactions both amongst groups and between these groups
and the state. This dynamic contributes to an increased risk of ethnic group rivalries and more
interactions, often conflictual, between these groups and the central government.
All three routes by which areas of highly variable rugged terrain are likely to experience civil
conflict derive from the historical processes by which politically marginalized ethnic groups came
to inhabit this rugged terrain. Evidence that variation in terrain ruggedness has an indirect effect
on civil conflict mediated by greater density of politically excluded ethnic groups implies that a
proportion of the effect of highly variable rugged terrain on conflict is channeled through terrain’s
early influences on settlement patterns of ethnic groups.
9
Data
We use subnational data on ethnic groups, variation in terrain ruggedness, and civil war to assess
our ideas. The data is measured at the province level for every country in the world from 1989
to 2008. Province-level measurement of ethnic groups, terrain ruggedness, and civil war eliminates
several ambiguities that would arise through the use of country-level data. Specifically, province-
level data allows us to more precisely identify spatial connections between the distribution of ethnic
groups, highly variable rugged terrain, and civil conflict. It is possible for a country to have a high
aggregate level of variation in terrain ruggedness and a large number of distinct ethnic groups but
for these groups to not be based in the most variable and rugged areas. Similarly, conflict might
erupt far from rugged areas of a country.
We analyze two dependent variables: the first measures the number of distinct ethnic groups
and their degree of exclusion; the other measures the incidence and volume of civil conflict in a given
province. To measure the former we use the geo-referenced version of the ethnic power relations
(EPR) data constructed by Wucherpfennig et al. (2011). We construct several variables using
the EPR data, with the baseline measure being the total number of ethnic groups, all measured
at the province-level. A key advantage of the EPR data is that it focuses on politically relevant
groups (Cederman, Min and Wimmer, 2009).9 Our theory identifies groups that are both significant
enough historically to have clashed with more dominant groups and the central government and our
interest is in groups that are important enough to plausibly fight the state. We use this measure
of the number of politically relevant ethnic groups to assess our argument that areas with high
variance in ruggedness have more ethnic groups.
Our argument that the persistence of ethnic groups is related to their ability to historically avoid
state repression implies that the ethnic groups nested in rugged areas will likely have contentious
relations to the state. We assess this expectation with three related measures. First, we measure
the number of ethnic groups in each province that are excluded from political power in the state in
9Groups are considered politically relevant “if at least one significant political actor claims to represent the interestsof that group in the national political arena, or if members of an ethnic category are systematically and intentionallydiscriminated against in the domain of public politics. By significant political actor we mean a political organization(not necessarily a party) that is active in the national political arena” (Cederman, Min and Wimmer, 2009).
10
a given year. While this measure is straightforward, it is possible that it simply proxies for number
of total ethnic groups, excluded or not. That is, the percentage of all politically excluded relevant
groups may be relatively constant across provinces. Our second measure aids us in ruling out this
possibility by identifying the percentage of all politically relevant ethnic groups that are excluded
from power in a given year. Finally, we produce a binary measure of whether an additional group
is excluded from political power in year t relative to year t−1. Collectively, these measures identify
whether provinces with relatively variable rugged terrain are more likely to host politically excluded
ethnic groups.
We measure the incidence of civil conflict in a given province using the UCDP/PRIO geo-
referenced data. Sub-state violence in a province is measured as having reached the level of civil
war if the violence results in at least 25 battlefield deaths in a given year. We consider a province
as experiencing civil war in a given year when it falls within a sub-state conflict circle constructed
by Hallberg (2012).10
We use newly constructed data on terrain ruggedness to measure how rugged and varied terrain
is in a given province. The measure of terrain ruggedness is obtained by first dividing the globe into
identical one kilometer by one kilometer (1 km x 1 km) grid-squares and then measure absolute
elevation change between each grid-square and all contiguous grid-squares. This approach is used
to create a terrain ruggedness index, calculated by taking the sum of all squared differences between
a given grid-square and all contiguous grid-squares.11 Given a ruggedness measure for each small
grid-square in a province, we then aggregate up to the level of province to generate two variables:
mean ruggedness and variance in ruggedness. We expect variance in ruggedness to be associated
with more ethnic groups and for those ethnic groups to have contentious relations with the state.
We also include a number of potential confounders in our specification of the distribution of
ethnic groups and the incidence of civil war. To account for geographic factors likely important
to the persistence of ethnic groups and the potential for civil war, we include average distance
10Because these conflict circles are sometimes large enough that they include areas that did not experience sub-stateviolence, to reduce erroneous classification, we manually correct for all cases in which territories of foreign countriesbordering countries in conflict are assigned a positive conflict value when in fact no battles were fought across theborder.
11The specific calculation is[∑i+1
i−1
∑j+1j−1(Xij −X00)2
]1/2
.
11
to nearest contiguous foreign country from a given province as well as distance to the capital
city (Tollefsen, Strand and Buhaug, 2012). To account for how large each province is within a
given country, we also measure the percentage of the country each province covers (area in square
kilometers).
A growing body of work on civil war shows that civil wars have a significant transnational
component (Salehyan and Gleditsch, 2006; Gleditsch, 2007; Salehyan, 2009). To account for the
possibility of spillover effects, we measure whether a neighboring foreign province is experiencing
civil war. Additionally, we include the logged GDP per capita of each province, as well as the
population density of each province. Both GDP and population are measured at the province level
in 5-year increments from 1989 (Tollefsen, Strand and Buhaug, 2012). We linearly interpolate the
years in between the 5 year measurements.12
To account for country-level effects, we estimate country-fixed effects versions of every model
reported below. Importantly, country-fixed effects ensure that we assess the effect of each regressor
measured at the province-level relative to the country-level mean of that variable. In the models
without country-fixed effects, we account for the regime type of a state by coding whether it is
democracy or not using the Polity IV data. We code a country as a democracy if it has Polity
score of greater than 5 and a non-democracy otherwise. To account for the longevity of a country’s
regime, we also include the regime durability measure from Polity, which indicates how many years
since a country experienced a change of three points in the Polity index. We interact this variable
with our democracy measure, which makes the interaction the effect of durability in a democracy,
and the individual durability measure the effect of durability in a non-democracy. The democracy
variable is interpreted as a new democracy, as a durability of zero years indicates a regime change
in the prior year. We include both current regime type and durability because a country’s history
with democracy or autocracy may influence its historical and contemporary repression of minority
ethnic groups (Davenport, 2007).
12Our key results are not affected if we report the same values for five-year periods.
12
Results
We assess our hypotheses with several complementary empirical strategies. First, we estimate the
effect of terrain ruggedness on the number of distinct ethnic groups that exist in a given province
at the start of our sample. Given that the number of ethnic groups does not vary much within
province after 1989, we estimate purely cross-sectional regression models with the start year of our
sample, 1989.13 These models establish that terrain ruggedness is strongly related to the spatial
distribution of ethnic groups observed globally post-Cold War. Second, we establish that the ethnic
groups present in provinces with rough terrain are especially likely to be excluded from political
power in a given year. The analysis of whether ethnic groups are excluded or not has both cross-
sectional and time-series components, as the political exclusion of ethnic groups varies across time.
This assesses our claim that highly variable rugged areas tend to host groups that are at odds with
the state. Third, we show that both terrain ruggedness and the distribution of ethnic groups are
associated with the incidence of civil war in a given province-year. Finally, we assess the claim that
terrain ruggedness has both a direct and indirect effect on the outbreak of civil war violence. We
introduce causal mediation analysis to the literature on civil war as it is uniquely suited to analysis
of whether the ethnic composition of a province serves as a causal mediator for the effect of terrain
ruggedness on civil war. We provide a difficult test of our argument given that our sample starts
in 1989, decades after the process of state repression produced the relationship between ruggedness
and the distribution of ethnic groups we uncover.
Terrain Ruggedness and the Distribution of Ethnic Groups
Table 1 shows the estimates from different models of the number of ethnic groups at the province
level. Given that the number of ethnic groups is almost always constant within-province after
1989, we focus our estimation on cross-sections of the first sample year.14 We estimate both OLS
and negative binomial regressions for each different specification, and also report results with and
13Inclusion of all province years artificially deflates our standard errors and neither ruggedness nor the number ofethnic groups varies from 1989–2008. The choice of year does not affect results.
14Note that we are careful to not rely on regressions that include potentially endogenous variables such as GDPper capita. However, the results are robust to inclusion of this variable as well as various measures of population.
13
without country fixed effects for each specification.15
Results across ten models support for the idea that geography, and variance in terrain ruggedness
in particular, is associated with the presence of more distinct ethnic groups. Models I–IV include
the variance in ruggedness for a given province and show that it is a significant predictor of the
number of ethnic groups regardless of whether we estimate OLS or a negative binomial count model
or whether we include country fixed effects or not. Models V–VIII show that the mean level of
ruggedness in a province is a less robust predictor of the number of ethnic groups. Thus, it is
variation in ruggedness rather than high mean levels that are associated with more distinct groups.
In models IX and X we include both the mean and variance of ruggedness and find that the variance
retains its large positive significant effect, while the significance of the mean level of ruggedness is
again inconsistent and the sign is negative. This suggests that the long-term survival of groups is
contingent not only on places to hide, but also some variation in terrain.
Other province-level geographic factors also matter. The distance between a province and the
capitol city has a consistent positive effect on the number of ethnic groups. This is also consistent
with the idea that many of these ethnic groups survived in part because it was difficult for the state
to reach them. The finding that smaller distances between a province and the nearest neighboring
state is associated with more groups is similarly consistent. This makes sense given that provinces
close to an international border are often outlying regions.16 Finally, provinces that constitute a
larger percentage of the total area of the state contain more distinct ethnic groups. This is a useful
confounder to control for as it is plausible that more rugged provinces would be less populated and
larger, such that ruggedness might proxy for province-size, which is clearly not true here.
In the models without country-fixed effects we also include variables that measure regime type
and longevity.17 Specifically, we include a measure of whether a country is a democracy, how long a
given regime has been in place, or regime durability, and an interaction between these two variables.
We do not find much support for the significance of any of these variables. We find an inconsistent
15We prefer country-fixed effects to random effects, as we are skeptical of the assumption that the country-effectsare uncorrelated with omitted variables. Nonetheless, in any of the fixed effects models reported below, the keyresults also hold if we estimate random effects instead.
16The correlation between the distance from the capitol and the distance from the nearest neighboring state is 0.38.17We do not include these regime type variables in the fixed effects regressions as they do not vary across provinces
and are thus subsumed by the fixed effects.
14
and negative effect for democracy in the two negative binomial models with no fixed effects, which
suggests that provinces in new democracies have fewer ethnic groups. However, this result is not
robust to the OLS specification.
Are Groups in Rugged Provinces Systematically Excluded?
The results in table 1 demonstrate that provinces with rugged and variable terrain are home to more
distinct ethnic groups. We now explore whether these groups are more likely to have contentious
relations with the state. Table 2 displays the results of four different estimated models of political
exclusion. In models I and II, we analyze the number of excluded ethnic groups in a given province
using OLS and negative binomial regression, respectively, while model III analyzes the percent of
all ethnic groups in a province that are excluded with OLS. The dependent variable in model IV
is a binary measure of whether an additional group was excluded from the prior year, t− 1, to the
current year, t. A key difference between the models of exclusion in table 2 and the models of the
number of ethnic groups in table 1 is that we include all country-province years in the exclusion
models. All three measures of political exclusion vary across time, as groups are excluded and
brought back into the regime fold as a function of elections or changes in coalitions. All models
include country-fixed effects, which ensure that we identify the variables relative to their within-
country mean. Fixed effects also account for any country-level attributes that increase or decrease
levels of political exclusion.
All four models provide considerable support for the idea that areas with high variance in
rugged terrain have more politically excluded groups. The coefficient for variance in ruggedness
is positive and significant across all four models, which constitute three different specifications of
the dependent variable. Thus, as a province’s variability in ruggedness increases above the level
of the average province in the country, it has more excluded groups, a higher percentage of all
politically relevant groups that are excluded, and a higher probability of experiencing an increase
in exclusion among its ethnic groups each year. This finding is especially notable given that mean
ruggedness and all but one of the three other geographic variables perform inconsistently. While
mean ruggedness has a modest statistically significant effect on the number of excluded groups, it
15
has no significant effect on either the percent of excluded groups or whether there is an increase in
exclusion from the prior year. Moreover, the substantive effect of variance in ruggedness is always
much greater than for mean ruggedness. Provinces that are more distant from the capitol have a
higher number of excluded groups, which is also true of provinces closer to the nearest international
border. However, neither of these variables has significant effect on either the proportion of total
ethnic groups in a province that are excluded or the probability that an additional group will be
excluded in a given year. The size of a province in terms of area is a positive and significant predictor
across the three different measures of political exclusion. Thus, as provinces constitute a greater
proportion of the overall area of the state, they have more excluded groups, a higher proportion of
all their groups are excluded, and the probability of an increase in exclusion is significantly higher.
The results for our regime type variables are somewhat mixed. We find that provinces in new
democracies host fewer excluded groups and have a lower probability of an additional group being
excluded, but find no relation to the percent of excluded groups. Non-democracies that have been
in place for longer, i.e., the regime durability variable, have more excluded groups and a higher
percentage of groups excluded. However, there is no relation to the probability a new group is
excluded in a given year. In contrast, the number of years a country has been a democracy, i.e.,
Democracy*Durability, is significantly and positively related to the probability an additional group
will be excluded in a given year. However, this variable is insignificant in models I–III.
We also include a measure of the logged GDP per capita of a given province in models I–IV. We
did not include this variable in the specifications of the number of groups, as we expect development
to be endogenous to ethnic diversity (Nunn and Puga, 2012). However, we did include it in our
models of exclusion, as the wealth of a province is quite plausibly related to whether its ethnic
groups are excluded from power or not. Indeed, we find a consistent positive effect across all four
models: higher levels of per capita wealth are associated with higher levels of exclusion. There are
still possible endogeneity concerns with GDP per capita, however. We, therefore, also estimate all
four models without this variable and find very similar results.
16
Civil War
Table 3 contains three models of civil war onset and incidence, respectively. The difference among
them is that models I and II include a measure of the total number of ethnic groups, models III
and IV contain a measure of the number of excluded ethnic groups, while models V and VI include
the percentage of all ethnic groups excluded. All measures are again at the province-year level and
all models include country fixed effects. All regressors are lagged one year to account for the fact
that their effect on civil war likely takes some time, although none of the key results are affected
by this choice.
The estimates reveal several important findings. First, the variance in ruggedness is significant
and positive predictor of both onset and incidence across all models. Thus, in countries that
experience civil war, it is indeed the provinces with relatively rugged but variable terrain that are
at higher risk of violence. However, mean ruggedness is generally not an important predictor of
civil war. Second, note that the total number of ethnic groups and the total number of excluded
groups are consistent predictors of civil war.18 This finding in tandem with those above suggest that
the long-term presence of ethnic groups in rugged provinces is associated not only with political
exclusion, but with significant levels of violence. The other variables generally have signs consistent
with existing literature, although several are sporadically significant. We do not discuss these
variables in the interest of focusing more on our new evidence over how ethnicity mediates the
effect of terrain on civil war.
Causal Mediation Analysis
We estimate the direct causal effect and and indirect causal mediation effect of variability in terrain
ruggedness using the formal causal mediation analysis methods developed by Imai, Keele and
Tingley (2010) and Imai et al. (2011). Causal mediation analysis is a powerful tool that allows us
to decompose the total effect of variability in terrain ruggedness into its direct effect on civil war
and its indirect effect on civil war via the presence of more ethnic groups and their exclusion. This
18Comparison of the coefficient size of the three ethnicity variables is not informative as the regressions are logitand the three variables have quite different magnitudes.
17
is important as we argue that the connection between civil war and rugged terrain is mediated by
the presence of ethnic groups that would likely not exist without access to such terrain.
Mediation analysis uses the potential outcomes framework, which is common in the causal
inference literature. We follow Imai et al. (2011) in our treatment here. The idea is straightforward:
consider our unit of analysis, a province, our treatment, highly variable rugged terrain, and our
outcome of interest, civil war. Given that our treatment is continuous, we must specify a range
of values that constitute a province getting the treatment, Ti = 1, versus the control, Ti = 0. We
use values of variability in terrain ruggedness that are above the 95th percentile to indicate the
treatment group.19 Our outcome variable, Yi is also continuous, as it indicates how many years after
1989 a province experienced civil war.20 The notation Yi indicates a potential civil war outcome
for each province i, where we can write Yi = Yi(Ti) to indicate a province’s outcome as a function
of its treatment status. Given this exposition, we can define the causal effect of our treatment for
province i as Yi(Ti = 1)−Yi(Ti = 0), where write the treatment notation as binary to simplify. We
focus on the average treatment effect (ATE) over all provinces in our sample.
We argue that variability in terrain ruggedness, Ti, affects civil war outcomes, Yi(Ti), directly
and indirectly. The indirect effect is transmitted via a causal mechanism, Mi(Ti), which we specify
as either the number of ethnic groups in a province or the number of ethnic groups in a province
that are excluded at some point. Thus, we can write civil war outcomes as Yi(Ti,Mi(Ti)) to
indicate the fact that the treatment and mediator both have an effect. Notice that the number
of ethnic groups, Mi(Ti) is also a function of the variability in terrain ruggedness, our treatment
Ti. The total effect of rugged terrain (our treatment) for a given province can now be expressed
as τi = Yi(1,Mi(1)) − (0,Mi(0)). The causal mediation effects, δi(t) are obtained by holding the
treatment, Ti = t constant:
δi = Yi(t,Mi(1)) − (t,Mi(0))
In this paper, we identify δi by having provinces that have the same treatment status, t, but
different numbers of ethnic groups, which is our mediator variable. All other causal mechanisms
19The results are not sensitive to using lower thresholds such as the 90th or 75th, or a binary treatment.20See below for a justification of this approach.
18
by which terrain ruggedness affects civil war are identified through the direct effect:
ψi = Yi(1,Mi(t)) − (0,Mi(t)).
We identify ψi with provinces that have different levels of terrain ruggedness, but share similar
numbers of ethnic groups. As is implied by the prior discussion, we focus on average causal
mediation effects (ACME) and average direct effects (ADE) across the population of provinces
here.
To identify ACME and ADE, we need to specify a set of regressors, Xi, which can be considered
“pre-treatment” confounders for each province, and satisfy the assumption of sequential ignorability.
There are two assumptions that we need to make to satisfy sequential ignorability. First, we need
to assume that the assignment of the treatment is random, or exogenous. Relative to typical
observational studies, this assumption seems relatively unproblematic here, as terrain ruggedness is
exogenous to outcomes of interest such as civil war and variables of interest such as the distribution
of ethnic groups. In other words, it is nonsensical to think that political variables affect ruggedness,
or even that omitted variables in a model specification for Yi or Mi are endogenous to terrain. The
second part of the sequential ignorability assumption states that the number of ethnic groups is
exogenous given the observed value of terrain ruggedness and pre-treatment covariates. We focus
on geographic variables and indicators of region and country as our covariates, as they are more
plausible pre-treatment confounders than indicators such as democracy or GDP per capita.21 This
is obviously the harder part of sequential ignorability here, and we address it below with robustness
checks.
Does Ethnic Diversity Mediate Terrain Ruggedness?
Tables 4 and 5 contain the results of our causal mediation analysis for all provinces globally.
Specifically, table 4 shows the specification of our mediator and outcome equations. To be careful
about identification, we focus our analysis cross-sectionally similar to table 1. We measure the
number of ethnic groups in a given province in the first year of our sample, 1989. We do this because
21That being said, we can include a host of political variables as confounders and the results do not change.However, we doubt the validity of these specifications and thus do not report them here.
19
variance in terrain ruggedness is fixed across time and because the number of ethnic groups in a
province does not really vary across time during our sample. Thus, it makes sense to explore how
the number of groups that we observe in 1989 is a function of terrain, and potential confounders.
We measure the number of ethnic groups that were excluded after 1989 by counting all groups that
were excluded at some point through 2008. In contrast to the mediator and treatment variables,
the outcome variable, civil war, does vary across time. Thus, focusing on a single year, such as
1989, for the civil war equation would lead us to lose information about whether each province
experienced civil war from 1990–2008. To sidestep this issue, we analyze the number of years in the
sample that a given province experienced civil war. Thus, if Yi = 5 for province i, this indicates
that this province experienced civil war for 5 years from 1989 to 2008, and did not experience civil
war for the other 15 years. It is of course possible to include all province-years; however, doing so
would add no statistical information to our mediator equation, artificially lowering our standard
errors.
For the global analysis in tables 4 and 5, we report two different specifications for each of our
two measures of ethnicity, which results in four mediation models. First, we include only regional
fixed effects as pre-treatment confounders, where we measure 26 different geographic regions.22
This approach seems quite sensible given the assumptions, as all of our country-provinces are in
one of these regions, which had numerous effects on its political history. That being said, all of
our results survive inclusion of a variety of factors such as regime type and per capita wealth even
though these variables are not veru plausibly exogenous to the number of ethnic groups conditional
on treatment. In the second specification, we include country-level fixed effects as pre-treatment
confounders. While country-fixed effects are more spatially precise, we are less confident that the
exact character of many states in the post-Cold War era is exogenous to terrain. For this same
reason, we exclude the three state-specific geographic variables included in tables 1–3. However,
the key results are not much different in the country fixed effects specification.
The results suggest that the number of ethnic groups does in fact mediate the effect of variability
22The regions are: Asiatic Russia, Antarctica, Australia/New Zealand, Caribbean, Central America, Central Asia,Eastern Africa, Eastern Asia, Eastern Europe, European Russia, Melanesia, Micronesia, Middle Africa, NorthernAfrica, Northern America, Northern Europe, Polynesia, South America, Southeastern Asia, Southern Africa, SouthernAsia, Southern Europe, Western Africa, Western Asia, and Western Europe.
20
in terrain ruggedness. First, note that table 4 shows that variance in terrain ruggedness has a
significant and positive effect on the number of ethnic groups in a province, excluded or otherwise,
which is unsurprising given the results of table 1. Second, both terrain ruggedness and the number
of ethnic groups or the number of excluded groups exert a significant and positive effect on the
number of post-Cold War years a province experiences civil war, which is consistent with the results
reported in table 3.
Table 5 reports the actual average causal mediation effect and direct effect for each of the models.
The model with regional fixed effects shows that nearly 14% of the effect of variable rugged terrain
on the incidence of civil war is mediated via the number of ethnic groups. Both the ACME and
the ADE are positive and statistically significant, as their lower 95% confidence intervals are easily
greater than zero. The same is true of the percentage of terrain’s total effect mediated by ethnic
groups. The findings are very similar if we allow the effect of the number of excluded groups to
be mediated by variation in terrain ruggedness, i.e., model III. The country-fixed effects models
produces similar results, although the magnitude of the mediation effects are smaller. In general,
the magnitude of the mediated effect we uncover is quite striking given that the state-building
processes that we describe in the theory section preceded the post-Cold War period by decades or
even longer in many countries. We suspect that if we had similar data for earlier historical periods,
we would estimate even larger effects.
Robustness Check: Leveraging Arbitrary States in Africa
Given our endogeneity concerns about state-specific geographic factors in the global population of
state-provinces, we examine the African case in more detail here. It is widely noted that African
states’ boundaries were “abitrarily” constructed, as over 75% of them simply follow lines of longitude
or latitude (Herbst, 2000). Thus, it is fair to think of African borders as being exogenous to terrain
in a way that European borders are not. Accordingly, a number of scholars have used African
borders to identify “as if” natural experiments, e.g., (Posner, 2004). We exploit the fact that
African borders were arbitrarily drawn with respect to terrain, ethnic groups, and most other
features here as a robustness check on our mediation results. Simply put, sequential ignorability is
21
even more plausible in the African case.
The results in tables 6 and 7 provide further support for the idea that both the number of ethnic
groups and the number of excluded ethnic groups serves as a mediator for terrain ruggedness in
driving civil war. The variance in ruggedness is still a significant positive predictor of: the number
of ethnic groups, the number of excluded ethnic groups, and the frequency of civil war incidence in
the post-Cold War period. Additionally, both the number of ethnic groups and the number of such
groups excluded from power exerts a positive and significant effect on the frequency of civil war
incidence in Africa. Note that we include two of the state-specific geographic variables in addition
to region fixed effects, i.e., model I, and country fixed effects, i.e., model II. The fact that state
boundaries can be treated as exogenous makes us comfortable with the inclusion of a province’s
distance from the capitol and distance from the nearest international border, both of which exert
the effects we would expect given the results in tables 1–3.23
The results in table 7 show significant causal mediation effects in Africa. Both the ACME and
ADE reported in table 7 are positive and significant at the 0.05 level in both the regional fixed effects
and country fixed effects models. Furthermore, the percent of terrain’s total effect that is causally
mediated by either the number of ethnic groups or the number of excluded groups is larger in the
African sample relative to what we found globally. In the regional fixed effects model that focuses
on the number of groups, we find that over 17% of the total effect of terrain on civil war frequency is
mediated by ethnicity, while around 10% of the effect is found to be mediated in the country-fixed
effects model. The fact that the ACME is more substantial in the African case is encouraging,
as state-building periods relevant to the current system of African states are more recent than
regions such as Europe, North America, or even South America, e.g., Argentina’s campaign in the
Pampas in the 1870s. Accordingly, we expect the mediation effect of terrain via ethnicity to be
more pronounced in Africa, which it is. Finally, while we are not comfortable including a battery of
additional political “controls”, such as regime type or per capita wealth because this likely violate
sequential ignorability, doing so again has virtually no effect on the results reported in tables 6 and
7.
23We do not include the size of a province as a percentage of the state, as this is plausibly endogenous to terrain.Its inclusion has no effect on the results.
22
Rough Terrain, Ethnic Diversity, and Conflict in Colombia
Rugged terrain has shaped Colombia’s ethnic diversity by limiting colonial and modern attempts
to uproot groups. The Andean region’s highly variable terrain has also proven advantageous for
rebel mobilization. Early settlers of the Andes split into a number of distinct ethnic groups. The
arrival of Spanish conquistadors in the early sixteenth century threatened the survival of vulnerable
coastal and agrarian tribes. These populations fled to relatively rough areas to avoid incursions by
Jimenez de Quesada, Sebastian de Benalcazar, and Nikolaus Federmann (Francis, 2007). Between
1509 and 1541, Spanish forces massacred, forcibly displaced, or enslaved indigenous populations
throughout the Chibchan plains, in what is now north-central Colombia (Melo, 1996). Highland
populations, shielded by inhospitable terrain, were able to thwart further expansion during the
early colonial period. Over the next four hundred years, autonomous self-defense groups, known
as peasant leagues, emerged in rural, rugged municipalities. Guerrilla leaders from these leagues
that survived the Marquetalia Massacre of 1964 joined ranks as the Revolutionary Armed Forces
of Colombia (FARC).
Our sketch of these historical events underscores three points. First, we illustrate how geography
shaped early settlement patterns. Terrain features influenced how early settlers split into distinct
ethnic groups and, over time, how these groups specialized economically. Second, we demonstrate
how ruggedness influenced where Spanish forces displaced or eliminated indigenous populations.
Those able to survive in rough, mountainous areas were scarred by these colonial atrocities and
remained restive and politically excluded for nearly five centuries. Third, we trace how these forces
shaped the formation of local self-defense groups in the rural, mountainous countryside that fought
a long civil war against the Colombian government. Facing exclusion from a fairly united political
establishment and a militarily stronger Colombian military backed by the United States, guerrilla
leaders were nonetheless able to form one of the world’s most resilient and capable rebel forces, the
FARC.
23
Early Settlement of Colombia
Archaeological evidence reveals that hunter-gathers first occupied the Andean region nearly 12,000
years ago. Bountiful valleys between the region’s myriad waterways and steep mountain ranges
shaped the migration and demographic patterns of these early settlers. Along the Caribbean and
across the Andes Range, two dominant Chibchan kingdoms and a number of smaller ethnic groups
emerged, most sharing common linguistic characteristics. The coastal region of the Pacific, known
as the Upper Choco, is characterized by dense land cover and uneven terrain. In this small but
rugged band of coastline between Cape Corrientes and Buenaventura, 19 distinct ethnic groups
emerged (Williams, 2004). Between 10,000 BCE and 800 AD, the dominant economic orientation
of the indigenous Chibchan populations to the land shifted from hunter-gather to simple farming
(Langebaek, 1995).
When the first European explorers arrived seven centuries later, the agricultural, social, and
political systems of these peoples had advanced significantly (Rivas, 2007). The two dominant
kingdoms divided their economy and populations along the ranges and valleys that shaped their
emergence. Lowlands groups had adopted innovative farming techniques, tailored to the fertile soil.
Precious metal extraction and emerald mining dominated the highland economies. Marketplaces
were common in most population centers and local chiefs collected taxes on agricultural exchanges
(Rivas, 2007). Although wealthy and not without military capability, these kingdoms were ill
equipped for the arrival of European mercenaries in 1509, who brought pestilence and firepower to
the Andes.
Conquest and Colonial Repression
The first explorers to arrive in modern-day Colombia explored the Caribbean and Pacific coastlines
(Campbell, 1762). These Spanish forces raided and pillaged villages near the coast, but their
attempts to advance further inland were hindered by indigenous resistance and geography. First-
hand accounts of their struggles reveal widespread frustration with the region’s dense forests and
substantial rainfall, both of which limited movement.24
24See Williams (2004) for a review of these accounts.
24
Eventually, these explorers abandoned their goal of conquest and returned to Spain. Between
1509 and 1541, a new wave of colonizers focused their efforts on the northern regions, where
the Magdalena River was believed to be the undiscovered passage from the Atlantic to Pacific.
The Spanish empire sought a waterway through the continent to ease transport of Peru’s newly
conquered treasures (Arcinegas, 1942). The interior of New Granada was a mystery, and the
most notable effort to find the source of the Magdalena was abandoned when the expedition first
encountered the Muiscas Kingdom. The explorers, led by de Quesada and aided by advanced
weaponry, raided villages and pillaged tombs for gold and silver (Francis, 2007). After nearly
a year, this expedition returned to Santa Marta with the spoils of war. Meanwhile, two more
expeditions were launched from newly established settlements along the Caribbean and Venezuelan
coasts. Archaeological data and expedition logs from the period suggest that a number of vulnerable
ethnic groups were decimated or altogether eliminated by Spanish explorers (Melo, 1996; Williams,
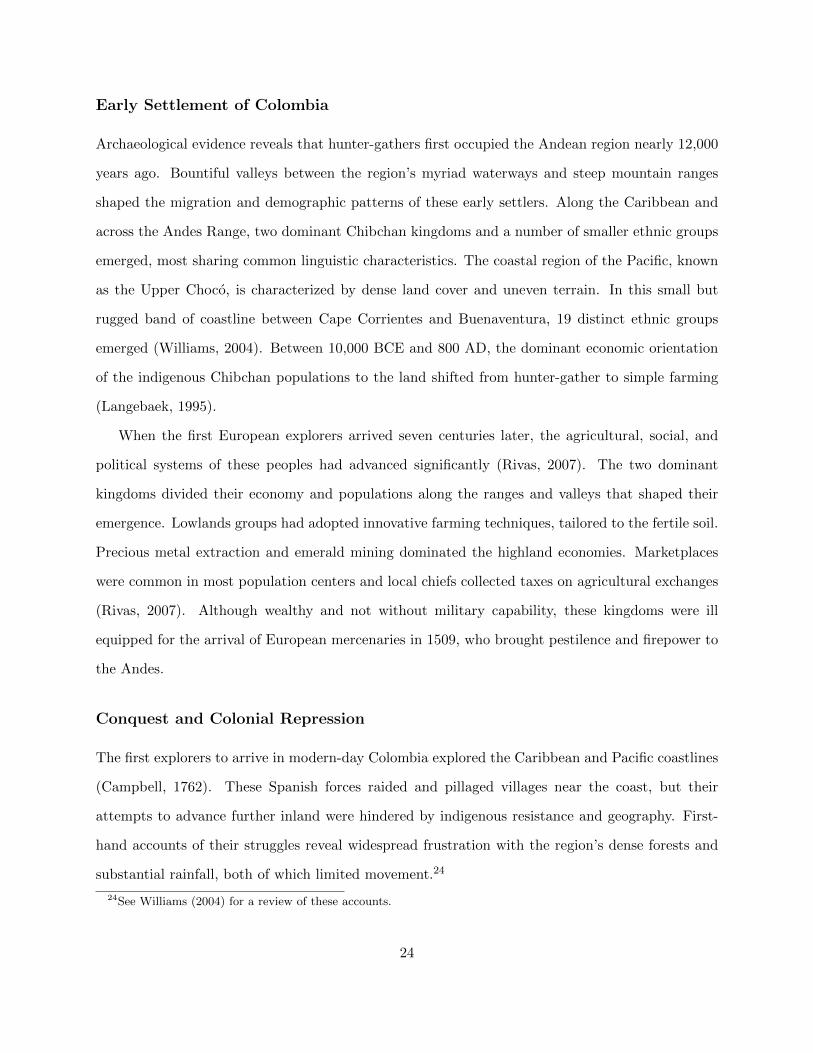
2004). These massacres are mapped in in Figure 1(a). Municipalities where indigenous populations
were displaced are in red. Localities where colonial incursions were blocked appear in blue. There
is a clear connection between variable rough terrain and resistance to Spanish conquest. Notice
that Spanish forces were thwarted in Antioquia, along the Rio Cauca, where geographic relief made
invasions difficult and settlement implausible. Ethnic groups in the Upper Choco also resisted
Spanish repression.
Early massacres were replaced by colonial repression when the Spanish government absorbed the
Andean region as the Commonwealth of New Granada, encompassing parts of modern day Colom-
bia and Venezuela. The lowlands populations were commonly displaced or enslaved, as colonial
administrators sought to extract the agricultural and mineral wealth of the Chibchan Kingdoms.
Indigenous populations survived in rugged areas where Spanish forces found it implausible to es-
tablish political or military control.
Peasant Leagues and Guerrilla Defenses
After less than two centuries, the once-attractive bounty of New Granada gave way to economic
hardship. Revenue from the colony’s agricultural and precious metal exports dwindled and, by
25
(a) Early massacres and rebel organiza-tion, FARC bases in 1964
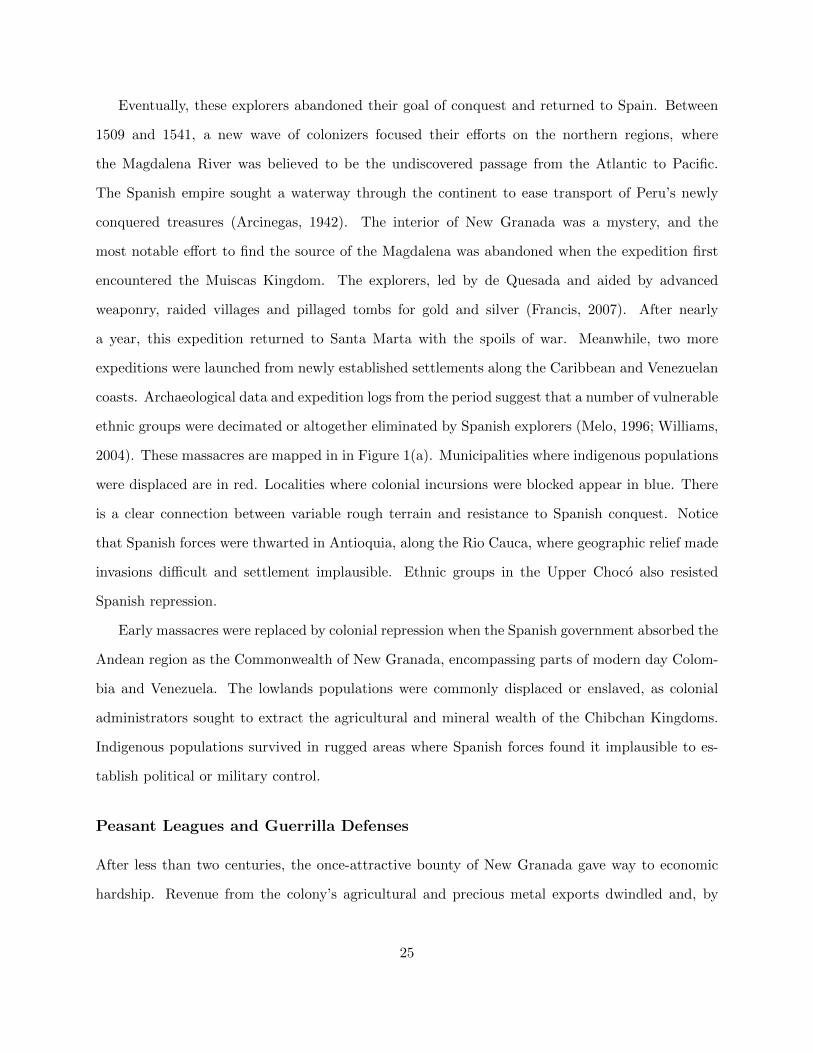
(b) Path dependence in rebel mobiliza-tion, FARC bases in 1995
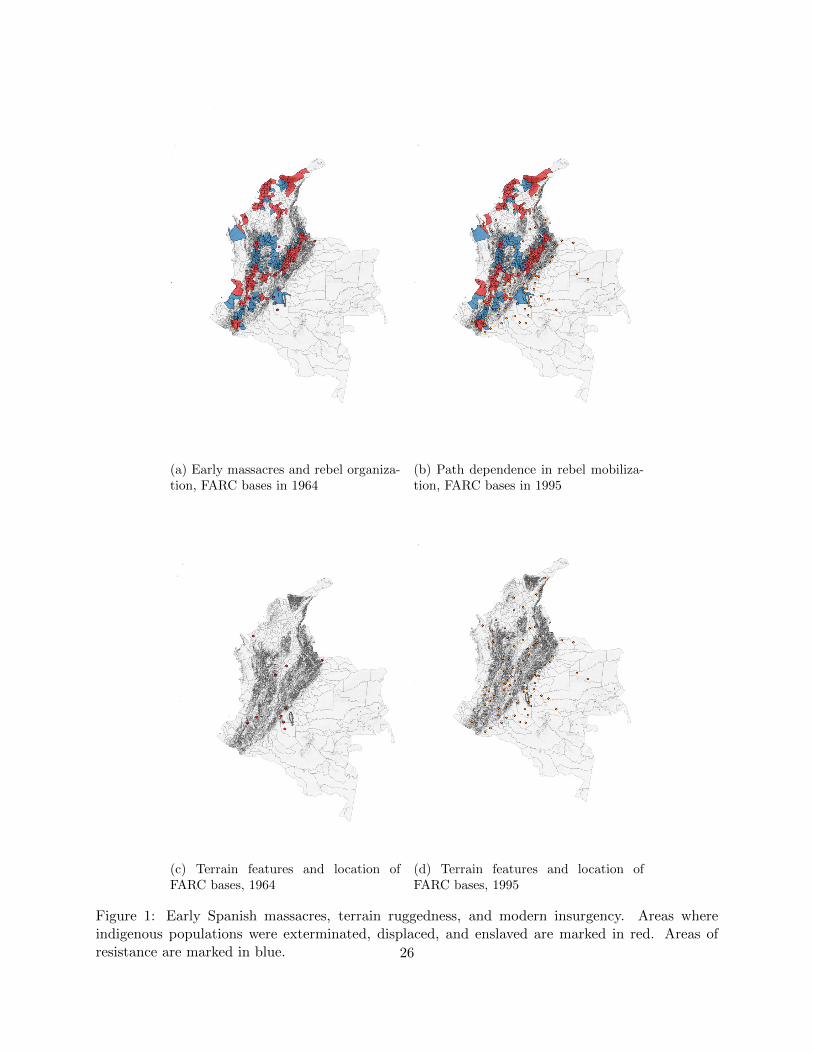
(c) Terrain features and location ofFARC bases, 1964
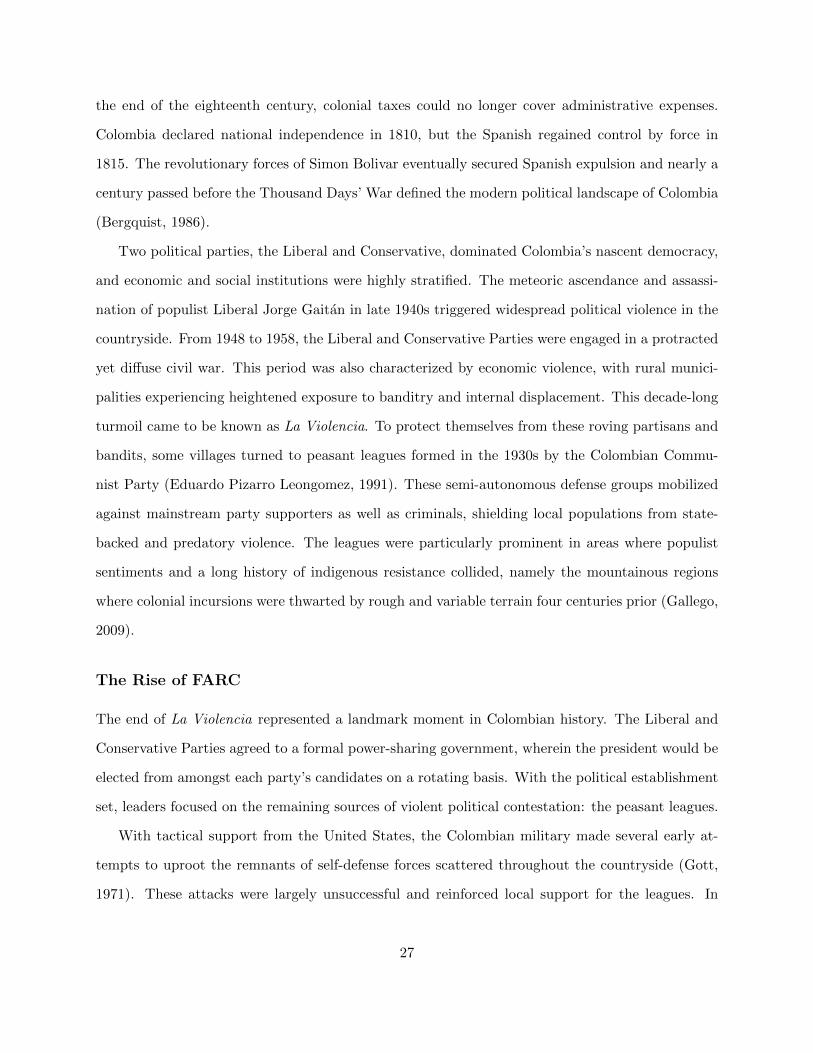
(d) Terrain features and location ofFARC bases, 1995
Figure 1: Early Spanish massacres, terrain ruggedness, and modern insurgency. Areas whereindigenous populations were exterminated, displaced, and enslaved are marked in red. Areas ofresistance are marked in blue. 26
the end of the eighteenth century, colonial taxes could no longer cover administrative expenses.
Colombia declared national independence in 1810, but the Spanish regained control by force in
1815. The revolutionary forces of Simon Bolivar eventually secured Spanish expulsion and nearly a
century passed before the Thousand Days’ War defined the modern political landscape of Colombia
(Bergquist, 1986).
Two political parties, the Liberal and Conservative, dominated Colombia’s nascent democracy,
and economic and social institutions were highly stratified. The meteoric ascendance and assassi-
nation of populist Liberal Jorge Gaitan in late 1940s triggered widespread political violence in the
countryside. From 1948 to 1958, the Liberal and Conservative Parties were engaged in a protracted
yet diffuse civil war. This period was also characterized by economic violence, with rural munici-
palities experiencing heightened exposure to banditry and internal displacement. This decade-long
turmoil came to be known as La Violencia. To protect themselves from these roving partisans and
bandits, some villages turned to peasant leagues formed in the 1930s by the Colombian Commu-
nist Party (Eduardo Pizarro Leongomez, 1991). These semi-autonomous defense groups mobilized
against mainstream party supporters as well as criminals, shielding local populations from state-
backed and predatory violence. The leagues were particularly prominent in areas where populist
sentiments and a long history of indigenous resistance collided, namely the mountainous regions
where colonial incursions were thwarted by rough and variable terrain four centuries prior (Gallego,
2009).
The Rise of FARC
The end of La Violencia represented a landmark moment in Colombian history. The Liberal and
Conservative Parties agreed to a formal power-sharing government, wherein the president would be
elected from amongst each party’s candidates on a rotating basis. With the political establishment
set, leaders focused on the remaining sources of violent political contestation: the peasant leagues.
With tactical support from the United States, the Colombian military made several early at-
tempts to uproot the remnants of self-defense forces scattered throughout the countryside (Gott,
1971). These attacks were largely unsuccessful and reinforced local support for the leagues. In
27
1964, nearly 16,000 Colombian troops massacred inhabitants of Marquetalia, where the most vocal
guerrilla leaders had gathered. Those who survived the assault fled to the mountains. Of the few
who lived, 48 fighters coalesced as the Revolutionary Armed Forces of Colombia (FARC), with the
goal of territorial sovereignty under communist political rule. In Figures 1(a) and 1(c), we plot
the location of the first FARC fronts on maps that show the localities that experienced Spanish
massacres, Figure 1(a), and rough terrain, Figure 1(c). Between 1965, with the First Guerrilla
Conference, and the Seventh Guerrilla Conference in 1982, FARC remained a small rural force
that concentrated operations in areas with uneven rugged terrain, where government interference
was minimal. Beginning in the mid-1980s, FARC adopted urban insurgency tactics, generating
revenue from kidnappings and extortion (Sanchez, Solimano and Formisano, 2005). Although their
tactics changed, Figures 1(b) and 1(d) reveal that the spread of FARC bases continued to reflect
the long-run consequences of settlement and repression, both of which are strongly influenced by
the presence of variable rugged terrain.
Conclusion
Although both terrain and ethnicity feature prominently in civil war research, important historical
and contemporary connections between these two factors have been overlooked. The robust rela-
tionship between terrain and civil conflict consists of two effects. The direct effect of terrain on
rebels’ abilities to withstand counterinsurgent efforts are widely recognized. We show that terrain
also indirectly affects civil conflict through its influence on historical patterns of settlement and
state repression. We argue and provide evidence that understanding the historical role of variable
rugged terrain on the distribution of ethnic groups within states sheds much light on the political
exclusion of ethnic groups. A sizable proportion of the effect of variable rugged terrain on civil
war is mediated by the distribution of ethnic groups, which also tend to be politically excluded.
These findings suggest that a lack of historical context for how terrain shapes the distribution of
ethnic groups and their relationship with the state is one reason why many studies have not found
28
a relationship between ethnicity and civil war.25
This paper makes several key contributions to the civil conflict literature. First, we theorize
over why difficult but variable terrain is associated with more ethnic diversity and larger numbers of
groups that are politically excluded. We identify two primary reasons why variable rugged terrain
hosts more ethnic groups that tend to be excluded: Greater effective distances among groups in
rugged areas limited interactions and stunted assimilation. This same factor prevented repression of
these distinct groups from the state or colonial powers. Second, we provide an explicit link between
this historical process and the contemporary relationships between terrain and civil conflict. Our
empirical tests contain two key innovations. First, we focus on areas within states that have highly
variable and rugged terrain, a more nuanced measure of “rough” terrain that recognizes that groups
must both avoid state repression and sustain a population over the long-term. Uniformly rugged
and mountainous areas, e.g., the Hindu Kush in Afghanistan, may blunt state attacks but are
often poorly suited to sustaining population over the long-term. Second, we introduce mediation
analysis to assess the degree to which terrain’s effect on conflict is mediated by ethnic variables.
The fact that we find important mediation effects despite a focus on the post-Cold War era, a
period long after initial state-building periods for many states, suggests that our estimates are
quite conservative. The statistics clearly indicate broad trends consistent with our arguments.
However, we are careful to supplement all of our key arguments and findings with a number of
important examples across different regions and time-periods, and provide an in-depth treatment
of how terrain shaped identity and resistance in Colombia in ways that continues to inform civil
conflict patterns.
These findings suggest new avenues of research investigating how the complex relationship
between ethnic and geographic factors influence the likelihood of civil violence. We have identified a
promising route for future work: examination of how ethnicity mediates the established relationship
between geography and armed conflict. Although considerable debate still exists over the conditions
under which ethnic diversity increases the likelihood of political violence, our analysis suggests that
the political legacies that bind geography, ethnic diversity and civil conflict together are at once
25See Cederman, Gleditsch and Buhaug (2013) for an excellent treatment that focuses on measurement and theproper unit of analysis.
29
deeply historical and contemporary. For restive minorities and rebels, difficult geography, while
limiting in some ways, is a blessing when it comes to the fundamental objective of survival. For
weak or repressive political leaders, difficult geography may be a curse.
30
References
Arcinegas, German. 1942. The Knight of El Dorado; the tale of Don Gonzalo Jimenez de Quesadaand his conquest of New Granada, now called Colombia. The Viking Press.
Asal, Victor and R. Karl Rethemeyer. 2008. “The nature of the beast: Organizational structuresand the lethality of terrorist attacks.” Journal of Politics 70(2):437–449.
Bergquist, Charles. 1986. Coffee and conflict in Colombia, 1886-1910. Duke University Press.
Buhaug, Halvard and Paivi Lujala. 2005. “Accounting for scale: Measuring geography in quanti-tative studies of civil war.” Political Geography 24:399–418.
Buhaug, Halvard and Scott Gates. 2002. “The geography of civil war.” Journal of Peace Research39:417–433.
Buhaug, Halvard, Scott Gates and Paivi Lujala. 2009. “Geography, Rebel Capability, and theDuration of Civil Conflict.” Journal of Conflict Resolution 53:544–569.
Campbell, John. 1762. An account of the Spanish settlements in America in four parts. Donaldsonand Reid.
Canfield, Robert L. 1973. “The Ecology of Rural Ethnic Groups and the Spatial Dimensions ofPower1.” American Anthropologist 75(5):1511–1528.
Carter, David B. 2012. “A Blessing or a Curse? State Support for Terrorist Groups.” InternationalOrganization 66(1):129–151.
Cederman, Lars-Erik. 2004. “Articulating the Geo-Cultural Logic of Nationalist Insurgency.” Un-published Manuscript, ETH Zurich .URL: http://ecpr.eu/Filestore/PaperProposal/8796b114-de99-4ceb-9bbd-bb27f38b42f4.pdf
Cederman, Lars-Erik, Andreas Wimmer and Brian Min. 2010. “Why Do Ethnic Groups Rebel?New Data and Analysis.” World Politics 62:87–119.
Cederman, Lars-Erik, Brian Min and Andreas Wimmer. 2009. “Ethnic power relations dataset.”May 1:2009.
Cederman, Lars-Erik, Kristian Skrede Gleditsch and Halvard Buhaug. 2013. Inequality, Grievances,and Civil War. Cambridge University Press.
Collier, Paul and Anke Hoeffler. 1998. “On Economic Causes of Civil War.” Oxford EconomicPapers 50:563–573.
Collier, Paul and Anke Hoeffler. 2004. “Greed and grievance in civil war.” Oxford Economic Papers56:563–595.
Cunningham, Kathleen Gallagher and Nils B Weidmann. 2010. “Shared Space: Ethnic Groups,State Accommodation, and Localized Conflict1.” International studies quarterly 54(4):1035–1054.
Davenport, Christian. 2007. State repression and the domestic democratic peace. Cambridge Uni-versity Press.
31
Dodds, Klaus-John. 1993. “Geography, identity and the creation of the Argentine State.” Bulletinof Latin American Research pp. 311–331.
Dyrstad, Karin, Tanja Ellingsen and Jan Ketil Rød. 2015. “Ethnonationalism in post-war Bosnia-Herzegovina and Kosovo The effects of local violence and ethnic composition.” International AreaStudies Review 18(1):4–25.
Eduardo Pizarro Leongomez, Ricardo Penaranda. 1991. LAS FARC (1949 -1966): De la autode-fensa a la combinacion de todas las formas de lucha. Tercer Mundo: Intituto de estudios politicosy relaciones internacionales.
Fagan, Brian. 1999. Floods, Famines, and Emperors: El Nino and the Fate of Civilizations. BasicBooks.
Fearon, James D. and David D. Laitin. 2003. “Ethnicity, Insurgency, and Civil War.” AmericanPolitical Science Review 97:75–90.
Francis, J. Michael. 2007. Invading Colombia : Spanish accounts of the Gonzalo Jimenez de Quesadaexpedition of conquest. Pennsylvania State University Press.
Gallego, Carlos Medina. 2009. FARC-EP: notas para una historia politica 1958-2008. UniversidadNacional de Colombia.
Gandonu, Ajato. 1978. “Nigeria’s 250 Ethnic Groups: Realities and Assumptions.” Perspectiveson ethnicity 46:243.
Gelles, Paul H. 2000. Water and power in highland Peru: The cultural politics of irrigation anddevelopment. Rutgers University Press.
Gleditsch, Kristian Skrede. 2007. “Transnational Dimensions of Civil War.” Journal of PeaceResearch 44(3):293–309.
Gleditsch, Nils Petter, Peter Wallensteen, Mikael Eriksson, Margareta Sollenberg and HavardStrand. 2002. “Armed Conflict 1946–2001: A New Dataset.” Journal of Peace Research 39(5).
Gott, Richard. 1971. Guerrilla movements in Latin America. Doubleday.
Hallberg, Johan Dittrich. 2012. “PRIO Conflict Site 1989–2008: A geo-referenced dataset on armedconflict.” Conflict Management and Peace Science 29(2):219–232.
Harrell, Stevan. 1995. “Languages defining ethnicity in southwest China.” Ethnic Identity: Cre-ation, Conflict, and Accommodation pp. 97–114.
Hasbrouck, Alfred. 1935. “The Conquest of the Desert.” The Hispanic American Historical Review15(2):195–228.
Herbst, Jeffrey. 2000. States and Power in Africa. Princeton, NJ: Princeton University Press.
Horowitz, Donald L. 1985. Ethnic groups in conflict. Univ of California Press.
Imai, Kosuke, Luke Keele and Dustin Tingley. 2010. “A general approach to causal mediationanalysis.” Psychological methods 15(4):309.
32
Imai, Kosuke, Luke Keele, Dustin Tingley and Teppei Yamamoto. 2011. “Unpacking the black boxof causality: Learning about causal mechanisms from experimental and observational studies.”American Political Science Review 105(4):765–789.
Kalyvas, Stathis N. 2006. The logic of violence in civil war. Cambridge Univ Press.
Kalyvas, Stathis N. and Matthew A. Kocher. 2007. “How “Free” is Free Riding in Civil Wars?Violence, Insurgency, and the Collective Action Problem.” World Politics 59(2):177–216.
Langebaek, Carl Henrik. 1995. Regional archaeology in the Muisca territory : a study of the Fuqueneand Susa valleys. University of Pittsburgh.
Lilja, Jannie and Lisa Hultman. 2011. “Intra-Ethnic Dominance and Control: Violence againstCo-Ethnics in the Early Sri Lankan Civil Wa.” Security Studies 20(2):171–197.
Lyall, Jason. 2010. “Are coethnics more effective counterinsurgents? Evidence from the SecondChechen War.” American Political Science Review 104(1):1–20.
Melo, J. O. 1996. Historia de Colombia: el establecimiento de la dominacion espanola. Presidenciade la Republica.
Michalopoulos, Stelios. 2012. “The Origins of Ethnolinguistic Diversity.” American Economic Re-view 102:1508–1539.
Michaud, Jean, Sarah Turner and Yann Roche. 2002. “Mapping ethnic diversity in highland North-ern Vietnam.” GeoJournal 57(4):305–323.
Nunn, Nathan and Diego Puga. 2012. “Ruggedness: The Blessing of Bad Geography in Africa.”Review of Economics and Statistics 94:20–36.
Pettersson, Therese and Peter Wallensteen. 2015. “Armed Conflicts, 1946–2014.” Journal of PeaceResearch 52(4).
Phillips, Brian J. 2014. “Terrorist Group Cooperation and Longevity.” International Studies Quar-terly 58(2):336–347.
Posner, Daniel N. 2004. “The Political Salience of Cultural Difference: Why Chewas and TumbukasAre Allies in Zambia and Adversaries in Malawi.” American Political Science Review 98(4):529–545.
Rivas, Ana Maria Boada. 2007. The evolution of social hierarchy in the Muisca chiefdom of thenorthern Andes of Colombia. University of Pittsburgh memoirs in Latin American archaeology.
Salehyan, Idean. 2009. Rebels Without Borders: Transnational Insurgencies in World Politics.Cornell, NY: Cornell University Press.
Salehyan, Idean and Kristian Skrede Gleditsch. 2006. “Refugees and the spread of civil war.”International Organization 60(2):335.
Sambanis, Nicholas. 2001. “Do Ethnic and Nonethnic Civil Wars Have the Same Causes? : ATheoretical and Empirical Inquiry (Part 1).” Journal of Conflict Resolution 45:259–282.
33
Sanchez, Fabio, Andres Solimano and Michel Formisano. 2005. Conflict, violence, and crime inColombia. In Understanding civil war: evidence and analysis, ed. Paul Collier and NicholasSambanis. Vol. 2 The World Bank chapter 5, pp. 119–159.
Scott, James C. 2014. The art of not being governed: An anarchist history of upland SoutheastAsia. Yale University Press.
Tollefsen, Andreas, Havard Strand and Halvard Buhaug. 2012. “PRIO-GRID: A unified spatialdata structure.” Journal of Peace Research 49(2):363–374.
Williams, Caroline A. 2004. Between Resistance and Adaptation: Indigenous Peoples and theColonisation of the Choco, 1510-1753. Liverpool University Press.
Wimmer, Andreas, Lars-Erik Cederman and Brian Min. 2009. “Ethnic politics and armed conflict.A configurational analysis of a new global dataset.” American Sociological Review 74(2):316–337.
Wucherpfennig, Julian, Nils B Weidmann, Luc Girardin, Lars-Erik Cederman and Andreas Wim-mer. 2011. “Politically relevant ethnic groups across space and time: Introducing the GeoEPRdataset.” Conflict Management and Peace Science 28(5):423–437.
Yannakakis, Yanna. 2008. The art of being in-between: Native intermediaries, Indian identity, andlocal rule in colonial Oaxaca. Duke University Press.
34
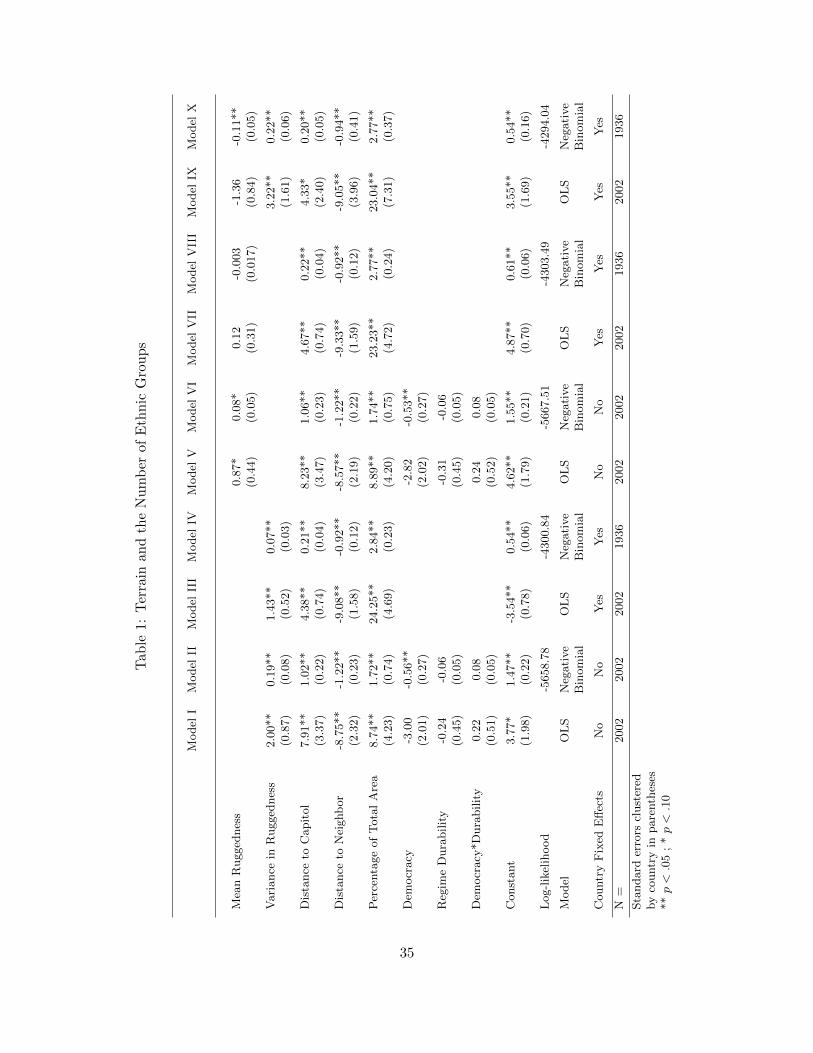
Tab
le1:
Ter
rain
and
the
Nu
mb
erof
Eth
nic
Gro
up
s
Model
IM
odel
IIM
odel
III
Model
IVM
odel
VM
odel
VI
Model
VII
Model
VII
IM
odel
IXM
odel
X
Mea
nR
ugged
nes
s0.8
7*
0.0
8*
0.1
2-0
.003
-1.3
6-0
.11**
(0.4
4)
(0.0
5)
(0.3
1)
(0.0
17)
(0.8
4)
(0.0
5)
Vari
ance
inR
ugged
nes
s2.0
0**
0.1
9**
1.4
3**
0.0
7**
3.2
2**
0.2
2**
(0.8
7)
(0.0
8)
(0.5
2)
(0.0
3)
(1.6
1)
(0.0
6)
Dis
tance
toC
apit
ol
7.9
1**
1.0
2**
4.3
8**
0.2
1**
8.2
3**
1.0
6**
4.6
7**
0.2
2**
4.3
3*
0.2
0**
(3.3
7)
(0.2
2)
(0.7
4)
(0.0
4)
(3.4
7)
(0.2
3)
(0.7
4)
(0.0
4)
(2.4
0)
(0.0
5)
Dis
tance
toN
eighb
or
-8.7
5**
-1.2
2**
-9.0
8**
-0.9
2**
-8.5
7**
-1.2
2**
-9.3
3**
-0.9
2**
-9.0
5**
-0.9
4**
(2.3
2)
(0.2
3)
(1.5
8)
(0.1
2)
(2.1
9)
(0.2
2)
(1.5
9)
(0.1
2)
(3.9
6)
(0.4
1)
Per
centa
ge
of
Tota
lA
rea
8.7
4**
1.7
2**
24.2
5**
2.8
4**
8.8
9**
1.7
4**
23.2
3**
2.7
7**
23.0
4**
2.7
7**
(4.2
3)
(0.7
4)
(4.6
9)
(0.2
3)
(4.2
0)
(0.7
5)
(4.7
2)
(0.2
4)
(7.3
1)
(0.3
7)
Dem
ocr
acy
-3.0
0-0
.56**
-2.8
2-0
.53**
(2.0
1)
(0.2
7)
(2.0
2)
(0.2
7)
Reg
ime
Dura
bilit
y-0
.24
-0.0
6-0
.31
-0.0
6(0
.45)
(0.0
5)
(0.4
5)
(0.0
5)
Dem
ocr
acy
*D
ura
bilit
y0.2
20.0
80.2
40.0
8(0
.51)
(0.0
5)
(0.5
2)
(0.0
5)
Const
ant
3.7
7*
1.4
7**
-3.5
4**
0.5
4**
4.6
2**
1.5
5**
4.8
7**
0.6
1**
3.5
5**
0.5
4**
(1.9
8)
(0.2
2)
(0.7
8)
(0.0
6)
(1.7
9)
(0.2
1)
(0.7
0)
(0.0
6)
(1.6
9)
(0.1
6)
Log-l
ikel
ihood
-5658.7
8-4
300.8
4-5
667.5
1-4
303.4
9-4
294.0
4
Model
OL
SN
egati
ve
OL
SN
egati
ve
OL
SN
egati
ve
OL
SN
egati
ve
OL
SN
egati
ve
Bin
om
ial
Bin
om
ial
Bin
om
ial
Bin
om
ial
Bin
om
ial
Countr
yF
ixed
Eff
ects
No
No
Yes
Yes
No
No
Yes
Yes
Yes
Yes
N=
2002
2002
2002
1936
2002
2002
2002
1936
2002
1936
Sta
ndard
erro
rscl
ust
ered
by
countr
yin
pare
nth
eses
**p<
.05
;*p<
.10
35
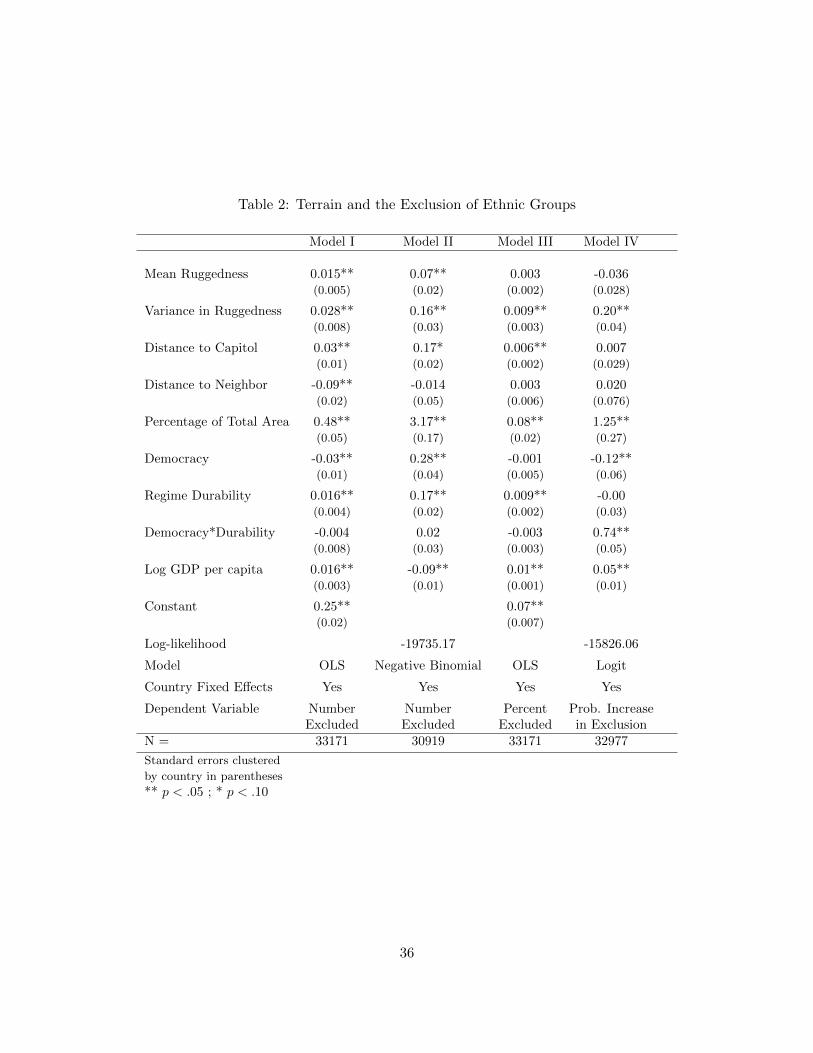
Table 2: Terrain and the Exclusion of Ethnic Groups
Model I Model II Model III Model IV
Mean Ruggedness 0.015** 0.07** 0.003 -0.036(0.005) (0.02) (0.002) (0.028)
Variance in Ruggedness 0.028** 0.16** 0.009** 0.20**(0.008) (0.03) (0.003) (0.04)
Distance to Capitol 0.03** 0.17* 0.006** 0.007(0.01) (0.02) (0.002) (0.029)
Distance to Neighbor -0.09** -0.014 0.003 0.020(0.02) (0.05) (0.006) (0.076)
Percentage of Total Area 0.48** 3.17** 0.08** 1.25**(0.05) (0.17) (0.02) (0.27)
Democracy -0.03** 0.28** -0.001 -0.12**(0.01) (0.04) (0.005) (0.06)
Regime Durability 0.016** 0.17** 0.009** -0.00(0.004) (0.02) (0.002) (0.03)
Democracy*Durability -0.004 0.02 -0.003 0.74**(0.008) (0.03) (0.003) (0.05)
Log GDP per capita 0.016** -0.09** 0.01** 0.05**(0.003) (0.01) (0.001) (0.01)
Constant 0.25** 0.07**(0.02) (0.007)
Log-likelihood -19735.17 -15826.06
Model OLS Negative Binomial OLS Logit
Country Fixed Effects Yes Yes Yes Yes
Dependent Variable Number Number Percent Prob. IncreaseExcluded Excluded Excluded in Exclusion
N = 33171 30919 33171 32977
Standard errors clustered
by country in parentheses
** p < .05 ; * p < .10
36
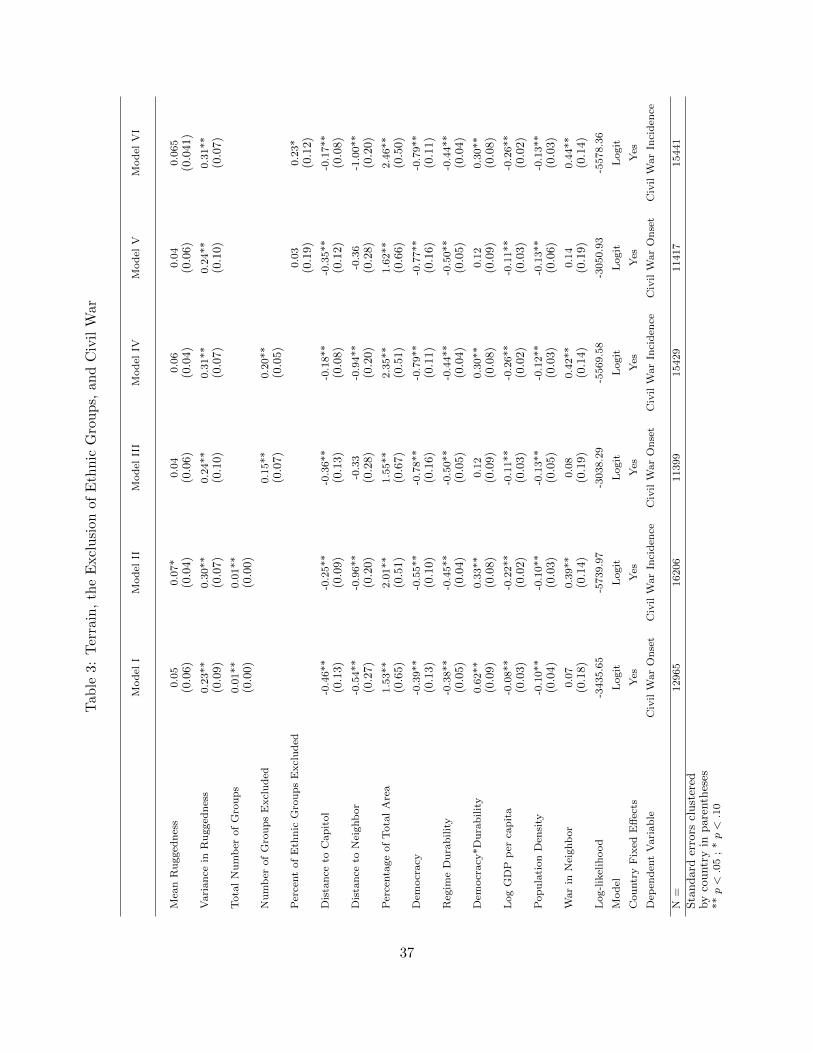
Tab
le3:
Ter
rain
,th
eE
xcl
usi
onof
Eth
nic
Gro
up
s,an
dC
ivil
War
Mod
elI
Mod
elII
Mod
elII
IM
od
elIV
Mod
elV
Mod
elV
I
Mea
nR
ugged
nes
s0.0
50.0
7*
0.0
40.0
60.0
40.0
65
(0.0
6)
(0.0
4)
(0.0
6)
(0.0
4)
(0.0
6)
(0.0
41)
Vari
an
cein
Ru
gged
nes
s0.2
3**
0.3
0**
0.2
4**
0.3
1**
0.2
4**
0.3
1**
(0.0
9)
(0.0
7)
(0.1
0)
(0.0
7)
(0.1
0)
(0.0
7)
Tota
lN
um
ber
of
Gro
up
s0.0
1**
0.0
1**
(0.0
0)
(0.0
0)
Nu
mb
erof
Gro
up
sE
xcl
ud
ed0.1
5**
0.2
0**
(0.0
7)
(0.0
5)
Per
cent
of
Eth
nic
Gro
up
sE
xcl
ud
ed0.0
30.2
3*
(0.1
9)
(0.1
2)
Dis
tan
ceto
Cap
itol
-0.4
6**
-0.2
5**
-0.3
6**
-0.1
8**
-0.3
5**
-0.1
7**
(0.1
3)
(0.0
9)
(0.1
3)
(0.0
8)
(0.1
2)
(0.0
8)
Dis
tan
ceto
Nei
ghb
or
-0.5
4**
-0.9
6**
-0.3
3-0
.94**
-0.3
6-1
.00**
(0.2
7)
(0.2
0)
(0.2
8)
(0.2
0)
(0.2
8)
(0.2
0)
Per
centa
ge
of
Tota
lA
rea
1.5
3**
2.0
1**
1.5
5**
2.3
5**
1.6
2**
2.4
6**
(0.6
5)
(0.5
1)
(0.6
7)
(0.5
1)
(0.6
6)
(0.5
0)
Dem
ocr
acy
-0.3
9**
-0.5
5**
-0.7
8**
-0.7
9**
-0.7
7**
-0.7
9**
(0.1
3)
(0.1
0)
(0.1
6)
(0.1
1)
(0.1
6)
(0.1
1)
Reg
ime
Du
rab
ilit
y-0
.38**
-0.4
5**
-0.5
0**
-0.4
4**
-0.5
0**
-0.4
4**
(0.0
5)
(0.0
4)
(0.0
5)
(0.0
4)
(0.0
5)
(0.0
4)
Dem
ocr
acy
*D
ura
bilit
y0.6
2**
0.3
3**
0.1
20.3
0**
0.1
20.3
0**
(0.0
9)
(0.0
8)
(0.0
9)
(0.0
8)
(0.0
9)
(0.0
8)
Log
GD
Pp
erca
pit
a-0
.08**
-0.2
2**
-0.1
1**
-0.2
6**
-0.1
1**
-0.2
6**
(0.0
3)
(0.0
2)
(0.0
3)
(0.0
2)
(0.0
3)
(0.0
2)
Pop
ula
tion
Den
sity
-0.1
0**
-0.1
0**
-0.1
3**
-0.1
2**
-0.1
3**
-0.1
3**
(0.0
4)
(0.0
3)
(0.0
5)
(0.0
3)
(0.0
6)
(0.0
3)
War
inN
eighb
or
0.0
70.3
9**
0.0
80.4
2**
0.1
40.4
4**
(0.1
8)
(0.1
4)
(0.1
9)
(0.1
4)
(0.1
9)
(0.1
4)
Log-l
ikel
ihood
-3435.6
5-5
739.9
7-3
038.2
9-5
569.5
8-3
050.9
3-5
578.3
6
Model
Logit
Logit
Logit
Logit
Logit
Logit
Cou
ntr
yF
ixed
Eff
ects
Yes
Yes
Yes
Yes
Yes
Yes
Dep
end
ent
Vari
ab
leC
ivil
War
On
set
Civ
ilW
ar
Inci
den
ceC
ivil
War
On
set
Civ
ilW
ar
Inci
den
ceC
ivil
War
On
set
Civ
ilW
ar
Inci
den
ce
N=
12965
16206
11399
15429
11417
15441
Sta
ndard
erro
rscl
ust
ered
by
countr
yin
pare
nth
eses
**p<
.05
;*p<
.10
37
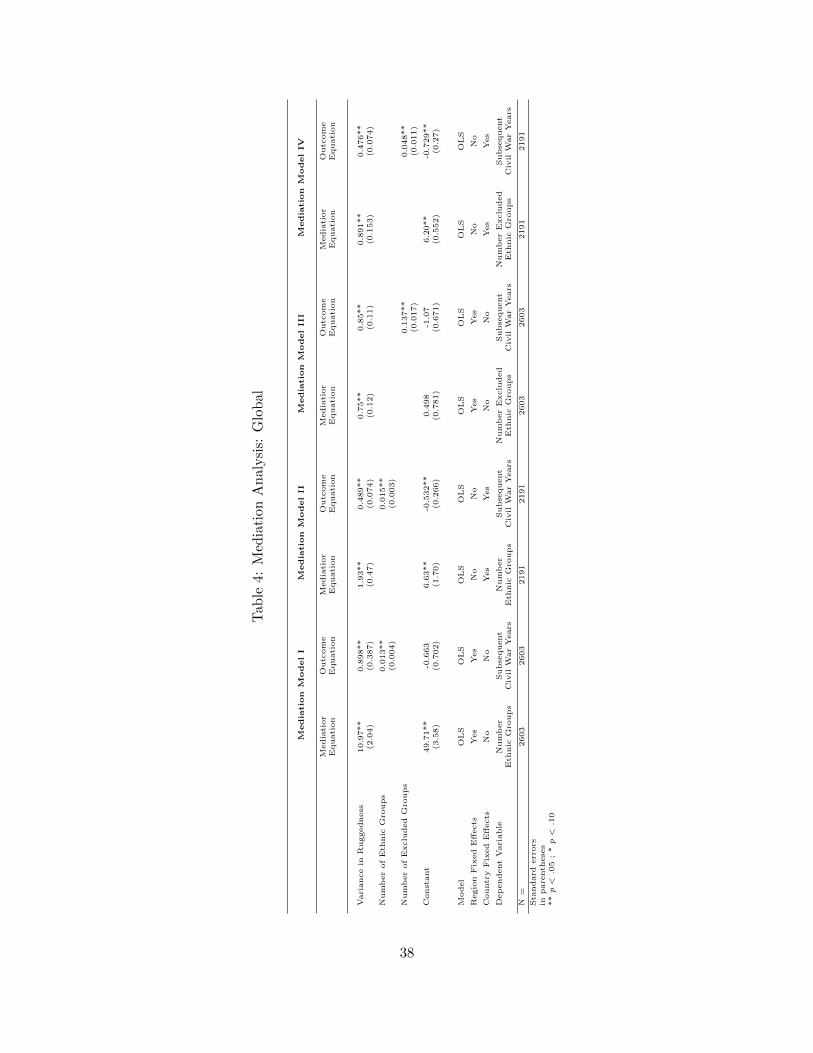
Tab
le4:
Med
iati
onA
nal
ysi
s:G
lob
al
Media
tio
nM
odelI
Media
tio
nM
odelII
Media
tio
nM
odelIII
Media
tio
nM
odelIV
Media
tior
Outc
om
eM
edia
tior
Outc
om
eM
edia
tior
Outc
om
eM
edia
tior
Outc
om
eE
quati
on
Equati
on
Equati
on
Equati
on
Equati
on
Equati
on
Equati
on
Equati
on
Vari
ance
inR
uggedness
10.9
7**
0.8
98**
1.9
3**
0.4
89**
0.7
5**
0.8
5**
0.8
91**
0.4
76**
(2.0
4)
(0.3
87)
(0.4
7)
(0.0
74)
(0.1
2)
(0.1
1)
(0.1
53)
(0.0
74)
Num
ber
of
Eth
nic
Gro
ups
0.0
13**
0.0
15**
(0.0
04)
(0.0
03)
Num
ber
of
Exclu
ded
Gro
ups
0.1
37**
0.0
48**
(0.0
17)
(0.0
11)
Const
ant
49.7
1**
-0.6
63
6.6
3**
-0.5
32**
0.4
98
-1.0
76.2
0**
-0.7
29**
(3.5
8)
(0.7
02)
(1.7
0)
(0.2
66)
(0.7
81)
(0.6
71)
(0.5
52)
(0.2
7)
Model
OL
SO
LS
OL
SO
LS
OL
SO
LS
OL
SO
LS
Regio
nF
ixed
Eff
ects
Yes
Yes
No
No
Yes
Yes
No
No
Countr
yF
ixed
Eff
ects
No
No
Yes
Yes
No
No
Yes
Yes
Dep
endent
Vari
able
Num
ber
Subse
quent
Num
ber
Subse
quent
Num
ber
Exclu
ded
Subse
quent
Num
ber
Exclu
ded
Subse
quent
Eth
nic
Gro
ups
Civ
ilW
ar
Years
Eth
nic
Gro
ups
Civ
ilW
ar
Years
Eth
nic
Gro
ups
Civ
ilW
ar
Years
Eth
nic
Gro
ups
Civ
ilW
ar
Years
N=
2603
2603
2191
2191
2603
2603
2191
2191
Sta
ndard
err
ors
inpare
nth
ese
s**
p<
.05
;*
p<
.10
38
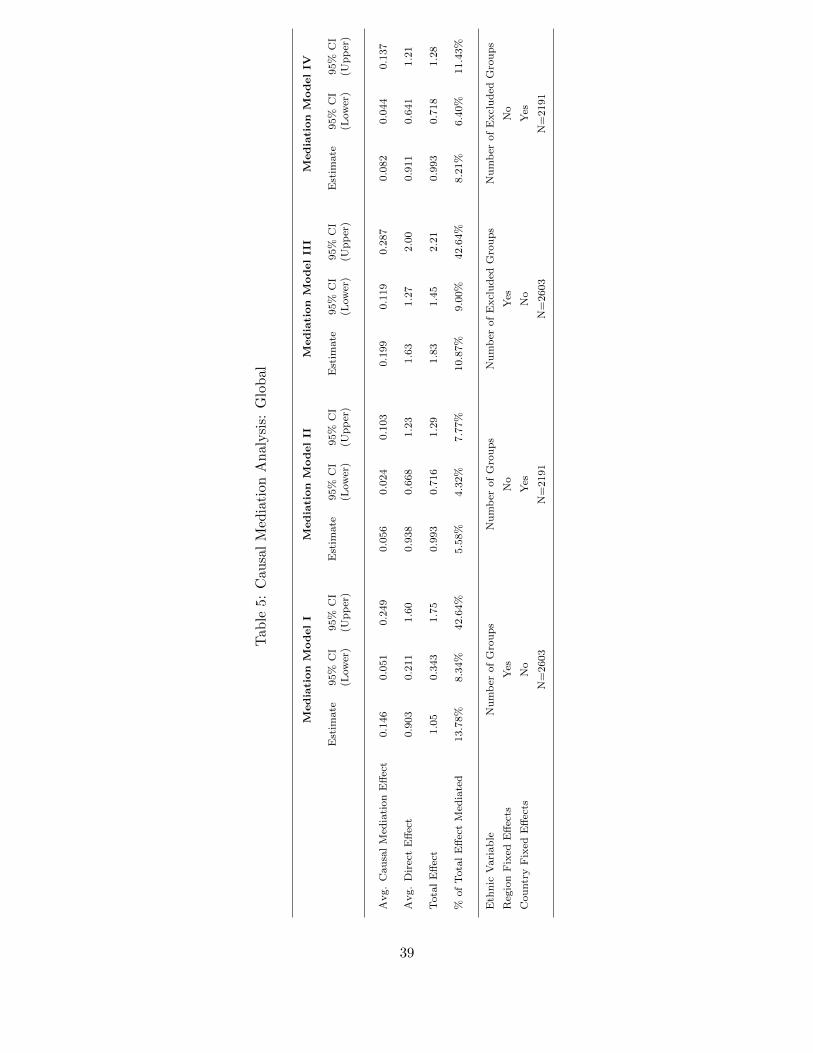
Tab
le5:
Cau
sal
Med
iati
onA
nal
ysi
s:G
lob
al
Mediation
ModelI
Mediation
ModelII
Mediation
ModelIII
Mediation
ModelIV
Est
imate
95%
CI
95%
CI
Est
imate
95%
CI
95%
CI
Est
imate
95%
CI
95%
CI
Est
imate
95%
CI
95%
CI
(Low
er)
(Up
per
)(L
ow
er)
(Up
per
)(L
ow
er)
(Up
per
)(L
ow
er)
(Up
per
)
Avg.
Cau
sal
Med
iati
on
Eff
ect
0.1
46
0.0
51
0.2
49
0.0
56
0.0
24
0.1
03
0.1
99
0.1
19
0.2
87
0.0
82
0.0
44
0.1
37
Avg.
Dir
ect
Eff
ect
0.9
03
0.2
11
1.6
00.9
38
0.6
68
1.2
31.6
31.2
72.0
00.9
11
0.6
41
1.2
1
Tota
lE
ffec
t1.0
50.3
43
1.7
50.9
93
0.7
16
1.2
91.8
31.4
52.2
10.9
93
0.7
18
1.2
8
%of
Tota
lE
ffec
tM
edia
ted
13.7
8%
8.3
4%
42.6
4%
5.5
8%
4.3
2%
7.7
7%
10.8
7%
9.0
0%
42.6
4%
8.2
1%
6.4
0%
11.4
3%
Eth
nic
Vari
ab
leN
um
ber
of
Gro
up
sN
um
ber
of
Gro
up
sN
um
ber
of
Excl
ud
edG
rou
ps
Nu
mb
erof
Excl
ud
edG
rou
ps
Reg
ion
Fix
edE
ffec
tsY
esN
oY
esN
o
Cou
ntr
yF
ixed
Eff
ects
No
Yes
No
Yes
N=
2603
N=
2191
N=
2603
N=
2191
39
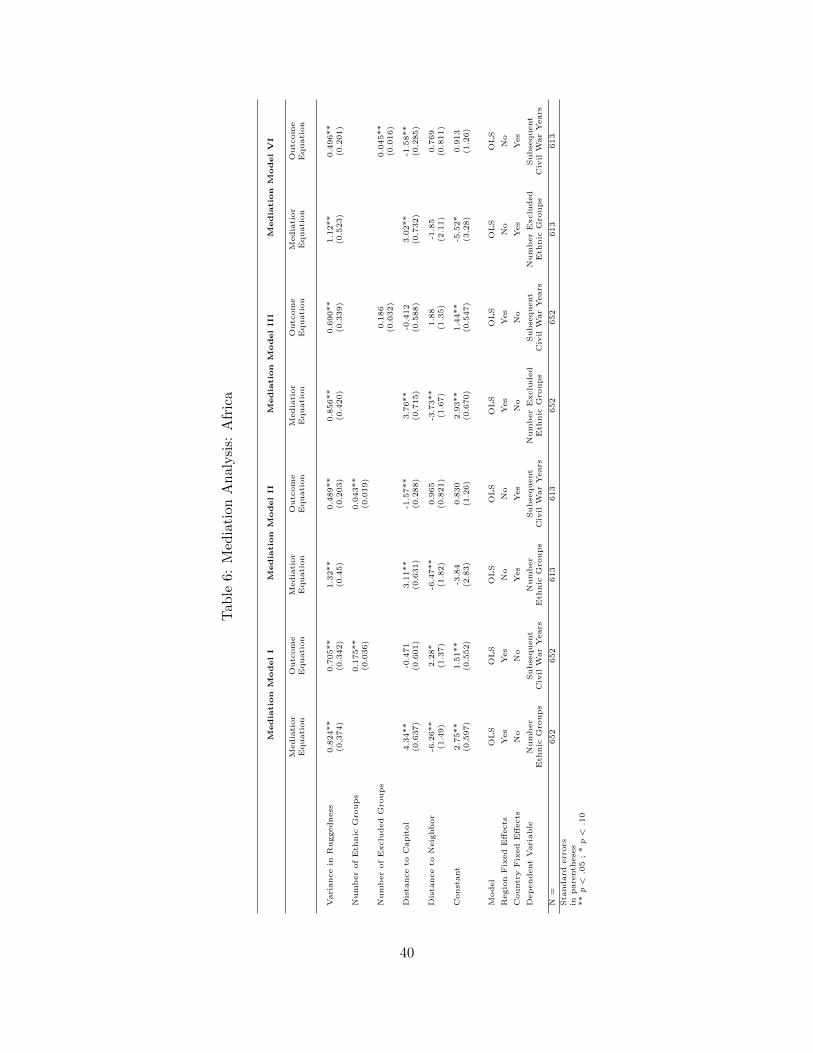
Tab
le6:
Med
iati
onA
nal
ysi
s:A
fric
a
Media
tio
nM
odelI
Media
tio
nM
odelII
Media
tio
nM
odelIII
Media
tio
nM
odelV
I
Media
tior
Outc
om
eM
edia
tior
Outc
om
eM
edia
tior
Outc
om
eM
edia
tior
Outc
om
eE
quati
on
Equati
on
Equati
on
Equati
on
Equati
on
Equati
on
Equati
on
Equati
on
Vari
ance
inR
uggedness
0.8
24**
0.7
05**
1.3
2**
0.4
89**
0.8
56**
0.6
90**
1.1
2**
0.4
96**
(0.3
74)
(0.3
42)
(0.4
5)
(0.2
03)
(0.4
20)
(0.3
39)
(0.5
23)
(0.2
01)
Num
ber
of
Eth
nic
Gro
ups
0.1
75**
0.0
43**
(0.0
36)
(0.0
19)
Num
ber
of
Exclu
ded
Gro
ups
0.1
86
0.0
45**
(0.0
32)
(0.0
16)
Dis
tance
toC
apit
ol
4.3
4**
-0.4
71
3.1
1**
-1.5
7**
3.7
6**
-0.4
12
3.0
2**
-1.5
8**
(0.6
37)
(0.6
01)
(0.6
31)
(0.2
88)
(0.7
15)
(0.5
88)
(0.7
32)
(0.2
85)
Dis
tance
toN
eig
hb
or
-6.2
6**
2.2
8*
-6.4
7**
0.9
65
-3.7
3**
1.8
8-1
.85
0.7
69
(1.4
9)
(1.3
7)
(1.8
2)
(0.8
21)
(1.6
7)
(1.3
5)
(2.1
1)
(0.8
11)
Const
ant
2.7
5**
1.5
1**
-3.8
40.8
30
2.9
3**
1.4
4**
-5.5
2*
0.9
13
(0.5
97)
(0.5
52)
(2.8
3)
(1.2
6)
(0.6
70)
(0.5
47)
(3.2
8)
(1.2
6)
Model
OL
SO
LS
OL
SO
LS
OL
SO
LS
OL
SO
LS
Regio
nF
ixed
Eff
ects
Yes
Yes
No
No
Yes
Yes
No
No
Countr
yF
ixed
Eff
ects
No
No
Yes
Yes
No
No
Yes
Yes
Dep
endent
Vari
able
Num
ber
Subse
quent
Num
ber
Subse
quent
Num
ber
Exclu
ded
Subse
quent
Num
ber
Exclu
ded
Subse
quent
Eth
nic
Gro
ups
Civ
ilW
ar
Years
Eth
nic
Gro
ups
Civ
ilW
ar
Years
Eth
nic
Gro
ups
Civ
ilW
ar
Years
Eth
nic
Gro
ups
Civ
ilW
ar
Years
N=
652
652
613
613
652
652
613
613
Sta
ndard
err
ors
inpare
nth
ese
s**
p<
.05
;*
p<
.10
40
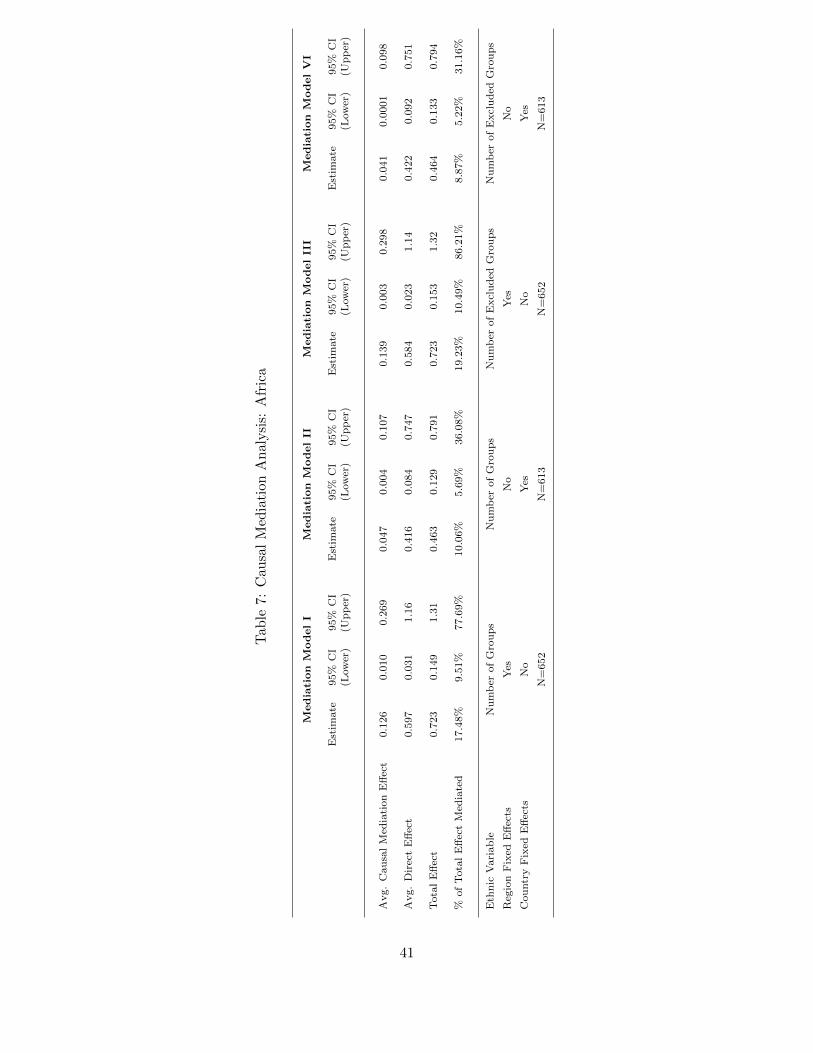
Tab
le7:
Cau
sal
Med
iati
onA
nal
ysi
s:A
fric
a
Mediation
ModelI
Mediation
ModelII
Mediation
ModelIII
Mediation
ModelVI
Est
imate
95%
CI
95%
CI
Est
imate
95%
CI
95%
CI
Est
imate
95%
CI
95%
CI
Est
imate
95%
CI
95%
CI
(Low
er)
(Up
per
)(L
ow
er)
(Up
per
)(L
ow
er)
(Up
per
)(L
ow
er)
(Up
per
)
Avg.
Cau
sal
Med
iati
on
Eff
ect
0.1
26
0.0
10
0.2
69
0.0
47
0.0
04
0.1
07
0.1
39
0.0
03
0.2
98
0.0
41
0.0
001
0.0
98
Avg.
Dir
ect
Eff
ect
0.5
97
0.0
31
1.1
60.4
16
0.0
84
0.7
47
0.5
84
0.0
23
1.1
40.4
22
0.0
92
0.7
51
Tota
lE
ffec
t0.7
23
0.1
49
1.3
10.4
63
0.1
29
0.7
91
0.7
23
0.1
53
1.3
20.4
64
0.1
33
0.7
94
%of
Tota
lE
ffec
tM
edia
ted
17.4
8%
9.5
1%
77.6
9%
10.0
6%
5.6
9%
36.0
8%
19.2
3%
10.4
9%
86.2
1%
8.8
7%
5.2
2%
31.1
6%
Eth
nic
Vari
ab
leN
um
ber
of
Gro
up
sN
um
ber
of
Gro
up
sN
um
ber
of
Excl
ud
edG
rou
ps
Nu
mb
erof
Excl
ud
edG
rou
ps
Reg
ion
Fix
edE
ffec
tsY
esN
oY
esN
o
Cou
ntr
yF
ixed
Eff
ects
No
Yes
No
Yes
N=
652
N=
613
N=
652
N=
613
41
Recommended