Mission: To actively create opportunities and encourage investment for the benefit of Saint Paul residents and businesses, which preserve, sustain, and grow the city’s diverse neighborhoods.
Director
HRA Executive DirectorDept. Policy Oversight & Coordination
2.00 FTE
Deputy DirectorChief Operations OfficerFiscal Management
1.00 FTE
Inspiring CommunitiesHome Improvement LoansForeclosure PreventionMultifamily Development & FinanceHomelessness PreventionSustainable Building PolicyRental Rehab Program
19.50 FTE
Business OutreachTIF & Bond FinancingCommercial Real Estate DevelopmentHRA Owned ParkingNeighborhood & Cultural STARBusiness Finance
17.80 FTE
Citywide/Neighborhood PlanningZoning Cases & StudiesHeritage PreservationResearch/GISEnvironmental ReviewsGrant Writing
20.00 FTE
Department AccountingAdmin/OperationsHuman ResourcesGrant ComplianceCommunicationsLoan Servicing & Credit committeeReal Estate
15.00 FTE
1/24/19(Total 75.30 FTE)
Planning and Economic Development
Administration &Financial Services
Housing Economic Development Planning
315
Department Description:
Department Facts Department Goals
● Total General Fund Budget: $82,486
● Total Special Fund Budget: $56,439,179
● Total FTEs: 75.30
Recent Accomplishments
2019 Adopted Budget
Planning and Economic Development
PED's mission is to build community wealth - through business, jobs, housing, planning, financial and cultural assets.
● Increase vitality, livability and investment in the City.● Capture market momentum on key redevelopment sites. ● Preserve and increase jobs and tax base.● Increase and improve housing options for growing the population.● Expand access to opportunity and housing choice; addressing racial disparities in employment and housing. ● Increase Department effectiveness.
● Manages and maintains property owned by the HRA.
Economic Development: Full Stack technology initiative launched and Farm to Fork Techstars recruited to downtown; The 428, Rondo Plaza and Karibu complete; Keg and Case House and Snelling-Midway development under construction; 50 average business visits monthly; STAR invested $4.285M; Job Opportunity Fund launched; sustained strong revenue at HRA ramps; $536M in conduit revenue bonds issued.Planning: Comprehensive Plan update underway, engaged over 2,200 people at 67 events; Accessory Dwelling Units Zoning recommendations completed; Community Plans completed with Districts 12 and 13; West Marshall Zoning Study and Ford Spur study; Census 2020 preparation; progress on West Side Flats Greenway, Snelling-Midway, and Ford Site; major project review: O-Gara's, Saint Clair and Snelling, Marshall and Western.Housing: BrownStone complete; Selby-Milton-Vic and Pioneer Press redevelopment under construction; financing secured to retain affordability of Como by the Lake; 58 Inspiring Communities homes completed or under way; 33 home improvement loans to low-income owners; Rental Rehab program launched.Workforce diversity: Increased proportion people of color on the department staff from 15.4% in 2016 to 26.9% in July 2018.
● 2018 operations budget is approximately $10.945 million.
● Administers $100M annually in Federal, State, and local resources.
● Manages City and HRA direct investments in housing and economic development.
● Finances affordable housing and business investments.
● Administers a loan portfolio of $181M.
● Manages 17 parking facilities and a $23M parking fund.
● Provides planning/zoning/HPC services, and staffs four citizen advisory boards.
PED's Portion of General Fund Spending
0.0%
316
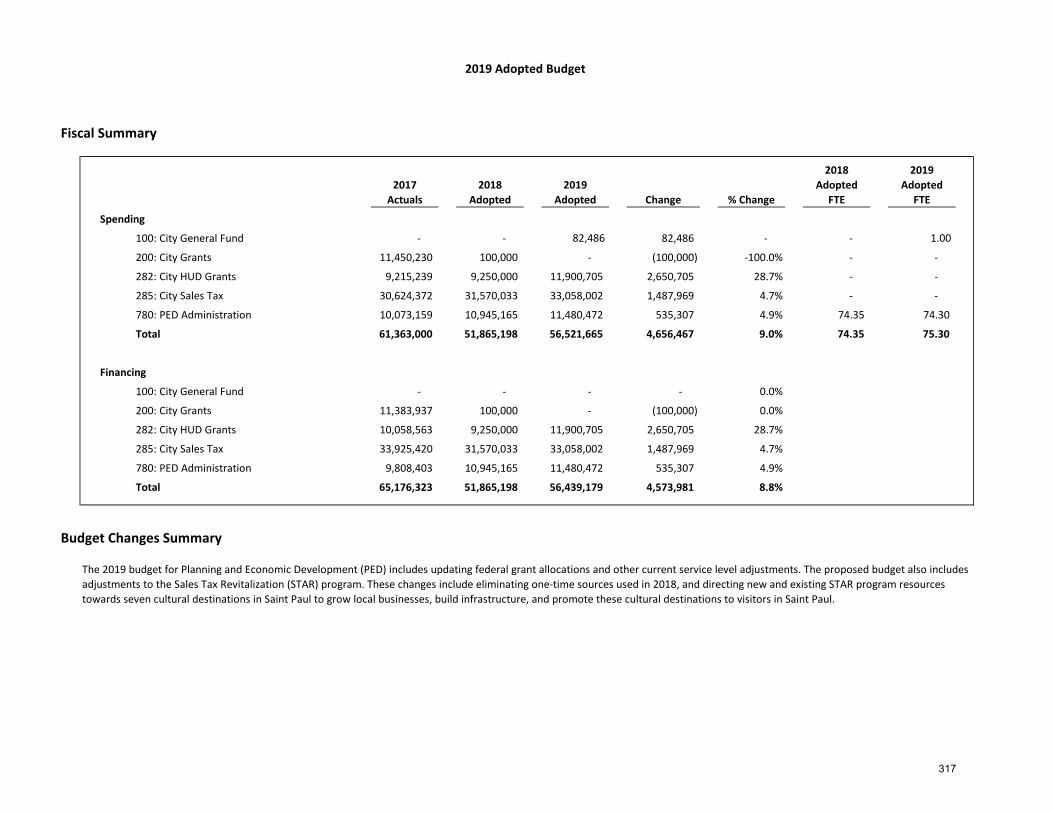
Fiscal Summary
2017 Actuals
2018 Adopted
2019 Adopted Change % Change
2018 Adopted
FTE
2019 Adopted
FTE
Spending
100: City General Fund - - 82,486 82,486 - - 1.00
11,450,230 100,000 - (100,000) -100.0% - -
9,215,239 9,250,000 11,900,705 2,650,705 28.7% - -
30,624,372 31,570,033 33,058,002 1,487,969 4.7% - -
780: PED Administration 10,073,159 10,945,165 11,480,472 535,307 4.9% 74.35 74.30
61,363,000 51,865,198 56,521,665 4,656,467 9.0% 74.35 75.30
Financing
100: City General Fund - - - - 0.0%
11,383,937 100,000 - (100,000) 0.0%
10,058,563 9,250,000 11,900,705 2,650,705 28.7%
33,925,420 31,570,033 33,058,002 1,487,969 4.7%
9,808,403 10,945,165 11,480,472 535,307 4.9%
65,176,323 51,865,198 56,439,179 4,573,981 8.8%
Budget Changes Summary
780: PED Administration
Total
2019 Adopted Budget
The 2019 budget for Planning and Economic Development (PED) includes updating federal grant allocations and other current service level adjustments. The proposed budget also includes adjustments to the Sales Tax Revitalization (STAR) program. These changes include eliminating one-time sources used in 2018, and directing new and existing STAR program resources towards seven cultural destinations in Saint Paul to grow local businesses, build infrastructure, and promote these cultural destinations to visitors in Saint Paul.
285: City Sales Tax
282: City HUD Grants
200: City Grants
282: City HUD Grants
285: City Sales Tax
200: City Grants
Total
317
City General Fund
Spending Financing FTE
Mayor's Proposed Changes
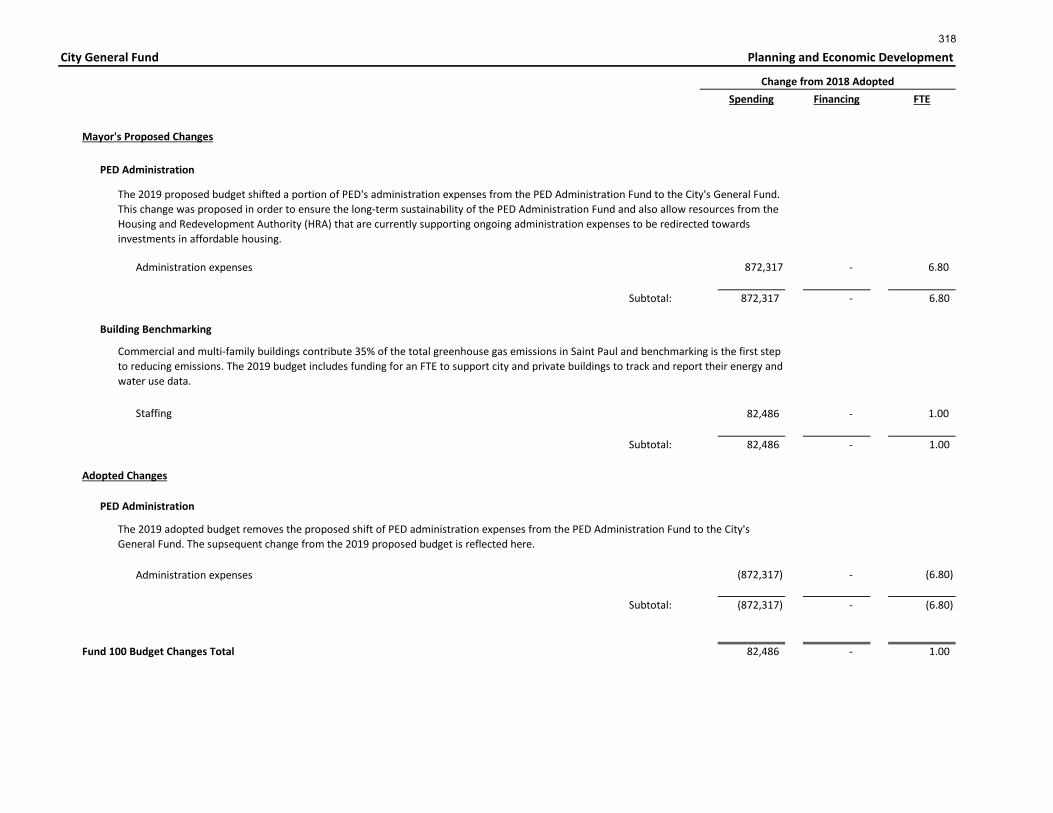
PED Administration
Administration expenses 872,317 - 6.80
Subtotal: 872,317 - 6.80
Building Benchmarking
Staffing 82,486 - 1.00
Subtotal: 82,486 - 1.00
Adopted Changes
PED Administration
Administration expenses (872,317) - (6.80)
Subtotal: (872,317) - (6.80)
Fund 100 Budget Changes Total 82,486 - 1.00
Planning and Economic Development
Change from 2018 Adopted
The 2019 proposed budget shifted a portion of PED's administration expenses from the PED Administration Fund to the City's General Fund. This change was proposed in order to ensure the long-term sustainability of the PED Administration Fund and also allow resources from the Housing and Redevelopment Authority (HRA) that are currently supporting ongoing administration expenses to be redirected towards investments in affordable housing.
Commercial and multi-family buildings contribute 35% of the total greenhouse gas emissions in Saint Paul and benchmarking is the first step to reducing emissions. The 2019 budget includes funding for an FTE to support city and private buildings to track and report their energy and water use data.
The 2019 adopted budget removes the proposed shift of PED administration expenses from the PED Administration Fund to the City's General Fund. The supsequent change from the 2019 proposed budget is reflected here.
318
200: City Grants
Spending Financing FTE
Mayor's Proposed Changes
Emergency Overflow Housing
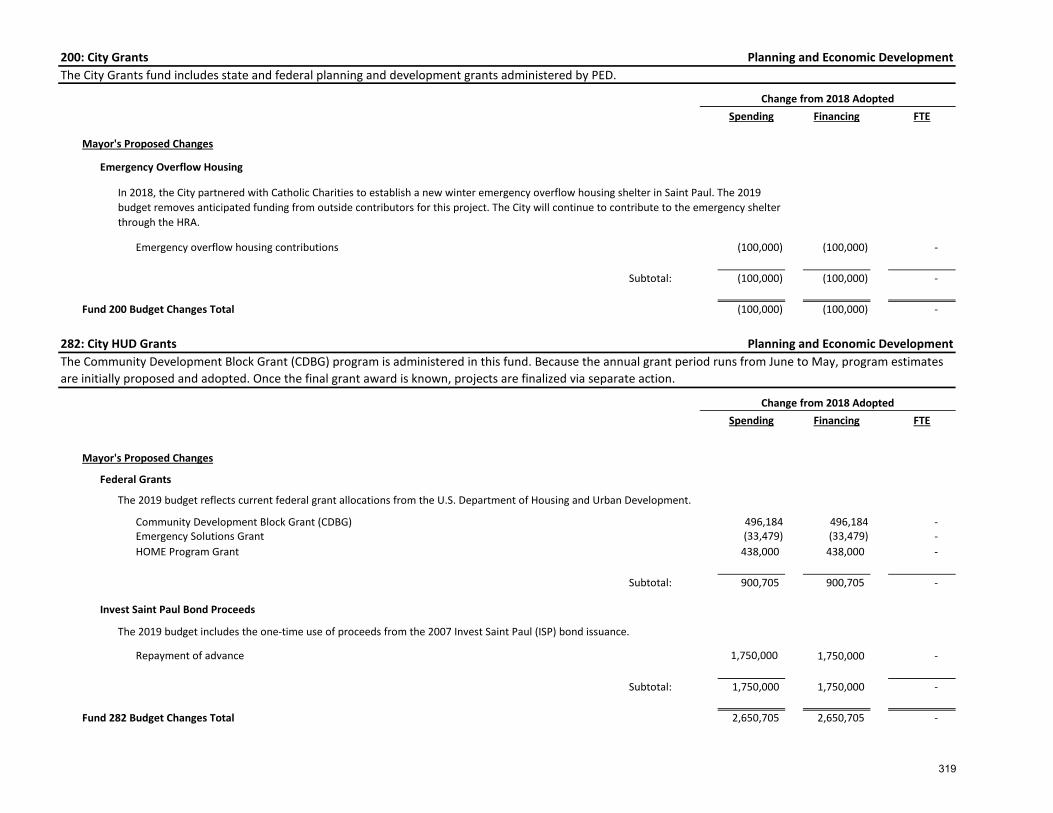
Emergency overflow housing contributions (100,000) (100,000) -
Subtotal: (100,000) (100,000) -
Fund 200 Budget Changes Total (100,000) (100,000) -
282: City HUD Grants
Spending Financing FTE
Mayor's Proposed Changes
Federal Grants
Community Development Block Grant (CDBG) 496,184 496,184 - Emergency Solutions Grant (33,479) (33,479) - HOME Program Grant 438,000 438,000 -
Subtotal: 900,705 900,705 -
Invest Saint Paul Bond Proceeds
Repayment of advance 1,750,000 1,750,000 -
Subtotal: 1,750,000 1,750,000 -
Fund 282 Budget Changes Total 2,650,705 2,650,705 -
Planning and Economic DevelopmentThe City Grants fund includes state and federal planning and development grants administered by PED.
Change from 2018 Adopted
In 2018, the City partnered with Catholic Charities to establish a new winter emergency overflow housing shelter in Saint Paul. The 2019 budget removes anticipated funding from outside contributors for this project. The City will continue to contribute to the emergency shelter through the HRA.
The 2019 budget reflects current federal grant allocations from the U.S. Department of Housing and Urban Development.
The 2019 budget includes the one-time use of proceeds from the 2007 Invest Saint Paul (ISP) bond issuance.
Planning and Economic DevelopmentThe Community Development Block Grant (CDBG) program is administered in this fund. Because the annual grant period runs from June to May, program estimates are initially proposed and adopted. Once the final grant award is known, projects are finalized via separate action.
Change from 2018 Adopted
319
285: City Sales Tax
Spending Financing FTE
Current Service Level Adjustments
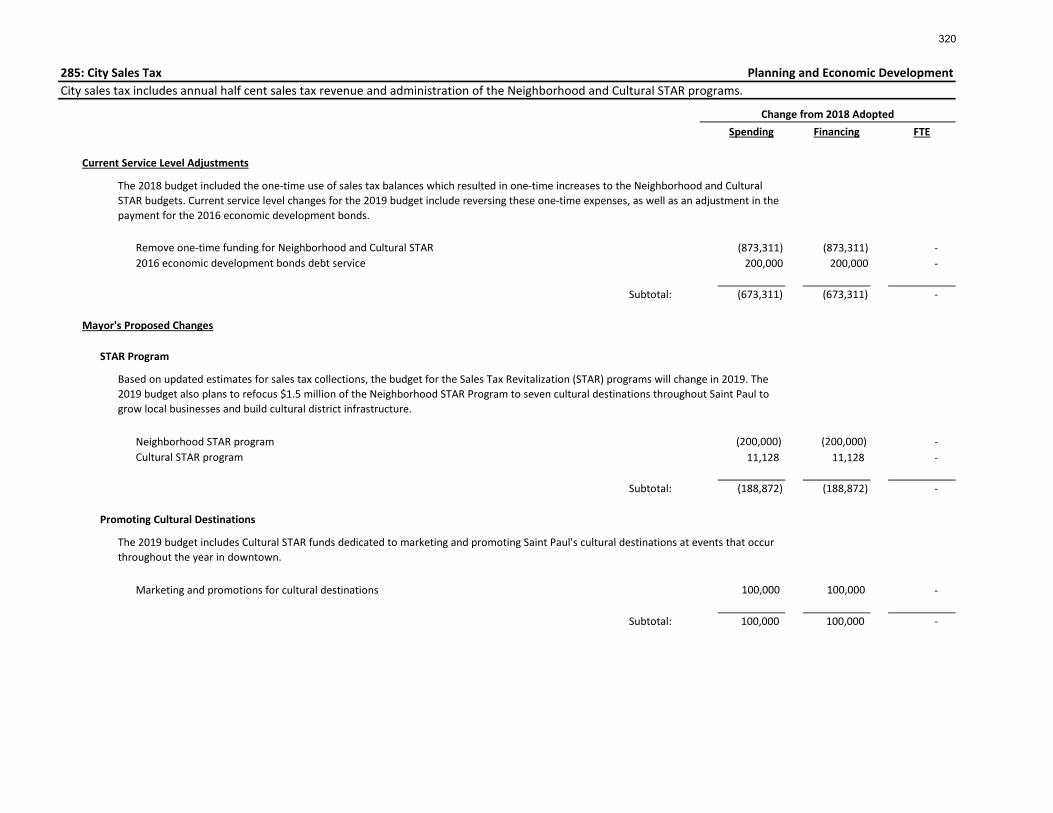
Remove one-time funding for Neighborhood and Cultural STAR (873,311) (873,311) - 2016 economic development bonds debt service 200,000 200,000 -
Subtotal: (673,311) (673,311) -
Mayor's Proposed Changes
STAR Program
Neighborhood STAR program (200,000) (200,000) - Cultural STAR program 11,128 11,128 -
Subtotal: (188,872) (188,872) -
Promoting Cultural Destinations
Marketing and promotions for cultural destinations 100,000 100,000 -
Subtotal: 100,000 100,000 -
Planning and Economic Development
Change from 2018 Adopted
City sales tax includes annual half cent sales tax revenue and administration of the Neighborhood and Cultural STAR programs.
The 2018 budget included the one-time use of sales tax balances which resulted in one-time increases to the Neighborhood and Cultural STAR budgets. Current service level changes for the 2019 budget include reversing these one-time expenses, as well as an adjustment in the payment for the 2016 economic development bonds.
Based on updated estimates for sales tax collections, the budget for the Sales Tax Revitalization (STAR) programs will change in 2019. The 2019 budget also plans to refocus $1.5 million of the Neighborhood STAR Program to seven cultural destinations throughout Saint Paul to grow local businesses and build cultural district infrastructure.
The 2019 budget includes Cultural STAR funds dedicated to marketing and promoting Saint Paul's cultural destinations at events that occur throughout the year in downtown.
320
285: City Sales Tax
Financing FTE
Housing
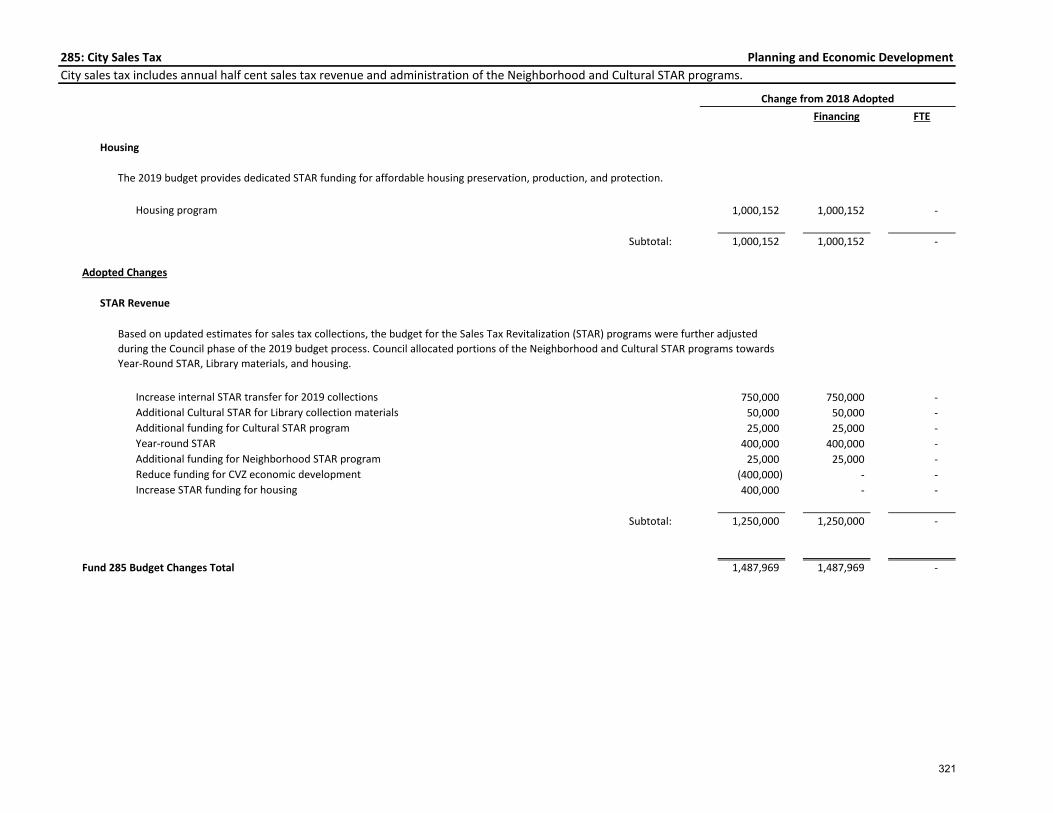
Housing program 1,000,152 1,000,152 -
Subtotal: 1,000,152 1,000,152 -
Adopted Changes
STAR Revenue
Increase internal STAR transfer for 2019 collections 750,000 750,000 - Additional Cultural STAR for Library collection materials 50,000 50,000 - Additional funding for Cultural STAR program 25,000 25,000 - Year-round STAR 400,000 400,000 - Additional funding for Neighborhood STAR program 25,000 25,000 - Reduce funding for CVZ economic development (400,000) - - Increase STAR funding for housing 400,000 - -
Subtotal: 1,250,000 1,250,000 -
Fund 285 Budget Changes Total 1,487,969 1,487,969 -
Based on updated estimates for sales tax collections, the budget for the Sales Tax Revitalization (STAR) programs were further adjusted during the Council phase of the 2019 budget process. Council allocated portions of the Neighborhood and Cultural STAR programs towards Year-Round STAR, Library materials, and housing.
The 2019 budget provides dedicated STAR funding for affordable housing preservation, production, and protection.
Planning and Economic DevelopmentCity sales tax includes annual half cent sales tax revenue and administration of the Neighborhood and Cultural STAR programs.
Change from 2018 Adopted
321
780: PED Administration
Spending Financing FTE
Current Service Level Adjustments
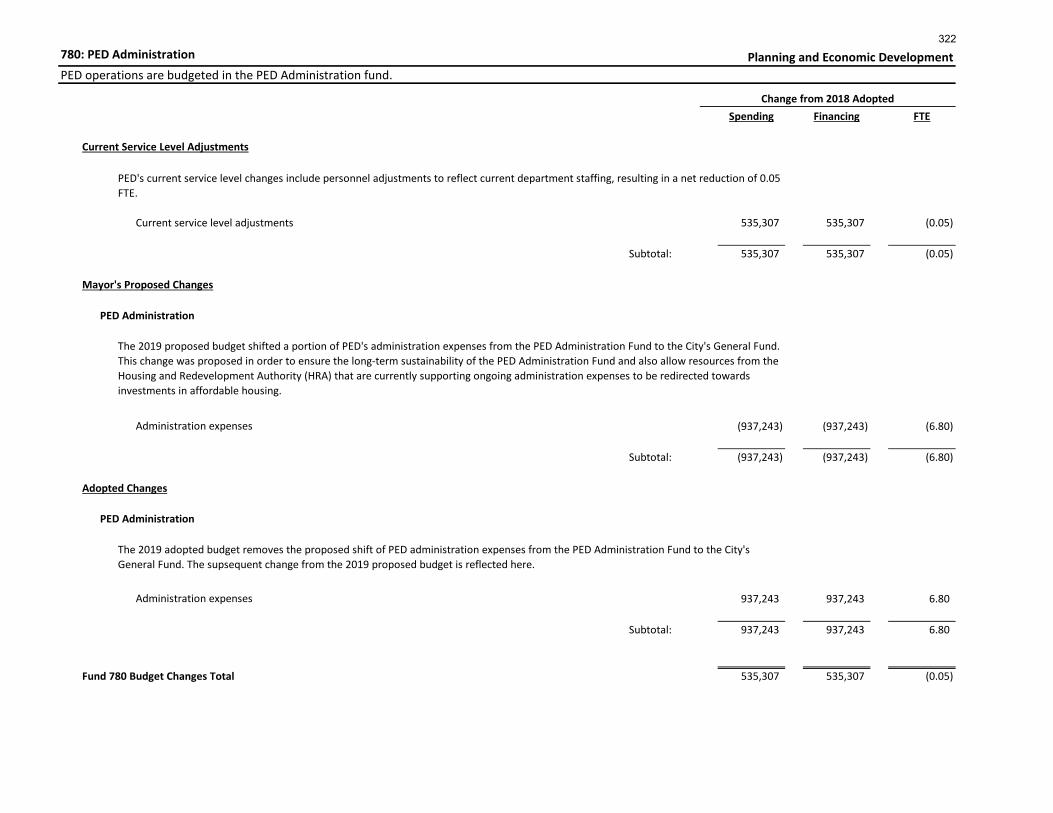
Current service level adjustments 535,307 535,307 (0.05)
Subtotal: 535,307 535,307 (0.05)
Mayor's Proposed Changes
PED Administration
Administration expenses (937,243) (937,243) (6.80)
Subtotal: (937,243) (937,243) (6.80)
Adopted Changes
PED Administration
Administration expenses 937,243 937,243 6.80
Subtotal: 937,243 937,243 6.80
Fund 780 Budget Changes Total 535,307 535,307 (0.05)
The 2019 adopted budget removes the proposed shift of PED administration expenses from the PED Administration Fund to the City's General Fund. The supsequent change from the 2019 proposed budget is reflected here.
The 2019 proposed budget shifted a portion of PED's administration expenses from the PED Administration Fund to the City's General Fund. This change was proposed in order to ensure the long-term sustainability of the PED Administration Fund and also allow resources from the Housing and Redevelopment Authority (HRA) that are currently supporting ongoing administration expenses to be redirected towards investments in affordable housing.
PED's current service level changes include personnel adjustments to reflect current department staffing, resulting in a net reduction of 0.05 FTE.
PED operations are budgeted in the PED Administration fund.
Change from 2018 Adopted
Planning and Economic Development322

Spending Reports 323
CITY OF SAINT PAULDepartment Budget Summary
(Spending and Financing)Department: Budget Year: 2019
2016Actuals
Change From
2018Adopted
2019Adopted
2018Adopted
2017Actuals
PLANNING ECONOMIC DEVELOPMENT
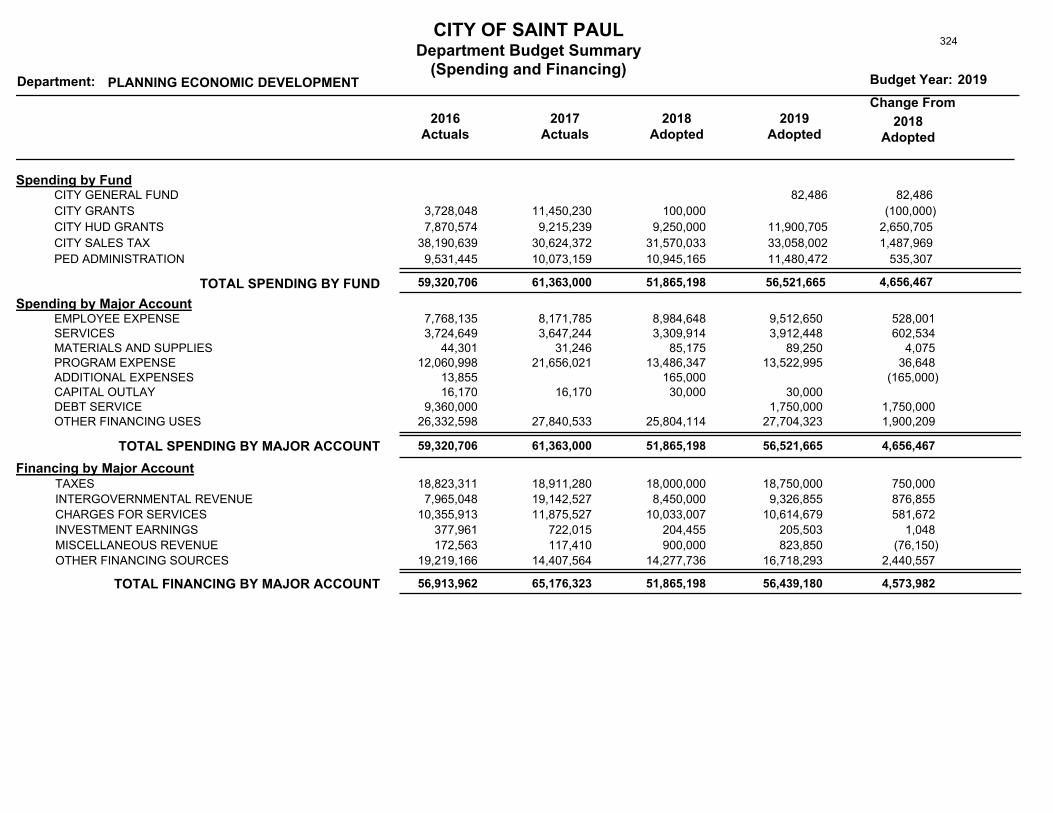
Spending by FundCITY GENERAL FUND 82,486 82,486
CITY GRANTS 3,728,048 11,450,230 100,000 (100,000)
CITY HUD GRANTS 7,870,574 9,215,239 9,250,000 11,900,705 2,650,705
CITY SALES TAX 38,190,639 30,624,372 31,570,033 33,058,002 1,487,969
PED ADMINISTRATION 9,531,445 10,073,159 10,945,165 11,480,472 535,307
TOTAL SPENDING BY FUND 56,521,665 51,865,198 61,363,000 59,320,706 4,656,467
Spending by Major AccountEMPLOYEE EXPENSE 7,768,135 9,512,650 8,984,648 8,171,785 528,001 SERVICES 3,724,649 3,912,448 3,309,914 3,647,244 602,534 MATERIALS AND SUPPLIES 44,301 89,250 85,175 31,246 4,075 PROGRAM EXPENSE 12,060,998 13,522,995 13,486,347 21,656,021 36,648 ADDITIONAL EXPENSES 13,855 165,000 (165,000)CAPITAL OUTLAY 16,170 30,000 30,000 16,170 DEBT SERVICE 9,360,000 1,750,000 1,750,000 OTHER FINANCING USES 26,332,598 27,704,323 25,804,114 27,840,533 1,900,209
TOTAL SPENDING BY MAJOR ACCOUNT 56,521,665 51,865,198 61,363,000 59,320,706 4,656,467
Financing by Major AccountTAXES 18,823,311 18,750,000 18,000,000 18,911,280 750,000
INTERGOVERNMENTAL REVENUE 7,965,048 9,326,855 8,450,000 19,142,527 876,855
CHARGES FOR SERVICES 10,355,913 10,614,679 10,033,007 11,875,527 581,672
INVESTMENT EARNINGS 377,961 205,503 204,455 722,015 1,048
MISCELLANEOUS REVENUE 172,563 823,850 900,000 117,410 (76,150)
OTHER FINANCING SOURCES 19,219,166 16,718,293 14,277,736 14,407,564 2,440,557
TOTAL FINANCING BY MAJOR ACCOUNT 56,439,180 51,865,198 65,176,323 56,913,962 4,573,982
324
CITY OF SAINT PAULSpending Plan by Department
Department:Fund: Budget Year: 2019
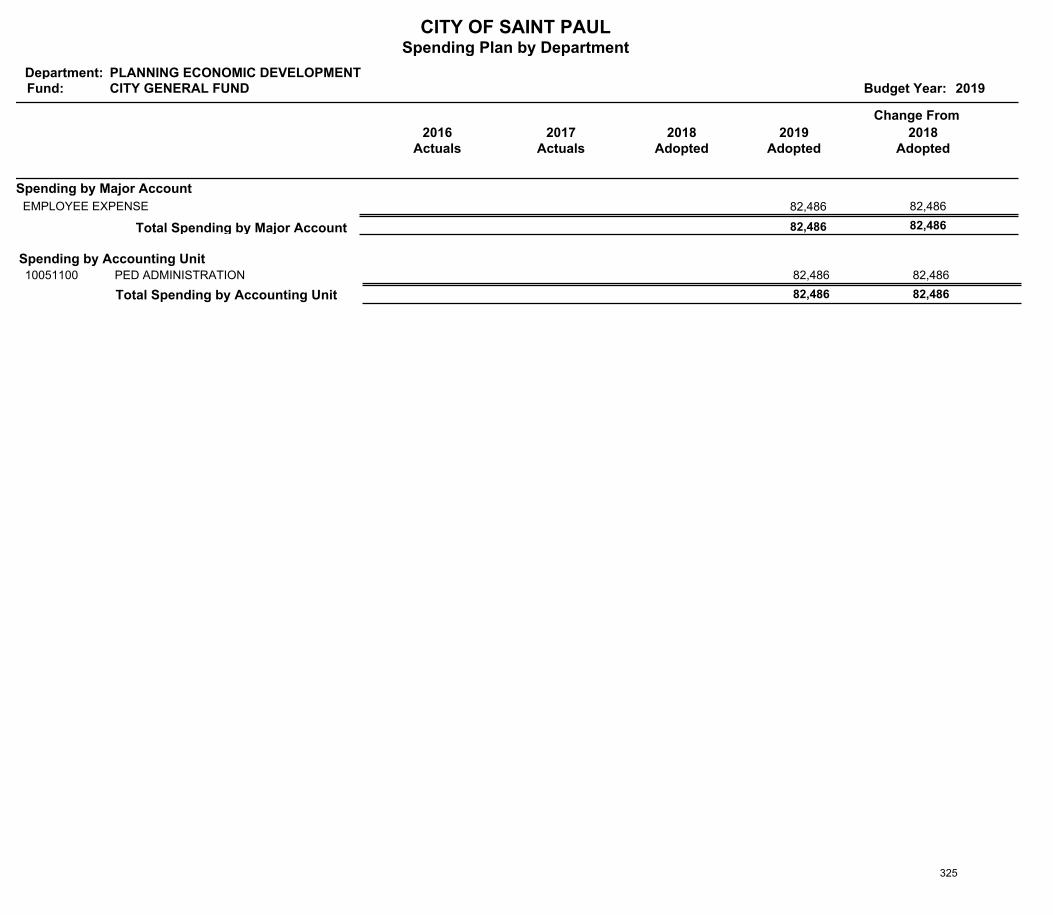
PLANNING ECONOMIC DEVELOPMENTCITY GENERAL FUND
2016Actuals
Change From
2017Actuals
2018Adopted
2019Adopted
2018Adopted
Spending by Major Account
82,486 EMPLOYEE EXPENSE 82,486
82,486 82,486 Total Spending by Major Account
Spending by Accounting UnitPED ADMINISTRATION 82,486 10051100 82,486
Total Spending by Accounting Unit 82,486 82,486
325
CITY OF SAINT PAULSpending Plan by Department
Department:Fund: Budget Year: 2019
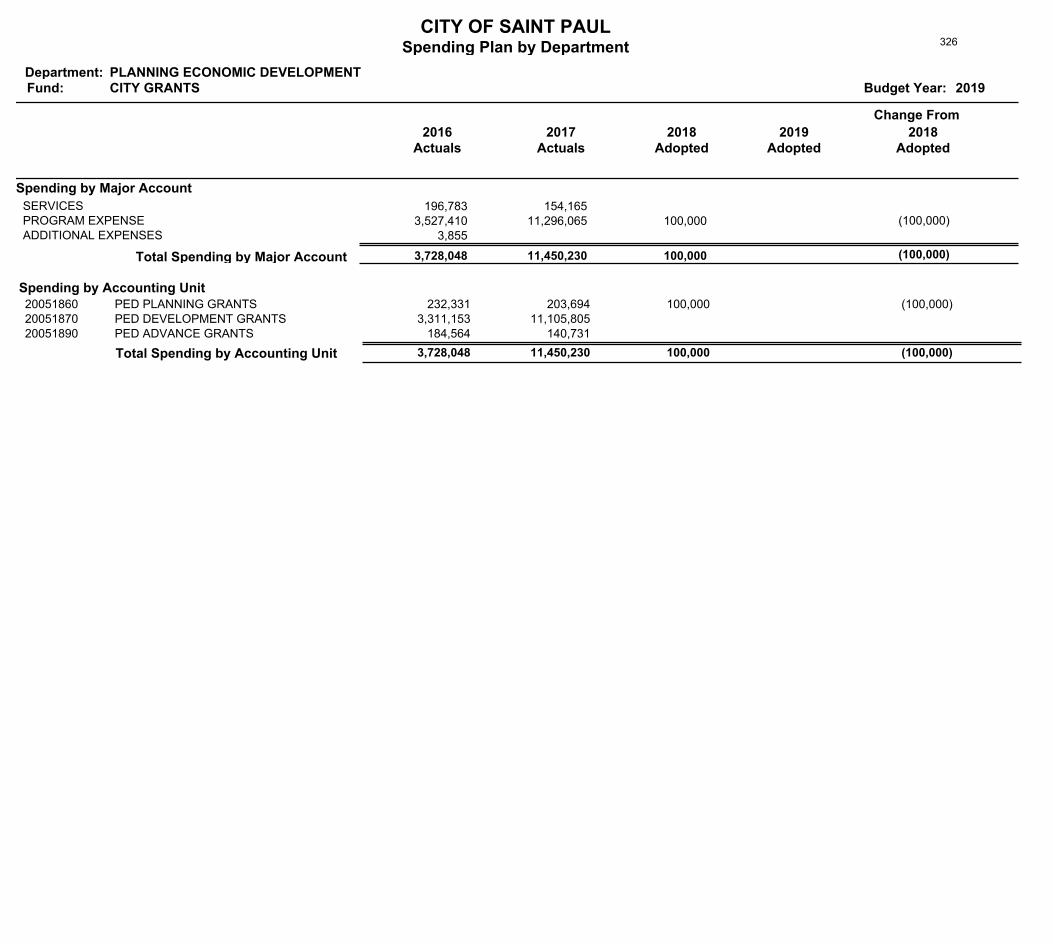
PLANNING ECONOMIC DEVELOPMENTCITY GRANTS
2016Actuals
Change From
2017Actuals
2018Adopted
2019Adopted
2018Adopted
Spending by Major Account
196,783 154,165 SERVICES 3,527,410 11,296,065 100,000 PROGRAM EXPENSE (100,000)
3,855 ADDITIONAL EXPENSES
(100,000) 100,000 11,450,230 3,728,048 Total Spending by Major Account
Spending by Accounting UnitPED PLANNING GRANTS 232,331 100,000 203,694 20051860 (100,000)PED DEVELOPMENT GRANTS 3,311,153 11,105,805 20051870PED ADVANCE GRANTS 184,564 140,731 20051890
Total Spending by Accounting Unit 3,728,048 (100,000) 11,450,230 100,000
326
CITY OF SAINT PAULSpending Plan by Department
Department:Fund: Budget Year: 2019
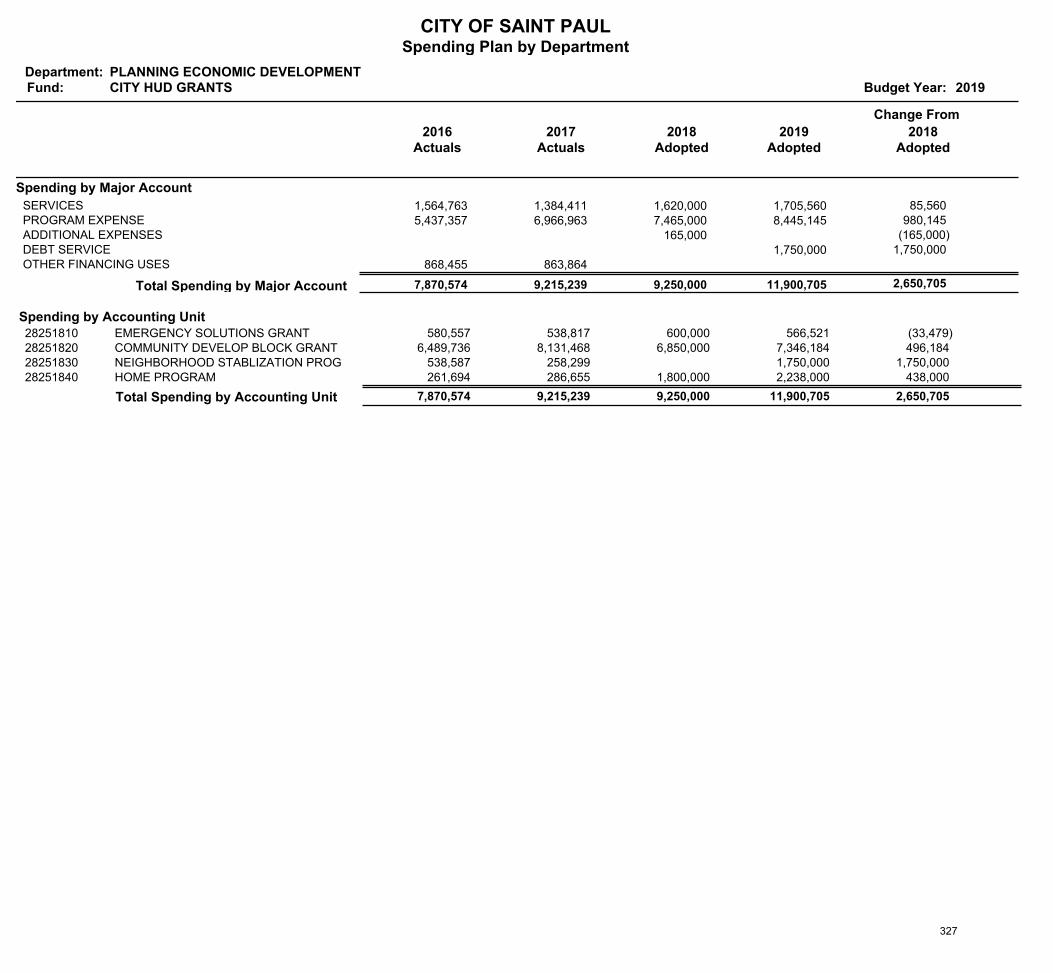
PLANNING ECONOMIC DEVELOPMENTCITY HUD GRANTS
2016Actuals
Change From
2017Actuals
2018Adopted
2019Adopted
2018Adopted
Spending by Major Account
1,564,763 1,384,411 1,620,000 1,705,560 SERVICES 85,560 5,437,357 6,966,963 7,465,000 8,445,145 PROGRAM EXPENSE 980,145
165,000 ADDITIONAL EXPENSES (165,000) 1,750,000 DEBT SERVICE 1,750,000
868,455 863,864 OTHER FINANCING USES
2,650,705 11,900,705 9,250,000 9,215,239 7,870,574 Total Spending by Major Account
Spending by Accounting UnitEMERGENCY SOLUTIONS GRANT 580,557 566,521 600,000 538,817 28251810 (33,479)COMMUNITY DEVELOP BLOCK GRANT 6,489,736 7,346,184 6,850,000 8,131,468 28251820 496,184 NEIGHBORHOOD STABLIZATION PROG 538,587 1,750,000 258,299 28251830 1,750,000 HOME PROGRAM 261,694 2,238,000 1,800,000 286,655 28251840 438,000
Total Spending by Accounting Unit 7,870,574 11,900,705 2,650,705 9,215,239 9,250,000
327
CITY OF SAINT PAULSpending Plan by Department
Department:Fund: Budget Year: 2019
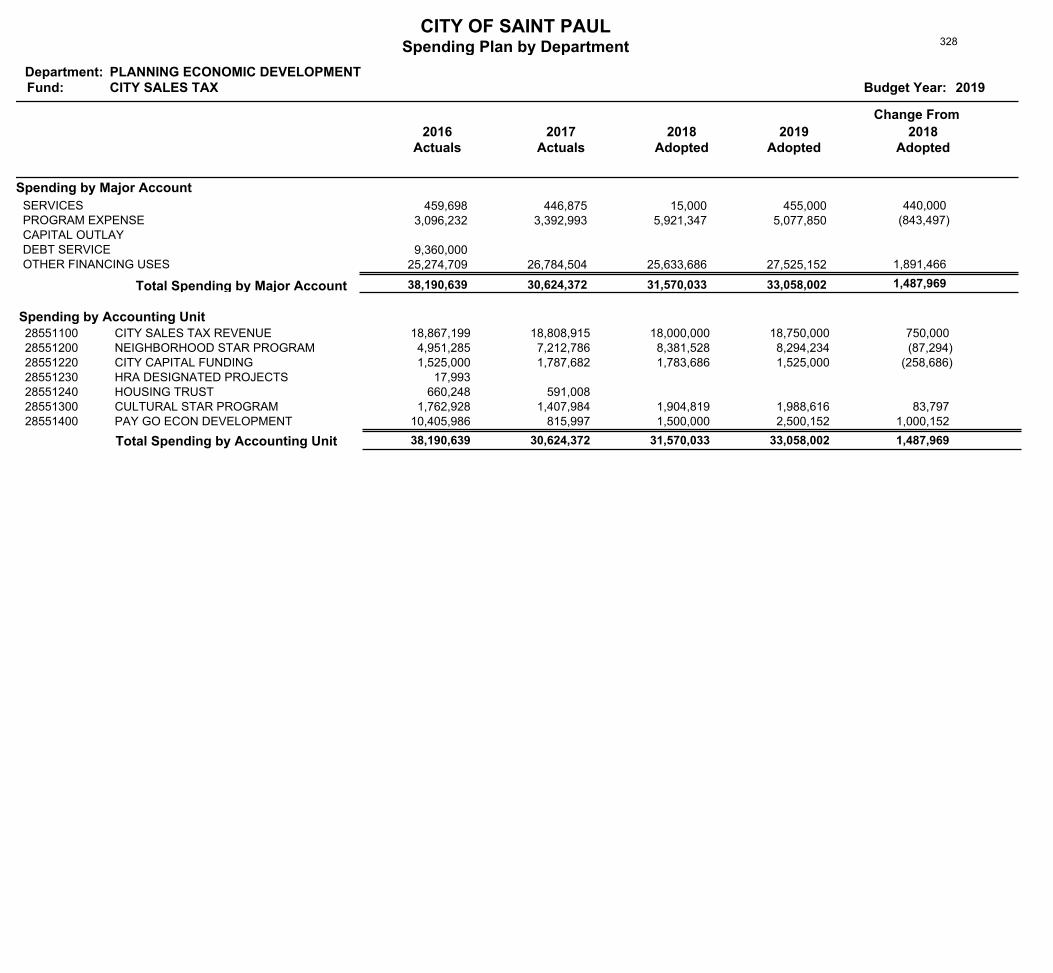
PLANNING ECONOMIC DEVELOPMENTCITY SALES TAX
2016Actuals
Change From
2017Actuals
2018Adopted
2019Adopted
2018Adopted
Spending by Major Account
459,698 446,875 15,000 455,000 SERVICES 440,000 3,096,232 3,392,993 5,921,347 5,077,850 PROGRAM EXPENSE (843,497)
CAPITAL OUTLAY 9,360,000 DEBT SERVICE
25,274,709 26,784,504 25,633,686 27,525,152 OTHER FINANCING USES 1,891,466
1,487,969 33,058,002 31,570,033 30,624,372 38,190,639 Total Spending by Major Account
Spending by Accounting UnitCITY SALES TAX REVENUE 18,867,199 18,750,000 18,000,000 18,808,915 28551100 750,000 NEIGHBORHOOD STAR PROGRAM 4,951,285 8,294,234 8,381,528 7,212,786 28551200 (87,294)CITY CAPITAL FUNDING 1,525,000 1,525,000 1,783,686 1,787,682 28551220 (258,686)HRA DESIGNATED PROJECTS 17,993 28551230HOUSING TRUST 660,248 591,008 28551240CULTURAL STAR PROGRAM 1,762,928 1,988,616 1,904,819 1,407,984 28551300 83,797 PAY GO ECON DEVELOPMENT 10,405,986 2,500,152 1,500,000 815,997 28551400 1,000,152
Total Spending by Accounting Unit 38,190,639 33,058,002 1,487,969 30,624,372 31,570,033
328
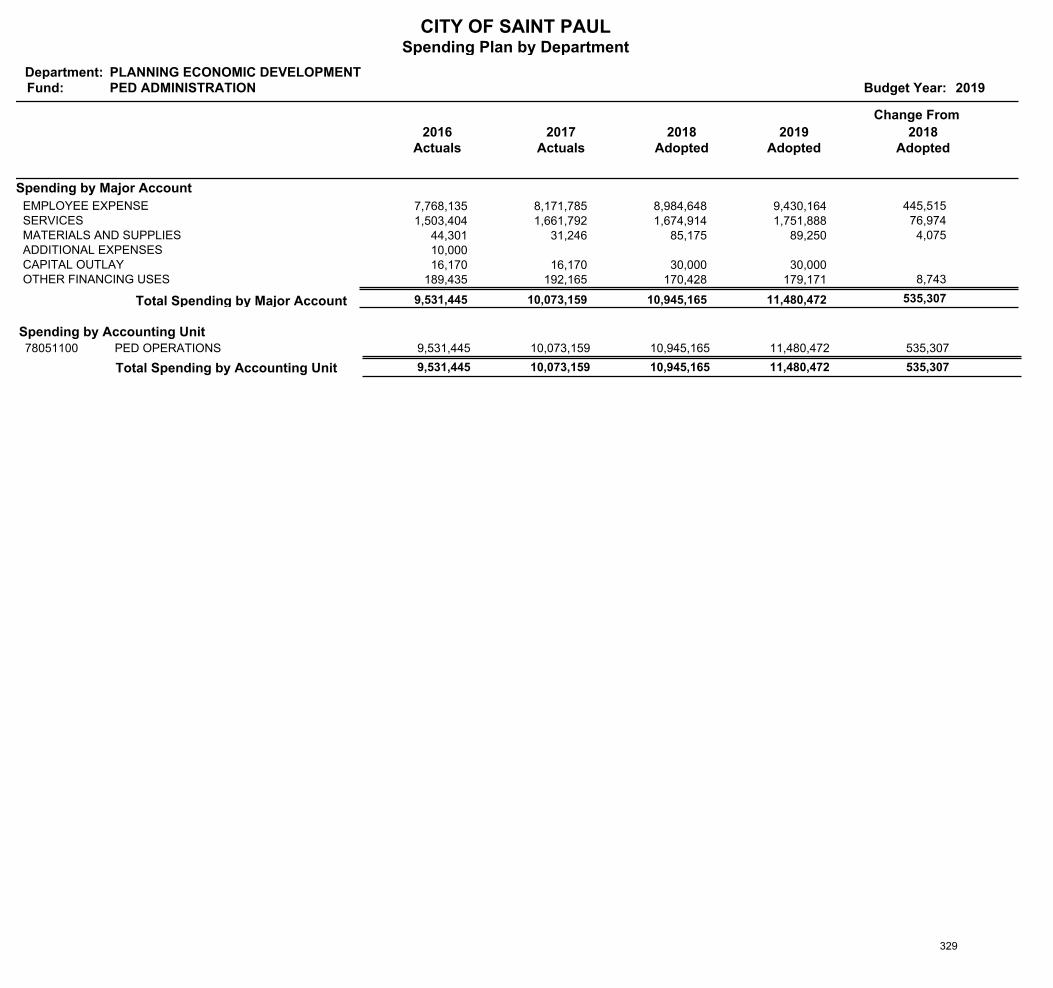
CITY OF SAINT PAULSpending Plan by Department
Department:Fund: Budget Year: 2019
PLANNING ECONOMIC DEVELOPMENTPED ADMINISTRATION
2016Actuals
Change From
2017Actuals
2018Adopted
2019Adopted
2018Adopted
Spending by Major Account
7,768,135 8,171,785 8,984,648 9,430,164 EMPLOYEE EXPENSE 445,515 1,503,404 1,661,792 1,674,914 1,751,888 SERVICES 76,974
44,301 31,246 85,175 89,250 MATERIALS AND SUPPLIES 4,075 10,000 ADDITIONAL EXPENSES 16,170 16,170 30,000 30,000 CAPITAL OUTLAY
189,435 192,165 170,428 179,171 OTHER FINANCING USES 8,743
535,307 11,480,472 10,945,165 10,073,159 9,531,445 Total Spending by Major Account
Spending by Accounting UnitPED OPERATIONS 9,531,445 11,480,472 10,945,165 10,073,159 78051100 535,307
Total Spending by Accounting Unit 9,531,445 11,480,472 535,307 10,073,159 10,945,165
329

�
330
Financing Reports 331
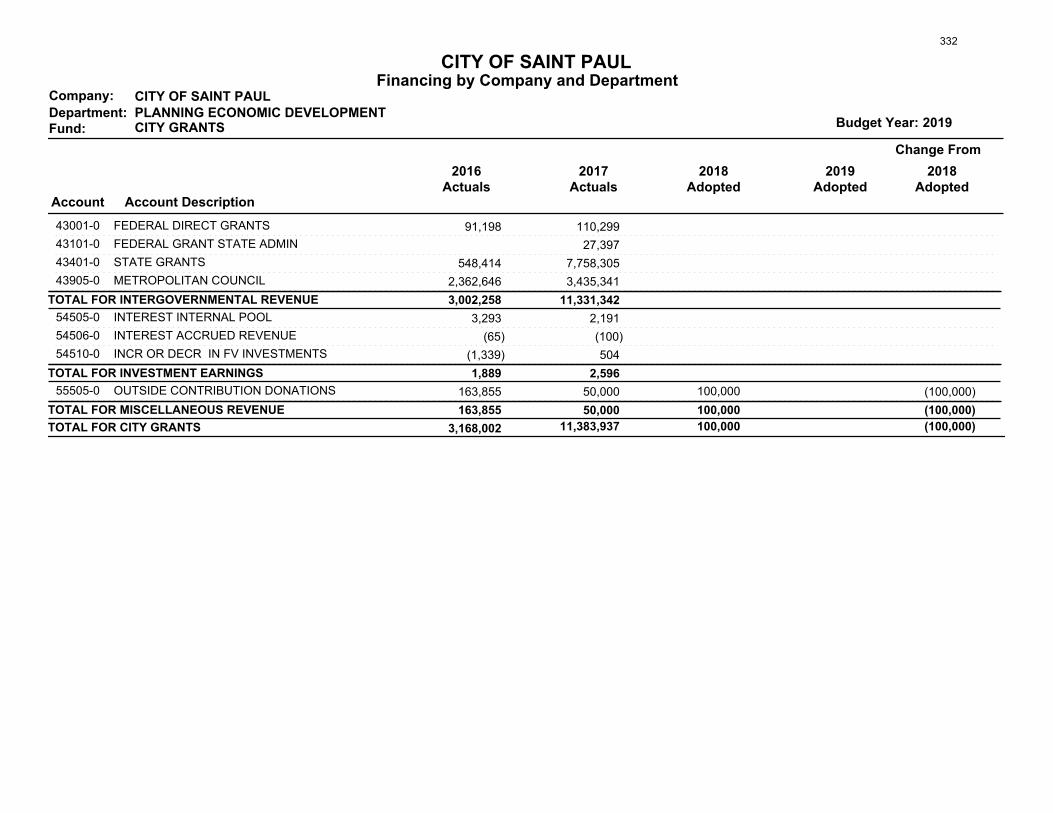
CITY OF SAINT PAULFinancing by Company and Department
Budget Year:
CITY OF SAINT PAULCompany:
Department: PLANNING ECONOMIC DEVELOPMENT
Change From
2018Adopted
2017Actuals
2016Actuals
Account Account Description
2018Adopted
2019Adopted
Fund: CITY GRANTS 2019
FEDERAL DIRECT GRANTS43001-0 91,198 110,299
FEDERAL GRANT STATE ADMIN43101-0 27,397
STATE GRANTS43401-0 548,414 7,758,305
METROPOLITAN COUNCIL43905-0 2,362,646 3,435,341
TOTAL FOR INTERGOVERNMENTAL REVENUE 3,002,258 11,331,342
INTEREST INTERNAL POOL54505-0 3,293 2,191
INTEREST ACCRUED REVENUE54506-0 (65) (100)
INCR OR DECR IN FV INVESTMENTS54510-0 (1,339) 504
TOTAL FOR INVESTMENT EARNINGS 1,889 2,596
OUTSIDE CONTRIBUTION DONATIONS55505-0 (100,000) 163,855 50,000 100,000
(100,000)TOTAL FOR MISCELLANEOUS REVENUE 163,855 50,000 100,000
TOTAL FOR CITY GRANTS 3,168,002 11,383,937 100,000 (100,000)
332
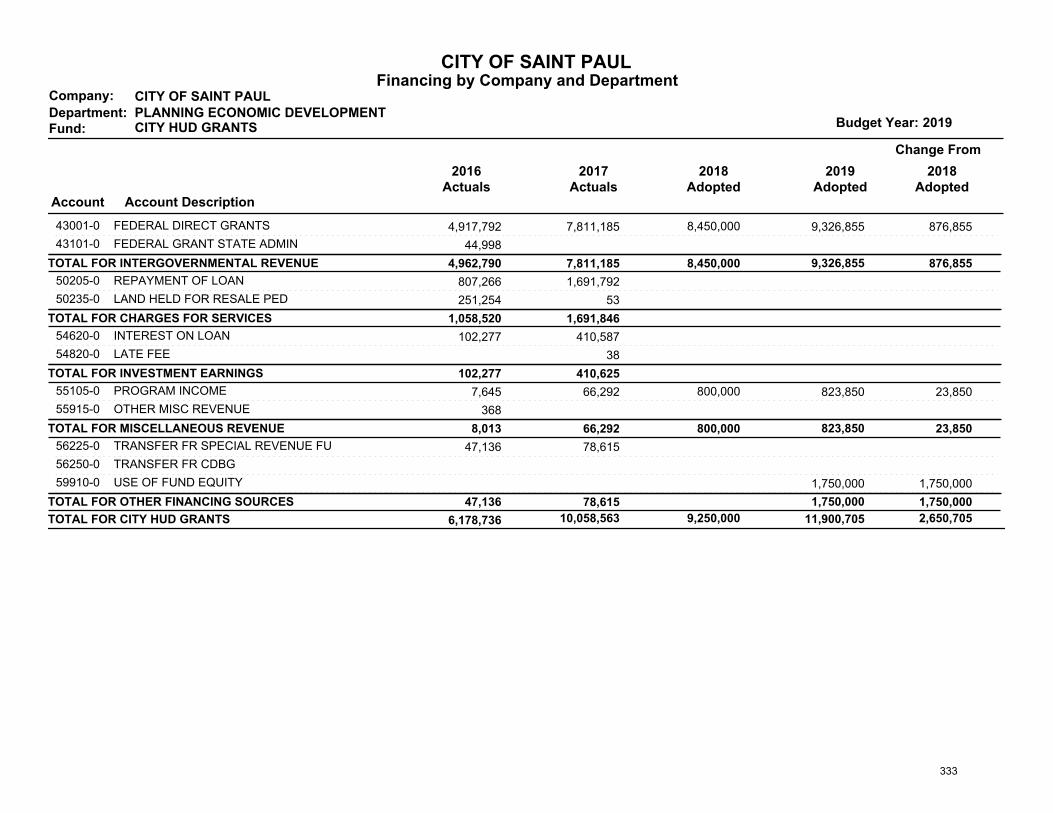
CITY OF SAINT PAULFinancing by Company and Department
Budget Year:
CITY OF SAINT PAULCompany:
Department: PLANNING ECONOMIC DEVELOPMENT
Change From
2018Adopted
2017Actuals
2016Actuals
Account Account Description
2018Adopted
2019Adopted
Fund: CITY HUD GRANTS 2019
FEDERAL DIRECT GRANTS43001-0 876,855 4,917,792 7,811,185 8,450,000 9,326,855
FEDERAL GRANT STATE ADMIN43101-0 44,998
876,855 TOTAL FOR INTERGOVERNMENTAL REVENUE 4,962,790 7,811,185 8,450,000 9,326,855
REPAYMENT OF LOAN50205-0 807,266 1,691,792
LAND HELD FOR RESALE PED50235-0 251,254 53
TOTAL FOR CHARGES FOR SERVICES 1,058,520 1,691,846
INTEREST ON LOAN54620-0 102,277 410,587
LATE FEE54820-0 38
TOTAL FOR INVESTMENT EARNINGS 102,277 410,625
PROGRAM INCOME55105-0 23,850 7,645 66,292 800,000 823,850
OTHER MISC REVENUE55915-0 368
23,850 TOTAL FOR MISCELLANEOUS REVENUE 8,013 66,292 800,000 823,850
TRANSFER FR SPECIAL REVENUE FU56225-0 47,136 78,615
TRANSFER FR CDBG56250-0
USE OF FUND EQUITY59910-0 1,750,000 1,750,000
1,750,000 TOTAL FOR OTHER FINANCING SOURCES 47,136 78,615 1,750,000
11,900,705 TOTAL FOR CITY HUD GRANTS 6,178,736 10,058,563 9,250,000 2,650,705
333
CITY OF SAINT PAULFinancing by Company and Department
Budget Year:
CITY OF SAINT PAULCompany:
Department: PLANNING ECONOMIC DEVELOPMENT
Change From
2018Adopted
2017Actuals
2016Actuals
Account Account Description
2018Adopted
2019Adopted
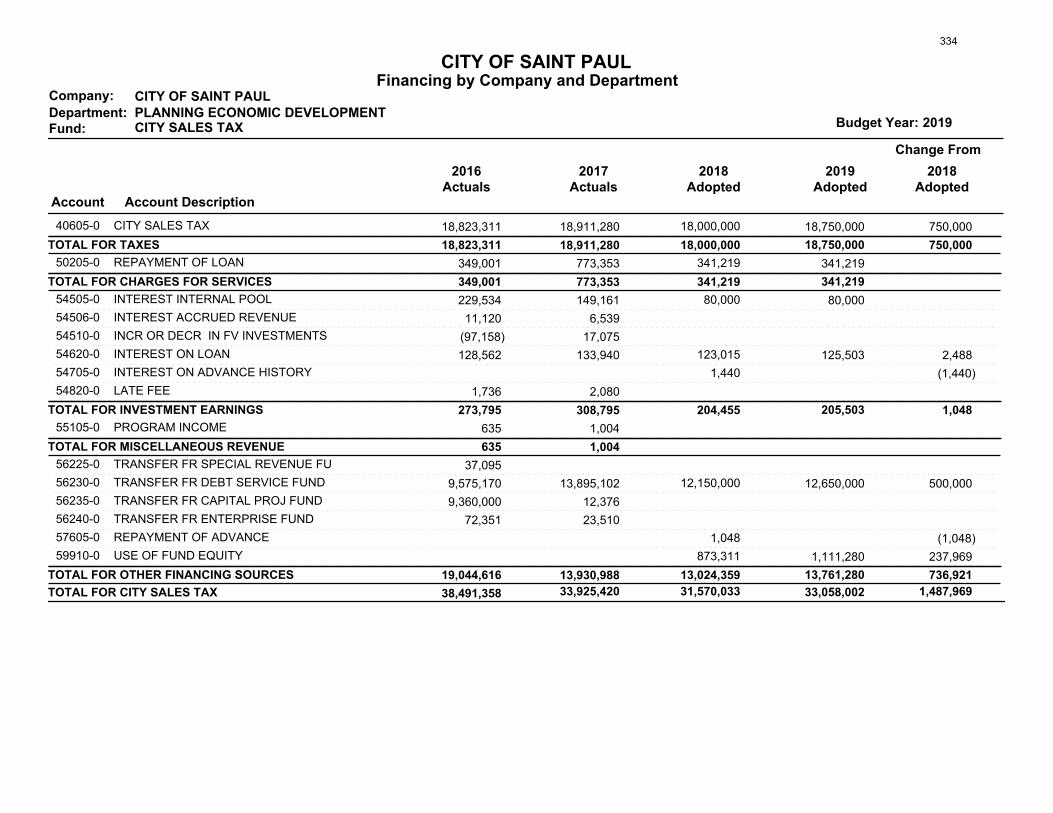
Fund: CITY SALES TAX 2019
CITY SALES TAX40605-0 750,000 18,823,311 18,911,280 18,000,000 18,750,000
750,000 TOTAL FOR TAXES 18,823,311 18,911,280 18,000,000 18,750,000
REPAYMENT OF LOAN50205-0 349,001 773,353 341,219 341,219
TOTAL FOR CHARGES FOR SERVICES 349,001 773,353 341,219 341,219
INTEREST INTERNAL POOL54505-0 229,534 149,161 80,000 80,000
INTEREST ACCRUED REVENUE54506-0 11,120 6,539
INCR OR DECR IN FV INVESTMENTS54510-0 (97,158) 17,075
INTEREST ON LOAN54620-0 2,488 128,562 133,940 123,015 125,503
INTEREST ON ADVANCE HISTORY54705-0 (1,440) 1,440
LATE FEE54820-0 1,736 2,080
1,048 TOTAL FOR INVESTMENT EARNINGS 273,795 308,795 204,455 205,503
PROGRAM INCOME55105-0 635 1,004
TOTAL FOR MISCELLANEOUS REVENUE 635 1,004
TRANSFER FR SPECIAL REVENUE FU56225-0 37,095
TRANSFER FR DEBT SERVICE FUND56230-0 500,000 9,575,170 13,895,102 12,150,000 12,650,000
TRANSFER FR CAPITAL PROJ FUND56235-0 9,360,000 12,376
TRANSFER FR ENTERPRISE FUND56240-0 72,351 23,510
REPAYMENT OF ADVANCE57605-0 (1,048) 1,048
USE OF FUND EQUITY59910-0 237,969 873,311 1,111,280
736,921 TOTAL FOR OTHER FINANCING SOURCES 19,044,616 13,930,988 13,024,359 13,761,280
33,058,002 TOTAL FOR CITY SALES TAX 38,491,358 33,925,420 31,570,033 1,487,969
334
CITY OF SAINT PAULFinancing by Company and Department
Budget Year:
CITY OF SAINT PAULCompany:
Department: PLANNING ECONOMIC DEVELOPMENT
Change From
2018Adopted
2017Actuals
2016Actuals
Account Account Description
2018Adopted
2019Adopted
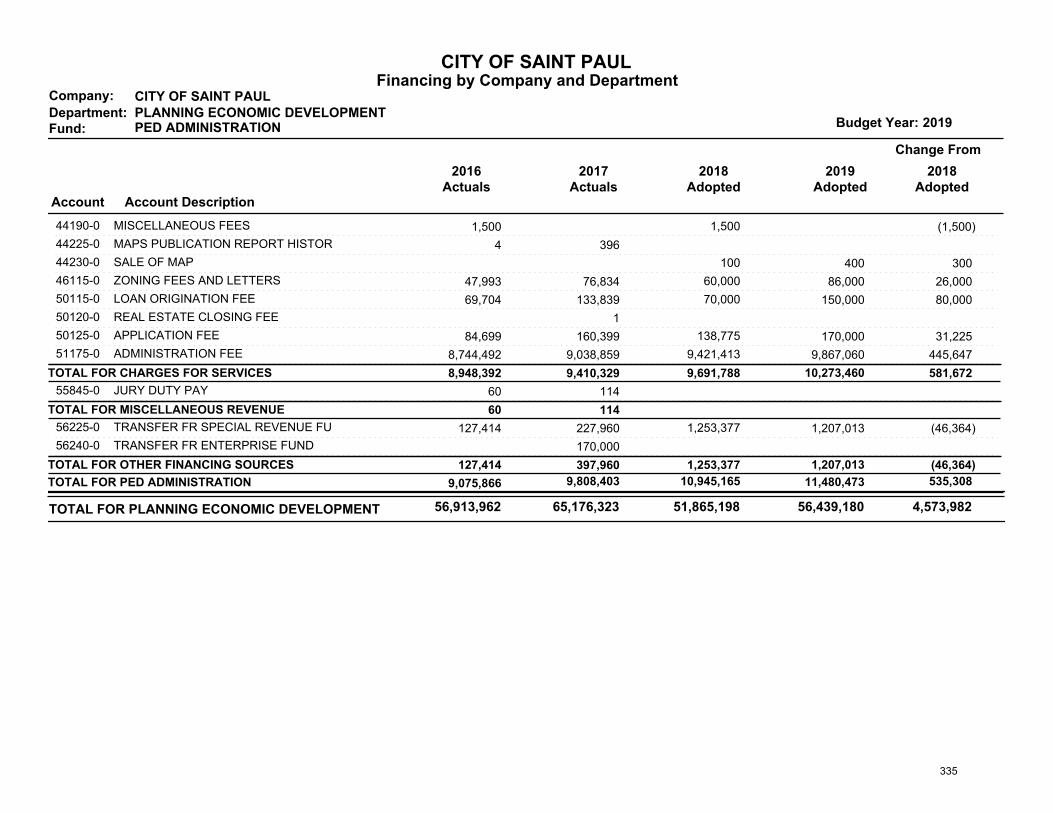
Fund: PED ADMINISTRATION 2019
MISCELLANEOUS FEES44190-0 (1,500) 1,500 1,500
MAPS PUBLICATION REPORT HISTOR44225-0 4 396
SALE OF MAP44230-0 300 100 400
ZONING FEES AND LETTERS46115-0 26,000 47,993 76,834 60,000 86,000
LOAN ORIGINATION FEE50115-0 80,000 69,704 133,839 70,000 150,000
REAL ESTATE CLOSING FEE50120-0 1
APPLICATION FEE50125-0 31,225 84,699 160,399 138,775 170,000
ADMINISTRATION FEE51175-0 445,647 8,744,492 9,038,859 9,421,413 9,867,060
581,672 TOTAL FOR CHARGES FOR SERVICES 8,948,392 9,410,329 9,691,788 10,273,460
JURY DUTY PAY55845-0 60 114
TOTAL FOR MISCELLANEOUS REVENUE 60 114
TRANSFER FR SPECIAL REVENUE FU56225-0 (46,364) 127,414 227,960 1,253,377 1,207,013
TRANSFER FR ENTERPRISE FUND56240-0 170,000
(46,364)TOTAL FOR OTHER FINANCING SOURCES 127,414 397,960 1,253,377 1,207,013
11,480,473 TOTAL FOR PED ADMINISTRATION 9,075,866 9,808,403 10,945,165 535,308
51,865,198 56,439,180 4,573,982 TOTAL FOR PLANNING ECONOMIC DEVELOPMENT 65,176,323 56,913,962
335
CITY OF SAINT PAULFinancing Plan by Department
Department:Fund: Budget Year: 2019
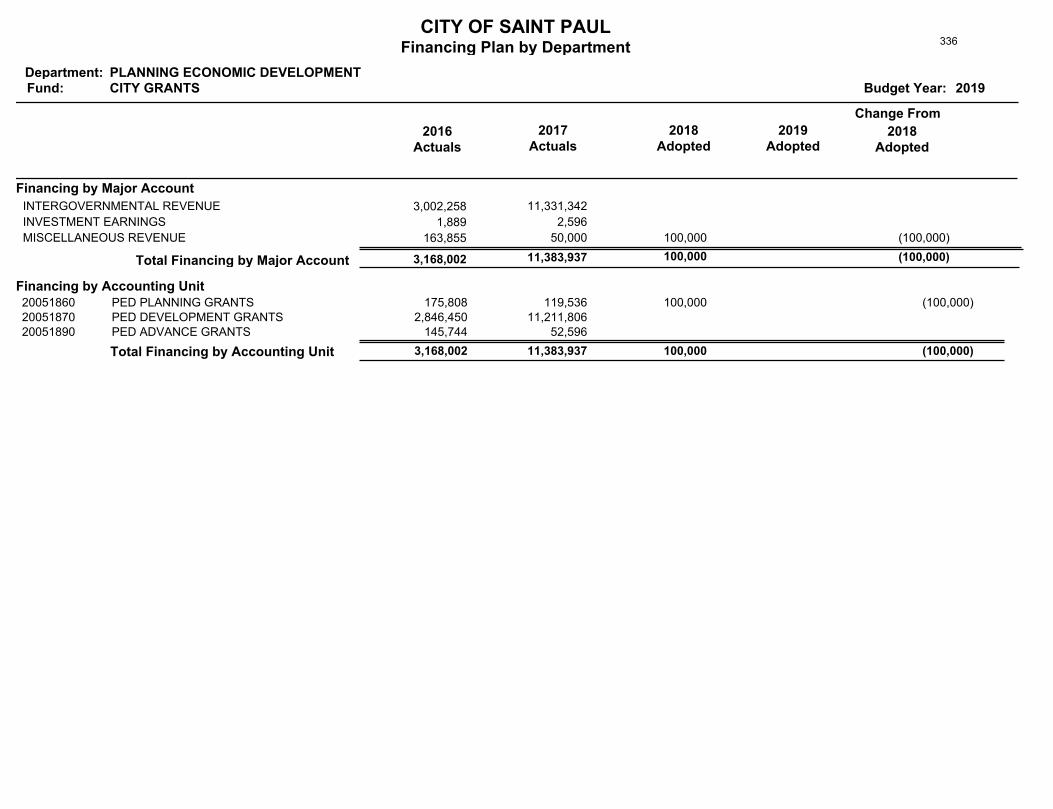
PLANNING ECONOMIC DEVELOPMENTCITY GRANTS
2016Actuals
Change From
2017Actuals
2018Adopted
2019Adopted
2018Adopted
Financing by Major Account
3,002,258 11,331,342 INTERGOVERNMENTAL REVENUE
1,889 2,596 INVESTMENT EARNINGS
163,855 50,000 100,000 MISCELLANEOUS REVENUE (100,000)
(100,000) 100,000 11,383,937 3,168,002 Total Financing by Major Account
Financing by Accounting UnitPED PLANNING GRANTS 175,808 100,000 119,536 20051860 (100,000)PED DEVELOPMENT GRANTS 2,846,450 11,211,806 20051870PED ADVANCE GRANTS 145,744 52,596 20051890
Total Financing by Accounting Unit 3,168,002 (100,000) 11,383,937 100,000
336
CITY OF SAINT PAULFinancing Plan by Department
Department:Fund: Budget Year: 2019
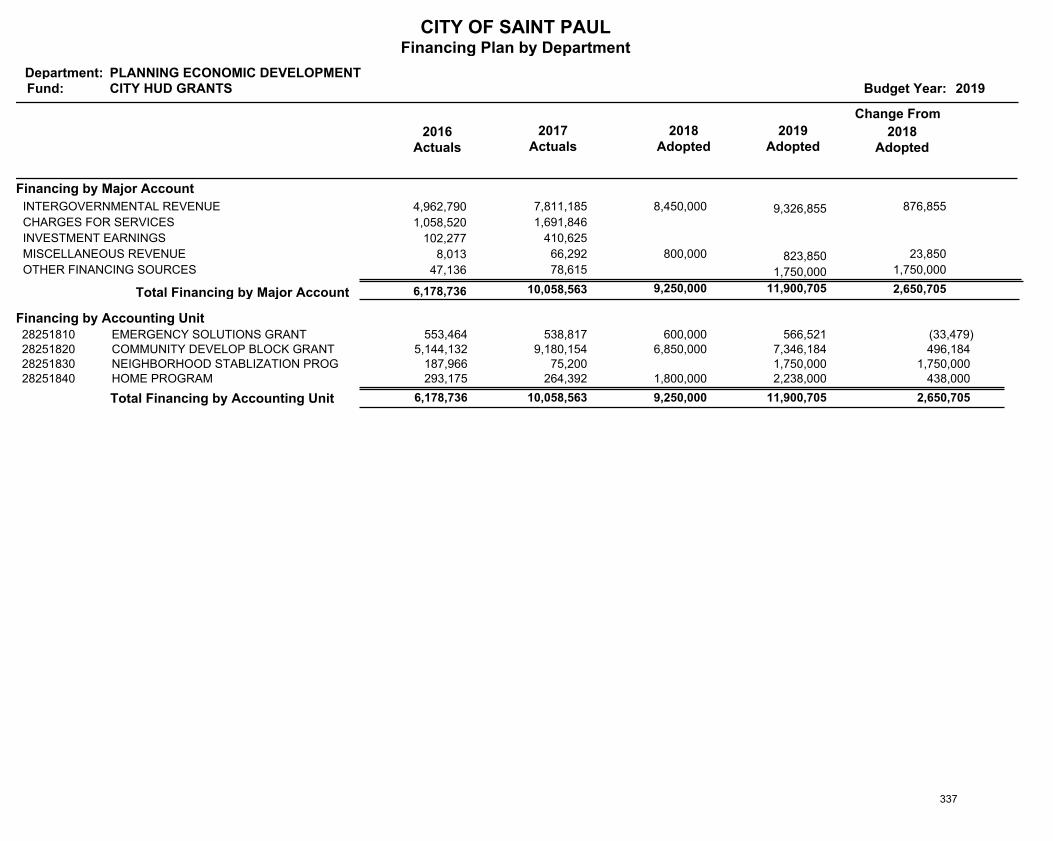
PLANNING ECONOMIC DEVELOPMENTCITY HUD GRANTS
2016Actuals
Change From
2017Actuals
2018Adopted
2019Adopted
2018Adopted
Financing by Major Account
4,962,790 7,811,185 8,450,000 9,326,855 INTERGOVERNMENTAL REVENUE 876,855
1,058,520 1,691,846 CHARGES FOR SERVICES
102,277 410,625 INVESTMENT EARNINGS
8,013 66,292 800,000 823,850 MISCELLANEOUS REVENUE 23,850
47,136 78,615 1,750,000 OTHER FINANCING SOURCES 1,750,000
2,650,705 11,900,705 9,250,000 10,058,563 6,178,736 Total Financing by Major Account
Financing by Accounting UnitEMERGENCY SOLUTIONS GRANT 553,464 566,521 600,000 538,817 28251810 (33,479)COMMUNITY DEVELOP BLOCK GRANT 5,144,132 7,346,184 6,850,000 9,180,154 28251820 496,184 NEIGHBORHOOD STABLIZATION PROG 187,966 1,750,000 75,200 28251830 1,750,000 HOME PROGRAM 293,175 2,238,000 1,800,000 264,392 28251840 438,000
Total Financing by Accounting Unit 6,178,736 11,900,705 2,650,705 10,058,563 9,250,000
337
CITY OF SAINT PAULFinancing Plan by Department
Department:Fund: Budget Year: 2019
PLANNING ECONOMIC DEVELOPMENTCITY SALES TAX
2016Actuals
Change From
2017Actuals
2018Adopted
2019Adopted
2018Adopted
Financing by Major Account
18,823,311 18,911,280 18,000,000 18,750,000 TAXES 750,000
349,001 773,353 341,219 341,219 CHARGES FOR SERVICES
273,795 308,795 204,455 205,503 INVESTMENT EARNINGS 1,048
635 1,004 MISCELLANEOUS REVENUE
19,044,616 13,930,988 13,024,359 13,761,280 OTHER FINANCING SOURCES 736,921
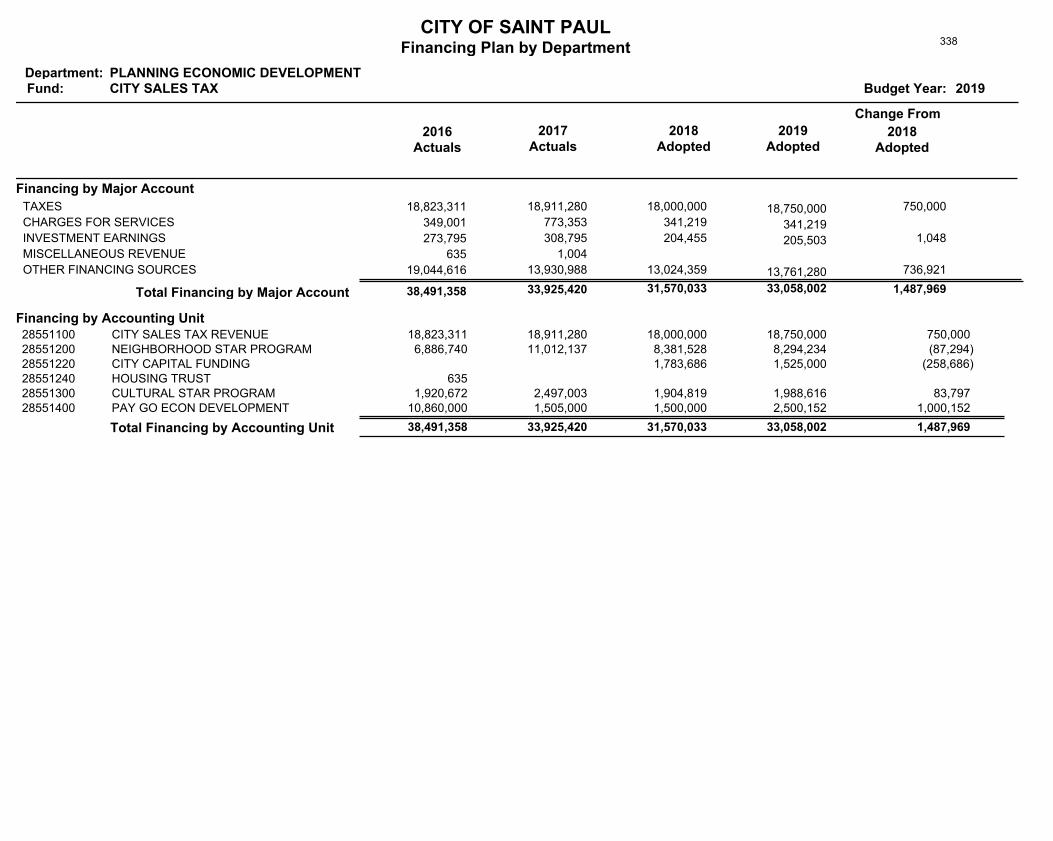
1,487,969 33,058,002 31,570,033 33,925,420 38,491,358 Total Financing by Major Account
Financing by Accounting UnitCITY SALES TAX REVENUE 18,823,311 18,750,000 18,000,000 18,911,280 28551100 750,000 NEIGHBORHOOD STAR PROGRAM 6,886,740 8,294,234 8,381,528 11,012,137 28551200 (87,294)CITY CAPITAL FUNDING 1,525,000 1,783,686 28551220 (258,686)HOUSING TRUST 635 28551240CULTURAL STAR PROGRAM 1,920,672 1,988,616 1,904,819 2,497,003 28551300 83,797 PAY GO ECON DEVELOPMENT 10,860,000 2,500,152 1,500,000 1,505,000 28551400 1,000,152
Total Financing by Accounting Unit 38,491,358 33,058,002 1,487,969 33,925,420 31,570,033
338
CITY OF SAINT PAULFinancing Plan by Department
Department:Fund: Budget Year: 2019
PLANNING ECONOMIC DEVELOPMENTPED ADMINISTRATION
2016Actuals
Change From
2017Actuals
2018Adopted
2019Adopted
2018Adopted
Financing by Major Account
8,948,392 9,410,329 9,691,788 10,273,460 CHARGES FOR SERVICES 581,672
60 114 MISCELLANEOUS REVENUE
127,414 397,960 1,253,377 1,207,013 OTHER FINANCING SOURCES (46,364)
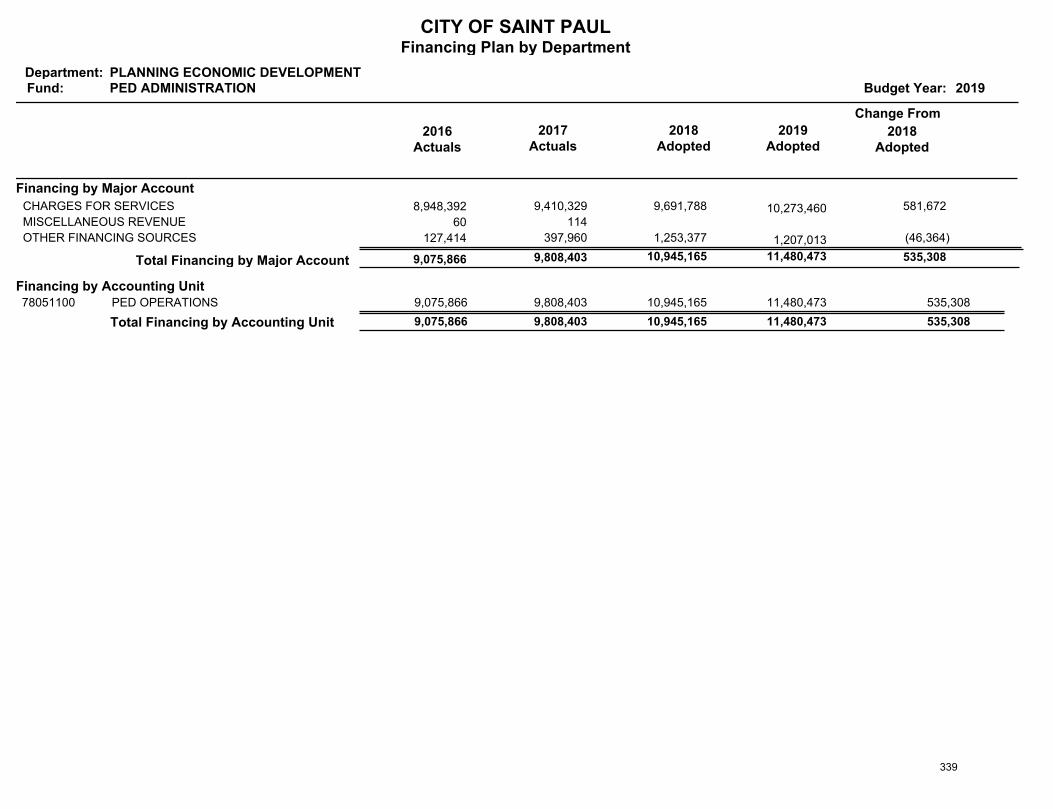
535,308 11,480,473 10,945,165 9,808,403 9,075,866 Total Financing by Major Account
Financing by Accounting UnitPED OPERATIONS 9,075,866 11,480,473 10,945,165 9,808,403 78051100 535,308
Total Financing by Accounting Unit 9,075,866 11,480,473 535,308 9,808,403 10,945,165
339

�
340
Recommended