Copyright © 2007 Improvement Foundation
Planning for Improvement
PDSAs the fun way!!
Chas RyanImprovement Foundation
Copyright © 2008 Improvement Foundation


Thomas Edison
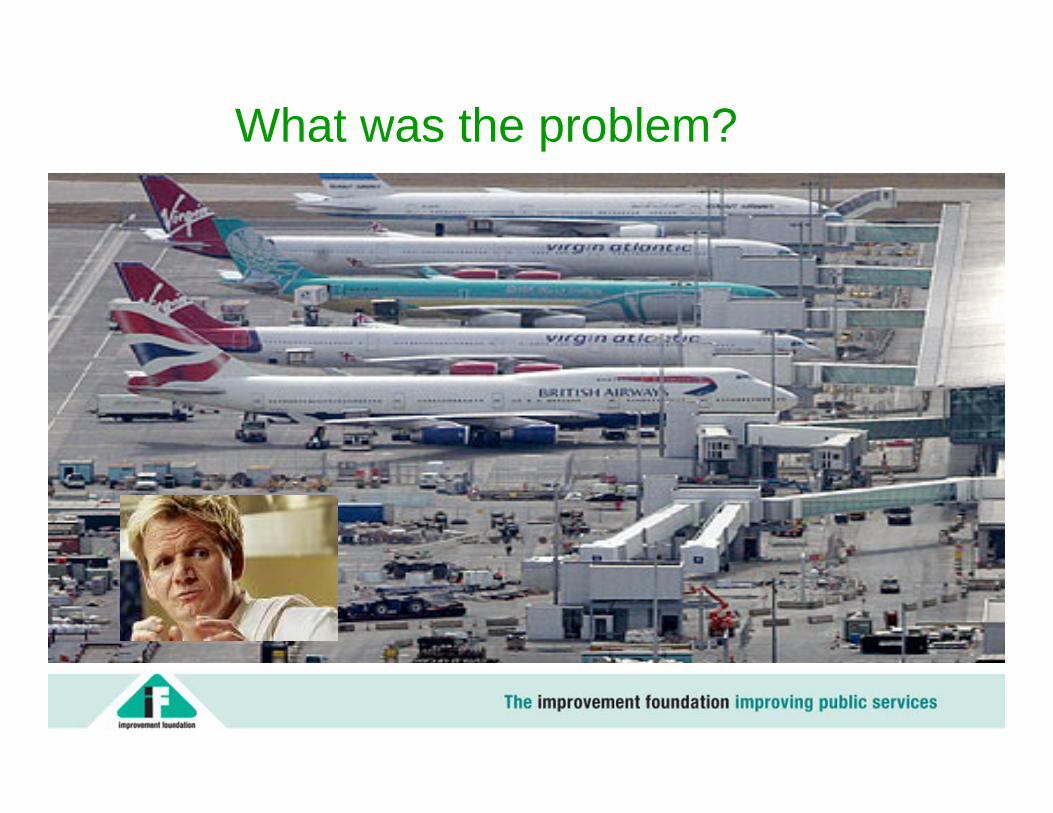
What was the problem?

Fun Easy and Popular!

A Root Cause
• Is the single biggest contributory factor to a systems failure
• Is a fundamental cause, which, if eradicated, will resolve or significantly contribute to the resolution of the problem, widely across a system

Ground Rules
• Everyone must be honest with each other & show respect
• Everyone involved in the event attends the meeting
• No blame, only ‘I’ statements• The event is recalled by each individual involved• These recollections are agreed & documented

Gathering Information
• Information is the lifeblood of knowledge & wisdom
• 60% of the time should be spent information gathering
• Everyone involved in the patient’s care should be included

Multiple Professional Review Meeting
• Invite delegates, explain process• OHP flipcharts• Transpose incident chronology onto wall• Note-pads, pens, different coloured post-its and
blue tack• Refreshments• Facilitator

Root Cause Analysis
• Success is all in the preparation
• Generally people too readily jump to Solutions
• In the long run we pay heavily for not• Defining & Analysing the Problem

Tools For Defining The Problem• 5 Whys• Gap Analysis• Process and Mind Mapping• Ishikawa (Fishbone)• Gathering Information• Pareto Analysis• Brainstorming• Affinity diagram• Tree diagram

Root Cause Analysis
• The 5 Whys• WHY?
WHY?
WHY?WHY?
WHY?
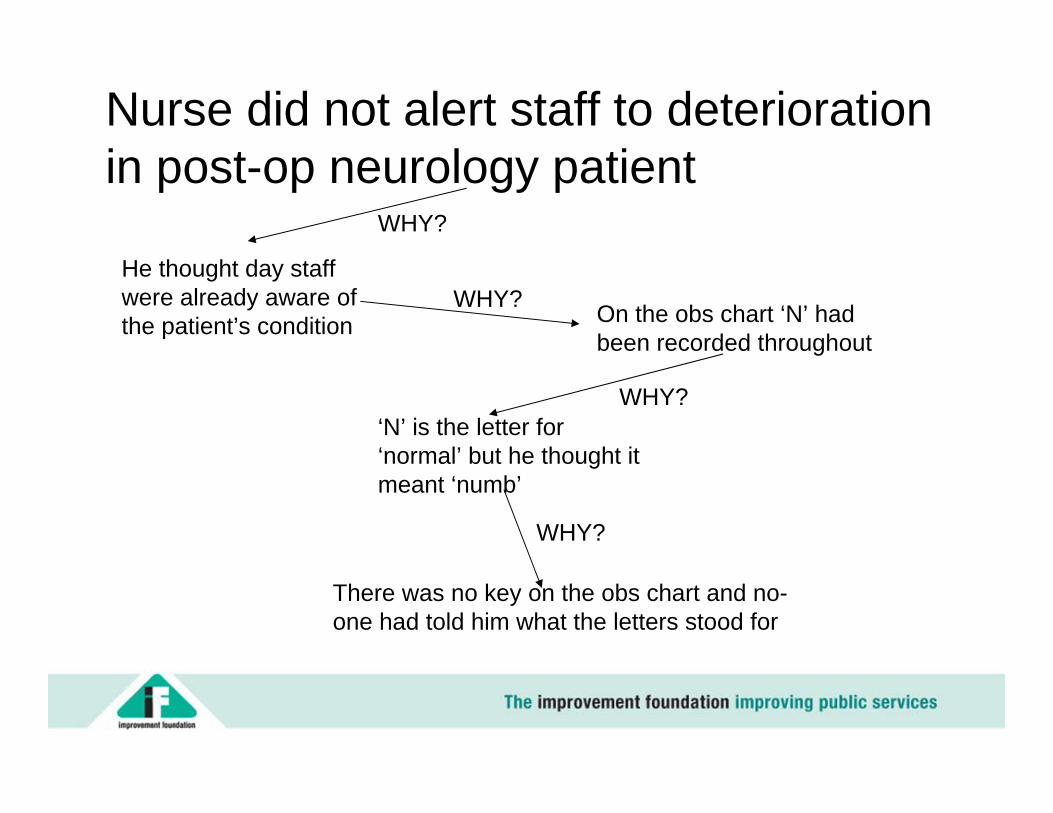
Nurse did not alert staff to deterioration in post-op neurology patient
He thought day staff were already aware of the patient’s condition
WHY?
On the obs chart ‘N’ had been recorded throughout
WHY?‘N’ is the letter for ‘normal’ but he thought it meant ‘numb’
WHY?
There was no key on the obs chart and no-one had told him what the letters stood for
WHY?

Gap Analysis
Clear statement of future desired state, detailed
enough to compare with
present
Assess current situation in relation to
future goals
Analyse the Gap
What do we need to do to get to where we
want to be?
Root Cause Analysis


Root Cause Analysis
• Process Mapping• The patient journey
– Who does what to the patient?– Define which group of patients– Define the scope (beginning and end)– Identify everyone involved– Together, write it down or draw it
• Other (sub-) processes– Transport, – Communication
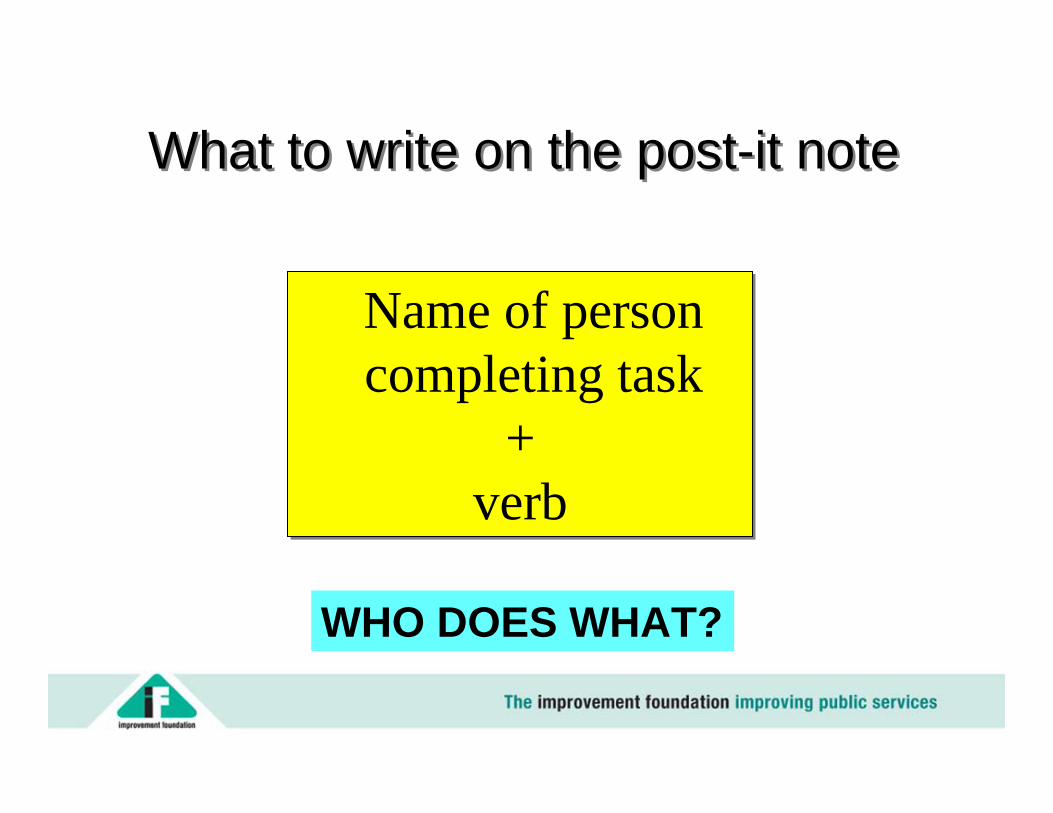
What to write on the post-it noteWhat to write on the post-it note
Name of person completing task
+verb
Name of person completing task
+verb
WHO DOES WHAT?

Step 1
Step 2
Step 3
Step 4
Step 5
Step 6
Step 7
Step 8
Step 1
Step 2
Step 3
Step 4
Step 5
Step 6
Step 7
Step 8
Step 1
Step 3
Step 4
Step 6
Step 8
CurrentFuture Ideal
Directions for elapsed time graph

Process Map re Patient Test Results
Mail Arrives
Mail Collected
Mail delivered to SecretariesAll Mail Date
StampedDoctors gets Investigations
Sec types letter and delivers tray
Secretary picks up tray Doctor checks Test
results and requests notes for letter
Secretary delivers notes
Doctor dictates letter to patient
GP reads and signs letter
Receptionists Manager Secretaries Doctors
If each step were 99% efficient, the process could only be 88% efficient;
if 95%, then only 49%;
if 90%, then only 25%!!
Sec puts letter in Post Box
Receptionist posts Practice mail

Mind Maps ( What can the future look like)

Mind maps
• Encourage Problem Solving by allowing new opportunities.
• See the whole picture• Organise action plans, activities, meetings and
journeys.• Mind maps speak louder than a thousand words• Fun team work

Mind map – Holiday or Shopping

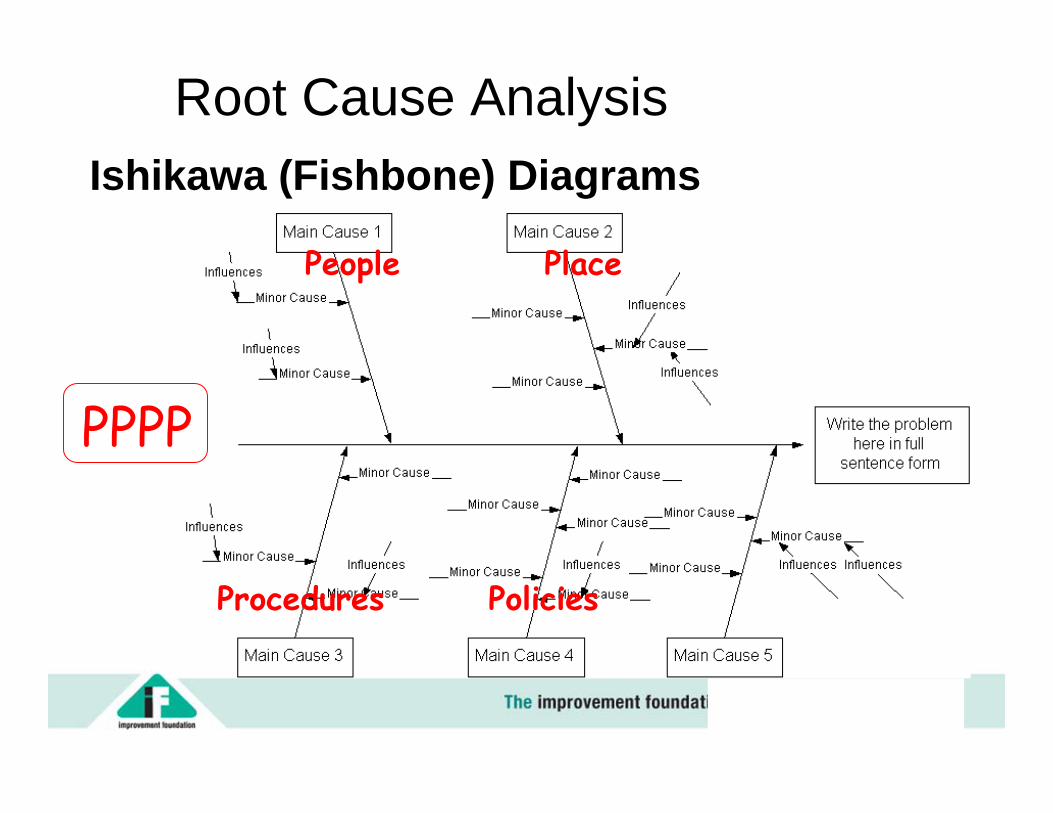
Root Cause AnalysisIshikawa (Fishbone) Diagrams
-- Cause and Effect Diagram --

Root Cause AnalysisIshikawa (Fishbone) Diagrams
Root Cause AnalysisIshikawa (Fishbone) Diagrams
PPPP
People Place
Procedures Policies

Example Cause & Effect Diagram
© 2004 Institute for Healthcare Improvement

Gathering Information • Samples- choosing a representative group to count
rather than everything• Checklist IIII IIII II• Linear scales- having a scale on which to mark a feeling
SAD------------------------------------------HAPPY
• Picture scales☺-------------------- --------------------------
• Lickert scale1- excellent, 2- good, 3- fair, 4- poor
• Survey (of a few cases)

Define the Problem
Pareto Analysis --The 20/80 Rule
20% of Effort 80% of Results

So I decided to gather some information to prove my point …
I was often late starting work- I knew what the problem was-the shower was cold, my wife kept me talking, and she forgot to set the alarm. She said the problem was my late nights and reading the paper.
An Example Of Pareto Analysis

Week 1 2 3 4 5 6 7 8 9 10
11
12
13
14
15
16
17
18
19
20
Alarm 1 0 1 0 1 1 2 0 0 1 1 0 1 0 0 1 1 1 2 0
Toaster fuse 2 1 0 0 0 0 0 0 0 0 0 0 0 0 1 0 0 0 0 0
Slow kettle 1 0 0 0 0 0 0 0 0 0 0 0 0 0 0 0 0 0 0 0
Reading paper 4 4 2 1 2 4 3 3 4 2 2 4 2 1 2 1 1 0 0 0
Talking to spouse 0 1 0 0 0 1 0 0 0 0 0 1 0 0 0 0 0 0 0 0
Late night 2 0 1 0 0 0 1 0 0 0 0 0 0 0 1 0 1 0 0 0
Computer Failed Login
2 0 0 0 0 0 0 0 0 0 0 0 0 0 0 0 0 0 0
Cold shower 2 3 2 1 0 0 2 2 1 1 3 1 2 0 0 2 1 0 0 1
Emergency Visit 0 0 0 0 0 0 0 0 0 0 0 0 0 0 0 0 0 0 0 0
Interrupted by PN 0 1 0 2 0 0 1 0 0 1 0 0 0 1 0 0 0 0 0 0
Reading paper 4 4 2 1 2 4 3 3 4 2

Rank Order the CausesReading Paper 42Cold Shower 24Alarm 14Late Night 6Interruption by P/N 6Toaster Fuse 4Talking to Spouse 3Computer Failed Login 2Slow Kettle 1Emergency Visit 0

Pareto Chart: Causes Of Late StartLate Starting
0
10
20
30
40
50
60
70
80
90
100
1
Causes
Perc
enta
ge
Reading PaperCold ShowerAlarmLate NightInteruption P/NToasterSpouseComputerKettleEmerg Visit

Brainstorming
• Preparation • Ground Rules• Processing the
Results– Affinity Diagram– Multi - voting– Nominal Group
Technique


Generating Solutions
• Involve Patients and Staff• List all recommendations for change and
prioritise for effective implementation• Draw up an Action Plan• Keep It Simple
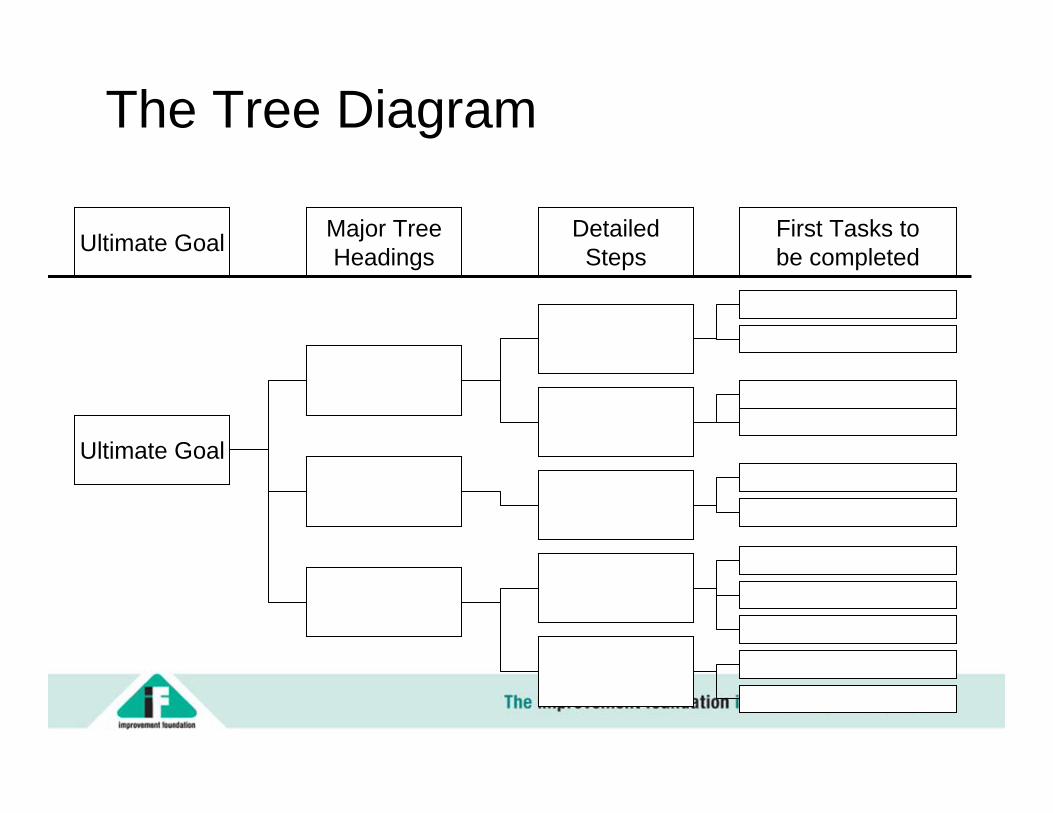
The Tree Diagram
Ultimate Goal First Tasks tobe completed
DetailedSteps
Major TreeHeadings
Ultimate Goal
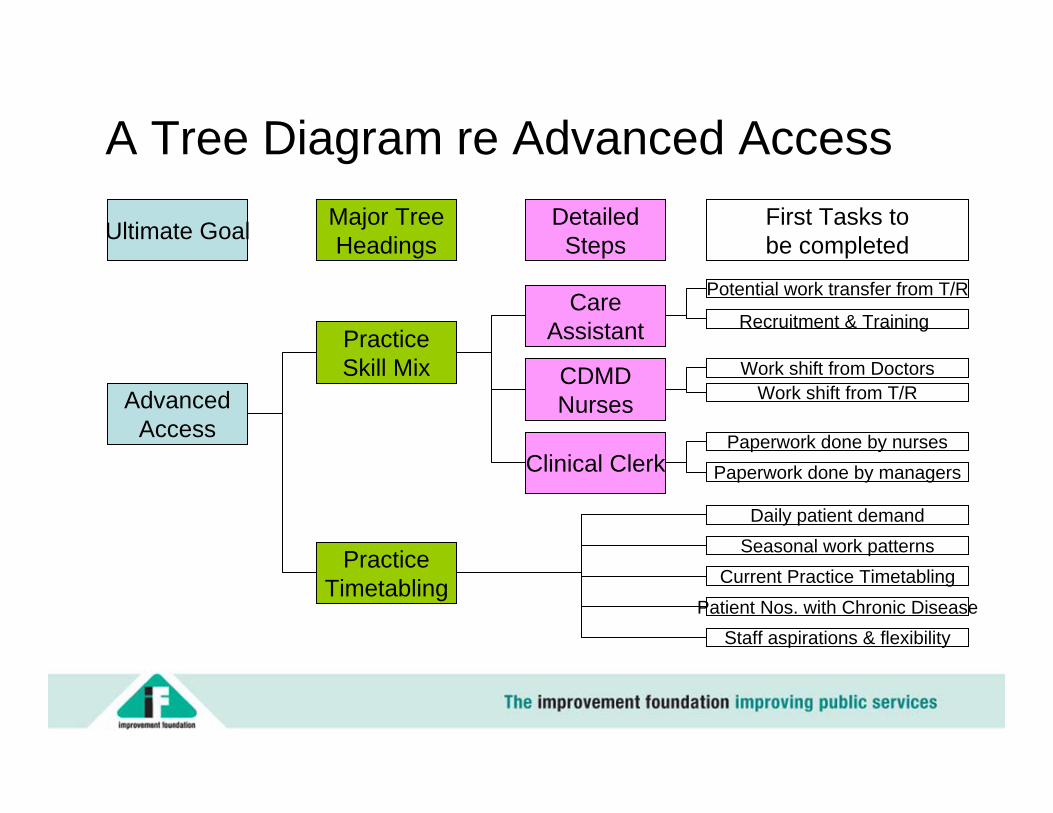
A Tree Diagram re Advanced Access
Ultimate Goal First Tasks tobe completed
DetailedSteps
Major TreeHeadings
Potential work transfer from T/R
Work shift from DoctorsWork shift from T/R
Paperwork done by nursesPaperwork done by managers
Daily patient demand
Current Practice TimetablingSeasonal work patterns
Patient Nos. with Chronic DiseaseStaff aspirations & flexibility
Recruitment & TrainingCare
Assistant
Clinical Clerk
PracticeSkill Mix
PracticeTimetabling
AdvancedAccess
CDMDNurses

Change idea!


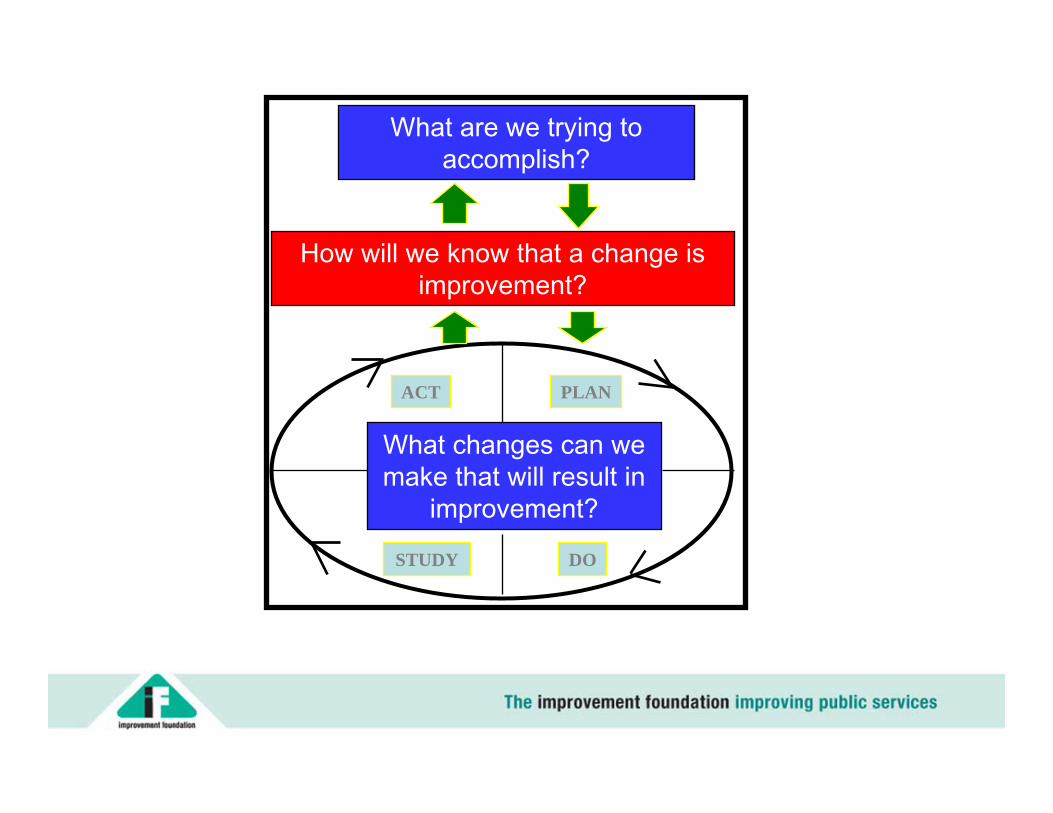
What are we trying to accomplish?
How will we know that a change is improvement?
What changes can we make that will result in
improvement?
ACT PLAN
STUDY DO

Model for ImprovementModel for Improvement
PLAN
DOSTUDY
ACT

Benefits of PDSA approachBenefits of PDSA approach
•• Minimize problems with getting startedMinimize problems with getting started-- persuading the reluctant persuading the reluctant -- bite sized chunks bite sized chunks
•• Enables Enables testingtesting of ideas to:of ideas to:-- evaluate evaluate ‘‘sideside--effectseffects’’-- reduce risks reduce risks -- customise idea for to local conditions customise idea for to local conditions -- identify blindidentify blind--alleys quicklyalleys quickly
•• Makes processes and learning explicitMakes processes and learning explicit... useful for team working... useful for team working
•• Builds momentumBuilds momentum-- demonstrate results to sceptical colleagues demonstrate results to sceptical colleagues -- encouragement and enthusiasmencouragement and enthusiasm

Step 1: Plan
What will you do? who, what, when, where, how)
What do you think will happen
How will you measure the change
How will you collect data

Step 2: Do
Carry out the plan
Document problems and unexpected observations
Collect data

Step 3: Study
Complete data analysis
What has happened?
What have you learnt

Step 4: Act
What changes can be made
How can you improve further
What will be the next cycle

• What do you think the problem is? (outcomes of your brainstorming session)
• Break the problem down - what small test could you put in place?
• How long would I need to test it for?• Think about: what measurement you would put
in place? Remember asking me how I feel is a valid measurement!
B.B. ““PlanPlan”” your first PDSA Team Timeyour first PDSA Team Time

Hints and Tips Hints and Tips -- PDSAPDSA• Keep it simple• Keep it small and manageable• Cycles should happen quickly – think in terms
of a week not a month!• There is no wrong answer, if you find
something works – use it• Write it down! It helps remind you of what you
have already learnt as well as planning the next steps
• Copy and adapt other people’s ideas if you think they may be useful

Hints and tipsHints and tips
Keep your tests as small scale as you can and Keep your tests as small scale as you can and rely on multiple cycles to achieve your aimrely on multiple cycles to achieve your aimPDSAs keep small in volumePDSAs keep small in volumeRemember to measureRemember to measureOne PDSA should lead to anotherOne PDSA should lead to anotherUse PDSAs to build evidenceUse PDSAs to build evidenceRecord your resultsRecord your resultsShare your learningShare your learning

PDSA examplePLAN
Invite 11 patients from COPD register and perform spirometry testing
DO
Letters and telephone calls to known patients
STUDYSTUDY100% attendance100% attendance2 patients discontinue 2 patients discontinue therapy. 1 patient therapy. 1 patient required meds required meds changing, 3 patients no changing, 3 patients no action taken. 1 patient, action taken. 1 patient, increase medication 3 increase medication 3 patients, new treatment. patients, new treatment. 1 patient removed from 1 patient removed from registerregister
ACT
Recall 20 patients and repeat process
What are we trying to accomplish?
How will we know that a change is improvement?
What changes can we make that will result in
improvement?
ACT PLAN
STUDY DO

Model for ImprovementModel for Improvement
PLAN
DOSTUDY
ACT

The success of a test lies in The success of a test lies in what is learned from it, no what is learned from it, no
matter how it turns outmatter how it turns out

Team work will make a difference!

Trying to achieve different results with the same system is the route to insanity.
Einstein

Recommended