Technical Report Documentation Page 1. Report No. FHWA/TX-11/0-6538-1
2. Government Accession No.
3. Recipient's Catalog No.
4. Title and Subtitle PLANNING TOOLS TO ASSESS THE REAL ESTATE LEVERAGING POTENTIAL FOR ROADWAYS AND TRANSIT: TECHNICAL REPORT
5. Report Date October 2010 Published: January 2011 6. Performing Organization Code
7. Author(s) Sharada Vadali, Rafael Aldrete, Arturo Bujanda, Swapnil Samant, Yingfeng Li, Tina Geiselbrecht, Beverly Kuhn, Stacey Lyle, Kyle Dalton, Ming Zhang, and Shaun Tooley
8. Performing Organization Report No. Report 0-6538-1
9. Performing Organization Name and Address Texas Transportation Institute The Texas A&M University System College Station, Texas 77843-3135
10. Work Unit No. (TRAIS) 11. Contract or Grant No. Project 0-6538
12. Sponsoring Agency Name and Address Texas Department of Transportation Research and Technology Implementation Office P.O. Box 5080 Austin, Texas 78763-5080
13. Type of Report and Period Covered Technical Report: September 2009–November 2010 14. Sponsoring Agency Code
15. Supplementary Notes Project performed in cooperation with the Texas Department of Transportation and the Federal Highway Administration. Project Title: Planning Tools to Assess the Real Estate Leveraging Potential for Roadways and Transit URL: http://tti.tamu.edu/documents/0-6538-1.pdf 16. Abstract A funding crisis exists for financing much needed transportation infrastructure projects across the nation and Texas is no exception. Texas has responded to the crisis by passing several bills allowing innovative financing and alternative options for project financing. Among these is Senate Bill 1266 (SB1266), which is a landmark legislation and was passed in 2007 as part of the 80th Legislature to provide the legal backdrop for the creation of the Transportation Reinvestment Zone (TRZ) to facilitate value capture of the tax increment from a future transportation project. This research aimed to provide various mechanisms to augment the implementation and understanding of SB1266 provisions across the state of Texas including but not limited to documenting the current understanding and knowledge of the legislative provisions, compilation of actual implementation case examples, development of standardized methods for screening, TRZ development and revenue assessments, and also presents the results of a workshop held to augment the understanding of TRZ for highway projects. An additional section of this research explores the implications of SB1266 for transit finance and discusses this aspect within the larger context for innovative finance of all transit infrastructure both those on the state highway systems and off. Finally, specific recommendations to the legal framework are made in the light of specific objectives of the research both for highways and transit in regard to the use of increment based finance. 17. Key Words Value Capture, Highway Projects, Transit Projects, Transportation Reinvestment Zones, Innovative Finance, Land Development
18. Distribution Statement No restrictions. This document is available to the public through NTIS: National Technical Information Service Springfield, Virginia 22161 http://www.ntis.gov
19. Security Classif.(of this report) Unclassified
20. Security Classif.(of this page) Unclassified
21. No. of Pages 222
22. Price
Form DOT F 1700.7 (8-72) Reproduction of completed page authorized

PLANNING TOOLS TO ASSESS THE REAL ESTATE LEVERAGING POTENTIAL FOR ROADWAYS AND TRANSIT: TECHNICAL REPORT
by
Sharada Vadali, Ph.D. Associate Research Scientist
Texas Transportation Institute Texas A&M University System
Rafael Manuel Aldrete, Ph.D.
Research Engineer Texas Transportation Institute
Texas A&M University System
Arturo Bujanda Associate Research Specialist Texas Transportation Institute
Texas A&M University System
Swapnil Samant
Software Applications Developer III Texas Transportation Institute
Texas A&M University System
Yingfeng Li Assistant Research Scientist
Texas Transportation Institute Texas A&M University System
Tina Geiselbrecht
Assistant Research Scientist Texas Transportation Institute
Texas A&M University System
Beverly Kuhn, Ph.D., P.E Senior Research Engineer
Texas Transportation Institute Texas A&M University System
Stacey Lyle, Ph.D.
Kyle Dalton Texas A&M University-Corpus Christi
Ming Zhang, Ph.D.
Shaun Tooley Center for Transportation Research,
University of Texas at Austin
Report 0-6538-1 Project 0-6538
Performed in cooperation with the
Texas Department of Transportation and the
Federal Highway Administration
October 2010 Published: January 2011
TEXAS TRANSPORTATION INSTITUTE
The Texas A&M University System College Station, Texas 77843-3135

v
DISCLAIMER
This research was performed in cooperation with the Texas Department of Transportation
(TxDOT) and the Federal Highway Administration (FHWA). The contents of this report reflect
the views of the authors, who are responsible for the facts and the accuracy of the data presented
herein. The contents do not necessarily reflect the official view or policies of the FHWA or
TxDOT. This report does not constitute a standard, specification, or regulation. The researchers
in charge of the overall project were Sharada Vadali and Rafael Manuel Aldrete.
vi
ACKNOWLEDGMENTS
This project was conducted in cooperation with TxDOT and FHWA. The authors
gratefully acknowledge the contributions of numerous persons who made the successful
completion of this report possible. Thanks are extended to the Texas Transportation Institute
(TTI) Advisory Team: Linda Cherrington. Special thanks go to Michelle Young and TTI
Communications Staff for their editorial help. Special thanks are extended to TxDOT for
support of this research project. The researchers also acknowledge the following members of the
project monitoring committee, for their leadership, time, efforts, and contributions: Project Director
• Gerardo Leos, P.E., El Paso District, TxDOT Technical Advisory Panel
• Jim Patterson, TxDOT • Charles Gurganus, TxDOT • Melissa Montemayor, TxDOT • Armida Sagaribay, TxDOT • Eduardo Calvo, TxDOT • Wayne Wells, TxDOT • Lucio Vasquez, Texas Turnpike Authority
RTI Engineer
• Duncan Stewart, Ph.D., P.E., Research and Technology Implementation Office, TxDOT Contract Specialist
• Frank Espinosa, Research and Technology Implementation Office, TxDOT Special thanks also go to the numerous agencies and individuals for their support, cooperation, and contributions to this research. This set of individuals and agencies include:
• Teresa Quesada, City of El Paso, TX • Alan Schubert, City of El Paso, TX • Dennis Burleson, Chairman, Hidalgo County Regional Mobility Authority • Brian Brooks, City of Forney, TX • Capital Area Metropolitan Planning Organization; City of Austin • Regional Mobility Authorities • Raymond Telles, Camino Real Regional Mobility Authority • Bryan Cassidy, Locke, Lord, Bissell, & Lidell, LLP • Senator Pickett, Chair of the House Transportation Committee • Jane Shang, City of El Paso, TX • Workshop Participants • City of Houston
vii
• City of San Antonio • City of Dallas • Via Metro • Dallas Area Rapid Transit • Houston Metro • Mr. Michael Chamberlain, TxDOT • Barbara Zektick, Maryland DOT • Jonathan Lane, City of San Antonio Tax Increment Finance Program • Tim Douglas, City of Houston Economic Development and TIRZ program • David Hawes, Principal, HawesHillCalderon LLP • Texas Municipal League • Texas Association of Counties and other survey participants

ix
TABLE OF CONTENTS
Page List of Figures .............................................................................................................................. xii List of Tables .............................................................................................................................. xiii Chapter 1: Background and Introduction .................................................................................. 1
Introduction ................................................................................................................................. 1 Value Capture as a Public Private Partnership ........................................................................... 2 Value Capture Legal Framework for Texas Transportation Projects ......................................... 3
TIRZ Code .............................................................................................................................. 4 Senate Bill 1266 ...................................................................................................................... 5
Bill Analysis – SB1266 ............................................................................................................... 5 Summary Analysis of SB1266 Text ....................................................................................... 5 Institutional and Municipal Financing Implications of SB1266 ............................................. 7
Types of Transportation Reinvestment Zones ............................................................................ 9 Municipal TRZ........................................................................................................................ 9 County TRZ .......................................................................................................................... 10 TRZ Duration and Surplus .................................................................................................... 10 TRZ and Taxes ...................................................................................................................... 11
Conceptual Flow of Funds under SB1266 ................................................................................ 11 Review of Amendments to SB1266 Proposed during the 81st Legislative Session ................. 12
Senate Bill 2096: TRZ and Urban Transportation Authorities ............................................. 13 Senate Bill 2378: Decoupling the Pass-Through Link to TRZ ............................................. 13 Senate Bill 898: TRZ, Rail, and Freight Infrastructure ........................................................ 13 Senate Bill 1671: TRZ Surplus Funds Use ........................................................................... 13 House Bill 300: TRZ, Rail Projects, Use of Surplus Funds, and Boundary Changes .......... 13
TRZ Implementation for Highways .......................................................................................... 13 Comparison with Tax-Increment-Finance and Tax-Increment-Reinvestment Zones .......... 13 The TIF Process .................................................................................................................... 18
TRZ – Spatial Extent and Boundaries for Contiguity Definitions ............................................ 25 TRZ – Implementation Examples and State of the Practice in Texas ...................................... 27
The City of El Paso TRZ ...................................................................................................... 30 The City of Forney, TX ........................................................................................................ 34 The Hidalgo County TRZ ..................................................................................................... 35
Chapter 2: Senate Bill 1266 – Implementer Perspectives and General Awareness .............. 37 County and Municipal TRZs .................................................................................................... 38
Administration: County TRZ and Road Utility Districts ...................................................... 38 Percent Increment Allocations for Municipal TRZs ............................................................. 38
TRZ Boundary Adjustments and Contiguity requirements ...................................................... 39 Coupling to Pass-Through ........................................................................................................ 39 TxDOT’s Role as Perceived by Interviewees ........................................................................... 40 Revenue Risk Allocation .......................................................................................................... 41 TRZ and SB1266 – General Awareness across Texas Cities and Counties ............................. 41 TRZ and SB1266 – General Awareness within Regional Mobility Authorities ...................... 43
x
Chapter 3: TRZ Conceptual Framework and Procedures for TRZ Planning, Development, and Implementation ........................................................................................... 45
TRZ Implementation ................................................................................................................. 46 Initiation ................................................................................................................................ 46 Data and Information Needs to Support Initiation ................................................................ 47 Zone Formulation .................................................................................................................. 48 Adoption of TRZ................................................................................................................... 50 Implementation ..................................................................................................................... 50 Monitoring and Evaluation ................................................................................................... 51
TRZ Decision Making Tools .................................................................................................... 52 Chapter 4: TRZ Development Decision Making Tools – TRZ Worthiness Screening Tool 55
Factors Contributing to a Successful TRZ ............................................................................... 55 Factor Groups............................................................................................................................ 56
Factor Scores and Global Weight Scores .............................................................................. 56 Stakeholder Readiness to Enter into Collaborative Agreements .......................................... 62 Facility or Project Level Factors ........................................................................................... 65 Project Area Type and Development Conditions ................................................................. 68 Regional Factors ................................................................................................................... 71
Tier 1 Screening Tool Design ................................................................................................... 73 Chapter 5: TRZ Zone Development Tool and Data Needs ..................................................... 79
Survey of Central Appraisal Districts Cadastral Data .............................................................. 79 Survey Findings .................................................................................................................... 79
Software Platform ..................................................................................................................... 80 Desktop Option ..................................................................................................................... 82 Web-Based Option ................................................................................................................ 83 Combined TRZ Zone and Revenue Tool – Final Recommendations ................................... 84
TRZ Prototype Tools for TRZ Development............................................................................ 85 TRZ GIS Prototype Software Tool Design ............................................................................... 87
Data and Software Needs ...................................................................................................... 87 Operation............................................................................................................................... 88
Chapter 6: TRZ Revenue Feasibility Tool................................................................................ 91 Objectives of the Revenue Tool ................................................................................................ 91 Revenue Tool Introduction ....................................................................................................... 92 Framework for Application of the Tool .................................................................................... 94 Financial Model Structure ......................................................................................................... 95
General Structure and Assumptions ...................................................................................... 95 Data Needs ................................................................................................................................ 97 Inputs Screen ............................................................................................................................. 97
Monte Carlo Simulation ........................................................................................................ 98 Land Development .............................................................................................................. 102
Guidance for the General Use ................................................................................................. 104 Determining the TRZ Boundaries and Baseline Inventory ................................................. 105 Assessing Taxable Value Growth Rates ............................................................................. 108 Pace of Development .......................................................................................................... 110 Scenario Analysis................................................................................................................ 111 Drawing Conclusions from the Financial Model ................................................................ 112
xi
Chapter 7: Increment Based Transit Value Capture in Texas ............................................. 115 ISSUEs in the Existing Legal Framework for Value Capture for Transit .............................. 115
TIRZ Code .......................................................................................................................... 115 Senate Bill 1266 .................................................................................................................. 116
TRZ and Transit ...................................................................................................................... 116 Transit and TRZ Surplus Funds .......................................................................................... 116
Typological List of Transit on TxDOT System ...................................................................... 117 Published Findings on Transit Impacts on Property Values ................................................... 122
Transit Access Premium: Evidence from Texas ................................................................. 125 Transit-TIRZ Based Value-Capture Practice in Texas ........................................................... 126
TIRZ in Texas and Their Effectiveness .............................................................................. 126 TIRZ and Transportation Expenditures .............................................................................. 130 Increment Finance outside Texas ........................................................................................ 133
TRZ Value Capture Planning and Implementation Guidance for Intracity and Intercity Transit in Texas ....................................................................................................................... 135 TRZ for Transit Capital Costs................................................................................................. 137 Summary ................................................................................................................................. 138
Chapter 8: TRZ Implementation Workshop ........................................................................ 140 TRZ Workshop: Stakeholders................................................................................................. 140 Workshop Content .................................................................................................................. 141 Workshop Evaluation .............................................................................................................. 141
Chapter 9: Conclusions ............................................................................................................ 143 References .................................................................................................................................. 145 Appendix A: Stakeholder Outreach ........................................................................................ 151 Appendix B: CAD Survey ........................................................................................................ 160 Appendix C: Survey Results .................................................................................................... 175 Appendix D: Physical and Logical Data Models and Data Dictionary for the Revenue Feasibility Tool .......................................................................................................................... 187
xii
LIST OF FIGURES
Page Figure 1.1. Municipal TRZ Tax Increment Calculation. ................................................................ 8 Figure 1.2. Municipal and County TRZs. ....................................................................................... 9 Figure 1.3. Conceptual Flow of Funds for TRZ Financing. ......................................................... 12 Figure 1.4. The TIF Process Adapted from NARS Report ........................................................... 19 Figure 1.5. The TIF Revenue Process. .......................................................................................... 22 Figure 1.6. The Typical Sequential TRZ Implementation Process and Various Sub-Steps ......... 25 Figure 1.7. The City of El Paso TRZ No. 2 Boundaries. .............................................................. 32 Figure 1.8. The City of El Paso TRZ No. 3 Boundaries. .............................................................. 33 Figure 1.9 Land Use Typology Adopted in the El Paso TRZ Evaluation (28, 32). ...................... 34 Figure 1.10. The City of Forney TRZ Boundary. ......................................................................... 35 Figure 1.11. The Hidalgo County TRZ Boundary. ....................................................................... 36 Figure 4.1. TRZ Establishment Screening Factors under SB1266. .............................................. 57 Figure 4.2. Proposed Factor List Schema. .................................................................................... 61 Figure 4.3. Appraisal District GIS Digital Parcel Data Status 2009. ............................................ 63 Figure 4.4. Distribution of Texas Counties by Percent Digitized . ............................................... 65 Figure 4.5. TRZ Screening Tool Interface Tab. ............................................................................ 74 Figure 4.6. Additional Information Window on the Tier 1 Tool Interface. .................................. 75 Figure 4.7. Tier 1 Tool Decision-Tree Interface Flowchart. ......................................................... 76 Figure 5.1. TRZ GIS Tool Prototype Software Design 1.0. ......................................................... 87 Figure 5.2. Selection of Features in the GIS Tool for TRZ Development. ................................... 88 Figure 5.3. TRZ Zone Development. ............................................................................................ 88 Figure 5.4. Minimum Drop Down Fields to Facilitate Revenue Analysis. .................................. 89 Figure 6.1. Main Screen – TRZ Revenue Feasibility Tool. .......................................................... 92 Figure 6.2. TRZ Revenue Calculation Approach—Conceptual Model Used in the Tool. ........... 93 Figure 6.3. Framework for Developing TRZ Revenue Projections. ............................................. 95 Figure 6.4. Basic Inputs Section of the TRZ Revenue Feasibility Tool. ...................................... 98 Figure 6.5. Definition of a Triangular Probability Distribution. ................................................... 99 Figure 6.6. Cumulative Frequency Distribution of the Net Capital Available (PV). ................. 101 Figure 6.7. Illustration of the Input Variables that Use Triangular Distribution. ....................... 102 Figure 6.8. The Remaining Undeveloped (Residual Vacant) Inputs Section. ............................ 103 Figure 6.9. Illustration of Functions Used to Model Land Development. .................................. 104 Figure 6.10. Example of a Parcel Invetory and the Attributes Required by the Tool. ............... 107 Figure 6.11. TRZ Boundary Example for an Initial Scenario. .................................................... 107 Figure 6.12. Annual Percentage Change in the Net Taxable Base and Number of Parcels. ...... 108 Figure 6.13. Average Annual Participation to the Net Taxable Base of the City (2000–2009). 109 Figure 6.14. Quick Example of Scenario Development and Analysis. ...................................... 111 Figure 6.15. Results of the TRZ Revenue Feasibility Tool. ....................................................... 112 Figure 7.1. Metropolitan and Urban District Transit Agencies. ................................................. 119 Figure 7.2. TIRZ Growth Trends. ............................................................................................... 128
xiii
LIST OF TABLES
Page Table 1.1. TRZ, TIF, and TIRZs: A Comparison. ....................................................................... 15 Table 1.2. Similarities and Dissimilarities of TRZ with TIF/TIRZ. ............................................. 18 Table 1.3. Comparison of the Three Municipalities in Texas with TRZ. ..................................... 29 Table 4.1. List of Key Factors Likely to Impact TRZ Outcomes. ................................................ 58 Table 5.1. Software Platforms - Summary of Advantages and Disadvantages for A Combined
TRZ Zone and Revenue Tool Option ................................................................................... 82 Table 5.2. Comparison of GIS Prototype Software Tools. ........................................................... 86 Table 6.1. General Cases of Triangular Distributions and their Significance. ........................... 100 Table 6.2. Vacant Parcel Inventory per Real Estate Category. ................................................... 111 Table 7.1. TxDOT On-System Highways by Road Type. .......................................................... 118 Table 7.2. Categorical Listing of Texas Transit Agencies. ........................................................ 120 Table 7.3. Single-Family Transit Access Premium. ................................................................... 123 Table 7.4. Multi-Family Transit Access Premium...................................................................... 123 Table 7.5. Commercial or Office Transit Access Premium. ....................................................... 124 Table 7.6. Property Value Premiums in Texas. .......................................................................... 125 Table 7.7. Spatial Extent of Transit Impacts on Property Values. .............................................. 126 Table 7.8. Analysis of TIRZ in Texas........................................................................................ 127 Table 7.9. TIRZ Establishment by Time Period. ........................................................................ 129 Table 7.10. Numerical Increase in TIRZ Land Values. .............................................................. 130 Table 7.11. Percentage Increase in TIRZ Land Values. ............................................................ 130 Table 7.12. Texas TIRZ Transportation Expenditures. .............................................................. 131 Table 7. 13 TRID Planning Phase Steps .................................................................................... 135 Table 7.14. Transit Technologies and Potential Interface with TxDOT On-System Highways.
............................................................................................................................................. 136 Table 8.1. TRZ Workshop-Project Team and Stakeholder Webinar Attendees. ........................ 140

1
CHAPTER 1: BACKGROUND AND INTRODUCTION
The nation’s transportation system is in a financial crisis. The State of Texas has
responded to the crisis by passing several bills allowing innovative financing and alternative
options for project financing. Among these is the Senate Bill 1266 (SB1266), passed in the
80th Legislative Session, which provides the legal backdrop for the creation of an institutional
arrangement called the Transportation Reinvestment Zone (TRZ). A TRZ facilitates value
capture of the potential benefit or tax increment from a future transportation project. This
research aims to augment the implementation of SB1266 provisions across Texas, more
specifically, to address knowledge gaps and provide guidance with respect to the bill, make
recommendations for needed amendments, and provide cost effective and standardized
procedures for ascertaining the feasibility of TRZ implementation projects.
INTRODUCTION
The status of the Highway Trust Fund for the Fiscal Year 2009 had a negative change of
23.2 percent from the prior fiscal year balance (1, 2). This change in the balance, driven largely
by the decline in the fuel tax revenues, will be reflected in the limited federal funds available to
each state. Texas is no exception.
Texas is facing enormous and rapidly increasing transportation needs. Currently, TxDOT
is responsible for maintaining nearly 80,000 miles of roads, in addition to supporting statewide
aviation, rail, and public transportation needs. The funding required to meet these mobility
needs for the long term is clearly beyond what traditional sources, like the dated fuel tax, can
supply. Moreover, in October 2009, TxDOT was required to return more than $742 million to
the federal government, as part of an $8.708 billion rescission of the highway project
programming authority, contributing to the severity of the transportation funding crisis in the
state (3). The state fuel tax, last raised in 1991, and the Texas’ allocation of federal funds are
falling short of current and projected needs.
SB1266, passed in the 80th Legislative session, allows for the establishment of a TRZ (4).
Currently, there are three implementation projects using this funding mechanism: the City of El
Paso, the City of Forney, and the Hidalgo County.
In the following sections, SB1266 in introduced and analyzed and TRZ related value
capture is discussed. National increment initiatives are reviewed followed by a discussion of the

2
TRZ state of the practice in Texas. As part of the implementation guidelines and as part of a
larger outreach effort, this chapter also seeks to highlight similarities and dissimilarities of TRZ
to the much more commonly known concepts of Tax Increment Financing (TIF) and tax-
increment-reinvestment zones (TIRZs). A lack of understanding of these similarities and
differences is an important component of the education/outreach effort.
VALUE CAPTURE AS A PUBLIC PRIVATE PARTNERSHIP
Value capture (VC) is an innovative financing method that relies on leveraging the real
estate potential brought by urban asset improvements. Most simply defined, value capture is the
means by which capital infrastructure investment is financed through means of capturing either
some or all of the added value of real estate property that results directly from that investment.
Commonly known examples of such value capture are the TIF and the TIRZ models seen across
the country. Also included in this category are special assessment districts, public improvement
districts, impact fees, and other examples.
VC can be traced back to 18th century and can be attributed to works of Henry George
when the theory of public finance first emerged, but interest in the concept has been renewed by
the U.S. Department of Transportation as it explores innovative approaches for infrastructure
financing. In its earliest from, it was discussed largely as land value taxation (LVT). LVT itself
has been applied in at least 30 countries around the world. VC refers to the process by which all
or a portion of increments in land value attributed to community efforts rather than landowner
actions are recovered by the public sector. VC is hence essentially a benefit-capture method that
offers an approach to ensure that the transportation system will remain adequate to serve
mobility needs for the future when implemented with appropriate screening criteria.
VC is also a way of using and recycling transportation project public benefit revenue
streams to fund specific projects within those zones. These revenue streams provide the
opportunity to adopt project bond financing in designated zones. As such, it is a non-commercial
inward looking form of a Public Private Partnership (PPP), a feature that distinguishes it from
other forms of PPPs. SB1266 (4) adopted by the State of Texas in 2007 makes specific
provisions for the development of municipal and county TRZs, a concept that encapsulates the
principles of VC to supplement roadway project financing. TRZs are a mechanism for local
governments to leverage local and state funds for infrastructure construction by using TxDOT’s
3
Pass-Through mechanism at minimal risk to the municipality’s credit rating (1).1 After
designating a contiguous area along a corridor as a TRZ, a local government entity (a city or a
county) can securitize the incremental tax revenues along with TxDOT Pass-Through financing
to obtain the funds necessary to bring a project to fruition. Funds generated from the
securitization are used to pay for infrastructure projects in the TRZ, and investors are to be
repaid from the combined revenue stream—the incremental tax revenues and TxDOT Pass-
Through funds. Once the securitized debt is repaid, the additional revenues generated by the
TRZ are redirected toward other municipal services. The Texas TRZ model is essentially a local
entity revenue sharing partnership with TxDOT and is somewhat similar in many ways to the
TIF or TIRZ model in its implementation
Minnesota’s Department of Transportation also recently completed a research
investigation also focusing interest on the use of the value capture concept for financing
transportation infrastructure for legislative purposes. It recommends eight value capture
strategies to finance transportation infrastructure, which include TIF, LVT, joint development,
air rights, development impact fees, special assessments, and negotiated exactions (5).
VALUE CAPTURE LEGAL FRAMEWORK FOR TEXAS TRANSPORTATION PROJECTS
Two existing laws focus on tax increment value capture in the state of Texas:
• TIRZs using TIF authorized for use by municipalities and counties under Tax Code
Chapter 311 (6) primarily used in connection with transit projects.
• Transportation Code Chapter 222 (amended by SB1266), permitting municipalities
and counties to enter into agreements with TxDOT to establish TRZs and use surplus
1 TxDOT defines Pass-Through Financing as a mechanism for project developers to finance and be reimbursed for the capital costs of constructing or expanding a state highway project. The public agency (e.g. a local government) or private entity developing the project finances, builds, maintains and/or operates a road project, and TxDOT reimburses a portion of the project cost by making periodic payments for each vehicle that drives on the highway. The remainder of the project capital costs may be met via a combination of traditional construction funds, toll revenue, or TRZ revenue.the capital costs of constructing or expanding a state highway project. The public agency (e.g., a local government) or private entity developing the project finances, builds, maintains and/or operates a road project, and TxDOT reimburses a portion of the project cost by making periodic payments for each vehicle that drives on the highway. The remainder of the project capital costs may be met via a combination of traditional construction funds, toll revenue, or TRZ revenue.
4
funds for supporting other transportation projects, which could include on-system
transit projects (3, 7).
TIRZ Code
The TIRZ code allows the governing bodies of municipalities to finance public
improvements. Chapter 311 Section 311.010 (b) allows the board of directors of a reinvestment
zone and the governing body of the municipality or county to enter into an agreement as the
body deems necessary, and does not specify what organizations or agencies are eligible for
partnership agreement, such as TxDOT. Section 311.010(b) provides:
(b) The board of directors of a reinvestment zone and the governing body of the
municipality or county that creates a reinvestment zone may each enter into
agreements as the board or the governing body considers necessary or convenient to
implement the project plan and reinvestment zone financing plan and achieve their
purposes.
Section 311.01005(b) discusses Bus Rapid Transit (BRT) and rail transportation,
allowing applicable parties to:
(b) …dedicate, pledge, or otherwise provide for the use of revenue in the tax increment
fund to pay the costs of acquiring, constructing, operating, or maintaining property
located in the zone or to acquire or reimburse acquisition costs of real property
outside the zone for right-of-way or easements necessary to construct public rights-
of-way or infrastructure that benefits the zone.
Section 311.01005(c) allows the board of directors of a reinvestment zone and the
governing body of the municipality or county to “dedicate, pledge, or expend funds to pay the
costs of acquiring land, or the development rights or a conservation easement in land, located
outside the reinvestment zone” based on three conditions: 1) the zone is or will be served by rail
transportation or bus rapid transit; 2) the land is acquired for preservation in natural or
undeveloped condition; and 3) the land is located in the county where the zone is located.
Chapter 311 in its current state permits the expenditure of funds for public transportation.
5
Senate Bill 1266
As amended by SB1266, the Transportation Code permits joint governing body
cooperation but currently permits financing for highway projects on the state highway system
(on-system) only. SB1266 amended Chapter 222 of the Transportation Code concerning Title 6
labeled “Roadways.” SB1266 encapsulated the principles of value capture of property tax
increments to supplement roadway project financing. It included specific provisions for the
development of municipal and county TRZs. A pre-requisite for a local government agency to
avail this mechanism is the Pass-Through agreement with Texas.
BILL ANALYSIS – SB1266
SB1266 makes specific provisions for the development of municipal TRZs, a concept
that encapsulates the principles of value capture to supplement roadway project financing. This
section provides an overview of SB1266, the legal framework governing the creation and
operation of TRZs, its’ institutional and financial implications, and to highlight amendments to
this legal framework proposed during the last legislative session.
Summary Analysis of SB1266 Text
Enacted in 2007, SB1266 amended Texas Transportation Code Section 222.104 and
added Sections 222.105, 222.106, and 222.107 (3, 4, and 8). Highlights of the bill’s text,
including the most significant amendments made to the Texas Transportation Code, include:
• Amendment to Section 222.104, by amending Subsection (e) to authorize the Texas
Department of Transportation to use any available funds for the purpose of making a
Pass-Through Toll payment except funds derived from the issuance of bonds under
Section 201.943 (Pledge of State’s Full Faith and Credit). 2
• Amendment to Subchapter E, Chapter 222, by adding Sections 222.105, 222.106, and
222.107, as follows:
2 TxDOT defines Pass-Through Financing as a mechanism for project developers to finance and be reimbursed for the capital costs of constructing or expanding a state highway project. The public agency (e.g., a local government) or private entity developing the project finances, builds, maintains, and/or operates a road project; TxDOT reimburses a portion of the project cost by making periodic payments for each vehicle that drives on the highway. The remainder of the project’s capital costs may be met via a combination of traditional construction funds, toll revenue, or TRZ revenue. Designation of a TRZ within the local entity’s jurisdiction is a consideration to authorize a Pass-Through agreement.
6
o Section 222.105. Provides that the purposes of Sections 222.106 and 222.107 are
to promote public safety, facilitate the development or redevelopment of property,
facilitate the movement of traffic, and enhance a local entity’s ability to sponsor a
project authorized under Section 222.104 (Pass-Through Tolls).
o Section 222.106. Provides the legal framework for the creation of Municipal
TRZs:
Provides that this section applies only to a municipality that intends to enter
into a Pass-Through Toll agreement with TxDOT under Section 222.104.
Stipulates that the TRZ must be a contiguous geographic area within the
jurisdiction of the municipality and stipulates the public involvement
requirements to establish a TRZ.
Requires the municipality to pay into the tax increment account for the zone
an amount equal to the tax increment produced by the municipality from taxes
collected on property in a zone.
Requires money deposited to a tax increment account to be used to fund Pass-
Through Toll projects, including the repayment of amounts owed under a
Pass-Through Toll agreement.
Provides that the TRZ terminates on December 31 of the year in which the
municipality finishes repaying the money pledged to the tax increment
account or owed under the Pass-Through agreement.
Provides that a TRZ terminates on December 31 of the 10th year after the year
the zone was designated, if before that date the municipality has not used the
zone for the purpose it was created.
Authorizes any surplus remaining on termination of a zone to be used for
municipal transportation projects in or outside the zone.
o Section 222.107. Provides the legal framework for the creation of county TRZs,
Tax Abatements, and Road Utility Districts (RUDs). Most of the provisions set
forth in this section are very similar to those in Section 222.107 for municipal
TRZs. However, there are some key specific requirements that make county
7
TRZs very different from municipal TRZs, the most significant of which are the
following:
Instead of requiring the county to deposit the tax increment into a tax
increment account, it authorizes the county to enter into an agreement with the
owner of any real property located in the zone to abate a portion of the ad
valorem taxes imposed by the county.
Concurrently, it authorizes the formation of a RUD that has the same
geographic boundaries as the TRZ, in order to assist the county in developing
a Pass-Through Toll project, and authorizes the Road Utility District to
impose a tax on property within the zone at a rate equal to the amount of ad
valorem taxes abated by the county. (It also provides that an election is not
required to approve the imposition of the taxes.)
It authorizes the RUD to enter into an agreement with the county to assume
the obligation of the county to fund a Pass-Through project or to repay funds
owed to TxDOT under that section.
The RUD concept in the act was included to enable counties to collect tax increments
since there are constitutional limitations on the authority of counties to fully implement tax
increment financing (9).
Institutional and Municipal Financing Implications of SB1266
Under SB1266, after designating a contiguous area along a transportation corridor as a
TRZ, a local government entity (a city or a county or an agent such as a Regional Mobility
Authority [RMA]) can securitize the incremental property tax revenues along with TxDOT Pass-
Through financing to obtain the funds necessary to bring a project to fruition. Funds generated
from the securitization will be used to pay for infrastructure projects in the TRZ, and investors
will be repaid from both revenue streams—the incremental tax revenues and TxDOT Pass-
Through funds. Thus, the amendments introduced by SB1266 are innovative from a municipal
financing standpoint for two main reasons:
• First, TRZs are a mechanism for local governments to leverage local and state funds
for infrastructure construction by using TxDOT’s Pass-Through mechanism.
8
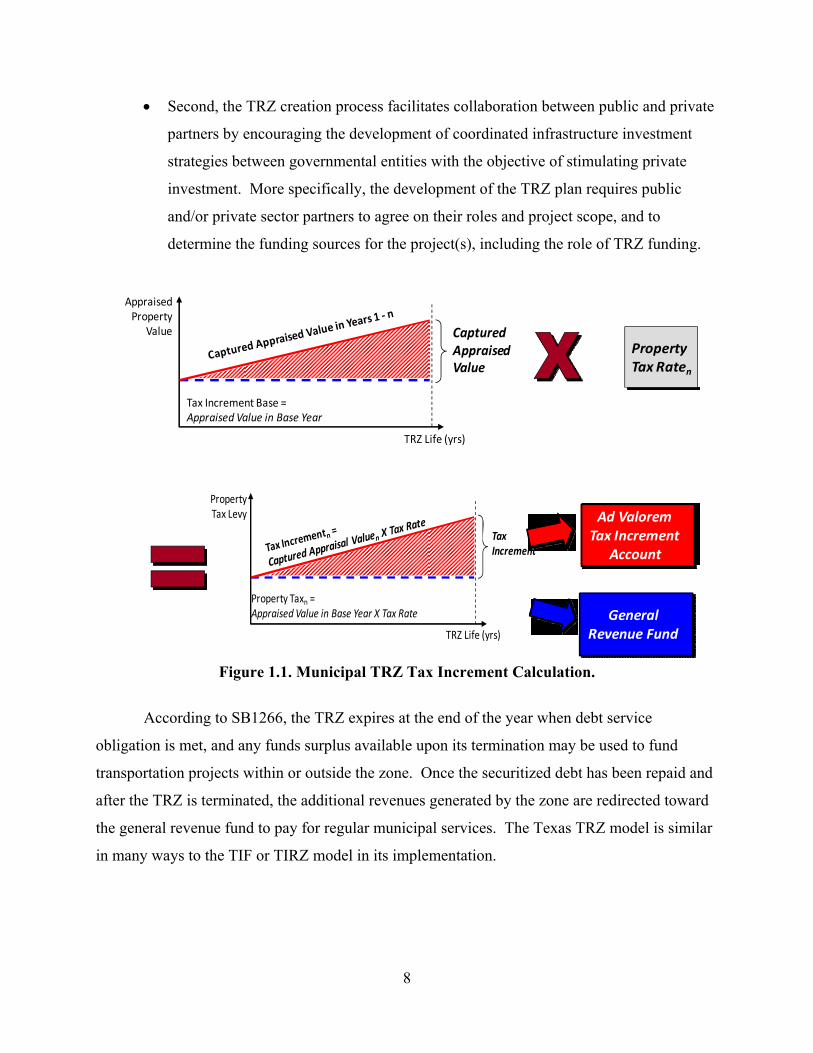
• Second, the TRZ creation process facilitates collaboration between public and private
partners by encouraging the development of coordinated infrastructure investment
strategies between governmental entities with the objective of stimulating private
investment. More specifically, the development of the TRZ plan requires public
and/or private sector partners to agree on their roles and project scope, and to
determine the funding sources for the project(s), including the role of TRZ funding.
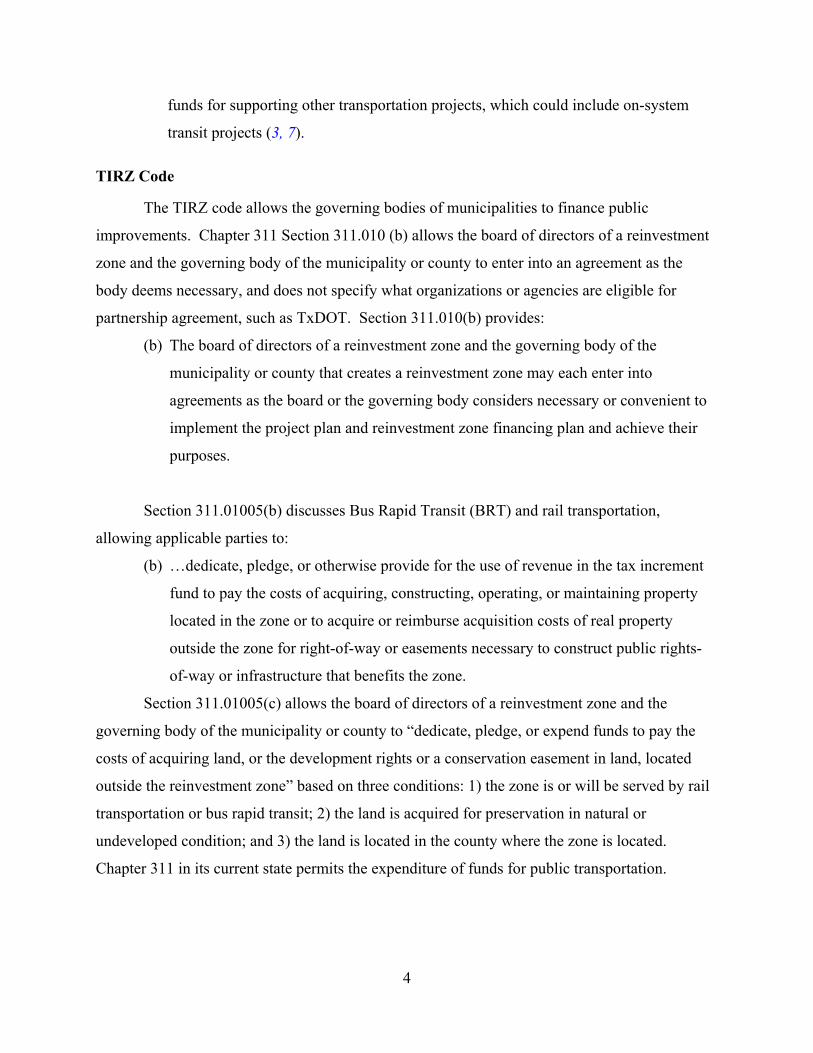
Figure 1.1. Municipal TRZ Tax Increment Calculation.
According to SB1266, the TRZ expires at the end of the year when debt service
obligation is met, and any funds surplus available upon its termination may be used to fund
transportation projects within or outside the zone. Once the securitized debt has been repaid and
after the TRZ is terminated, the additional revenues generated by the zone are redirected toward
the general revenue fund to pay for regular municipal services. The Texas TRZ model is similar
in many ways to the TIF or TIRZ model in its implementation.
Tax Increment Base = Appraised Value in Base Year
TRZ Life (yrs)
Appraised Property
Value Captured Appraised Value
Property Tax Raten
Property Taxn = Appraised Value in Base Year X Tax Rate
TRZ Life (yrs)
Property Tax Levy
Tax Increment
GeneralRevenue Fund
Ad ValoremTax Increment
Account
9
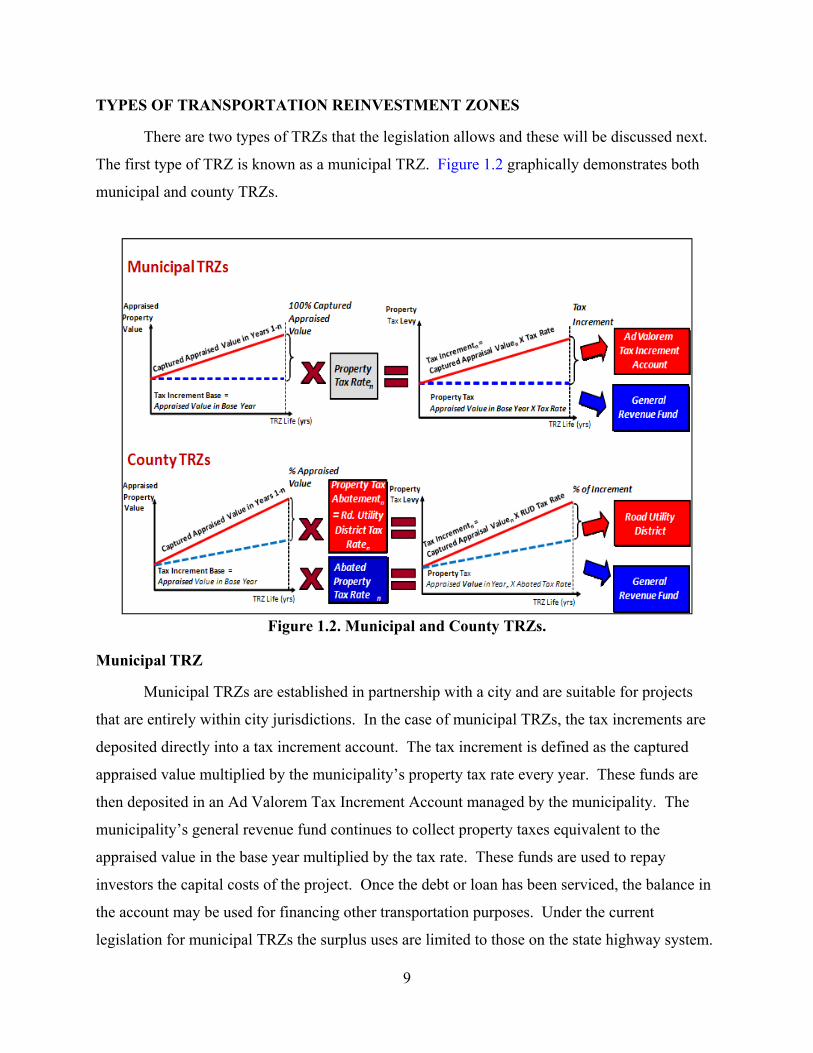
TYPES OF TRANSPORTATION REINVESTMENT ZONES
There are two types of TRZs that the legislation allows and these will be discussed next.
The first type of TRZ is known as a municipal TRZ. Figure 1.2 graphically demonstrates both
municipal and county TRZs.
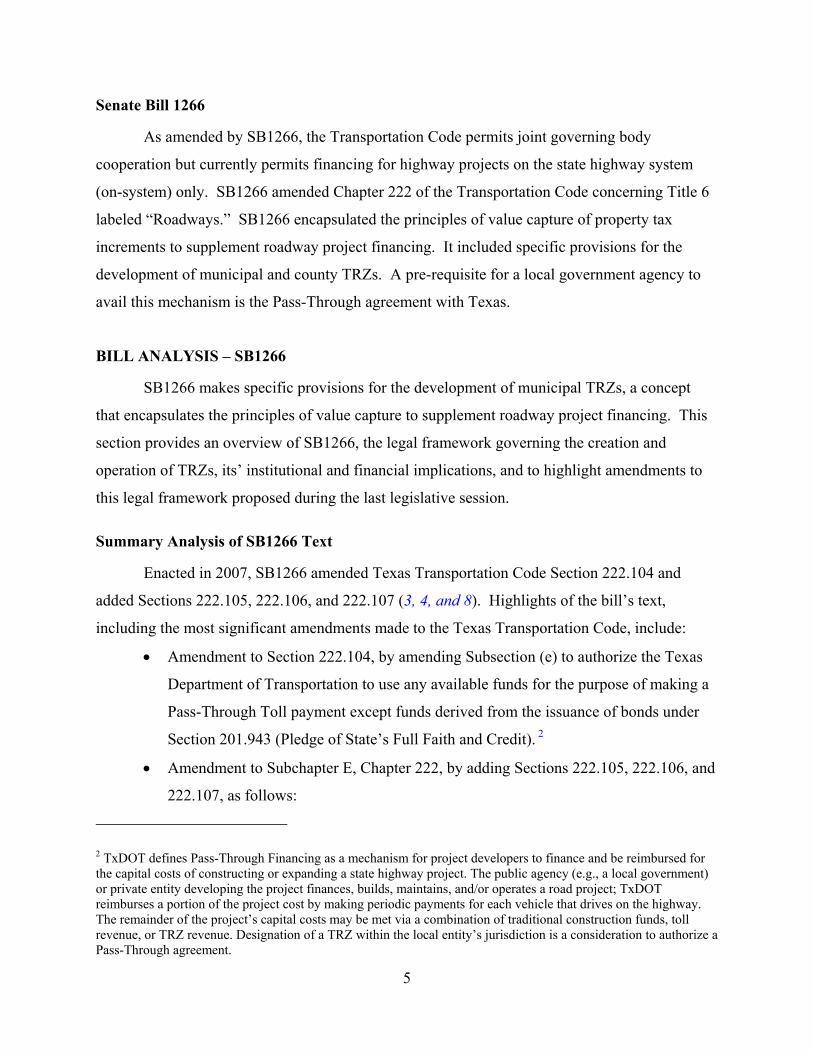
Figure 1.2. Municipal and County TRZs.
Municipal TRZ
Municipal TRZs are established in partnership with a city and are suitable for projects
that are entirely within city jurisdictions. In the case of municipal TRZs, the tax increments are
deposited directly into a tax increment account. The tax increment is defined as the captured
appraised value multiplied by the municipality’s property tax rate every year. These funds are
then deposited in an Ad Valorem Tax Increment Account managed by the municipality. The
municipality’s general revenue fund continues to collect property taxes equivalent to the
appraised value in the base year multiplied by the tax rate. These funds are used to repay
investors the capital costs of the project. Once the debt or loan has been serviced, the balance in
the account may be used for financing other transportation purposes. Under the current
legislation for municipal TRZs the surplus uses are limited to those on the state highway system.
10
County TRZ
County TRZs are set up in partnership with county governments and are suitable within
county boundaries but traverse several cities. In the case of a county TRZ, a tax increment base
is calculated as the total appraised value of all real property taxable by the county within the
TRZ in the base year (i.e., when the TRZ is established). The captured appraised value in each
subsequent year is equal to the total appraised value of all real property taxable by the county
and located within the TRZ less the tax increment base.
The tax increment for a year is the amount of ad-valorem taxes collected by the county
for that year on the captured appraised value for taxable real property within the TRZ. The tax
increment is defined as the captured appraised value multiplied by the county’s property tax rate
every year. In order to obtain the benefit of the tax increment, a county may abate taxes to the
amount of the tax increment; form a RUD with the same boundaries as the TRZ; and allow the
RUD to impose taxes in the district in an amount equal to taxes abated. This collection
mechanism is necessary due to an apparent constitutional limitation on the authority of a
county to implement tax increment financing (9). The RUD tax collected can be pledged
against debt acquired to fund the TRZ and the annual tax revenue used to service the debt.
TRZ Duration and Surplus
There are no prescribed durations for the TRZ in the law as it stands. However, in
practice TRZs are set up for duration of 20+ years, a period long enough to pay off the debt or
loan set up for defraying the capital costs of building the infrastructure improvement. The
surplus left over after debt is paid off may be used according to guidelines set up by the
legislation. In the case of municipal TRZs, once the debt or loan has been serviced, the balance
in the account may be used to finance any other transportation project within the jurisdiction.
Under the current legislation for municipal TRZs the surplus can be used for any transportation
within the jurisdiction. The annual tax increment collected by a city is limited by law to
payments toward the TRZ project (which must be on the state highway system).
In the case of a county TRZ, the tax increment revenue can be used to meet the TRZ
obligation of the RUD, and any money not used for this purpose, can be used for any other
purpose within the RUD. In the event a RUD is used to collect the tax increment, funds not used
11
for financing of the project may be used for any district purpose. The scope of permissible uses
of TRZ generated funds is therefore broader under the county/RUD structure. However, if the
RUD has solely been set up for the TRZ project on the state highway system, in practice, the
county TRZ is also limited to using the surplus on-system.
TRZ and Taxes
In a typical TRZ implementation neither does the tax rate change, nor does the current
allocation of tax revenues to finance local government operations. Only the additional tax
revenues associated with the increased property values accruing to the local entity (city or
county) (from a pre-project baseline) are used to repay the debt (see Figure 2). In addition, no
diversion of other revenues from other taxing entities (school districts and community colleges,
etc.) takes place. In other words, the revenue sharing portion occurs only based on the local
entity’s portion of the overall tax increment while still providing a benefit to other taxing entities.
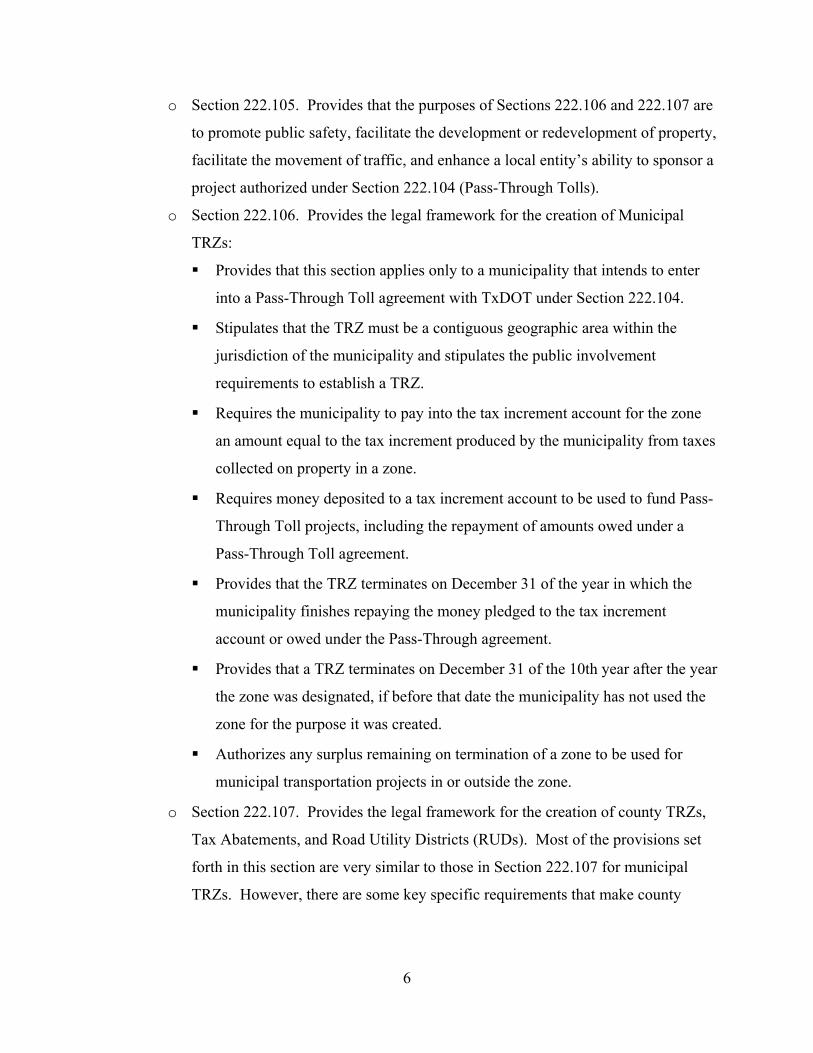
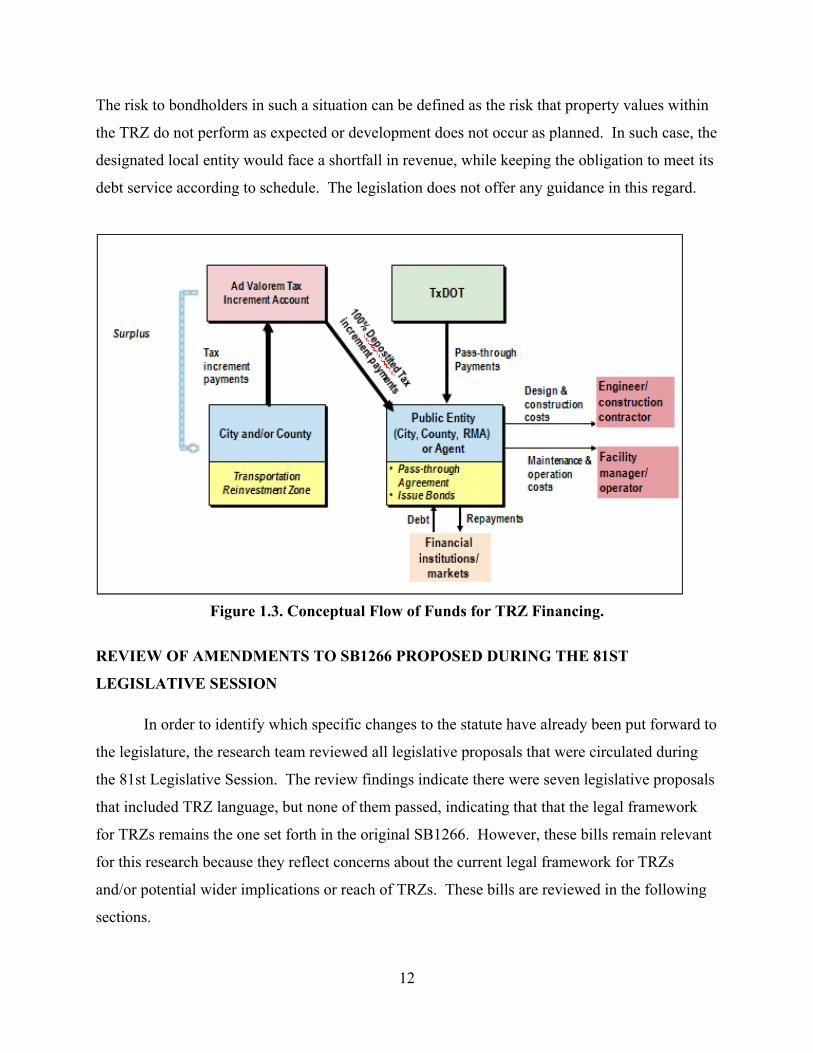
CONCEPTUAL FLOW OF FUNDS UNDER SB1266
Figure 1.3 shows the flow of funds as conceptualized in the SB1266 TRZ model. As
shown in the figure, every year during the life of the TRZ, tax revenue collected over and above
an agreed upon base would go into an ad valorem tax increment account established by the local
government. From the ad valorem tax account these funds would flow to the designated local
entity (the local government itself or an RMA), where it will be complemented with Pass-
Through funds. Finally, the designated local entity will securitize this annual revenue stream to
obtain debt and fund construction of the transportation facilities. In terms of revenue risk, the
TRZ legislation is neither clear nor explicit regarding its allocation, while the flow of funds
shown in the figure seems to implicitly allocate the risk of financial non-performance to the
designated local entity issuing debt.
In practice, the annual cash flow projections from the TRZ are estimated prior to its
establishment, and represent simply a projection and not a binding commitment for the
municipality. Rather, the municipality commits the entire tax increment in any given year over
the TRZ life, regardless of whether the amount falls short or exceeds the projection.
Consequently, the TRZ revenue securitized represent a contingent liability for the designated
local entity, whose commitment to repay debt according to a pre-specified schedule remains.
12
The risk to bondholders in such a situation can be defined as the risk that property values within
the TRZ do not perform as expected or development does not occur as planned. In such case, the
designated local entity would face a shortfall in revenue, while keeping the obligation to meet its
debt service according to schedule. The legislation does not offer any guidance in this regard.
Figure 1.3. Conceptual Flow of Funds for TRZ Financing.
REVIEW OF AMENDMENTS TO SB1266 PROPOSED DURING THE 81ST
LEGISLATIVE SESSION
In order to identify which specific changes to the statute have already been put forward to
the legislature, the research team reviewed all legislative proposals that were circulated during
the 81st Legislative Session. The review findings indicate there were seven legislative proposals
that included TRZ language, but none of them passed, indicating that that the legal framework
for TRZs remains the one set forth in the original SB1266. However, these bills remain relevant
for this research because they reflect concerns about the current legal framework for TRZs
and/or potential wider implications or reach of TRZs. These bills are reviewed in the following
sections.
13
Senate Bill 2096: TRZ and Urban Transportation Authorities
SB2096 and its companion House Bill (HB) 4335, was captioned “Relating to the
creation of and the powers of a comprehensive multimodal urban transportation authority.” This
bill proposed allowing urban transportation authorities to use funds from a TRZ in the same
jurisdiction to pay for transportation projects (10, 11).
Senate Bill 2378: Decoupling the Pass-Through Link to TRZ
SB2378 and its companion HB1810 concerned a change that eliminated the requirement
for a municipality to establish a Pass-Through agreement with TxDOT prior to creating a TRZ,
and that transportation projects could include aesthetic improvements (12, 13).
Senate Bill 898: TRZ, Rail, and Freight Infrastructure
SB898 concerned authorizing a municipality to include the acquisition, improvement, or
operation of a freight or passenger rail facility or system by the municipality as a purpose for
designating a geographic area as a TRZ (14, 15).
Senate Bill 1671: TRZ Surplus Funds Use
SB1671 concerned allowing the use of TRZ funds to pay for municipal transportation
projects not part of a Pass-Through agreement (16).
House Bill 300: TRZ, Rail Projects, Use of Surplus Funds, and Boundary Changes
HB300 included language relevant to TRZs including a number of amendments,
including among others: allowing changes in the boundaries of a TRZ; the ability to fund rail
projects; and the use of surplus funds in the tax increment account for any purpose (17, 18).
TRZ IMPLEMENTATION FOR HIGHWAYS
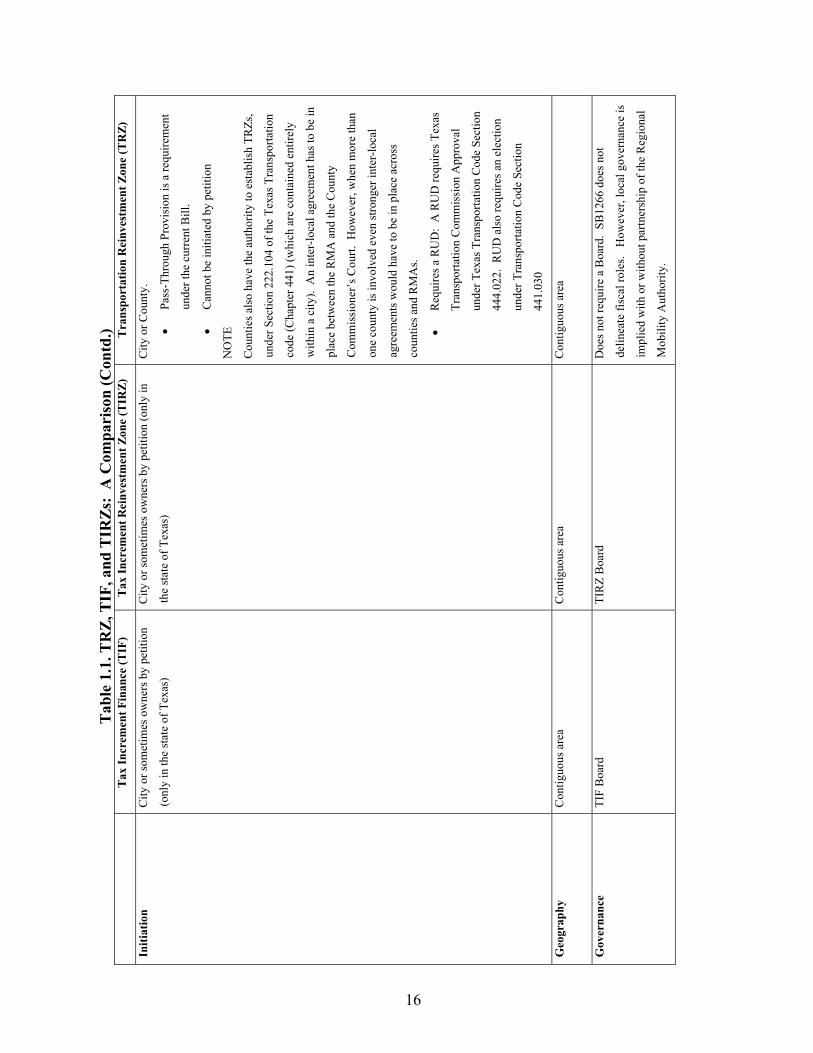
Comparison with Tax-Increment-Finance and Tax-Increment-Reinvestment Zones
The concept and processes of TRZ are similar to TIF/TIRZ (economic development
tools) that are adopted by municipalities. However, the T in TRZ stands for transportation, while
the T in TIF and TIRZ stands for tax (tax increment). This suggests that TRZs are for
transportation purposes alone, while TIFs/TIRZ generally support non-transportation
developmental objectives. As of 2010, there were 182 TIRZs in Texas and more than 60 percent
14
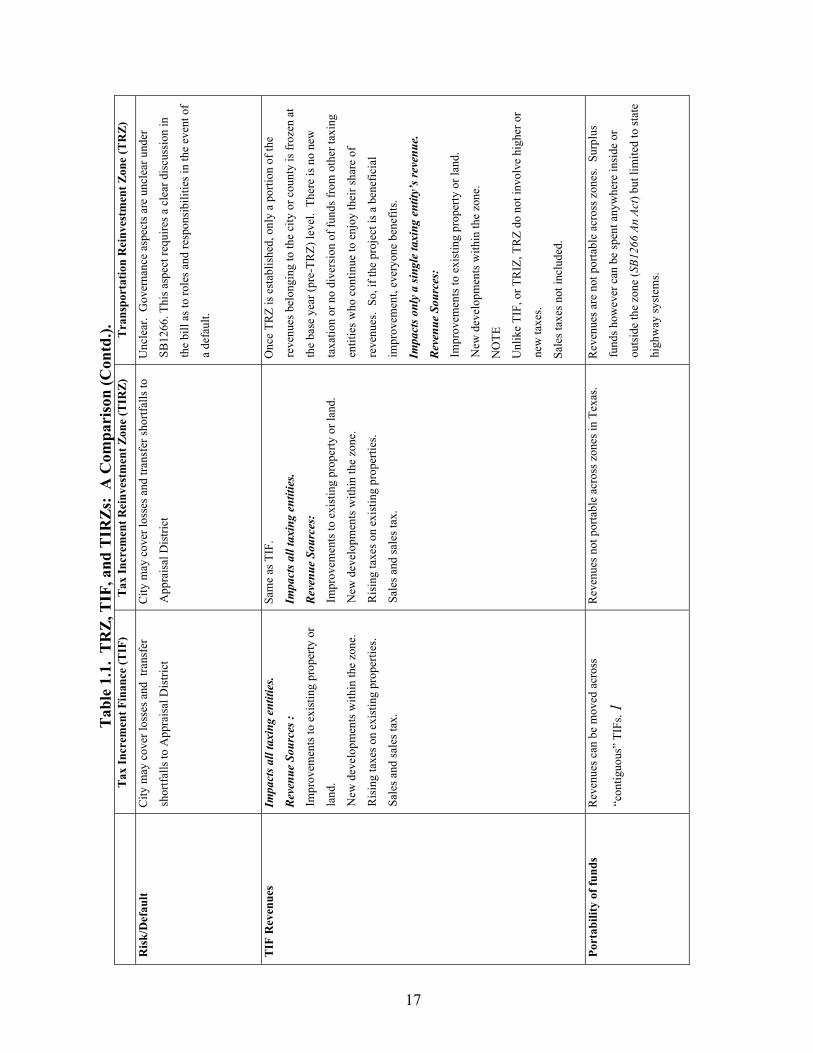
are in urban counties. A discussion follows but there are significant differences between
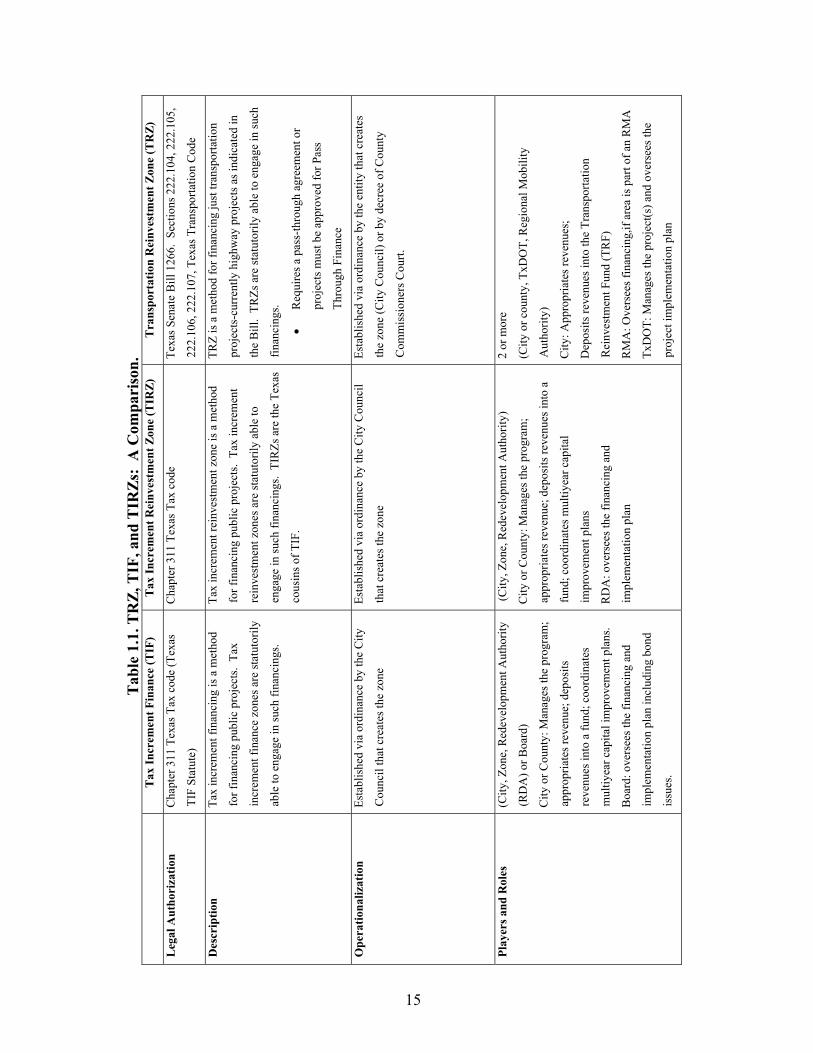
TIF/TIRZ and TRZs. Table 1.1 summarizes various aspects of TIF/TIRZ/TRZ. Table 1.2
crystallizes these into a more succinct summary of key issues where TRZs share a common
ground with TIF/TIRZ where they are different, and pros and cons of the arrangements.
15
Tab
le 1
.1. T
RZ,
TIF
, and
TIR
Zs:
A C
ompa
riso
n.
T
ax In
crem
ent F
inan
ce (T
IF)
Tax
Incr
emen
t Rei
nves
tmen
t Zon
e (T
IRZ)
T
rans
port
atio
n R
einv
estm
ent Z
one
(TR
Z)
Leg
al A
utho
riza
tion
Cha
pter
311
Tex
as T
ax c
ode
(Tex
as
TIF
Stat
ute)
Cha
pter
311
Tex
as T
ax c
ode
Texa
s Sen
ate
Bill
126
6. S
ectio
ns 2
22.1
04, 2
22.1
05,
222.
106,
222
.107
, Tex
as T
rans
porta
tion
Cod
e
Des
crip
tion
Tax
incr
emen
t fin
anci
ng is
a m
etho
d
for f
inan
cing
pub
lic p
roje
cts.
Tax
incr
emen
t fin
ance
zon
es a
re st
atut
orily
able
to e
ngag
e in
such
fina
ncin
gs.
Tax
incr
emen
t rei
nves
tmen
t zon
e is
a m
etho
d
for f
inan
cing
pub
lic p
roje
cts.
Tax
incr
emen
t
rein
vest
men
t zon
es a
re st
atut
orily
abl
e to
enga
ge in
such
fina
ncin
gs.
TIR
Zs a
re th
e Te
xas
cous
ins o
f TIF
.
TRZ
is a
met
hod
for f
inan
cing
just
tran
spor
tatio
n
proj
ects
-cur
rent
ly h
ighw
ay p
roje
cts a
s ind
icat
ed in
the
Bill
. TR
Zs a
re st
atut
orily
abl
e to
eng
age
in su
ch
finan
cing
s.
• R
equi
res a
pas
s-th
roug
h ag
reem
ent o
r
proj
ects
mus
t be
appr
oved
for P
ass
Thro
ugh
Fina
nce
Ope
ratio
naliz
atio
n Es
tabl
ishe
d vi
a or
dina
nce
by th
e C
ity
Cou
ncil
that
cre
ates
the
zone
Esta
blis
hed
via
ordi
nanc
e by
the
City
Cou
ncil
that
cre
ates
the
zone
Esta
blis
hed
via
ordi
nanc
e by
the
entit
y th
at c
reat
es
the
zone
(City
Cou
ncil)
or b
y de
cree
of C
ount
y
Com
mis
sion
ers C
ourt.
Play
ers a
nd R
oles
(C
ity, Z
one,
Red
evel
opm
ent A
utho
rity
(RD
A) o
r Boa
rd)
City
or C
ount
y: M
anag
es th
e pr
ogra
m;
appr
opria
tes r
even
ue; d
epos
its
reve
nues
into
a fu
nd; c
oord
inat
es
mul
tiyea
r cap
ital i
mpr
ovem
ent p
lans
.
Boa
rd: o
vers
ees t
he fi
nanc
ing
and
impl
emen
tatio
n pl
an in
clud
ing
bond
issu
es.
(City
, Zon
e, R
edev
elop
men
t Aut
horit
y)
City
or C
ount
y: M
anag
es th
e pr
ogra
m;
appr
opria
tes r
even
ue; d
epos
its re
venu
es in
to a
fund
; coo
rdin
ates
mul
tiyea
r cap
ital
impr
ovem
ent p
lans
RD
A: o
vers
ees t
he fi
nanc
ing
and
impl
emen
tatio
n pl
an
2 or
mor
e
(City
or c
ount
y, T
xDO
T, R
egio
nal M
obili
ty
Aut
horit
y)
City
: App
ropr
iate
s rev
enue
s;
Dep
osits
reve
nues
into
the
Tran
spor
tatio
n
Rei
nves
tmen
t Fun
d (T
RF)
RM
A: O
vers
ees f
inan
cing
,if a
rea
is p
art o
f an
RM
A
TxD
OT:
Man
ages
the
proj
ect(s
) and
ove
rsee
s the
proj
ect i
mpl
emen
tatio
n pl
an
16
Tab
le 1
.1. T
RZ,
TIF
, and
TIR
Zs:
A C
ompa
riso
n (C
ontd
.)
Tax
Incr
emen
t Fin
ance
(TIF
) T
ax In
crem
ent R
einv
estm
ent Z
one
(TIR
Z)
Tra
nspo
rtat
ion
Rei
nves
tmen
t Zon
e (T
RZ)
Initi
atio
n C
ity o
r som
etim
es o
wne
rs b
y pe
titio
n
(onl
y in
the
stat
e of
Tex
as)
City
or s
omet
imes
ow
ners
by
petit
ion
(onl
y in
the
stat
e of
Tex
as)
City
or C
ount
y.
• Pa
ss-T
hrou
gh P
rovi
sion
is a
requ
irem
ent
unde
r the
cur
rent
Bill
.
• C
anno
t be
initi
ated
by
petit
ion
NO
TE
Cou
ntie
s als
o ha
ve th
e au
thor
ity to
est
ablis
h TR
Zs,
unde
r Sec
tion
222.
104
of th
e Te
xas T
rans
porta
tion
code
(Cha
pter
441
) (w
hich
are
con
tain
ed e
ntire
ly
with
in a
city
). A
n in
ter-
loca
l agr
eem
ent h
as to
be
in
plac
e be
twee
n th
e R
MA
and
the
Cou
nty
Com
mis
sion
er’s
Cou
rt. H
owev
er, w
hen
mor
e th
an
one
coun
ty is
invo
lved
eve
n st
rong
er in
ter-
loca
l
agre
emen
ts w
ould
hav
e to
be
in p
lace
acr
oss
coun
ties a
nd R
MA
s.
• R
equi
res a
RU
D:
A R
UD
requ
ires T
exas
Tran
spor
tatio
n C
omm
issi
on A
ppro
val
unde
r Tex
as T
rans
porta
tion
Cod
e Se
ctio
n
444.
022.
RU
D a
lso
requ
ires a
n el
ectio
n
unde
r Tra
nspo
rtatio
n C
ode
Sect
ion
441.
030
Geo
grap
hy
Con
tiguo
us a
rea
Con
tiguo
us a
rea
Con
tiguo
us a
rea
Gov
erna
nce
TIF
Boa
rd
TIR
Z B
oard
D
oes n
ot re
quire
a B
oard
. SB
1266
doe
s not
delin
eate
fisc
al ro
les.
How
ever
, loc
al g
over
nanc
e is
impl
ied
with
or w
ithou
t par
tner
ship
of t
he R
egio
nal
Mob
ility
Aut
horit
y.
17
Tab
le 1
.1.
TR
Z, T
IF, a
nd T
IRZs
: A
Com
pari
son
(Con
td.).
Tax
Incr
emen
t Fin
ance
(TIF
) T
ax In
crem
ent R
einv
estm
ent Z
one
(TIR
Z)
Tra
nspo
rtat
ion
Rei
nves
tmen
t Zon
e (T
RZ)
Ris
k/D
efau
lt C
ity m
ay c
over
loss
es a
nd t
rans
fer
shor
tfalls
to A
ppra
isal
Dis
trict
City
may
cov
er lo
sses
and
tran
sfer
shor
tfalls
to
App
rais
al D
istri
ct
Unc
lear
. G
over
nanc
e as
pect
s are
unc
lear
und
er
SB12
66. T
his a
spec
t req
uire
s a c
lear
dis
cuss
ion
in
the
bill
as to
role
s and
resp
onsi
bilit
ies i
n th
e ev
ent o
f
a de
faul
t.
TIF
Rev
enue
s Im
pact
s all
taxi
ng e
ntiti
es.
Rev
enue
Sou
rces
:
Impr
ovem
ents
to e
xist
ing
prop
erty
or
land
.
New
dev
elop
men
ts w
ithin
the
zone
.
Ris
ing
taxe
s on
exis
ting
prop
ertie
s.
Sale
s and
sale
s tax
.
Sam
e as
TIF
.
Impa
cts a
ll ta
ent
ities
.
Rev
enue
Sou
rces
:
Impr
ovem
ents
to e
xist
ing
prop
erty
or l
and.
New
dev
elop
men
ts w
ithin
the
zone
.
Ris
ing
taxe
s on
exis
ting
prop
ertie
s.
Sale
s and
sale
s tax
.
Onc
e TR
Z is
est
ablis
hed,
onl
y a
porti
on o
f the
reve
nues
bel
ongi
ng to
the
city
or c
ount
y is
froz
en a
t
the
base
yea
r (pr
e-TR
Z) le
vel.
The
re is
no
new
taxa
tion
or n
o di
vers
ion
of fu
nds f
rom
oth
er ta
entit
ies w
ho c
ontin
ue to
enj
oy th
eir s
hare
of
reve
nues
. So
, if t
he p
roje
ct is
a b
enef
icia
l
impr
ovem
ent,
ever
yone
ben
efits
.
Impa
cts o
nly
a sin
gle
taxi
ng e
ntity
’s re
venu
e.
Rev
enue
Sou
rces
:
Impr
ovem
ents
to e
xist
ing
prop
erty
or l
and.
New
dev
elop
men
ts w
ithin
the
zone
.
NO
TE
Unl
ike
TIF,
or T
RIZ
, TR
Z do
not
invo
lve
high
er o
r
new
taxe
s.
Sale
s tax
es n
ot in
clud
ed.
Port
abili
ty o
f fun
ds
Rev
enue
s can
be
mov
ed a
cros
s
“con
tiguo
us”
TIFs
. 1
Rev
enue
s not
por
tabl
e ac
ross
zon
es in
Tex
as.
Rev
enue
s are
not
por
tabl
e ac
ross
zon
es.
Surp
lus
fund
s how
ever
can
be
spen
t any
whe
re in
side
or
outs
ide
the
zone
(SB1
266
An A
ct) b
ut li
mite
d to
stat
e
high
way
syst
ems.
18
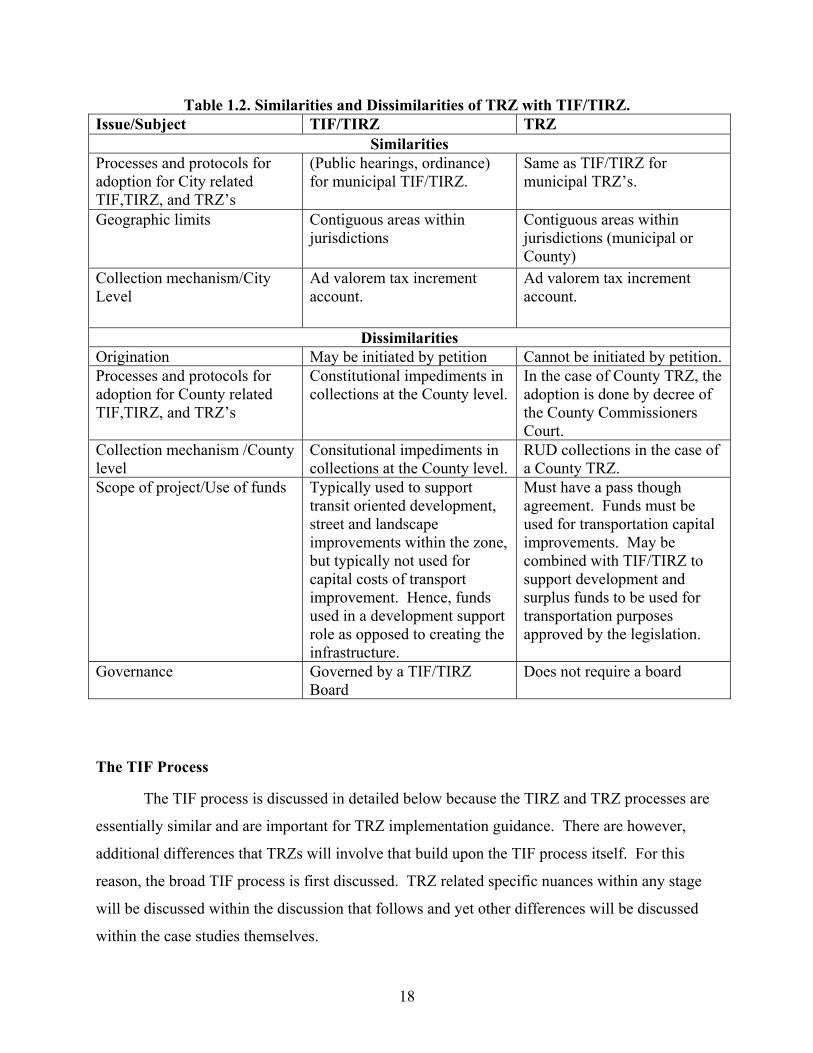
Table 1.2. Similarities and Dissimilarities of TRZ with TIF/TIRZ. Issue/Subject TIF/TIRZ TRZ
Similarities Processes and protocols for adoption for City related TIF,TIRZ, and TRZ’s
(Public hearings, ordinance) for municipal TIF/TIRZ.
Same as TIF/TIRZ for municipal TRZ’s.
Geographic limits Contiguous areas within jurisdictions
Contiguous areas within jurisdictions (municipal or County)
Collection mechanism/City Level
Ad valorem tax increment account.
Ad valorem tax increment account.
Dissimilarities Origination May be initiated by petition Cannot be initiated by petition. Processes and protocols for adoption for County related TIF,TIRZ, and TRZ’s
Constitutional impediments in collections at the County level.
In the case of County TRZ, the adoption is done by decree of the County Commissioners Court.
Collection mechanism /County level
Consitutional impediments in collections at the County level.
RUD collections in the case of a County TRZ.
Scope of project/Use of funds Typically used to support transit oriented development, street and landscape improvements within the zone, but typically not used for capital costs of transport improvement. Hence, funds used in a development support role as opposed to creating the infrastructure.
Must have a pass though agreement. Funds must be used for transportation capital improvements. May be combined with TIF/TIRZ to support development and surplus funds to be used for transportation purposes approved by the legislation.
Governance Governed by a TIF/TIRZ Board
Does not require a board
The TIF Process
The TIF process is discussed in detailed below because the TIRZ and TRZ processes are
essentially similar and are important for TRZ implementation guidance. There are however,
additional differences that TRZs will involve that build upon the TIF process itself. For this
reason, the broad TIF process is first discussed. TRZ related specific nuances within any stage
will be discussed within the discussion that follows and yet other differences will be discussed
within the case studies themselves.
19
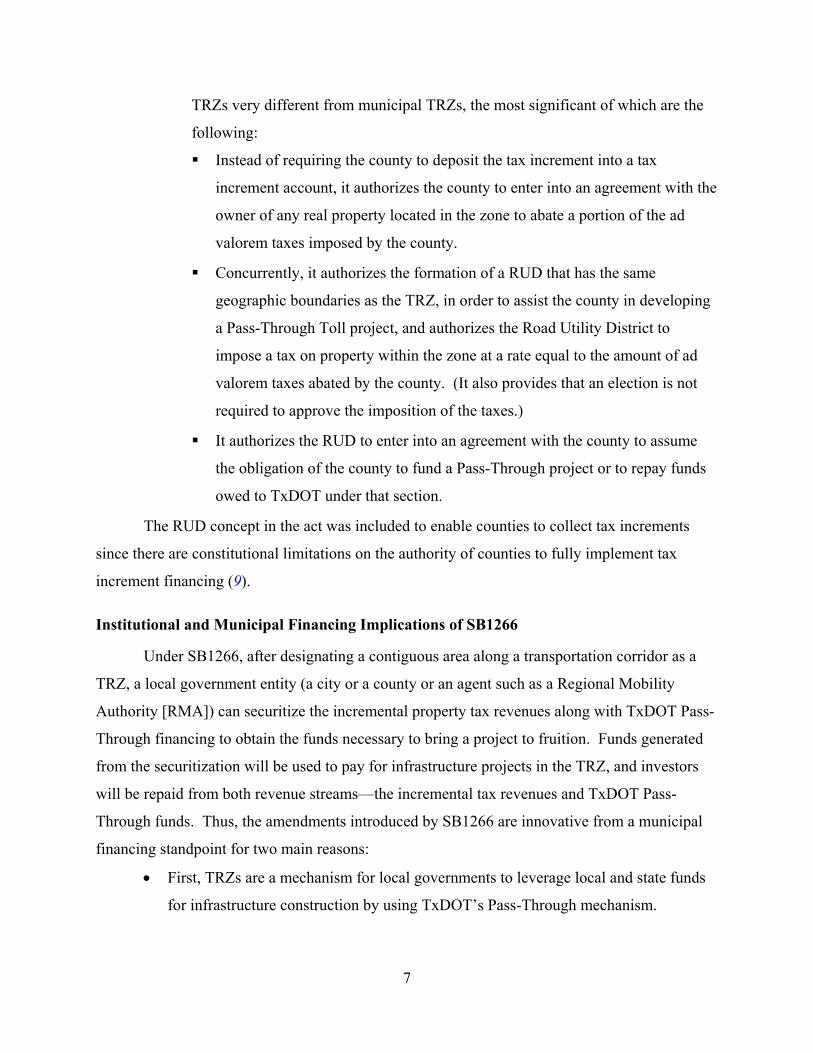
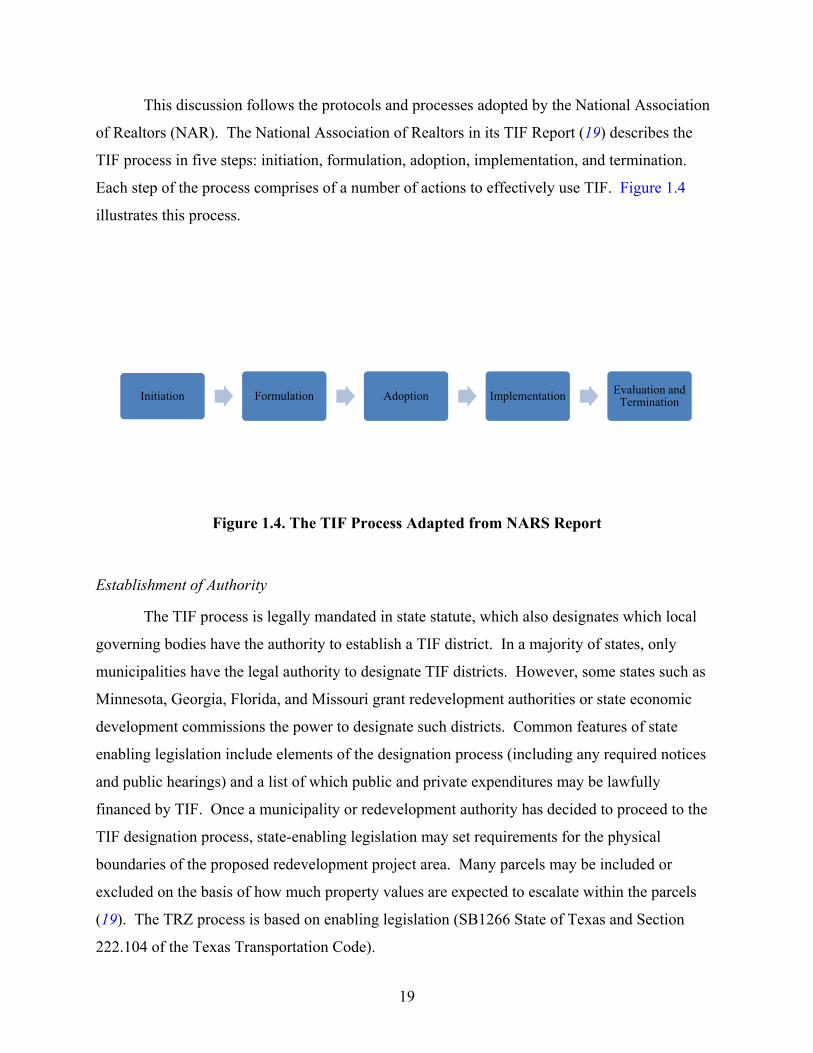
This discussion follows the protocols and processes adopted by the National Association
of Realtors (NAR). The National Association of Realtors in its TIF Report (19) describes the
TIF process in five steps: initiation, formulation, adoption, implementation, and termination.
Each step of the process comprises of a number of actions to effectively use TIF. Figure 1.4
illustrates this process.
Figure 1.4. The TIF Process Adapted from NARS Report
Establishment of Authority
The TIF process is legally mandated in state statute, which also designates which local
governing bodies have the authority to establish a TIF district. In a majority of states, only
municipalities have the legal authority to designate TIF districts. However, some states such as
Minnesota, Georgia, Florida, and Missouri grant redevelopment authorities or state economic
development commissions the power to designate such districts. Common features of state
enabling legislation include elements of the designation process (including any required notices
and public hearings) and a list of which public and private expenditures may be lawfully
financed by TIF. Once a municipality or redevelopment authority has decided to proceed to the
TIF designation process, state-enabling legislation may set requirements for the physical
boundaries of the proposed redevelopment project area. Many parcels may be included or
excluded on the basis of how much property values are expected to escalate within the parcels
(19). The TRZ process is based on enabling legislation (SB1266 State of Texas and Section
222.104 of the Texas Transportation Code).
Initiation Formulation Adoption Implementation Evaluation and Termination
20
Project initiation
Project initiation involves determining the project feasibility in terms of needs, benefits
and area eligibility. This may be done through a feasibility report that justifies the use of TIF for
the project. Once the project feasibility is determined, project initiation can come from either the
public or the private sector. Many times the designation of a TIF district is suggested by
property owners, private businesses, or developers who need assistance with either development
or redevelopment projects on a specific site. Municipalities often prefer to initiate TIF districts
based on a developer’s solicitation of funding because it reflects the developer’s willingness and
interest in investing in the area. In the absence of private interest the public sector may choose to
initiate a TIF project. Municipalities may decide to take the lead role in initiating TIF projects
because they want to have more control over development activities in heated markets, they want
to encourage development in areas where site impediments may discourage investment by
developers, or they want to pursue a large project that may not otherwise be possible (19, 20). In
practice, TIF and TIRZs tend to be implemented for an array of projects within the regions they
traverse. In the case of TRZ, project initiation implies the development of feasibility analysis
and studies to support the TRZ for the specific project(s) since TRZs are specifically project
driven. The initiation of the TRZ has to typically start from the local government entity
(city/municipality or county) but as a partnership with TxDOT and the RMAs, when applicable.
TRZ’s may not be initiated by property owners unlike TIRZ’s and TIF’s. In the event a county
initiates the TRZ, an interim step, a RUD has to be established under the existing guidelines with
the same boundaries as the TRZ to comply with terms of the Pass-Through finance agreement.
The TRZ initiation requires a Pass-Through agreement to be in place with the TxDOT.
Formulation
Once the project has been successfully initiated, the formulation of a plan for the area
begins. The first step in formulation is establishing the geographical boundaries of the TIF
district.
Needs Assessment. Most states, require that the TIF project area meet both a “blight” and
a “but-for” requirement as set forth by TIF legislation. Typically a blighted area is one where the
built environment is older, deteriorated, depreciated, and excessively vacant or abandoned,
overcrowded, or sparsely developed compared to the rest of the municipality. Definitions of
21
blight for TIF projects vary across states. In order for an area to be eligible for the use of TIF a
municipality must also prove that the area would not develop in the absence of the use of TIF. In
other words, “but-for” the TIF assistance, developers would not invest in the area. It is often very
difficult to provide a definite answer to the “but-for” question. As such, municipalities usually
use a set of questions based on the concept of public purpose to provide evidence that would
satisfy the requirement. Some of the questions commonly used are, whether a prospective
developer has adequate financial resources to fund the entire project, whether and what kinds of
efforts have been previously attempted to improve the area, how long have the key properties in
the proposed redevelopment area been abandoned or vacant, etc. In the case of TRZs, the
governing body of a municipality could use criteria established under Tax Code, Ch. 311 to
demonstrate an area is unproductive, underdeveloped, or blighted and therefore eligible for a
TRZ.
Calculating Increments. Calculating future tax increments involves setting up a property
tax base value. Any property tax revenues that exceed this base are captured as the tax
increments and are returned to the developer. Figure 1.5 shows the TIF revenue process.
Equalized Assessed Value (EAV) is used to spread the property tax burden in an area equally by
assigning similar taxes to similar structures. The base EAV is calculated by totaling the EAVs of
all properties within the district. When property values in the district increase due to
improvements or development, the increases above the district’s original tax capacity are
captured and referred to as the captured tax capacity. The auditor also certifies an original tax
rate in the TIF district when it is created. This is the total tax rate that applies to the district and
includes taxes by all local governments in the district. The final tax increment in the TIF district
is calculated by multiplying the original tax rate by the captured tax capacity. Local
governments must take care in establishing an appropriate base rate. In the past, base rates have
been established that do not include inflation, which results in an overestimation of the tax
increment to which the developer is entitled. The increments are also known as payments in-lieu-
of-taxes or PILOTS. In many cases, TIFs also have provisions for new economic activity taxes,
which include sales taxes and utility taxes on new activity for the year prior to establishment of
TIFs. Much like TIFs, TRZs, have similar provisions for the increments that are typically
deposited in an account. TRZs do not, however, allow for revenue generation from other sources
like sales taxes like TIFs.
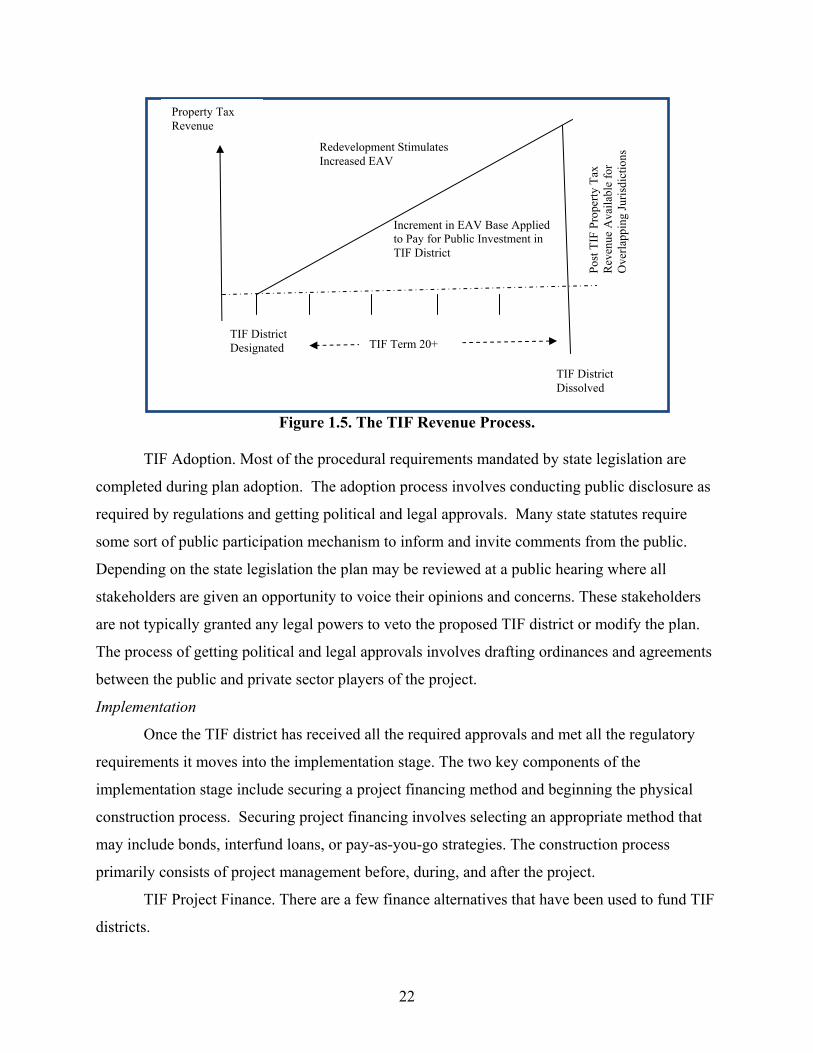
22
Figure 1.5. The TIF Revenue Process.
TIF Adoption. Most of the procedural requirements mandated by state legislation are
completed during plan adoption. The adoption process involves conducting public disclosure as
required by regulations and getting political and legal approvals. Many state statutes require
some sort of public participation mechanism to inform and invite comments from the public.
Depending on the state legislation the plan may be reviewed at a public hearing where all
stakeholders are given an opportunity to voice their opinions and concerns. These stakeholders
are not typically granted any legal powers to veto the proposed TIF district or modify the plan.
The process of getting political and legal approvals involves drafting ordinances and agreements
between the public and private sector players of the project.
Implementation
Once the TIF district has received all the required approvals and met all the regulatory
requirements it moves into the implementation stage. The two key components of the
implementation stage include securing a project financing method and beginning the physical
construction process. Securing project financing involves selecting an appropriate method that
may include bonds, interfund loans, or pay-as-you-go strategies. The construction process
primarily consists of project management before, during, and after the project.
TIF Project Finance. There are a few finance alternatives that have been used to fund TIF
districts.
Increment in EAV Base Applied to Pay for Public Investment in TIF District
Property Tax Revenue
TIF District Dissolved
TIF District Designated TIF Term 20+
Redevelopment Stimulates Increased EAV
Post
TIF
Pro
perty
Tax
R
even
ue A
vaila
ble
for
Ove
rlapp
ing
Juris
dict
ions
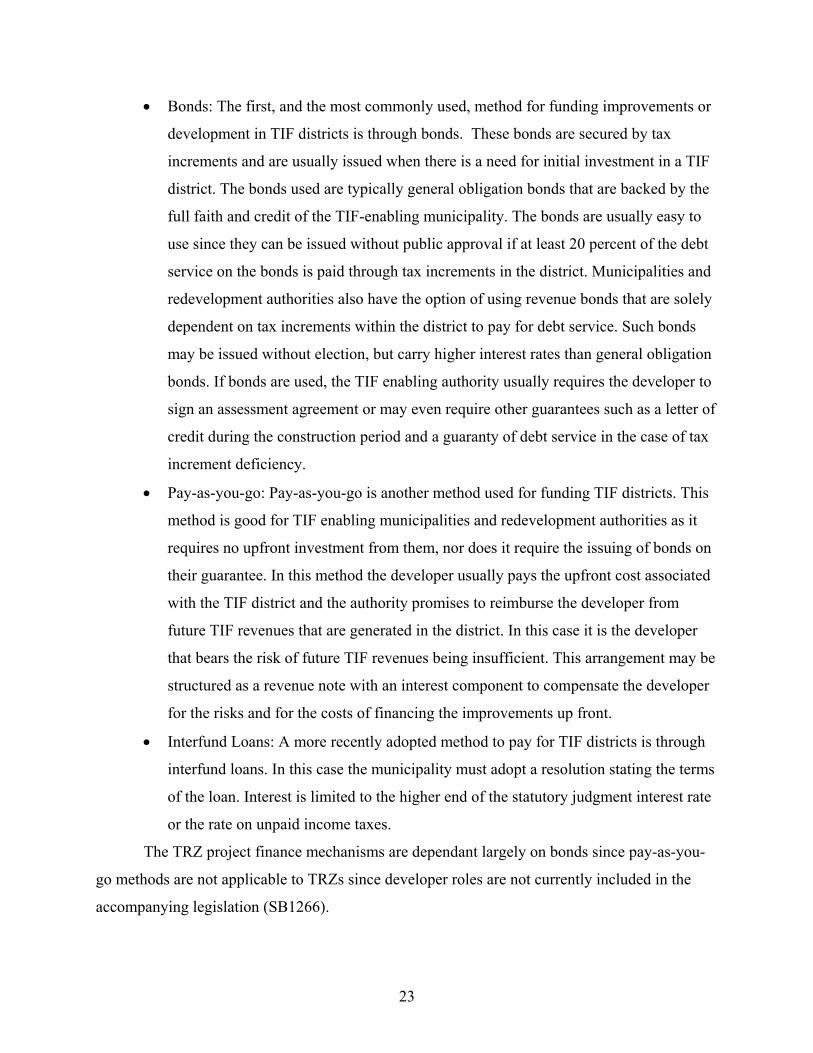
23
• Bonds: The first, and the most commonly used, method for funding improvements or
development in TIF districts is through bonds. These bonds are secured by tax
increments and are usually issued when there is a need for initial investment in a TIF
district. The bonds used are typically general obligation bonds that are backed by the
full faith and credit of the TIF-enabling municipality. The bonds are usually easy to
use since they can be issued without public approval if at least 20 percent of the debt
service on the bonds is paid through tax increments in the district. Municipalities and
redevelopment authorities also have the option of using revenue bonds that are solely
dependent on tax increments within the district to pay for debt service. Such bonds
may be issued without election, but carry higher interest rates than general obligation
bonds. If bonds are used, the TIF enabling authority usually requires the developer to
sign an assessment agreement or may even require other guarantees such as a letter of
credit during the construction period and a guaranty of debt service in the case of tax
increment deficiency.
• Pay-as-you-go: Pay-as-you-go is another method used for funding TIF districts. This
method is good for TIF enabling municipalities and redevelopment authorities as it
requires no upfront investment from them, nor does it require the issuing of bonds on
their guarantee. In this method the developer usually pays the upfront cost associated
with the TIF district and the authority promises to reimburse the developer from
future TIF revenues that are generated in the district. In this case it is the developer
that bears the risk of future TIF revenues being insufficient. This arrangement may be
structured as a revenue note with an interest component to compensate the developer
for the risks and for the costs of financing the improvements up front.
• Interfund Loans: A more recently adopted method to pay for TIF districts is through
interfund loans. In this case the municipality must adopt a resolution stating the terms
of the loan. Interest is limited to the higher end of the statutory judgment interest rate
or the rate on unpaid income taxes.
The TRZ project finance mechanisms are dependant largely on bonds since pay-as-you-
go methods are not applicable to TRZs since developer roles are not currently included in the
accompanying legislation (SB1266).
24
Construction. Once financing for the project is available, the construction process can
begin. The land for the project is obtained and prepared for construction to start. Construction
management is important, as delays or increases in construction costs can significantly hamper
the success of a TIF district. Finally, once construction is completed, post-construction
management is used to keep the district healthy and functional so that the benefits of the
construction may be captured through tax increments. With both TIFs and TRZs the construction
stage associated with right-of-way acquisition of parcels presents challenges for success.
Monitoring and Termination
The monitoring and termination of TIF districts is pivotal to their success. Once a TIF
project has successfully been constructed it requires constant monitoring to determine that the
district is meeting its revenue expectations. Termination of the project is usually regulated by
state-level TIF enabling legislation. Projects usually require a substantial amount of monitoring
to ensure the successful and fair use of TIF. This is mainly due to the fact that a majority of state
regulations and mandates regarding the use of TIF are applicable only until the implementation
of the project. Once a project is underway, there is no significant guidance or regulations. Since
the physical and financial landscapes of cities are fluid, the practical use of TIF requires frequent
monitoring. To ensure that TIF projects are relevant and stay on track, many states have annual
reporting requirements to track the status of TIF projects. Similarly, TRZs also require
continuous or dynamic monitoring and evaluation to maximize fiscal responsibility and revenue
compliance.
Plan Termination. In most cases the TIF enabling statues also regulate the period of time
over which the objectives of the TIF project must be met. In terms of termination, the lifespan of
TIF districts varies across states. In Massachusetts the time limit is 20 years, in West Virginia 30
years, and in Florida 40 years. Some states fix a maximum period and give the municipalities or
redevelopment authorities the flexibility to terminate the district whenever they feel it is
appropriate. On the other hand states such as Texas and Georgia do not specify a time limit but
wait until the initiating jurisdiction votes to terminate the district, typically when all
redevelopment costs have been paid. Even in states without legal limits, TIF districts tend to last
for 20–25 years. This is because most TIF projects require 20–25 years to generate net benefits
for local governments. Some states allow TIF districts to last as long as the project objectives are
met or until the governing authority decides to terminate the project. In regard to the lifespan of
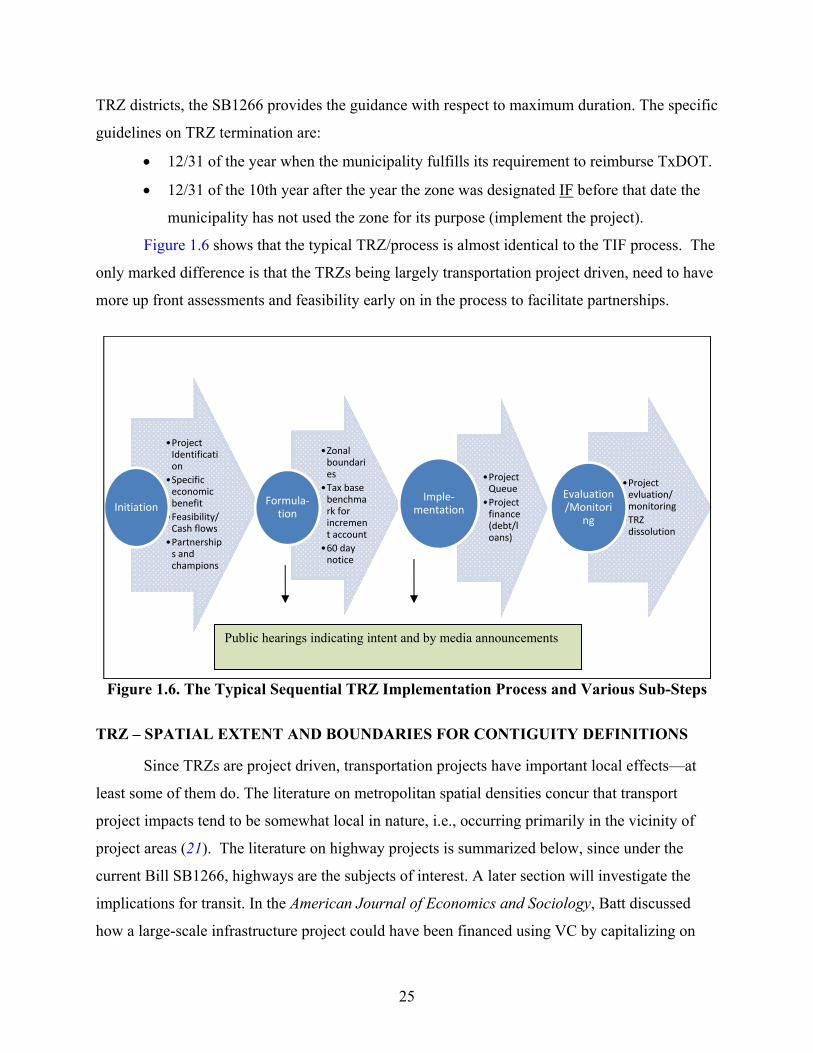
25
TRZ districts, the SB1266 provides the guidance with respect to maximum duration. The specific
guidelines on TRZ termination are:
• 12/31 of the year when the municipality fulfills its requirement to reimburse TxDOT.
• 12/31 of the 10th year after the year the zone was designated IF before that date the
municipality has not used the zone for its purpose (implement the project).
Figure 1.6 shows that the typical TRZ/process is almost identical to the TIF process. The
only marked difference is that the TRZs being largely transportation project driven, need to have
more up front assessments and feasibility early on in the process to facilitate partnerships.
Figure 1.6. The Typical Sequential TRZ Implementation Process and Various Sub-Steps
TRZ – SPATIAL EXTENT AND BOUNDARIES FOR CONTIGUITY DEFINITIONS
Since TRZs are project driven, transportation projects have important local effects—at
least some of them do. The literature on metropolitan spatial densities concur that transport
project impacts tend to be somewhat local in nature, i.e., occurring primarily in the vicinity of
project areas (21). The literature on highway projects is summarized below, since under the
current Bill SB1266, highways are the subjects of interest. A later section will investigate the
implications for transit. In the American Journal of Economics and Sociology, Batt discussed
how a large-scale infrastructure project could have been financed using VC by capitalizing on
•Project Identification
•Specific economic benefit
•Feasibility/Cash flows
•Partnerships and champions
Initiation
•Zonal boundaries
•Tax base benchmark for increment account
•60 day notice
Formula‐tion
•Project Queue
•Project finance (debt/loans)
Imple‐mentation
•Project evluation/monitoring
•TRZ dissolution
Evaluation/Monitori
ng
Public hearings indicating intent and by media announcements
26
the land value created in the vicinity of transportation access nodes, and by discouraging
speculators to continue holding their parcels off the market in expectation of future gains. He
notes that the mechanism is likely to be stable, simple, administrable, progressive, and most of
all, economically efficient (22). Among the key points made that are of relevance to this paper
are how VC could have been deployed for a 9-mile stretch of I-87 (a portion of the New York
State Interstate Highway) and within a 2-mile buffer-zone around the corridor. This was a
Greenfield redevelopment project.
Price increases of up to 1,274 percent for remaining private lands within 1/2 mile of the
corridor, 894 percent for lands between 1/2 to 1 mile, and 647 percent increase for those between
1 to 2 miles of the corridor for a total of 831 percent increase for the entire corridor lands over a
period of over 35 years. A total of 30,516 acres were impacted and the gains in value were
reported at $3.73 billion with gains highest to properties between 1–2 miles from the corridor.
Smith and Gihring emphasized the value of longitudinal models to predict increase in
land values to support debt financing of transportation projects (23). In similar studies, Huang
conducted research of roadway and transit projects and identified their impact on the property
values. Moreover, he noted that most suggest a positive premium and a general pattern of
diminishing premiums over older and newer studies (24). Carey also noted that impacts in value
appraisal tend to be positive for multifamily and commercial properties (25), while Boarnet et al.
(26) point to access premiums for single-family homes. In more recent studies Vadali (27, 28)
concurred with Boarnet and Carey’s findings, and described various aspects regarding area,
location, size, and timing of impacts in real estate in conjunction with new capacity projects in
the Dallas region. Using an extensive database of data-transactions over a 20-year period,
spanning the boom and bust of the real estate cycle in Dallas for attached and detached housing,
the results suggested that there were systematic location patterns in impact on property values.
However, the size of the positive impact is anisotropic and is determined by the micro-location
of the project in that it is greatest where the maximum synergies for capitalization exist (central
business districts) and tends to diminish toward suburbs and exurbs. This pattern could have
important implications for financing large scale infrastructure improvements via VC in
congested urban areas. The impacts on real property were concentrated in regions within 1 mile,
and extended to 2 miles especially in regions of contiguous development, such as on immediate
segment of the corridors radiating out from the central business district. With respect to timing,
27
impacts tend to occur as early as 3–5 years from opening of transportation infrastructure as an
anticipatory response.
The implications of all of these findings for planning and financing purposes of VC zones
like a TRZ are:
• They should be set up early in the planning process of large scale transportation
projects with significant capacity and access changes to capture anticipatory gains.
• They should cover a maximum of 1 mile around the corridor.
• Positive impacts cannot occur for all project types or conditions; only large scale
projects that confer significant accessibility change (inter-regional or intra-regional)
or new projects that open up regions for development via enhanced access provided
to old and known new activity nodes offer the greatest potential for maximizing VC.
• They have the greatest potential in dense networks with developable land or rapidly
growing regions that can benefit from accessibility benefits brought about by
transportation projects.
All of these have significant implications for the Pass-Through component of SB1266
that allows a whole range project types to be considered for Pass-Through finance including
safety and redevelopment. Not all of these Pass-Through projects can support value capture.
Projects that enhance accessibility, connectivity by augmenting multi-modal access, and levels of
service provide should be the primary projects that support TRZs. Other ancillary projects within
those zones that meet Pass-Through requirements could then simultaneously benefit from
increment finance.
The same literature also tends to suggest that theoretical boundaries of contiguous parcels
that should be part of a TRZ boundary should be no more than 1 mile on either side from the
project centerline for large scale projects. Smaller projects with even more local effects like
interchanges should not exceed 1/2 mile on either side. Thereafter, within those maximum
bounds, practical considerations like political support and revenue needs should be the guiding
factors in establishing spatial boundaries for highway projects.
TRZ – IMPLEMENTATION EXAMPLES AND STATE OF THE PRACTICE IN TEXAS
To date, three local governments in Texas have implemented TRZs: the City of El Paso,
the City of Forney located in Kaufman County, and Hidalgo County. This task identifies the
28
similarities and differences in the ways these local entities have approached the implementation
of SB1266 and explains the circumstances driving those differences.
TTI investigated the following documents as primary sources to develop the state of the
practice implementation examples:
• The Texas Transportation Funding Challenge report by Dye Management Group (29).
• Financial Evaluation of TRZ for the City of El Paso report (30).
• Keep Forney Moving website from Pate Transportation Partners (31).
• The Hidalgo County Road Builders original website, a subsidiary of Pate
Transportation Partners and communication with the Hidalgo County Regional
Mobility Authority (32).
• Hidalgo County Socioeconomic and Real Estate Analysis Related to the Hidalgo
Loop (33) (by the company Txp).
The information in these documents has been complemented with direct input from
stakeholders from the cities of El Paso and Forney, and Hidalgo County. Table 1.3 summarizes
the implementation examples in a general manner. There is limited available information of the
challenges associated with the evaluation of the value capture potential of a TRZ, the potential
circumstances when they might be appropriate, and the requirements and challenges associated
with the data acquisition, aggregation, and financial analysis processes and protocols. In other
words, in the three cases studied there is no uniform approach to analyze the TRZ
implementation feasibility in a determined location. The process was different in each of the
three case studies.
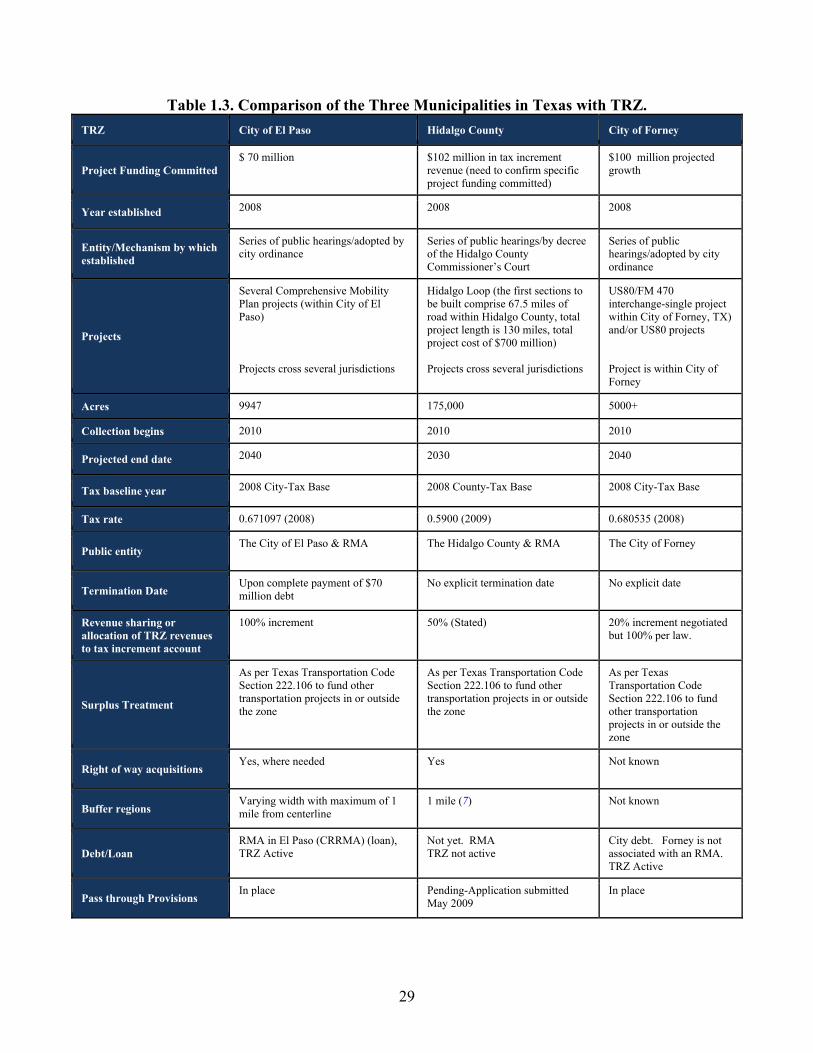
29
Table 1.3. Comparison of the Three Municipalities in Texas with TRZ. TRZ City of El Paso Hidalgo County City of Forney
Project Funding Committed $ 70 million $102 million in tax increment
revenue (need to confirm specific project funding committed)
$100 million projected growth
Year established 2008 2008 2008
Entity/Mechanism by which established
Series of public hearings/adopted by city ordinance
Series of public hearings/by decree of the Hidalgo County Commissioner’s Court
Series of public hearings/adopted by city ordinance
Projects
Several Comprehensive Mobility Plan projects (within City of El Paso) Projects cross several jurisdictions
Hidalgo Loop (the first sections to be built comprise 67.5 miles of road within Hidalgo County, total project length is 130 miles, total project cost of $700 million) Projects cross several jurisdictions
US80/FM 470 interchange-single project within City of Forney, TX) and/or US80 projects Project is within City of Forney
Acres 9947 175,000 5000+
Collection begins 2010 2010 2010
Projected end date 2040 2030 2040
Tax baseline year 2008 City-Tax Base 2008 County-Tax Base 2008 City-Tax Base
Tax rate 0.671097 (2008) 0.5900 (2009) 0.680535 (2008)
Public entity The City of El Paso & RMA The Hidalgo County & RMA The City of Forney
Termination Date Upon complete payment of $70 million debt
No explicit termination date No explicit date
Revenue sharing or allocation of TRZ revenues to tax increment account
100% increment 50% (Stated) 20% increment negotiated but 100% per law.
Surplus Treatment
As per Texas Transportation Code Section 222.106 to fund other transportation projects in or outside the zone
As per Texas Transportation Code Section 222.106 to fund other transportation projects in or outside the zone
As per Texas Transportation Code Section 222.106 to fund other transportation projects in or outside the zone
Right of way acquisitions Yes, where needed Yes Not known
Buffer regions Varying width with maximum of 1 mile from centerline
1 mile (7) Not known
Debt/Loan RMA in El Paso (CRRMA) (loan), TRZ Active
Not yet. RMA TRZ not active
City debt. Forney is not associated with an RMA. TRZ Active
Pass through Provisions In place Pending-Application submitted
May 2009 In place
30
The City of El Paso TRZ
The City of El Paso’s TRZ Nos. 2 and 3 (Figures 1.7, 1.8) will encompass approximately
9,947 acres. Collection of the TRZ revenues into the ad valorem tax increment account started in
2010 and will only impact the city portion of a property tax bill (City 2009 tax rate: 0.633 per
$100 valuation). The 2009 city tax base was set up as the baseline for assessing increments over
the duration of the TRZ. Tax revenue increments over and above the baseline value are assumed
to be deposited in a dedicated account—the Transportation Reinvestment Fund. El Paso TRZ is
designed to expire when the $70 million debt is paid off (in addition to interest and other
financing costs), which is expected to occur by December 31, 2040. The revenues will be
generated from properties along the following five corridors that form the TRZ:
• Loop 375 and Zaragoza Rd.
• Northeast Parkway and US 54.
• Transmountain Rd.
• Americas Ave.
• I-10.
• Montana Ave.
Financial Evaluation Approach
The framework used to conduct the financial evaluation of the City of El Paso TRZ Nos.
2 and 3 was based on three main sets of drivers of property value growth along a transportation
corridor when a capacity improvement project is implemented (a with‐project case):
• The type of properties that exist within the TRZ, which are divided into three real
estate groups (shown in Figure 1.9):
o Existing development.
o New development.
o Properties around access points.
• The development of vacant property in the TRZ (new development), including:
o Timing of development.
o Type of development.
o Values attained upon development.
o Pace or speed at which land is developed.
31
Based on the analysis framework described above, a discounted cash flow model was
built to forecast TRZ revenues (30, 34). The revenues were estimated according to the provisions
of SB1266, adopting the 2009 tax base as a baseline (2008 baseline in a preliminary analysis).
The TRZ revenues in each subsequent year were then estimated as the tax revenue for that
particular year less the baseline.
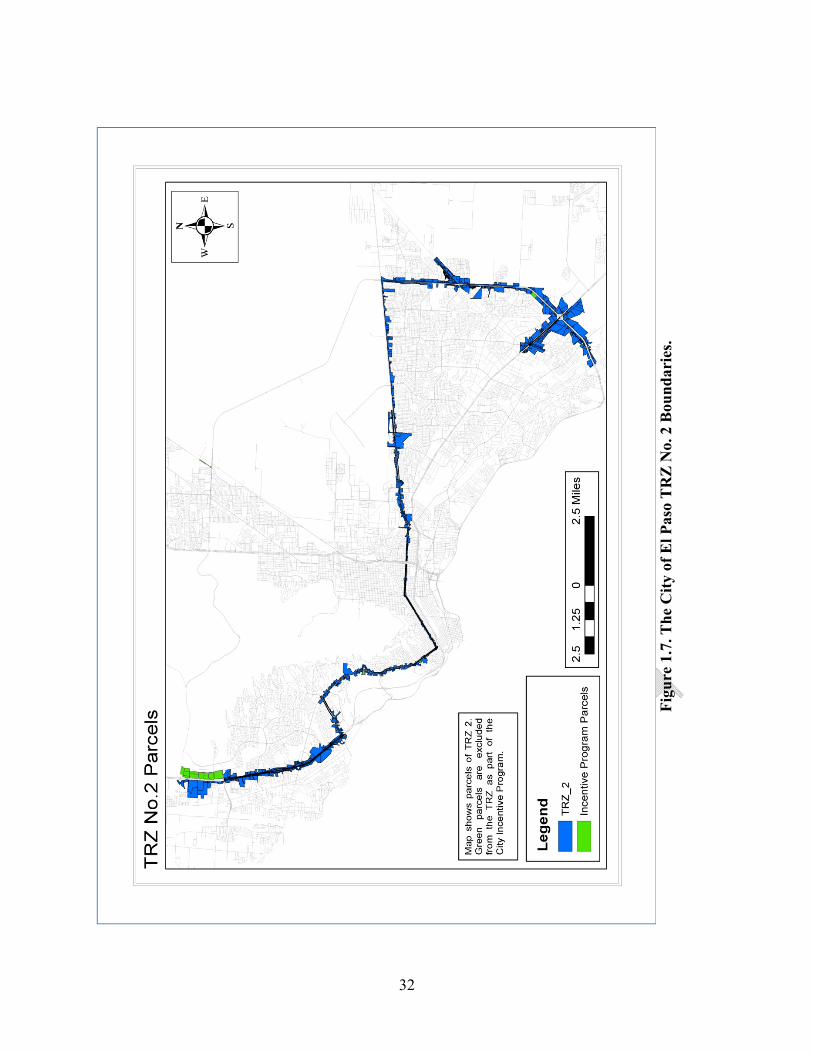
32
32
Fi
gure
1.7
. The
City
of E
l Pas
o T
RZ
No.
2 B
ound
arie
s.
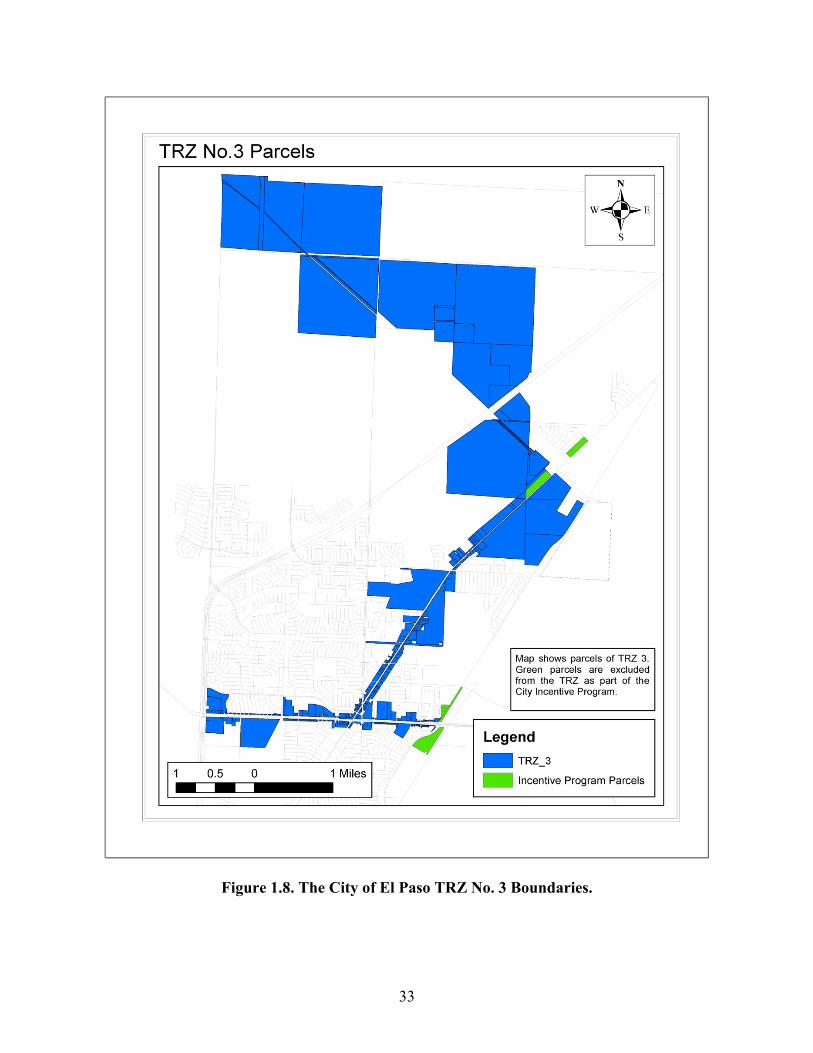
33
Figure 1.8. The City of El Paso TRZ No. 3 Boundaries.
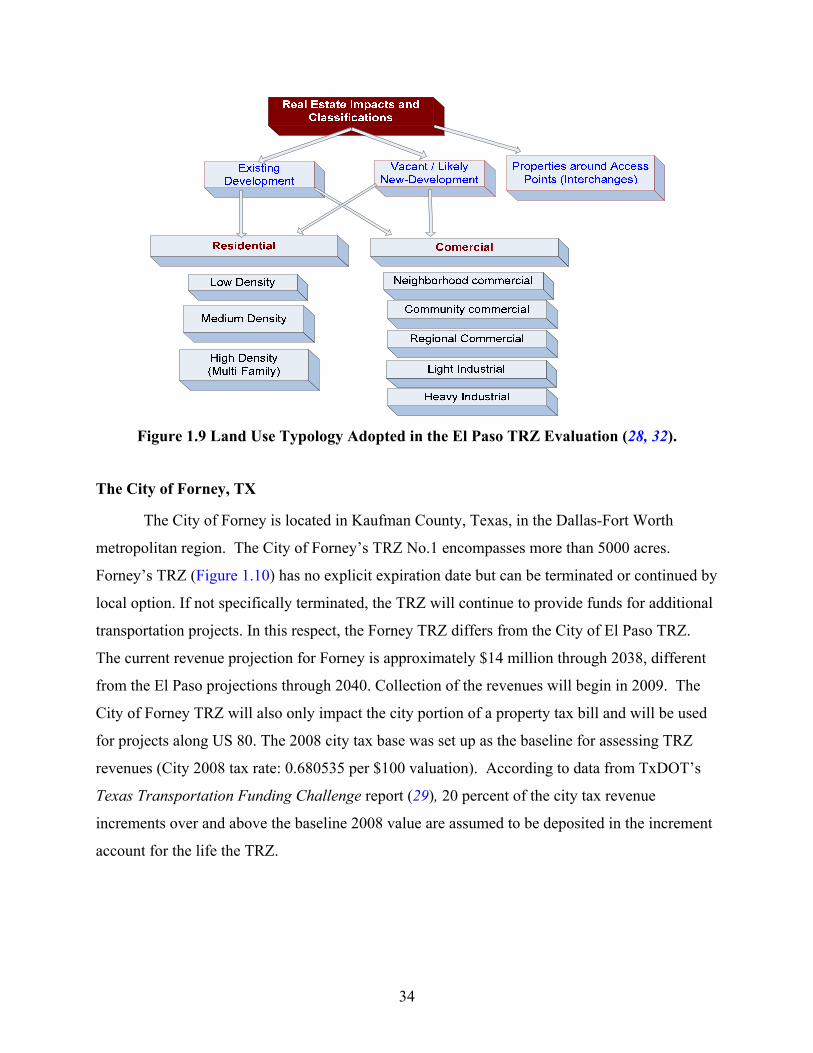
34
Figure 1.9 Land Use Typology Adopted in the El Paso TRZ Evaluation (28, 32).
The City of Forney, TX
The City of Forney is located in Kaufman County, Texas, in the Dallas-Fort Worth
metropolitan region. The City of Forney’s TRZ No.1 encompasses more than 5000 acres.
Forney’s TRZ (Figure 1.10) has no explicit expiration date but can be terminated or continued by
local option. If not specifically terminated, the TRZ will continue to provide funds for additional
transportation projects. In this respect, the Forney TRZ differs from the City of El Paso TRZ.
The current revenue projection for Forney is approximately $14 million through 2038, different
from the El Paso projections through 2040. Collection of the revenues will begin in 2009. The
City of Forney TRZ will also only impact the city portion of a property tax bill and will be used
for projects along US 80. The 2008 city tax base was set up as the baseline for assessing TRZ
revenues (City 2008 tax rate: 0.680535 per $100 valuation). According to data from TxDOT’s
Texas Transportation Funding Challenge report (29), 20 percent of the city tax revenue
increments over and above the baseline 2008 value are assumed to be deposited in the increment
account for the life the TRZ.
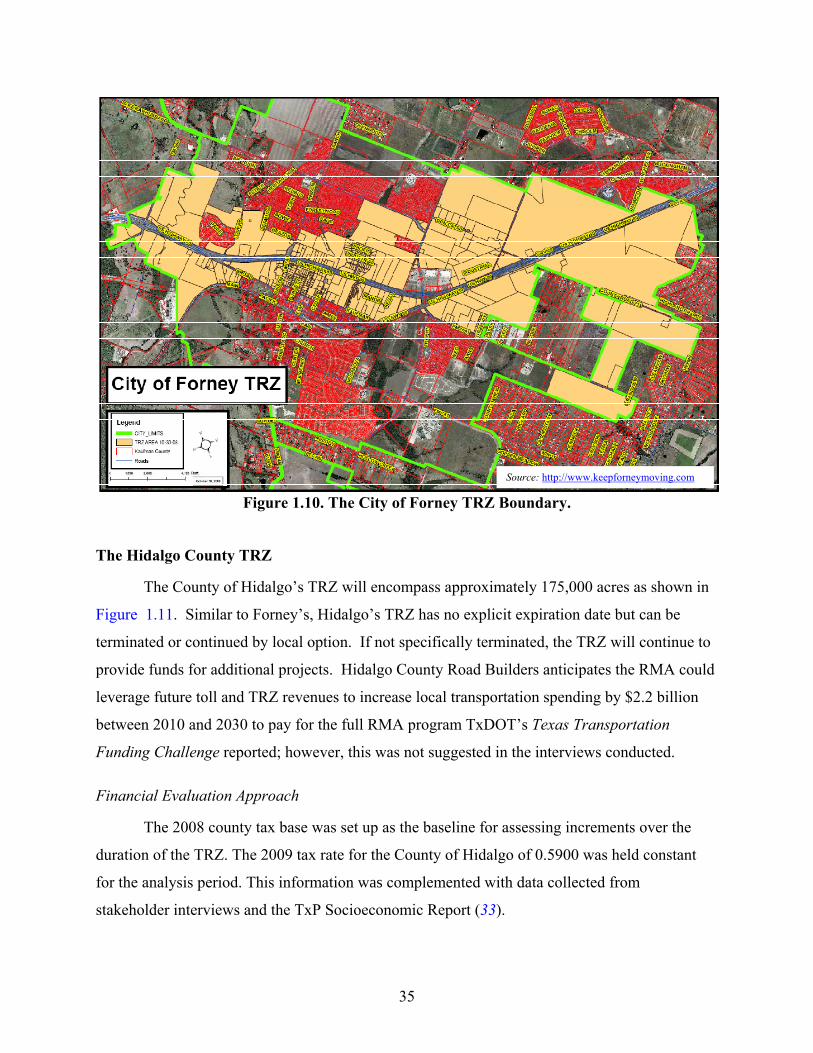
35
Figure 1.10. The City of Forney TRZ Boundary.
The Hidalgo County TRZ
The County of Hidalgo’s TRZ will encompass approximately 175,000 acres as shown in
Figure 1.11. Similar to Forney’s, Hidalgo’s TRZ has no explicit expiration date but can be
terminated or continued by local option. If not specifically terminated, the TRZ will continue to
provide funds for additional projects. Hidalgo County Road Builders anticipates the RMA could
leverage future toll and TRZ revenues to increase local transportation spending by $2.2 billion
between 2010 and 2030 to pay for the full RMA program TxDOT’s Texas Transportation
Funding Challenge reported; however, this was not suggested in the interviews conducted.
Financial Evaluation Approach
The 2008 county tax base was set up as the baseline for assessing increments over the
duration of the TRZ. The 2009 tax rate for the County of Hidalgo of 0.5900 was held constant
for the analysis period. This information was complemented with data collected from
stakeholder interviews and the TxP Socioeconomic Report (33).
Source: http://www.keepforneymoving.com
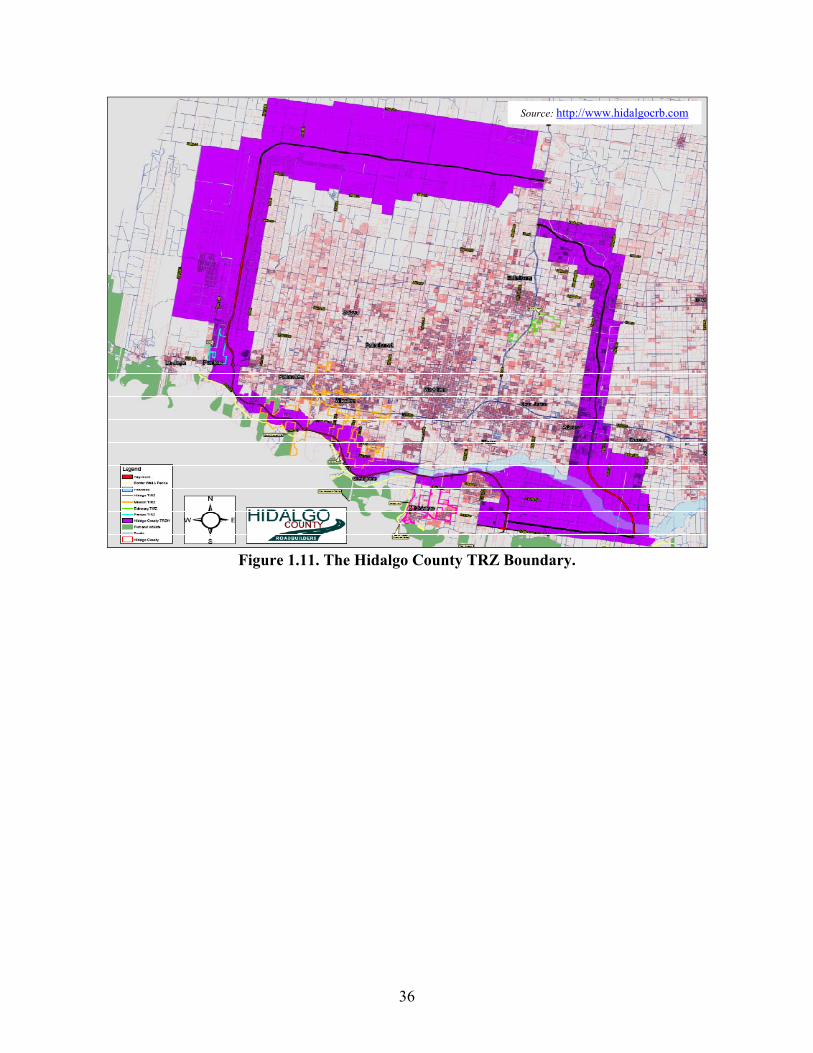
36
Figure 1.11. The Hidalgo County TRZ Boundary.
Source: http://www.hidalgocrb.com
37
CHAPTER 2: SENATE BILL 1266 – IMPLEMENTER PERSPECTIVES AND GENERAL AWARENESS
With the passage of SB1266, local entities were empowered with another tool to help
finance needed infrastructure projects—the TRZ option to facilitate value capture. However, as
is the case with new legislation, numerous lessons are learned by early implementers about the
practicality of the law and other issues associated with its implementation. The ultimate goal of
this research was to see how TRZ development through SB1266 could be augmented. Therefore,
it was critical to document and identify specific issue areas in the law as it currently exists. This
chapter documents the results of interviews conducted with officials from the three local
governments in the state known to have started the process of implementing a TRZ and a few
other stakeholders. This chapter does not present any justifications or explanations beyond
documenting the actual interview findings.
Researchers developed an interview guide that included questions ranging from issues
such as the motivations for using the TRZ mechanism to the process and stakeholder
consultations that were necessary to establish the TRZ, and any issues that were found in this
process, particularly issues related to the guidance provided by the law. A list of individuals
familiar with the establishment of the three existing TRZs was developed in consultation with the
research panel. A total of seven interviews were scheduled and conducted with individuals from
local and state agencies directly involved in the implementation of these TRZs. The interviews
were conducted over the telephone and in person. Appendix A shows the interview guide, the list
of interviewees, and list of questions presented to stakeholders.
The findings from the interviews have been aggregated and summarized around five main
issue areas and researchers have avoided attributing comments to individual interviewees. The
paragraphs that follow present the findings in each of these issue areas. The five
issues/problematic areas identified by the interviewees are:
• County and Municipal TRZs.
• TRZ Boundaries.
• Coupling to Pass-Through.
• TxDOT’s Role.
• Revenue Risk Allocation.
38
COUNTY AND MUNICIPAL TRZS
The provisions in the legislation for county TRZ and municipal TRZs have features that
seem advantageous to one, but disadvantageous for the other, and vice versa.
Administration: County TRZ and Road Utility Districts
First, county TRZ requirements are administratively onerous and confusing to the public,
making it difficult for officials to gain political support to move a TRZ initiative forward. This is
because unlike cities, constitutional restrictions prevent Texas counties from directly leveraging
tax increments through a bond sale. Additionally, cities have ordinance authority, while counties
just have resolution authority.3 As described in Chapter 1, the law prescribes that counties have
to hold a referendum and have a body of elected officials charged with overseeing a RUD. The
county property tax is has to be abated, and then a new RUD tax equal to the tax abatement
enacted, which brings forth the question from the public about why are taxes being abated, and
then a new tax enacted. One of the interviewees suggested that one way to address this issue
would be to amend the Constitution to allow counties to collect a tax increment and also bond
against it.
Percent Increment Allocations for Municipal TRZs
Second, municipalities are implicitly required to dedicate 100 percent of the tax
increment collected in a TRZ to a transportation project, which is perceived as an onerous
proposition for municipalities with TRZs located in areas that are significantly underdeveloped.
In such a situation, future funding for police, traffic, fire, and other municipal essential services
may be adversely affected. On the other hand, the legislation provides county TRZs with
flexibility to dedicate only a portion of the increment to the transportation project. This may not
be an issue in municipal TRZs where the expected revenue stream is not significant because the
redevelopment may occur in areas that are already well developed, and the impact on the
municipal general fund will not be significant. However, in TRZs where significant new
development is expected, and where other public services and new infrastructure to complement
the new road facilities will be needed the 100 percent set aside was perceived as problematic and
leading to diversion of revenues from the general fund. 3 Ordinances are enforceable laws and resolutions are non-binding and unenforceable statements.
39
The purpose section of SB1266 states that if the governing body determines an area to be
unproductive and underdeveloped, it may establish a TRZ to promote a transportation project
that cultivates development or redevelopment of the area. Due to the 100 percent set aside
requirement, the explicit purpose of the legislation to cultivate development was felt to be a
contradiction in terms, because the mechanism itself could impose a burden on a municipality
with TRZ in an underdeveloped area.
TRZ BOUNDARY ADJUSTMENTS AND CONTIGUITY REQUIREMENTS
Currently, the TRZ legislation does not provide express authority to local governments to
amend or adjust the boundaries of a TRZ once it has been established. Although it would be
possible to argue that local governments have implied authority to amend the boundaries of a
TRZ, based on case law and opinion of authority, this was felt questionable. As a matter of fact,
the need to amend the boundaries of the City of El Paso TRZ No. 1 was one of the reasons for its
repealing and the establishment of the subsequent TRZ No. 2 and TRZ No. 3. This lack of clear
authority to amend TRZ boundaries complicates bonding against the revenue streams, because
investors and financial markets lose comfort when an aspect so integral to revenue itself is not
clearly articulated and authorized. Therefore, it is important from a financing standpoint that
provisions to change or modify the boundaries of a TRZ are clearly spelled out in the statute.
The lack of a clear definition of what constitutes contiguity within TRZ boundaries in the
current statutory language is also an issue. This lack of clarity requires local governments to
seek extensive legal assistance when defining the boundaries of a TRZ to ensure that its
contiguity is not disrupted by a piece of property that may be within the geographic limits but
belong to a different government entity (e.g., military facilities or state right of way).
COUPLING TO PASS-THROUGH
In the opinion of some interviewees, the coupling to Pass-Through of the TRZ model was
felt to unnecessarily limit the use of TRZs and add complexity to the implementation process.
This is because the coupling to the Pass-Through program limits the use of TRZs to projects on
the state highway system, negating the possibility of its use for projects on arterials or other
transportation projects. Additionally, TxDOT should not frequently change the Pass-Through
requirements because it creates even more confusion.
40
Also the process to establishing a Pass-Through agreement between the local government
and TxDOT was perceived as onerous because it is subject to a number of interpretations. For
example, in the case of the City of El Paso, the TRZ No. 1 was to provide funding of a total of
four projects, and one of the questions for the municipality in such situation was whether a Pass-
Through agreement was required for every project or one would suffice. A second issue that
illustrates this point is in the case of City of El Paso TRZ No. 1 arrangement; there was an
agreement between the city and the Camino Real Regional Mobility Authority (CRRMA) for the
implementation of the four projects. In this case, the city would implement the TRZ, but TxDOT
would enter into the Pass-Through agreement with the CRRMA, creating an unclear situation
that makes the parties uncomfortable. The process was perceived to add more steps to the
administrative aspect of the project development process.
On the other hand, according to interviewees who were directly familiar with the
legislation process that culminated with the enactment of SB1266, the TRZ mechanism was
initially intended to help local governments to raise more money to leverage pass-through funds.
This was one of the reasons why earlier versions of the legislation included the creation of a state
transportation reinvestment fund. Because the pass through program was popular, the TRZs were
intended to fulfill two purposes. The first one was to provide local governments with the ability
to raise more money to leverage the Pass-Through dollars. The second purpose of the TRZ
program was to help replenish the Pass-Through fund, through the state transportation
reinvestment fund. Ultimately, the final version of the bill enacted did not include this provision.
TXDOT’S ROLE AS PERCEIVED BY INTERVIEWEES
Several interviewees concurred in lack of understanding or guidance of an explicit role
for TxDOT in the use of the TRZ mechanism and concluded that this lack of guidance causes
delays and confusion in the process of project implementation. The legislation currently defines
very clearly the role of municipal and county governments in TRZ financing. However, the
statute is silent regarding TxDOT’s role in the definition, establishment, and facilitation of the
implementation of a TRZ even though it is a partnership. As a result, TxDOT districts have to
“muddle through” their role as the process moves along.
41
REVENUE RISK ALLOCATION
The TRZ legislation does not currently define in any way which party to the TRZ-Pass-
Through funding arrangement is to bear the TRZ revenue risk. Development-based debt is
always difficult to finance, particularly at a time when credit markets have significantly tightened
for local governments. This is particularly true for institutions like Texas RMAs with extremely
short credit histories. In these cases, TxDOT backing in some way or fashion has been common
throughout the state. For example in the case of El Paso TRZs, the CRRMA, and the City of El
Paso pursued a State Infrastructure Bank loan as opposed to a bond issue, because they were
aware that issuing debt using a development-based source of funds would possibly get poor
credit ratings, making it difficult and very expensive. Should the CRRMA have pursued bonding
of the TRZ revenues, interviewees felt it would have been necessary for TxDOT to provide a
backstop to make it happen. When interviewees were asked about their perception of the
potential benefits of having a guarantee facility available to local governments to purchase TRZ
revenue risk coverage, they stated that it would be of significant benefit as it would provide a
clean way of dealing with revenue risk.
TRZ AND SB1266 – GENERAL AWARENESS ACROSS TEXAS CITIES AND COUNTIES
A survey of general awareness was conducted and distributed across Texas through
agencies such as the Texas Municipal League, Texas Association of Counties, and Regional
Mobility Authorities in Texas. The survey instrument is in Appendix A. The survey was active
from December 1, 2009, until February 4, 2010. During that time period 54 responses were
received. However, some of those responses were incomplete. The majority of the respondents
were from counties although there were some responses from cities.
When responding to the question, Please tell us what you know about SB1266, passed in
the 80th Legislature, very few respondents (5) indicated that were aware of the bill and TRZs.
Ironically, eight respondents indicated that they were considering developing a TRZ. However,
some of these responses did not include contact information and there was no way to determine
who sent the response. This indicates that the general awareness of the bill was very low and
only a few agencies/counties/cities had more knowledge of TRZs. Based on follow up phone
calls, the following regions/individuals shared knowledge on TRZs or plans to consider TRZ.
42
Rockwall County Commissioner. Rockwall County had been in several discussions
and formed several planning consortiums with neighboring entities to complete Loop 9. Loop 9
would be an outer loop that traverses Collin, Denton, and Rockwall Counties. The commissioner
informed that Collin County has formed its own toll authority as a way to finance Loop 9. All
the counties had completed some preliminary design of a three-lane roadway and the
Commissioner was determining if the TRZ was the right step for Rockwall County.
Denton County Judge. Denton County may consider developing a TRZ between
Denton and Ft. Worth. The TRZ tool was welcomed but preferred that any new tool the
legislature put forth could be supported as long as the decisions stayed local. “It is important to
leave all options on the table” according to this respondent.
Gaines County Judge. This respondent indicated that Gaines County is a very rural
county with a small population of approximately 15,000. He does not envision much
development happening in the county. However, the county would consider a TRZ for a project
they have been discussing with TxDOT. The project would involve converting a county road to
a farm-to-market (FM) road. This road would tie into existing FM 1788. Most of the project
would be in Andrews County to the south. Completing this project would make an easy
connection to State Highway (SH) 214 and improve access to Midland.
Refugio County Commissioner. Refugio County is a very rural county with a small
population. Funding is very scarce because there is very little tax base. The Commissioner feels
the county is too dependent on oil and gas revenues. The county typically cannot even meet the
match required for TxDOT projects and was very appreciative of these research efforts. The
county has very little staff that can devote time to researching new funding avenues and most do
not understand even the tools that are available. The long-term need is to devote time to
understanding the available options. The county also has issues related to the development of
I-69.
Schleicher County Judge. The Schlieter County Judge was interested in determining if
a TRZ could help to develop a transit district. He is interested in partnering with the Concho
Valley Council of Government (COG). He would like the district to improve bus service and
create stations for intercity buses. He would like for El Dorado to be the hub.
Chambers County Judge. The Chambers County Judge believed Chambers County to
be too rural to take advantage of this as a financing tool.
43
City of Nolanville. The city had not heard of TRZs but was interested in their ability to
fund city infrastructure projects and repair.
City of Pecos. The City of Pecos was very interested in developing a TRZ and had been
contact with private partners, consultants, and TxDOT to develop a rural rail transportation
district. The city has several industries that are interested in moving to the area so they would
like to establish an industrial corridor. The TRZ would support several projects including a rail
spur and switch.
TRZ AND SB1266 – GENERAL AWARENESS WITHIN REGIONAL MOBILITY AUTHORITIES
Often, it is necessary or beneficial for an entity that is considering implementing a TRZ
to partner with a local RMA. RMAs can be entities that establish Pass-Through agreements,
which are a requirement under SB1266. In addition in Texas, RMAs have the authority to issue
debt for projects. In those regions with RMAs, cities and counties may wish to use this
mechanism and risk exceeding their bonding authority. County TRZs in regions with RMAs do
require inter-local agreements with the RMA. Therefore it was necessary to also contact the
RMAs to assess their level of awareness of SB1266 and TRZs. Six of the eight RMAs in Texas
were contacted to ascertain their awareness of TRZs. Hidalgo County and Camino Real were not
contacted since they were already involved in the areas that have already created TRZs.
Grayson County RMA was not at all familiar with TRZs but they had been approached
by several private firms that are interested in partnering with the RMA to complete a tollway
through Grayson County. The Northeast Texas RMA (NETRMA) is very interested in
developing a TRZ to help complete the Loop 49 project around Tyler. However, the board is
opposed to the language in the statute that requires a Pass-Through toll agreement with TxDOT.
The outreach conducted as part of this exercise exposed the knowledge gaps regarding
TRZs. Very little information is available and most entities do not have a clear understanding of
the purpose or intent of this financing tool.

45
CHAPTER 3: TRZ CONCEPTUAL FRAMEWORK AND PROCEDURES FOR TRZ PLANNING, DEVELOPMENT, AND IMPLEMENTATION
The process of developing a TRZ project involves numerous steps. The type of project
authorized to use a TRZ facility plays a critical role in its feasibility. This report was developed
around a framework for supporting decisions related to the development of TRZ projects. The
framework depicts the sequential elements that should be considered in implementing a TRZ
project and builds on Figure 1.5. Features of the framework include the following:
• Incorporation of broader mobility, community, and financial goals, particularly those
involving revenue generation, into the general policy framework for TRZ
development specifically in the initial phases.
• Objective decision making in determining potential project types where TRZs are
warranted and/or revenue generation might be of value.
• The involvement of other local governmental agencies in the process, as well as
multiple opportunities for public input as mandated by the legislation.
• An evaluation and monitoring process to track revenues if expected performance does
not meet desired outcomes since it is tied to a financial stream of annual payments to
defray capital costs.
Figure 3.1 illustrates the broad framework showing the TRZ as part of a longer term
planning strategy for regions that might consider it an additional financing mechanism to meet
their long-term mobility needs.
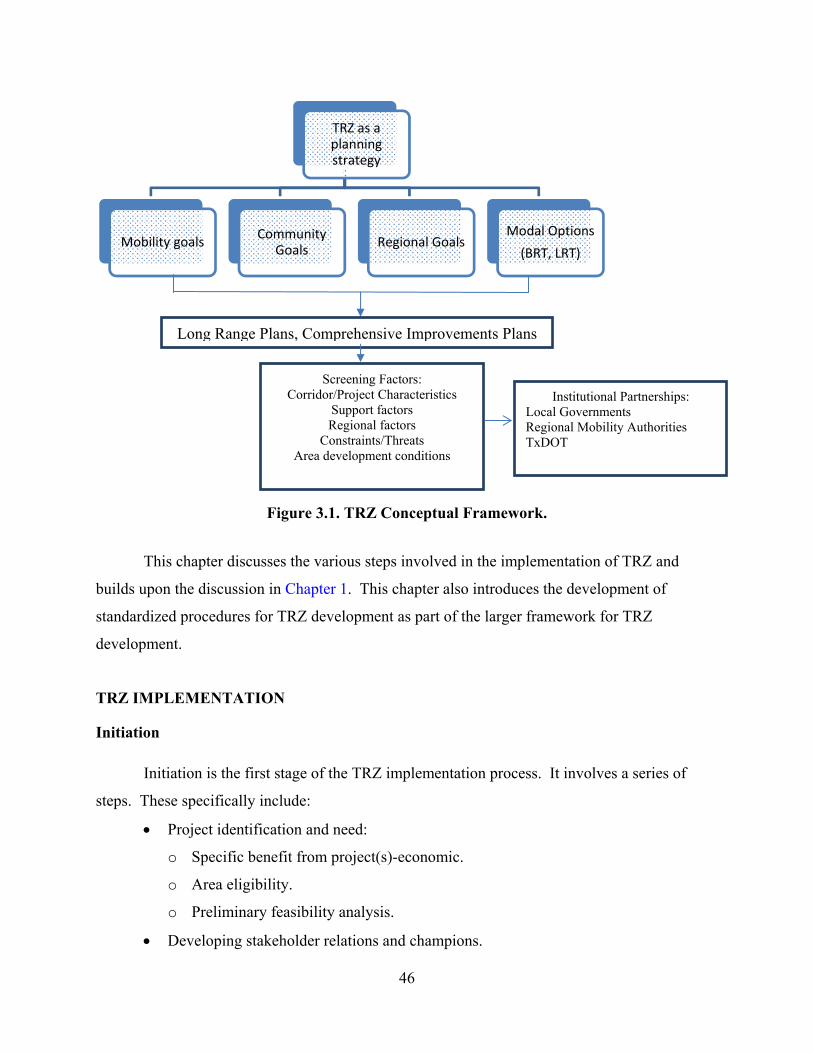
46
Figure 3.1. TRZ Conceptual Framework.
This chapter discusses the various steps involved in the implementation of TRZ and
builds upon the discussion in Chapter 1. This chapter also introduces the development of
standardized procedures for TRZ development as part of the larger framework for TRZ
development.
TRZ IMPLEMENTATION
Initiation
Initiation is the first stage of the TRZ implementation process. It involves a series of
steps. These specifically include:
• Project identification and need:
o Specific benefit from project(s)-economic.
o Area eligibility.
o Preliminary feasibility analysis.
• Developing stakeholder relations and champions.
TRZ as a planning strategy
Mobility goals Community Goals Regional Goals
Modal Options
(BRT, LRT)
Long Range Plans, Comprehensive Improvements Plans
Screening Factors: Corridor/Project Characteristics
Support factors Regional factors
Constraints/Threats Area development conditions
Institutional Partnerships: Local Governments Regional Mobility Authorities TxDOT
47
Project identification and need refers to the process of identifying specific candidate
projects that might be significant from a mobility standpoint and provide other functions. One
way to approach TRZs is on a project by project basis. On the other hand, TRZs may also be
part of a long range strategy where projects from comprehensive plans or long-range plans are
screened for TRZ feasibility. In the latter case, TRZ may also be included in the plans as a
potential financing strategy and as an explicit funding source.
The projects chosen must be shown to provide benefits to the region and address aspects
that lead to economic benefits—a good example is significant accessibility improvement.
Demonstration of the eligibility of the area as undeveloped or underdeveloped is also a
requirement under the legislation. In some projects, this analysis may also be used to satisfy
environmental review documentation. The analysis specifically requires the following
assessments:
• A benefit-cost analysis and/or, an economic impact assessment study of both regional
benefit and local impact derivable from the project.
• A screening to assess whether the project can support a TRZ.
• A preliminary revenue feasibility analysis to assess a project as a TRZ candidate.
• Demonstration of unproductive or underdeveloped land in the corridor using maps.
These analyses could be used to initiate a dialogue with the local government entities and
with other stakeholders to build support. In yet other cases, a local government entity may also
initiate this process, but TxDOT has to become part of the dialogue. These processes and the
entire implementation of a TRZ require a significant amount of interagency collaboration, as the
information and support needed to complete the process has to be assembled from a number of
stakeholders.
Data and Information Needs to Support Initiation
Both economic impact analysis and feasibility analyses involve significant data and
information needs that must be compiled from:
• TxDOT.
• The appraisal districts.
• City council members.
48
• County commissioners.
• RMA, if the region is under the jurisdiction of an RMA.
The types of data include:
• Project related information (costs, tentative limits, general schematics, and project
type).
• Parcel layers from appraisal districts and other sources to define various requirements
like land eligibility followed by TRZ parcels and boundaries.
• Appraisal data.
• Land use information.
• Other supporting information to develop economic impact analysis and screening
study such as demographics.
Hence, developing good solid stakeholder relations and TRZ champions is extremely
important to facilitate various aspects of TRZ development—data sharing being a significant
area of partnership and dialogue.
Zone Formulation
This second stage of implementation involves the following sub steps:
• Define boundaries, zones, parcels.
• Establish benchmark year for tax increment collection.
• Provide a 60-day notice.
• Refine the feasibility analysis.
The first step is to define zone boundaries and identify the parcels that will be within the
TRZ. This requires that a zone map showing all the affected parcels and areas must be
developed as TRZ and the zone must be assigned a number (example, TRZ #1). Following that,
a benchmark year for tax increment collection has to be established as a basis for analysis, i.e.,
the base year for which the TRZ has to designated and benchmarked.
There is a 60-day notice period that needs to take place before the TRZ is designated. The
legislation specifies that the local government hold a public hearing on the creation of the zone,
not later than the 30th day before the date when the TRZ is expected to be designated by either
the City Council or the County Commissioners Court. Not later than the 7th day before the date
49
of the hearing, notice of the hearing and the intent to create the zone must be published in a
newspaper having general circulation in the municipality or county.
During this 60-day period the feasibility analysis must be refined to ensure that the cash
flows will be sufficient to service the debt that the local government is committing to. This
includes generating the highest possible cadastral (parcel) data and refining assumptions related
to pace of development and property values. The revenue feasibility tool plays an increasingly
important role in this phase in the development of revenue consistent buffers and zones. This
tool will be discussed in greater detail in a later section.
TRZ Boundary Development
This is an important step of the zone formulation stage. It specifically involves the
following additional steps:
• Declaration of unproductive/underdeveloped region.
• Actual zonal boundaries limited to a maximum of a 1-mile radius, around the project.
In reality, however, political will and revenue considerations drive the development
of zones.
• Boundaries may be established prior to knowing exact project limits.
TRZ legislation does not yet provide express authority to local governments to amend
boundaries once they are established. Hence, great diligence must be adopted in this stage of
zone formation.
Operationalizing Increment Capture
After the establishment of zones, there must be protocols in place with the local
government to operationalize the capture of the increment. This typically includes the following
sequence of steps:
• Establish Base Year and Base Year Appraised Value.
o The year the TRZ is established.
o The total appraised value of all real property taxable in the TRZ is defined as the
base year appraised value (tax increment base).
• Determine Final Captured Appraised Value.
50
o Total final appraised value (all real property) in TRZ − Tax Increment Base =
Captured Appraised Value.
• Determine Tax Increment.
o Amount of ad valorem taxes levied and collected by the municipality for the year.
• Use the appropriate tax rates—city or county tax rates to develop the portions of tax-
increment set aside as the revenue share.
Adoption of TRZ
One the zones have been finalized, the adoption stage involves a series of opportunities
for public input and comment per legislative mandates in the following ways:
• Public hearings.
• Ordinance (municipal TRZ).
• Decree of the County Commissioner’s Court (county TRZ).
The public hearings provide an opportunity for public comment and feedback on zones of
the TRZ and any other aspect of the TRZ itself. The adoption is finalized by ordinance in the
case of a municipal TRZ and by decree in the case of a county TRZ.
Implementation
The implementation stage is characterized by the following steps:
• Develop a project queue for payout purposes if multiple projects.
• Determination of TRZ financing aspects including amount of debt or loan, payout
schedule, pooling of funding sources, and partnerships to ensure all parties in the
agreement are aware of the financing and recognize their roles in the financial
collaboration.
• Ensure pass through application is in place.
• Facilitate collection processes:
o Road Utility District for county TRZ under SB1266 (same boundaries as TRZ),
o Inter-local agreement (RMA, county through County Commissioner’s Court).
51
Payout Schedule and Pass-Through Application
In the case of a scenario with multiple projects, it is necessary to develop a payout
schedule for payout purposes from the available funding mix to ensure which projects will be
allocated the TRZ funds. This includes ensuring that a Pass-Through application is approved
and that the payout schedule is in synchrony with the financing plan.
Financing Plan
The financing plan must determine the indebtedness or loan amounts to be incurred as
well as bonding entity or loan issuing entity, which is typically an RMA in regions where an
RMA exists or the local government itself in regions without an RMA and ensuring all parties in
the agreement are aware of their roles. The financing plan must also specifically refer to various
revenue sources or types of funds that will be combined together to defray the capital costs.
Examples of various types of funds besides TRZ funds include federal dollars, state dollars, toll
revenues, if applicable and other categories of funds. There must be legal counsel advising the
partners on mixing funding sources as part of a financing strategy. This includes ensuring that a
Pass-Through application is approved and in synchrony with the financing plan. It is also
expected that project costs, base value of the TRZ tax base , and estimated yearly change in tax
base over the duration of the TRZ are included in the financing plan. The last element of the
financing plan is the determination of a strategy to deal with revenue shortfalls in the event there
is such a shortfall.
Establish RUD and Inter-Local Agreement
Under the current legislation, in the case of a county TRZ, there is a need to establish a
RUD with the same boundaries as the TRZ to facilitate the collection of revenues. If an RMA is
to be the implementing agency for the project(s) an inter-local agreement should be established
to enable the flow of funds to that agency.
Monitoring and Evaluation
Monitoring and evaluation are critical steps once such zones are established. To date,
only the El Paso TRZ is also the first fully operational TRZ that has moved to the monitoring
52
phase. The Forney TRZ will be in this stage shortly, while the Hidalgo County TRZ is not yet at
this stage due to issues in the development of RUD.
As part of this stage, local entities would find it in their interest to establish monitoring
and evaluation of TRZ revenues so as to optimize revenue and payment streams. The El Paso
TRZ is adopting a dynamic evaluation and monitoring protocol, whereby revenue may be
tracked to assess how far projections were from actual realizations. This information may be
used for multiple purposes. One example is to provide the greater local government insight into
scenarios when revenue from new development may be lower than expected, allowing the
implementation of targeted actions that may help facilitate development and bring the revenues
to the expected levels.
TRZ DECISION MAKING TOOLS
These standardized procedures were developed because the three implementation
examples indicated little commonality by way of methods or procedures that were adopted.
These procedures are formalized into tool sets/toolkits which a stakeholder/user could use to
determine various aspects of a highway project TRZ development. These tools are independent
tool sets but work together toward a common goal. To make the process of TRZ development
and planning easier, TTI has provided a set of three decision making tools. An attached disk
contains the tools and the user guides for these tools. These tools are as follows:
• TRZ Screening Application Tool: Development of a user-friendly preliminary
screening tool that helps users determine if a TRZ is meaningful for a corridor or a
highway project at the sketch planning level. The specific purpose of this tool is to
answer the question is the specific project located in a specific region TRZ worthy?
TRZ worthiness is described as a situation where a TRZ can be set up and could be
viable with other supporting conditions. This is designed as an Excel® spreadsheet
and will take the stakeholders through an investigation on various aspects of the
project. This tool can be used at various points of a project from very early stages to
more advanced stages. This tool may also be used to screen more than one project at
a time to weed out projects that may not qualify for TRZ development. This tool is
best used well in internal stakeholder investigations by either the city or TxDOT
53
assuming the project will qualify for a Pass-Though application. It is recommended
in the initiation phase.
• A GIS-Based Automated TRZ Development tool option that allows one to explore
and optimize TRZ planning by enabling further scrutiny of land parcels in selected
TRZ buffer zones. It also prepares the land parcels database for preliminary revenue
assessments.
• TRZ Feasibility Tool: This is a tool that is designed to help users/stakeholders
prepare preliminary revenue estimates for a TRZ once it is actually established. It has
additional functionalities important to TRZ establishment including the development
of revenue-consistent TRZ zones and more advanced revenue estimation facilitated
by local calibration of the tool/model. It is designed as a web-based preliminary
revenue feasibility tool. The TRZ Revenue Feasibility tool is currently hosted at:
http://ciitr.tamu.edu/RMC.aspx. This tool is recommended in the initiation stage to
obtain preliminary revenue assessments. It may also be used in the zone formulation
stage, and with high level cadastral data and quality control on inputs at the local
level it may be used to obtain revenue-consistent zones and to facilitate more refined
approximations of revenue as might be needed to facilitate financial agency scrutiny
of stakeholder financial proposals .
Each of these tools will be discussed in the chapters that follow.

55
CHAPTER 4: TRZ DEVELOPMENT DECISION MAKING TOOLS – TRZ WORTHINESS SCREENING TOOL
One of the main objectives of this research was to develop standardized procedures that
may be used in the establishment of future TRZs. This chapter discusses the development of a
screening application that stakeholders may use very early on in the process. The TRZ
Screening tool presented in this chapter is developed to helps users decide whether an individual
project or group of projects will have the potential for value creation. The first section conducts a
review of factors that the research team feels are important and should be considered in a
preliminary screening evaluation. The next section deals with the design of the tool itself, which
is developed as a standalone spreadsheet tool (Software and Hardware Platforms for Tool
Development). The screening tool represents a pre-feasibility tool to suggest if and when a TRZ
would be worthwhile to pursue. It precedes more formal revenue and financial feasibility
analysis performed with the TRZ Revenue Feasibility tool.
The screening tool does not build upon an existing framework, but starts from a
community’s inward-looking process of development and growth where several factors should to
be taken into consideration to suggest whether it would be worthwhile to continue to a more
detailed analysis. Due to its proposed end use, the screening application was conceived as a
simple application relying on even simpler inputs combined with an ability to allow for
introspection of regional flaws and opportunities for TRZ development when used dynamically.
FACTORS CONTRIBUTING TO A SUCCESSFUL TRZ
The screening tool allows agencies to decide whether support conditions exist for the
establishment of a successful TRZ. This initial screening tool is followed by a more advanced
preliminary revenue feasibility tool that allows agencies to further assess projects that have
passed the tier 1 screening for additional information such as likely revenues, payback amounts,
and bondable capacity if needed. The presence of local financing options through TRZ finance
is noted to be a favorable aspect for obtaining a Pass-Though finance application (35) since
SB1266 requires it.
All TRZs will generate some level of income as long net tax rolls are added to. A project
influences tax rolls in two ways: a) in the short term it takes away via tax base loss if there is
right of way acquisition, and b) in the medium to long term it adds to rolls by enhancing values
56
of remaining properties and adding new tax base or new developments. The real question is if
the conditions exist to support the TRZ and if TRZs can be successfully deployed for raising
local matching funds. Many factors can affect TRZ potential associated with transportation
projects. Based on a literature review and previous project experience, a comprehensive set of
factors that have pertinent relationships with TRZ establishment and land development are
identified (34, 36-39).
FACTOR GROUPS
Figure 4.1 shows five categories of factors that could contribute toward a successful
TRZ. These are broken down into:
• Support factors: These factors are highly critical in the physical establishment of a
planning initiative like TRZ much like TIFs and TIRZs. This category refers to
factors that are important in establishing boundaries. The following three groups
point to the ability for TRZ’s to be successful.
• Project specific factors: These factors pertain to the specific project(s) that warrant
the TRZ since not all projects are TRZ-worthy in the sense that, not all projects are
capable of creating a positive influence on development.
• Area development conditions and development constraints: These two sets of factors
point to land conditions in project vicinity and explore the potential for land favorable
development impacts.
• Regional factors are those associated with the regional macroeconomic conditions
and trends that create conditions for successful land development.
Factor Scores and Global Weight Scores
To facilitate the design and application of the screening tool, a standard score range of 0–
5 is assigned to each of the factors, with five indicating maximum TRZ potential and zero
indicating no potential. Each factor is further assigned a global weight score at a macro level
(0.25–1 with one representing most significance) to reflect its significance in the overall
assessment of TRZ potential. Global weight scores are established for global factors, i.e., those
factors that are known to be directly associated with either establishment of TRZ as a planning
initiative or TRZ potential once established. Global weight scores are established at four levels
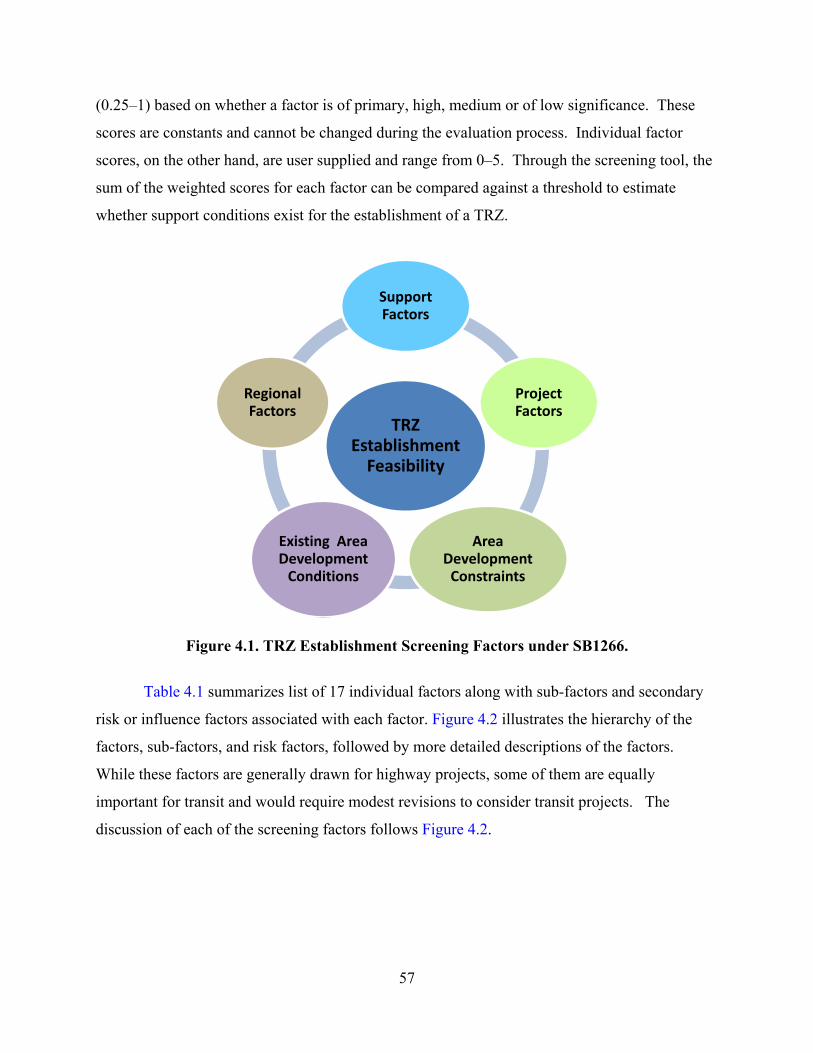
57
(0.25–1) based on whether a factor is of primary, high, medium or of low significance. These
scores are constants and cannot be changed during the evaluation process. Individual factor
scores, on the other hand, are user supplied and range from 0–5. Through the screening tool, the
sum of the weighted scores for each factor can be compared against a threshold to estimate
whether support conditions exist for the establishment of a TRZ.
Figure 4.1. TRZ Establishment Screening Factors under SB1266.
Table 4.1 summarizes list of 17 individual factors along with sub-factors and secondary
risk or influence factors associated with each factor. Figure 4.2 illustrates the hierarchy of the
factors, sub-factors, and risk factors, followed by more detailed descriptions of the factors.
While these factors are generally drawn for highway projects, some of them are equally
important for transit and would require modest revisions to consider transit projects. The
discussion of each of the screening factors follows Figure 4.2.
TRZ Establishment Feasibility
Support Factors
Project Factors
Area Development Constraints
Existing Area Development Conditions
Regional Factors
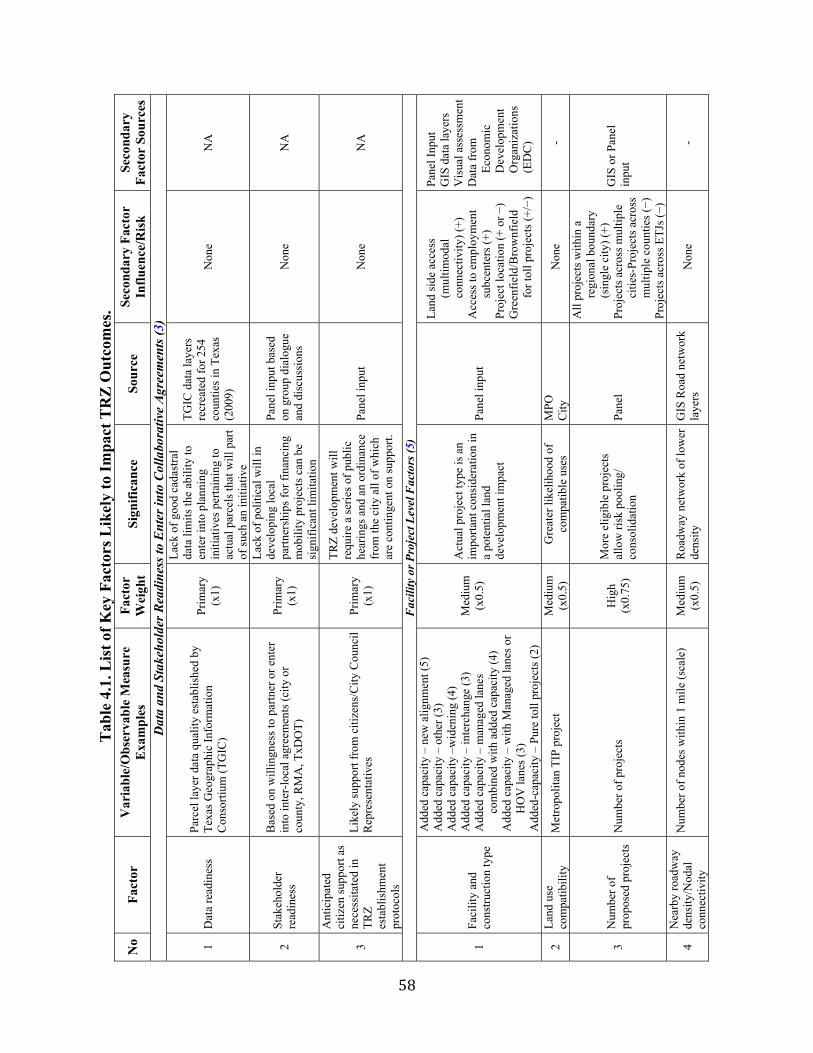
58
Tab
le 4
.1. L
ist o
f Key
Fac
tors
Lik
ely
to Im
pact
TR
Z O
utco
mes
.
No
Fact
or
Var
iabl
e/O
bser
vabl
e M
easu
re
Exa
mpl
es
Fact
or
Wei
ght
Sign
ifica
nce
Sour
ce
Seco
ndar
y Fa
ctor
In
fluen
ce/R
isk
Seco
ndar
y Fa
ctor
Sou
rces
Dat
a an
d St
akeh
olde
r Rea
dine
ss to
Ent
er in
to C
olla
bora
tive
Agr
eem
ents
(3)
1 D
ata
read
ines
s Pa
rcel
laye
r dat
a qu
ality
est
ablis
hed
by
Texa
s Geo
grap
hic
Info
rmat
ion
Con
sorti
um (T
GIC
)
Prim
ary
(x
1)
Lack
of g
ood
cada
stra
l da
ta li
mits
the
abili
ty to
en
ter i
nto
plan
ning
in
itiat
ives
per
tain
ing
to
actu
al p
arce
ls th
at w
ill p
art
of su
ch a
n in
itiat
ive
TGIC
dat
a la
yers
re
crea
ted
for 2
54
coun
ties i
n Te
xas
(200
9)
Non
e N
A
2 St
akeh
olde
r re
adin
ess
Bas
ed o
n w
illin
gnes
s to
partn
er o
r ent
er
into
inte
r-lo
cal a
gree
men
ts (c
ity o
r co
unty
, RM
A, T
xDO
T)
Prim
ary
(x
1)
Lack
of p
oliti
cal w
ill in
de
velo
ping
loca
l pa
rtner
ship
s for
fina
ncin
g m
obili
ty p
roje
cts c
an b
e si
gnifi
cant
lim
itatio
n
Pane
l inp
ut b
ased
on
gro
up d
ialo
gue
and
disc
ussi
ons
Non
e N
A
3
Ant
icip
ated
ci
tizen
supp
ort a
s ne
cess
itate
d in
TR
Z es
tabl
ishm
ent
prot
ocol
s
Like
ly su
ppor
t fro
m c
itize
ns/C
ity C
ounc
il R
epre
sent
ativ
es
Prim
ary
(x
1)
TRZ
deve
lopm
ent w
ill
requ
ire a
serie
s of p
ublic
he
arin
gs a
nd a
n or
dina
nce
from
the
city
all
of w
hich
ar
e co
ntin
gent
on
supp
ort.
Pane
l inp
ut
Non
e N
A
Fac
ility
or P
roje
ct L
evel
Fac
tors
(5)
1 Fa
cilit
y an
d co
nstru
ctio
n ty
pe
Add
ed c
apac
ity –
new
alig
nmen
t (5)
A
dded
cap
acity
– o
ther
(3)
Add
ed c
apac
ity –
wid
enin
g (4
) A
dded
cap
acity
– in
terc
hang
e (3
) A
dded
cap
acity
– m
anag
ed la
nes
com
bine
d w
ith a
dded
cap
acity
(4)
Add
ed c
apac
ity –
with
Man
aged
lane
s or
HO
V la
nes (
3)
Add
ed-c
apac
ity –
Pur
e to
ll pr
ojec
ts (2
)
Med
ium
(x
0.5)
Act
ual p
roje
ct ty
pe is
an
impo
rtant
con
side
ratio
n in
a
pote
ntia
l lan
d de
velo
pmen
t im
pact
Pane
l inp
ut
Land
side
acc
ess
(mul
timod
al
conn
ectiv
ity) (
+)
Acc
ess t
o em
ploy
men
t su
bcen
ters
(+)
Proj
ect l
ocat
ion
(+ o
r −)
Gre
enfie
ld/B
row
nfie
ld
for t
oll p
roje
cts (
+/−)
Pane
l Inp
ut
GIS
dat
a la
yers
V
isua
l ass
essm
ent
Dat
a fr
om
Econ
omic
D
evel
opm
ent
Org
aniz
atio
ns
(ED
C)
2 La
nd u
se
com
patib
ility
M
etro
polit
an T
IP p
roje
ct
Med
ium
(x
0.5)
G
reat
er li
kelih
ood
of
com
patib
le u
ses
MPO
C
ity
Non
e -
3 N
umbe
r of
prop
osed
pro
ject
s N
umbe
r of p
roje
cts
Hig
h (x
0.75
)
Mor
e el
igib
le p
roje
cts
allo
w ri
sk p
oolin
g/
cons
olid
atio
n Pa
nel
All
proj
ects
with
in a
re
gion
al b
ound
ary
(s
ingl
e ci
ty) (
+)
Proj
ects
acr
oss m
ultip
le
citie
s-Pr
ojec
ts a
cros
s m
ultip
le c
ount
ies (−)
Pr
ojec
ts a
cros
s ETJ
s (−)
GIS
or P
anel
in
put
4 N
earb
y ro
adw
ay
dens
ity/N
odal
co
nnec
tivity
Num
ber o
f nod
es w
ithin
1 m
ile (s
cale
)
Med
ium
(x
0.5)
R
oadw
ay n
etw
ork
of lo
wer
de
nsity
G
IS R
oad
netw
ork
laye
rs
Non
e -
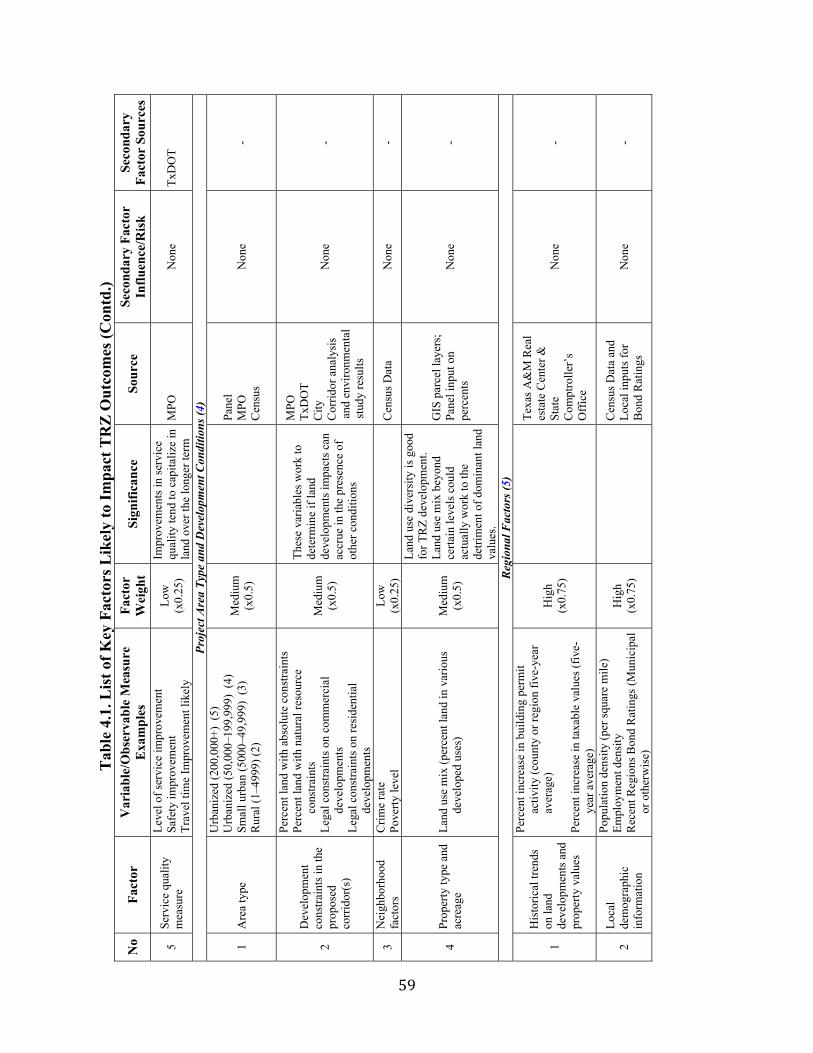
59
Tab
le 4
.1. L
ist o
f Key
Fac
tors
Lik
ely
to Im
pact
TR
Z O
utco
mes
(Con
td.)
No
Fact
or
Var
iabl
e/O
bser
vabl
e M
easu
re
Exa
mpl
es
Fact
or
Wei
ght
Sign
ifica
nce
Sour
ce
Seco
ndar
y Fa
ctor
In
fluen
ce/R
isk
Seco
ndar
y Fa
ctor
Sou
rces
5 Se
rvic
e qu
ality
m
easu
re
Leve
l of s
ervi
ce im
prov
emen
t Sa
fety
impr
ovem
ent
Trav
el ti
me
Impr
ovem
ent l
ikel
y
Low
(x
0.25
)
Impr
ovem
ents
in se
rvic
e qu
ality
tend
to c
apita
lize
in
land
ove
r the
long
er te
rm
MPO
N
one
TxD
OT
Proj
ect A
rea
Type
and
Dev
elop
men
t Con
ditio
ns (4
)
1 A
rea
type
Urb
aniz
ed (2
00,0
00+)
(5)
U
rban
ized
(50,
000–
199,
999)
(4)
Sm
all u
rban
(500
0–49
,999
) (3
) R
ural
(1–4
999)
(2)
Med
ium
(x
0.5)
Pane
l M
PO
Cen
sus
Non
e -
2
Dev
elop
men
t co
nstra
ints
in th
e pr
opos
ed
corr
idor
(s)
Perc
ent l
and
with
abs
olut
e co
nstra
ints
Pe
rcen
t lan
d w
ith n
atur
al re
sour
ce
cons
train
ts
Lega
l con
stra
ints
on
com
mer
cial
de
velo
pmen
ts
Lega
l con
stra
ints
on
resi
dent
ial
deve
lopm
ents
Med
ium
(x
0.5)
Thes
e va
riabl
es w
ork
to
dete
rmin
e if
land
de
velo
pmen
ts im
pact
s can
ac
crue
in th
e pr
esen
ce o
f ot
her c
ondi
tions
MPO
Tx
DO
T
City
C
orrid
or a
naly
sis
and
envi
ronm
enta
l st
udy
resu
lts
Non
e -
3 N
eigh
borh
ood
fact
ors
Crim
e ra
te
Pove
rty le
vel
Low
(x
0.25
)
Cen
sus D
ata
Non
e -
4 Pr
oper
ty ty
pe a
nd
acre
age
Land
use
mix
(per
cent
land
in v
ario
us
deve
lope
d us
es)
Med
ium
(x
0.5)
Land
use
div
ersi
ty is
goo
d fo
r TR
Z de
velo
pmen
t.
Land
use
mix
bey
ond
certa
in le
vels
cou
ld
actu
ally
wor
k to
the
detri
men
t of d
omin
ant l
and
valu
es.
GIS
par
cel l
ayer
s;
Pane
l inp
ut o
n pe
rcen
ts
Non
e -
Reg
iona
l Fac
tors
(5)
1
His
toric
al tr
ends
on
land
de
velo
pmen
ts a
nd
prop
erty
val
ues
Perc
ent i
ncre
ase
in b
uild
ing
perm
it ac
tivity
(cou
nty
or re
gion
five
-yea
r av
erag
e)
Perc
ent i
ncre
ase
in ta
xabl
e va
lues
(fiv
e-ye
ar a
vera
ge)
Hig
h (x
0.75
)
Texa
s A&
M R
eal
esta
te C
ente
r &
Stat
e C
ompt
rolle
r’s
Off
ice
Non
e -
2 Lo
cal
dem
ogra
phic
in
form
atio
n
Popu
latio
n de
nsity
(per
squa
re m
ile)
Empl
oym
ent d
ensi
ty
Rec
ent R
egio
ns B
ond
Rat
ings
(Mun
icip
al
or o
ther
wis
e)
Hig
h (x
0.75
)
Cen
sus D
ata
and
Loca
l inp
uts f
or
Bon
d R
atin
gs
Non
e -
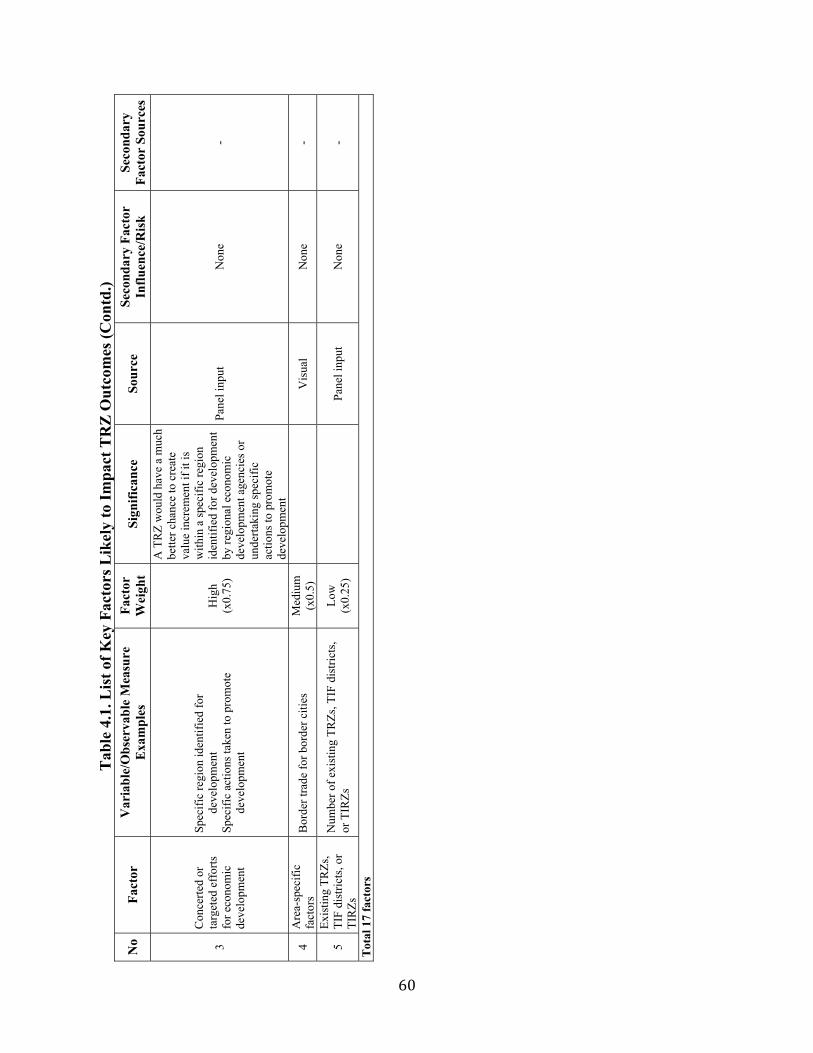
60
Tab
le 4
.1. L
ist o
f Key
Fac
tors
Lik
ely
to Im
pact
TR
Z O
utco
mes
(Con
td.)
No
Fact
or
Var
iabl
e/O
bser
vabl
e M
easu
re
Exa
mpl
es
Fact
or
Wei
ght
Sign
ifica
nce
Sour
ce
Seco
ndar
y Fa
ctor
In
fluen
ce/R
isk
Seco
ndar
y Fa
ctor
Sou
rces
3
Con
certe
d or
ta
rget
ed e
ffor
ts
for e
cono
mic
de
velo
pmen
t
Spec
ific
regi
on id
entif
ied
for
deve
lopm
ent
Spec
ific
actio
ns ta
ken
to p
rom
ote
deve
lopm
ent
Hig
h (x
0.75
)
A T
RZ
wou
ld h
ave
a m
uch
bette
r cha
nce
to c
reat
e va
lue
incr
emen
t if i
t is
with
in a
spec
ific
regi
on
iden
tifie
d fo
r dev
elop
men
t by
regi
onal
eco
nom
ic
deve
lopm
ent a
genc
ies o
r un
derta
king
spec
ific
actio
ns to
pro
mot
e de
velo
pmen
t
Pane
l inp
ut
Non
e -
4 A
rea-
spec
ific
fact
ors
Bor
der t
rade
for b
orde
r citi
es
Med
ium
(x
0.5)
Vis
ual
Non
e -
5 Ex
istin
g TR
Zs,
TIF
dist
ricts
, or
TIR
Zs
Num
ber o
f exi
stin
g TR
Zs, T
IF d
istri
cts,
or T
IRZs
Lo
w
(x0.
25)
Pa
nel i
nput
N
one
-
Tot
al 1
7 fa
ctor
s
61
Figure 4.2. Proposed Factor List Schema.
Criteria Sub-Criteria
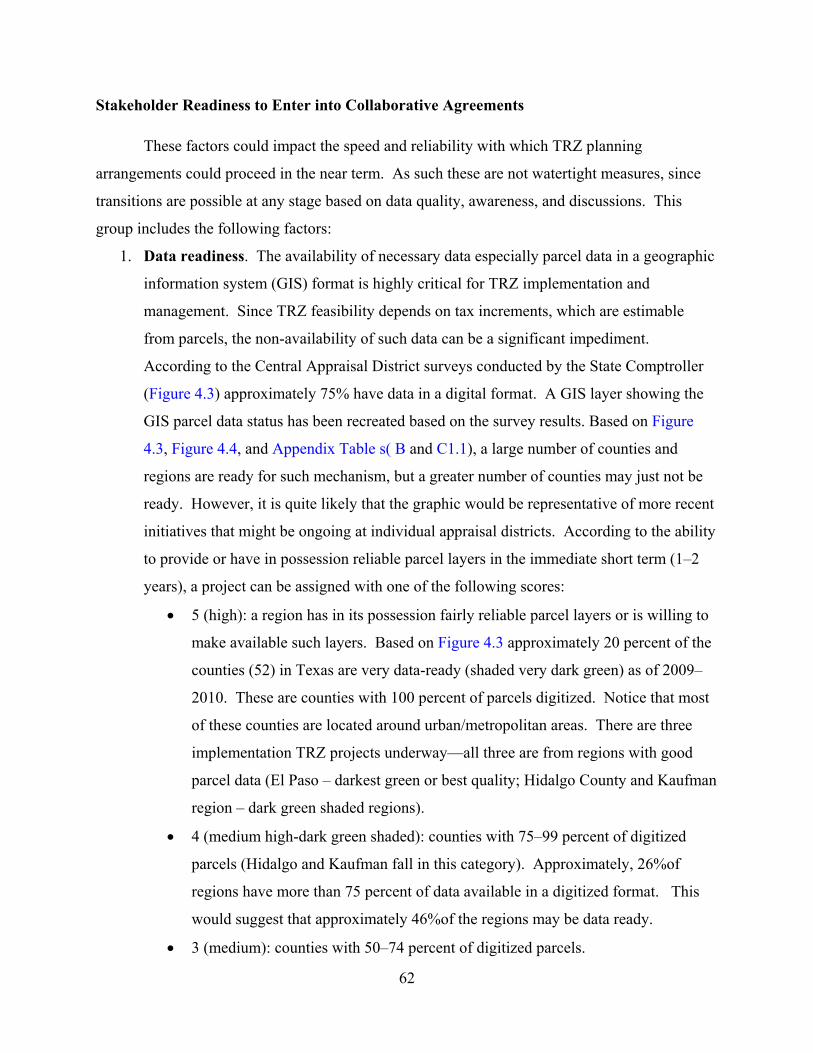
62
Stakeholder Readiness to Enter into Collaborative Agreements
These factors could impact the speed and reliability with which TRZ planning
arrangements could proceed in the near term. As such these are not watertight measures, since
transitions are possible at any stage based on data quality, awareness, and discussions. This
group includes the following factors:
1. Data readiness. The availability of necessary data especially parcel data in a geographic
information system (GIS) format is highly critical for TRZ implementation and
management. Since TRZ feasibility depends on tax increments, which are estimable
from parcels, the non-availability of such data can be a significant impediment.
According to the Central Appraisal District surveys conducted by the State Comptroller
(Figure 4.3) approximately 75% have data in a digital format. A GIS layer showing the
GIS parcel data status has been recreated based on the survey results. Based on Figure
4.3, Figure 4.4, and Appendix Table s( B and C1.1), a large number of counties and
regions are ready for such mechanism, but a greater number of counties may just not be
ready. However, it is quite likely that the graphic would be representative of more recent
initiatives that might be ongoing at individual appraisal districts. According to the ability
to provide or have in possession reliable parcel layers in the immediate short term (1–2
years), a project can be assigned with one of the following scores:
• 5 (high): a region has in its possession fairly reliable parcel layers or is willing to
make available such layers. Based on Figure 4.3 approximately 20 percent of the
counties (52) in Texas are very data-ready (shaded very dark green) as of 2009–
2010. These are counties with 100 percent of parcels digitized. Notice that most
of these counties are located around urban/metropolitan areas. There are three
implementation TRZ projects underway—all three are from regions with good
parcel data (El Paso – darkest green or best quality; Hidalgo County and Kaufman
region – dark green shaded regions).
• 4 (medium high-dark green shaded): counties with 75–99 percent of digitized
parcels (Hidalgo and Kaufman fall in this category). Approximately, 26%of
regions have more than 75 percent of data available in a digitized format. This
would suggest that approximately 46%of the regions may be data ready.
• 3 (medium): counties with 50–74 percent of digitized parcels.
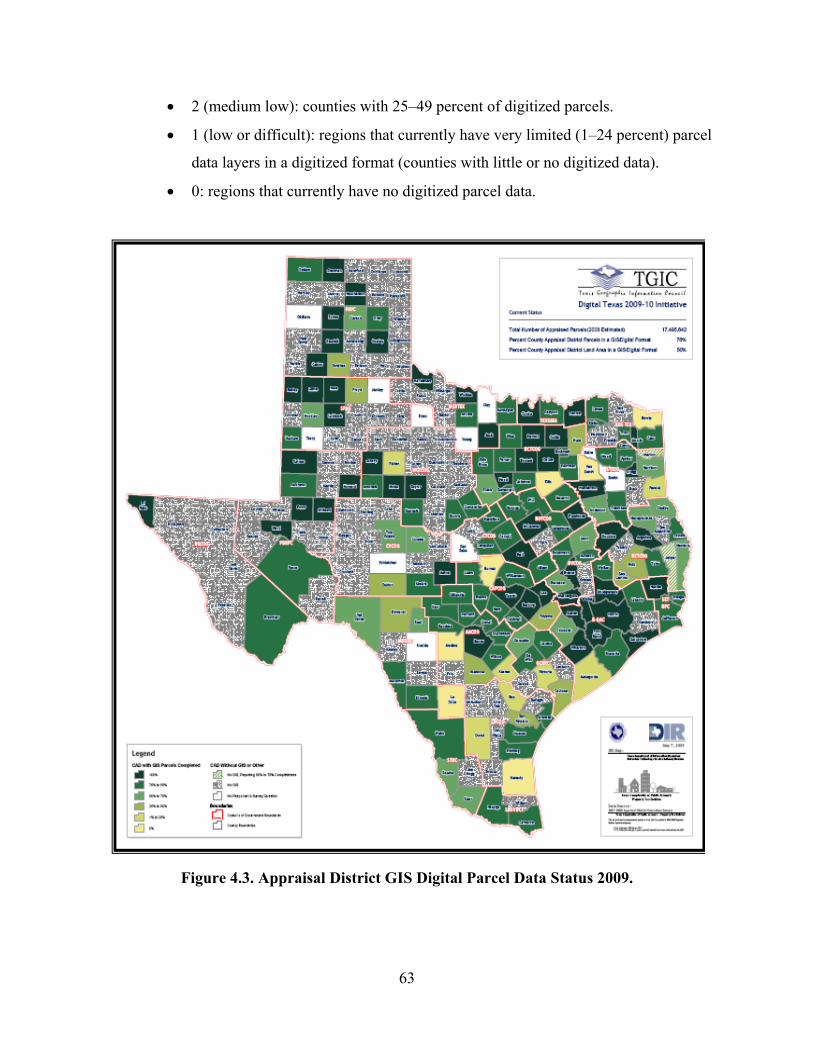
63
• 2 (medium low): counties with 25–49 percent of digitized parcels.
• 1 (low or difficult): regions that currently have very limited (1–24 percent) parcel
data layers in a digitized format (counties with little or no digitized data).
• 0: regions that currently have no digitized parcel data.
Figure 4.3. Appraisal District GIS Digital Parcel Data Status 2009.
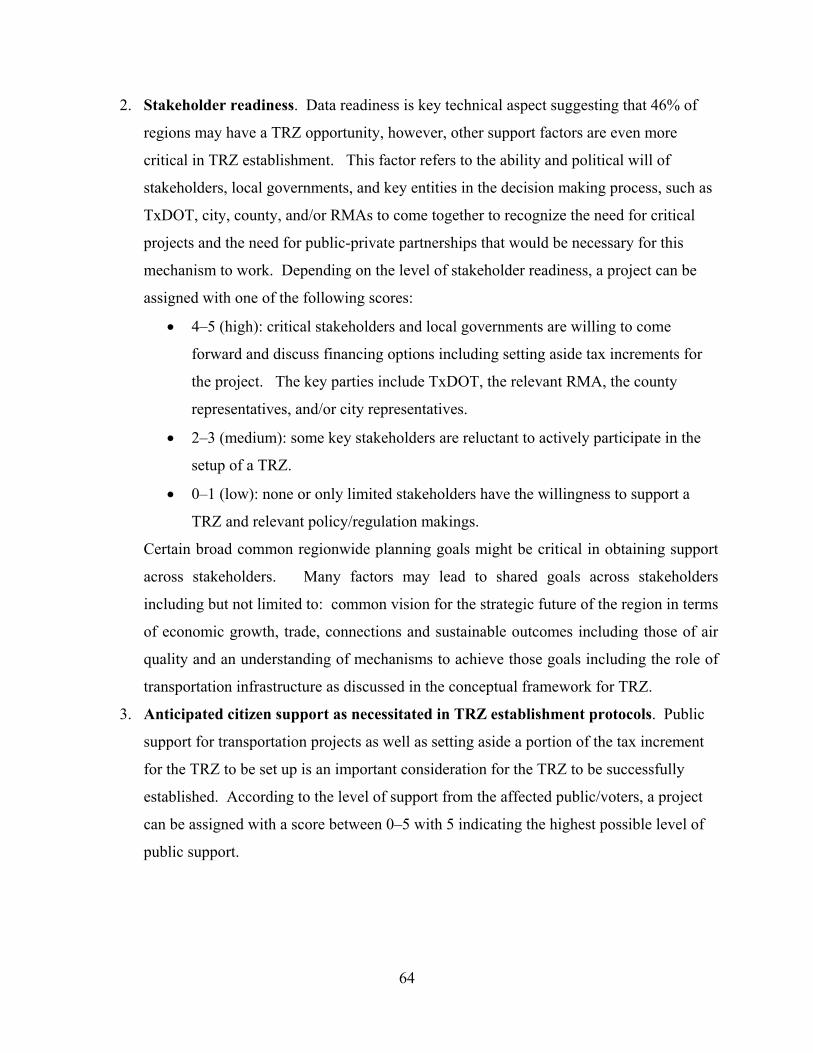
64
2. Stakeholder readiness. Data readiness is key technical aspect suggesting that 46% of
regions may have a TRZ opportunity, however, other support factors are even more
critical in TRZ establishment. This factor refers to the ability and political will of
stakeholders, local governments, and key entities in the decision making process, such as
TxDOT, city, county, and/or RMAs to come together to recognize the need for critical
projects and the need for public-private partnerships that would be necessary for this
mechanism to work. Depending on the level of stakeholder readiness, a project can be
assigned with one of the following scores:
• 4–5 (high): critical stakeholders and local governments are willing to come
forward and discuss financing options including setting aside tax increments for
the project. The key parties include TxDOT, the relevant RMA, the county
representatives, and/or city representatives.
• 2–3 (medium): some key stakeholders are reluctant to actively participate in the
setup of a TRZ.
• 0–1 (low): none or only limited stakeholders have the willingness to support a
TRZ and relevant policy/regulation makings.
Certain broad common regionwide planning goals might be critical in obtaining support
across stakeholders. Many factors may lead to shared goals across stakeholders
including but not limited to: common vision for the strategic future of the region in terms
of economic growth, trade, connections and sustainable outcomes including those of air
quality and an understanding of mechanisms to achieve those goals including the role of
transportation infrastructure as discussed in the conceptual framework for TRZ.
3. Anticipated citizen support as necessitated in TRZ establishment protocols. Public
support for transportation projects as well as setting aside a portion of the tax increment
for the TRZ to be set up is an important consideration for the TRZ to be successfully
established. According to the level of support from the affected public/voters, a project
can be assigned with a score between 0–5 with 5 indicating the highest possible level of
public support.
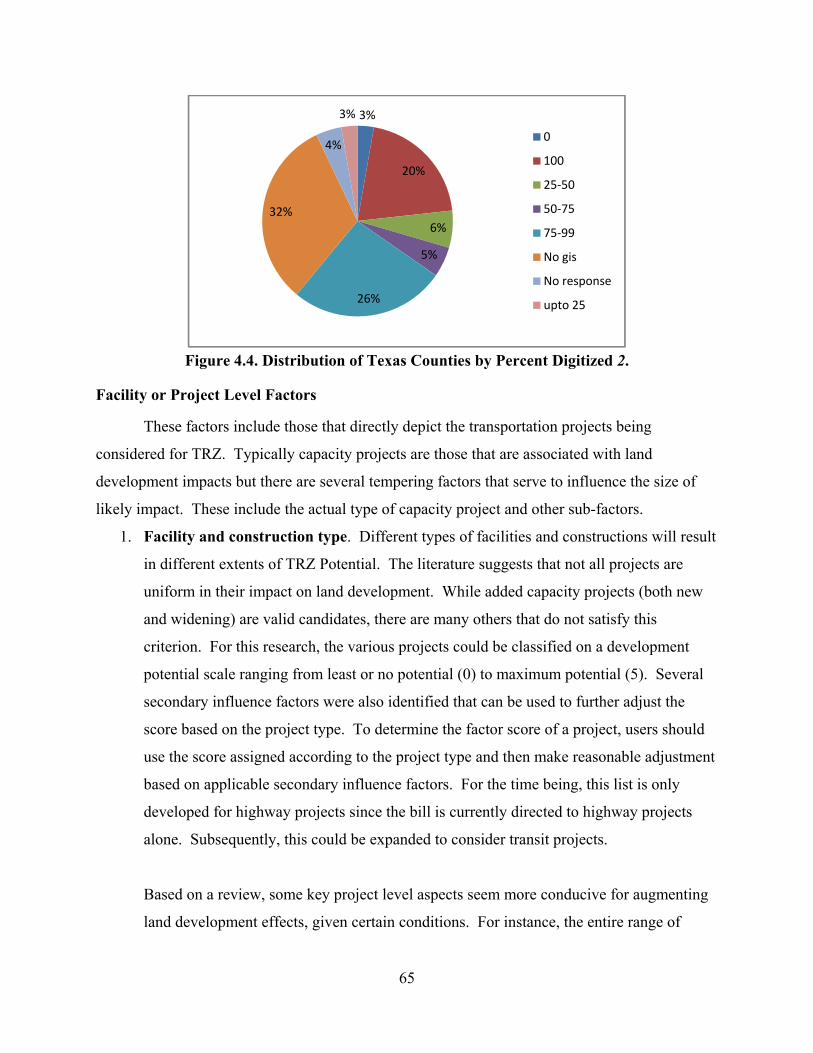
65
Figure 4.4. Distribution of Texas Counties by Percent Digitized 2.
Facility or Project Level Factors
These factors include those that directly depict the transportation projects being
considered for TRZ. Typically capacity projects are those that are associated with land
development impacts but there are several tempering factors that serve to influence the size of
likely impact. These include the actual type of capacity project and other sub-factors.
1. Facility and construction type. Different types of facilities and constructions will result
in different extents of TRZ Potential. The literature suggests that not all projects are
uniform in their impact on land development. While added capacity projects (both new
and widening) are valid candidates, there are many others that do not satisfy this
criterion. For this research, the various projects could be classified on a development
potential scale ranging from least or no potential (0) to maximum potential (5). Several
secondary influence factors were also identified that can be used to further adjust the
score based on the project type. To determine the factor score of a project, users should
use the score assigned according to the project type and then make reasonable adjustment
based on applicable secondary influence factors. For the time being, this list is only
developed for highway projects since the bill is currently directed to highway projects
alone. Subsequently, this could be expanded to consider transit projects.
Based on a review, some key project level aspects seem more conducive for augmenting
land development effects, given certain conditions. For instance, the entire range of
3%
20%
6%
5%
26%
32%
4%
3%
0
100
25‐50
50‐75
75‐99
No gis
No response
upto 25
66
capacity projects can be meaningfully broken down into three types of broad
capacity/mobility characteristics: tollway, non-tollway free capacity improvements, and
finally options that combine both features. Minor improvements such as reconstruction
and resurfacing are not considered if they are part of a main project. While the jury is
still out on some aspects, tollway projects tend to be riskiest in terms of generating
widespread land developments while free options tend to generate the most widespread
effects. This aspect is used to develop the rating scale. This scale is tempered by the
broad type of access features a project provides.
Two risk factors, connectivity and access, are considered along with micro-location.
Therefore, every project can be considered as five categories. In principle, there are more
risk factors, but we have decided to focus on the most critical and perhaps easiest to note
based on planned project routes. The risk factors, when positive, are assigned with a
score of 0.5 on top of the base score assigned based on project type (0–5).
2. Land use compatibility. The consistency of a proposed project with the local land use
plans as well as other transportation plans may affect the probability of a project creating
compatible land uses and maintaining values in the area. For example, a metropolitan
transportation improvement program (TIP) project is likely to be consistent with existing
zoning patterns and have a greater possibility for generating predictable development
patterns consistent with those considered in land use plans. Therefore, one indicator is
whether a project is part of a long-range plan or a metropolitan transportation
improvement plan. Projects that do not belong in these categories can lead to
incompatible uses and lead to fluctuations in value. A binary score is assigned to this
factor: a score of 0 indicating the project is not a TIP project while a 5 indicating the
opposite.
3. Number of projects that are considered. The numbers of major proposed projects in
the TRZ and their scales/types have an impact on TRZ potential. Multiple projects that
lead to synergistic network influences frequently prompt more significant value
increments in the region. However, the significance of this factor to the success of a TRZ
67
also depends on the number of jurisdictions the projects cross. The land developments
associated with projects that are completely contained within a single jurisdiction are
generally easy to identify and manage, simplifying the assessment of TRZ potential. In
contrast, crossing borders of multiple cities or even counties will inevitably complicate
the management of a TRZ and increase the difficulty of achieving sufficient investment
return. In addition, due to the lack of zoning in regions beyond extra territorial
jurisdiction (ETJ) boundaries revenue assessments become a challenge. A project of
which a large part traverses an ETJ may have a lower level of feasibility of setting
up a TRZ primarily because the degree to which land use conversions occur in these
areas is a function of several additional factors. To determine the score of the projects
in the aspect, users should first assign a score based on the number of projects (3 for one
project only, 4 for two projects, and 5 for three or more projects). Reasonable adjustment
can be made on top of the base score based on the number of jurisdictions the projects cross:
• All projects within a regional boundary: minus 0.
• Projects across ETJs: minus 1.
• Projects across multiple cities: minus 2.
• Projects across multiple counties: minus 3.
Projects that traverse multiple counties are multi-jurisdictional by nature, requiring strong
inter-local agreements. These projects may be broken down by county for analysis
purposes since support has to be generated at the county level.
4. Nearby roadway density. An existing dense nearby roadway network is likely to
maximize the potential of a new highway project leading to significant further
developments. As such, this measure is an indirect accessibility measure. This tool uses
the number of nodes (i.e., intersections) within the 1-mile radius of the project(s). This
can be further refined by type of opportunity afforded. The following criteria are used
when assigning a score:
• 0 if no intersections within the 1-mile buffer.
• 1 if 1–2 intersections.
• 2 if 3–4 intersections.
• 3 if 5–6 intersections.
68
• 4 if 7–8 intersections.
• 5 if 9 or more intersections.
5. Service quality measure. Projected service quality has potential impact on TRZ
potential for both transit and highway projects. Commonly used performance measures
such as predicted levels of service (LOS), safety, and congestion (travel time conditions)
may be used as indicators of service quality. Travel time improvements can be
capitalized in land values as can safety measures improve the amenity factor. To
determine the overall score for a project associated with this factor, users should first
assign separate scores (0–5 scale) based on the potential improvements to LOS, safety,
and travel time. The overall score is the average of these three scores.
Project Area Type and Development Conditions
The factors in this group depict the development conditions within a potential TRZ. All
of these are best quantified in GIS, but none of which may be readily available for this analysis.
If those exist, an external analysis can facilitate this process. In subsequent efforts, the tier 1
screening tool may be upgraded to include ready access and calculation of all of these aspects
internally; however, good parcel layers are a requirement for this process. To maintain
simplicity and ease of use as a TRZ facilitation tool, it was decided that this effort should retain
the capability for users to resort to either expert judgment or a more quantitative assessment of
the following sub-factors.
1. Area type. The development type of the TRZ area has an impact on TRZ potential and
therefore value capture after a TRZ is set up. Examples of variables or observations for
this factor include urban, suburban, and rural. We suggest a simple classification based
on a population classification scheme for classifying macro-location. These factors will
be rated on a 1–4 scale:
• 4 for urbanized areas with a population ≥ 200,000.
• 3 for urbanized areas with a population between 50,000–199,999.
• 2 for small urban areas with a population between 5,000–49,999.
• 1 for rural areas with a population less than 5,000.
69
2. Development constraints. The ability of land developments to occur depends on the
amount of vacant land that is developable and constraint free, among other factors (40).
Development constraints include absolute constraints, natural constraints, and legal
constraints such as restrictive zoning, which limit the development potential by reducing
the amount of vacant land that is developable. The overall score for this factor is
estimated as the sum of those determined based on the following variables (cannot
exceed five):
• Absolute physical constraints include features such as existence of water bodies,
major utility rights of way, roadways, or railroads. Absolute constraints are
riskier than resource related constraints since they can cause land to not be
available for development. A base score can be determined based on the
percentage of land with absolute constraints within the TRZ: 2.5 = 0–20 percent,
2 = 21–30 percent, 1.5 = 31–40 percent, 1 = 41–50 percent, and 0.5 = 51 percent
and up.
• Natural resource related constraints include features such as flood plains,
detention ponds, landfills, environmental constrains (e.g., wetlands), and high
terrain. The score of this variable is determined based on the percentage of the
land with natural resource constraints within the TRZ: 2.5 = 0–20 percent, 2 =
21–30 percent, 1.5 = 31–40 percent, 1 = 41–50 percent, and 0.5 = 51 percent and
up.
• Legal constraints on commercial developments, which will inevitably decrease
the potential of transportation project catalyzing further developments. This is a
binary variable with 0 indicating no existing legal constraints and −3 indicating
existence of legal constraints.
• Legal constraints on residential developments, which may result in a reduced
likelihood of commercial land developments. This is also a binary variable with 0
indicating no constraints and −2 indicating the existence of such legal constraints.
3. Neighborhood factors. Some neighborhood factors such as local crime rate and poverty
levels may have impact on the TRZ potential of a transportation project(s). These work
in a similar fashion as development constraints and higher values serve to detract rather
70
than contribute. Poverty level is rated lower because poverty features are partly a
requirement in the establishment of TRZs. A score can be assigned as following:
• Crime rate in the region: 1 for low, 3 for medium, and 5 for high (may be based
on percentages from Census data or quick expert judgments).
• Poverty level: 1 for low, 3 for medium, and 5 for high (may be based on
percentages from Census data or quick expert judgments).
4. Property type and acreage. Different types of properties within a TRZ may have
different rates of further development and therefore TRZ Potential. Land use diversity or
mix to a degree is beneficial for TRZ development. However, land use mix beyond
certain levels could actually work to the detriment of dominant land values. While there
are complex measures that can be used to describe this, an entropy measure based on
percentage of uses is simple and can be useful in this context. Values closer to 0 are
reflective of homogeneity in the distribution of developed land while values closer to 1
are reflective of diversity. Following Frank et al. (41), this is an entropy measure
reflecting the evenness of distribution of several land-use types within the region.
This factor is a single index value and attempts to capture information only on already
developed land in the immediate project corridor (say, within a 1-mile radius of the
project). Expert opinion from city officials or those familiar with land use can provide
these inputs, while precise assessments may be made if parcel data are available. The
aim of this attribute is to capture the developed land use mix in the region. This factor is
often used in the context of trip generation; however, it can be of importance in
influencing developmental trends in the region and is of even greater significance in the
case of transit projects. The specific measure being adopted to address this is the land
use entropy index, which is commonly calculated through the following formula. The
measure is bounded between 0 and 1 and represents the land use balance in a region.
∑
71
P represents proportion of the various developed land uses in the corridor; i = the specific
type of distinct land uses (developed); k = the number of land use types. Ln (Pi) is the
log of the proportion to the base 10. The index spells out the proportion of each of the
land use types such as single family residential, multi-family residential, commercial,
industrial, public institutional, and park uses. This factor is broadly correlated with
micro-location. For instance, suburban areas will tend to have homogeneous use, while
more urban locations will tend to have a mix. In general, closer the index is zero, the less
the potential for TRZs. The closer the index is to 1 the greater is the indication of a more
developed corridor and of limitations to development. Hence threshold values between
0.3 and 0.7 are likely to be conducive to TRZ growth.
Regional Factors
Factors listed in this group are those that describe the relevant characteristics or macro
conditions of the relatively large region (e.g., region in a city, city, or county) where the
proposed TRZs are located. Many of these factors may be obtained from Census data,
discussions with the Appraisal Office in the region, and the city planning offices.
1. Historical trends on land developments and property values. Historical trends on
land developments and property values are an indicator of economic health of the region.
The score associated with this factor for a project can be estimated as the average of the
two determined based on the following two variables:
• Percent increase in building permit activity (five-year average). A score is
assigned based on the increased percentages: 0 = 0–4 percent, 1 = 5–9 percent,
2 = 10–14 percent, 3 = 15–19 percent, 4 = 20–24 percent, and 5 = 25 percent and
up.
• Percent increase in taxable values (five-year average). A score is assigned
similarly based on the percent increase as follows: 0 = 0–4 percent, 1 = 5–9
percent, 2 = 10–14 percent, 3 = 15–19 percent, 4 = 20–24 percent, and
5 = 25 percent and up.
2. Local demographic information. Local demographic conditions may affect the extent
of further developments. Several demographic variables need to be considered while
72
assessing the feasibility of a TRZ. An overall score between 0–5 associated with this
factor can be then computed as the average of the scores based on the regional
employment and population densities as well as recent bond ratings. Information about
population and employment densities is available at sources such as Census (42), local
planning agencies, and other local public agencies. Information about local municipal
bond ratings is available from various bond rating websites.
• Regional employment/employment density:
o 5 if 80 or more per square mile.
o 3 if 20–80 per square mile.
o 1 if less than 20 per square mile.
• Regional population/population density:
o 5 if 80 or more per square mile.
o 3 if 20–80 per square mile.
o 1 if less than 20 per square mile.
• Recent regional bond ratings (municipal or otherwise):
o 5 for best quality (AAA).
o 4 for high quality (Moody’s: AA1–AA3; S&P or Fitch: AA+–AA−).
o 3 for upper medium grade (Moody’s: A1–A3; S&P or Fitch: A+–A−).
o 2 for medium grade (Moody’s: BAA1–BAA3; S&P or Fitch: BBB+–BBB−).
3. Concerted or targeted efforts to promote economic growth and development. This is
a collateral action at the regional level that can impact development trends in the broader
region as well as the TRZ, if it is undertaken. For instance, if the local and regional
economic development agencies and the city have identified specific regions for
development, have incentives for promoting development, or have undertaken specific
action items to promote development, a TRZ would have a much better chance to create
higher increment. A binary score of 0 or 5 can be assigned to this factor with 5 indicating
the existence of such efforts or actions.
73
4. Area-specific factors. Other factors that are specific to the region where the project is
located may also have impact to value increment. An example of such factors is border
trade trends for border regions. Depending on the existence of such factors and their
potential contribution to value increment, a binary score of 0 or 5 can be assigned with 5
indicating the existence of such significant factors.
5. Existing TRZs, TIF districts, or TIRZs. Too many existing TRZs, TIF districts, or
TIRZs in a region might cause conflicts with the implementation of additional TRZs
since they tend to reduce the TRZ potential. This is quite likely to be the scenario in the
urban areas of Texas (Houston, Dallas, Arlington, San Antonio, Austin, etc.). Few TIFs
or TIRZs are an indication that the region is ready to undertake such ventures and is
aware of the protocols and processes of TRZ. It is also an indication of concerted effort
of regions to develop the regions in those boundaries. A score may be assigned based on
this factor as follows:
• 5 if no existing zones.
• 3 if one to five existing zones.
• 0 if more than five zones.
TIER 1 SCREENING TOOL DESIGN
The screening tool involves the evaluation of several factors, suggesting a multi-attribute
decision theoretic framework with attendant factor scoring. In principle, this type of a framework
lends itself well to development as either a desktop or web-based solution. This tool lends itself
well to development as a stand-alone executable program or spreadsheet. The screening tool was
therefore developed as a standalone spreadsheet on an Excel platform making it very simple to
refine with additional factors over time. The tool contains two information tabs, a tool interface
tab, and five worksheet tabs. Figure 4.5 shows the tool interface tab.
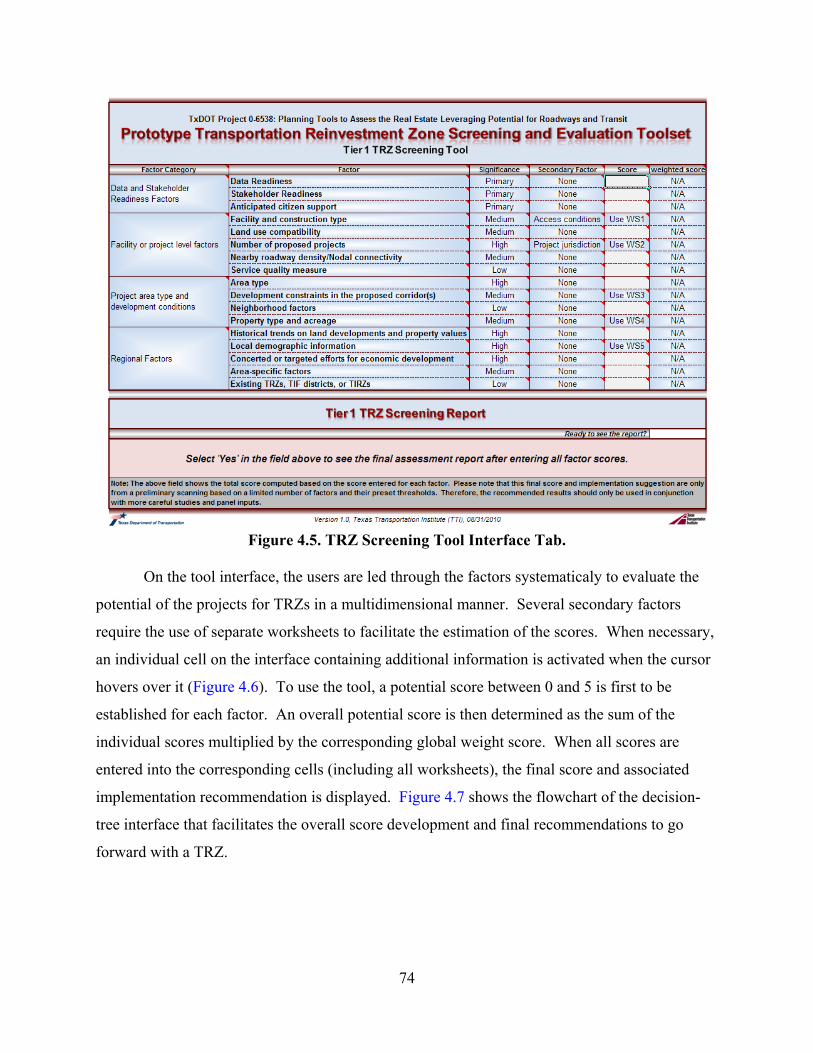
74
Figure 4.5. TRZ Screening Tool Interface Tab.
On the tool interface, the users are led through the factors systematicaly to evaluate the
potential of the projects for TRZs in a multidimensional manner. Several secondary factors
require the use of separate worksheets to facilitate the estimation of the scores. When necessary,
an individual cell on the interface containing additional information is activated when the cursor
hovers over it (Figure 4.6). To use the tool, a potential score between 0 and 5 is first to be
established for each factor. An overall potential score is then determined as the sum of the
individual scores multiplied by the corresponding global weight score. When all scores are
entered into the corresponding cells (including all worksheets), the final score and associated
implementation recommendation is displayed. Figure 4.7 shows the flowchart of the decision-
tree interface that facilitates the overall score development and final recommendations to go
forward with a TRZ.
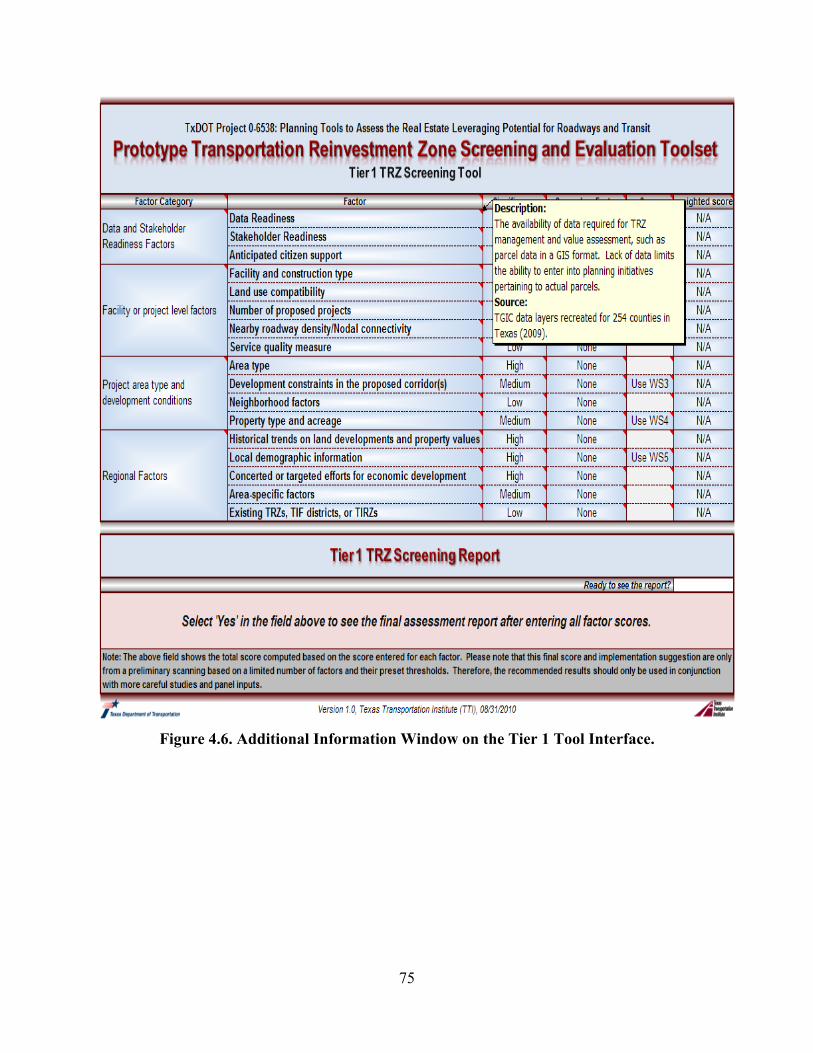
75
Figure 4.6. Additional Information Window on the Tier 1 Tool Interface.
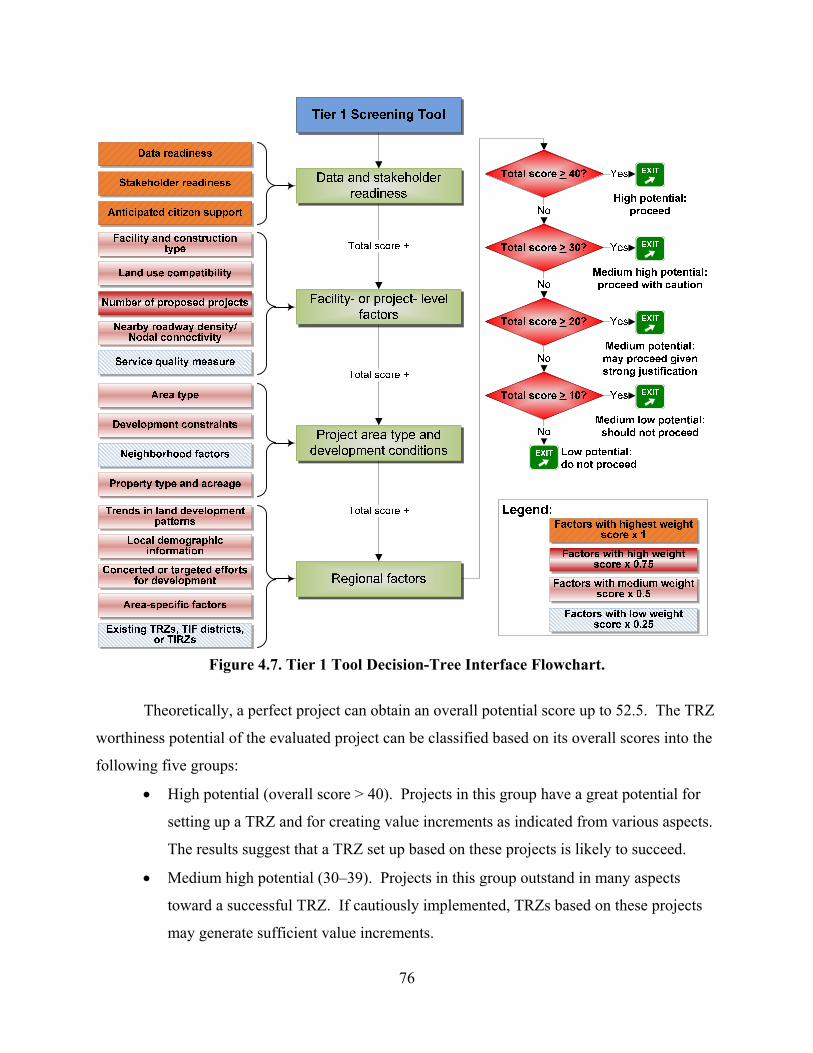
76
Figure 4.7. Tier 1 Tool Decision-Tree Interface Flowchart.
Theoretically, a perfect project can obtain an overall potential score up to 52.5. The TRZ
worthiness potential of the evaluated project can be classified based on its overall scores into the
following five groups:
• High potential (overall score > 40). Projects in this group have a great potential for
setting up a TRZ and for creating value increments as indicated from various aspects.
The results suggest that a TRZ set up based on these projects is likely to succeed.
• Medium high potential (30–39). Projects in this group outstand in many aspects
toward a successful TRZ. If cautiously implemented, TRZs based on these projects
may generate sufficient value increments.
77
• Medium potential (20–29). Projects in this group have a moderate potential for
TRZs. However, if conditions justify and with adequate risk analyses, a TRZ plan
may still be successful; however, it is best to scrutinize both the projects and the
conditions further in this case.
• Medium low potential (10–19). Projects in this group have a very low potential for
generating revenue increments if a TRZ is set up. It is generally not recommended to
implement a TRZ for such projects.
• Low potential (0–9). These projects have little or no potential for generating value
increments within a TRZ. It is not recommended to implement TRZs based on these
projects.
The screening application may be used very early on from conceptual stages leading all to the
way to TRZ consideration. It may be used at various points dynamically to assess whether
conditions are ripe for a region to pursue a TRZ. Careful planning, strategy, shared visions and
goals are all part of the process in achieving convergence combined with introspections on
regional conditions.

79
CHAPTER 5: TRZ ZONE DEVELOPMENT TOOL AND DATA NEEDS
A critical part of TRZ Development is an assessment of data quality and standards for
data across regions in Texas. A second element is the automation of TRZ to facilitate various
aspects of TRZ planning and development as well as to facilitate preliminary revenue
assessments. Each of these aspects is discussed in this chapter.
Researchers reviewed the data quality and the data needs to develop a TRZ. A cadastral
system of land ownership was determined to meet the needs. Existing state cadastral systems
were investigated for a standard and methodology for determining land to be used within the
buffer of the TRZ. Cadastral systems are land ownership databases or GIS. Most cadastral GIS
in Texas are made and owned by the County Appraisal District (CAD) or a third party private
owner. This chapter discusses the details on GIS data across the 254 counties in the State of
Texas and discusses the development of the actual prototype tools. The survey reported below
details more information on the GIS data status across the state. An additional aspect discussed
in this chapter pertains to the specific platforms that could be used for the development of
revenue tool of which TRZ zone development is the most important primary step. The final
aspect discussed in this chapter is the prototype tool to facilitate TRZ zone development. The
prototype tools may be used by CADs themselves or by TRZ stakeholders as long as the use
requirements for GIS data are in place.
SURVEY OF CENTRAL APPRAISAL DISTRICTS CADASTRAL DATA
A survey of the CADs GIS to be used to create TRZ shows that, of the 99 districts
reporting, very few of those have a GIS or spatial database that can be queried using geospatial
techniques for TRZ development. Appendix B includes the survey instrument.
Survey Findings
Even more importantly the results of the survey indicate that the GIS may not always
have the most up to data system to use. As an outside company is often in charge of maintaining
the GIS; records must be submitted to the outsourced company and then entered into the GIS.
80
This is an important consideration for TRZ development as up-to-date parcel information is key
to assessing TRZ potential. Since there are no standards for parcel information collection CADs
often collect information across many databases that are not generally tied to one another. The
survey results also indicate that most CADs only have a limited amount of information within
their GIS. In regards to TRZ development CADs or other stakeholder groups will have to
manage to tie all relevant information to the GIS prior to using the development tools. As there
are no standards on the data structures it will be the responsibility of the CADs and other bodies
to decipher their own data and create datasets that are used specifically for TRZ development
tools. Appendix B contains results of the survey. Appendix C shows the results of the Texas
Comptroller’s Office 2006–2007 survey.
• The number of CADs with a GIS totaled 159 out of 254 counties.
• Reporting CADs had entered 79.7 percent of their appraisal records in the GIS.
• Six CADs with a GIS had not yet entered appraisal records into the system.
• Eighty-four CADs did not have a GIS and two CADs did not answer this question on
the survey.
There is currently no common standard with CADs on GISs being built and/or used.
Some cadastral GISs have been built by other agencies other than a CAD. These other cadastral
GISs might not have current land ownership information needed to plan, build, or maintain a
TRZ. The CAD’s GIS data content is owned by two indices:
• CADs own all the data and have the right to share data and dispense data to other
agencies.
• Private companies have entered into agreements with CADs to build a GIS. Data are
owned by the private companies, but can be used by the CAD to build a TRZ.
Both owners would require that the TRZ sponsor work with the CAD. The survey was
conducted of all the CADs to determine the status and quality of the cadastral GISs. The attached
report offers results of the reporting CADs. The GIS software that seems to be the most
prevalent in the CADs is ESRI ArcGIS. Versions vary with each CAD.
SOFTWARE PLATFORM
A critical task in the development of a combined TRZ zone development tool with
revenue assessments was to determine the optimum software and hardware platform that would
81
provide reasonable functionality, compatibility, and flexibility. As part of this project, the
researchers explored several advanced software options for the combined tool, including desktop
options and web-based options. A web-based prototype option was selected as the final option
for the screening tool based on input from the panel and research team. Table 5.1 summarizes
the pros, cons, and challenges associated with each of the options explored for the development
of the combined zone and revenue tool, followed by a detailed discussion of the options.
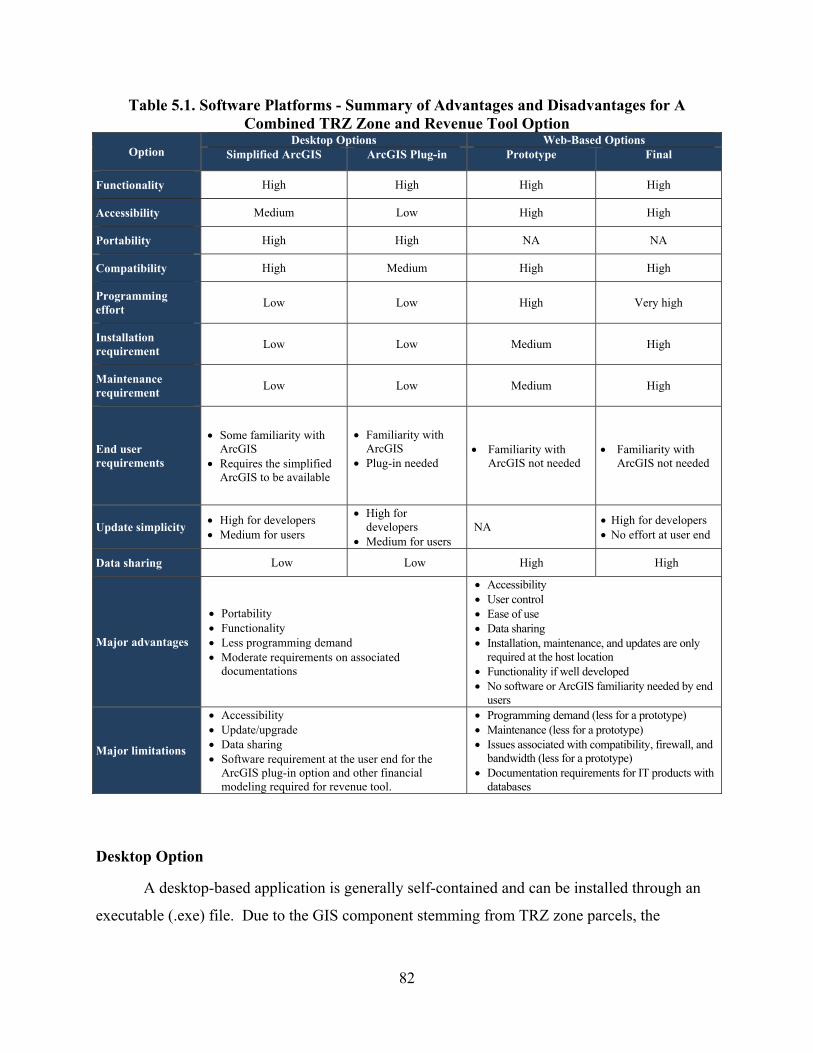
82
Table 5.1. Software Platforms - Summary of Advantages and Disadvantages for A Combined TRZ Zone and Revenue Tool Option
Option Desktop Options Web-Based Options
Simplified ArcGIS ArcGIS Plug-in Prototype Final
Functionality High High High High
Accessibility Medium Low High High
Portability High High NA NA
Compatibility High Medium High High
Programming effort Low Low High Very high
Installation requirement Low Low Medium High
Maintenance requirement Low Low Medium High
End user requirements
• Some familiarity with ArcGIS
• Requires the simplified ArcGIS to be available
• Familiarity with ArcGIS
• Plug-in needed
• Familiarity with ArcGIS not needed
• Familiarity with ArcGIS not needed
Update simplicity • High for developers • Medium for users
• High for developers
• Medium for users NA • High for developers
• No effort at user end
Data sharing Low Low High High
Major advantages
• Portability • Functionality • Less programming demand • Moderate requirements on associated
documentations
• Accessibility • User control • Ease of use • Data sharing • Installation, maintenance, and updates are only
required at the host location • Functionality if well developed • No software or ArcGIS familiarity needed by end
users
Major limitations
• Accessibility • Update/upgrade • Data sharing • Software requirement at the user end for the
ArcGIS plug-in option and other financial modeling required for revenue tool.
• Programming demand (less for a prototype) • Maintenance (less for a prototype) • Issues associated with compatibility, firewall, and
bandwidth (less for a prototype) • Documentation requirements for IT products with
databases
Desktop Option
A desktop-based application is generally self-contained and can be installed through an
executable (.exe) file. Due to the GIS component stemming from TRZ zone parcels, the
83
researchers explored two desktop options including a customized ArcGIS® desktop application
and an ArcGIS desktop plug-in, in the form of a customized ArcGIS toolbar.
• The former option would be a simplified ArcGIS desktop with only limited analysis
functions as necessary for screening. This option has limited requirements on
software and hardware at the user end. If well developed, the tool would be easy to
use and have maximum compatibility with ESRI shapefiles.
• The latter option (toolbar only) would require users to install a plug-in onto their
existing ArcGIS desktop software. Such a tool would be easy to install and use for
existing ArcGIS users. However, it would require users to have ArcGIS first and
might have compatibility challenges with different versions of ArcGIS software.
Both desktop options would require relatively less development effort than a web-based
tool yet provide optimum portability. Because these options are based on existing ArcGIS
software, they would eliminate the additional efforts of developing a GIS data viewer and a
graphic user interface. Both options would require limited installation and maintenance efforts
and would simplify the associated documentation effort (e.g., user manual and installation
guide). This type of application generally has limited accessibility since users are required to
have the tools installed first in order to use. Updates and upgrades are difficult since they would
need to be distributed to all end users. Furthermore, there are attendant difficulties of providing
multilevel functionality for different user groups, and individual users would need to be
responsible for data gathering and uploading.
Web-Based Option
A web-based application does not require additional software at the user end and in
comparison to a desktop application, it does allow various degrees of user access. Data that are
necessary for carrying out analyses can be uploaded and updated at a central location, easing the
data requirement for individual users. In addition, developers and users may upload data to the
application, which can be then shared by other authorized users. Updating software becomes
easier since it needs to be done only on the host server. A web-based application is typically
complex to develop and requires intensive maintenance efforts at the central host location.
84
Combined TRZ Zone and Revenue Tool – Final Recommendations
After an objective discussion of software platforms presented earlier, it was decided to
pursue two independent options for the prototype instead of a combined tool. The first of these
tools is the independent TRZ Zone Development desktop tool discussed in detail in this chapter.
The second is a web-based revenue tool using external inputs provided by the TRZ zone tool.
An enduser would need to have both prototype components available and use them in sequence.
Prototype Option. The term “final tool” hereafter refers to a tool that is developed such
that it can be implemented on TxDOT servers as a production tool without additional
modification and upgrades. Since a prototype is a proof-of-concept tool that demonstrates the
feasibility of such a tool, it typically has moderate requirements on implementation issues. In
addition, it has lower requirements on the interface, requires limited number of users for
demonstration purposes, and may require data only from a limited number of cities/districts (thus
reducing the requirements on data quality and compatibility issues when compiling GIS data
from all districts in the state). Because a prototype is not intended to be used as a production tool,
users outside the TxDOT network may not access the tool, reducing the efforts required for
addressing issues such as bandwidth, firewall, link connectivity, and hardware requirement
during this research phase.
Final Tool Option. A final tool will need to be developed such that it can handle a large
number of users, cope with various versions of internet browsers, and have a sophisticated
interface that is consistent with a production-level tool. It will need high-quality parcel data
from all CADs for which users would like to use the tool. Such a tool would not only require a
much greater level of development effort than a prototype, but also testing efforts to make sure it
can be deployed as a production tool. In addition, the research team would need to ensure
smooth migration to the TxDOT systems with issues such as bandwidth, firewall, compatibility,
and maintenance. It would require developers to collect and process high-quality data for the
regions considering it.
Both tools, despite being prototypes, are made compatible to TXDOT standards for
information technology (IT) deliverables.
85
TRZ PROTOTYPE TOOLS FOR TRZ DEVELOPMENT
ESRI ArcGIS is the standard for the CADs and best to be used for creating the TRZ
prototype tools. While an ARCGIS Desktop tool was proposed, this research went one step
forward and three separate prototype tools (including the ARCGIS option) were developed to
assist the TRZ sponsors with creating the data to be used by the screening tool. Table 5.2
describes the advantages and disadvantages to each prototype tool/database. The two datasets
needed for the tools are the cadastral area of the TRZ and the road network to buffer to build the
TRZ with minimal datasets, which might not include zoning information. The ESRI ArcGIS
Geodatabase format used will utilize the current CAD’s format, in order to obtain the linked
information to the needed format. Multiple layers from many other sources held by TxDOT or
TRZ stakeholders may also be used in the GIS software. Use of CAD or other third party data
owners must follow those owners data use agreements.
Some CADs will not allow direct links to databases or complete copies. In order to use
the data it was decided that a tool that extracted the data as provided would be queried to feed
into the TRZ screening tool. A prototype Geodatabase could not be created in all cases with
CAD parcel databases. Most data in the State of Texas is owned by private companies that do
not allow users to have copies and reformat data into a standard format for the TRZ
Geodatabase. Additionally, some parcel data information needed by the TRZ screening tool is
only available with a connection to the CAD database, requiring an Open Database Connectivity
(ODBC) connection.
The TRZ Zone Development GIS Prototype Software Tool does not include entities and
variables. If the CAD, local entity, TxDOT, or other party does not have some of the data
needed by the screening tool then it must be added before the screening tool and cannot be added
by the TRZ Tool as additional layers. The goal of the tool was not to create new data, but to get
the latest data from CAD and combine it with most relevant information for TRZ development
and to facilitate TRZ feasibility assessments. A classification parcel data GIS TRZ Prototype
Software Tool was developed that converted the CAD’s data into a format that could be used by
the TRZ revenue tool in Microsoft Excel. The tool allows users to interact with the Geodatabase
and extract the various fields needed for an assessment of TRZ zones and to facilitate TRZ zone
planning and feasibility. The tool created an automated approach to link CAD appraisal data to
parcel to enhance accuracy for revenue estimation. Extraction of various existing geospatial data
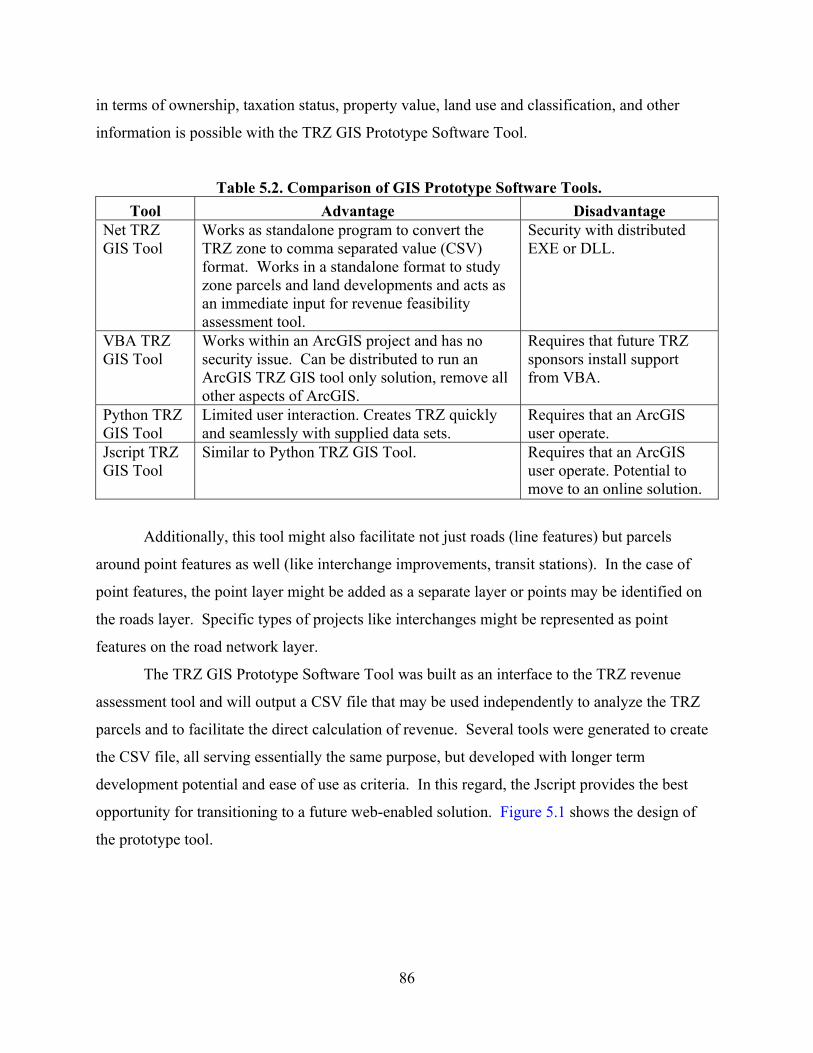
86
in terms of ownership, taxation status, property value, land use and classification, and other
information is possible with the TRZ GIS Prototype Software Tool.
Table 5.2. Comparison of GIS Prototype Software Tools. Tool Advantage Disadvantage
Net TRZ GIS Tool
Works as standalone program to convert the TRZ zone to comma separated value (CSV) format. Works in a standalone format to study zone parcels and land developments and acts as an immediate input for revenue feasibility assessment tool.
Security with distributed EXE or DLL.
VBA TRZ GIS Tool
Works within an ArcGIS project and has no security issue. Can be distributed to run an ArcGIS TRZ GIS tool only solution, remove all other aspects of ArcGIS.
Requires that future TRZ sponsors install support from VBA.
Python TRZ GIS Tool
Limited user interaction. Creates TRZ quickly and seamlessly with supplied data sets.
Requires that an ArcGIS user operate.
Jscript TRZ GIS Tool
Similar to Python TRZ GIS Tool. Requires that an ArcGIS user operate. Potential to move to an online solution.
Additionally, this tool might also facilitate not just roads (line features) but parcels
around point features as well (like interchange improvements, transit stations). In the case of
point features, the point layer might be added as a separate layer or points may be identified on
the roads layer. Specific types of projects like interchanges might be represented as point
features on the road network layer.
The TRZ GIS Prototype Software Tool was built as an interface to the TRZ revenue
assessment tool and will output a CSV file that may be used independently to analyze the TRZ
parcels and to facilitate the direct calculation of revenue. Several tools were generated to create
the CSV file, all serving essentially the same purpose, but developed with longer term
development potential and ease of use as criteria. In this regard, the Jscript provides the best
opportunity for transitioning to a future web-enabled solution. Figure 5.1 shows the design of
the prototype tool.
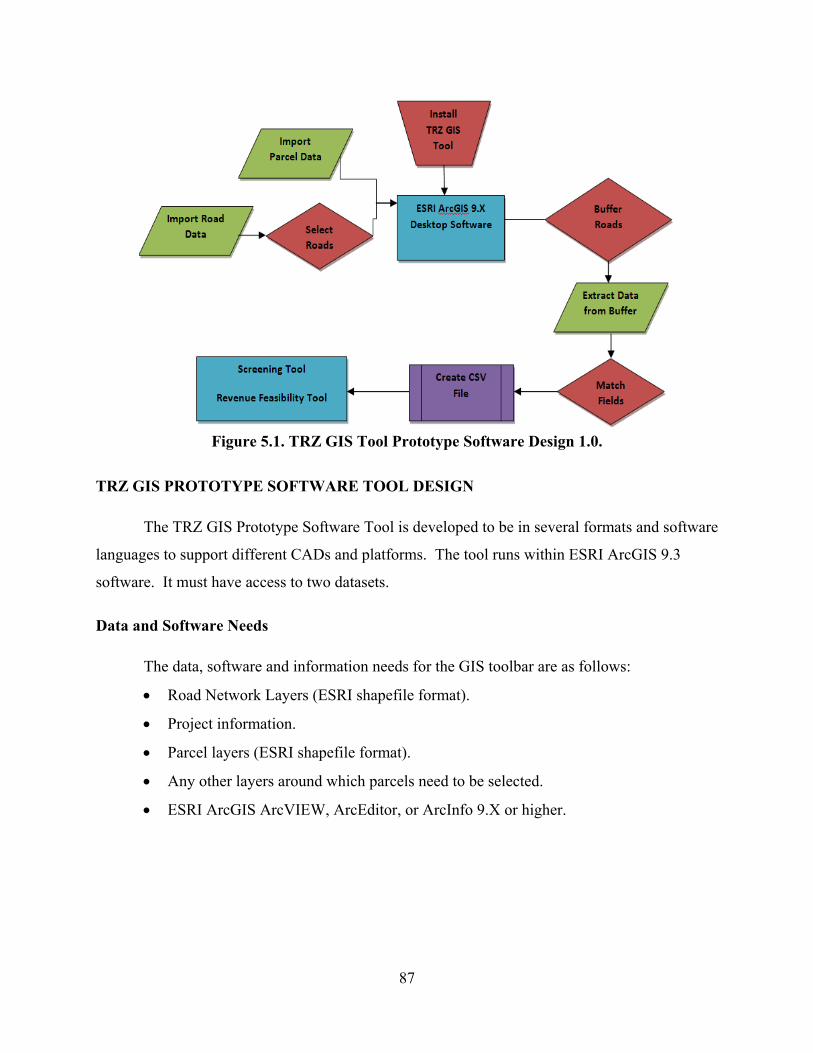
87
Figure 5.1. TRZ GIS Tool Prototype Software Design 1.0.
TRZ GIS PROTOTYPE SOFTWARE TOOL DESIGN
The TRZ GIS Prototype Software Tool is developed to be in several formats and software
languages to support different CADs and platforms. The tool runs within ESRI ArcGIS 9.3
software. It must have access to two datasets.
Data and Software Needs
The data, software and information needs for the GIS toolbar are as follows:
• Road Network Layers (ESRI shapefile format).
• Project information.
• Parcel layers (ESRI shapefile format).
• Any other layers around which parcels need to be selected.
• ESRI ArcGIS ArcVIEW, ArcEditor, or ArcInfo 9.X or higher.
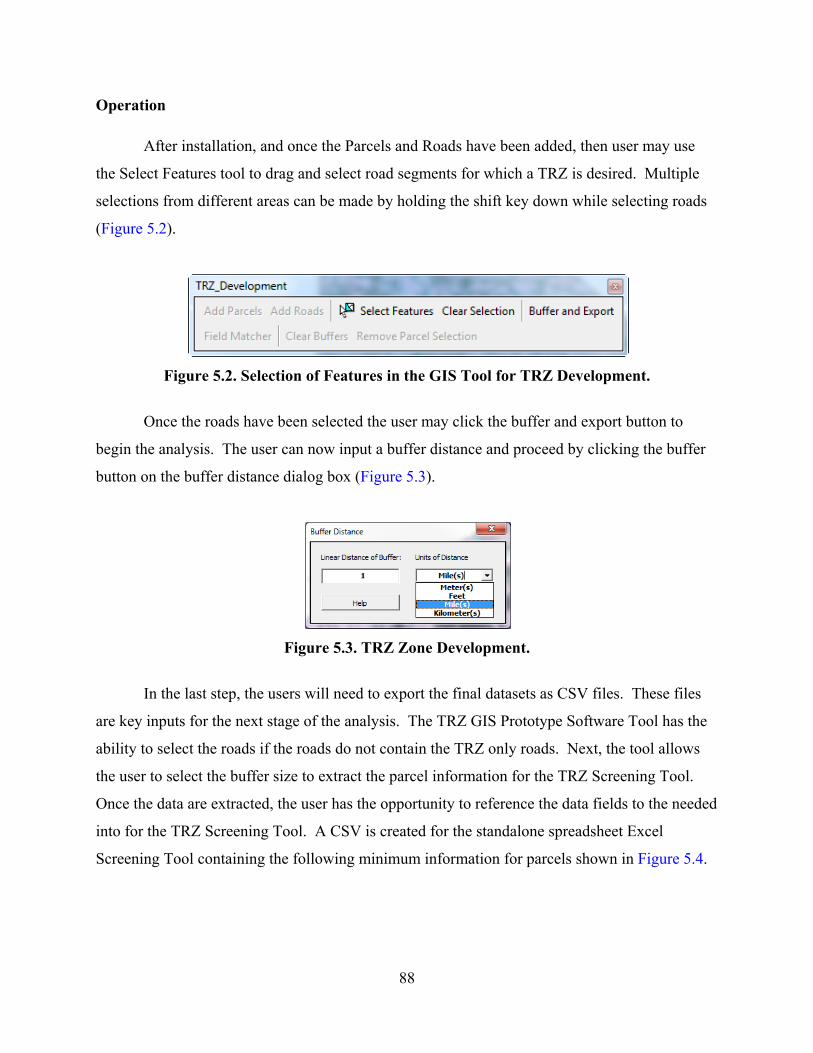
88
Operation
After installation, and once the Parcels and Roads have been added, then user may use
the Select Features tool to drag and select road segments for which a TRZ is desired. Multiple
selections from different areas can be made by holding the shift key down while selecting roads
(Figure 5.2).
Figure 5.2. Selection of Features in the GIS Tool for TRZ Development.
Once the roads have been selected the user may click the buffer and export button to
begin the analysis. The user can now input a buffer distance and proceed by clicking the buffer
button on the buffer distance dialog box (Figure 5.3).
Figure 5.3. TRZ Zone Development.
In the last step, the users will need to export the final datasets as CSV files. These files
are key inputs for the next stage of the analysis. The TRZ GIS Prototype Software Tool has the
ability to select the roads if the roads do not contain the TRZ only roads. Next, the tool allows
the user to select the buffer size to extract the parcel information for the TRZ Screening Tool.
Once the data are extracted, the user has the opportunity to reference the data fields to the needed
into for the TRZ Screening Tool. A CSV is created for the standalone spreadsheet Excel
Screening Tool containing the following minimum information for parcels shown in Figure 5.4.
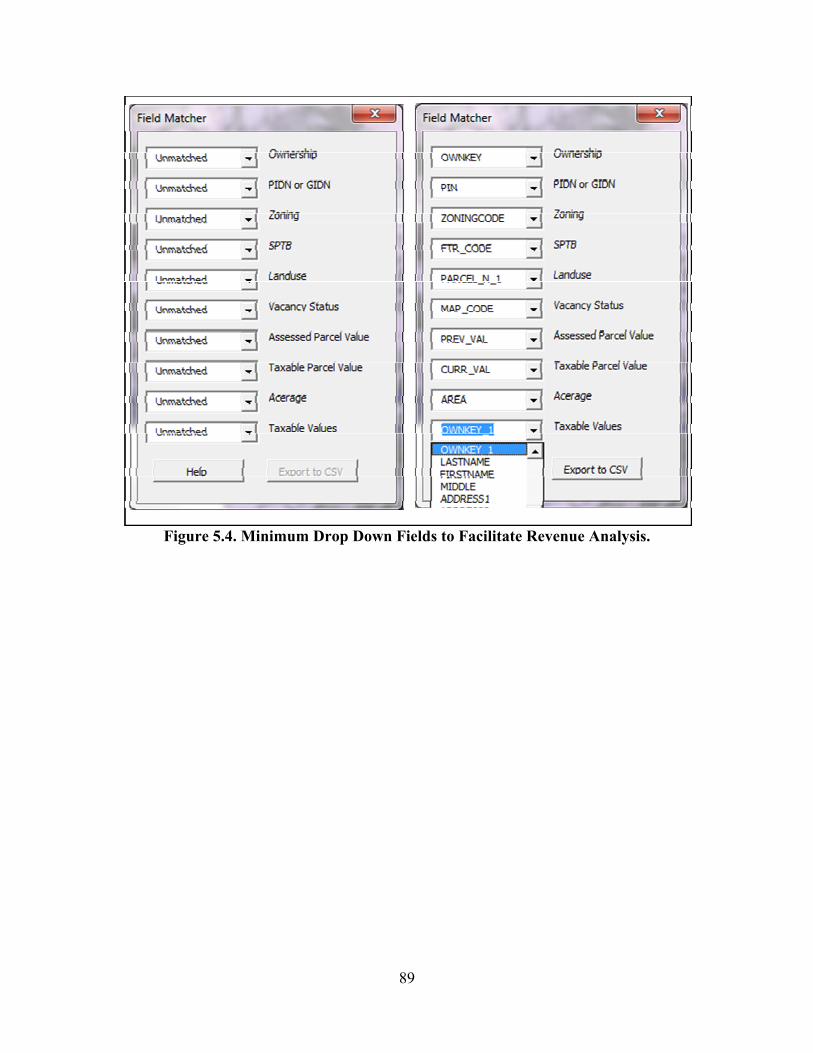
89
Figure 5.4. Minimum Drop Down Fields to Facilitate Revenue Analysis.

91
CHAPTER 6: TRZ REVENUE FEASIBILITY TOOL
This section discusses the conceptual elements behind the TRZ Revenue Feasibility tool
for determining the preliminary revenue feasibility of a proposed TRZ zone. Under SB1266,
after designating a contiguous area along a proposed transportation project as a TRZ, a local
government entity such as a city, county, or RMA may securitize the incremental tax increments
to obtain necessary funds to bring the project to fruition. This chapter discusses the development
of the TRZ revenue feasibility tool.
TRZs provide a good mechanism to capture tax increments generated by large scale
capacity improvements; however, before implementing a TRZ multiple questions emerge that are
integral to any tool that must determine revenue:
• What should be the geographic extent where capacity improvements produce
economic impacts on property values and development trends?
• How much revenue can a specific TRZ buffer-size support?
• What values can be attained after TRZ development (for both existing property uses
and newly developed land)?
• How does one deal with vacant land development or pace of absorption in the timing
of TRZ cash flows?
OBJECTIVES OF THE REVENUE TOOL
The TRZ Revenue Feasibility tool can help a local government entity to analyze these
questions and arrive at a decision whether pursue or not the implementation of a TRZ based on
actual preliminary revenue estimates. Numerical results from the tool include the present value
of the following cash flows: net capital available, aggregate TRZ revenues (existing plus new
development revenues), existing development, and new development. The specific objectives of
this tool are to:
• Assist in the preliminary valuation of TRZ revenue potential by estimating the
Present Value (PV) of the cash flows resulting from the tax revenue differential
accruing to the TRZ over time.
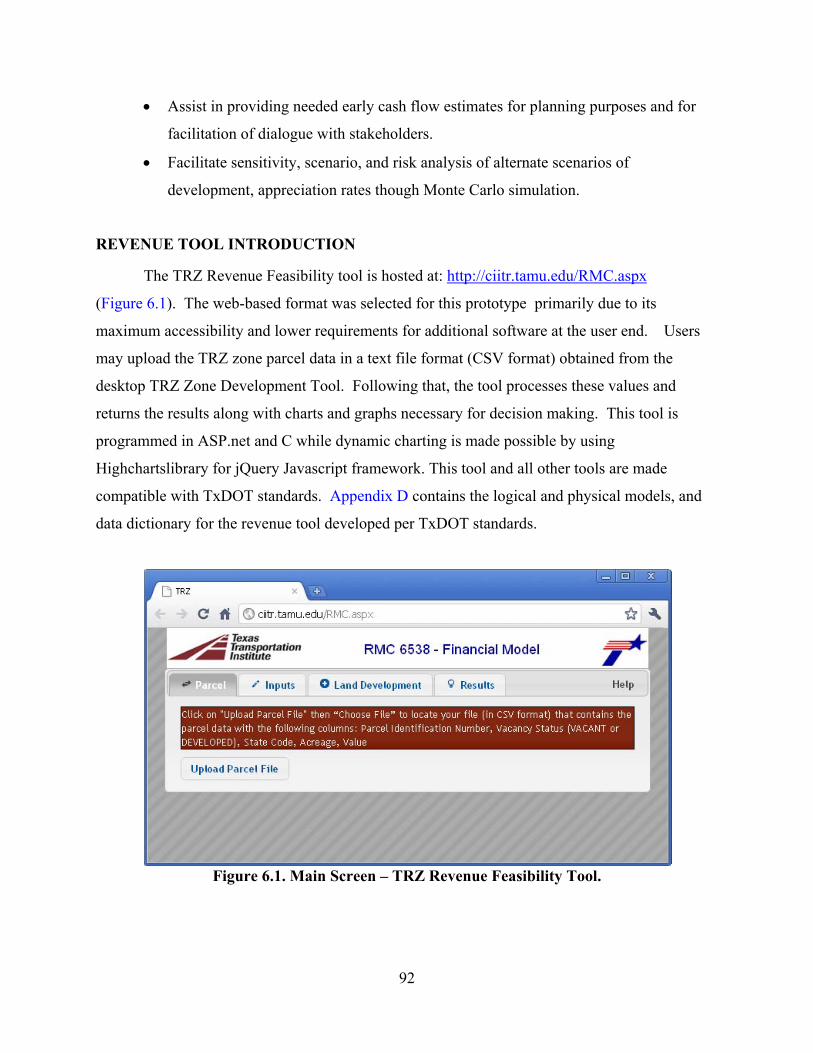
92
• Assist in providing needed early cash flow estimates for planning purposes and for
facilitation of dialogue with stakeholders.
• Facilitate sensitivity, scenario, and risk analysis of alternate scenarios of
development, appreciation rates though Monte Carlo simulation.
REVENUE TOOL INTRODUCTION
The TRZ Revenue Feasibility tool is hosted at: http://ciitr.tamu.edu/RMC.aspx
(Figure 6.1). The web-based format was selected for this prototype primarily due to its
maximum accessibility and lower requirements for additional software at the user end. Users
may upload the TRZ zone parcel data in a text file format (CSV format) obtained from the
desktop TRZ Zone Development Tool. Following that, the tool processes these values and
returns the results along with charts and graphs necessary for decision making. This tool is
programmed in ASP.net and C while dynamic charting is made possible by using
Highchartslibrary for jQuery Javascript framework. This tool and all other tools are made
compatible with TxDOT standards. Appendix D contains the logical and physical models, and
data dictionary for the revenue tool developed per TxDOT standards.
Figure 6.1. Main Screen – TRZ Revenue Feasibility Tool.
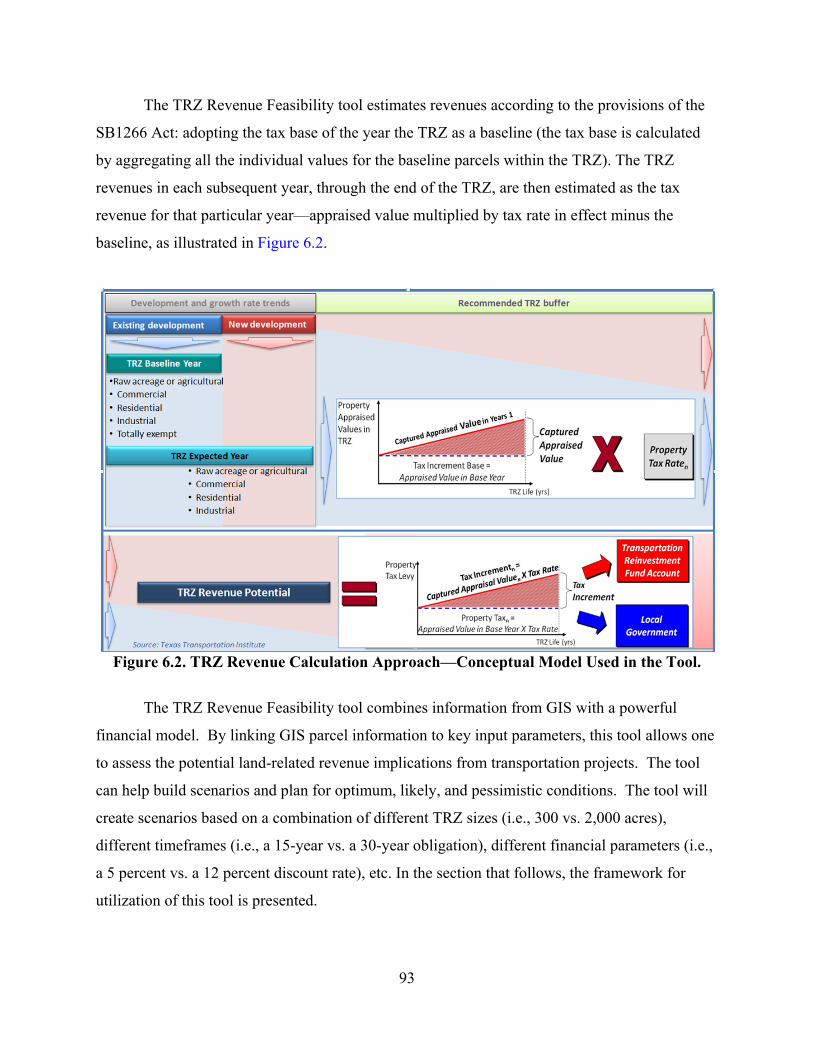
93
The TRZ Revenue Feasibility tool estimates revenues according to the provisions of the
SB1266 Act: adopting the tax base of the year the TRZ as a baseline (the tax base is calculated
by aggregating all the individual values for the baseline parcels within the TRZ). The TRZ
revenues in each subsequent year, through the end of the TRZ, are then estimated as the tax
revenue for that particular year—appraised value multiplied by tax rate in effect minus the
baseline, as illustrated in Figure 6.2.
Figure 6.2. TRZ Revenue Calculation Approach—Conceptual Model Used in the Tool.
The TRZ Revenue Feasibility tool combines information from GIS with a powerful
financial model. By linking GIS parcel information to key input parameters, this tool allows one
to assess the potential land-related revenue implications from transportation projects. The tool
can help build scenarios and plan for optimum, likely, and pessimistic conditions. The tool will
create scenarios based on a combination of different TRZ sizes (i.e., 300 vs. 2,000 acres),
different timeframes (i.e., a 15-year vs. a 30-year obligation), different financial parameters (i.e.,
a 5 percent vs. a 12 percent discount rate), etc. In the section that follows, the framework for
utilization of this tool is presented.
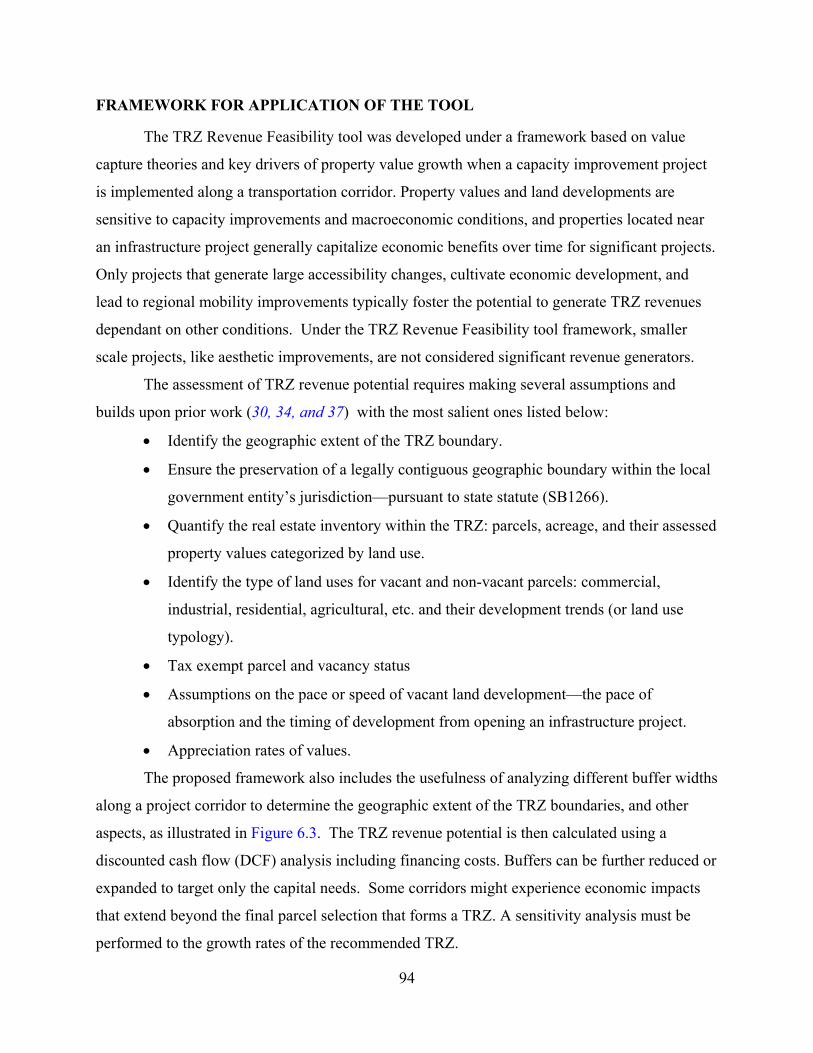
94
FRAMEWORK FOR APPLICATION OF THE TOOL
The TRZ Revenue Feasibility tool was developed under a framework based on value
capture theories and key drivers of property value growth when a capacity improvement project
is implemented along a transportation corridor. Property values and land developments are
sensitive to capacity improvements and macroeconomic conditions, and properties located near
an infrastructure project generally capitalize economic benefits over time for significant projects.
Only projects that generate large accessibility changes, cultivate economic development, and
lead to regional mobility improvements typically foster the potential to generate TRZ revenues
dependant on other conditions. Under the TRZ Revenue Feasibility tool framework, smaller
scale projects, like aesthetic improvements, are not considered significant revenue generators.
The assessment of TRZ revenue potential requires making several assumptions and
builds upon prior work (30, 34, and 37) with the most salient ones listed below:
• Identify the geographic extent of the TRZ boundary.
• Ensure the preservation of a legally contiguous geographic boundary within the local
government entity’s jurisdiction—pursuant to state statute (SB1266).
• Quantify the real estate inventory within the TRZ: parcels, acreage, and their assessed
property values categorized by land use.
• Identify the type of land uses for vacant and non-vacant parcels: commercial,
industrial, residential, agricultural, etc. and their development trends (or land use
typology).
• Tax exempt parcel and vacancy status
• Assumptions on the pace or speed of vacant land development—the pace of
absorption and the timing of development from opening an infrastructure project.
• Appreciation rates of values.
The proposed framework also includes the usefulness of analyzing different buffer widths
along a project corridor to determine the geographic extent of the TRZ boundaries, and other
aspects, as illustrated in Figure 6.3. The TRZ revenue potential is then calculated using a
discounted cash flow (DCF) analysis including financing costs. Buffers can be further reduced or
expanded to target only the capital needs. Some corridors might experience economic impacts
that extend beyond the final parcel selection that forms a TRZ. A sensitivity analysis must be
performed to the growth rates of the recommended TRZ.
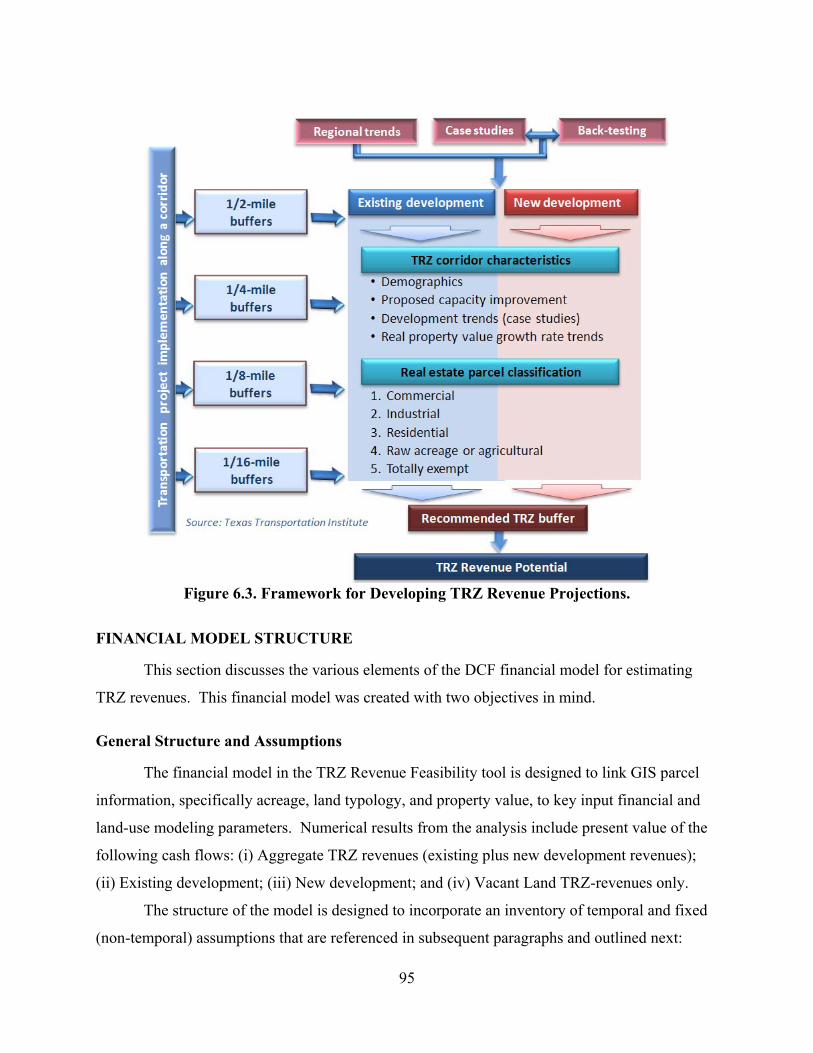
95
Figure 6.3. Framework for Developing TRZ Revenue Projections.
FINANCIAL MODEL STRUCTURE
This section discusses the various elements of the DCF financial model for estimating
TRZ revenues. This financial model was created with two objectives in mind.
General Structure and Assumptions
The financial model in the TRZ Revenue Feasibility tool is designed to link GIS parcel
information, specifically acreage, land typology, and property value, to key input financial and
land-use modeling parameters. Numerical results from the analysis include present value of the
following cash flows: (i) Aggregate TRZ revenues (existing plus new development revenues);
(ii) Existing development; (iii) New development; and (iv) Vacant Land TRZ-revenues only.
The structure of the model is designed to incorporate an inventory of temporal and fixed
(non-temporal) assumptions that are referenced in subsequent paragraphs and outlined next:
96
• The TRZ analysis is conducted considering each proposed capacity improvement in a
specific corridor independently, and the results are aggregated to produce the overall
TRZ revenue projections—in the case of multiple corridors.
• The model assumes that new development (new PIDNs, parcels, or subdivisions)
taking place within the TRZ boundaries will be incorporated into the TRZ and their
expected revenues will contribute to the TRZ cash flows.
• The time period considered for the PV analyses encompasses the TRZ duration, from
the base year (the year when the TRZ is expected to be established) to the year of
termination.
• The parcel inventory uploaded to the TRZ Revenue Feasibility tool, with its
corresponding land use typology, acreage, vacancy, and property values, will be used
to establish the tax base or baseline.
• TRZ revenues in each subsequent year are estimated as the tax revenue for that
particular year—appraised value multiplied by tax rate in effect—minus the baseline
(until the year of termination).
• All cash flows estimated are nominal, and real discounted to the base year, as the
TRZ revenue estimation requires it.
• The discount rate is estimated based primarily on the cost of capital (inflation
unadjusted); municipalities often have discount rate estimates based on previous debt
agreements.
• Up-zoning or changes in ownership from government-owned vacant parcels is not
considered.
• Risk analysis and uncertainty are considered using Monte Carlo simulation using a
conservative 90 percent confidence interval.
• Projects open to traffic as per the specified opening year.
• The pace of development around a capacity improvement is modeled with
distribution functions (slow initial development, then rapid dissemination, and slowly
approaching market saturation) in combination with Monte Carlo Simulation.
• All existing and new developments are assessed using the property tax mechanism—
changes in the tax rate will impact revenue projections.
97
• The model produces an estimate of the net capital available from a TRZ considering
the interest on debt (discount rate) and the interest earned during construction.
• Interest earned through construction assumes earnings over 50 percent of the time
between bond issue and facility opening.
• Right of way is not considered.
DATA NEEDS
The only data and information need for a preliminary analysis of revenue is the actual
CSV file obtained from the TRZ development tool with the minimum features listed in
Figure 5.2 from the previous chapter in addition to assumptions needed on growth parameters.
The assumptions and parameters are very specific for each region, TRZ corridor, and macro and
microeconomic conditions. An advanced analysis could utilize additional local information than
simple assumptions.
INPUTS SCREEN
The Basic Input section of the TRZ Revenue Feasibility tool incorporates (Figure 6.4)
most of these assumptions of into the financial model. The Inputs tab is divided in two main
sections:
• Basic Inputs.
• Timing of Development.
The base year is the year the TRZ is implemented. The construction start year is when
the proposed capacity improvement or transportation project begins to be constructed. Once
construction is complete, the opening year is when the project opens to the public. The year the
debt is issued gives flexibility if the municipality or county plan to issue an obligation in a year
other than the base year (otherwise the base year is retyped). The TRZ entity tax rate should
reflect the property tax component of the entity that established the TRZ.
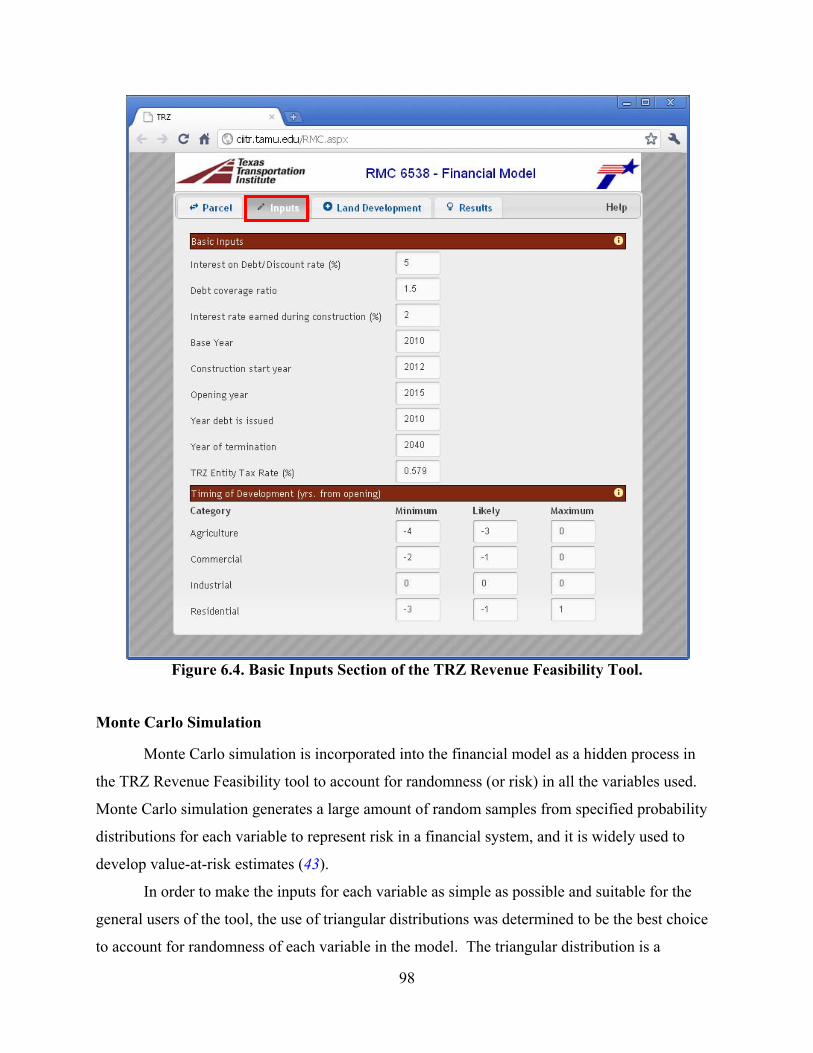
98
Figure 6.4. Basic Inputs Section of the TRZ Revenue Feasibility Tool.
Monte Carlo Simulation
Monte Carlo simulation is incorporated into the financial model as a hidden process in
the TRZ Revenue Feasibility tool to account for randomness (or risk) in all the variables used.
Monte Carlo simulation generates a large amount of random samples from specified probability
distributions for each variable to represent risk in a financial system, and it is widely used to
develop value-at-risk estimates (43).
In order to make the inputs for each variable as simple as possible and suitable for the
general users of the tool, the use of triangular distributions was determined to be the best choice
to account for randomness of each variable in the model. The triangular distribution is a
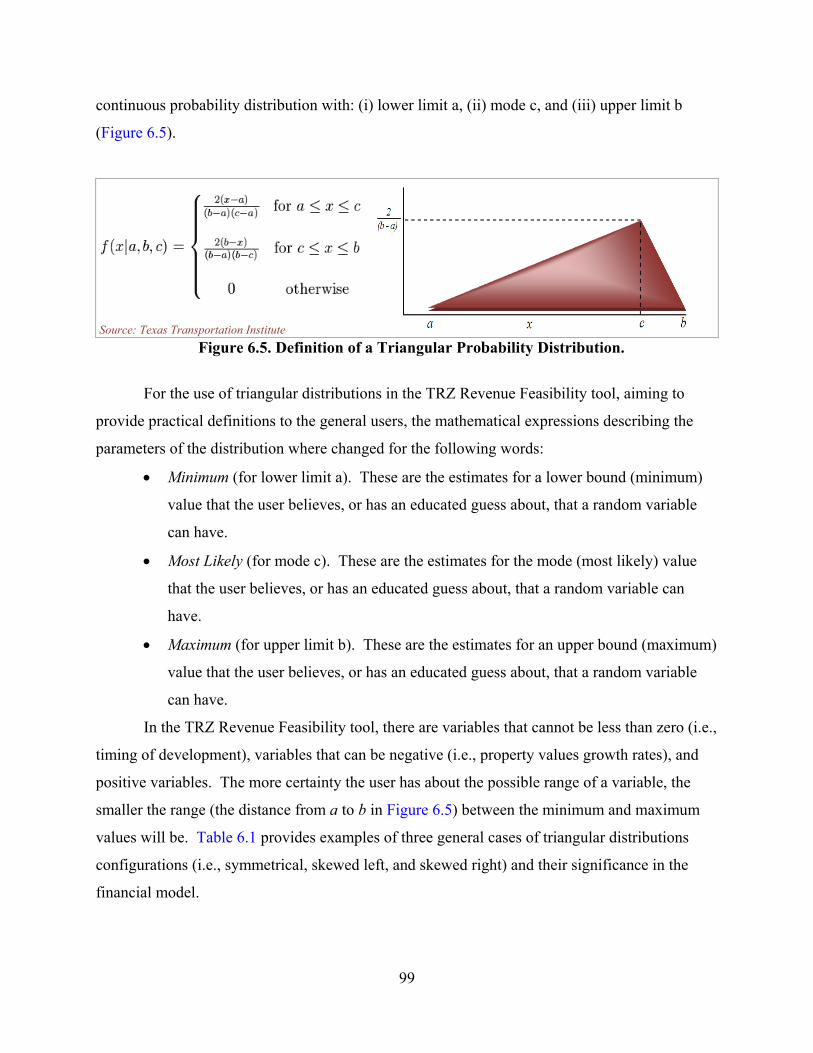
99
continuous probability distribution with: (i) lower limit a, (ii) mode c, and (iii) upper limit b
(Figure 6.5).
Figure 6.5. Definition of a Triangular Probability Distribution.
For the use of triangular distributions in the TRZ Revenue Feasibility tool, aiming to
provide practical definitions to the general users, the mathematical expressions describing the
parameters of the distribution where changed for the following words:
• Minimum (for lower limit a). These are the estimates for a lower bound (minimum)
value that the user believes, or has an educated guess about, that a random variable
can have.
• Most Likely (for mode c). These are the estimates for the mode (most likely) value
that the user believes, or has an educated guess about, that a random variable can
have.
• Maximum (for upper limit b). These are the estimates for an upper bound (maximum)
value that the user believes, or has an educated guess about, that a random variable
can have.
In the TRZ Revenue Feasibility tool, there are variables that cannot be less than zero (i.e.,
timing of development), variables that can be negative (i.e., property values growth rates), and
positive variables. The more certainty the user has about the possible range of a variable, the
smaller the range (the distance from a to b in Figure 6.5) between the minimum and maximum
values will be. Table 6.1 provides examples of three general cases of triangular distributions
configurations (i.e., symmetrical, skewed left, and skewed right) and their significance in the
financial model.
Source: Texas Transportation Institute
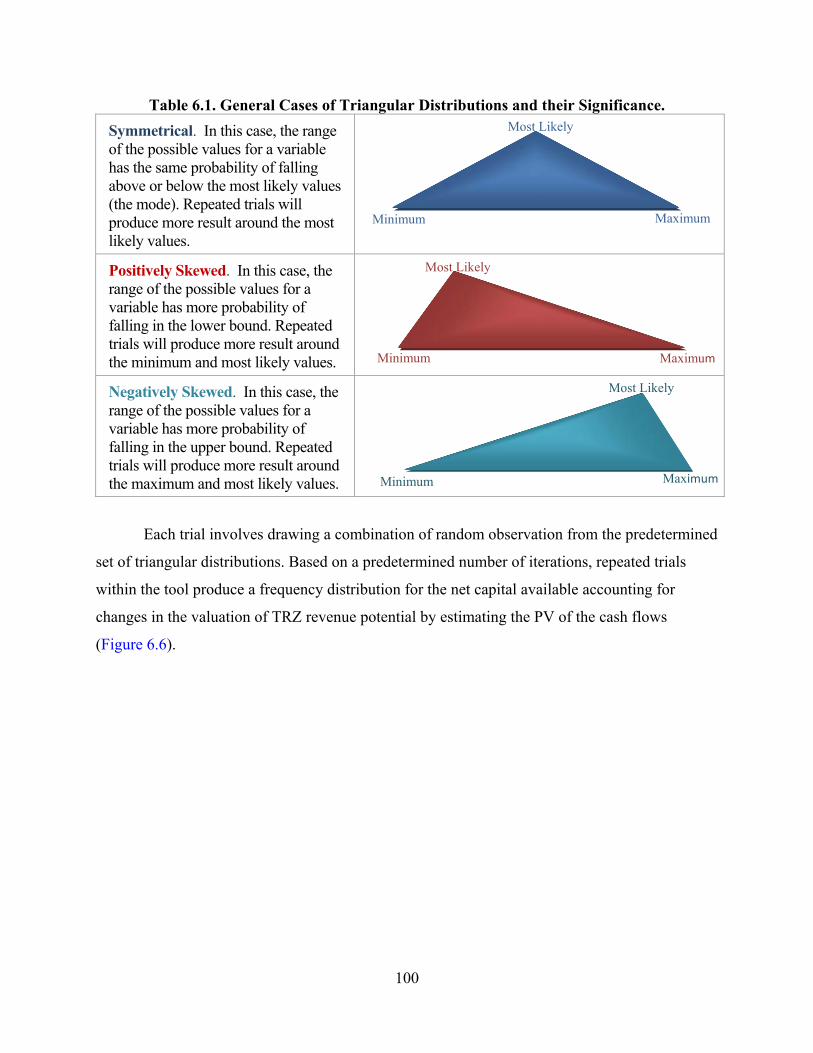
100
Table 6.1. General Cases of Triangular Distributions and their Significance. Symmetrical. In this case, the range of the possible values for a variable has the same probability of falling above or below the most likely values (the mode). Repeated trials will produce more result around the most likely values.
Positively Skewed. In this case, the range of the possible values for a variable has more probability of falling in the lower bound. Repeated trials will produce more result around the minimum and most likely values.
Negatively Skewed. In this case, the range of the possible values for a variable has more probability of falling in the upper bound. Repeated trials will produce more result around the maximum and most likely values.
Each trial involves drawing a combination of random observation from the predetermined
set of triangular distributions. Based on a predetermined number of iterations, repeated trials
within the tool produce a frequency distribution for the net capital available accounting for
changes in the valuation of TRZ revenue potential by estimating the PV of the cash flows
(Figure 6.6).
Minimum Maximum
Most Likely
Most Likely
Maximum Minimum
Minimum Maximum
Most Likely
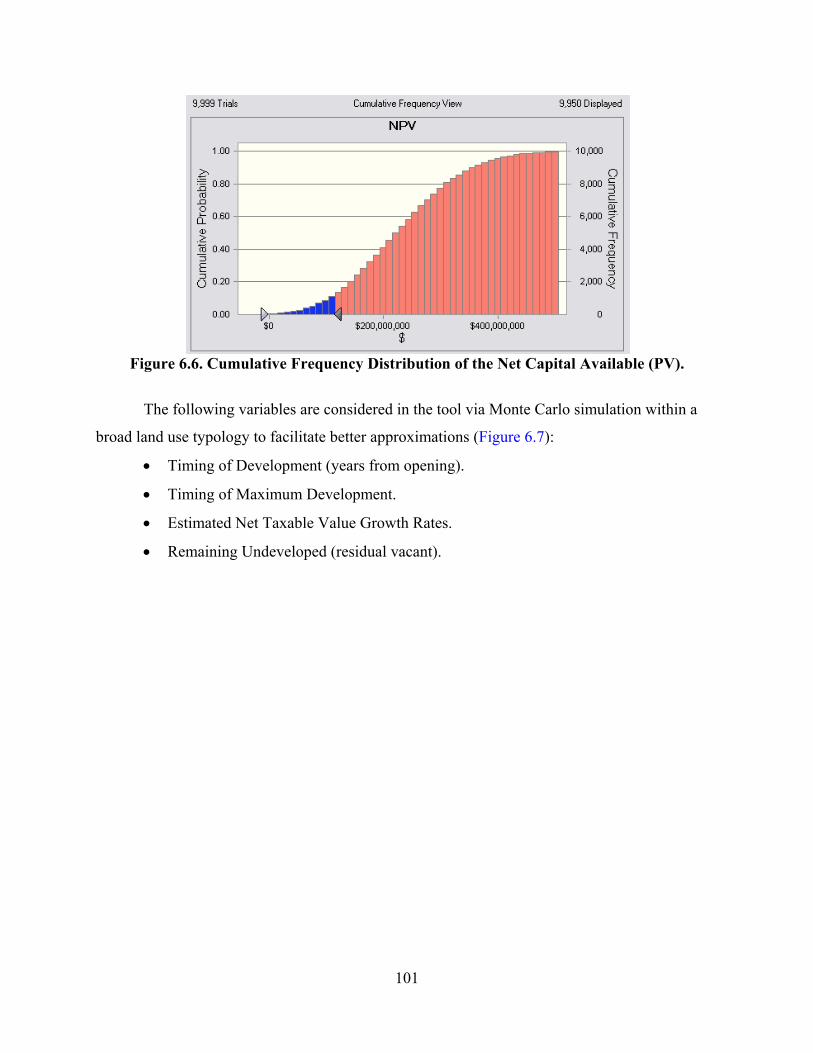
101
Figure 6.6. Cumulative Frequency Distribution of the Net Capital Available (PV).
The following variables are considered in the tool via Monte Carlo simulation within a
broad land use typology to facilitate better approximations (Figure 6.7):
• Timing of Development (years from opening).
• Timing of Maximum Development.
• Estimated Net Taxable Value Growth Rates.
• Remaining Undeveloped (residual vacant).
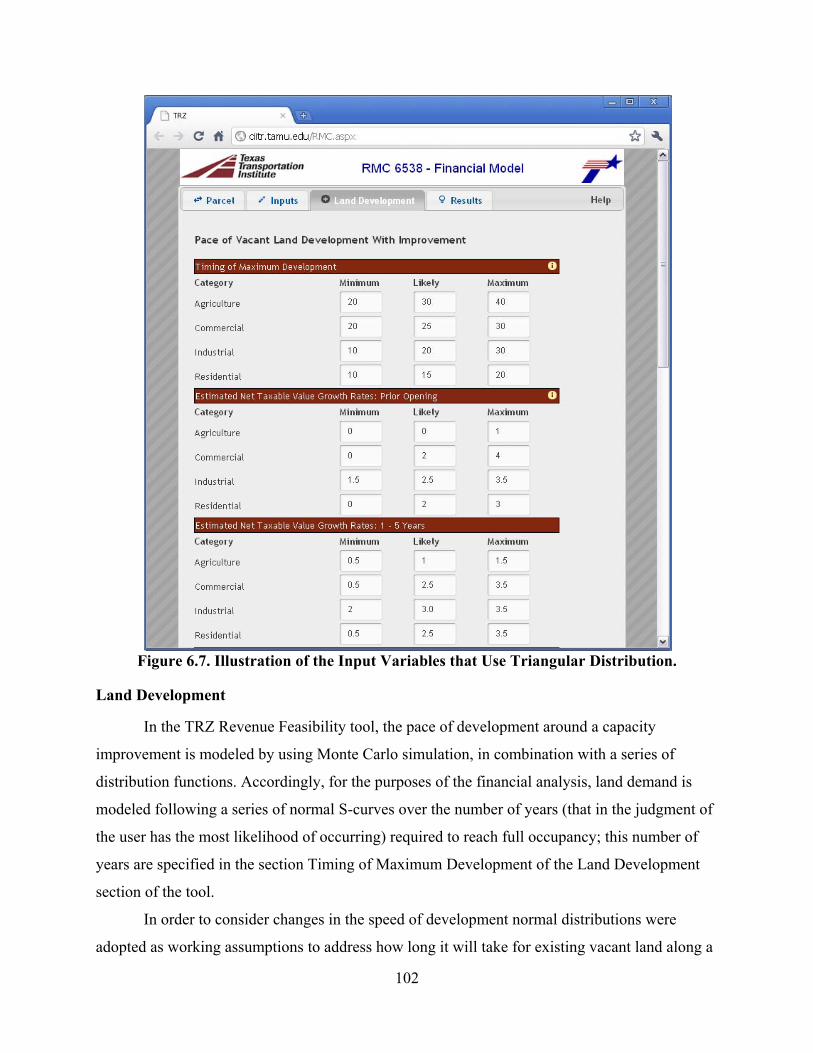
102
Figure 6.7. Illustration of the Input Variables that Use Triangular Distribution.
Land Development
In the TRZ Revenue Feasibility tool, the pace of development around a capacity
improvement is modeled by using Monte Carlo simulation, in combination with a series of
distribution functions. Accordingly, for the purposes of the financial analysis, land demand is
modeled following a series of normal S-curves over the number of years (that in the judgment of
the user has the most likelihood of occurring) required to reach full occupancy; this number of
years are specified in the section Timing of Maximum Development of the Land Development
section of the tool.
In order to consider changes in the speed of development normal distributions were
adopted as working assumptions to address how long it will take for existing vacant land along a
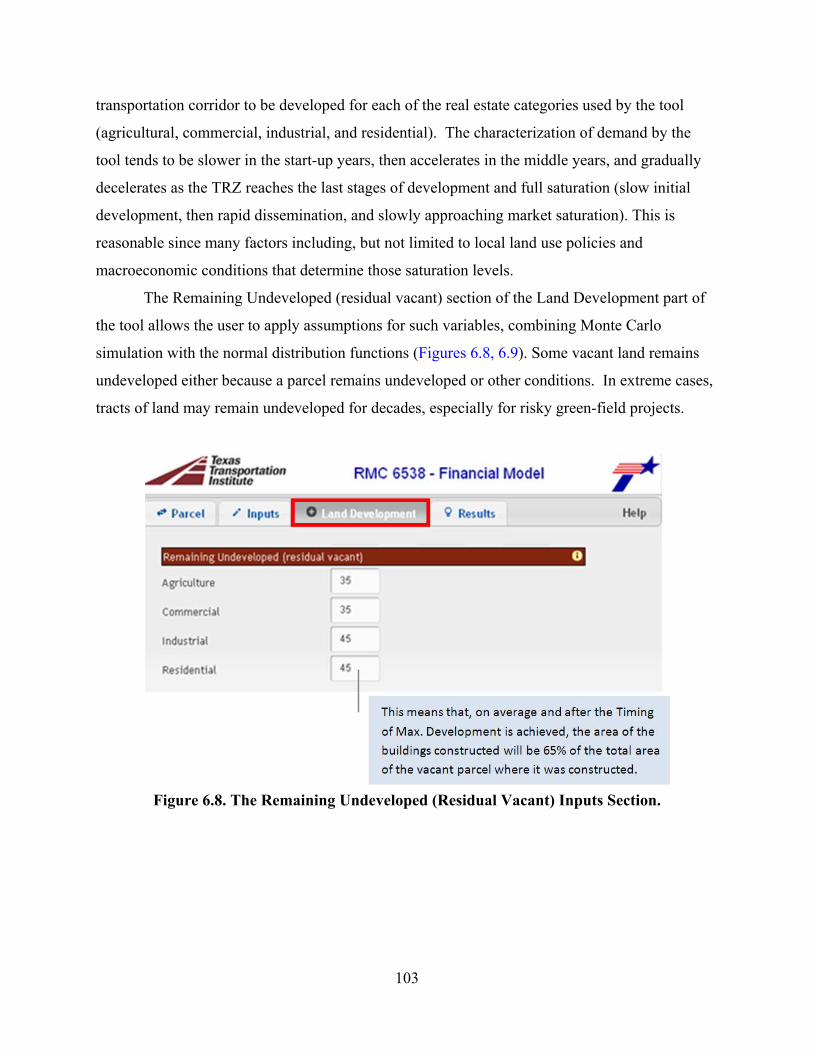
103
transportation corridor to be developed for each of the real estate categories used by the tool
(agricultural, commercial, industrial, and residential). The characterization of demand by the
tool tends to be slower in the start-up years, then accelerates in the middle years, and gradually
decelerates as the TRZ reaches the last stages of development and full saturation (slow initial
development, then rapid dissemination, and slowly approaching market saturation). This is
reasonable since many factors including, but not limited to local land use policies and
macroeconomic conditions that determine those saturation levels.
The Remaining Undeveloped (residual vacant) section of the Land Development part of
the tool allows the user to apply assumptions for such variables, combining Monte Carlo
simulation with the normal distribution functions (Figures 6.8, 6.9). Some vacant land remains
undeveloped either because a parcel remains undeveloped or other conditions. In extreme cases,
tracts of land may remain undeveloped for decades, especially for risky green-field projects.
Figure 6.8. The Remaining Undeveloped (Residual Vacant) Inputs Section.
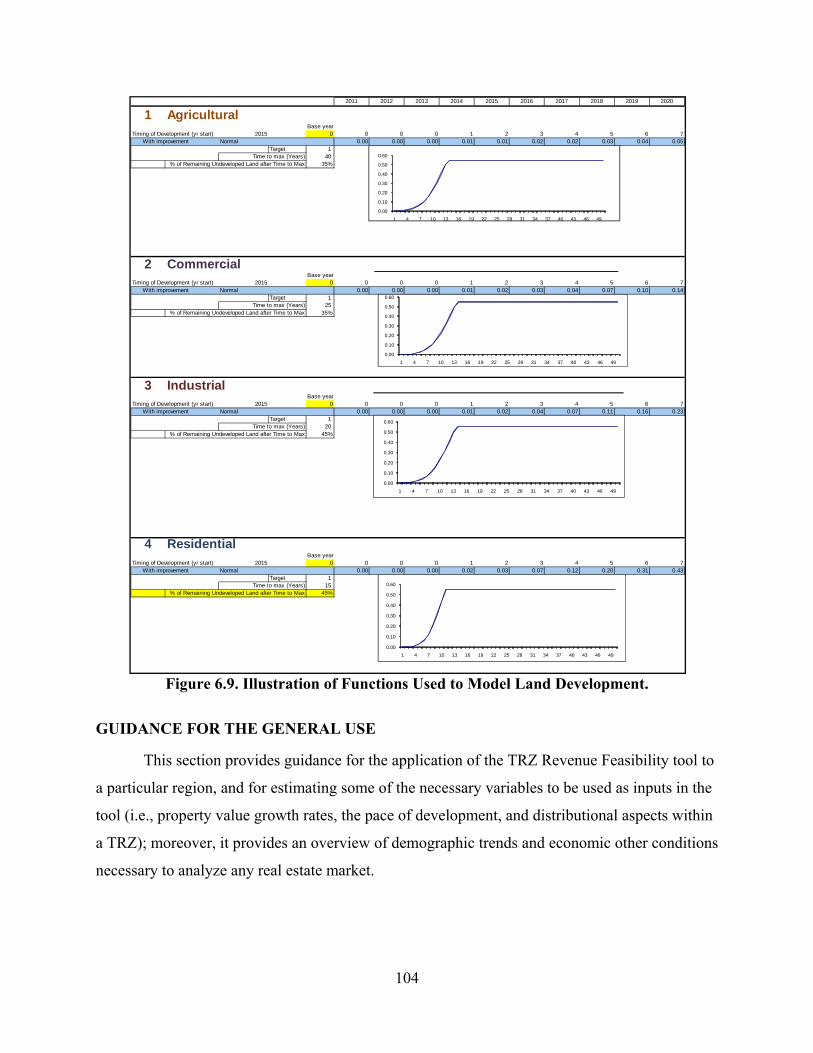
104
Figure 6.9. Illustration of Functions Used to Model Land Development.
GUIDANCE FOR THE GENERAL USE
This section provides guidance for the application of the TRZ Revenue Feasibility tool to
a particular region, and for estimating some of the necessary variables to be used as inputs in the
tool (i.e., property value growth rates, the pace of development, and distributional aspects within
a TRZ); moreover, it provides an overview of demographic trends and economic other conditions
necessary to analyze any real estate market.
2011 2012 2013 2014 2015 2016 2017 2018 2019 2020
1 AgriculturalBase year
Timing of Development (yr start) 2015 0 0 0 0 1 2 3 4 5 6 7With improvement Normal 0.00 0.00 0.00 0.01 0.01 0.02 0.02 0.03 0.04 0.05
Target 1 Time to max (Years) 40
% of Remaining Undeveloped Land after Time to Max 35%
2 CommercialBase year
Timing of Development (yr start) 2015 0 0 0 0 1 2 3 4 5 6 7With improvement Normal 0.00 0.00 0.00 0.01 0.02 0.03 0.04 0.07 0.10 0.14
Target 1 Time to max (Years) 25
% of Remaining Undeveloped Land after Time to Max 35%
3 IndustrialBase year
Timing of Development (yr start) 2015 0 0 0 0 1 2 3 4 5 6 7With improvement Normal 0.00 0.00 0.00 0.01 0.02 0.04 0.07 0.11 0.16 0.23
Target 1 Time to max (Years) 20
% of Remaining Undeveloped Land after Time to Max 45%
4 ResidentialBase year
Timing of Development (yr start) 2015 0 0 0 0 1 2 3 4 5 6 7With improvement Normal 0.00 0.00 0.00 0.02 0.03 0.07 0.12 0.20 0.31 0.43
Target 1 Time to max (Years) 15
% of Remaining Undeveloped Land after Time to Max 45%
0.00
0.10
0.20
0.30
0.40
0.50
0.60
1 4 7 10 13 16 19 22 25 28 31 34 37 40 43 46 49
0.00
0.10
0.20
0.30
0.40
0.50
0.60
1 4 7 10 13 16 19 22 25 28 31 34 37 40 43 46 49
0.00
0.10
0.20
0.30
0.40
0.50
0.60
1 4 7 10 13 16 19 22 25 28 31 34 37 40 43 46 49
0.00
0.10
0.20
0.30
0.40
0.50
0.60
1 4 7 10 13 16 19 22 25 28 31 34 37 40 43 46 49
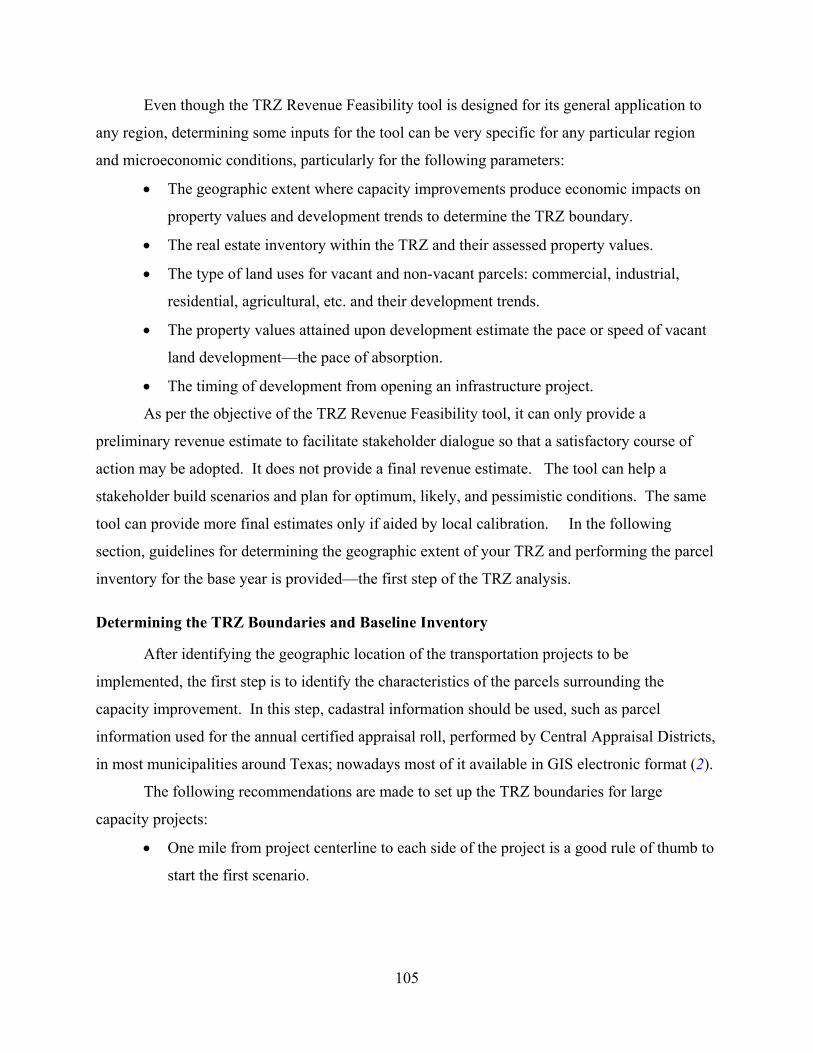
105
Even though the TRZ Revenue Feasibility tool is designed for its general application to
any region, determining some inputs for the tool can be very specific for any particular region
and microeconomic conditions, particularly for the following parameters:
• The geographic extent where capacity improvements produce economic impacts on
property values and development trends to determine the TRZ boundary.
• The real estate inventory within the TRZ and their assessed property values.
• The type of land uses for vacant and non-vacant parcels: commercial, industrial,
residential, agricultural, etc. and their development trends.
• The property values attained upon development estimate the pace or speed of vacant
land development—the pace of absorption.
• The timing of development from opening an infrastructure project.
As per the objective of the TRZ Revenue Feasibility tool, it can only provide a
preliminary revenue estimate to facilitate stakeholder dialogue so that a satisfactory course of
action may be adopted. It does not provide a final revenue estimate. The tool can help a
stakeholder build scenarios and plan for optimum, likely, and pessimistic conditions. The same
tool can provide more final estimates only if aided by local calibration. In the following
section, guidelines for determining the geographic extent of your TRZ and performing the parcel
inventory for the base year is provided—the first step of the TRZ analysis.
Determining the TRZ Boundaries and Baseline Inventory
After identifying the geographic location of the transportation projects to be
implemented, the first step is to identify the characteristics of the parcels surrounding the
capacity improvement. In this step, cadastral information should be used, such as parcel
information used for the annual certified appraisal roll, performed by Central Appraisal Districts,
in most municipalities around Texas; nowadays most of it available in GIS electronic format (2).
The following recommendations are made to set up the TRZ boundaries for large
capacity projects:
• One mile from project centerline to each side of the project is a good rule of thumb to
start the first scenario.
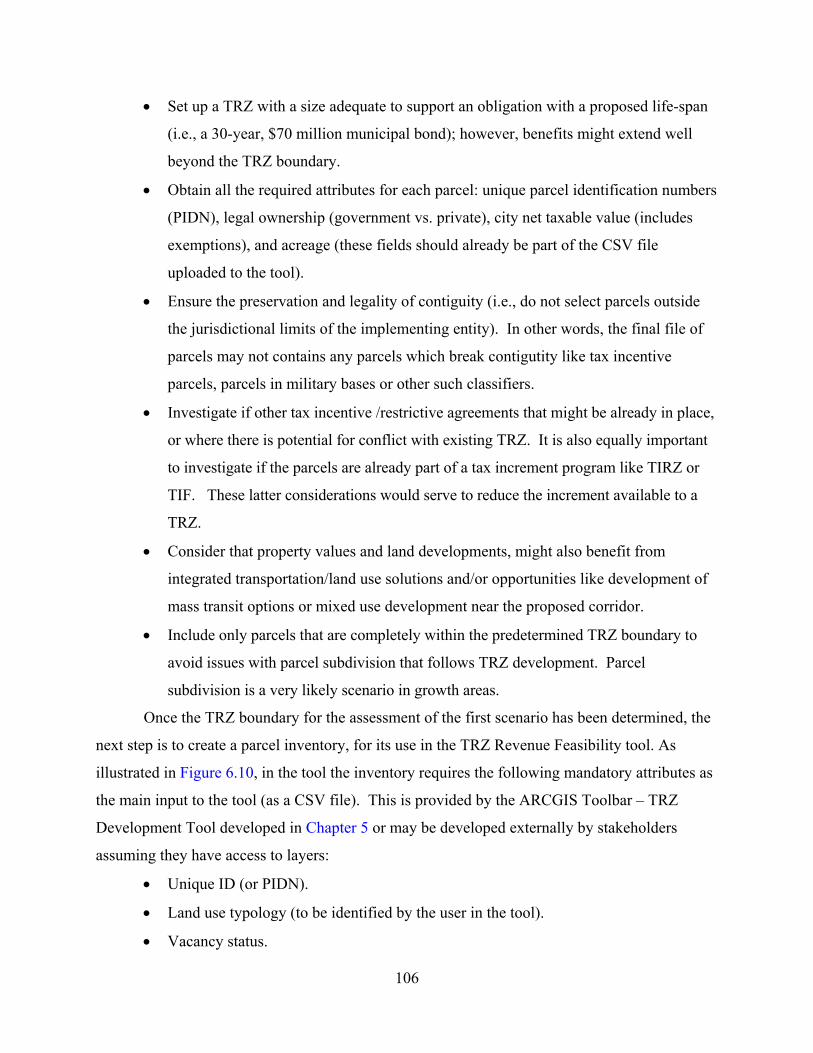
106
• Set up a TRZ with a size adequate to support an obligation with a proposed life-span
(i.e., a 30-year, $70 million municipal bond); however, benefits might extend well
beyond the TRZ boundary.
• Obtain all the required attributes for each parcel: unique parcel identification numbers
(PIDN), legal ownership (government vs. private), city net taxable value (includes
exemptions), and acreage (these fields should already be part of the CSV file
uploaded to the tool).
• Ensure the preservation and legality of contiguity (i.e., do not select parcels outside
the jurisdictional limits of the implementing entity). In other words, the final file of
parcels may not contains any parcels which break contigutity like tax incentive
parcels, parcels in military bases or other such classifiers.
• Investigate if other tax incentive /restrictive agreements that might be already in place,
or where there is potential for conflict with existing TRZ. It is also equally important
to investigate if the parcels are already part of a tax increment program like TIRZ or
TIF. These latter considerations would serve to reduce the increment available to a
TRZ.
• Consider that property values and land developments, might also benefit from
integrated transportation/land use solutions and/or opportunities like development of
mass transit options or mixed use development near the proposed corridor.
• Include only parcels that are completely within the predetermined TRZ boundary to
avoid issues with parcel subdivision that follows TRZ development. Parcel
subdivision is a very likely scenario in growth areas.
Once the TRZ boundary for the assessment of the first scenario has been determined, the
next step is to create a parcel inventory, for its use in the TRZ Revenue Feasibility tool. As
illustrated in Figure 6.10, in the tool the inventory requires the following mandatory attributes as
the main input to the tool (as a CSV file). This is provided by the ARCGIS Toolbar – TRZ
Development Tool developed in Chapter 5 or may be developed externally by stakeholders
assuming they have access to layers:
• Unique ID (or PIDN).
• Land use typology (to be identified by the user in the tool).
• Vacancy status.
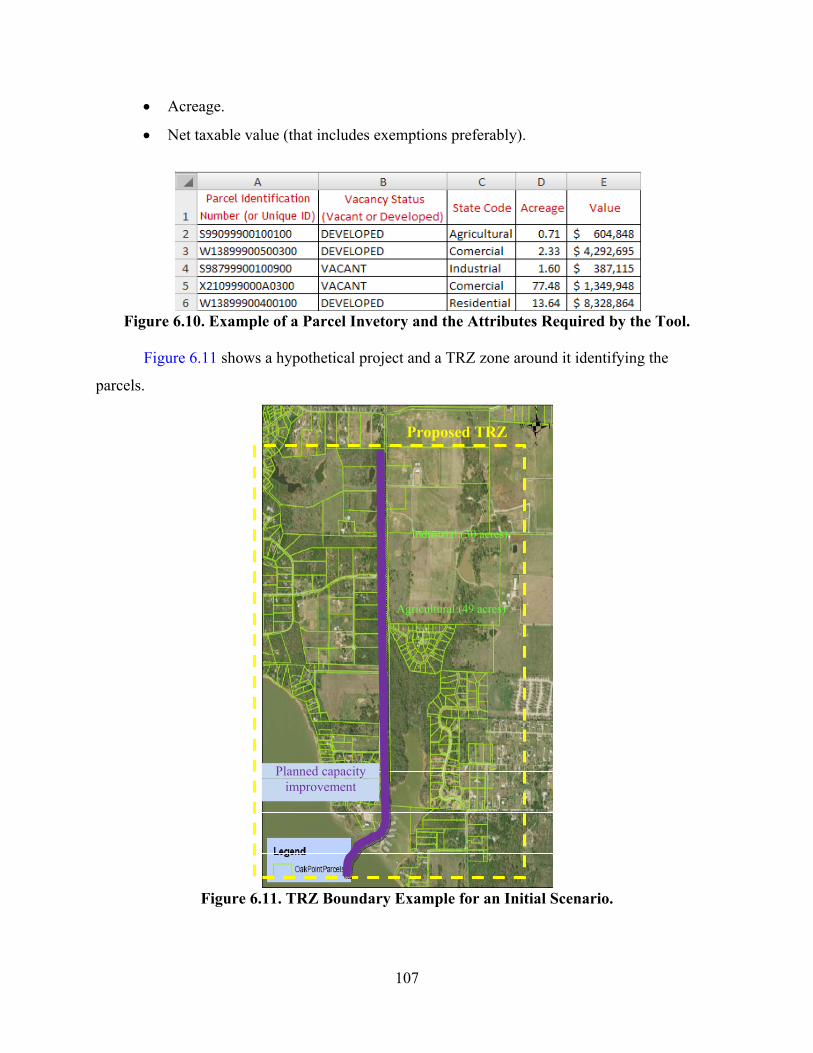
107
• Acreage.
• Net taxable value (that includes exemptions preferably).
Figure 6.10. Example of a Parcel Invetory and the Attributes Required by the Tool.
Figure 6.11 shows a hypothetical project and a TRZ zone around it identifying the
parcels.
Figure 6.11. TRZ Boundary Example for an Initial Scenario.
Proposed TRZ
Planned capacity improvement
Industrial (30 acres)
Agricultural (49 acres)
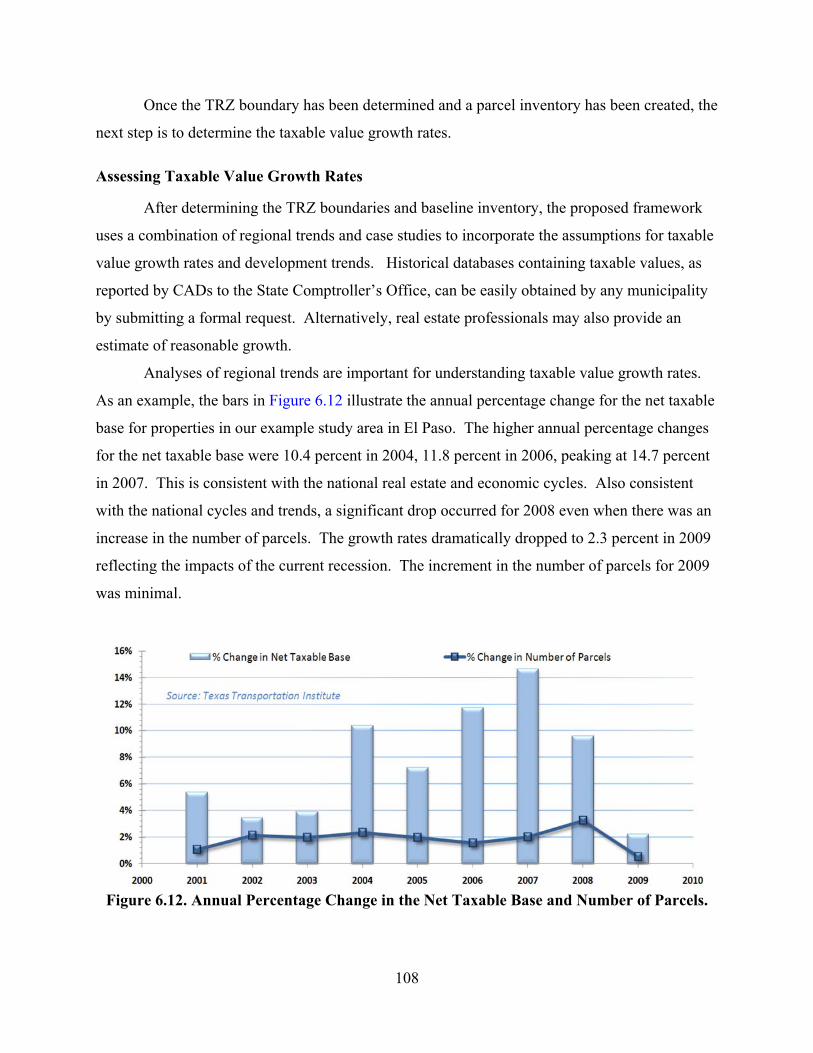
108
Once the TRZ boundary has been determined and a parcel inventory has been created, the
next step is to determine the taxable value growth rates.
Assessing Taxable Value Growth Rates
After determining the TRZ boundaries and baseline inventory, the proposed framework
uses a combination of regional trends and case studies to incorporate the assumptions for taxable
value growth rates and development trends. Historical databases containing taxable values, as
reported by CADs to the State Comptroller’s Office, can be easily obtained by any municipality
by submitting a formal request. Alternatively, real estate professionals may also provide an
estimate of reasonable growth.
Analyses of regional trends are important for understanding taxable value growth rates.
As an example, the bars in Figure 6.12 illustrate the annual percentage change for the net taxable
base for properties in our example study area in El Paso. The higher annual percentage changes
for the net taxable base were 10.4 percent in 2004, 11.8 percent in 2006, peaking at 14.7 percent
in 2007. This is consistent with the national real estate and economic cycles. Also consistent
with the national cycles and trends, a significant drop occurred for 2008 even when there was an
increase in the number of parcels. The growth rates dramatically dropped to 2.3 percent in 2009
reflecting the impacts of the current recession. The increment in the number of parcels for 2009
was minimal.
Figure 6.12. Annual Percentage Change in the Net Taxable Base and Number of Parcels.
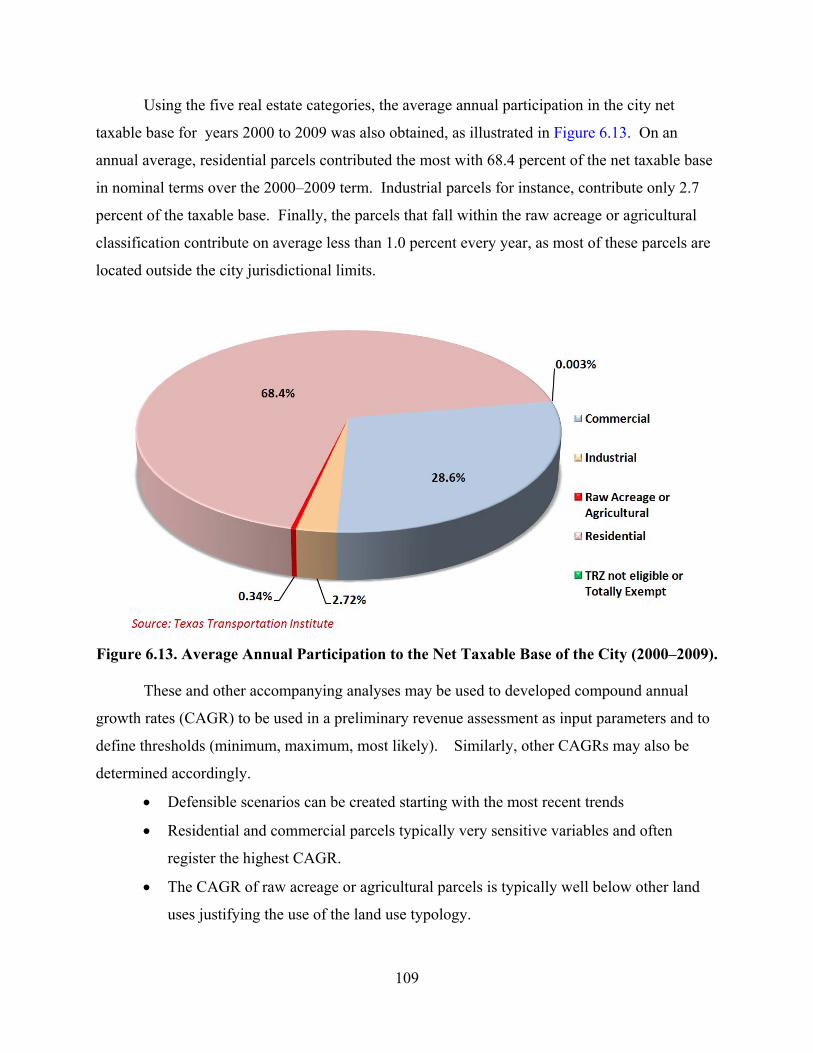
109
Using the five real estate categories, the average annual participation in the city net
taxable base for years 2000 to 2009 was also obtained, as illustrated in Figure 6.13. On an
annual average, residential parcels contributed the most with 68.4 percent of the net taxable base
in nominal terms over the 2000–2009 term. Industrial parcels for instance, contribute only 2.7
percent of the taxable base. Finally, the parcels that fall within the raw acreage or agricultural
classification contribute on average less than 1.0 percent every year, as most of these parcels are
located outside the city jurisdictional limits.
Figure 6.13. Average Annual Participation to the Net Taxable Base of the City (2000–2009).
These and other accompanying analyses may be used to developed compound annual
growth rates (CAGR) to be used in a preliminary revenue assessment as input parameters and to
define thresholds (minimum, maximum, most likely). Similarly, other CAGRs may also be
determined accordingly.
• Defensible scenarios can be created starting with the most recent trends
• Residential and commercial parcels typically very sensitive variables and often
register the highest CAGR.
• The CAGR of raw acreage or agricultural parcels is typically well below other land
uses justifying the use of the land use typology.
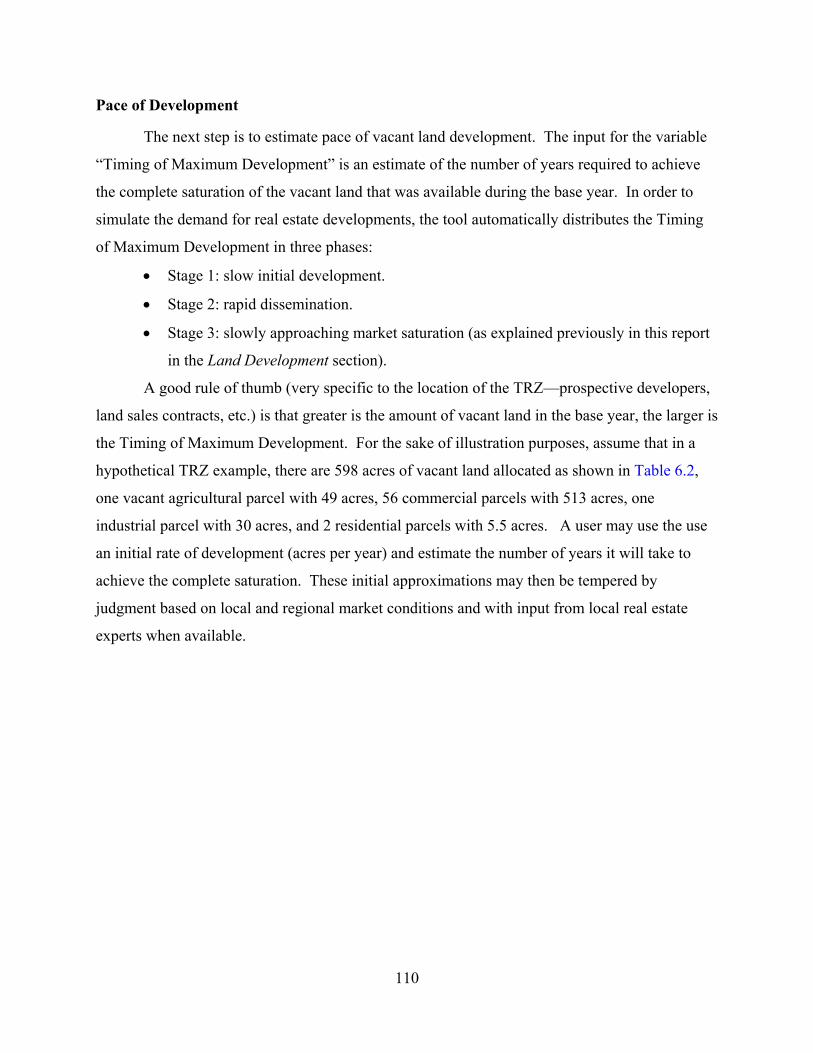
110
Pace of Development
The next step is to estimate pace of vacant land development. The input for the variable
“Timing of Maximum Development” is an estimate of the number of years required to achieve
the complete saturation of the vacant land that was available during the base year. In order to
simulate the demand for real estate developments, the tool automatically distributes the Timing
of Maximum Development in three phases:
• Stage 1: slow initial development.
• Stage 2: rapid dissemination.
• Stage 3: slowly approaching market saturation (as explained previously in this report
in the Land Development section).
A good rule of thumb (very specific to the location of the TRZ—prospective developers,
land sales contracts, etc.) is that greater is the amount of vacant land in the base year, the larger is
the Timing of Maximum Development. For the sake of illustration purposes, assume that in a
hypothetical TRZ example, there are 598 acres of vacant land allocated as shown in Table 6.2,
one vacant agricultural parcel with 49 acres, 56 commercial parcels with 513 acres, one
industrial parcel with 30 acres, and 2 residential parcels with 5.5 acres. A user may use the use
an initial rate of development (acres per year) and estimate the number of years it will take to
achieve the complete saturation. These initial approximations may then be tempered by
judgment based on local and regional market conditions and with input from local real estate
experts when available.
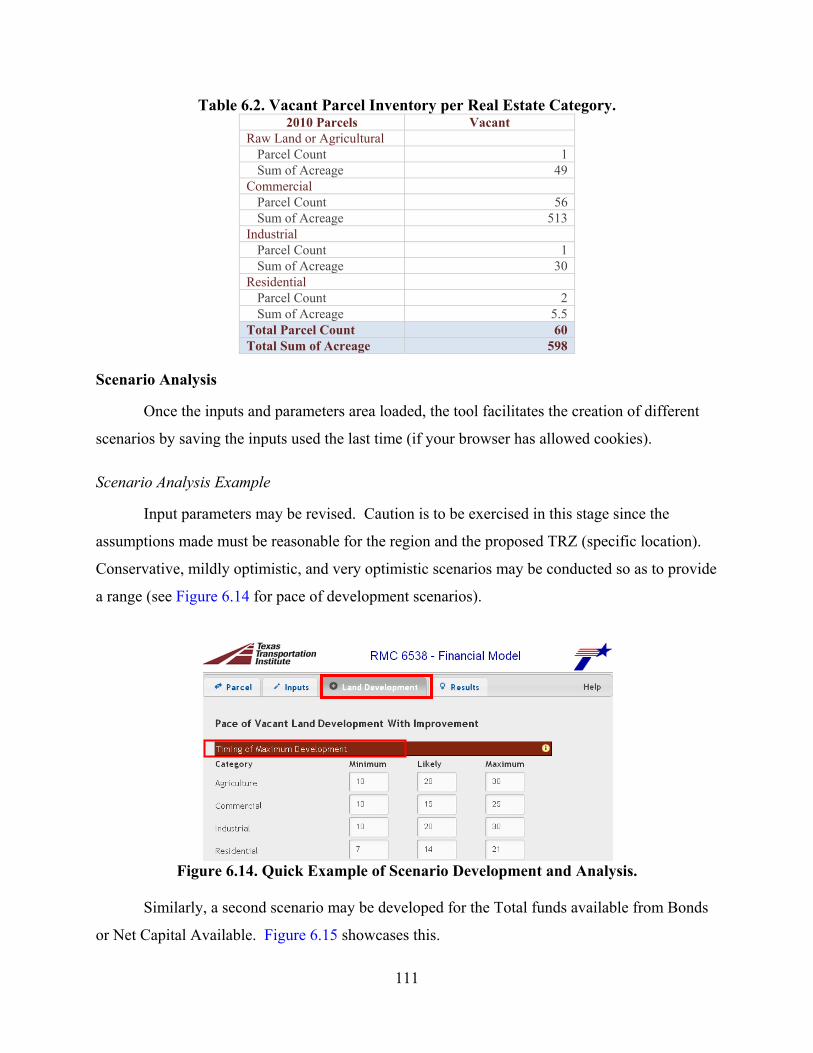
111
Table 6.2. Vacant Parcel Inventory per Real Estate Category. 2010 Parcels Vacant
Raw Land or Agricultural Parcel Count 1 Sum of Acreage 49
Commercial Parcel Count 56 Sum of Acreage 513
Industrial Parcel Count 1 Sum of Acreage 30
Residential Parcel Count 2 Sum of Acreage 5.5
Total Parcel Count 60 Total Sum of Acreage 598
Scenario Analysis
Once the inputs and parameters area loaded, the tool facilitates the creation of different
scenarios by saving the inputs used the last time (if your browser has allowed cookies).
Scenario Analysis Example
Input parameters may be revised. Caution is to be exercised in this stage since the
assumptions made must be reasonable for the region and the proposed TRZ (specific location).
Conservative, mildly optimistic, and very optimistic scenarios may be conducted so as to provide
a range (see Figure 6.14 for pace of development scenarios).
Figure 6.14. Quick Example of Scenario Development and Analysis.
Similarly, a second scenario may be developed for the Total funds available from Bonds
or Net Capital Available. Figure 6.15 showcases this.
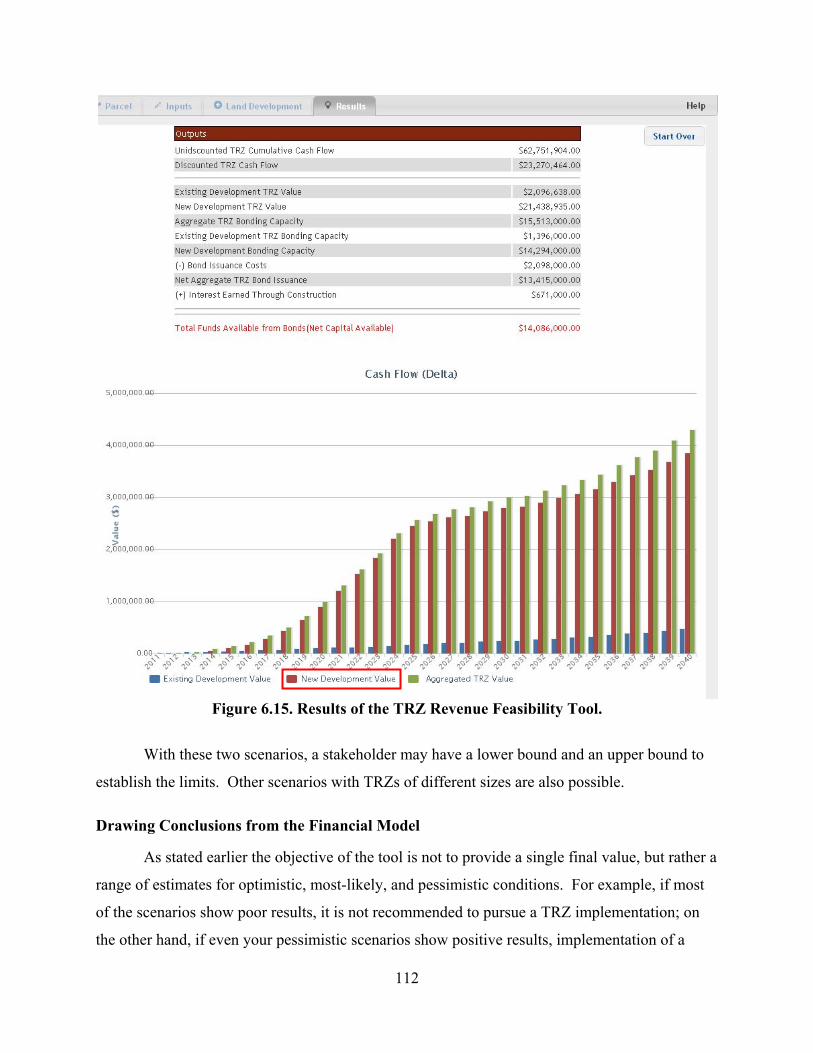
112
Figure 6.15. Results of the TRZ Revenue Feasibility Tool.
With these two scenarios, a stakeholder may have a lower bound and an upper bound to
establish the limits. Other scenarios with TRZs of different sizes are also possible.
Drawing Conclusions from the Financial Model
As stated earlier the objective of the tool is not to provide a single final value, but rather a
range of estimates for optimistic, most-likely, and pessimistic conditions. For example, if most
of the scenarios show poor results, it is not recommended to pursue a TRZ implementation; on
the other hand, if even your pessimistic scenarios show positive results, implementation of a
113
TRZ should certainly be further explored. If that is the case, the TRZ may be formulated, and
more advanced revenue assessments may be developed to meet. Once the CSV file from the
TRZ Zone development tool is developed and the inputs are loaded into the revenue tool, the
entire process takes only a few minutes.

115
CHAPTER 7: INCREMENT BASED TRANSIT VALUE CAPTURE IN TEXAS
This chapter assesses the implications of current value capture legislation for transit in
Texas, provides planning and implementation guidelines when applicable, and discusses the
larger role for transit in mobility improvements and congestion reduction in future via transit
capital infrastructure supported through value capture initiatives like transit TRZs or similar
concepts. This chapter documents existing value capture legislation from a transit perspective;
documents impact effects much like highways; and makes recommendations for specific
suggestions for facilitating transit value capture for cost recovery. This chapter is divided into
many sub sections to facilitate the discussion of primary objectives, including:
• Specific issues in legislative provisions for increment based finance in Texas for
transit like TRIZ code and SB1266 mentioned in Chapter 1.
• A typological list of transit on TxDOT systems currently existing in Texas
specifically distinguishing between those that are on the state highway system (on-
system) and those that are not.
• A meta-analysis of published findings on transit impacts on property values.
• Review of the state-of-practice of transit-based value capture techniques in Texas.
• Develop planning and implementation guidance for TRZ for on- and off-system
transit.
• Recommendations for further legislation in Texas that might help value capture
increment finance for financing transit systems in a better way than currently
practiced.
ISSUES IN THE EXISTING LEGAL FRAMEWORK FOR VALUE CAPTURE FOR TRANSIT
TIRZ Code
The TIRZ mechanism in Texas has most often been used to promote local goals and to
finance or facilitate primarily transit- oriented- development ( TOD) within the zones created
rather than being used to defray the capital costs of the infrastructure improvement itself.
116
Senate Bill 1266
SB1266, permits joint governing body cooperation but currently permits financing for
highway projects on the state highway system (on-system) only, and on-system transit facilities
may only receive surplus funds after the primary highway project(s) have been financed.
TRZ AND TRANSIT
SB1266 amended Chapter 222 of the Transportation Code (4) concerning Title 6 labeled
“Roadways” in the Transportation Code while “Railroads” are included in Title 5. Another
important aspect is that current transit statute such as Chapter 451 Metropolitan Rapid Transit
Authorities, Chapter 453 Municipal Transit, Chapter 456 State Financing of Public
Transportation, Chapter 457 County Mass Transit, and Chapter 461 Statewide Coordination of
Public Transportation are also located under Title 6 for Roadways. Chapter 222 mentions transit
in relation to the Highway Trust Fund and that transit receives funding from a separate account
derived from the Trust Fund. The funds from the State Infrastructure Bank are allowed to
“finance a purchase or lease agreement in connection with a transit project” under
Section 222.074(a-6). In summary, the language in SB1266 primarily amended highway
financing but does not contain any transit supportive language because of constitutional
provisions that do not allow it.
Transit and TRZ Surplus Funds
The current TRZ law supports transit systems on the state highway system in the same
region as the TRZ through surplus provisions after the debt issued to pay for the initial highway
project has been paid off. These on-system transit systems typically include bus systems and
BRT systems. Only two examples are currently found in Texas (i.e., BRT lines in El Paso and
San Antonio). In other words, as of now, El Paso and San Antonio BRT systems may only
indirectly benefit if a) there are TRZ’s established in their regions and b) if those uses are
approved by the local entity. In the future, however, more BRT systems and/or new forms of
transit operations may emerge and interact with TxDOT on-system projects. Some of these new
forms of transit are discussed in the following sections. Hence the question may be asked: is
there a financing mechanism that can directly benefit or expedite such systems or should the
117
presence of surplus funds in the region be the only potential source of local funds for these
systems?
TYPOLOGICAL LIST OF TRANSIT ON TXDOT SYSTEM
A loose definition of TxDOT On-System Transit refers to all transit systems having their
service routes partially or entirely on TxDOT state highways. In contrast, a strict definition of
On-System Transit refers to those with transit facilities, for example, station/stop structures and
guideways, built within the right-of-way of the TxDOT on-system highways. Table 7.1 presents
an inventory of TxDOT on-system highways.
TxDOT follows the restricted version of on-system transit definition. By this definition,
there are currently only two on-system transit systems in Texas: the BRT lines in El Paso and
San Antonio.
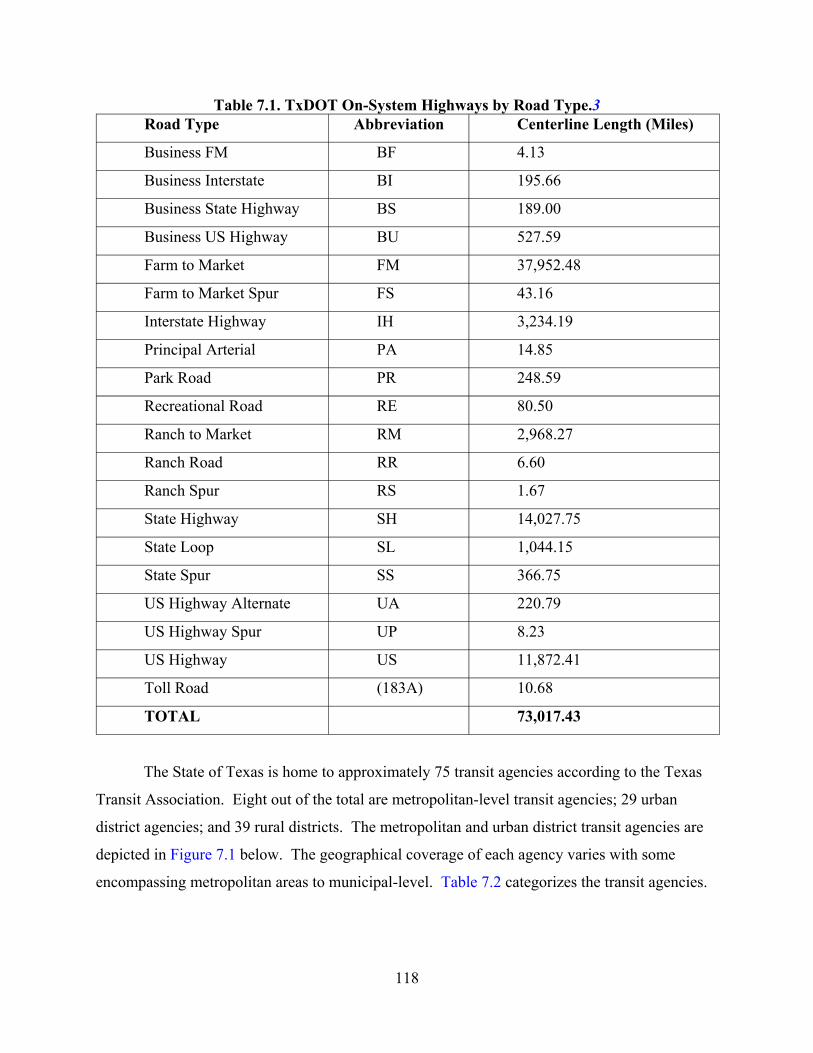
118
Table 7.1. TxDOT On-System Highways by Road Type.3 Road Type Abbreviation Centerline Length (Miles)
Business FM BF 4.13
Business Interstate BI 195.66
Business State Highway BS 189.00
Business US Highway BU 527.59
Farm to Market FM 37,952.48
Farm to Market Spur FS 43.16
Interstate Highway IH 3,234.19
Principal Arterial PA 14.85
Park Road PR 248.59
Recreational Road RE 80.50
Ranch to Market RM 2,968.27
Ranch Road RR 6.60
Ranch Spur RS 1.67
State Highway SH 14,027.75
State Loop SL 1,044.15
State Spur SS 366.75
US Highway Alternate UA 220.79
US Highway Spur UP 8.23
US Highway US 11,872.41
Toll Road (183A) 10.68
TOTAL 73,017.43
The State of Texas is home to approximately 75 transit agencies according to the Texas
Transit Association. Eight out of the total are metropolitan-level transit agencies; 29 urban
district agencies; and 39 rural districts. The metropolitan and urban district transit agencies are
depicted in Figure 7.1 below. The geographical coverage of each agency varies with some
encompassing metropolitan areas to municipal-level. Table 7.2 categorizes the transit agencies.
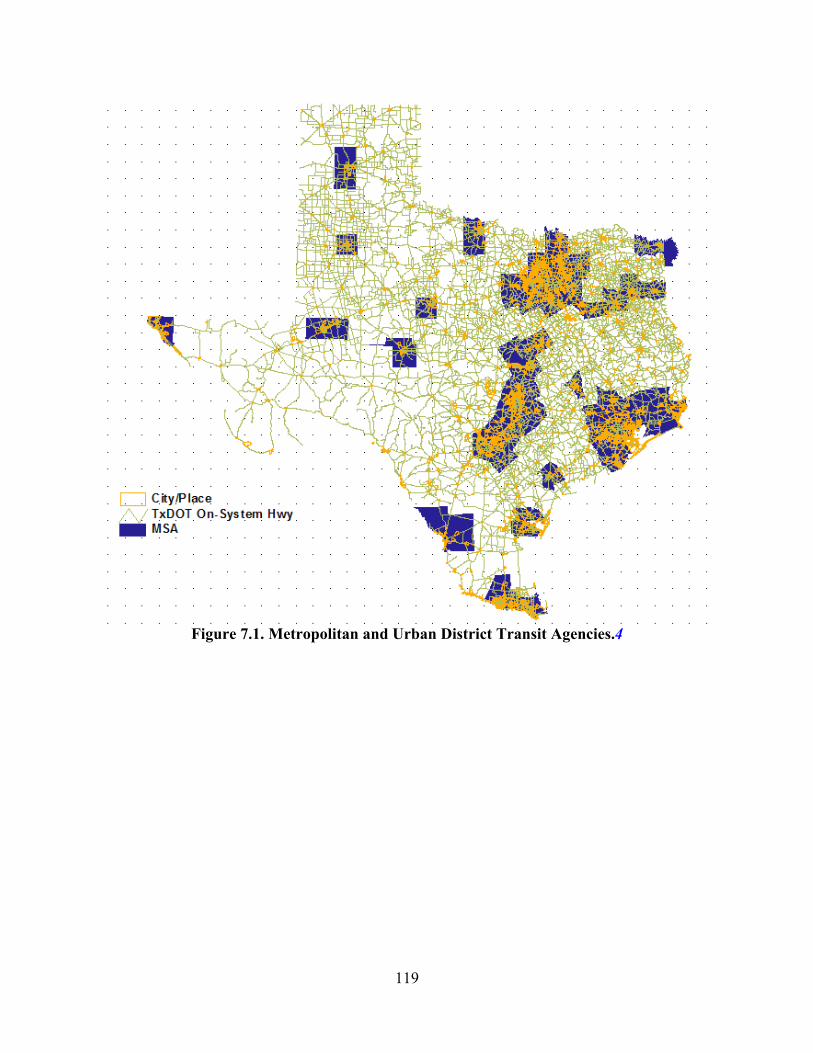
119
Figure 7.1. Metropolitan and Urban District Transit Agencies.4
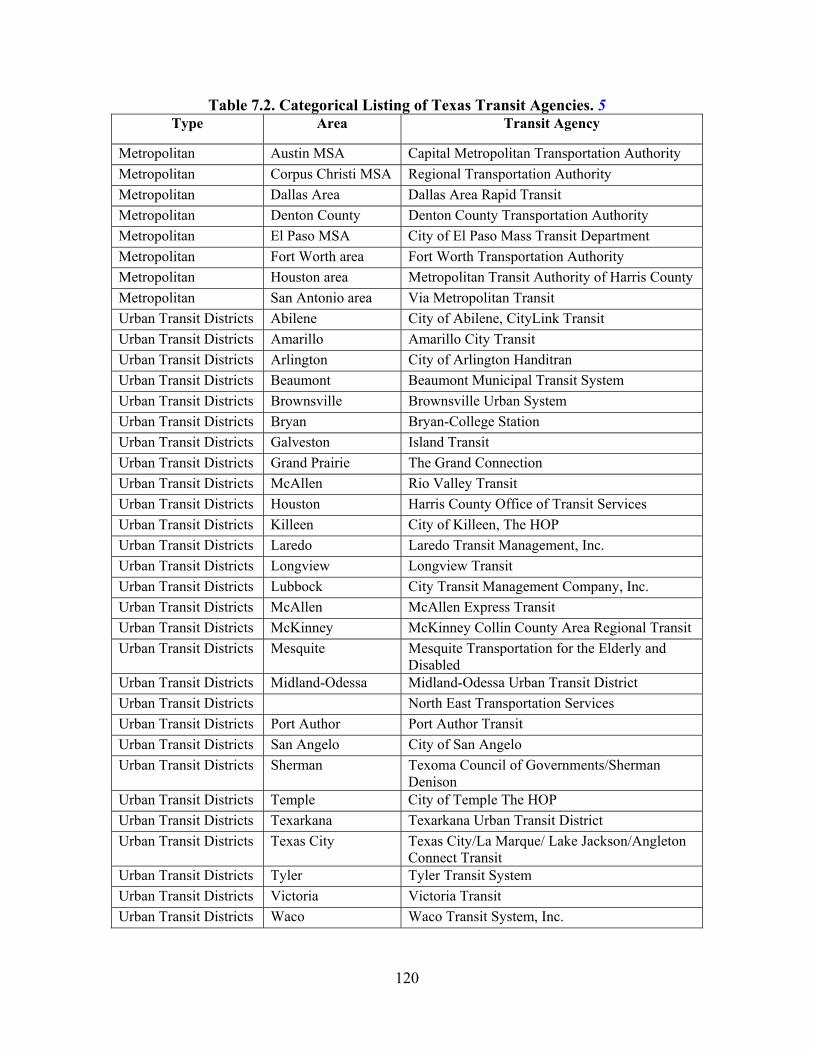
120
Table 7.2. Categorical Listing of Texas Transit Agencies. 5 Type Area Transit Agency
Metropolitan Austin MSA Capital Metropolitan Transportation Authority Metropolitan Corpus Christi MSA Regional Transportation Authority Metropolitan Dallas Area Dallas Area Rapid Transit Metropolitan Denton County Denton County Transportation Authority Metropolitan El Paso MSA City of El Paso Mass Transit Department Metropolitan Fort Worth area Fort Worth Transportation Authority Metropolitan Houston area Metropolitan Transit Authority of Harris County Metropolitan San Antonio area Via Metropolitan Transit Urban Transit Districts Abilene City of Abilene, CityLink Transit Urban Transit Districts Amarillo Amarillo City Transit Urban Transit Districts Arlington City of Arlington Handitran Urban Transit Districts Beaumont Beaumont Municipal Transit System Urban Transit Districts Brownsville Brownsville Urban System Urban Transit Districts Bryan Bryan-College Station Urban Transit Districts Galveston Island Transit Urban Transit Districts Grand Prairie The Grand Connection Urban Transit Districts McAllen Rio Valley Transit Urban Transit Districts Houston Harris County Office of Transit Services Urban Transit Districts Killeen City of Killeen, The HOP Urban Transit Districts Laredo Laredo Transit Management, Inc. Urban Transit Districts Longview Longview Transit Urban Transit Districts Lubbock City Transit Management Company, Inc. Urban Transit Districts McAllen McAllen Express Transit Urban Transit Districts McKinney McKinney Collin County Area Regional Transit Urban Transit Districts Mesquite Mesquite Transportation for the Elderly and
Disabled Urban Transit Districts Midland-Odessa Midland-Odessa Urban Transit District Urban Transit Districts North East Transportation Services Urban Transit Districts Port Author Port Author Transit Urban Transit Districts San Angelo City of San Angelo Urban Transit Districts Sherman Texoma Council of Governments/Sherman
Denison Urban Transit Districts Temple City of Temple The HOP Urban Transit Districts Texarkana Texarkana Urban Transit District Urban Transit Districts Texas City Texas City/La Marque/ Lake Jackson/Angleton
Connect Transit Urban Transit Districts Tyler Tyler Transit System Urban Transit Districts Victoria Victoria Transit Urban Transit Districts Waco Waco Transit System, Inc.
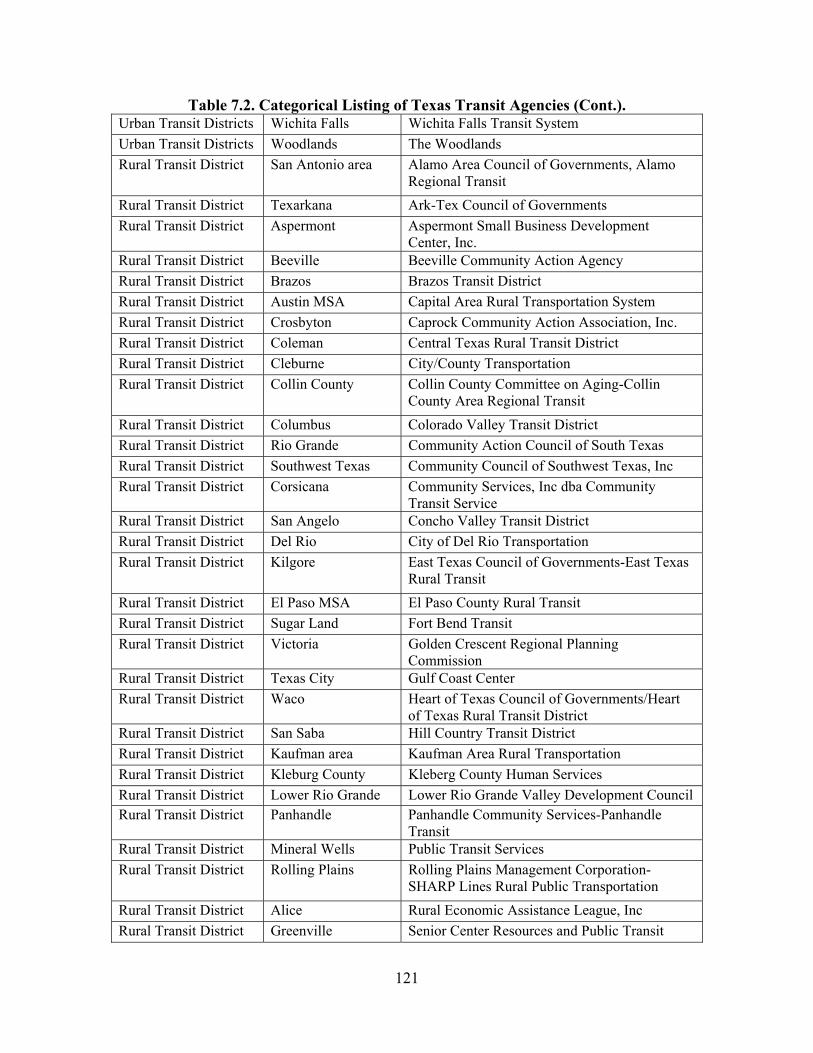
121
Table 7.2. Categorical Listing of Texas Transit Agencies (Cont.). Urban Transit Districts Wichita Falls Wichita Falls Transit System Urban Transit Districts Woodlands The Woodlands Rural Transit District San Antonio area Alamo Area Council of Governments, Alamo
Regional Transit Rural Transit District Texarkana Ark-Tex Council of Governments Rural Transit District Aspermont Aspermont Small Business Development
Center, Inc. Rural Transit District Beeville Beeville Community Action Agency Rural Transit District Brazos Brazos Transit District Rural Transit District Austin MSA Capital Area Rural Transportation System Rural Transit District Crosbyton Caprock Community Action Association, Inc. Rural Transit District Coleman Central Texas Rural Transit District Rural Transit District Cleburne City/County Transportation Rural Transit District Collin County Collin County Committee on Aging-Collin
County Area Regional Transit Rural Transit District Columbus Colorado Valley Transit District Rural Transit District Rio Grande Community Action Council of South Texas Rural Transit District Southwest Texas Community Council of Southwest Texas, Inc Rural Transit District Corsicana Community Services, Inc dba Community
Transit Service Rural Transit District San Angelo Concho Valley Transit District Rural Transit District Del Rio City of Del Rio Transportation Rural Transit District Kilgore East Texas Council of Governments-East Texas
Rural Transit Rural Transit District El Paso MSA El Paso County Rural Transit Rural Transit District Sugar Land Fort Bend Transit Rural Transit District Victoria Golden Crescent Regional Planning
Commission Rural Transit District Texas City Gulf Coast Center Rural Transit District Waco Heart of Texas Council of Governments/Heart
of Texas Rural Transit District Rural Transit District San Saba Hill Country Transit District Rural Transit District Kaufman area Kaufman Area Rural Transportation Rural Transit District Kleburg County Kleberg County Human Services Rural Transit District Lower Rio Grande Lower Rio Grande Valley Development Council Rural Transit District Panhandle Panhandle Community Services-Panhandle
Transit Rural Transit District Mineral Wells Public Transit Services Rural Transit District Rolling Plains Rolling Plains Management Corporation-
SHARP Lines Rural Public Transportation Rural Transit District Alice Rural Economic Assistance League, Inc Rural Transit District Greenville Senior Center Resources and Public Transit
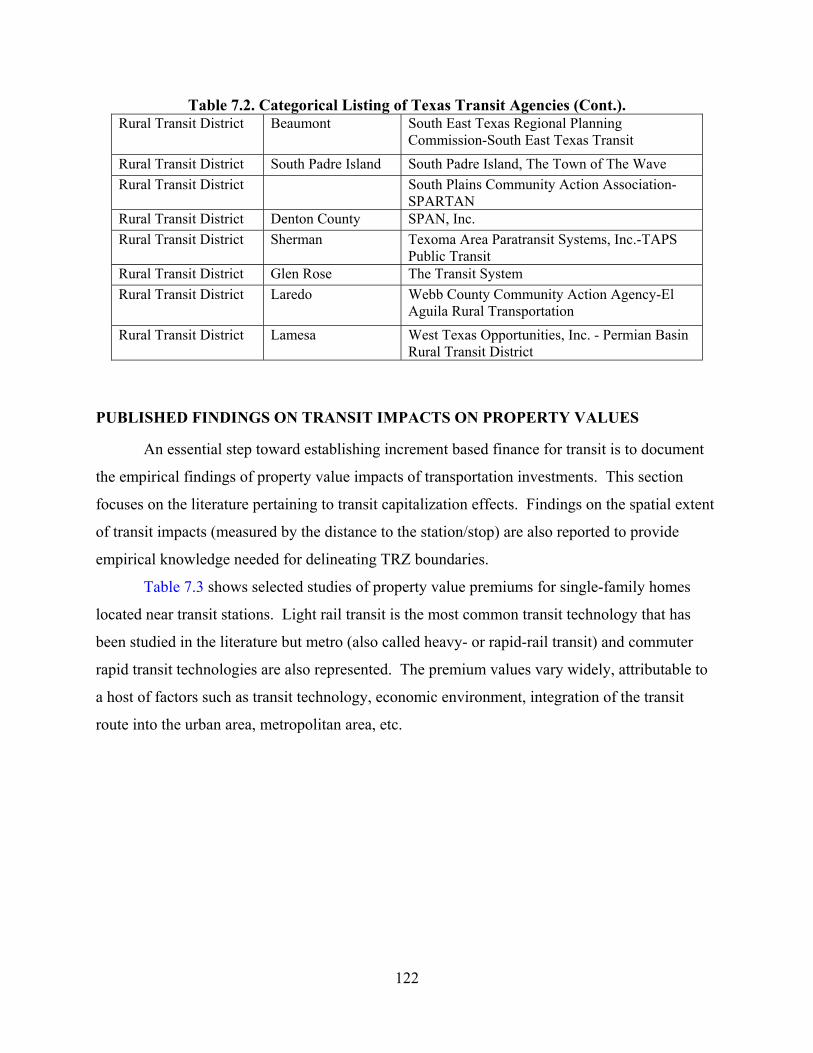
122
Table 7.2. Categorical Listing of Texas Transit Agencies (Cont.). Rural Transit District Beaumont South East Texas Regional Planning
Commission-South East Texas Transit Rural Transit District South Padre Island South Padre Island, The Town of The Wave Rural Transit District South Plains Community Action Association-
SPARTAN Rural Transit District Denton County SPAN, Inc. Rural Transit District Sherman Texoma Area Paratransit Systems, Inc.-TAPS
Public Transit Rural Transit District Glen Rose The Transit System Rural Transit District Laredo Webb County Community Action Agency-El
Aguila Rural Transportation Rural Transit District Lamesa West Texas Opportunities, Inc. - Permian Basin
Rural Transit District
PUBLISHED FINDINGS ON TRANSIT IMPACTS ON PROPERTY VALUES
An essential step toward establishing increment based finance for transit is to document
the empirical findings of property value impacts of transportation investments. This section
focuses on the literature pertaining to transit capitalization effects. Findings on the spatial extent
of transit impacts (measured by the distance to the station/stop) are also reported to provide
empirical knowledge needed for delineating TRZ boundaries.
Table 7.3 shows selected studies of property value premiums for single-family homes
located near transit stations. Light rail transit is the most common transit technology that has
been studied in the literature but metro (also called heavy- or rapid-rail transit) and commuter
rapid transit technologies are also represented. The premium values vary widely, attributable to
a host of factors such as transit technology, economic environment, integration of the transit
route into the urban area, metropolitan area, etc.
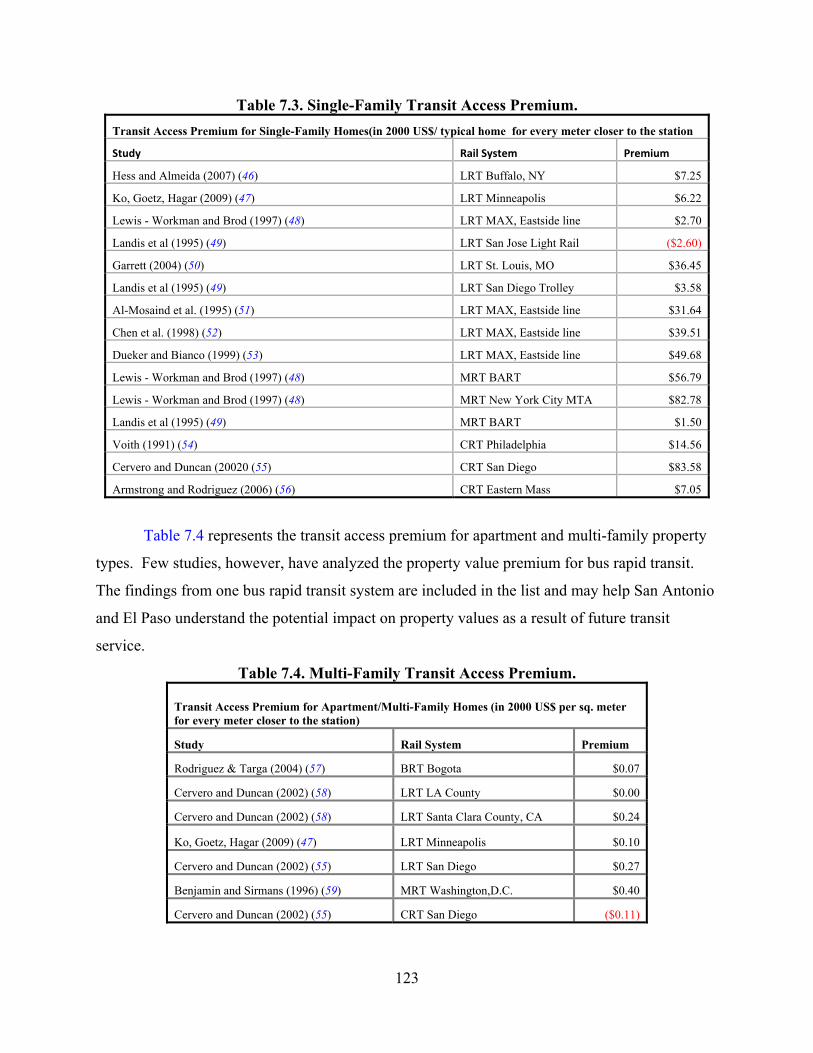
123
Table 7.3. Single-Family Transit Access Premium. Transit Access Premium for Single-Family Homes(in 2000 US$/ typical home for every meter closer to the station
Study Rail System Premium
Hess and Almeida (2007) (46) LRT Buffalo, NY $7.25
Ko, Goetz, Hagar (2009) (47) LRT Minneapolis $6.22
Lewis - Workman and Brod (1997) (48) LRT MAX, Eastside line $2.70
Landis et al (1995) (49) LRT San Jose Light Rail ($2.60)
Garrett (2004) (50) LRT St. Louis, MO $36.45
Landis et al (1995) (49) LRT San Diego Trolley $3.58
Al-Mosaind et al. (1995) (51) LRT MAX, Eastside line $31.64
Chen et al. (1998) (52) LRT MAX, Eastside line $39.51
Dueker and Bianco (1999) (53) LRT MAX, Eastside line $49.68
Lewis - Workman and Brod (1997) (48) MRT BART $56.79
Lewis - Workman and Brod (1997) (48) MRT New York City MTA $82.78
Landis et al (1995) (49) MRT BART $1.50
Voith (1991) (54) CRT Philadelphia $14.56
Cervero and Duncan (20020 (55) CRT San Diego $83.58
Armstrong and Rodriguez (2006) (56) CRT Eastern Mass $7.05
Table 7.4 represents the transit access premium for apartment and multi-family property
types. Few studies, however, have analyzed the property value premium for bus rapid transit.
The findings from one bus rapid transit system are included in the list and may help San Antonio
and El Paso understand the potential impact on property values as a result of future transit
service.
Table 7.4. Multi-Family Transit Access Premium.
Transit Access Premium for Apartment/Multi-Family Homes (in 2000 US$ per sq. meter for every meter closer to the station)
Study Rail System Premium
Rodriguez & Targa (2004) (57) BRT Bogota $0.07
Cervero and Duncan (2002) (58) LRT LA County $0.00
Cervero and Duncan (2002) (58) LRT Santa Clara County, CA $0.24
Ko, Goetz, Hagar (2009) (47) LRT Minneapolis $0.10
Cervero and Duncan (2002) (55) LRT San Diego $0.27
Benjamin and Sirmans (1996) (59) MRT Washington,D.C. $0.40
Cervero and Duncan (2002) (55) CRT San Diego ($0.11)
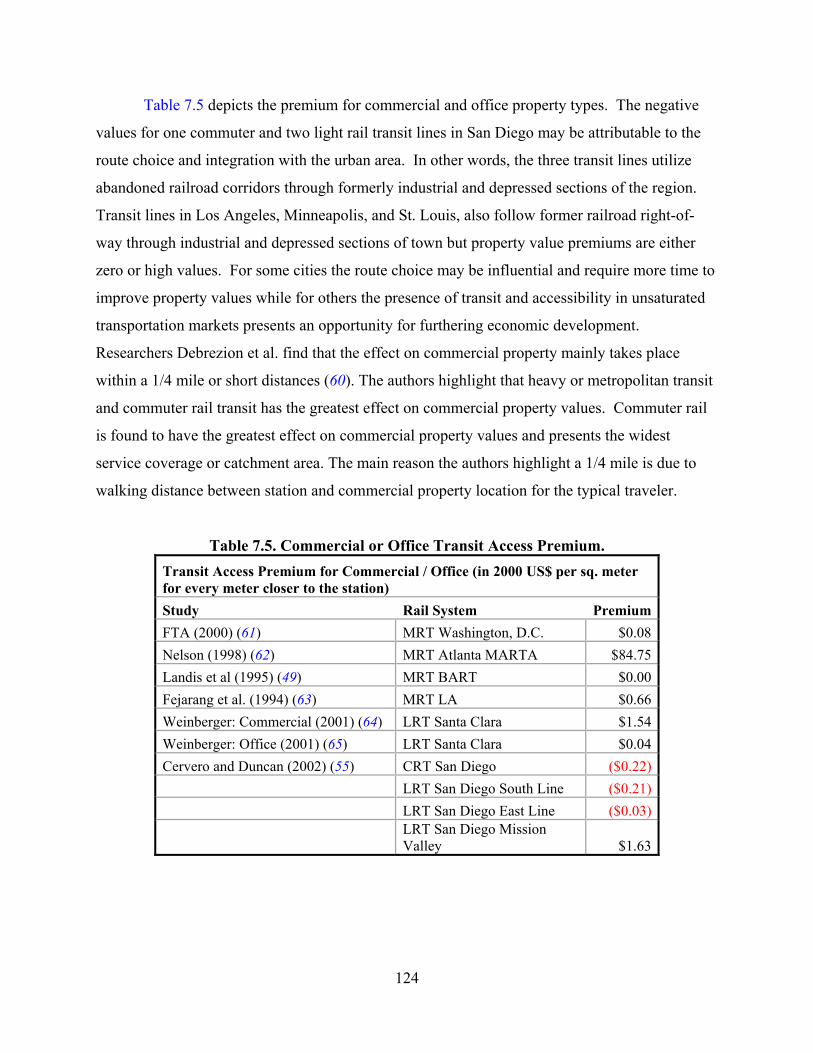
124
Table 7.5 depicts the premium for commercial and office property types. The negative
values for one commuter and two light rail transit lines in San Diego may be attributable to the
route choice and integration with the urban area. In other words, the three transit lines utilize
abandoned railroad corridors through formerly industrial and depressed sections of the region.
Transit lines in Los Angeles, Minneapolis, and St. Louis, also follow former railroad right-of-
way through industrial and depressed sections of town but property value premiums are either
zero or high values. For some cities the route choice may be influential and require more time to
improve property values while for others the presence of transit and accessibility in unsaturated
transportation markets presents an opportunity for furthering economic development.
Researchers Debrezion et al. find that the effect on commercial property mainly takes place
within a 1/4 mile or short distances (60). The authors highlight that heavy or metropolitan transit
and commuter rail transit has the greatest effect on commercial property values. Commuter rail
is found to have the greatest effect on commercial property values and presents the widest
service coverage or catchment area. The main reason the authors highlight a 1/4 mile is due to
walking distance between station and commercial property location for the typical traveler.
Table 7.5. Commercial or Office Transit Access Premium. Transit Access Premium for Commercial / Office (in 2000 US$ per sq. meter for every meter closer to the station) Study Rail System Premium FTA (2000) (61) MRT Washington, D.C. $0.08 Nelson (1998) (62) MRT Atlanta MARTA $84.75 Landis et al (1995) (49) MRT BART $0.00 Fejarang et al. (1994) (63) MRT LA $0.66 Weinberger: Commercial (2001) (64) LRT Santa Clara $1.54 Weinberger: Office (2001) (65) LRT Santa Clara $0.04 Cervero and Duncan (2002) (55) CRT San Diego ($0.22) LRT San Diego South Line ($0.21) LRT San Diego East Line ($0.03)
LRT San Diego Mission Valley $1.63
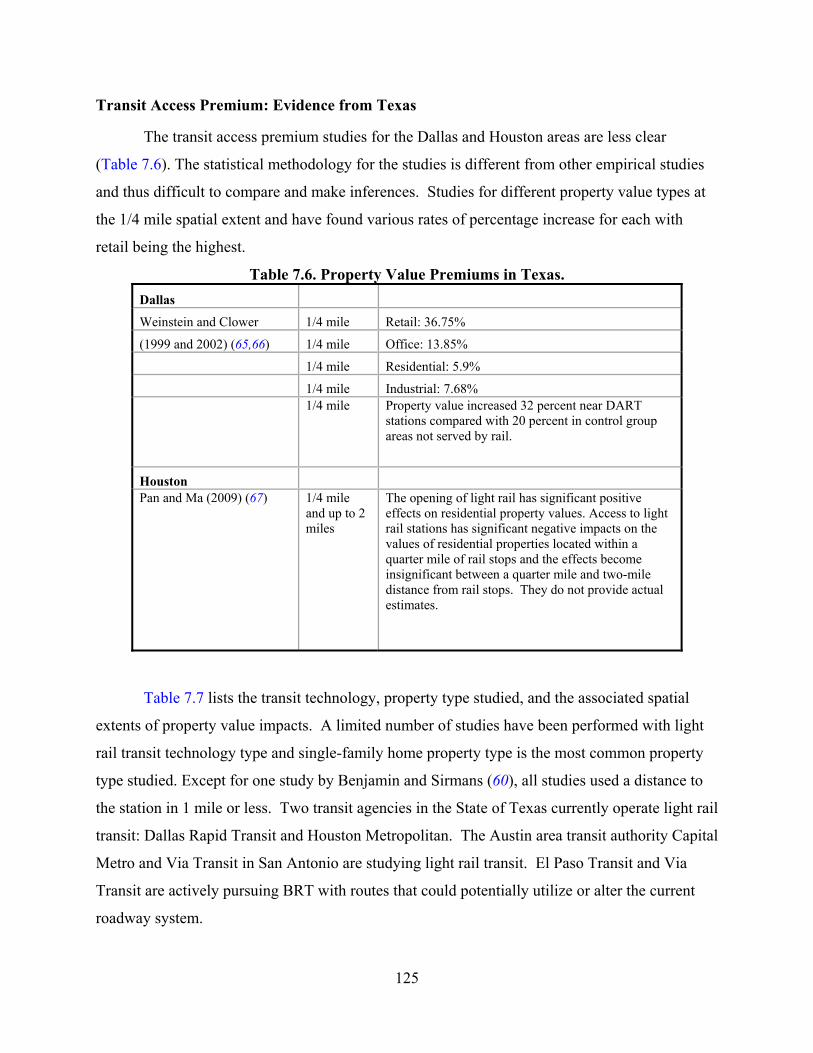
125
Transit Access Premium: Evidence from Texas
The transit access premium studies for the Dallas and Houston areas are less clear
(Table 7.6). The statistical methodology for the studies is different from other empirical studies
and thus difficult to compare and make inferences. Studies for different property value types at
the 1/4 mile spatial extent and have found various rates of percentage increase for each with
retail being the highest.
Table 7.6. Property Value Premiums in Texas. Dallas
Weinstein and Clower 1/4 mile Retail: 36.75%
(1999 and 2002) (65,66) 1/4 mile Office: 13.85%
1/4 mile Residential: 5.9%
1/4 mile Industrial: 7.68%
1/4 mile Property value increased 32 percent near DART stations compared with 20 percent in control group areas not served by rail.
Houston Pan and Ma (2009) (67) 1/4 mile
and up to 2 miles
The opening of light rail has significant positive effects on residential property values. Access to light rail stations has significant negative impacts on the values of residential properties located within a quarter mile of rail stops and the effects become insignificant between a quarter mile and two-mile distance from rail stops. They do not provide actual estimates.
Table 7.7 lists the transit technology, property type studied, and the associated spatial
extents of property value impacts. A limited number of studies have been performed with light
rail transit technology type and single-family home property type is the most common property
type studied. Except for one study by Benjamin and Sirmans (60), all studies used a distance to
the station in 1 mile or less. Two transit agencies in the State of Texas currently operate light rail
transit: Dallas Rapid Transit and Houston Metropolitan. The Austin area transit authority Capital
Metro and Via Transit in San Antonio are studying light rail transit. El Paso Transit and Via
Transit are actively pursuing BRT with routes that could potentially utilize or alter the current
roadway system.
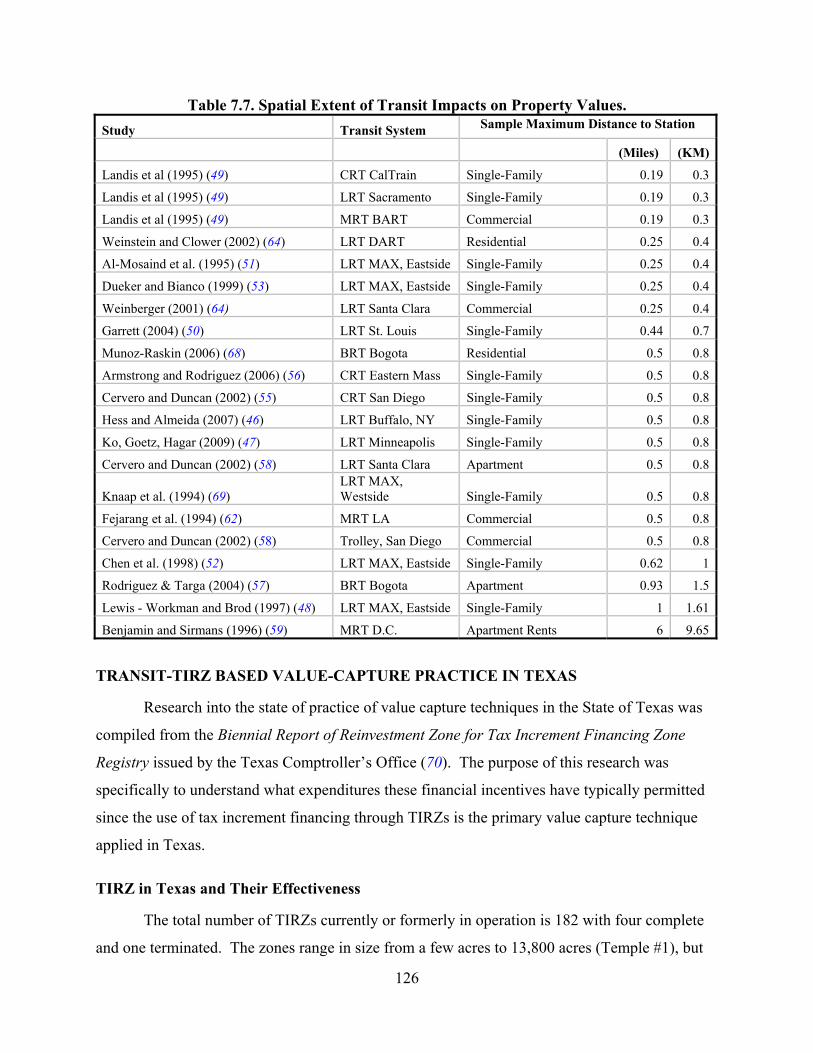
126
Table 7.7. Spatial Extent of Transit Impacts on Property Values. Study Transit System Sample Maximum Distance to Station
(Miles) (KM)
Landis et al (1995) (49) CRT CalTrain Single-Family 0.19 0.3
Landis et al (1995) (49) LRT Sacramento Single-Family 0.19 0.3
Landis et al (1995) (49) MRT BART Commercial 0.19 0.3
Weinstein and Clower (2002) (64) LRT DART Residential 0.25 0.4
Al-Mosaind et al. (1995) (51) LRT MAX, Eastside Single-Family 0.25 0.4
Dueker and Bianco (1999) (53) LRT MAX, Eastside Single-Family 0.25 0.4
Weinberger (2001) (64) LRT Santa Clara Commercial 0.25 0.4
Garrett (2004) (50) LRT St. Louis Single-Family 0.44 0.7
Munoz-Raskin (2006) (68) BRT Bogota Residential 0.5 0.8
Armstrong and Rodriguez (2006) (56) CRT Eastern Mass Single-Family 0.5 0.8
Cervero and Duncan (2002) (55) CRT San Diego Single-Family 0.5 0.8
Hess and Almeida (2007) (46) LRT Buffalo, NY Single-Family 0.5 0.8
Ko, Goetz, Hagar (2009) (47) LRT Minneapolis Single-Family 0.5 0.8
Cervero and Duncan (2002) (58) LRT Santa Clara Apartment 0.5 0.8
Knaap et al. (1994) (69) LRT MAX, Westside Single-Family 0.5 0.8
Fejarang et al. (1994) (62) MRT LA Commercial 0.5 0.8
Cervero and Duncan (2002) (58) Trolley, San Diego Commercial 0.5 0.8
Chen et al. (1998) (52) LRT MAX, Eastside Single-Family 0.62 1
Rodriguez & Targa (2004) (57) BRT Bogota Apartment 0.93 1.5
Lewis - Workman and Brod (1997) (48) LRT MAX, Eastside Single-Family 1 1.61
Benjamin and Sirmans (1996) (59) MRT D.C. Apartment Rents 6 9.65
TRANSIT-TIRZ BASED VALUE-CAPTURE PRACTICE IN TEXAS
Research into the state of practice of value capture techniques in the State of Texas was
compiled from the Biennial Report of Reinvestment Zone for Tax Increment Financing Zone
Registry issued by the Texas Comptroller’s Office (70). The purpose of this research was
specifically to understand what expenditures these financial incentives have typically permitted
since the use of tax increment financing through TIRZs is the primary value capture technique
applied in Texas.
TIRZ in Texas and Their Effectiveness
The total number of TIRZs currently or formerly in operation is 182 with four complete
and one terminated. The zones range in size from a few acres to 13,800 acres (Temple #1), but
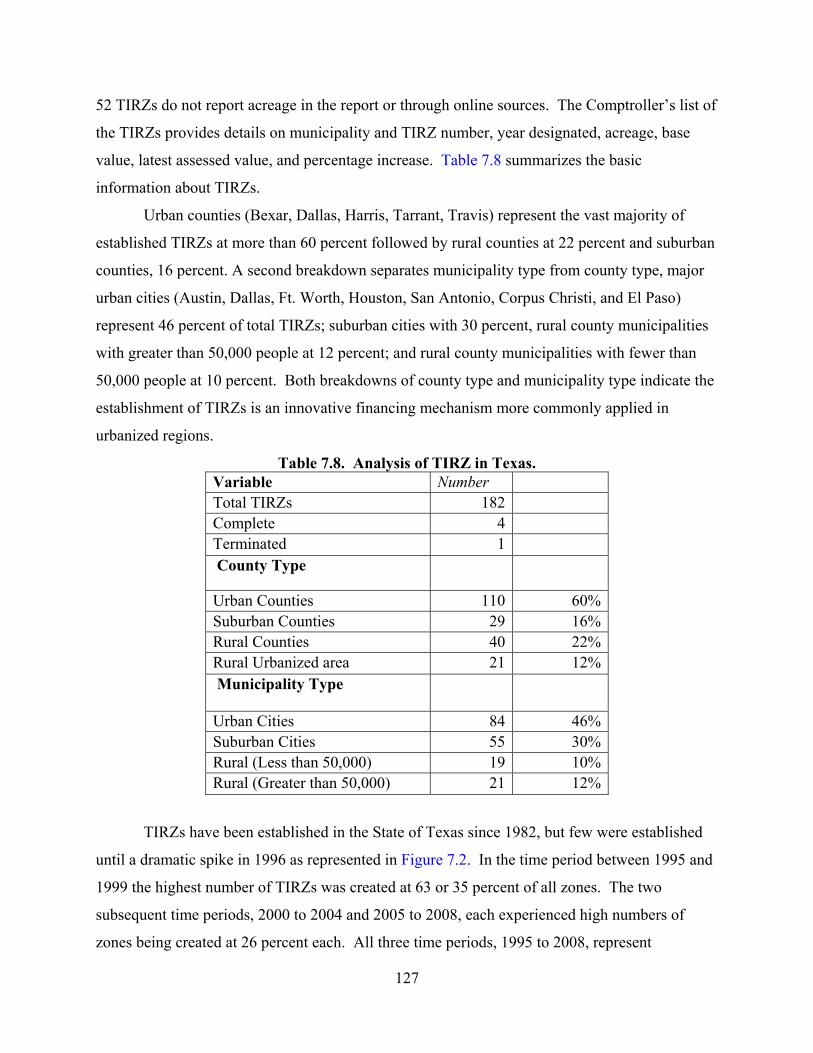
127
52 TIRZs do not report acreage in the report or through online sources. The Comptroller’s list of
the TIRZs provides details on municipality and TIRZ number, year designated, acreage, base
value, latest assessed value, and percentage increase. Table 7.8 summarizes the basic
information about TIRZs.
Urban counties (Bexar, Dallas, Harris, Tarrant, Travis) represent the vast majority of
established TIRZs at more than 60 percent followed by rural counties at 22 percent and suburban
counties, 16 percent. A second breakdown separates municipality type from county type, major
urban cities (Austin, Dallas, Ft. Worth, Houston, San Antonio, Corpus Christi, and El Paso)
represent 46 percent of total TIRZs; suburban cities with 30 percent, rural county municipalities
with greater than 50,000 people at 12 percent; and rural county municipalities with fewer than
50,000 people at 10 percent. Both breakdowns of county type and municipality type indicate the
establishment of TIRZs is an innovative financing mechanism more commonly applied in
urbanized regions.
Table 7.8. Analysis of TIRZ in Texas. Variable Number Total TIRZs 182 Complete 4 Terminated 1 County Type
Urban Counties 110 60% Suburban Counties 29 16% Rural Counties 40 22% Rural Urbanized area 21 12% Municipality Type
Urban Cities 84 46% Suburban Cities 55 30% Rural (Less than 50,000) 19 10% Rural (Greater than 50,000) 21 12%
TIRZs have been established in the State of Texas since 1982, but few were established
until a dramatic spike in 1996 as represented in Figure 7.2. In the time period between 1995 and
1999 the highest number of TIRZs was created at 63 or 35 percent of all zones. The two
subsequent time periods, 2000 to 2004 and 2005 to 2008, each experienced high numbers of
zones being created at 26 percent each. All three time periods, 1995 to 2008, represent
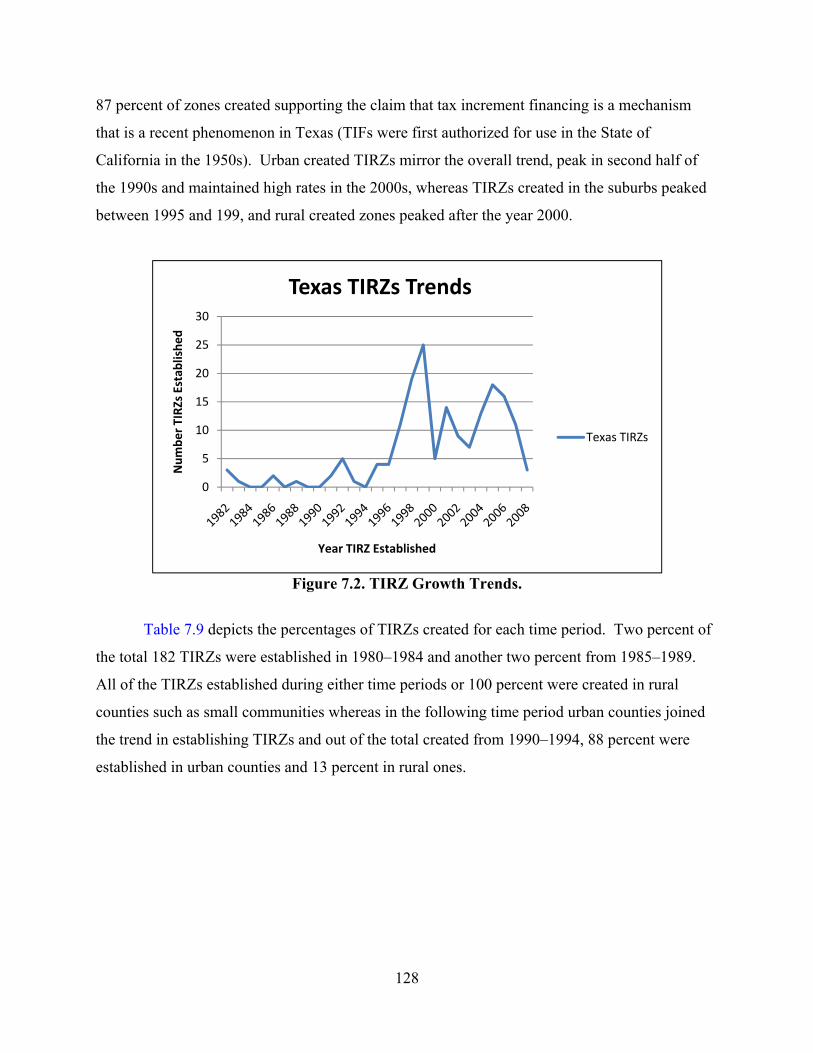
128
87 percent of zones created supporting the claim that tax increment financing is a mechanism
that is a recent phenomenon in Texas (TIFs were first authorized for use in the State of
California in the 1950s). Urban created TIRZs mirror the overall trend, peak in second half of
the 1990s and maintained high rates in the 2000s, whereas TIRZs created in the suburbs peaked
between 1995 and 199, and rural created zones peaked after the year 2000.
Figure 7.2. TIRZ Growth Trends.
Table 7.9 depicts the percentages of TIRZs created for each time period. Two percent of
the total 182 TIRZs were established in 1980–1984 and another two percent from 1985–1989.
All of the TIRZs established during either time periods or 100 percent were created in rural
counties such as small communities whereas in the following time period urban counties joined
the trend in establishing TIRZs and out of the total created from 1990–1994, 88 percent were
established in urban counties and 13 percent in rural ones.
0
5
10
15
20
25
30
Num
ber T
IRZs Estab
lishe
d
Year TIRZ Established
Texas TIRZs Trends
Texas TIRZs
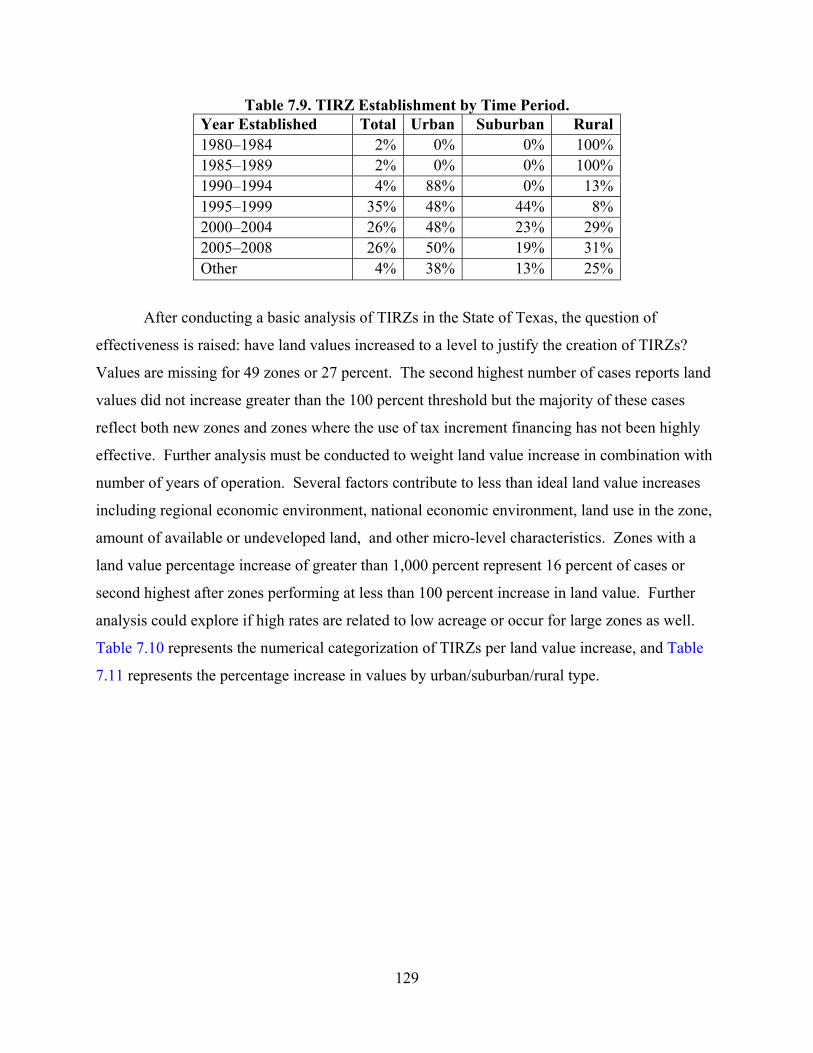
129
Table 7.9. TIRZ Establishment by Time Period. Year Established Total Urban Suburban Rural 1980–1984 2% 0% 0% 100% 1985–1989 2% 0% 0% 100% 1990–1994 4% 88% 0% 13% 1995–1999 35% 48% 44% 8% 2000–2004 26% 48% 23% 29% 2005–2008 26% 50% 19% 31% Other 4% 38% 13% 25%
After conducting a basic analysis of TIRZs in the State of Texas, the question of
effectiveness is raised: have land values increased to a level to justify the creation of TIRZs?
Values are missing for 49 zones or 27 percent. The second highest number of cases reports land
values did not increase greater than the 100 percent threshold but the majority of these cases
reflect both new zones and zones where the use of tax increment financing has not been highly
effective. Further analysis must be conducted to weight land value increase in combination with
number of years of operation. Several factors contribute to less than ideal land value increases
including regional economic environment, national economic environment, land use in the zone,
amount of available or undeveloped land, and other micro-level characteristics. Zones with a
land value percentage increase of greater than 1,000 percent represent 16 percent of cases or
second highest after zones performing at less than 100 percent increase in land value. Further
analysis could explore if high rates are related to low acreage or occur for large zones as well.
Table 7.10 represents the numerical categorization of TIRZs per land value increase, and Table
7.11 represents the percentage increase in values by urban/suburban/rural type.
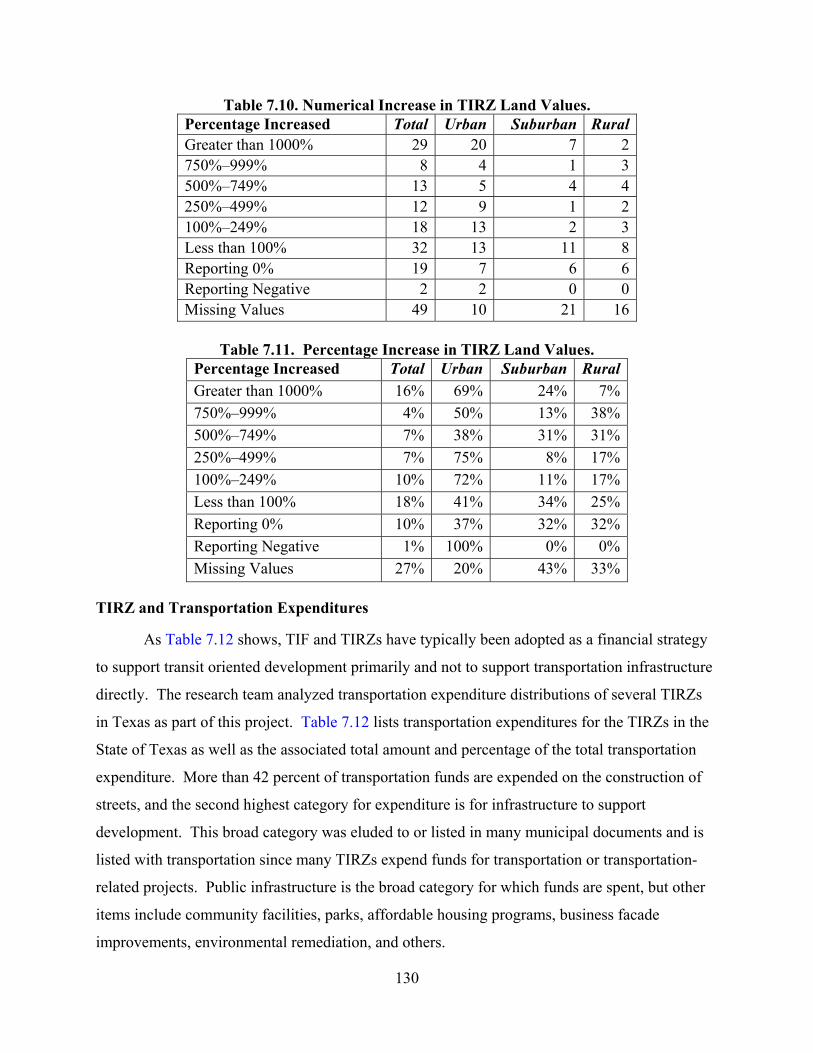
130
Table 7.10. Numerical Increase in TIRZ Land Values. Percentage Increased Total Urban Suburban Rural Greater than 1000% 29 20 7 2 750%–999% 8 4 1 3 500%–749% 13 5 4 4 250%–499% 12 9 1 2 100%–249% 18 13 2 3 Less than 100% 32 13 11 8 Reporting 0% 19 7 6 6 Reporting Negative 2 2 0 0 Missing Values 49 10 21 16
Table 7.11. Percentage Increase in TIRZ Land Values.
Percentage Increased Total Urban Suburban Rural Greater than 1000% 16% 69% 24% 7% 750%–999% 4% 50% 13% 38% 500%–749% 7% 38% 31% 31% 250%–499% 7% 75% 8% 17% 100%–249% 10% 72% 11% 17% Less than 100% 18% 41% 34% 25% Reporting 0% 10% 37% 32% 32% Reporting Negative 1% 100% 0% 0% Missing Values 27% 20% 43% 33%
TIRZ and Transportation Expenditures
As Table 7.12 shows, TIF and TIRZs have typically been adopted as a financial strategy
to support transit oriented development primarily and not to support transportation infrastructure
directly. The research team analyzed transportation expenditure distributions of several TIRZs
in Texas as part of this project. Table 7.12 lists transportation expenditures for the TIRZs in the
State of Texas as well as the associated total amount and percentage of the total transportation
expenditure. More than 42 percent of transportation funds are expended on the construction of
streets, and the second highest category for expenditure is for infrastructure to support
development. This broad category was eluded to or listed in many municipal documents and is
listed with transportation since many TIRZs expend funds for transportation or transportation-
related projects. Public infrastructure is the broad category for which funds are spent, but other
items include community facilities, parks, affordable housing programs, business facade
improvements, environmental remediation, and others.
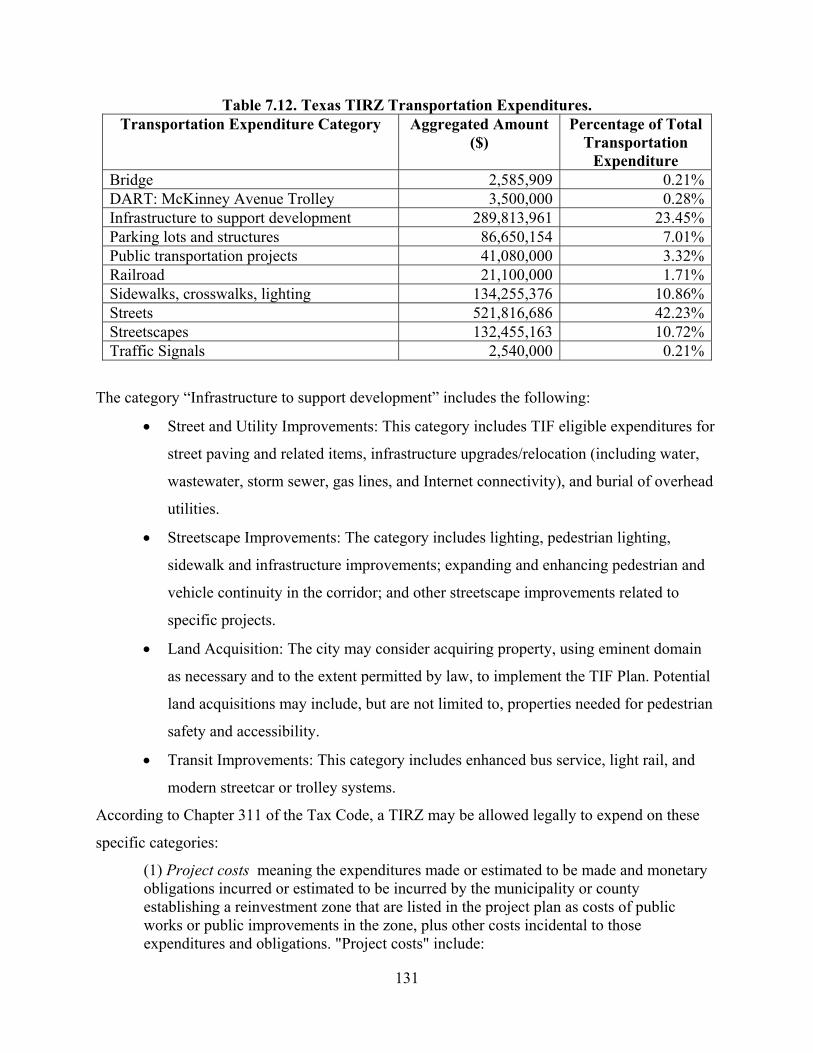
131
Table 7.12. Texas TIRZ Transportation Expenditures. Transportation Expenditure Category Aggregated Amount
($) Percentage of Total
Transportation Expenditure
Bridge 2,585,909 0.21%DART: McKinney Avenue Trolley 3,500,000 0.28%Infrastructure to support development 289,813,961 23.45%Parking lots and structures 86,650,154 7.01%Public transportation projects 41,080,000 3.32%Railroad 21,100,000 1.71%Sidewalks, crosswalks, lighting 134,255,376 10.86%Streets 521,816,686 42.23%Streetscapes 132,455,163 10.72%Traffic Signals 2,540,000 0.21%
The category “Infrastructure to support development” includes the following:
• Street and Utility Improvements: This category includes TIF eligible expenditures for
street paving and related items, infrastructure upgrades/relocation (including water,
wastewater, storm sewer, gas lines, and Internet connectivity), and burial of overhead
utilities.
• Streetscape Improvements: The category includes lighting, pedestrian lighting,
sidewalk and infrastructure improvements; expanding and enhancing pedestrian and
vehicle continuity in the corridor; and other streetscape improvements related to
specific projects.
• Land Acquisition: The city may consider acquiring property, using eminent domain
as necessary and to the extent permitted by law, to implement the TIF Plan. Potential
land acquisitions may include, but are not limited to, properties needed for pedestrian
safety and accessibility.
• Transit Improvements: This category includes enhanced bus service, light rail, and
modern streetcar or trolley systems.
According to Chapter 311 of the Tax Code, a TIRZ may be allowed legally to expend on these
specific categories:
(1) Project costs meaning the expenditures made or estimated to be made and monetary obligations incurred or estimated to be incurred by the municipality or county establishing a reinvestment zone that are listed in the project plan as costs of public works or public improvements in the zone, plus other costs incidental to those expenditures and obligations. "Project costs" include:
132
(A) capital costs, including the actual costs of the acquisition and construction of public works, public improvements, new buildings, structures, and fixtures; the actual costs of the acquisition, demolition, alteration, remodeling, repair, or reconstruction of existing buildings, structures, and fixtures; and the actual costs of the acquisition of land and equipment and the clearing and grading of land;
(B) financing costs, including all interest paid to holders of evidences of indebtedness or other obligations issued to pay for project costs and any premium paid over the principal amount of the obligations because of the redemption of the obligations before maturity;
(C) real property assembly costs;
(D) professional service costs, including those incurred for architectural, planning, engineering, and legal advice and services;
(E) imputed administrative costs, including reasonable charges for the time spent by employees of the municipality or county in connection with the implementation of a project plan;
(F) relocation costs;
(G) organizational costs, including the costs of conducting environmental impact studies or other studies, the cost of publicizing the creation of the zone, and the cost of implementing the project plan for the zone;
(H) interest before and during construction and for one year after completion of construction, whether or not capitalized;
(I) the cost of operating the reinvestment zone and project facilities;
(J) the amount of any contributions made by the municipality or county from general revenue for the implementation of the project plan; and
(K) payments made at the discretion of the governing body of the municipality or county that the governing body finds necessary or convenient to the creation of the zone or to the implementation of the project plans for the zone.
Clearly, capital costs for transit infrastructure are not specific line items in TIRZ or TIF
finance for transit as seen from past expenditures. This suggests that value capture legislations
for transit must specifically aim to address both development around stations and to support
133
infrastructure costs of all types of transit investments both for those that are on-system and off-
system.
Increment Finance outside Texas
Tax increment financing has been widely applied in other states to support transit or
infrastructure in transit-service areas:
• California – TIF for housing in transit station areas.
• Georgia – TIF used for transit infrastructure (stations) and TOD infrastructure.
• Illinois – TIF used for transit infrastructure (stations).
• Maryland – TIF used for TOD infrastructure supporting transit (stations, parking
garages, streets, sidewalks).
• Massachusetts – TIF used for housing and TOD infra in transit station areas.
• Minnesota – TIF under development for transit.
• Oregon – TIF for rail infrastructure (streetcar).
• Pennsylvania – Transit Revitalization Investment District (TRID) (TIF mechanism)
for TOD and transit infrastructure (TRID is new and currently been used for
conducting studies but presents the best legislation to replicate).
The state legislation best suited for replication in Texas is the Transit Revitalization
Investment District Act 238 of 2004. The Pennsylvania General Assembly authorized the
creation of TRIDs for the purpose of spurring transit-oriented development, community
revitalization, and enhanced community character around public transit facilities. Additionally,
the law also allows for the establishment of value capture areas as a means to reserve and use
future, designated incremental tax revenues for:
• Public transportation capital improvements.
• Related site development improvements and maintenance.
• Promoting the involvement of and partnerships with the private sector in TRID
development and implementation.
• Encouraging public involvement during TRID planning and implementation.
• Providing for duties of the Department of Community and Economic Development.
The Pennsylvania law allows municipalities or counties to partner with public
transportation agencies including the National Railroad Passenger Corporation whereas the TIRZ
134
in Texas does not specifically state public transportation agencies. The TIRZ legislation does
allow the board of directors for a TIRZ to establish partnerships according to their needs that can
include public transit agencies. Thus, the Pennsylvania law is more limiting, but it also sends a
clear signal to transit agencies that their area of active involvement has been increased. Transit
agencies and local governments are allowed to share in the tax revenues (71). Texas TIRZ law
does not specifically state that municipalities must partner with transit agencies but the potential
for partnership is implied, whereas in the Pennsylvania TRID is explicit.
A TRID may be established by a local government for a geographic area or neighborhood
located within 1/8 mile or up to 1/2 mile from a commuter rail, light rail, busway, or similar
transit stop or station, including planned new station or stop. This radius from stations or stops is
very explicit and restricts the extent of the TRID more than the TIRZ in Texas. Exceptions to this
rule in Pennsylvania: an existing neighborhood improvement district, existing tax increment
district, or existing urban renewal district may be used as the alternate basis for the boundaries of
the TRID.
Transit authorities are given land development powers to acquire and improve property.
The State of Pennsylvania like other transit-oriented development states may sell state-owned
property or property purchased by the state with federal or state funds to transit agencies. The
Pennsylvania TRID Act specifically authorizes state public transportation agencies to work
cooperatively with counties, local governments, transportation authorities, the private sector, and
Amtrak to create and designate Transit Revitalization Investment Districts. The partnership
creates a management entity to work with the private sector developer and create development
agreements. The specific planning steps are laid out in Table 7.13.
Pennsylvania also has a separate tax increment financing law for municipalities and
counties. The TRID states in clear language that funds can be spent on capital projects for inter-
city and intra-city public transportation, whereas in Texas the municipality and TIRZ Board of
Directors may or may not spend funds on public transportation, inter-city, or intra-city.
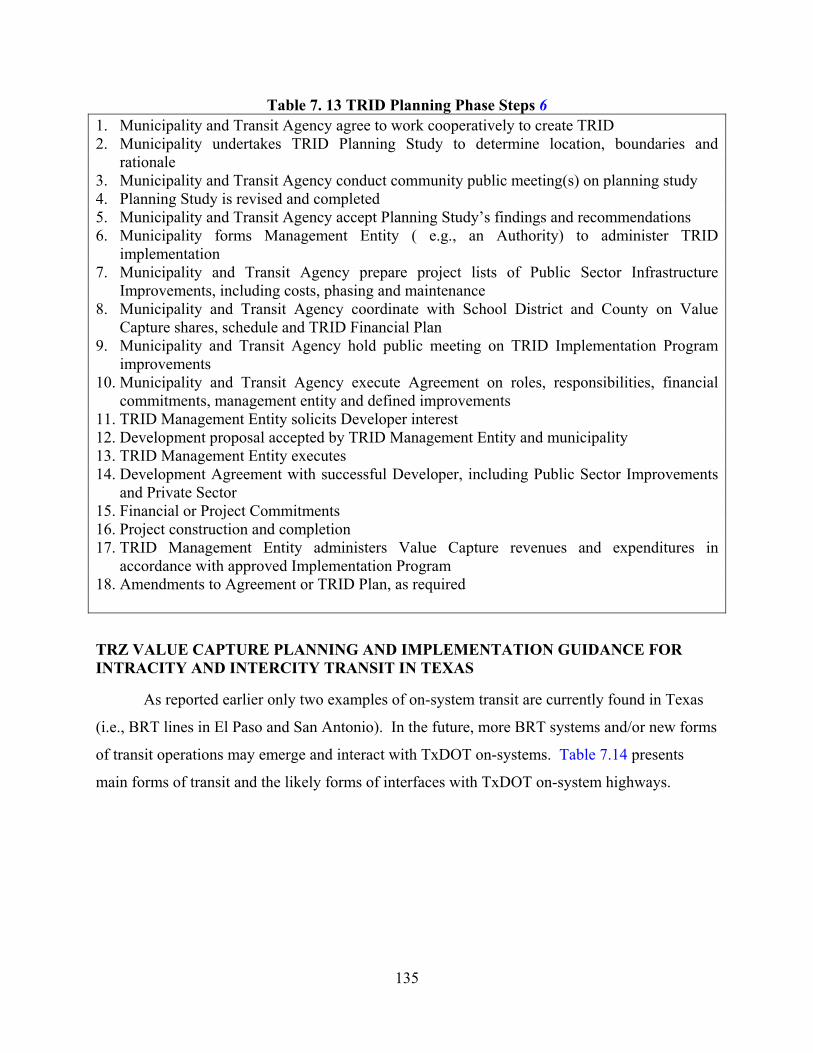
135
Table 7. 13 TRID Planning Phase Steps 6 1. Municipality and Transit Agency agree to work cooperatively to create TRID 2. Municipality undertakes TRID Planning Study to determine location, boundaries and
rationale 3. Municipality and Transit Agency conduct community public meeting(s) on planning study 4. Planning Study is revised and completed 5. Municipality and Transit Agency accept Planning Study’s findings and recommendations 6. Municipality forms Management Entity ( e.g., an Authority) to administer TRID
implementation 7. Municipality and Transit Agency prepare project lists of Public Sector Infrastructure
Improvements, including costs, phasing and maintenance 8. Municipality and Transit Agency coordinate with School District and County on Value
Capture shares, schedule and TRID Financial Plan 9. Municipality and Transit Agency hold public meeting on TRID Implementation Program
improvements 10. Municipality and Transit Agency execute Agreement on roles, responsibilities, financial
commitments, management entity and defined improvements 11. TRID Management Entity solicits Developer interest 12. Development proposal accepted by TRID Management Entity and municipality 13. TRID Management Entity executes 14. Development Agreement with successful Developer, including Public Sector Improvements
and Private Sector 15. Financial or Project Commitments 16. Project construction and completion 17. TRID Management Entity administers Value Capture revenues and expenditures in
accordance with approved Implementation Program 18. Amendments to Agreement or TRID Plan, as required
TRZ VALUE CAPTURE PLANNING AND IMPLEMENTATION GUIDANCE FOR INTRACITY AND INTERCITY TRANSIT IN TEXAS
As reported earlier only two examples of on-system transit are currently found in Texas
(i.e., BRT lines in El Paso and San Antonio). In the future, more BRT systems and/or new forms
of transit operations may emerge and interact with TxDOT on-systems. Table 7.14 presents
main forms of transit and the likely forms of interfaces with TxDOT on-system highways.
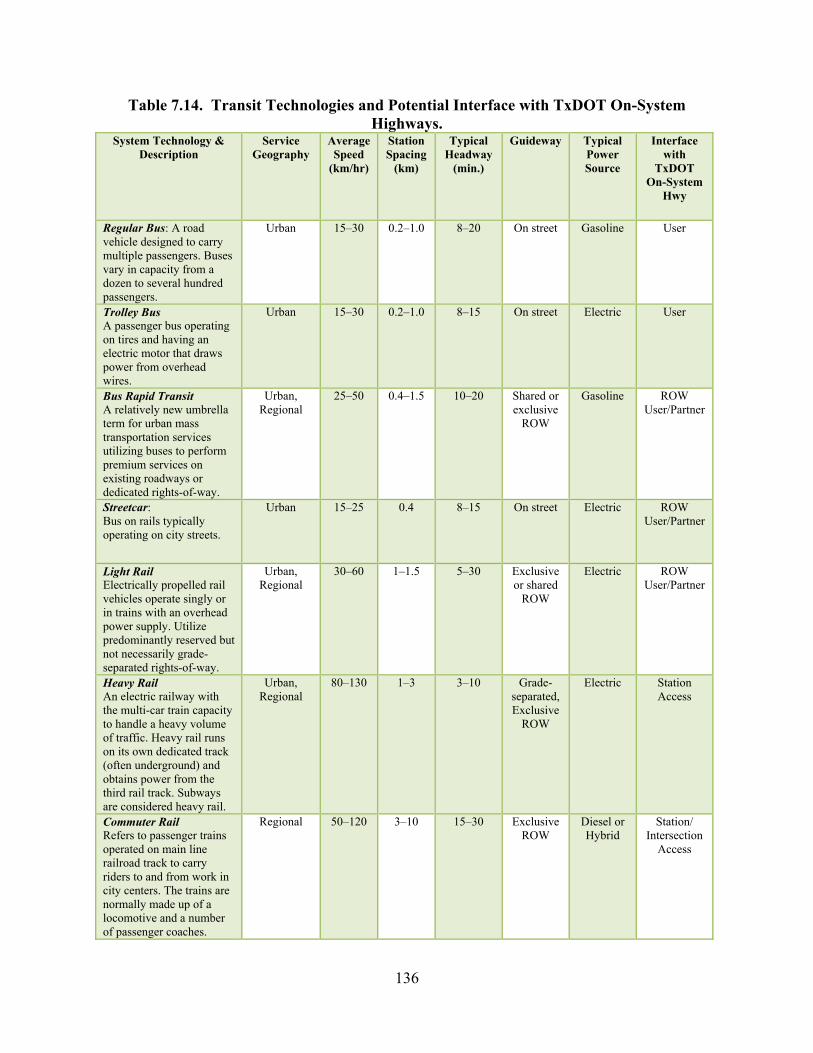
136
Table 7.14. Transit Technologies and Potential Interface with TxDOT On-System Highways.
System Technology & Description
Service Geography
Average Speed
(km/hr)
Station Spacing
(km)
Typical Headway
(min.)
Guideway Typical Power Source
Interface with
TxDOT On-System
Hwy
Regular Bus: A road vehicle designed to carry multiple passengers. Buses vary in capacity from a dozen to several hundred passengers.
Urban 15–30 0.2–1.0 8–20 On street Gasoline User
Trolley Bus A passenger bus operating on tires and having an electric motor that draws power from overhead wires.
Urban 15–30 0.2–1.0 8–15 On street Electric User
Bus Rapid Transit A relatively new umbrella term for urban mass transportation services utilizing buses to perform premium services on existing roadways or dedicated rights-of-way.
Urban, Regional
25–50 0.4–1.5 10–20 Shared or exclusive
ROW
Gasoline ROW User/Partner
Streetcar: Bus on rails typically operating on city streets.
Urban 15–25 0.4 8–15 On street Electric ROW User/Partner
Light Rail Electrically propelled rail vehicles operate singly or in trains with an overhead power supply. Utilize predominantly reserved but not necessarily grade-separated rights-of-way.
Urban, Regional
30–60 1–1.5 5–30 Exclusive or shared
ROW
Electric ROW User/Partner
Heavy Rail An electric railway with the multi-car train capacity to handle a heavy volume of traffic. Heavy rail runs on its own dedicated track (often underground) and obtains power from the third rail track. Subways are considered heavy rail.
Urban, Regional
80–130 1–3 3–10 Grade-separated, Exclusive
ROW
Electric Station Access
Commuter Rail Refers to passenger trains operated on main line railroad track to carry riders to and from work in city centers. The trains are normally made up of a locomotive and a number of passenger coaches.
Regional 50–120 3–10 15–30 Exclusive ROW
Diesel or Hybrid
Station/ Intersection
Access
137
TRZ FOR TRANSIT CAPITAL COSTS
Federal funding has historically financed capital transit projects, and TIRZs provide
limited to no funds for transit system costs beyond supporting transit-oriented development.
Local jurisdictions typically have other goals in mind for TIRZ revenues. Financing transit
improvements in TIRZ competes with other public goals and desired projects such as affordable
housing, environmental remediation, drainage, historic rehabilitation, and more. Current TRZ
statute language does not imply expenditure of funds or revenue for public transportation except
through final surplus provisions for municipal or county TRZs. This suggests that municipalities
and counties may judiciously use their surplus revenues to pursue transit options for their
regions. However, this does not provide an explicit mechanism for financing mass transit
options directly, especially for on- or off-system options for which capital costs may be high
such as light-rail transit (LRT) and commuter rail (inter- and intra-city options) and federal
grants may be inadequate to fully meet capital costs. Proposed legislation SB898 attempted to
tackle this issue by amending TRZs to also be used for the acquisition, construction,
improvement, and operation of a freight rail, passenger rail, commuter rail, intercity rail, or high-
speed rail facilities or systems. Chapter 311 of the Tax code expressly allows funding for transit.
The amended code from SB898 allows municipalities to work with TxDOT but only concerning
rail infrastructure, which does not encompass all available transit modes such as paratransit, bus,
or bus-rapid transit. This bill did not pass in the last legislative session.
SB 898, like the Pennsylvania TRID, should have also made the distinction of fund
expenditure for inter-city and intra-city transit clear and succinct. SB898 could have also
provided clear language to support the interest of transit agencies toward alternative funding
sources. The Federal Transit Administration (FTA) rarely funds projects at the 80 percent level
and sometimes funds transit only at the 60 percent level. FTA expenditures are more likely to
favor transit agencies that can show dedicated local sources of funding such as a TIRZ and/or a
TRID. The future passage of a bill such as SB898 and/or TRID may be viewed by federal
authorities as supportive state policy for transit. Legislation like SB 898 and TRID for Texas
may serve as a clear funding signal and give encouragement to the federal agency to favor Texas
capital transit expansion over other competing states.
The completion is fiercer in the case of recent discretionary grant programs by the United
States Department of Transportation (USDOT). The expenditures due to America Recovery and
138
Reinvestment Act gave FTA flexible funds and the agency did not follow traditional New Starts
or Small Starts funding priorities for every dollar. The result was that streetcar and bus-rapid
transit projects that did not exhibit a high enough rating through traditional means were awarded
grants in the $25 million to $50 million range. The Dallas Streetcar project that won the
discretionary stimulus grant in 2010 from USDOT with a local match is simply a case in the
point (72). Future programs, such as the Livability initiative, which aim to create a coalition
between the USDOT, Environmental Protection Agency, and Department of Housing and Urban
Development, or the climate change bill may also provide discretionary funds for moving capital
transit projects and transit-oriented development in the State of Texas forward.
SUMMARY
In summary, SB1266 makes provisions for on-system transit systems through surplus
provisions only after the original highway project is completely paid off. Hence, the SB 1266
TRZ mechanism for financing transit is applicable only to on-system transit, is indirect and
meaningful only in regions where TRZ’s for highways can be set up and finally, even the surplus
use is subject to local government approval. Clearly, there is a need to look beyond SB1266 to
legislations that can support similar concepts for transit finance. In that regard, both TIRZ and
TIF have been practiced in Texas for financing transit. However, neither TIRZ nor TIFs in
Texas have allowed capital costs of transit infrastructure as specific line items in the budget,
since they are specifically used for the purpose of supporting development around stations.
TIRZs in Texas also do not explicitly define partnerships with transit agencies. In this
connection, the Pennsylvania TRID Act may serve as effective model for Texas to consider.
SB898 for rail infrastructure was presented in the 81st Legislative Session and attempted
to address capital costs for rail infrastructure (excluding options like Bus Rapid Transit, Bus
Transit). It is suggested that this bill explicitly consider the distinctions between intra-city and
inter-city transit clearly if it has to be presented again with roles for transit agencies clearly
delineated. Reconsidering SB 898 would require reverting to TIRZ mechanisms to spur
development in the region. A possibly better and more useful alternative would be to consider a
Texas version of the TRID model in Pennsylvania, which allows funding for both development
and capital costs and explicit partnerships and may be applicable to all forms of transit. Regions
in areas where TRZ will be developed in future may continue to benefit indirectly.
139
These legislation changes, aimed at direct application of financial resources for transit are
needed to address limitations in the current transit value-capture legislation in Texas and to
stimulate transit investments (both on-system and off-system). This step is of importance in this
current climate characterized by declining federal funds, new national initiatives, stiff
competition for federal dollars, and enhanced need to demonstrate local matching funds. In
addition, such legislation might provide the clear economic signal needed to make Texas transit
investments more attractive in federal reviews under the assumption of a core latent demand.
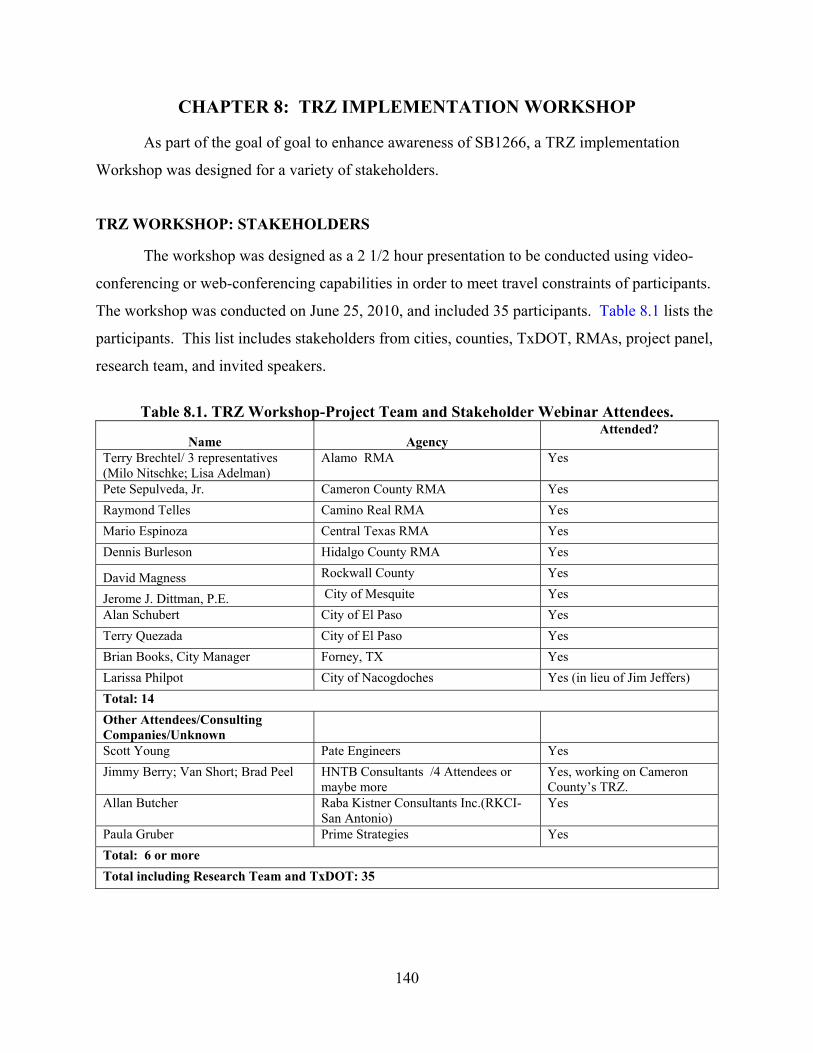
140
CHAPTER 8: TRZ IMPLEMENTATION WORKSHOP
As part of the goal of goal to enhance awareness of SB1266, a TRZ implementation
Workshop was designed for a variety of stakeholders.
TRZ WORKSHOP: STAKEHOLDERS
The workshop was designed as a 2 1/2 hour presentation to be conducted using video-
conferencing or web-conferencing capabilities in order to meet travel constraints of participants.
The workshop was conducted on June 25, 2010, and included 35 participants. Table 8.1 lists the
participants. This list includes stakeholders from cities, counties, TxDOT, RMAs, project panel,
research team, and invited speakers.
Table 8.1. TRZ Workshop-Project Team and Stakeholder Webinar Attendees.
Name AgencyAttended?
Terry Brechtel/ 3 representatives (Milo Nitschke; Lisa Adelman)
Alamo RMA Yes
Pete Sepulveda, Jr. Cameron County RMA Yes Raymond Telles Camino Real RMA Yes Mario Espinoza Central Texas RMA Yes Dennis Burleson Hidalgo County RMA Yes
David Magness Rockwall County Yes
Jerome J. Dittman, P.E. City of Mesquite Yes Alan Schubert City of El Paso Yes Terry Quezada City of El Paso Yes Brian Books, City Manager Forney, TX Yes Larissa Philpot City of Nacogdoches Yes (in lieu of Jim Jeffers) Total: 14 Other Attendees/Consulting Companies/Unknown
Scott Young Pate Engineers Yes Jimmy Berry; Van Short; Brad Peel HNTB Consultants /4 Attendees or
maybe more Yes, working on Cameron County’s TRZ.
Allan Butcher Raba Kistner Consultants Inc.(RKCI- San Antonio)
Yes
Paula Gruber Prime Strategies Yes Total: 6 or more Total including Research Team and TxDOT: 35
141
WORKSHOP CONTENT
The workshop included a detailed discussion of the following aspects:
• Introduction to SB1266 and Pass-Through provisions.
• Types of TRZs (municipal and county).
• Understanding of TRZs and comparison with TIF and TIRZ.
• Case examples of implementation in regions with and without an RMA.
• TRZ implementation lessons (partnership models, TRZ project finance, and TRZ
economic viability).
• Demonstration of tools and how they can be used in various stages of the TRZ
implementation process.
WORKSHOP EVALUATION
After the workshop all the non-TxDOT and research team attendees were requested to
submit their views on the workshop using a web-survey instrument and to indicate whether the
workshop met their objectives. Only four returned responses and indicated that the workshop
met their expectations.

143
CHAPTER 9: CONCLUSIONS
This research examines the SB1266 Act and presents extensive data from three
implementation examples in the State of Texas. One of the key finding from the implementation
examples was a lack of standardized procedures and/or guidance for TRZ development. In order
to address these limitations, the research team explored data quality and standards across the
state, and developed procedures and tools for TRZ stakeholder who might be interested in TRZ
development. Three cost effective tools were developed to assist in various stages of TRZ
development and to provide guidance on pursuing a TRZ—an initial simple screening tool for
determining TRZ worthiness, a preliminary revenue assessment tool, and a GIS Toolkit to aid in
TRZ zone development by either the CAD or other stakeholders in the process. These tools are
compliant with TxDOT standards. The revenue toolkit as currently developed allows only for
preliminary revenue assessments, but is also suitable for more advanced studies only when
combined with additional local inputs and regional study. One important finding from data
gathering efforts was that approximately 46% of regions in Texas may be data ready for TRZ
development. Various other support factors in the region and general regional visions are more
important in getting planning tools like TRZ’s underway since they do require a significant
amount of interagency coordination, political will and support for facilitating various aspects of
TRZ planning.
A second critical finding of this research was a general lack of awareness of TRZ and
provisions of SB1266. In order to meet these objectives, the research team undertook an
extensive outreach effort across various organizations in Texas though web-based surveys
followed by actual telephone calls. The interested individuals were invited to attend a TRZ
Implementation Workshop, which included a variety of stakeholders ranging from city officials,
to county stakeholders, TXDOT, RMAs, and consultants who had had TRZ implementation
projects underway. A total of 35 participants partook in the workshop held in June 2010.
A third finding of this research includes an identification of various areas where existing
legislation may be modified. Several recommendations are suggested to amend SB1266 so as to
make it less onerous and confusing for implementing agencies. These specific recommendations
were driven by implementer experiences and driven from discussions presented in Chapter 2 and
include specific topics that need to be addressed in SB1266 including but not limited to:
• TRZ boundary changes and contiguity requirements.
144
• 100 percent set aside in increment accounts.
• Need to consider other prior increment agreements and other incentive agreements.
• Specific role for TxDOT.
• Amending the RUD provision for county TRZs.
One provision that must be investigated more thoroughly is the decoupling with pass-
through. This provision generated a lot of discussion among respondents. While it may seem
onerous, as long as TxDOT does not change requirements frequently causing confusion,
dropping the PT requirement may have additional cost consequences for TxDOT.
In regard to transit projects, SB1266 is noted to have very limited indirect application to
transit since it is primarily intended to benefit transit (but not explicitly) only through surplus
provisions once the primary highway project is paid off. It is only of value to regions that
already have a TRZ in place or propose to have a TRZ. It is also only applicable to on-system
transit like the BRT systems in San Antonio and El Paso. SB 1266 leaves out a large category
of transit systems and regions that cannot benefit. These include several off-system transit
systems and new types of transit technologies that could be applicable in future.
On the other hand, Texas and other states have employed value capture finance in the
past and even currently through TIRZ and TIF. The vast majority of TIRZ operators use the
increment revenue sources for local capital improvements, not transit system development.
Successful stories from other states, documented positive evidence of transit impacts on property
values, and growing interest in transit in Texas call for further innovative legislation for transit
and highway financing, include TRZ for transit either on- or off-TxDOT systems as well as
perhaps TRID for transit, which allows both development and capital costs to be financed from
increments.
The current environment is one fraught with fiscal uncertainty and proactive legislation to
provide for local matching funds may serve to provide positive signals for enhancing transit
investments and in federal screening and reviews such as those conducted for discretionary
grants. In this connection, the SB898 with appropriate modifications or better still, the
Pennsylvania (TRID Act) may serve as the needed framework for transit finance.
145
REFERENCES
1. Texas Department of Transportation. “TxDOT: Open for Business.” Pass-Through Financing, 2007.
2. U.S. Department of Transportation Federal Highway Administration. Status of the Highway Trust Fund. October 2009. http://www.fhwa.dot.gov/highwaytrustfund/index.htm. Accessed October 29, 2009.
3. Texas Department of Transportation. TxDOT News. October 1, 2009.
4. Act for Senate Bill 1266. Texas State 80th Legislature. May 27th, 2007.
5. M. Iacono, D. Levinson, Z. Zha, and A. Lari, Value Capture for Transportation Finance. Report to the Minnesota Legislature. Center for Transportation Studies Report No. CTS09-18S, June 2009.
6. Tax Code, Chapter 311. http://www.statutes.legis.state.tx.us/Docs/TX/htm/TX.311.htm. Accessed on August 26, 2010.
7. Texas Transportation Code. http://speedtrapahead.org/wordpress/wp-content/STA/Texas_Transportation_Code.html. Accessed on August 26, 2010.
8. Testimony to Transportation Reinvestment Zones by Brian Cassidy. Senate Committee on Transportation and Homeland Security. House Committee on Transportation. Joint Public Hearing. Austin Texas, February 1, 2010.
9. Senate Bill 1266. Bill Analysis. Senate Research Center. August 2nd, 2007.
10. Senate Bill 2096. Texas State Senate, 81st Legislature. Senator Wentworth.
11. House Bill 4335. Texas State House of Representatives, 81st Legislature.
12. Senate Bill 2378. Texas State Senate, 81st Legislature. Senator Nichols.
13. House Bill 1810. Texas State House of Representatives, 81st Legislature. Rep. Pickett.
14. Senate Bill 898. Texas State Senate, 81st Legislature. Senator Shapleigh.
15. Senate Bill 898. House Bill Analysis. August 2nd, 2007.
16. Senate Bill 1671. Texas State Senate, 81st Legislature. Senator Nichols.
17. House Bill 300. Texas State House of Representatives Version, 81st Legislature.
18. House Bill 300. Texas State Senate Version, 81st Legislature.
146
19. National Association of Realtors, TIF Report. http://www.realtor.org/smart_growth.nsf/docfiles/TIFreport.pdf/$FILE/TIFreport.pdf> Accessed in September 2009.
20. Council of Development Finance Agencies. Tax increment finance: Best practices reference guide. Technical report, Council of Development Finance Agencies, 2007. URL http://www.icsc.org/government/CDFA.pdf. Accessed in June 2008.
21. Boarnet, M., and A. Haughwout. Do Highways Matter: Evidence and Policy Implications of the Influence of Highways on Metropolitan Development. Brookings Institution Center on Urban and Metropolitan Policy Discussion Paper, 2000.
22. Batt, W. H., Value Capture as a Policy Tool in Transportation Economics: An Exploration in Public Finance in the Tradition of Henry George. American Journal of Economics and Sociology, Vol. 60, No.1. pp: 195–228. 2001.
23. Huang, W. The Effects of Transportation Infrastructure on Nearby Property Values: A Review of Literature. Institute for Urban and Regional Development, WP-60. 1994.
24. Smith, J.J., and T. Gihring. Financing Transit Systems through Value Capture: an Annotated Bibliography. American Journal of Economics and Sociology, Vol. 60, No.1, pp: 1751–786. 2003.
25. Carey. J. Impacts of Highways on Property Values: Case Study of the Superstition Corridor. Final Report. Arizona Department of Transportation. October 2001.
26. Boarnet, M.G. and S. Chalermpong. New Highways, House Prices and Urban Development: A Case Study of Toll Roads in Orange County, CA. Housing Policy Debate, Volume 12, Issue 3, 2001.
27. Vadali, S. Toll Roads and Economic Development: Exploring Effects on Property Values. Annals of Regional Science. Springer Verlag, 2008.
28. Vadali, S. The North Central Expressway Reconstruction Project: Residential and Commercial Impacts. Report Prepared for TxDOT Dallas District, 2004.
29. Dye Management Group, Inc. Findings and Analysis. Texas Transportation Funding Challenge. Texas Department of Transportation, Original Report 2008, Updated 2009.
30. Texas Transportation Institute. “Financial Evaluation of Transportation Reinvestment Zones in the City of El Paso.” El Paso TX, 2008.
31. Keep Forney Moving. Keep Forney Moving. http://www.keepforneymoving.com/index.php?page=trz. Accessed October 27, 2009.
32. Personal Interview and Communication with Dennis Burleson of Hidalgo County Regional Mobility Authority (www.lrgvdc.org/RMA/ ).
147
33. TxP. Socioeconomics and Real Estate Analysis of the Hidalgo Loop, October 2008. (http://www.hidalgocrb.com/news/txp-report.pdf.) Accessed in November, 2008.
34. Vadali, S.R., R. Aldrete., and A. Bujanda. A Financial Model to Evaluate the Value Capture Potential of a Roadway Project, Journal of the Transportation Research Board, Transportation Research Record, 2115, 2009.
35. Texas Department of Transportation. “Application Guidelines for Pass Through Toll Financing,” http://www.dot.state.tx.us/business/governments/pass_finance.htm. Accessed in April, 2010.
36. Walther, E., L. A. Hoel, and L.J. Pignataro. FHWA Report: Value Capture Techniques in Transportation, Final Report Phase 1, 1990.
37. Financial Evaluation of Transportation Reinvestment Zones in the El Paso District. Draft Technical Memorandum, October 21, 2008.
38. Kone, D. L., Land Development, Eighth edition, National Association of Home Builders, Washington, D.C.: Home Builders Press, 1994.
39. Miles, M. E., G. Berens, and M. A. Weiss, Real Estate Development Principles and Process, Third edition, Urban Land Institute, Washington, D.C., 2000.
40. Knight, L.R. and L.L. Trygg. Evidence of Land Use Impacts of Rapid Transit Systems, Transportation, Vol. 6, pp. 23–247. 1977.
41. Frank, L., M. Andresen, and T. Schmid. Obesity Relationships with Community Design, Physical Activity, and Time Spent in Cars. American Journal of Preventive Medicine, v 27 (2): pp 87–96. 2004.
42. Census 2000: Texas Profile – Population Density by Census Tract. U.S. Census Bureau. http://www2.census.gov/geo/maps/special/profile2k/TX_2K_Profile.pdf. Accessed May 26, 2010.
43. Defusco, R.A., Pinto, J.E;, Runkle, D.E., and D. E. McLeavev. Quantitative Methods for Investment Analysis. s.l. : CFA Institute, 2004.
44. Texas Association of Appraisal Districts. Rules Statues and AG Opinions. Austin TX : s.n., 2010.
45. Texas Transportation Institute. Assessment of recalibration needs for the City of El Paso TRZ Boundaries. El Paso TX: Texas Tranportation Institute. Technical Report for the City of El Paso. 2010.
46. Hess, D. and T. Almeida. “Impact of Proximity to Light Rail Rapid Transit on Station-Area Property Values in Buffalo, New York.” Urban Studies, 44, no. 5/6, pp.1041–1068, 2007.
148
47. Ko, K., E. Goetz, and A. Hagar. “Differential Impacts on the Hiawatha Light Rail Line” 88th Annual Meeting, Transportation Research Board, Washington, D.C., Paper 09-1630, 2009.
48. Lewis-Workman, S. and D. Brod. Measuring the Neighborhood Benefits of Rail Transit Accessibility. Transportation Research Record, 1576, pp. 147–153, 1997.
49. Landis, J., R. Cervero, S. Guhathukurta, D. Loutzenheiser, and M. Zhang. “Rail Transit Investments, Real Estate Values, and Land Use Change: A Comparative Analysis of Five California Rail Transit Systems.” Monograph 48, Institute of Urban and Regional Studies. University of California at Berkeley, 1995.
50. Garrett, T. Light-Rail Transit in America: Policy Issues and Prospects for Economic Development. St. Louis: Federal Reserve Bank of St. Louis, pp.1–30. 2004.
51. Al-Mosaind, M. A., K. J. Dueke, and J.G. Strathman. “Light-Rail Transit Stations and Property Values: A Hedonic Price Approach.” Transportation Research Record, Issue 1400: 90–94, 1993.
52. Chen, H., A. Rufolo, and K. Dueker. “Measuring the Impact of Light Rail systems on Single-Family Home Prices: A Hedonic Approach with GIS Applications” Transportation Research Record. 1617: 38–43. 1998.
53. Dueker, K. and M. Bianco. Light-Rail-Transit Impacts in Portland: The First Ten Years. Transportation Research Record, 1685, pp.17–-180. 1999.
54. Voith, R. “Changing Capitalization of CBD-Oriented Transportation Systems: Evidence from Philadelphia, 1970–1988.” Journal of Urban Economics, 33: 361–376. 1993.
55. Cervero, R and Duncan, M. “Land Value Impacts of Rail Transit Services in San Diego County.” Report prepared for the National Association of Realtor and the Urban Land Institute. 2002.
56. Armstrong, R. and D.A. Rodríguez. An evaluation of the accessibility benefits of commuter rail in Eastern Massachusetts using spatial hedonic price functions, Transportation, 33:1, 21-43., 2006.
57. Rodríguez, D. A., and F. Targa. Value of accessibility to Bogotá’s Bus Rapid Transit System. Transport Reviews 24 (5):587–610, 2004.
58. Cervero, R and Duncan, M. “Benefits of Proximity to Rail on Housing Markets: Experiences in Santa Clara County.” Journal of Public Transportation, Vol.5, No.:1–18. 2002.
59. Benjamin, J.D. and G.S. Sirmans. “Mass Transportation, Apartment Rent and property Values.” The Journal of Real Estate Research, Vol. 12, No. 1. 1996.
60. Debrezion, G., E. Pels, and P. Rietveld. “The Impact of Railway Stations on Residential and Commercial Property Value: A Meta-Analysis” Journal of Real Estate Finance and Economics. 35:161-180. 2007.
149
61. Transit Benefits - Working Papers: A Public Choice Policy Analysis Office of Policy Development, FTA, Washington, D.C., 2000.
62. Nelson, A.C. Transit Stations and Commercial Property Values: A Case Study with Policy and Land-Use Implications. Journal of Public Transportation, Vol. 2, No. 3, 1998, pp. 77-95.
63. Fejarang, R.A. Impact on Property Values: A Study of the Los Angeles Metro Rail. Preprint, Transportation Research Board, 73rd Annual Meeting, Washington, D.C., January 9–13, 1994.
64. Weinberger, R. “Light Rail Proximity: Benefit Or Detriment in the Case of Santa Clara
County, California?” Transportation Research Record 1747: 104-113, 2001.
65. Weinstein, B. and T. Clower. The Initial Economic Impacts of the DART LRT System. Denton, Texas: University of North Texas, Center for Economic Development and Research, report prepared for the Dallas Area Rapid Transit District, 1999.
66. Weinstein, B. and T. Clower. “An Assessment of the DART LRT on taxable property valuations and transit oriented development.” Center for Economic Development and Research, University of North Texas, 2002.
67. Pan, Q., and L. Ma. Impacts of Urban Light Rail System on Residential Property Values: Case Study of Houston Metrorail Transit Line. Transportation Research Board Annual Meeting 2009 Paper #09-1712.
68. Munoz-Raskin, R. Walking accessibility to bus rapid transit in Latin America: Does it affect property values? The case of Bogotá, Colombia. In TRB 86th Annual Meeting Compendium of Papers CD-ROM, 2006.
69. Knaap, G. J., C. R. Ding, and L. D. Hopkins. Do plans matter? The effects of light rail plans on land values in station areas. Journal of Planning Education and Research, 21 (1):32–39, 2001.
70. Texas Comptroller. Biennial Reports of Reinvestment Zone for Tax Abatement Registry; Tax Increment Financing Registry. <http://www.window.state.tx.us/taxinfo/proptax/registry04/zone.html>. Accessed in 2010.
71. Delaware Valley Regional Planning Commission. “Transit Revitalization Investment District
Act: Implementing Transit-Oriented Development in Pennsylvania: A Summary of Act 238 of 2004.” Presentation. 2005.
72. “Why Dallas’s Streetcars Got the Transportation Funds, Not Fort Worth’s.” http://blogs.dallasobserver.com/unfairpark/2010/02/why_dallas_got_the_feds_funds.php. Accessed on Sept 26, 2010.

151
APPENDIX A: STAKEHOLDER OUTREACH
Interview Guide for Implementing Agency Stakeholders
Project 0-6535 Transportation Re-Investment Zones Interview Guide
Introduction The Texas Transportation Institute, along with Texas A&M University-Corpus Christi and the University of Texas-Austin are conducting a research project entitled, “Planning Tools to Asses the Real Estate Leveraging Potential for Roadways and Transit. Part of that research involves speaking to people such as yourself to assess your direct experience with Transportation Reinvestment Zones (TRZ) in Forney, Hidalgo, and El Paso Regions of Texas.
For note-taking purposes only, this interview will be audio-recorded. To begin with can you please tell me your name, agency and official title?
o Please indicate which TRZs you were involved with specifically and your specific role in the TRZ development.
o Need: Please explain the need and motivation for deciding to go with a TRZ for these projects and share any relevant background information that is pertinent for the project finance of these specific projects. If there are more than one projects please discuss them individually (Project A, B, C)
o Boundaries: What criteria did you use for deciding project boundaries for TRZ?
o Entities/TRZ Champions: Who were the key parties that were involved in the realization of TRZ for your region?
o Stakeholder Support: What were the specific processes you used to get all the parties on board before the TRZ was established?
o Allocation/Revenue Sharing: What percentage of City or County revenues were set aside for TRZ and were these deposits established in a fund (100% or only a portion x%)?
o Surplus Delineation: Was there a set of rules/guidelines that were decided upon for dealing with revenue surpluses from TRZ?
o Key Entities/Organizations: Who were entities/parties that were involved in this surplus delineation and revenue sharing allocation?
o Processes: What were the specific processes and protocols that were used to ensure the TRZ was in place (include those mandated by the TRZ legislation as well).
o TRZ Establishment and Negotiations.
− Were there any issues in developing and getting gaining acceptance/approval to establish the TRZ to acceptance?
− Did the negotiations among all parties involved in the establishment of the TRZ
152
proceed on schedule or were there any stumbling blocks that caused delays?
o Revenue Generation Analysis: Who, if at all, handled the revenue generation aspects of TRZs?
o Bill Issues:
− Now that the TRZ is underway, can you identify any issues or areas of improvement in the Bill as it currently stands?
− Was the guidance contained in the Bill, the Texas Administrative Code, and the Texas Transportation Code sufficiently clear to establish roles and responsibilities for each party in the TRZ? If not, where did you seek/find additional guidance and how easy was it to find it? What were the issues that required the most clarification?
o Financing and Fiscal Responsibility:
− Who is assumed to have fiscal responsibility in the event of a projected shortfall in revenue?
− What kind of debt instrument is your locality planning to acquire through the expected TRZ cash flows (a SIB loan, revenue bonds, others)?
− Can you describe the foreseen flow of funds in your TRZ from the moment property taxes are collected, through their ultimate use to repay debt?
− Who is assumed to have fiscal responsibility in the event of a projected shortfall in revenue? Did this assumption play any role in your decision to pursue a TRZ as a financing mechanism? Does your locality have any risk management mechanisms in place to deal with a potential shortfall in revenue? In the hypothetical case that a “TRZ revenue insurance” policy was available for purchase, would it make TRZ financing more or less attractive?
o Please provide contact information of other key parties we should speak to for the TRZs that we have discussed.
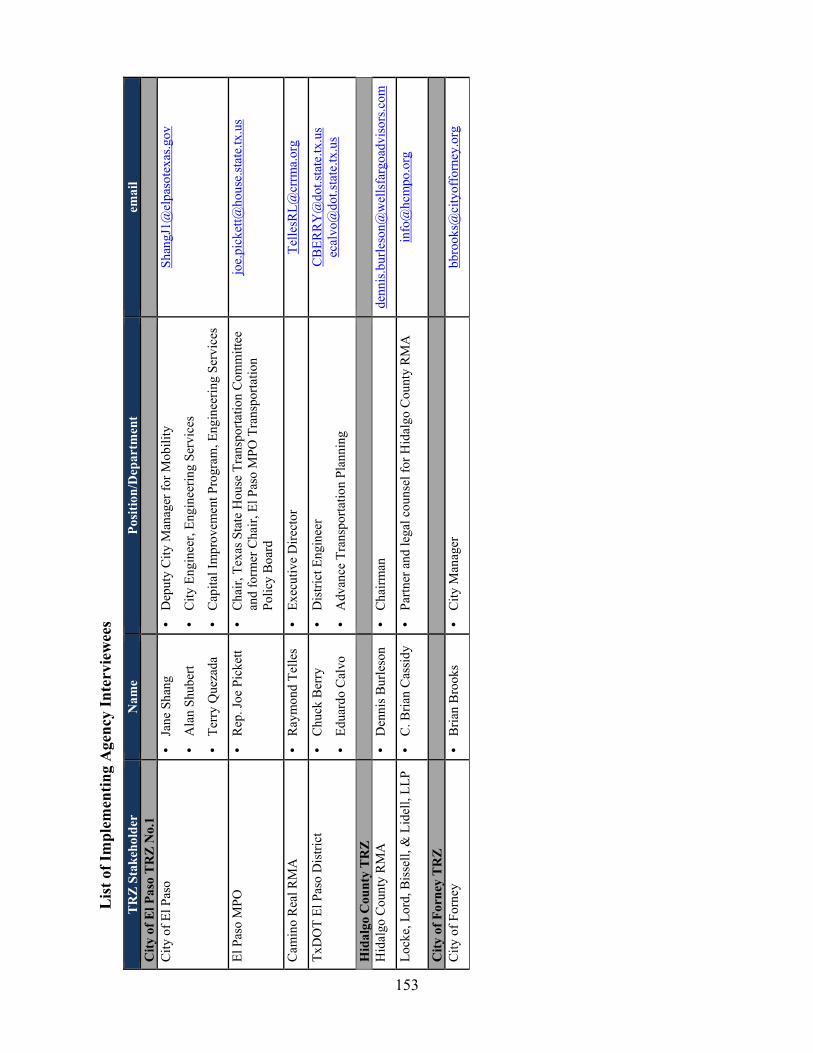
153
Lis
t of I
mpl
emen
ting
Age
ncy
Inte
rvie
wee
s T
RZ
Stak
ehol
der
Nam
e Po
sitio
n/D
epar
tmen
t em
ail
City
of E
l Pas
o T
RZ
No.
1
City
of E
l Pas
o
• Ja
ne S
hang
• A
lan
Shub
ert
• Te
rry
Que
zada
• D
eput
y C
ity M
anag
er fo
r Mob
ility
• C
ity E
ngin
eer,
Engi
neer
ing
Serv
ices
• C
apita
l Im
prov
emen
t Pro
gram
, Eng
inee
ring
Serv
ices
Shan
gJ1@
elpa
sote
xas.g
ov
El P
aso
MPO
•
Rep
. Joe
Pic
kett
•
Cha
ir, T
exas
Sta
te H
ouse
Tra
nspo
rtatio
n C
omm
ittee
an
d fo
rmer
Cha
ir, E
l Pas
o M
PO T
rans
porta
tion
Polic
y B
oard
joe.
pick
ett@
hous
e.st
ate.
tx.u
s
Cam
ino
Rea
l RM
A
• R
aym
ond
Telle
s •
Exec
utiv
e D
irect
or
Telle
sRL@
crrm
a.or
g
TxD
OT
El P
aso
Dis
trict
•
Chu
ck B
erry
• Ed
uard
o C
alvo
• D
istri
ct E
ngin
eer
• A
dvan
ce T
rans
porta
tion
Plan
ning
CB
ERR
Y@
dot.s
tate
.tx.u
s ec
alvo
@do
t.sta
te.tx
.us
Hid
algo
Cou
nty
TR
Z
Hid
algo
Cou
nty
RM
A
• D
enni
s Bur
leso
n •
Cha
irman
de
nnis
.bur
leso
n@w
ells
farg
oadv
isor
s.com
Lock
e, L
ord,
Bis
sell,
& L
idel
l, LL
P •
C. B
rian
Cas
sidy
•
Partn
er a
nd le
gal c
ouns
el fo
r Hid
algo
Cou
nty
RM
A
info
@hc
mpo
.org
City
of F
orne
y TR
Z
City
of F
orne
y •
Bria
n B
rook
s •
City
Man
ager
bb
rook
s@ci
tyof
forn
ey.o
rg

155
Stakeholder Outreach- Texas Association of Counties and Texas Municipal League
TRANSPORTATION REINVESTMENT ZONES SURVEY (www.TRZSurvey.org)
A statute passed in 2007 (Senate Bill 1266) provides Texas cities the authority to create zones for transportation infrastructure investment. Specifically addressed in the bill, Transportation Reinvestment Zones are a relatively new method of funding transportation projects by capturing a part of the property tax revenue from increased property values resulting from the creation of a new road. To date, only the City of El Paso and Hidalgo County have created transportation projects using this funding method, and the City of Forney is currently in the process of doing so. (S.B. 1266 is codified in Subchapter E, Chapter 222 of the Texas Transportation Code.) The Texas Transportation Institute is currently conducting a research project to enhance the implementation of the provisions of S.B. 1266. Goals of this research are to enhance cities’ knowledge of the law, make recommendations for changes, and recommend procedures for the effective execution of this statute. To begin this research process, the department is surveying Texas cities in an effort to gain general information about cities’ knowledge of S.B. 1266 and the nature of cities’ Transportation Reinvestment Zones. To participate in this survey, please go to www.TRZSurvey.org and complete the short questionnaire. The Texas Transportation Institute, along with Texas A&M University - Corpus Christi and the University of Texas at Austin – Center for Transportation Research are conducting a research project entitled "Planning Tools to Assess the Real Estate Leveraging Potential for Roadways and Transit." Part of that research involves speaking to people such as yourself to assess your familiarity with various innovative financing methods for transportation projects, Transportation Reinvestment Zones (TRZ) in particular. There are 27 questions in this survey TRZ Questions
1. Please tell us about what you know about Senate Bill 1266, passed in the 80th Texas Legislature.
Please write your answer here:
2. Have you or are you considering developing a TRZ? *
Please choose only one of the following: Yes, we have developed a TRZ We are considering developing a TRZ No, we are not considering developing a TRZ
156
3. For what purpose?
Only answer this question if the following conditions are met: ° Answer was 'Yes, we have developed a TRZ' or 'We are considering developing a TRZ' at question 2 (Have you or are you considering developing a TRZ?) Please write your answer here:
4. What is the geographic boundary?
Only answer this question if the following conditions are met: ° Answer was 'Yes, we have developed a TRZ' or 'We are considering developing a TRZ' at question 2 (Have you or are you considering developing a TRZ?)
5. Are there overlapping jurisdictions such as cities and school districts?
Only answer this question if the following conditions are met: ° Answer was 'Yes, we have developed a TRZ' or 'We are considering developing a TRZ' at question 2 (Have you or are you considering developing a TRZ?)
6. Are there other TIFs, SADs, etc within the project limits?
Only answer this question if the following conditions are met: ° Answer was 'Yes, we have developed a TRZ' or 'We are considering developing a TRZ' at question 2 (Have you or are you considering developing a TRZ?)
7. Are you working with another jurisdiction, e.g. county and city together, adjacent county or city, etc.?
Only answer this question if the following conditions are met: ° Answer was 'Yes, we have developed a TRZ' or 'We are considering developing a TRZ' at question 2 (Have you or are you considering developing a TRZ?)
8. Are you working with a Regional Mobility Authority on this development?
Only answer this question if the following conditions are met: ° Answer was 'We are considering developing a TRZ' or 'Yes, we have developed a TRZ' at question '2 [2]' (Have you or are you considering developing a TRZ?)
Please choose only one of the following: Yes No
9. Why did you decide to take that approach (working with an RMA)?
157
Only answer this question if the following conditions are met: ° Answer was 'Yes' at question 8 (Are you working with a Regional Mobility Authority on this development?)
10. What is the role of the RMA?
Only answer this question if the following conditions are met: ° Answer was 'Yes' at question 8 (Are you working with a Regional Mobility Authority on this development?)
11. What were the most significant challenges that you have faced in the process of
developing the TRZ and how did you overcome them?
Only answer this question if the following conditions are met: ° Answer was 'Yes, we have developed a TRZ' or 'We are considering developing a TRZ' at question 2 (Have you or are you considering developing a TRZ?)
12. What significant challenges do you still need to overcome?
Only answer this question if the following conditions are met: ° Answer was 'Yes, we have developed a TRZ' or 'We are considering developing a TRZ' at question 2 (Have you or are you considering developing a TRZ?)
13. Why did you decide not to pursue a TRZ?
Only answer this question if the following conditions are met: ° Answer was 'No, we are not considering developing a TRZ ' at question 2 (Have you or are you considering developing a TRZ?)
14. What difficulties did you encounter?
Only answer this question if the following conditions are met: ° Answer was 'No, we are not considering developing a TRZ ' at question 2 (Have you or are you considering developing a TRZ?)
15. Are there specific provisions in the bill (SB 1266) that influenced your decision?
Only answer this question if the following conditions are met: ° Answer was 'No, we are not considering developing a TRZ ' at question 2 (Have you or are you considering developing a TRZ?)
16. Have you been approached by another entity to form a TRZ?
Please choose only one of the following: Yes No
17. Which entity?
158
Only answer this question if the following conditions are met: ° Answer was 'Yes' at question '16' (Have you been approached by another entity to form a TRZ?)
18. Can you provide any details about the discussions?
Only answer this question if the following conditions are met: ° Answer was 'Yes' at question '16 [3m]' (Have you been approached by another entity to form a TRZ?)
19. Please review the information on TRZs presented below and answer the question that follows:
Senate Bill 1266 (SB1266) is landmark legislation passed in 2007 as part of the 80th Legislature to provide the legal backdrop for the creation of an institutional arrangement called the “Transportation Reinvestment Zone” (TRZ). This makes Texas one of the first states in the nation to provide the legal background for the capture of the tax increment resulting from the increase in property values related to a transportation infrastructure investment. Under the current language of the legislation, local governmental entities (cities, counties, and Regional Mobility Authorities) can create a TRZ to capture the property tax increment revenues resulting from a transportation project in order to finance pass-through transportation investments. SB1266 allows local governments to raise project funding through the issuance of bonds backed by a revenue mix consisting of property tax increment revenues and TxDOT pass-through payments. Here are examples of how it has already been used in Texas Cities and Counties:
• The City of El Paso has established a TRZ to finance three of Comprehensive Mobility Plan projects with revenues from a TRZ set up in 2008. The TRZ revenues constitute local matching funds for these projects.
• The City of Forney, TX has established a TRZ in 2009 to finance an interchange project with TRZ revenues.
• Hidalgo County has established a County TRZ to finance the Hidalgo Loop project. Do you think your agency might be interested in forming a TRZ? Only answer this question if the following conditions are met: ° Answer was 'No, we are not considering developing a TRZ ' at question 2 (Have you or are you considering developing a TRZ?) Please choose only one of the following: Yes No
20. What would it look like? (Single project, multiple projects, on-system transit, roadway,
etc...)
Only answer this question if the following conditions are met: ° Answer was 'Yes' at question '19

159
21. What other information would make the process easier?
Only answer this question if the following conditions are met:° Answer was 'Yes' at question 19
22. Would you partner with another agency, such as an RMA or local toll authority?
Only answer this question if the following conditions are met: ° Answer was 'Yes' at question 19
23. Which agency would you partner with?
Only answer this question if the following conditions are met: ° Answer was 'Yes' at question 22 (Would you partner with another agency, such as an RMA or local toll authority?)
24. Please provide your name 25 Please provide your address.
26 Please provide your phone number.
27 Please provide your e-mail address.
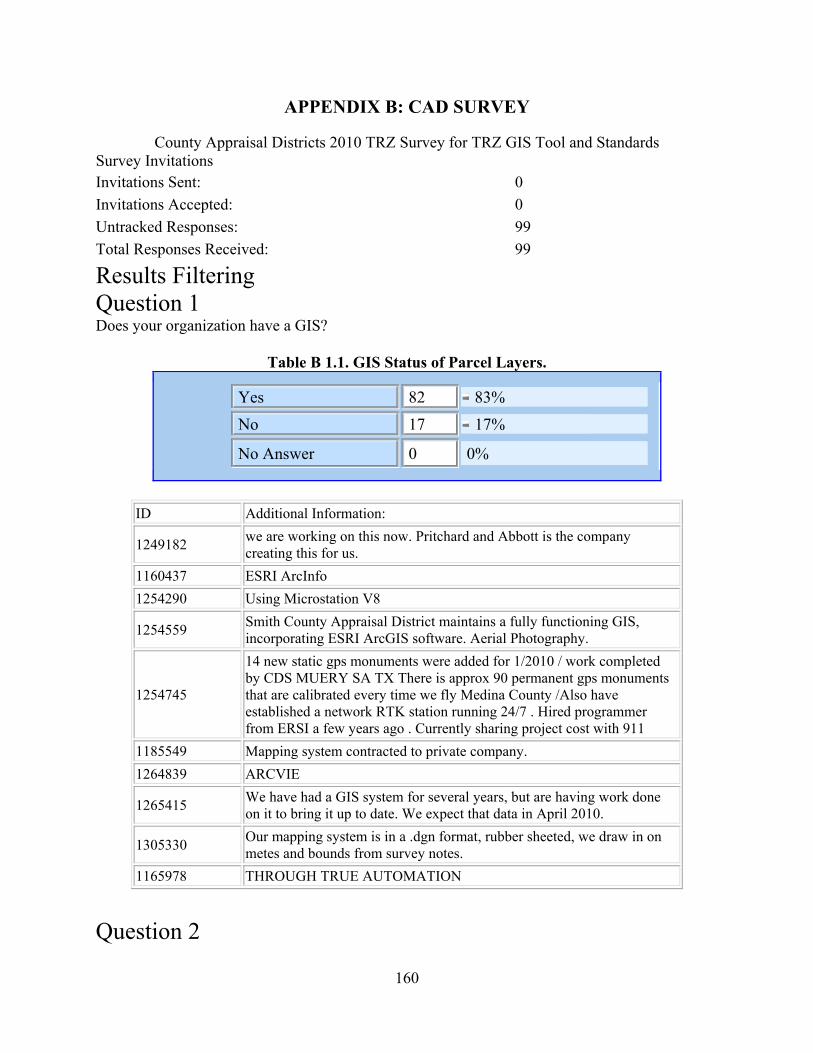
160
APPENDIX B: CAD SURVEY
County Appraisal Districts 2010 TRZ Survey for TRZ GIS Tool and Standards Survey Invitations Invitations Sent: 0 Invitations Accepted: 0 Untracked Responses: 99 Total Responses Received: 99
Results Filtering Question 1 Does your organization have a GIS?
Table B 1.1. GIS Status of Parcel Layers.
Yes 82 83% No 17 17%
No Answer 0 0%
ID Additional Information:
1249182 we are working on this now. Pritchard and Abbott is the company creating this for us.
1160437 ESRI ArcInfo 1254290 Using Microstation V8
1254559 Smith County Appraisal District maintains a fully functioning GIS, incorporating ESRI ArcGIS software. Aerial Photography.
1254745
14 new static gps monuments were added for 1/2010 / work completed by CDS MUERY SA TX There is approx 90 permanent gps monuments that are calibrated every time we fly Medina County /Also have established a network RTK station running 24/7 . Hired programmer from ERSI a few years ago . Currently sharing project cost with 911
1185549 Mapping system contracted to private company. 1264839 ARCVIE
1265415 We have had a GIS system for several years, but are having work done on it to bring it up to date. We expect that data in April 2010.
1305330 Our mapping system is in a .dgn format, rubber sheeted, we draw in on metes and bounds from survey notes.
1165978 THROUGH TRUE AUTOMATION
Question 2
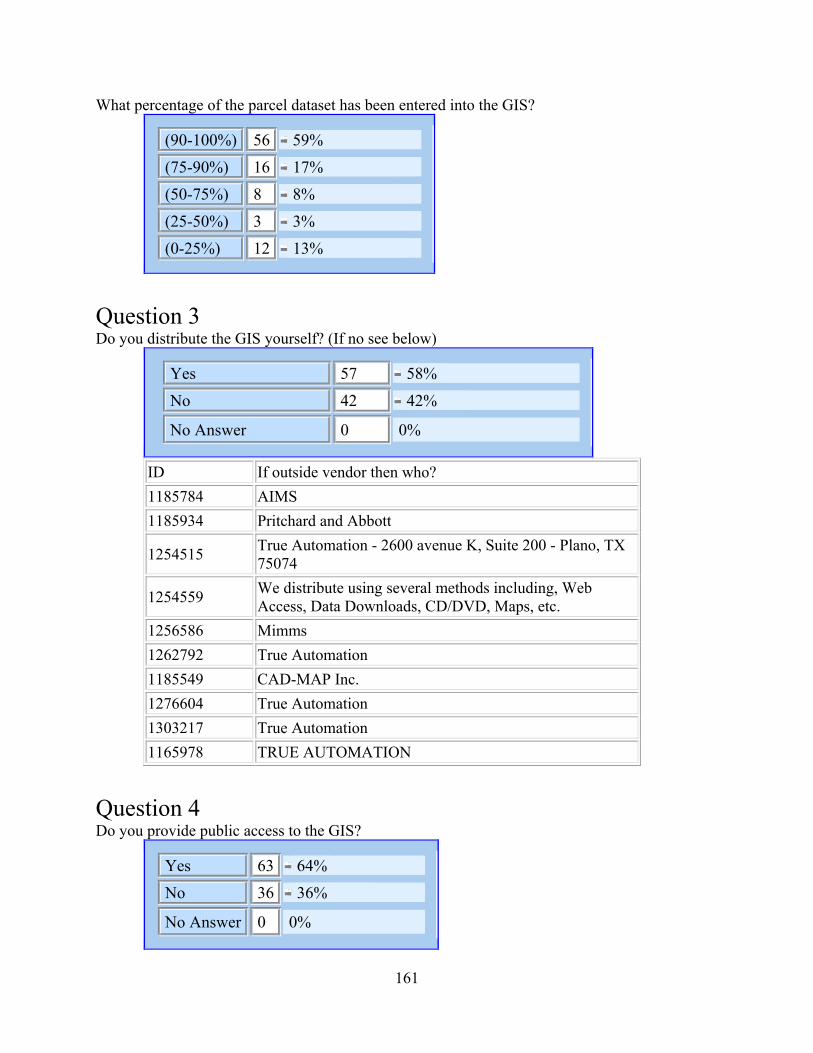
161
What percentage of the parcel dataset has been entered into the GIS?
(90-100%) 56 59%
(75-90%) 16 17%
(50-75%) 8 8%
(25-50%) 3 3%
(0-25%) 12 13%
Question 3 Do you distribute the GIS yourself? (If no see below)
Yes 57 58% No 42 42%
No Answer 0 0%
ID If outside vendor then who? 1185784 AIMS 1185934 Pritchard and Abbott
1254515 True Automation - 2600 avenue K, Suite 200 - Plano, TX 75074
1254559 We distribute using several methods including, Web Access, Data Downloads, CD/DVD, Maps, etc.
1256586 Mimms 1262792 True Automation 1185549 CAD-MAP Inc. 1276604 True Automation 1303217 True Automation 1165978 TRUE AUTOMATION
Question 4 Do you provide public access to the GIS?
Yes 63 64%
No 36 36%
No Answer 0
0%
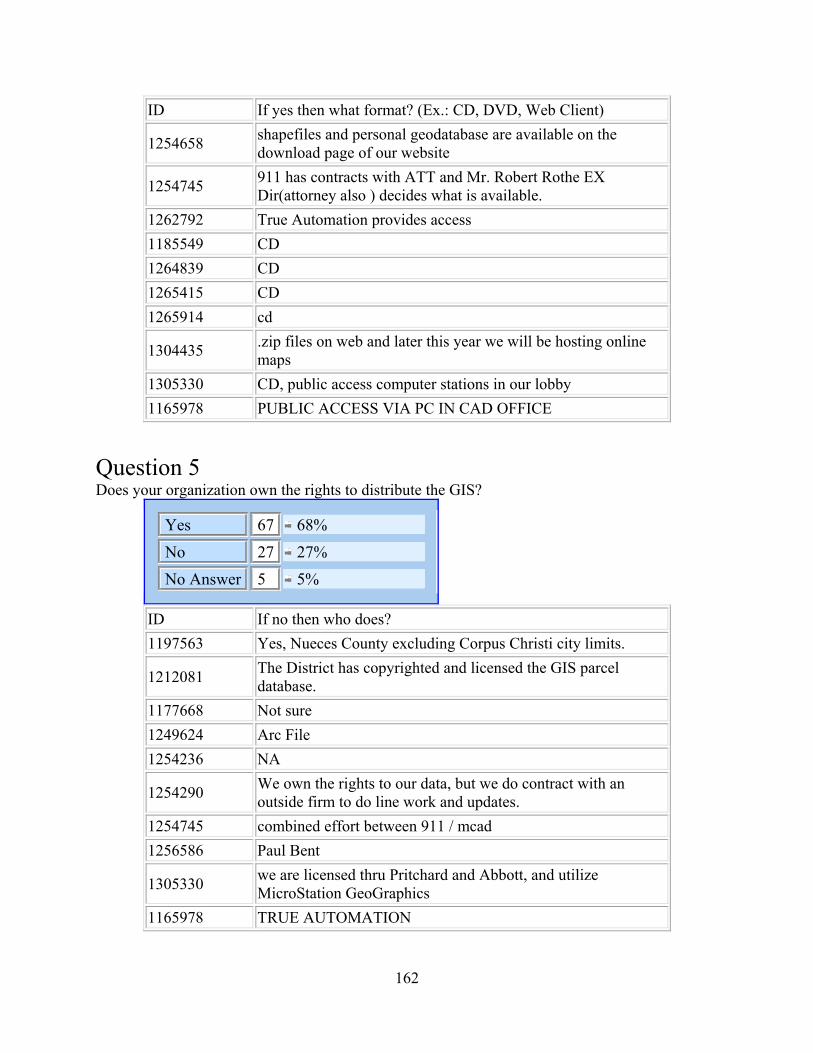
162
ID If yes then what format? (Ex.: CD, DVD, Web Client)
1254658 shapefiles and personal geodatabase are available on the download page of our website
1254745 911 has contracts with ATT and Mr. Robert Rothe EX Dir(attorney also ) decides what is available.
1262792 True Automation provides access 1185549 CD 1264839 CD 1265415 CD 1265914 cd
1304435 .zip files on web and later this year we will be hosting online maps
1305330 CD, public access computer stations in our lobby 1165978 PUBLIC ACCESS VIA PC IN CAD OFFICE
Question 5 Does your organization own the rights to distribute the GIS?
Yes 67 68%
No 27 27%
No Answer 5 5%
ID If no then who does? 1197563 Yes, Nueces County excluding Corpus Christi city limits.
1212081 The District has copyrighted and licensed the GIS parcel database.
1177668 Not sure 1249624 Arc File 1254236 NA
1254290 We own the rights to our data, but we do contract with an outside firm to do line work and updates.
1254745 combined effort between 911 / mcad 1256586 Paul Bent
1305330 we are licensed thru Pritchard and Abbott, and utilize MicroStation GeoGraphics
1165978 TRUE AUTOMATION
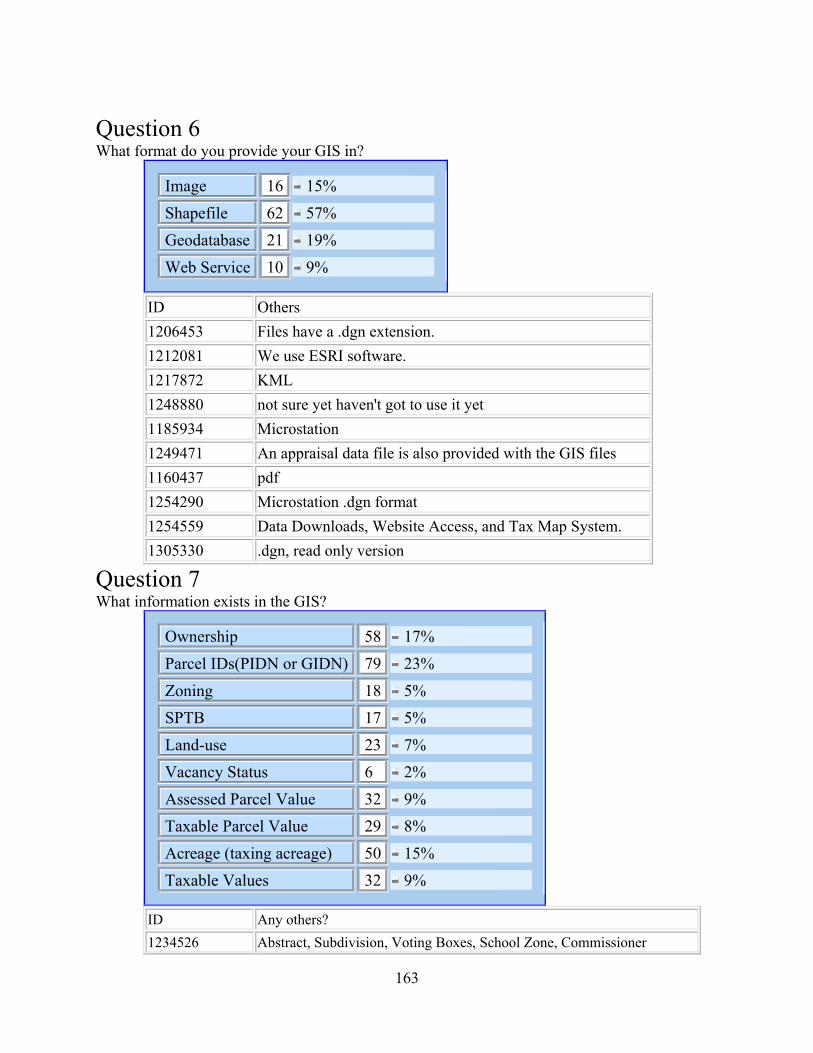
163
Question 6 What format do you provide your GIS in?
Image 16 15%
Shapefile 62 57%
Geodatabase 21 19%
Web Service 10 9%
ID Others 1206453 Files have a .dgn extension. 1212081 We use ESRI software. 1217872 KML 1248880 not sure yet haven't got to use it yet 1185934 Microstation 1249471 An appraisal data file is also provided with the GIS files 1160437 pdf 1254290 Microstation .dgn format 1254559 Data Downloads, Website Access, and Tax Map System. 1305330 .dgn, read only version
Question 7 What information exists in the GIS?
Ownership 58 17% Parcel IDs(PIDN or GIDN) 79 23% Zoning 18 5% SPTB 17 5% Land-use 23 7% Vacancy Status 6 2% Assessed Parcel Value 32 9% Taxable Parcel Value 29 8% Acreage (taxing acreage) 50 15% Taxable Values 32 9%
ID Any others? 1234526 Abstract, Subdivision, Voting Boxes, School Zone, Commissioner
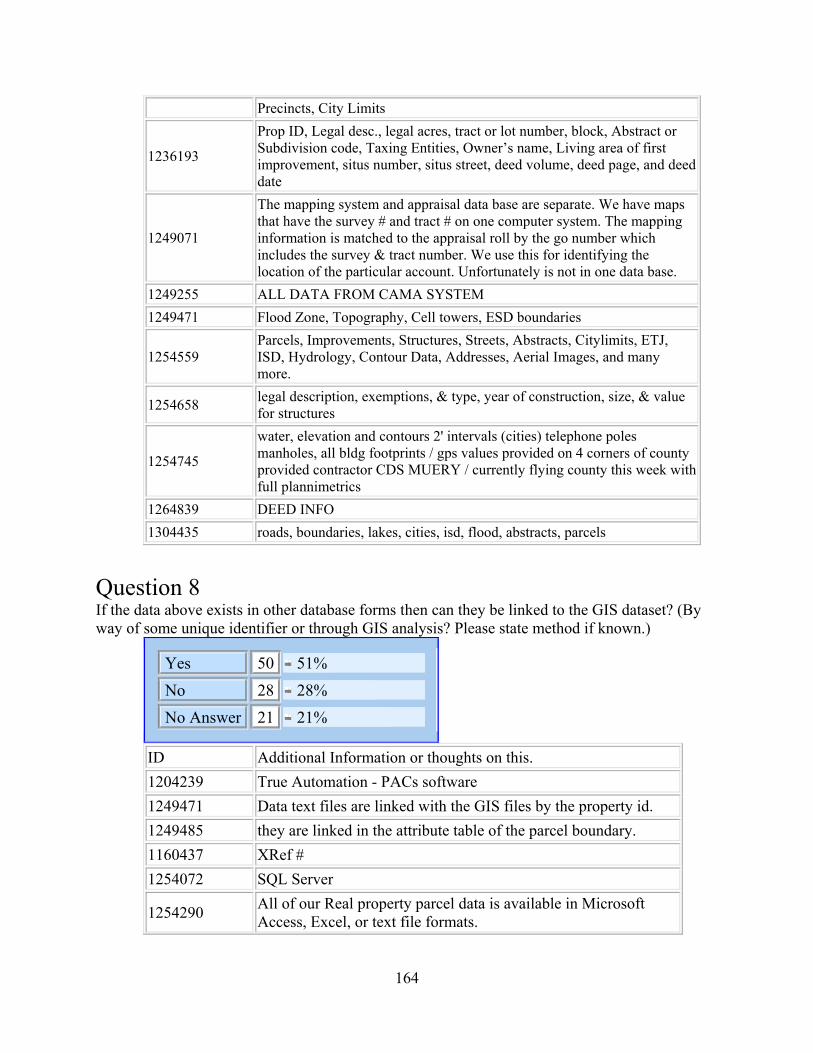
164
Precincts, City Limits
1236193
Prop ID, Legal desc., legal acres, tract or lot number, block, Abstract or Subdivision code, Taxing Entities, Owner’s name, Living area of first improvement, situs number, situs street, deed volume, deed page, and deed date
1249071
The mapping system and appraisal data base are separate. We have maps that have the survey # and tract # on one computer system. The mapping information is matched to the appraisal roll by the go number which includes the survey & tract number. We use this for identifying the location of the particular account. Unfortunately is not in one data base.
1249255 ALL DATA FROM CAMA SYSTEM 1249471 Flood Zone, Topography, Cell towers, ESD boundaries
1254559 Parcels, Improvements, Structures, Streets, Abstracts, Citylimits, ETJ, ISD, Hydrology, Contour Data, Addresses, Aerial Images, and many more.
1254658 legal description, exemptions, & type, year of construction, size, & value for structures
1254745
water, elevation and contours 2' intervals (cities) telephone poles manholes, all bldg footprints / gps values provided on 4 corners of county provided contractor CDS MUERY / currently flying county this week with full plannimetrics
1264839 DEED INFO 1304435 roads, boundaries, lakes, cities, isd, flood, abstracts, parcels
Question 8 If the data above exists in other database forms then can they be linked to the GIS dataset? (By way of some unique identifier or through GIS analysis? Please state method if known.)
Yes 50 51%
No 28 28%
No Answer 21 21%
ID Additional Information or thoughts on this. 1204239 True Automation - PACs software 1249471 Data text files are linked with the GIS files by the property id. 1249485 they are linked in the attribute table of the parcel boundary. 1160437 XRef # 1254072 SQL Server
1254290 All of our Real property parcel data is available in Microsoft Access, Excel, or text file formats.
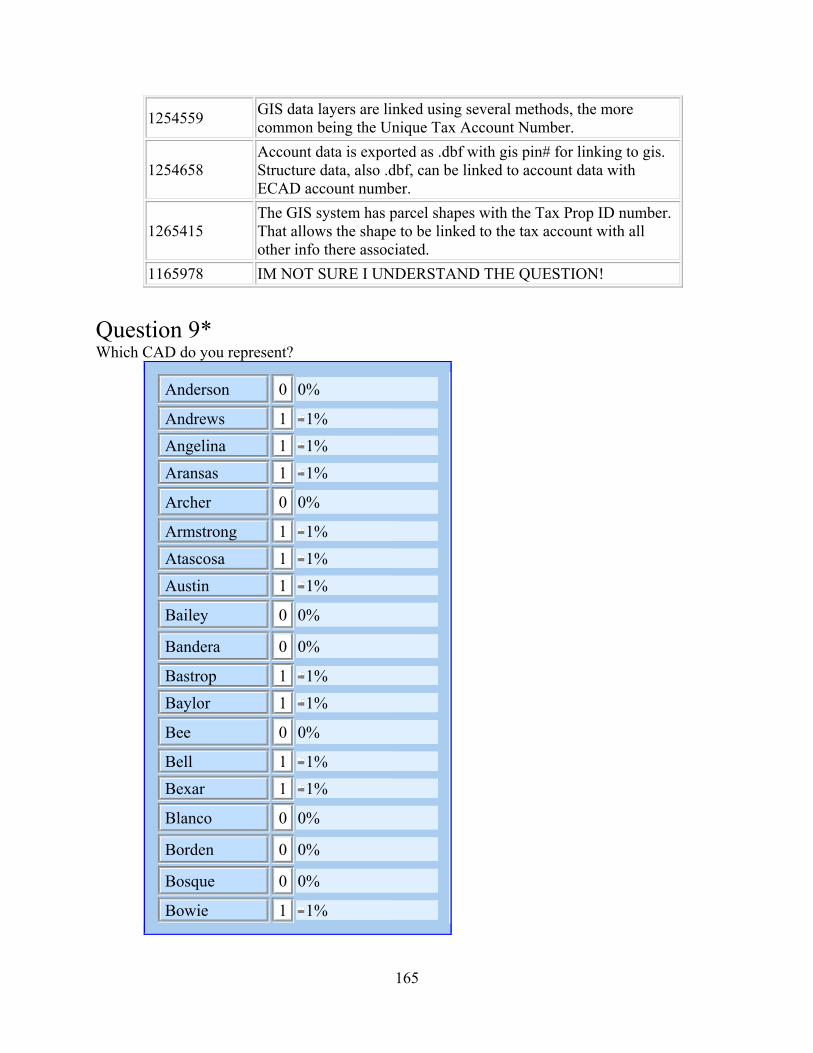
165
1254559 GIS data layers are linked using several methods, the more common being the Unique Tax Account Number.
1254658 Account data is exported as .dbf with gis pin# for linking to gis. Structure data, also .dbf, can be linked to account data with ECAD account number.
1265415 The GIS system has parcel shapes with the Tax Prop ID number. That allows the shape to be linked to the tax account with all other info there associated.
1165978 IM NOT SURE I UNDERSTAND THE QUESTION!
Question 9* Which CAD do you represent?
Anderson 0 0%
Andrews 1 1%
Angelina 1 1%
Aransas 1 1%
Archer 0 0%
Armstrong 1 1%
Atascosa 1 1%
Austin 1 1%
Bailey 0 0%
Bandera 0 0%
Bastrop 1 1%
Baylor 1 1%
Bee 0 0%
Bell 1 1%
Bexar 1 1%
Blanco 0 0%
Borden 0 0%
Bosque 0 0%
Bowie 1 1%
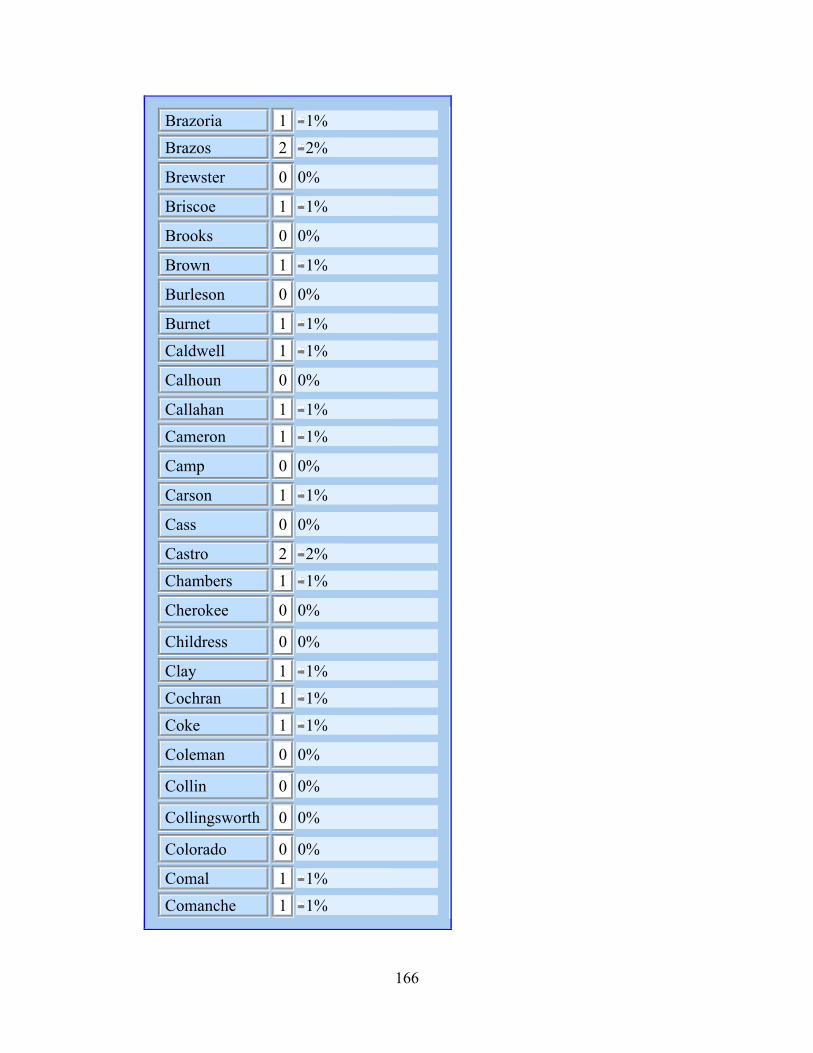
166
Brazoria 1 1%
Brazos 2 2%
Brewster 0 0%
Briscoe 1 1%
Brooks 0 0%
Brown 1 1%
Burleson 0 0%
Burnet 1 1%
Caldwell 1 1%
Calhoun 0 0%
Callahan 1 1%
Cameron 1 1%
Camp 0 0%
Carson 1 1%
Cass 0 0%
Castro 2 2%
Chambers 1 1%
Cherokee 0 0%
Childress 0 0%
Clay 1 1%
Cochran 1 1%
Coke 1 1%
Coleman 0 0%
Collin 0 0%
Collingsworth 0 0%
Colorado 0 0%
Comal 1 1%
Comanche 1 1%
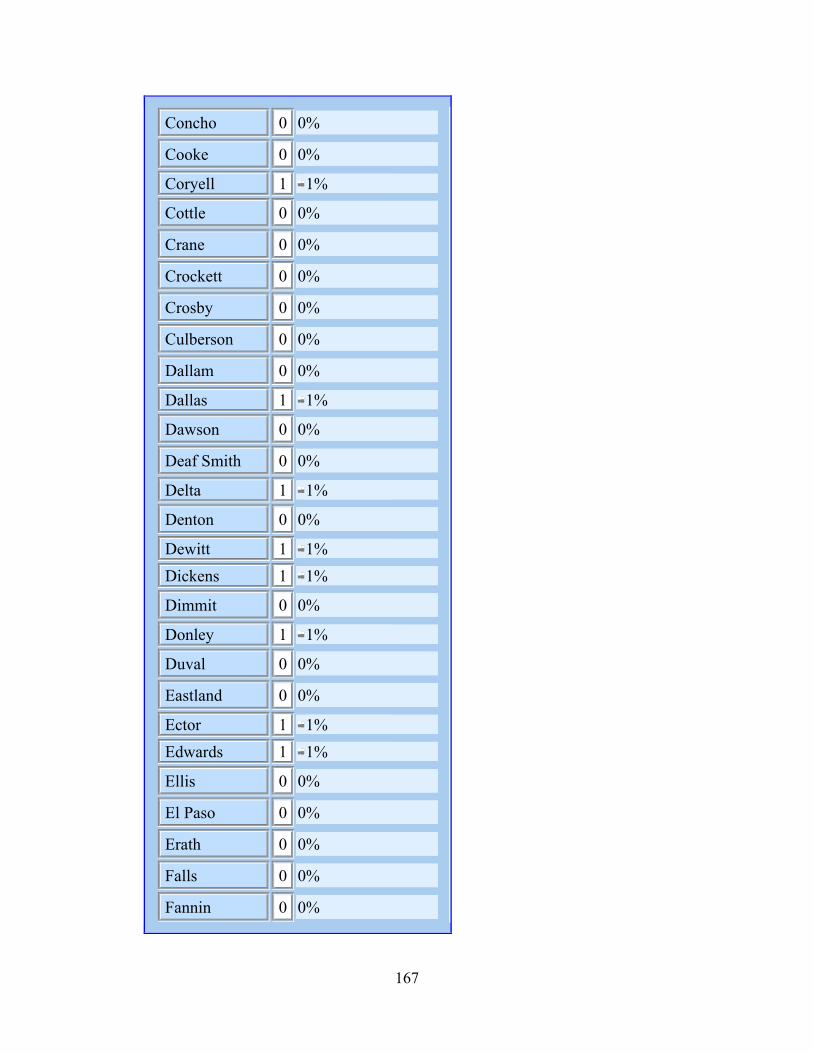
167
Concho 0 0%
Cooke 0 0%
Coryell 1 1%
Cottle 0 0%
Crane 0 0%
Crockett 0 0%
Crosby 0 0%
Culberson 0 0%
Dallam 0 0%
Dallas 1 1%
Dawson 0 0%
Deaf Smith 0 0%
Delta 1 1%
Denton 0 0%
Dewitt 1 1%
Dickens 1 1%
Dimmit 0 0%
Donley 1 1%
Duval 0 0%
Eastland 0 0%
Ector 1 1%
Edwards 1 1%
Ellis 0 0%
El Paso 0 0%
Erath 0 0%
Falls 0 0%
Fannin 0 0%
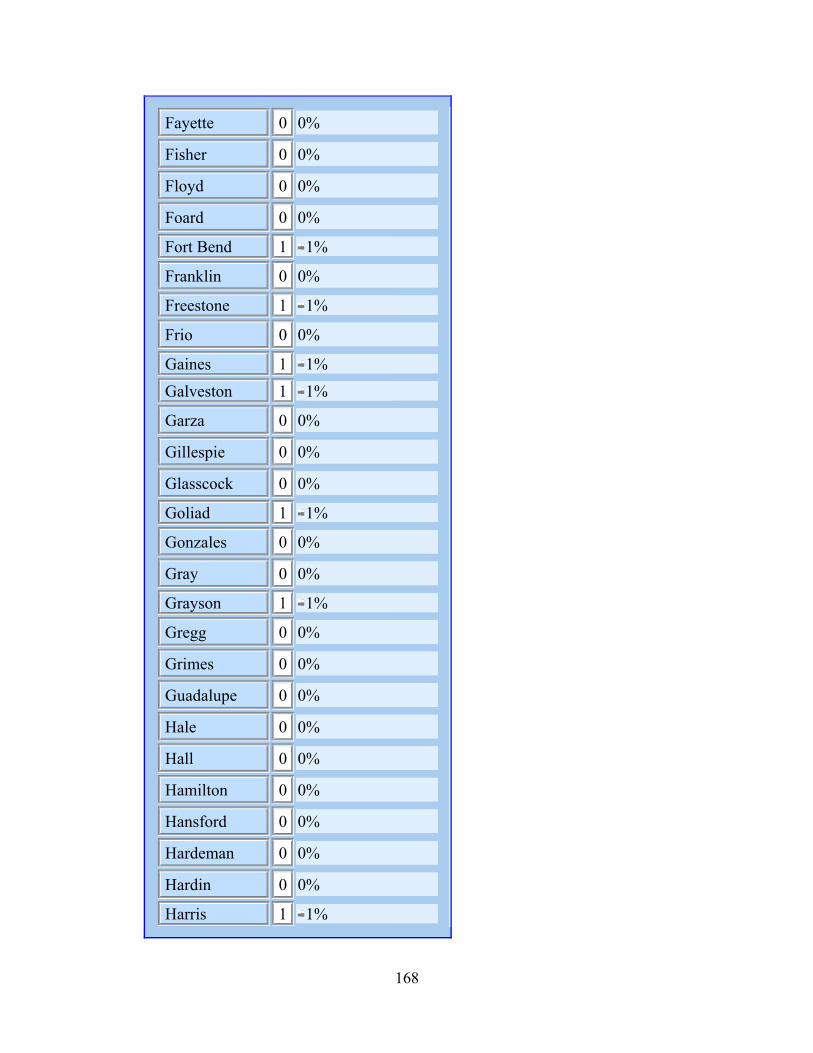
168
Fayette 0 0%
Fisher 0 0%
Floyd 0 0%
Foard 0 0%
Fort Bend 1 1%
Franklin 0 0%
Freestone 1 1%
Frio 0 0%
Gaines 1 1%
Galveston 1 1%
Garza 0 0%
Gillespie 0 0%
Glasscock 0 0%
Goliad 1 1%
Gonzales 0 0%
Gray 0 0%
Grayson 1 1%
Gregg 0 0%
Grimes 0 0%
Guadalupe 0 0%
Hale 0 0%
Hall 0 0%
Hamilton 0 0%
Hansford 0 0%
Hardeman 0 0%
Hardin 0 0%
Harris 1 1%

169
Harrison 1 1%
Hartley 0 0%
Haskell 0 0%
Hays 0 0%
Hemphill 0 0%
Henderson 0 0%
Hidalgo 0 0%
Hill 0 0%
Hockley 0 0%
Hood 0 0%
Hopkins 0 0%
Houston 0 0%
Howard 1 1%
Hudspeth 0 0%
Hunt 1 1%
Hutchinson 1 1%
Irion 0 0%
Jack 0 0%
Jackson 1 1%
Jasper 0 0%
Jeff Davis 0 0%
Jefferson 1 1%
Jim Hogg 0 0%
Jim Wells 0 0%
Johnson 1 1%
Jones 0 0%
Karnes 1 1%
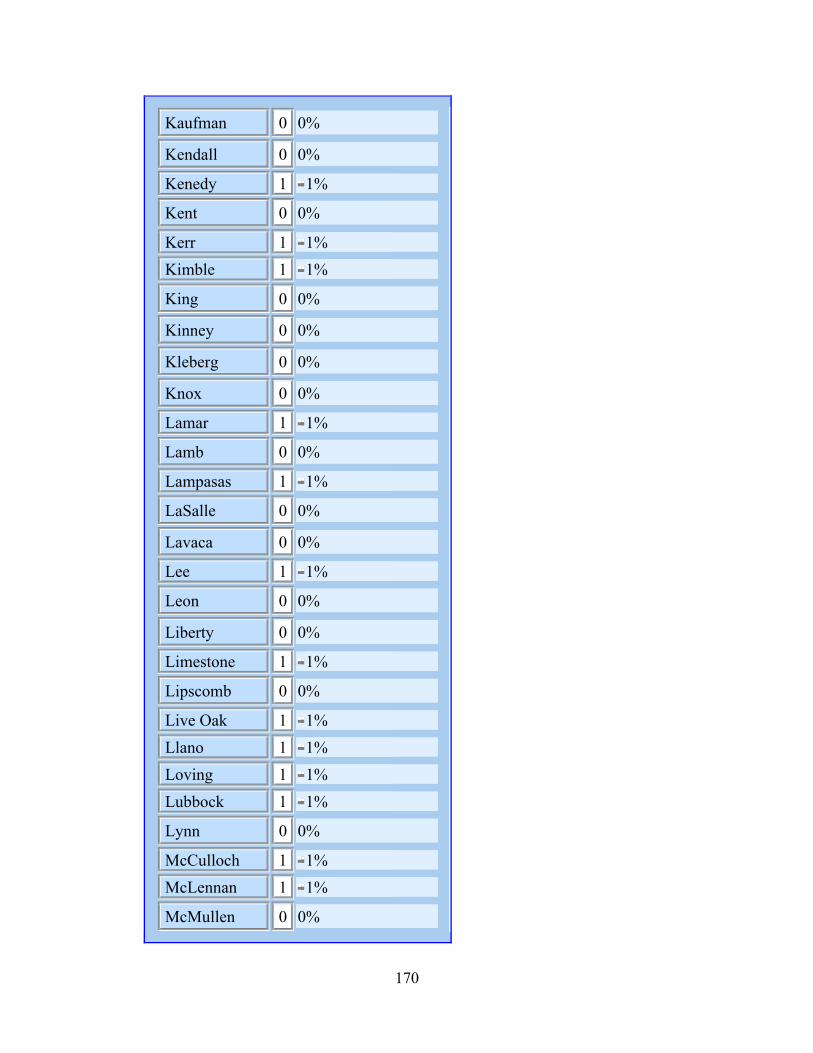
170
Kaufman 0 0%
Kendall 0 0%
Kenedy 1 1%
Kent 0 0%
Kerr 1 1%
Kimble 1 1%
King 0 0%
Kinney 0 0%
Kleberg 0 0%
Knox 0 0%
Lamar 1 1%
Lamb 0 0%
Lampasas 1 1%
LaSalle 0 0%
Lavaca 0 0%
Lee 1 1%
Leon 0 0%
Liberty 0 0%
Limestone 1 1%
Lipscomb 0 0%
Live Oak 1 1%
Llano 1 1%
Loving 1 1%
Lubbock 1 1%
Lynn 0 0%
McCulloch 1 1%
McLennan 1 1%
McMullen 0 0%
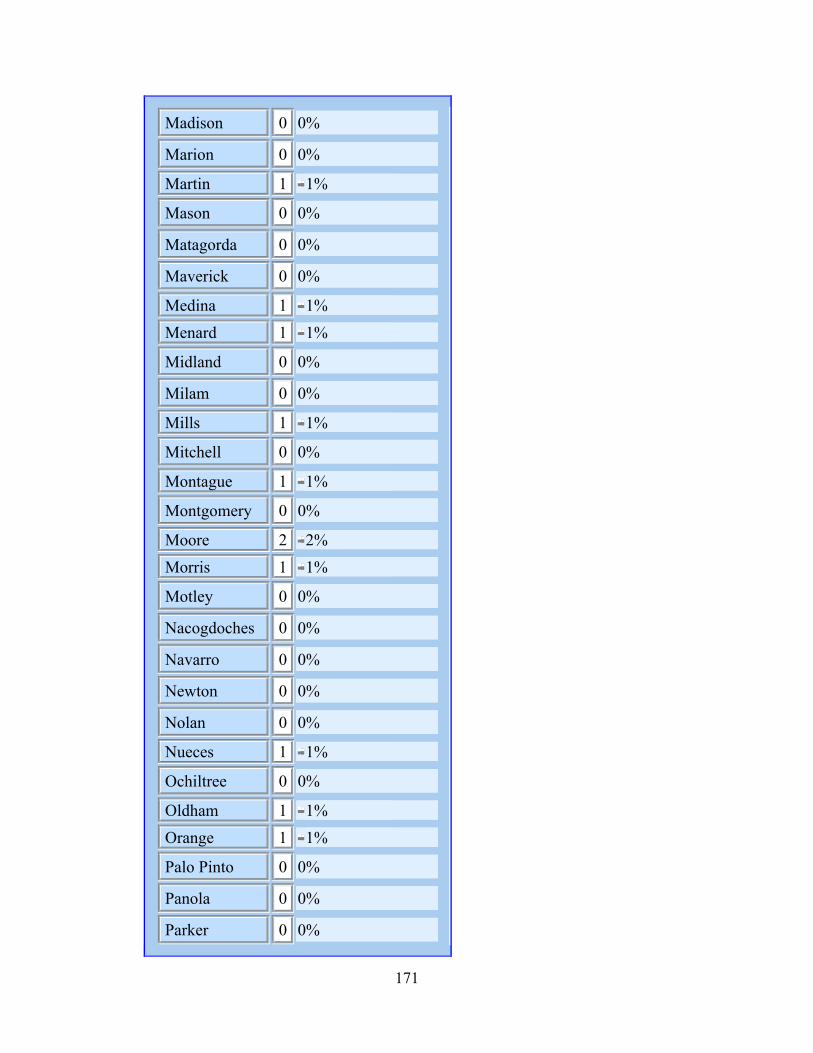
171
Madison 0 0%
Marion 0 0%
Martin 1 1%
Mason 0 0%
Matagorda 0 0%
Maverick 0 0%
Medina 1 1%
Menard 1 1%
Midland 0 0%
Milam 0 0%
Mills 1 1%
Mitchell 0 0%
Montague 1 1%
Montgomery 0 0%
Moore 2 2%
Morris 1 1%
Motley 0 0%
Nacogdoches 0 0%
Navarro 0 0%
Newton 0 0%
Nolan 0 0%
Nueces 1 1%
Ochiltree 0 0%
Oldham 1 1%
Orange 1 1%
Palo Pinto 0 0%
Panola 0 0%
Parker 0 0%
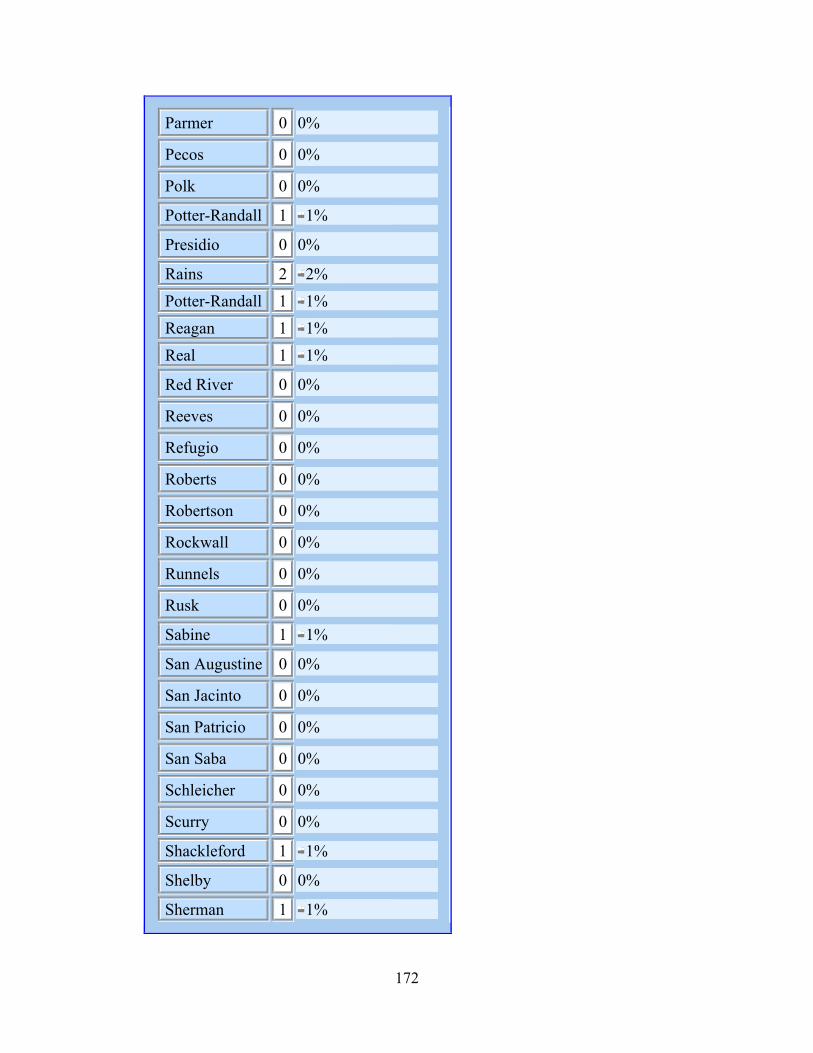
172
Parmer 0 0%
Pecos 0 0%
Polk 0 0%
Potter-Randall 1 1%
Presidio 0 0%
Rains 2 2%
Potter-Randall 1 1%
Reagan 1 1%
Real 1 1%
Red River 0 0%
Reeves 0 0%
Refugio 0 0%
Roberts 0 0%
Robertson 0 0%
Rockwall 0 0%
Runnels 0 0%
Rusk 0 0%
Sabine 1 1%
San Augustine 0 0%
San Jacinto 0 0%
San Patricio 0 0%
San Saba 0 0%
Schleicher 0 0%
Scurry 0 0%
Shackleford 1 1%
Shelby 0 0%
Sherman 1 1%
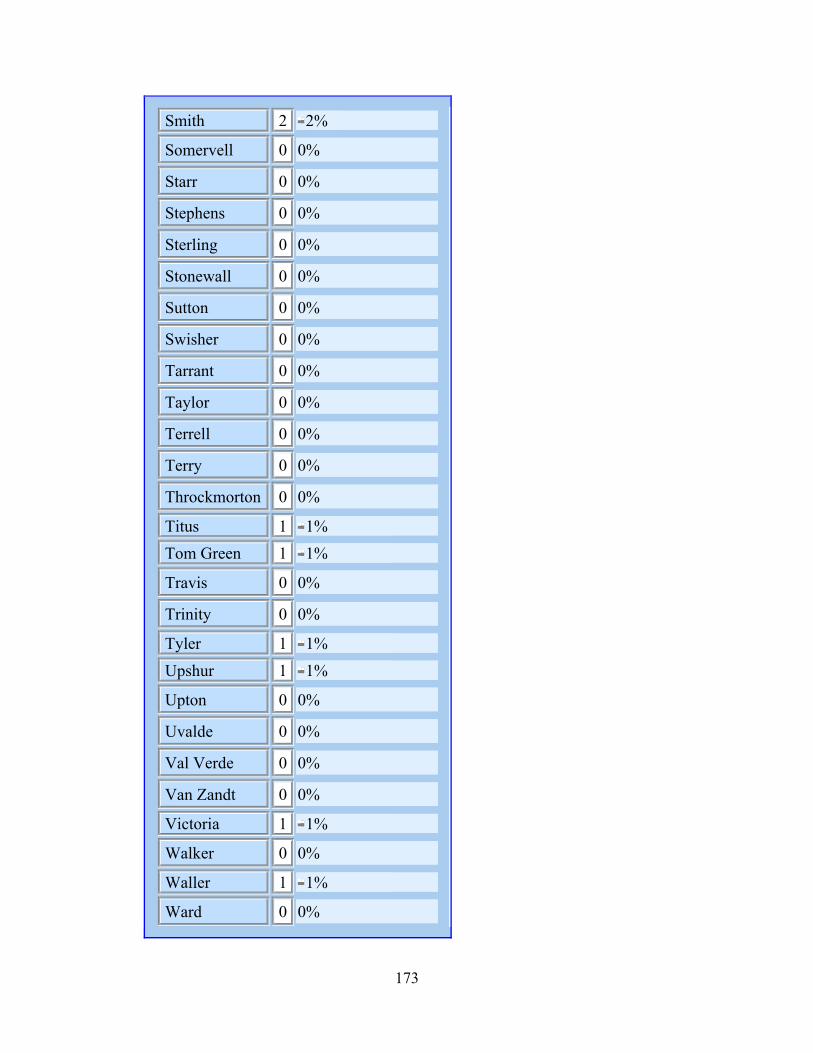
173
Smith 2 2%
Somervell 0 0%
Starr 0 0%
Stephens 0 0%
Sterling 0 0%
Stonewall 0 0%
Sutton 0 0%
Swisher 0 0%
Tarrant 0 0%
Taylor 0 0%
Terrell 0 0%
Terry 0 0%
Throckmorton 0 0%
Titus 1 1%
Tom Green 1 1%
Travis 0 0%
Trinity 0 0%
Tyler 1 1%
Upshur 1 1%
Upton 0 0%
Uvalde 0 0%
Val Verde 0 0%
Van Zandt 0 0%
Victoria 1 1%
Walker 0 0%
Waller 1 1%
Ward 0 0%
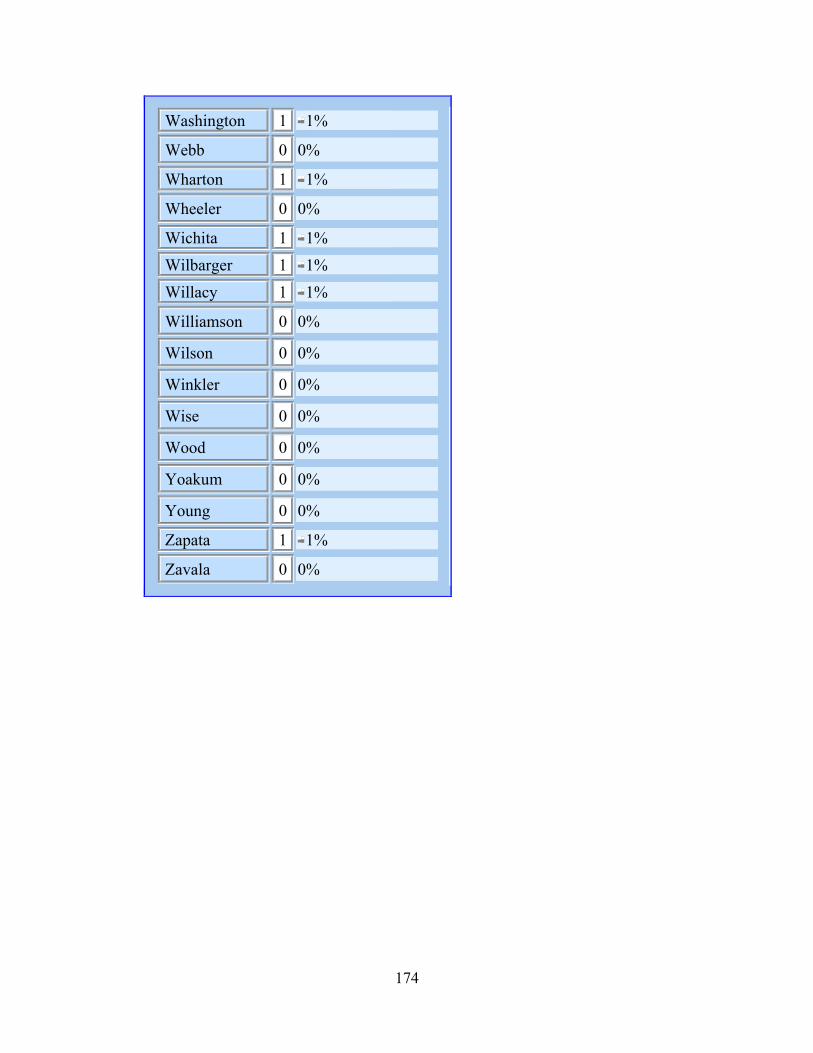
174
Washington 1 1%
Webb 0 0%
Wharton 1 1%
Wheeler 0 0%
Wichita 1 1%
Wilbarger 1 1%
Willacy 1 1%
Williamson 0 0%
Wilson 0 0%
Winkler 0 0%
Wise 0 0%
Wood 0 0%
Yoakum 0 0%
Young 0 0%
Zapata 1 1%
Zavala 0 0%
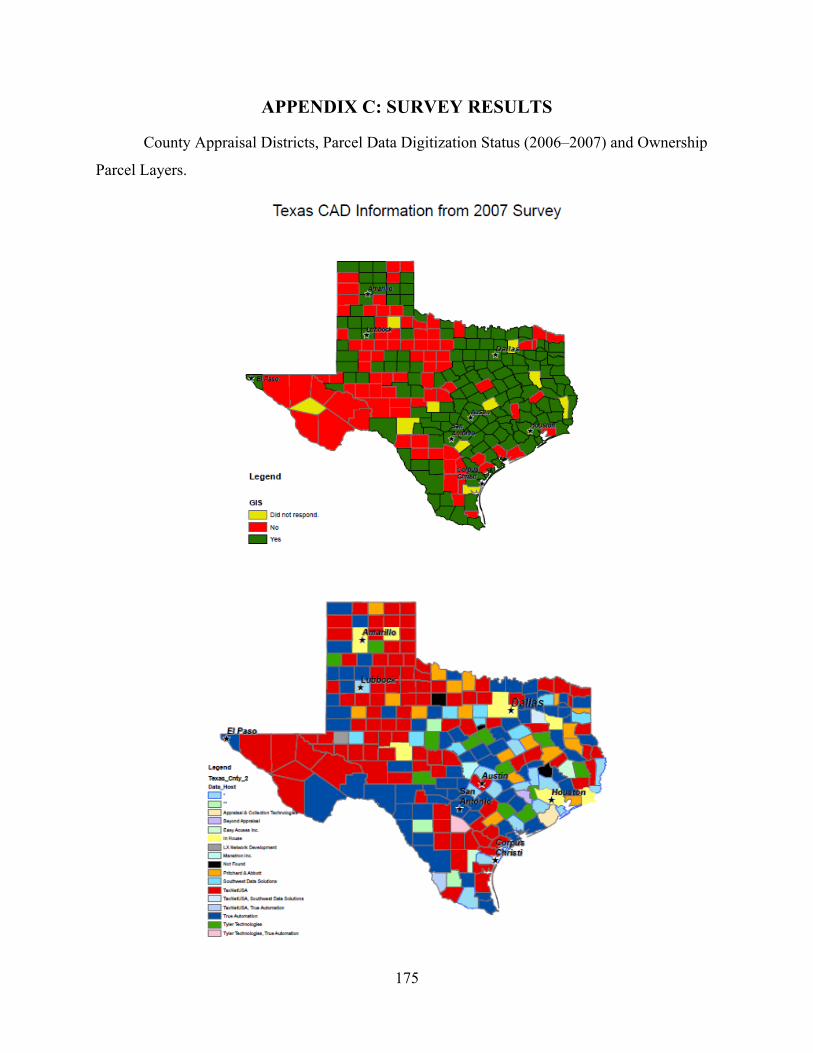
175
APPENDIX C: SURVEY RESULTS
County Appraisal Districts, Parcel Data Digitization Status (2006–2007) and Ownership
Parcel Layers.
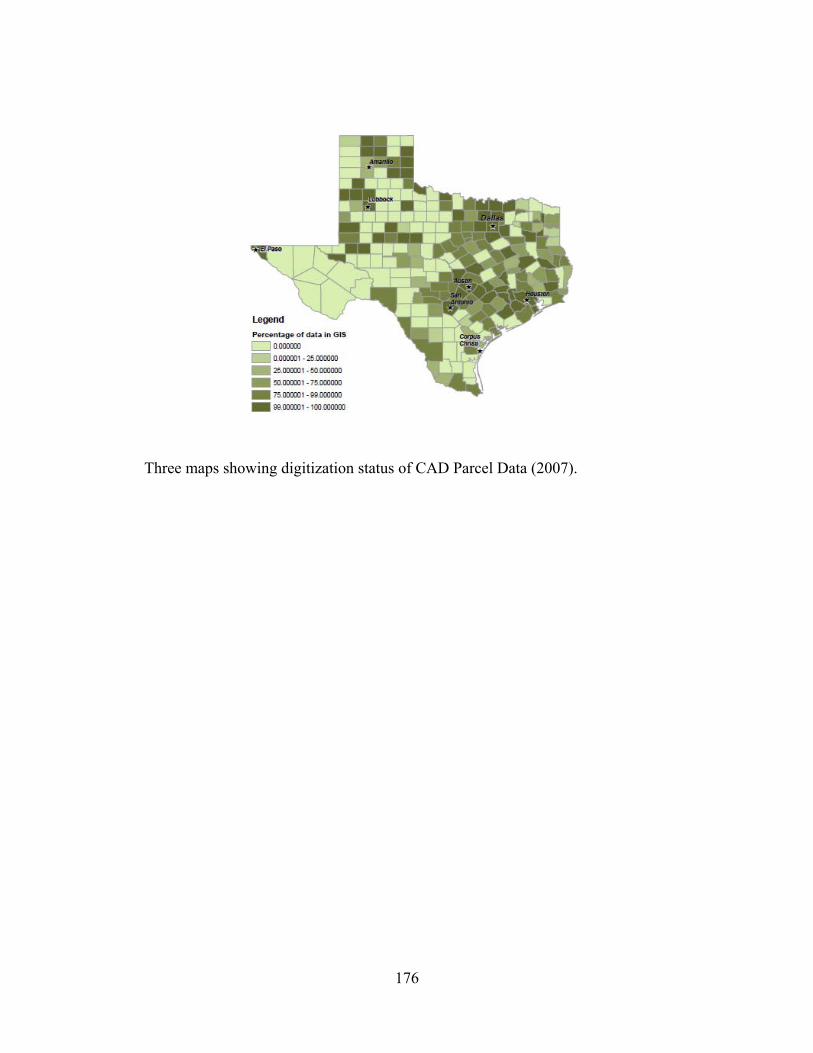
176
Three maps showing digitization status of CAD Parcel Data (2007).
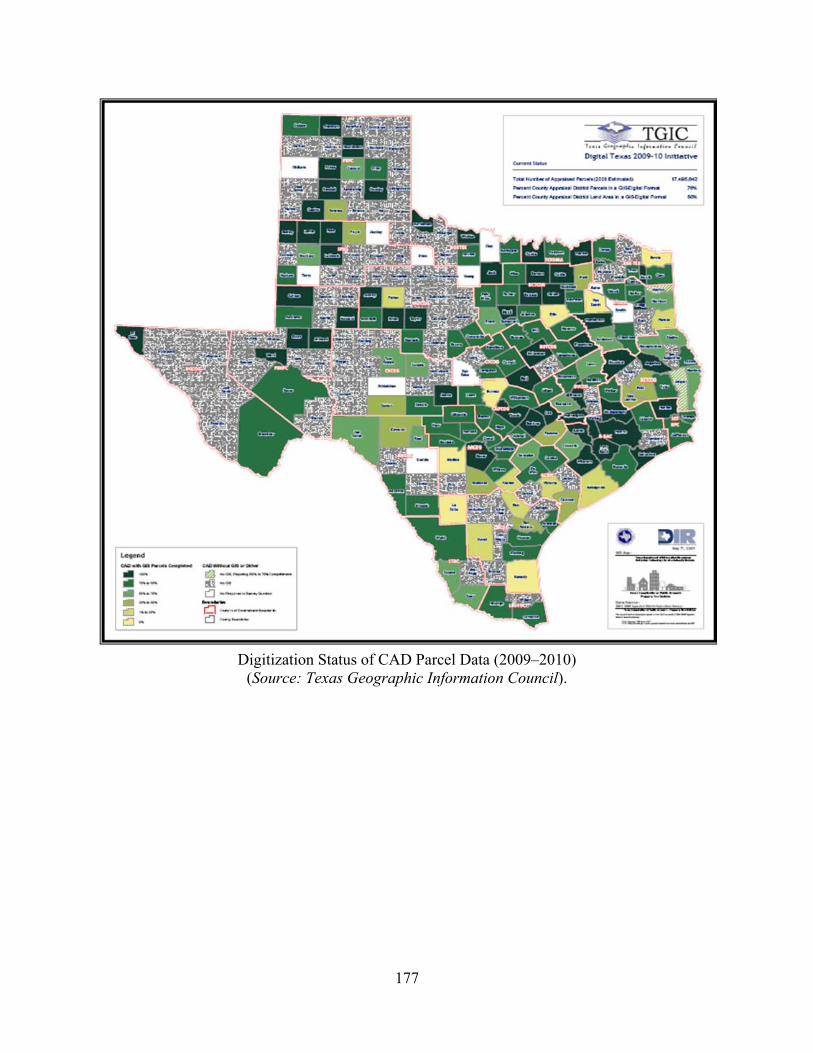
177
Digitization Status of CAD Parcel Data (2009–2010) (Source: Texas Geographic Information Council).
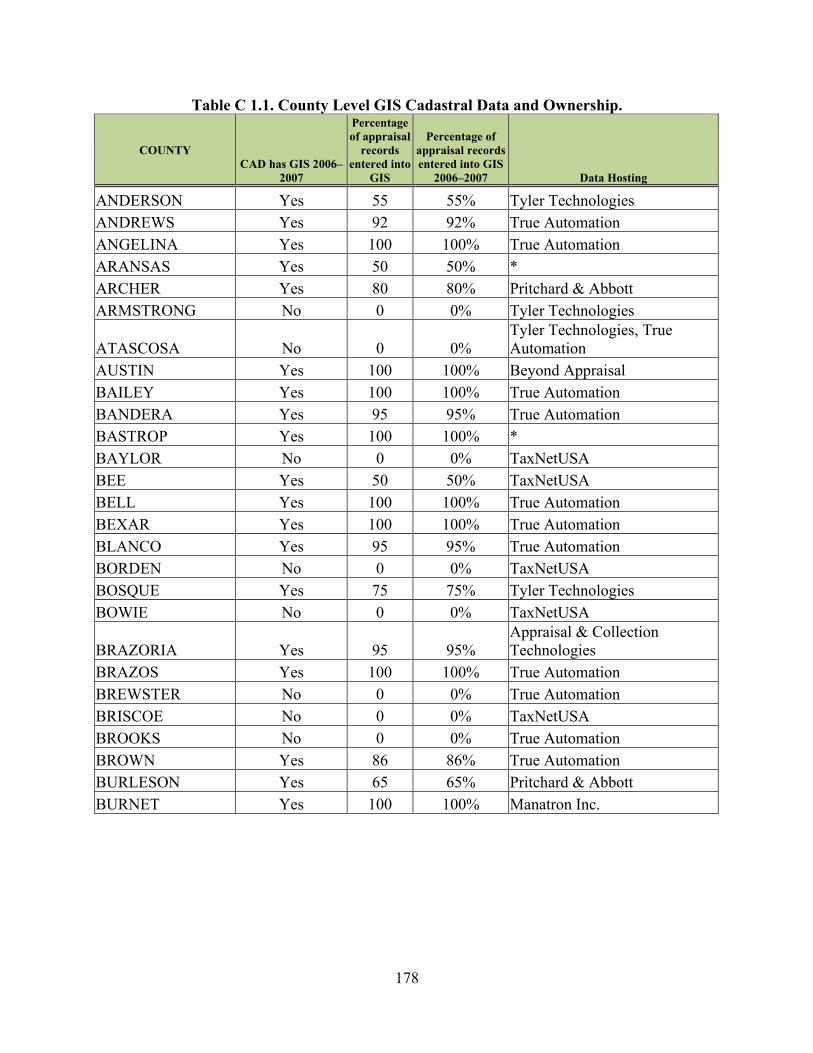
178
Table C 1.1. County Level GIS Cadastral Data and Ownership.
COUNTY CAD has GIS 2006–
2007
Percentage of appraisal
records entered into
GIS
Percentage of appraisal records entered into GIS
2006–2007 Data Hosting
ANDERSON Yes 55 55% Tyler Technologies ANDREWS Yes 92 92% True Automation ANGELINA Yes 100 100% True Automation ARANSAS Yes 50 50% * ARCHER Yes 80 80% Pritchard & Abbott ARMSTRONG No 0 0% Tyler Technologies
ATASCOSA No 0 0% Tyler Technologies, True Automation
AUSTIN Yes 100 100% Beyond Appraisal BAILEY Yes 100 100% True Automation BANDERA Yes 95 95% True Automation BASTROP Yes 100 100% * BAYLOR No 0 0% TaxNetUSA BEE Yes 50 50% TaxNetUSA BELL Yes 100 100% True Automation BEXAR Yes 100 100% True Automation BLANCO Yes 95 95% True Automation BORDEN No 0 0% TaxNetUSA BOSQUE Yes 75 75% Tyler Technologies BOWIE No 0 0% TaxNetUSA
BRAZORIA Yes 95 95% Appraisal & Collection Technologies
BRAZOS Yes 100 100% True Automation BREWSTER No 0 0% True Automation BRISCOE No 0 0% TaxNetUSA BROOKS No 0 0% True Automation BROWN Yes 86 86% True Automation BURLESON Yes 65 65% Pritchard & Abbott BURNET Yes 100 100% Manatron Inc.
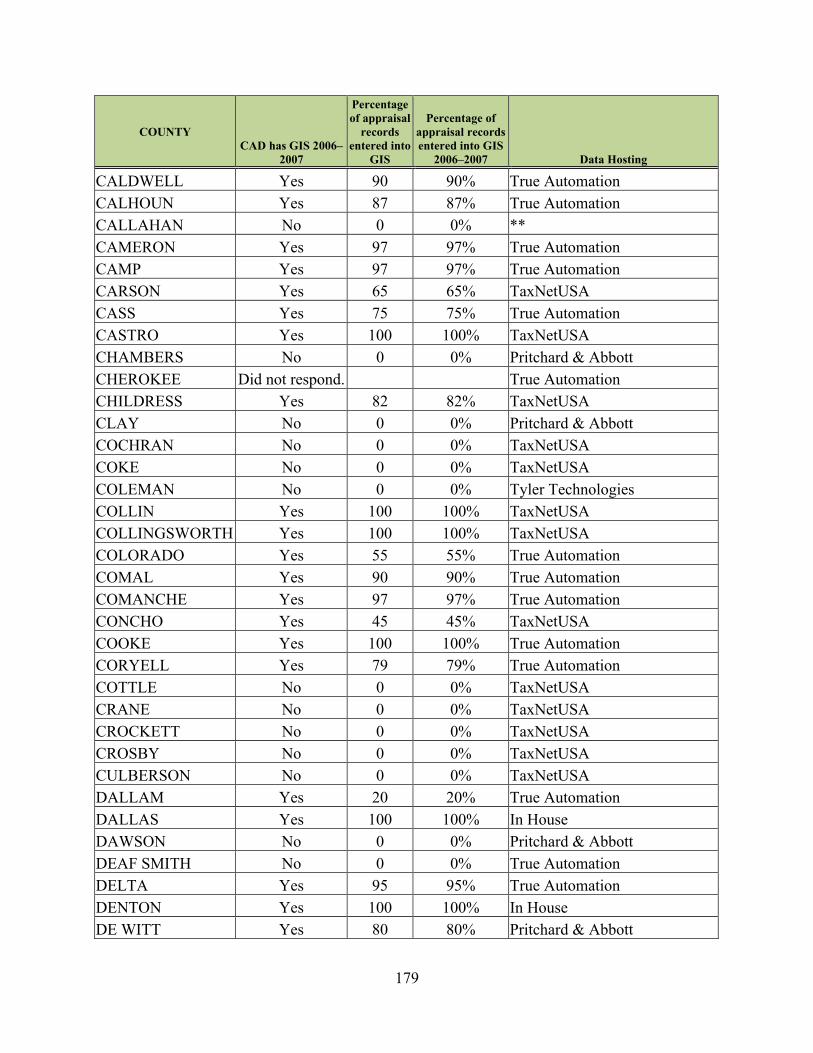
179
COUNTY CAD has GIS 2006–
2007
Percentage of appraisal
records entered into
GIS
Percentage of appraisal records entered into GIS
2006–2007 Data Hosting
CALDWELL Yes 90 90% True Automation CALHOUN Yes 87 87% True Automation CALLAHAN No 0 0% ** CAMERON Yes 97 97% True Automation CAMP Yes 97 97% True Automation CARSON Yes 65 65% TaxNetUSA CASS Yes 75 75% True Automation CASTRO Yes 100 100% TaxNetUSA CHAMBERS No 0 0% Pritchard & Abbott CHEROKEE Did not respond. True Automation CHILDRESS Yes 82 82% TaxNetUSA CLAY No 0 0% Pritchard & Abbott COCHRAN No 0 0% TaxNetUSA COKE No 0 0% TaxNetUSA COLEMAN No 0 0% Tyler Technologies COLLIN Yes 100 100% TaxNetUSA COLLINGSWORTH Yes 100 100% TaxNetUSA COLORADO Yes 55 55% True Automation COMAL Yes 90 90% True Automation COMANCHE Yes 97 97% True Automation CONCHO Yes 45 45% TaxNetUSA COOKE Yes 100 100% True Automation CORYELL Yes 79 79% True Automation COTTLE No 0 0% TaxNetUSA CRANE No 0 0% TaxNetUSA CROCKETT No 0 0% TaxNetUSA CROSBY No 0 0% TaxNetUSA CULBERSON No 0 0% TaxNetUSA DALLAM Yes 20 20% True Automation DALLAS Yes 100 100% In House DAWSON No 0 0% Pritchard & Abbott DEAF SMITH No 0 0% True Automation DELTA Yes 95 95% True Automation DENTON Yes 100 100% In House DE WITT Yes 80 80% Pritchard & Abbott
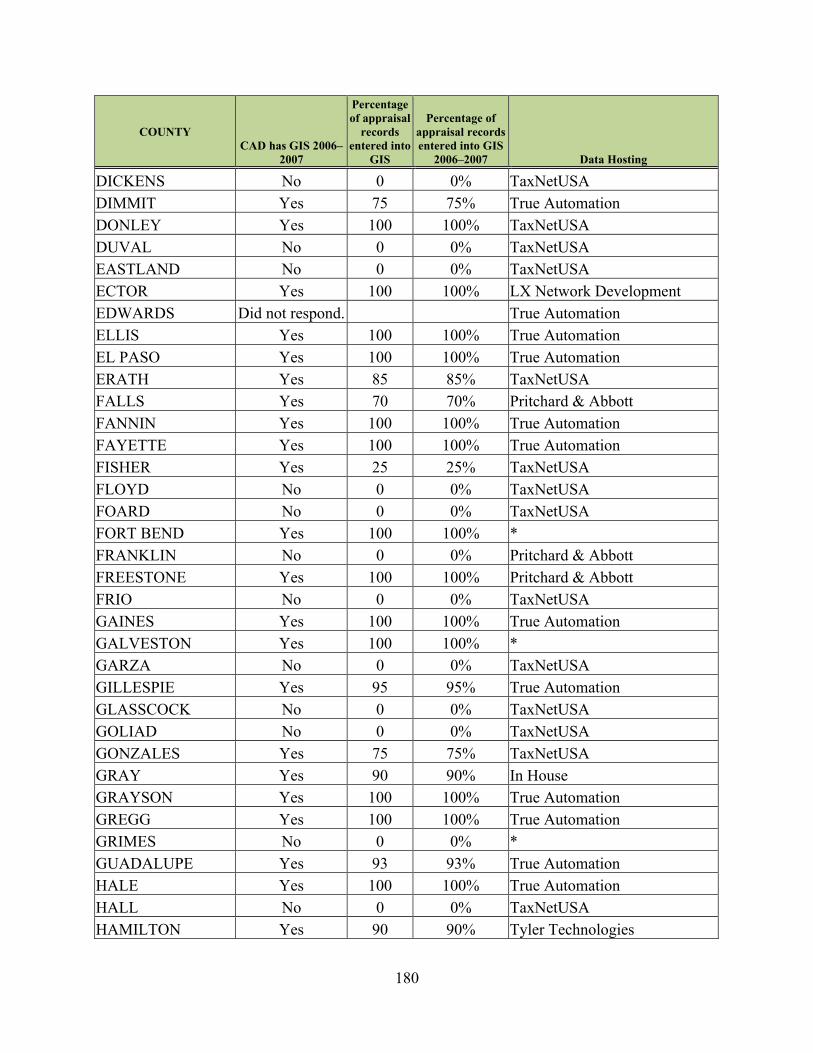
180
COUNTY CAD has GIS 2006–
2007
Percentage of appraisal
records entered into
GIS
Percentage of appraisal records entered into GIS
2006–2007 Data Hosting
DICKENS No 0 0% TaxNetUSA DIMMIT Yes 75 75% True Automation DONLEY Yes 100 100% TaxNetUSA DUVAL No 0 0% TaxNetUSA EASTLAND No 0 0% TaxNetUSA ECTOR Yes 100 100% LX Network Development EDWARDS Did not respond. True Automation ELLIS Yes 100 100% True Automation EL PASO Yes 100 100% True Automation ERATH Yes 85 85% TaxNetUSA FALLS Yes 70 70% Pritchard & Abbott FANNIN Yes 100 100% True Automation FAYETTE Yes 100 100% True Automation FISHER Yes 25 25% TaxNetUSA FLOYD No 0 0% TaxNetUSA FOARD No 0 0% TaxNetUSA FORT BEND Yes 100 100% * FRANKLIN No 0 0% Pritchard & Abbott FREESTONE Yes 100 100% Pritchard & Abbott FRIO No 0 0% TaxNetUSA GAINES Yes 100 100% True Automation GALVESTON Yes 100 100% * GARZA No 0 0% TaxNetUSA GILLESPIE Yes 95 95% True Automation GLASSCOCK No 0 0% TaxNetUSA GOLIAD No 0 0% TaxNetUSA GONZALES Yes 75 75% TaxNetUSA GRAY Yes 90 90% In House GRAYSON Yes 100 100% True Automation GREGG Yes 100 100% True Automation GRIMES No 0 0% * GUADALUPE Yes 93 93% True Automation HALE Yes 100 100% True Automation HALL No 0 0% TaxNetUSA HAMILTON Yes 90 90% Tyler Technologies
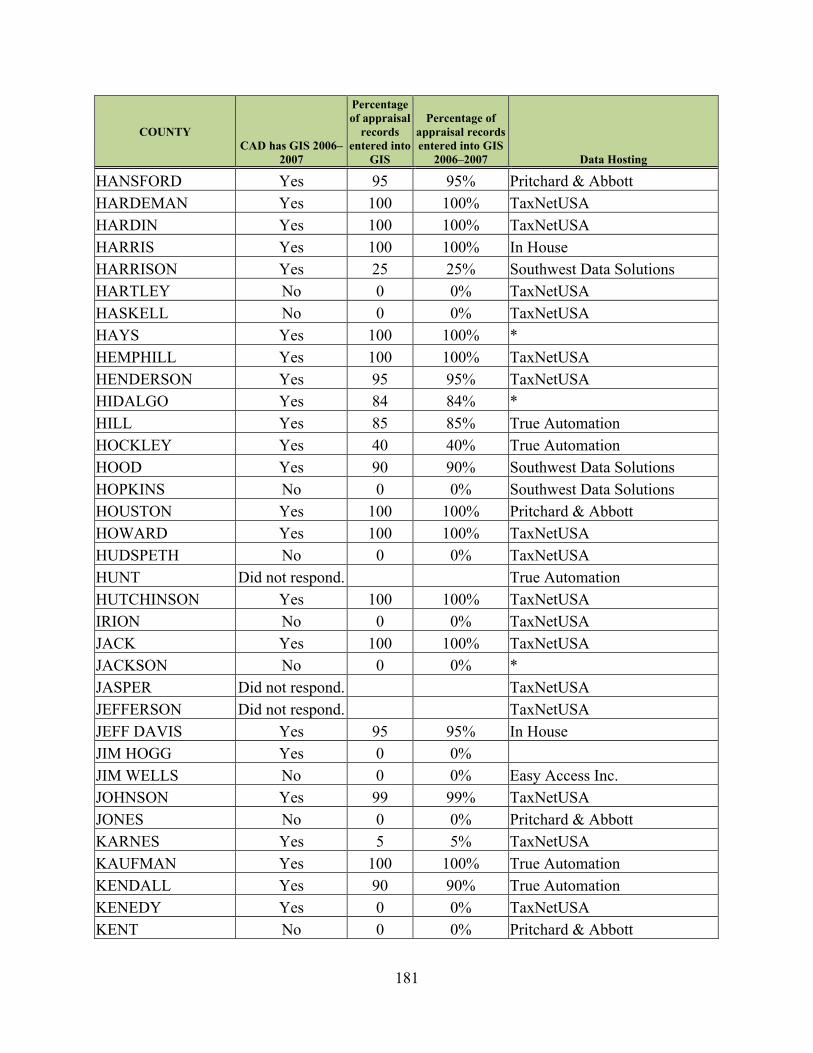
181
COUNTY CAD has GIS 2006–
2007
Percentage of appraisal
records entered into
GIS
Percentage of appraisal records entered into GIS
2006–2007 Data Hosting
HANSFORD Yes 95 95% Pritchard & Abbott HARDEMAN Yes 100 100% TaxNetUSA HARDIN Yes 100 100% TaxNetUSA HARRIS Yes 100 100% In House HARRISON Yes 25 25% Southwest Data Solutions HARTLEY No 0 0% TaxNetUSA HASKELL No 0 0% TaxNetUSA HAYS Yes 100 100% * HEMPHILL Yes 100 100% TaxNetUSA HENDERSON Yes 95 95% TaxNetUSA HIDALGO Yes 84 84% * HILL Yes 85 85% True Automation HOCKLEY Yes 40 40% True Automation HOOD Yes 90 90% Southwest Data Solutions HOPKINS No 0 0% Southwest Data Solutions HOUSTON Yes 100 100% Pritchard & Abbott HOWARD Yes 100 100% TaxNetUSA HUDSPETH No 0 0% TaxNetUSA HUNT Did not respond. True Automation HUTCHINSON Yes 100 100% TaxNetUSA IRION No 0 0% TaxNetUSA JACK Yes 100 100% TaxNetUSA JACKSON No 0 0% * JASPER Did not respond. TaxNetUSA JEFFERSON Did not respond. TaxNetUSA JEFF DAVIS Yes 95 95% In House JIM HOGG Yes 0 0% JIM WELLS No 0 0% Easy Access Inc. JOHNSON Yes 99 99% TaxNetUSA JONES No 0 0% Pritchard & Abbott KARNES Yes 5 5% TaxNetUSA KAUFMAN Yes 100 100% True Automation KENDALL Yes 90 90% True Automation KENEDY Yes 0 0% TaxNetUSA KENT No 0 0% Pritchard & Abbott
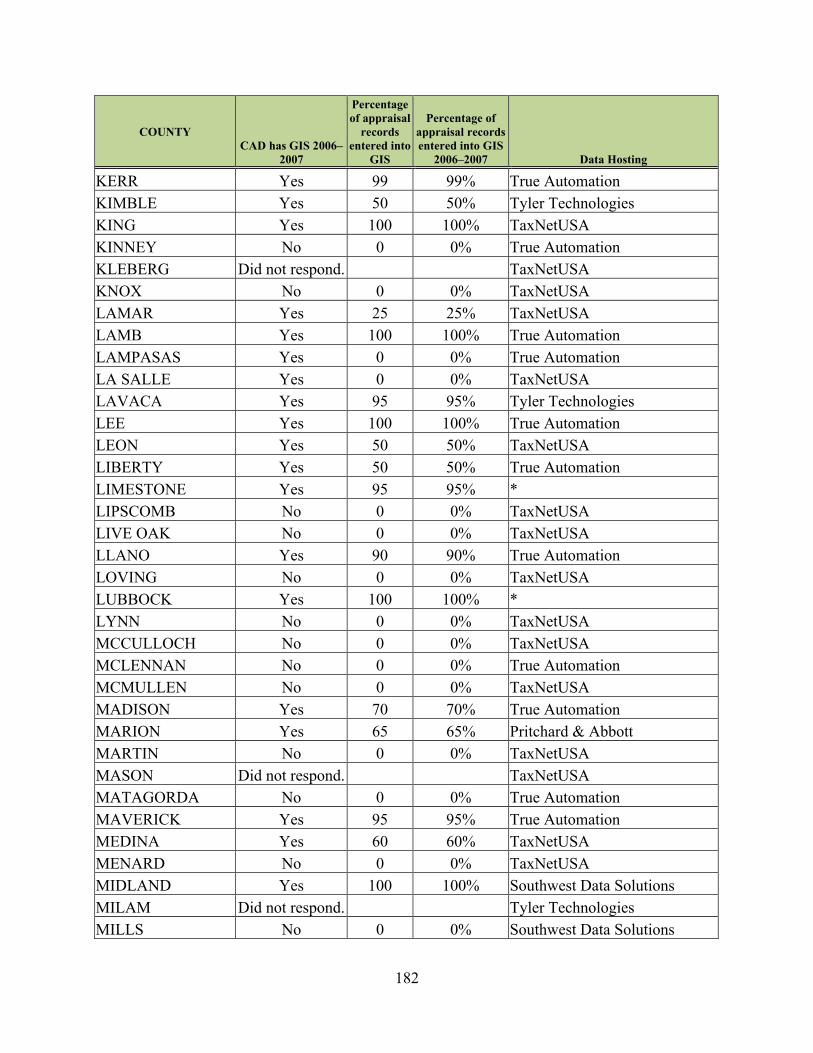
182
COUNTY CAD has GIS 2006–
2007
Percentage of appraisal
records entered into
GIS
Percentage of appraisal records entered into GIS
2006–2007 Data Hosting
KERR Yes 99 99% True Automation KIMBLE Yes 50 50% Tyler Technologies KING Yes 100 100% TaxNetUSA KINNEY No 0 0% True Automation KLEBERG Did not respond. TaxNetUSA KNOX No 0 0% TaxNetUSA LAMAR Yes 25 25% TaxNetUSA LAMB Yes 100 100% True Automation LAMPASAS Yes 0 0% True Automation LA SALLE Yes 0 0% TaxNetUSA LAVACA Yes 95 95% Tyler Technologies LEE Yes 100 100% True Automation LEON Yes 50 50% TaxNetUSA LIBERTY Yes 50 50% True Automation LIMESTONE Yes 95 95% * LIPSCOMB No 0 0% TaxNetUSA LIVE OAK No 0 0% TaxNetUSA LLANO Yes 90 90% True Automation LOVING No 0 0% TaxNetUSA LUBBOCK Yes 100 100% * LYNN No 0 0% TaxNetUSA MCCULLOCH No 0 0% TaxNetUSA MCLENNAN No 0 0% True Automation MCMULLEN No 0 0% TaxNetUSA MADISON Yes 70 70% True Automation MARION Yes 65 65% Pritchard & Abbott MARTIN No 0 0% TaxNetUSA MASON Did not respond. TaxNetUSA MATAGORDA No 0 0% True Automation MAVERICK Yes 95 95% True Automation MEDINA Yes 60 60% TaxNetUSA MENARD No 0 0% TaxNetUSA MIDLAND Yes 100 100% Southwest Data Solutions MILAM Did not respond. Tyler Technologies MILLS No 0 0% Southwest Data Solutions
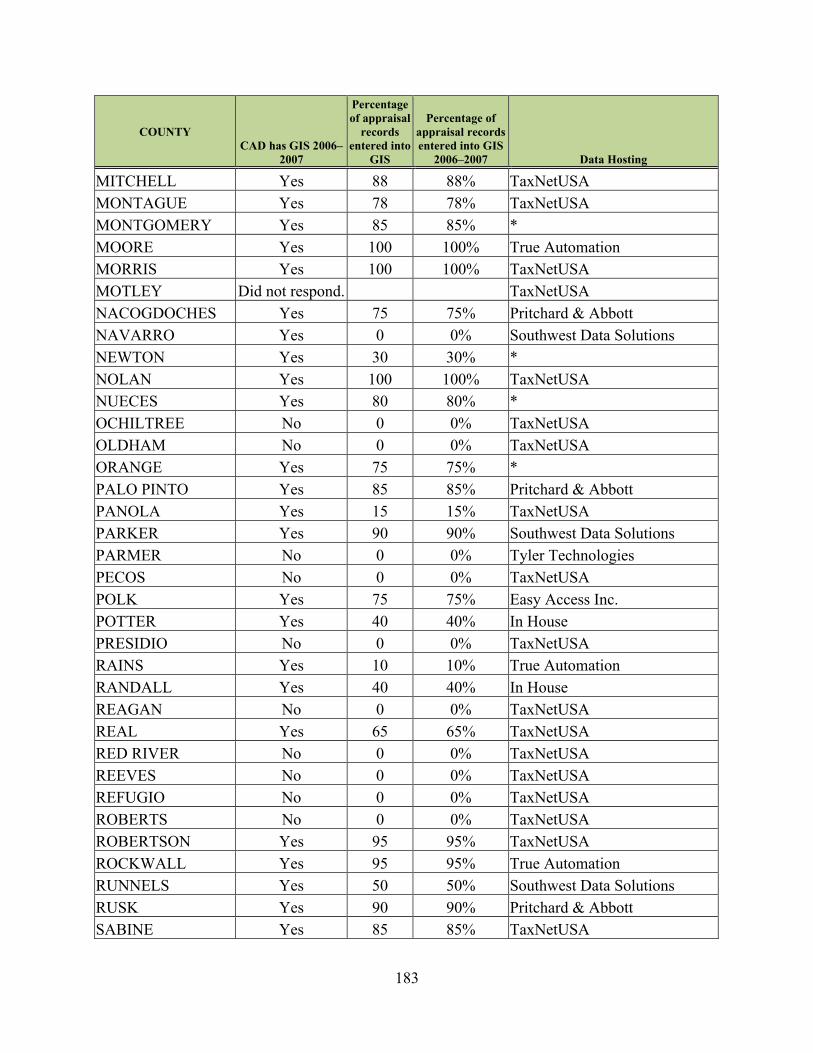
183
COUNTY CAD has GIS 2006–
2007
Percentage of appraisal
records entered into
GIS
Percentage of appraisal records entered into GIS
2006–2007 Data Hosting
MITCHELL Yes 88 88% TaxNetUSA MONTAGUE Yes 78 78% TaxNetUSA MONTGOMERY Yes 85 85% * MOORE Yes 100 100% True Automation MORRIS Yes 100 100% TaxNetUSA MOTLEY Did not respond. TaxNetUSA NACOGDOCHES Yes 75 75% Pritchard & Abbott NAVARRO Yes 0 0% Southwest Data Solutions NEWTON Yes 30 30% * NOLAN Yes 100 100% TaxNetUSA NUECES Yes 80 80% * OCHILTREE No 0 0% TaxNetUSA OLDHAM No 0 0% TaxNetUSA ORANGE Yes 75 75% * PALO PINTO Yes 85 85% Pritchard & Abbott PANOLA Yes 15 15% TaxNetUSA PARKER Yes 90 90% Southwest Data Solutions PARMER No 0 0% Tyler Technologies PECOS No 0 0% TaxNetUSA POLK Yes 75 75% Easy Access Inc. POTTER Yes 40 40% In House PRESIDIO No 0 0% TaxNetUSA RAINS Yes 10 10% True Automation RANDALL Yes 40 40% In House REAGAN No 0 0% TaxNetUSA REAL Yes 65 65% TaxNetUSA RED RIVER No 0 0% TaxNetUSA REEVES No 0 0% TaxNetUSA REFUGIO No 0 0% TaxNetUSA ROBERTS No 0 0% TaxNetUSA ROBERTSON Yes 95 95% TaxNetUSA ROCKWALL Yes 95 95% True Automation RUNNELS Yes 50 50% Southwest Data Solutions RUSK Yes 90 90% Pritchard & Abbott SABINE Yes 85 85% TaxNetUSA
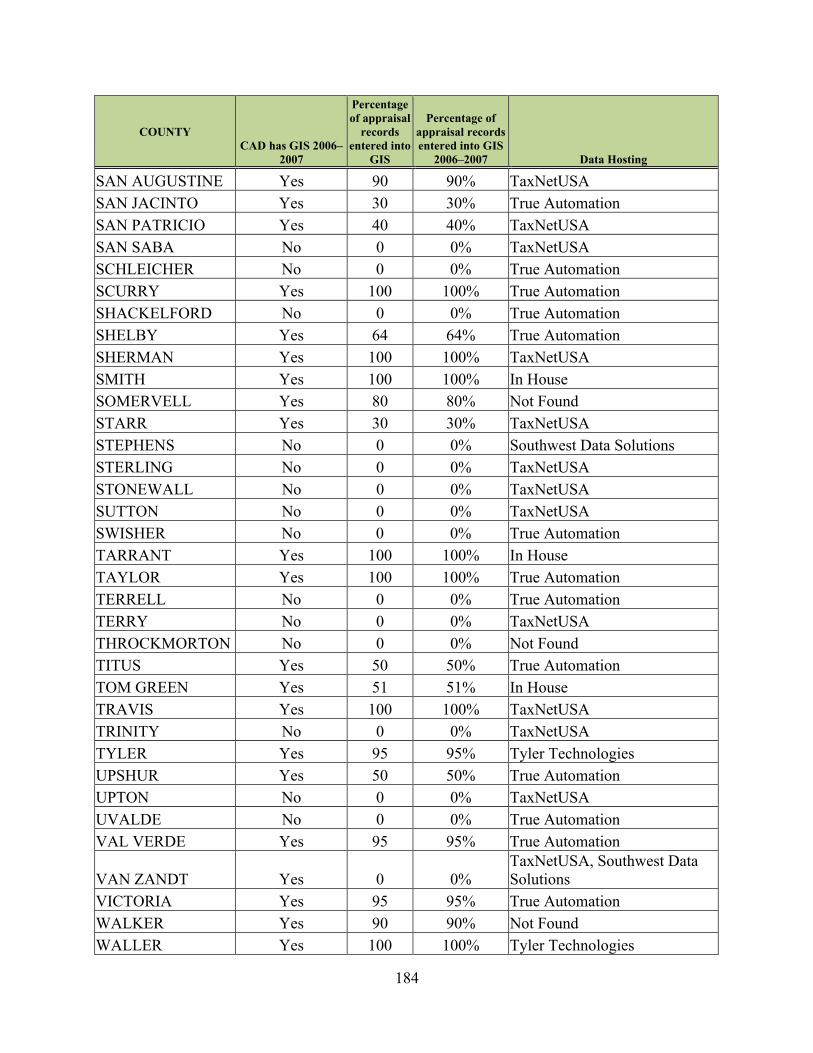
184
COUNTY CAD has GIS 2006–
2007
Percentage of appraisal
records entered into
GIS
Percentage of appraisal records entered into GIS
2006–2007 Data Hosting
SAN AUGUSTINE Yes 90 90% TaxNetUSA SAN JACINTO Yes 30 30% True Automation SAN PATRICIO Yes 40 40% TaxNetUSA SAN SABA No 0 0% TaxNetUSA SCHLEICHER No 0 0% True Automation SCURRY Yes 100 100% True Automation SHACKELFORD No 0 0% True Automation SHELBY Yes 64 64% True Automation SHERMAN Yes 100 100% TaxNetUSA SMITH Yes 100 100% In House SOMERVELL Yes 80 80% Not Found STARR Yes 30 30% TaxNetUSA STEPHENS No 0 0% Southwest Data Solutions STERLING No 0 0% TaxNetUSA STONEWALL No 0 0% TaxNetUSA SUTTON No 0 0% TaxNetUSA SWISHER No 0 0% True Automation TARRANT Yes 100 100% In House TAYLOR Yes 100 100% True Automation TERRELL No 0 0% True Automation TERRY No 0 0% TaxNetUSA THROCKMORTON No 0 0% Not Found TITUS Yes 50 50% True Automation TOM GREEN Yes 51 51% In House TRAVIS Yes 100 100% TaxNetUSA TRINITY No 0 0% TaxNetUSA TYLER Yes 95 95% Tyler Technologies UPSHUR Yes 50 50% True Automation UPTON No 0 0% TaxNetUSA UVALDE No 0 0% True Automation VAL VERDE Yes 95 95% True Automation
VAN ZANDT Yes 0 0% TaxNetUSA, Southwest Data Solutions
VICTORIA Yes 95 95% True Automation WALKER Yes 90 90% Not Found WALLER Yes 100 100% Tyler Technologies
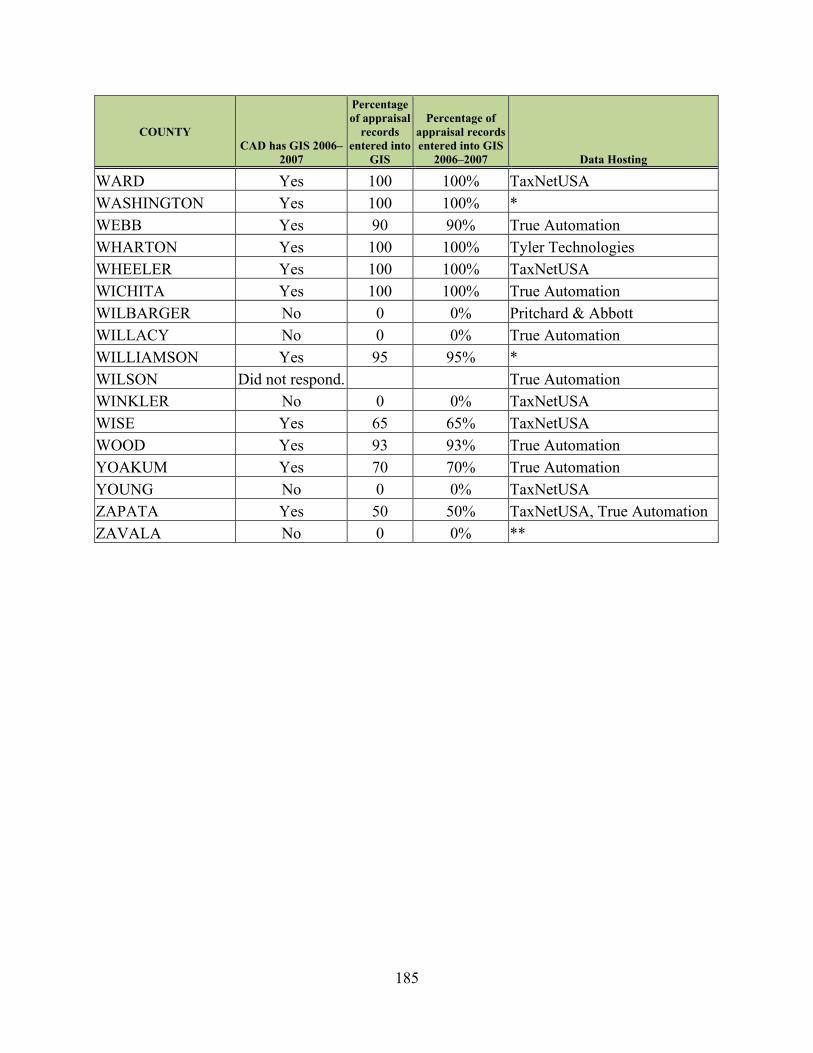
185
COUNTY CAD has GIS 2006–
2007
Percentage of appraisal
records entered into
GIS
Percentage of appraisal records entered into GIS
2006–2007 Data Hosting
WARD Yes 100 100% TaxNetUSA WASHINGTON Yes 100 100% * WEBB Yes 90 90% True Automation WHARTON Yes 100 100% Tyler Technologies WHEELER Yes 100 100% TaxNetUSA WICHITA Yes 100 100% True Automation WILBARGER No 0 0% Pritchard & Abbott WILLACY No 0 0% True Automation WILLIAMSON Yes 95 95% * WILSON Did not respond. True Automation WINKLER No 0 0% TaxNetUSA WISE Yes 65 65% TaxNetUSA WOOD Yes 93 93% True Automation YOAKUM Yes 70 70% True Automation YOUNG No 0 0% TaxNetUSA ZAPATA Yes 50 50% TaxNetUSA, True Automation ZAVALA No 0 0% **

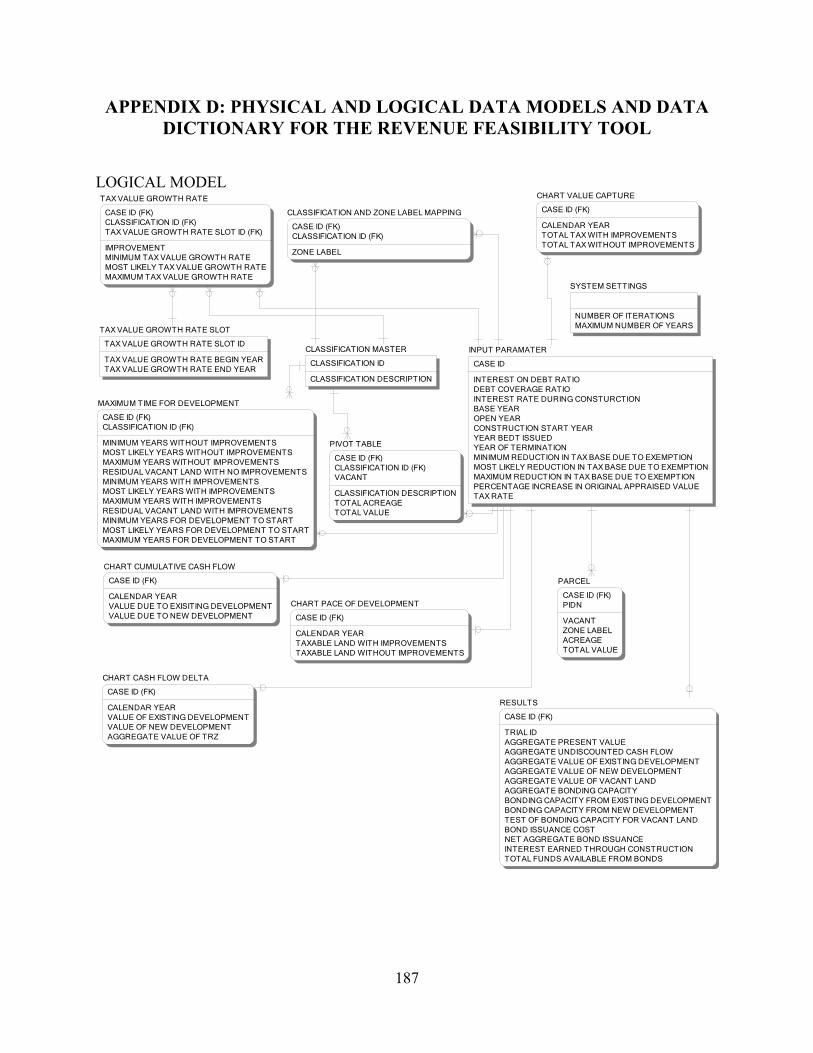
187
APPENDIX D: PHYSICAL AND LOGICAL DATA MODELS AND DATA DICTIONARY FOR THE REVENUE FEASIBILITY TOOL
LOGICAL MODEL
CHART CASH FLOW DELTA
CASE ID (FK)
CALENDAR YEARVALUE OF EXISTING DEVELOPMENTVALUE OF NEW DEVELOPMENTAGGREGATE VALUE OF TRZ
CHART CUMULATIVE CASH FLOW
CASE ID (FK)
CALENDAR YEARVALUE DUE TO EXISITING DEVELOPMENTVALUE DUE TO NEW DEVELOPMENT
CHART PACE OF DEVELOPMENT
CASE ID (FK)
CALENDAR YEARTAXABLE LAND WITH IMPROVEMENTSTAXABLE LAND WITHOUT IMPROVEMENTS
CHART VALUE CAPTURE
CASE ID (FK)
CALENDAR YEARTOTAL TAX WITH IMPROVEMENTSTOTAL TAX WITHOUT IMPROVEMENTS
CLASSIFICATION MASTER
CLASSIFICATION ID
CLASSIFICATION DESCRIPTION
CLASSIFICATION AND ZONE LABEL MAPPING
CASE ID (FK)CLASSIFICATION ID (FK)
ZONE LABEL
INPUT PARAMATER
CASE ID
INTEREST ON DEBT RATIODEBT COVERAGE RATIOINTEREST RATE DURING CONSTURCTIONBASE YEAROPEN YEARCONSTRUCTION START YEARYEAR BEDT ISSUEDYEAR OF TERMINATIONMINIMUM REDUCTION IN TAX BASE DUE TO EXEMPTIONMOST LIKELY REDUCTION IN TAX BASE DUE TO EXEMPTIONMAXIMUM REDUCTION IN TAX BASE DUE TO EXEMPTIONPERCENTAGE INCREASE IN ORIGINAL APPRAISED VALUETAX RATE
MAXIMUM TIME FOR DEVELOPMENT
CASE ID (FK)CLASSIFICATION ID (FK)
MINIMUM YEARS WITHOUT IMPROVEMENTSMOST LIKELY YEARS WITHOUT IMPROVEMENTSMAXIMUM YEARS WITHOUT IMPROVEMENTSRESIDUAL VACANT LAND WITH NO IMPROVEMENTSMINIMUM YEARS WITH IMPROVEMENTSMOST LIKELY YEARS WITH IMPROVEMENTSMAXIMUM YEARS WITH IMPROVEMENTSRESIDUAL VACANT LAND WITH IMPROVEMENTSMINIMUM YEARS FOR DEVELOPMENT TO STARTMOST LIKELY YEARS FOR DEVELOPMENT TO STARTMAXIMUM YEARS FOR DEVELOPMENT TO START
PARCEL
CASE ID (FK)PIDN
VACANTZONE LABELACREAGETOTAL VALUE
PIVOT TABLE
CASE ID (FK)CLASSIFICATION ID (FK)VACANT
CLASSIFICATION DESCRIPTIONTOTAL ACREAGETOTAL VALUE
RESULTS
CASE ID (FK)
TRIAL IDAGGREGATE PRESENT VALUEAGGREGATE UNDISCOUNTED CASH FLOWAGGREGATE VALUE OF EXISTING DEVELOPMENTAGGREGATE VALUE OF NEW DEVELOPMENTAGGREGATE VALUE OF VACANT LANDAGGREGATE BONDING CAPACITYBONDING CAPACITY FROM EXISTING DEVELOPMENTBONDING CAPACITY FROM NEW DEVELOPMENTTEST OF BONDING CAPACITY FOR VACANT LANDBOND ISSUANCE COSTNET AGGREGATE BOND ISSUANCEINTEREST EARNED THROUGH CONSTRUCTIONTOTAL FUNDS AVAILABLE FROM BONDS
SYSTEM SETTINGS
NUMBER OF ITERATIONSMAXIMUM NUMBER OF YEARS
TAX VALUE GROWTH RATE
CASE ID (FK)CLASSIFICATION ID (FK)TAX VALUE GROWTH RATE SLOT ID (FK)
IMPROVEMENTMINIMUM TAX VALUE GROWTH RATEMOST LIKELY TAX VALUE GROWTH RATEMAXIMUM TAX VALUE GROWTH RATE
TAX VALUE GROWTH RATE SLOT
TAX VALUE GROWTH RATE SLOT ID
TAX VALUE GROWTH RATE BEGIN YEARTAX VALUE GROWTH RATE END YEAR
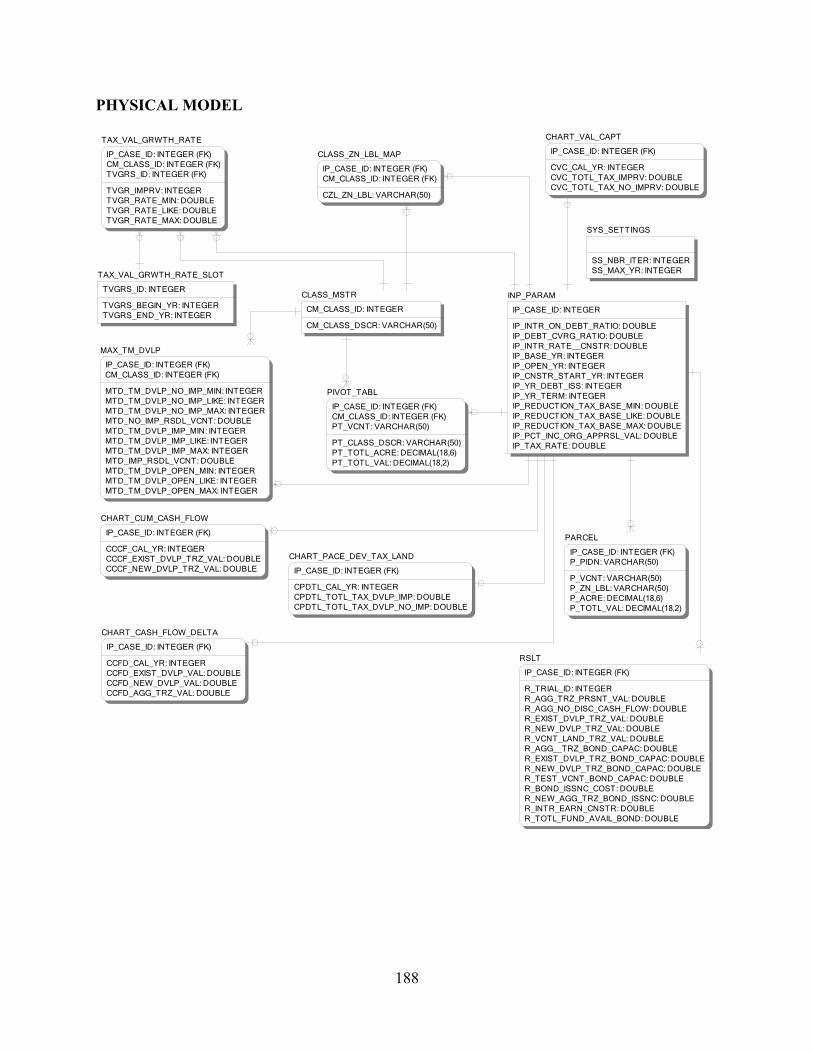
188
PHYSICAL MODEL
CHART_CASH_FLOW_DELTA
IP_CASE_ID: INTEGER (FK)
CCFD_CAL_YR: INTEGERCCFD_EXIST_DVLP_VAL: DOUBLECCFD_NEW_DVLP_VAL: DOUBLECCFD_AGG_TRZ_VAL: DOUBLE
CHART_CUM_CASH_FLOW
IP_CASE_ID: INTEGER (FK)
CCCF_CAL_YR: INTEGERCCCF_EXIST_DVLP_TRZ_VAL: DOUBLECCCF_NEW_DVLP_TRZ_VAL: DOUBLE
CHART_PACE_DEV_TAX_LAND
IP_CASE_ID: INTEGER (FK)
CPDTL_CAL_YR: INTEGERCPDTL_TOTL_TAX_DVLP_IMP: DOUBLECPDTL_TOTL_TAX_DVLP_NO_IMP: DOUBLE
CHART_VAL_CAPT
IP_CASE_ID: INTEGER (FK)
CVC_CAL_YR: INTEGERCVC_TOTL_TAX_IMPRV: DOUBLECVC_TOTL_TAX_NO_IMPRV: DOUBLE
CLASS_MSTR
CM_CLASS_ID: INTEGER
CM_CLASS_DSCR: VARCHAR(50)
CLASS_ZN_LBL_MAP
IP_CASE_ID: INTEGER (FK)CM_CLASS_ID: INTEGER (FK)
CZL_ZN_LBL: VARCHAR(50)
INP_PARAM
IP_CASE_ID: INTEGER
IP_INTR_ON_DEBT_RATIO: DOUBLEIP_DEBT_CVRG_RATIO: DOUBLEIP_INTR_RATE__CNSTR: DOUBLEIP_BASE_YR: INTEGERIP_OPEN_YR: INTEGERIP_CNSTR_START_YR: INTEGERIP_YR_DEBT_ISS: INTEGERIP_YR_TERM: INTEGERIP_REDUCTION_TAX_BASE_MIN: DOUBLEIP_REDUCTION_TAX_BASE_LIKE: DOUBLEIP_REDUCTION_TAX_BASE_MAX: DOUBLEIP_PCT_INC_ORG_APPRSL_VAL: DOUBLEIP_TAX_RATE: DOUBLE
MAX_TM_DVLP
IP_CASE_ID: INTEGER (FK)CM_CLASS_ID: INTEGER (FK)
MTD_TM_DVLP_NO_IMP_MIN: INTEGERMTD_TM_DVLP_NO_IMP_LIKE: INTEGERMTD_TM_DVLP_NO_IMP_MAX: INTEGERMTD_NO_IMP_RSDL_VCNT: DOUBLEMTD_TM_DVLP_IMP_MIN: INTEGERMTD_TM_DVLP_IMP_LIKE: INTEGERMTD_TM_DVLP_IMP_MAX: INTEGERMTD_IMP_RSDL_VCNT: DOUBLEMTD_TM_DVLP_OPEN_MIN: INTEGERMTD_TM_DVLP_OPEN_LIKE: INTEGERMTD_TM_DVLP_OPEN_MAX: INTEGER
PARCEL
IP_CASE_ID: INTEGER (FK)P_PIDN: VARCHAR(50)
P_VCNT: VARCHAR(50)P_ZN_LBL: VARCHAR(50)P_ACRE: DECIMAL(18,6)P_TOTL_VAL: DECIMAL(18,2)
PIVOT_TABL
IP_CASE_ID: INTEGER (FK)CM_CLASS_ID: INTEGER (FK)PT_VCNT: VARCHAR(50)
PT_CLASS_DSCR: VARCHAR(50)PT_TOTL_ACRE: DECIMAL(18,6)PT_TOTL_VAL: DECIMAL(18,2)
RSLT
IP_CASE_ID: INTEGER (FK)
R_TRIAL_ID: INTEGERR_AGG_TRZ_PRSNT_VAL: DOUBLER_AGG_NO_DISC_CASH_FLOW: DOUBLER_EXIST_DVLP_TRZ_VAL: DOUBLER_NEW_DVLP_TRZ_VAL: DOUBLER_VCNT_LAND_TRZ_VAL: DOUBLER_AGG__TRZ_BOND_CAPAC: DOUBLER_EXIST_DVLP_TRZ_BOND_CAPAC: DOUBLER_NEW_DVLP_TRZ_BOND_CAPAC: DOUBLER_TEST_VCNT_BOND_CAPAC: DOUBLER_BOND_ISSNC_COST: DOUBLER_NEW_AGG_TRZ_BOND_ISSNC: DOUBLER_INTR_EARN_CNSTR: DOUBLER_TOTL_FUND_AVAIL_BOND: DOUBLE
SYS_SETTINGS
SS_NBR_ITER: INTEGERSS_MAX_YR: INTEGER
TAX_VAL_GRWTH_RATE
IP_CASE_ID: INTEGER (FK)CM_CLASS_ID: INTEGER (FK)TVGRS_ID: INTEGER (FK)
TVGR_IMPRV: INTEGERTVGR_RATE_MIN: DOUBLETVGR_RATE_LIKE: DOUBLETVGR_RATE_MAX: DOUBLE
TAX_VAL_GRWTH_RATE_SLOT
TVGRS_ID: INTEGER
TVGRS_BEGIN_YR: INTEGERTVGRS_END_YR: INTEGER
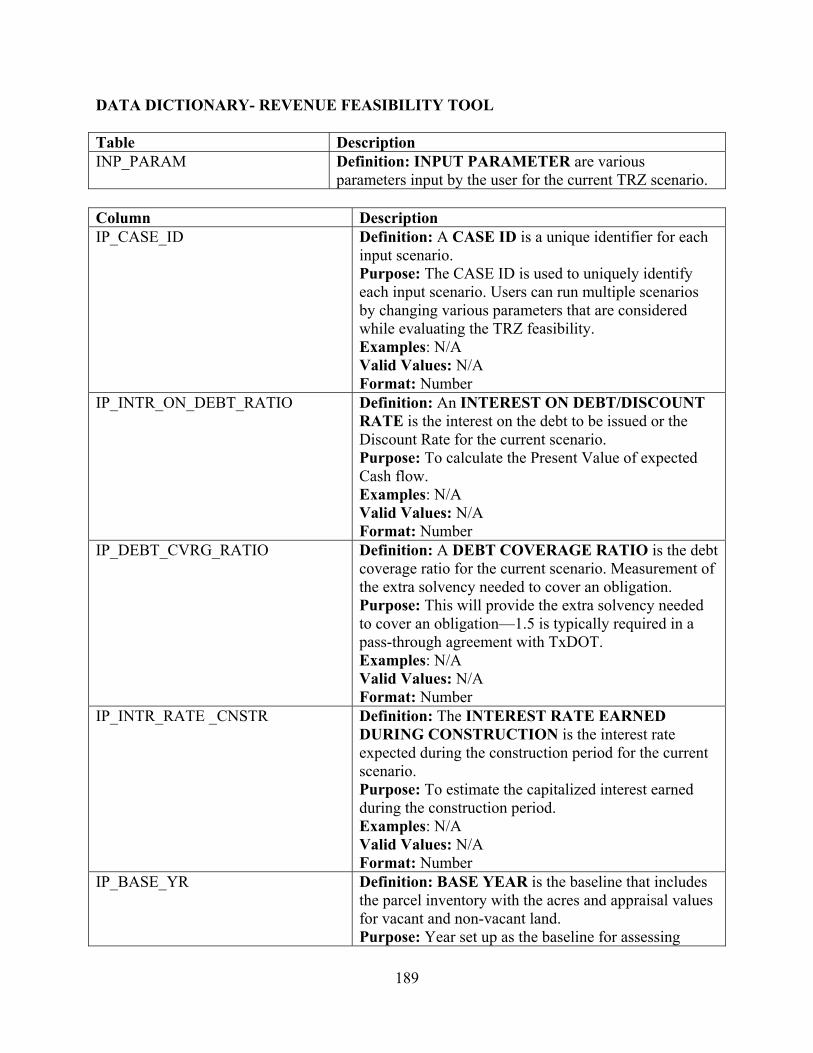
189
DATA DICTIONARY- REVENUE FEASIBILITY TOOL Table Description INP_PARAM Definition: INPUT PARAMETER are various
parameters input by the user for the current TRZ scenario. Column Description IP_CASE_ID Definition: A CASE ID is a unique identifier for each
input scenario. Purpose: The CASE ID is used to uniquely identify each input scenario. Users can run multiple scenarios by changing various parameters that are considered while evaluating the TRZ feasibility. Examples: N/A Valid Values: N/A Format: Number
IP_INTR_ON_DEBT_RATIO Definition: An INTEREST ON DEBT/DISCOUNT RATE is the interest on the debt to be issued or the Discount Rate for the current scenario. Purpose: To calculate the Present Value of expected Cash flow. Examples: N/A Valid Values: N/A Format: Number
IP_DEBT_CVRG_RATIO Definition: A DEBT COVERAGE RATIO is the debt coverage ratio for the current scenario. Measurement of the extra solvency needed to cover an obligation. Purpose: This will provide the extra solvency needed to cover an obligation—1.5 is typically required in a pass-through agreement with TxDOT. Examples: N/A Valid Values: N/A Format: Number
IP_INTR_RATE _CNSTR Definition: The INTEREST RATE EARNED DURING CONSTRUCTION is the interest rate expected during the construction period for the current scenario. Purpose: To estimate the capitalized interest earned during the construction period. Examples: N/A Valid Values: N/A Format: Number
IP_BASE_YR Definition: BASE YEAR is the baseline that includes the parcel inventory with the acres and appraisal values for vacant and non-vacant land. Purpose: Year set up as the baseline for assessing
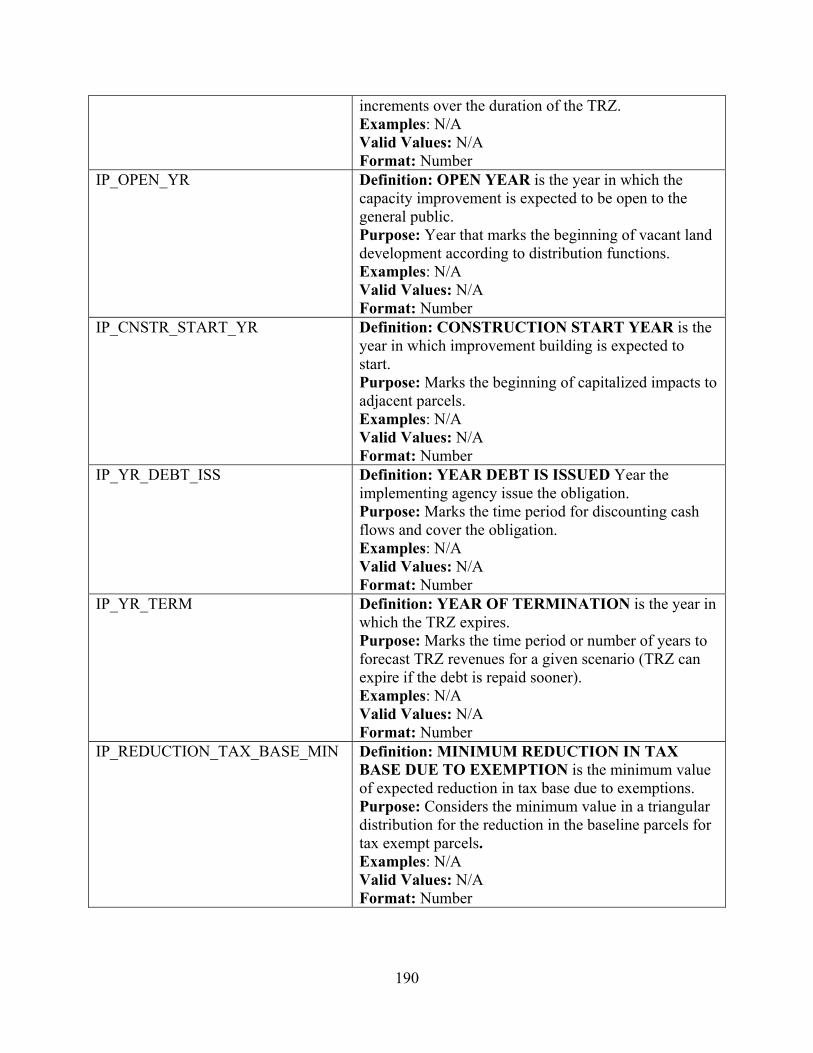
190
increments over the duration of the TRZ. Examples: N/A Valid Values: N/A Format: Number
IP_OPEN_YR Definition: OPEN YEAR is the year in which the capacity improvement is expected to be open to the general public. Purpose: Year that marks the beginning of vacant land development according to distribution functions. Examples: N/A Valid Values: N/A Format: Number
IP_CNSTR_START_YR Definition: CONSTRUCTION START YEAR is the year in which improvement building is expected to start. Purpose: Marks the beginning of capitalized impacts to adjacent parcels. Examples: N/A Valid Values: N/A Format: Number
IP_YR_DEBT_ISS Definition: YEAR DEBT IS ISSUED Year the implementing agency issue the obligation. Purpose: Marks the time period for discounting cash flows and cover the obligation. Examples: N/A Valid Values: N/A Format: Number
IP_YR_TERM Definition: YEAR OF TERMINATION is the year in which the TRZ expires. Purpose: Marks the time period or number of years to forecast TRZ revenues for a given scenario (TRZ can expire if the debt is repaid sooner). Examples: N/A Valid Values: N/A Format: Number
IP_REDUCTION_TAX_BASE_MIN Definition: MINIMUM REDUCTION IN TAX BASE DUE TO EXEMPTION is the minimum value of expected reduction in tax base due to exemptions. Purpose: Considers the minimum value in a triangular distribution for the reduction in the baseline parcels for tax exempt parcels. Examples: N/A Valid Values: N/A Format: Number
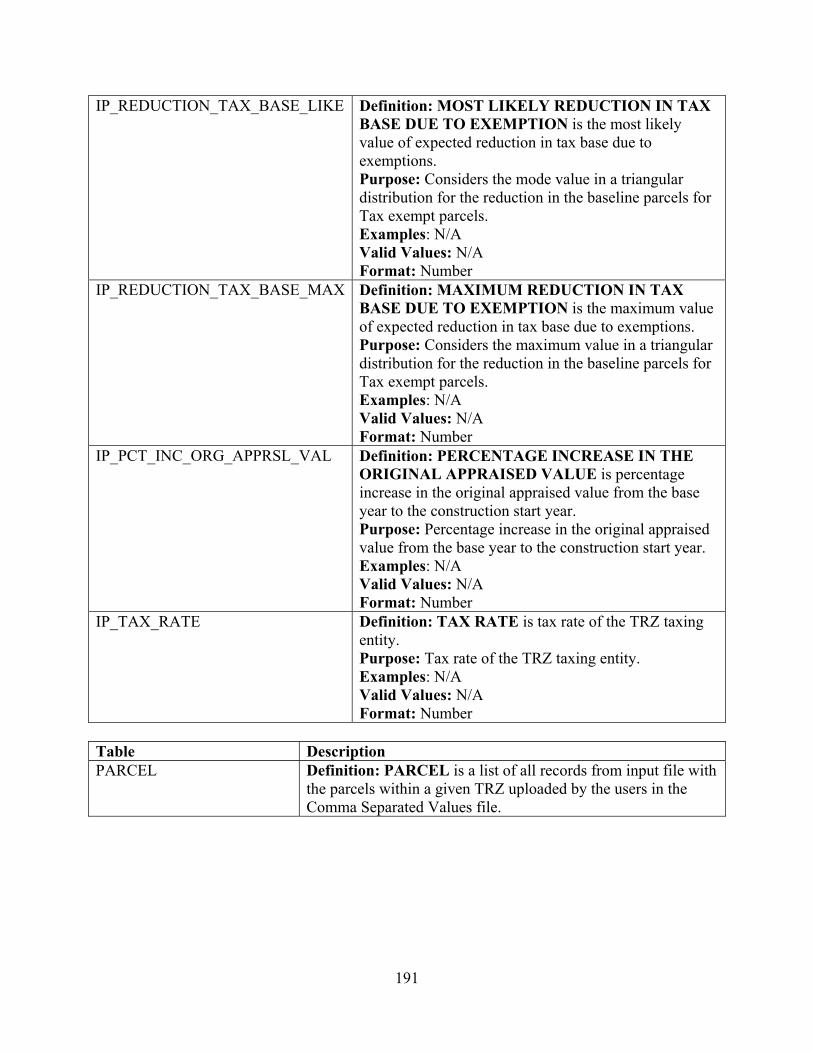
191
IP_REDUCTION_TAX_BASE_LIKE Definition: MOST LIKELY REDUCTION IN TAX BASE DUE TO EXEMPTION is the most likely value of expected reduction in tax base due to exemptions. Purpose: Considers the mode value in a triangular distribution for the reduction in the baseline parcels for Tax exempt parcels. Examples: N/A Valid Values: N/A Format: Number
IP_REDUCTION_TAX_BASE_MAX Definition: MAXIMUM REDUCTION IN TAX BASE DUE TO EXEMPTION is the maximum value of expected reduction in tax base due to exemptions. Purpose: Considers the maximum value in a triangular distribution for the reduction in the baseline parcels for Tax exempt parcels. Examples: N/A Valid Values: N/A Format: Number
IP_PCT_INC_ORG_APPRSL_VAL Definition: PERCENTAGE INCREASE IN THE ORIGINAL APPRAISED VALUE is percentage increase in the original appraised value from the base year to the construction start year. Purpose: Percentage increase in the original appraised value from the base year to the construction start year. Examples: N/A Valid Values: N/A Format: Number
IP_TAX_RATE Definition: TAX RATE is tax rate of the TRZ taxing entity. Purpose: Tax rate of the TRZ taxing entity. Examples: N/A Valid Values: N/A Format: Number
Table Description PARCEL Definition: PARCEL is a list of all records from input file with
the parcels within a given TRZ uploaded by the users in the Comma Separated Values file.
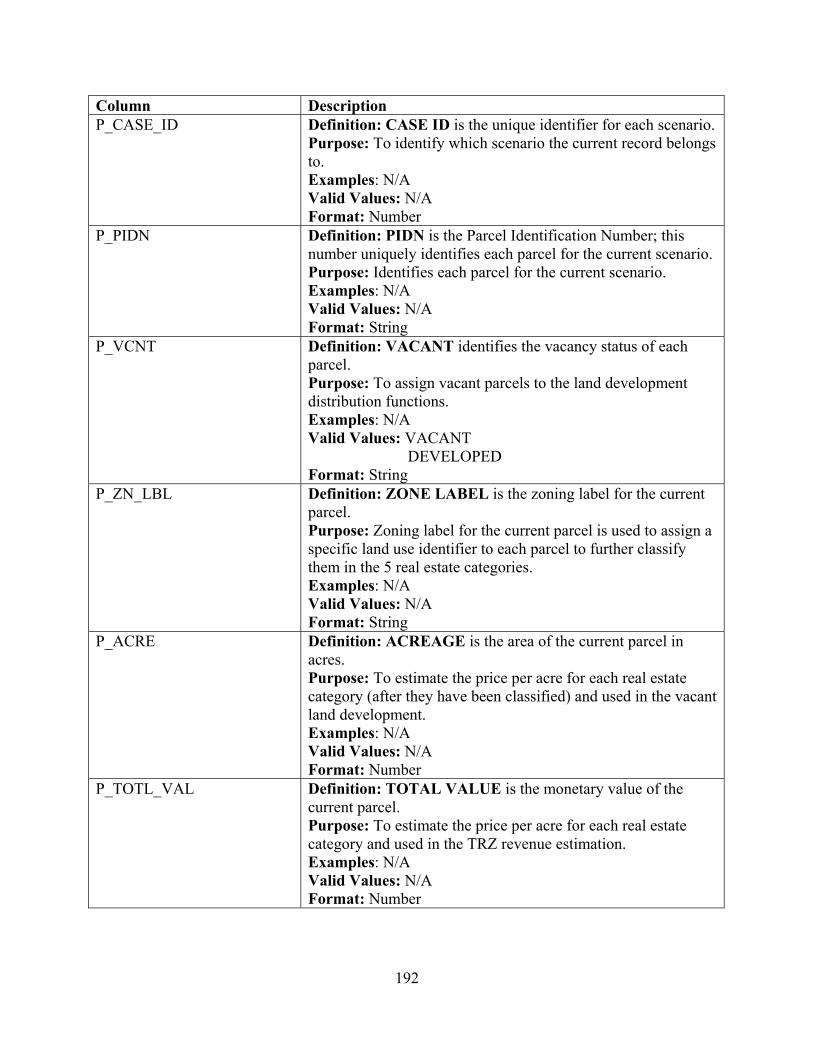
192
Column Description P_CASE_ID Definition: CASE ID is the unique identifier for each scenario.
Purpose: To identify which scenario the current record belongs to. Examples: N/A Valid Values: N/A Format: Number
P_PIDN Definition: PIDN is the Parcel Identification Number; this number uniquely identifies each parcel for the current scenario. Purpose: Identifies each parcel for the current scenario. Examples: N/A Valid Values: N/A Format: String
P_VCNT Definition: VACANT identifies the vacancy status of each parcel. Purpose: To assign vacant parcels to the land development distribution functions. Examples: N/A Valid Values: VACANT DEVELOPED Format: String
P_ZN_LBL Definition: ZONE LABEL is the zoning label for the current parcel. Purpose: Zoning label for the current parcel is used to assign a specific land use identifier to each parcel to further classify them in the 5 real estate categories. Examples: N/A Valid Values: N/A Format: String
P_ACRE Definition: ACREAGE is the area of the current parcel in acres. Purpose: To estimate the price per acre for each real estate category (after they have been classified) and used in the vacant land development. Examples: N/A Valid Values: N/A Format: Number
P_TOTL_VAL Definition: TOTAL VALUE is the monetary value of the current parcel. Purpose: To estimate the price per acre for each real estate category and used in the TRZ revenue estimation. Examples: N/A Valid Values: N/A Format: Number
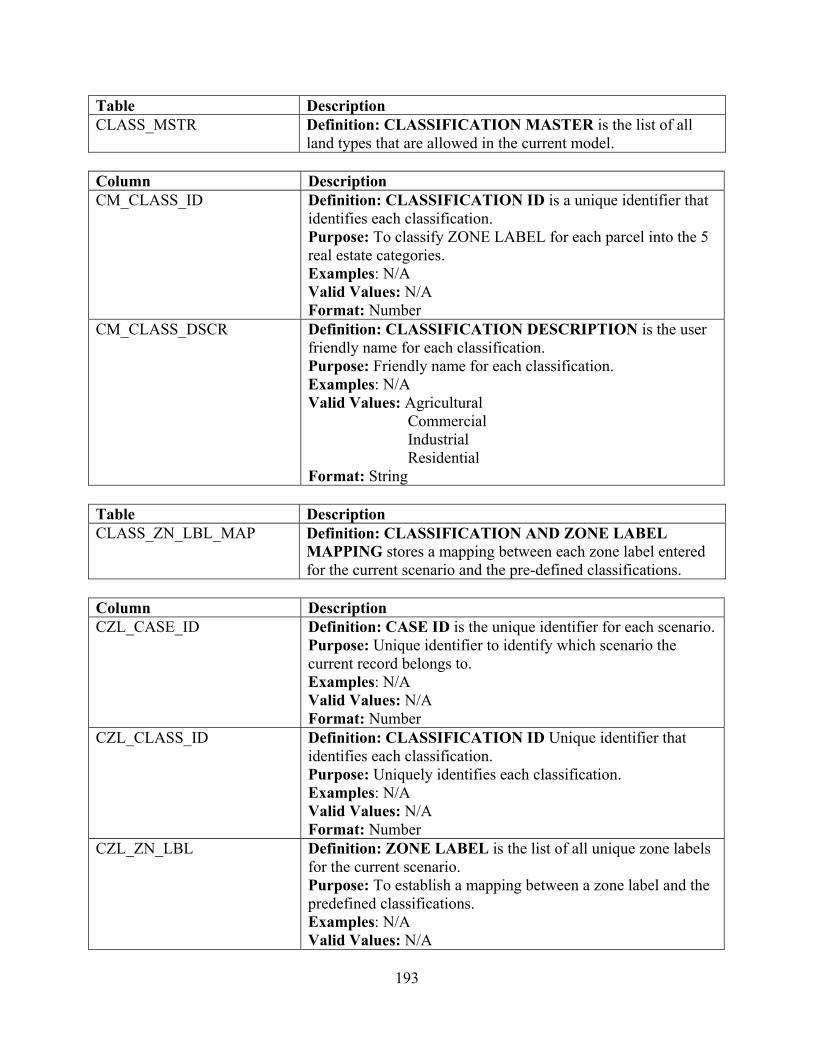
193
Table Description CLASS_MSTR Definition: CLASSIFICATION MASTER is the list of all
land types that are allowed in the current model. Column Description CM_CLASS_ID Definition: CLASSIFICATION ID is a unique identifier that
identifies each classification. Purpose: To classify ZONE LABEL for each parcel into the 5 real estate categories. Examples: N/A Valid Values: N/A Format: Number
CM_CLASS_DSCR Definition: CLASSIFICATION DESCRIPTION is the user friendly name for each classification. Purpose: Friendly name for each classification. Examples: N/A Valid Values: Agricultural Commercial Industrial Residential Format: String
Table Description CLASS_ZN_LBL_MAP Definition: CLASSIFICATION AND ZONE LABEL
MAPPING stores a mapping between each zone label entered for the current scenario and the pre-defined classifications.
Column Description CZL_CASE_ID Definition: CASE ID is the unique identifier for each scenario.
Purpose: Unique identifier to identify which scenario the current record belongs to. Examples: N/A Valid Values: N/A Format: Number
CZL_CLASS_ID Definition: CLASSIFICATION ID Unique identifier that identifies each classification. Purpose: Uniquely identifies each classification. Examples: N/A Valid Values: N/A Format: Number
CZL_ZN_LBL Definition: ZONE LABEL is the list of all unique zone labels for the current scenario. Purpose: To establish a mapping between a zone label and the predefined classifications. Examples: N/A Valid Values: N/A
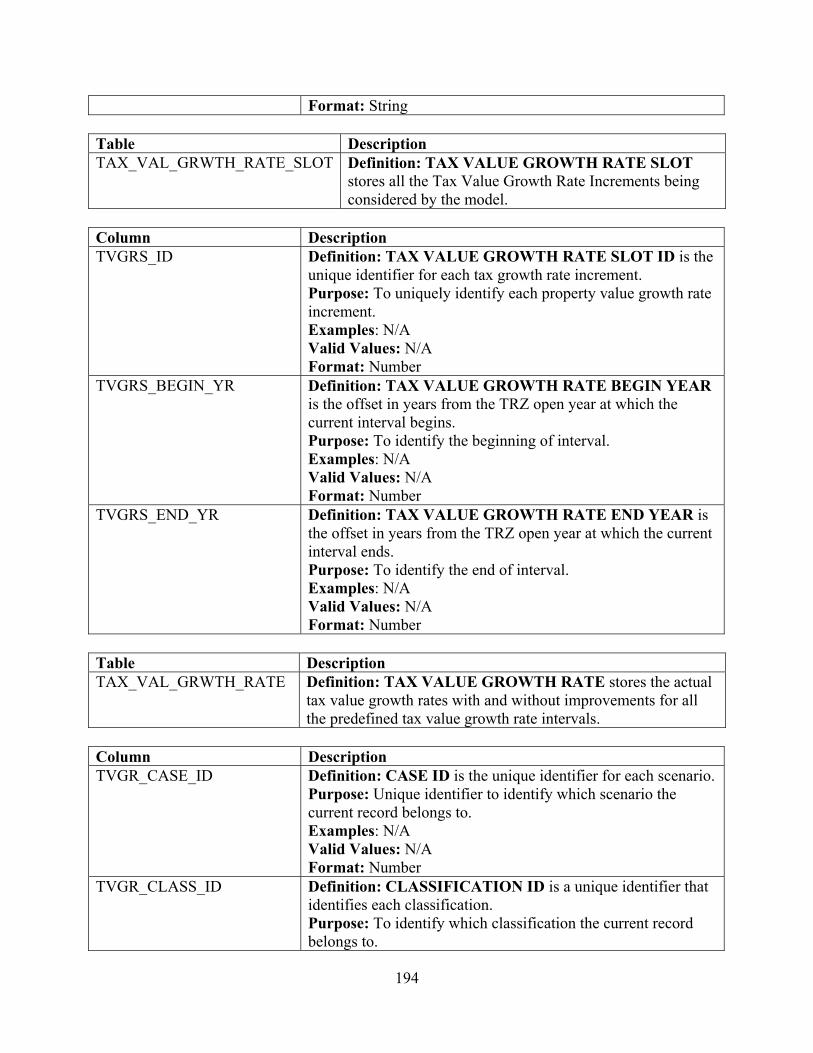
194
Format: String Table Description TAX_VAL_GRWTH_RATE_SLOT Definition: TAX VALUE GROWTH RATE SLOT
stores all the Tax Value Growth Rate Increments being considered by the model.
Column Description TVGRS_ID Definition: TAX VALUE GROWTH RATE SLOT ID is the
unique identifier for each tax growth rate increment. Purpose: To uniquely identify each property value growth rate increment. Examples: N/A Valid Values: N/A Format: Number
TVGRS_BEGIN_YR Definition: TAX VALUE GROWTH RATE BEGIN YEAR is the offset in years from the TRZ open year at which the current interval begins. Purpose: To identify the beginning of interval. Examples: N/A Valid Values: N/A Format: Number
TVGRS_END_YR Definition: TAX VALUE GROWTH RATE END YEAR is the offset in years from the TRZ open year at which the current interval ends. Purpose: To identify the end of interval. Examples: N/A Valid Values: N/A Format: Number
Table Description TAX_VAL_GRWTH_RATE Definition: TAX VALUE GROWTH RATE stores the actual
tax value growth rates with and without improvements for all the predefined tax value growth rate intervals.
Column Description TVGR_CASE_ID Definition: CASE ID is the unique identifier for each scenario.
Purpose: Unique identifier to identify which scenario the current record belongs to. Examples: N/A Valid Values: N/A Format: Number
TVGR_CLASS_ID Definition: CLASSIFICATION ID is a unique identifier that identifies each classification. Purpose: To identify which classification the current record belongs to.
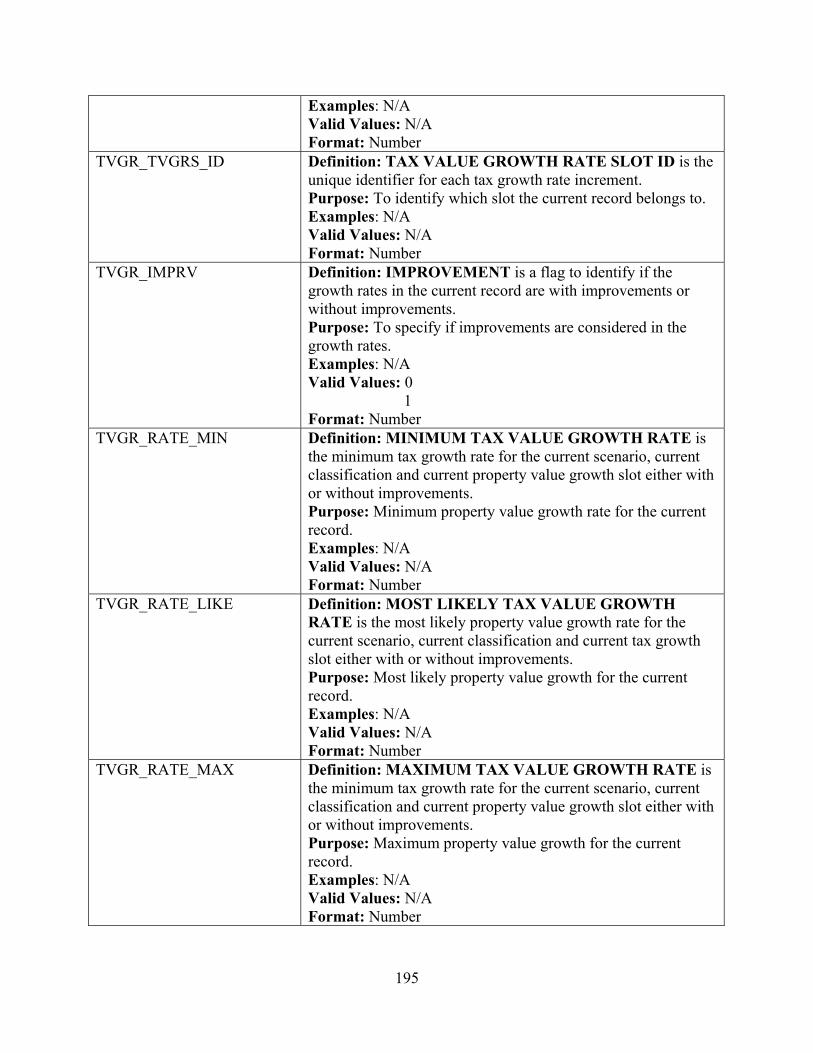
195
Examples: N/A Valid Values: N/A Format: Number
TVGR_TVGRS_ID Definition: TAX VALUE GROWTH RATE SLOT ID is the unique identifier for each tax growth rate increment. Purpose: To identify which slot the current record belongs to. Examples: N/A Valid Values: N/A Format: Number
TVGR_IMPRV Definition: IMPROVEMENT is a flag to identify if the growth rates in the current record are with improvements or without improvements. Purpose: To specify if improvements are considered in the growth rates. Examples: N/A Valid Values: 0 1 Format: Number
TVGR_RATE_MIN Definition: MINIMUM TAX VALUE GROWTH RATE is the minimum tax growth rate for the current scenario, current classification and current property value growth slot either with or without improvements. Purpose: Minimum property value growth rate for the current record. Examples: N/A Valid Values: N/A Format: Number
TVGR_RATE_LIKE Definition: MOST LIKELY TAX VALUE GROWTH RATE is the most likely property value growth rate for the current scenario, current classification and current tax growth slot either with or without improvements. Purpose: Most likely property value growth for the current record. Examples: N/A Valid Values: N/A Format: Number
TVGR_RATE_MAX Definition: MAXIMUM TAX VALUE GROWTH RATE is the minimum tax growth rate for the current scenario, current classification and current property value growth slot either with or without improvements. Purpose: Maximum property value growth for the current record. Examples: N/A Valid Values: N/A Format: Number
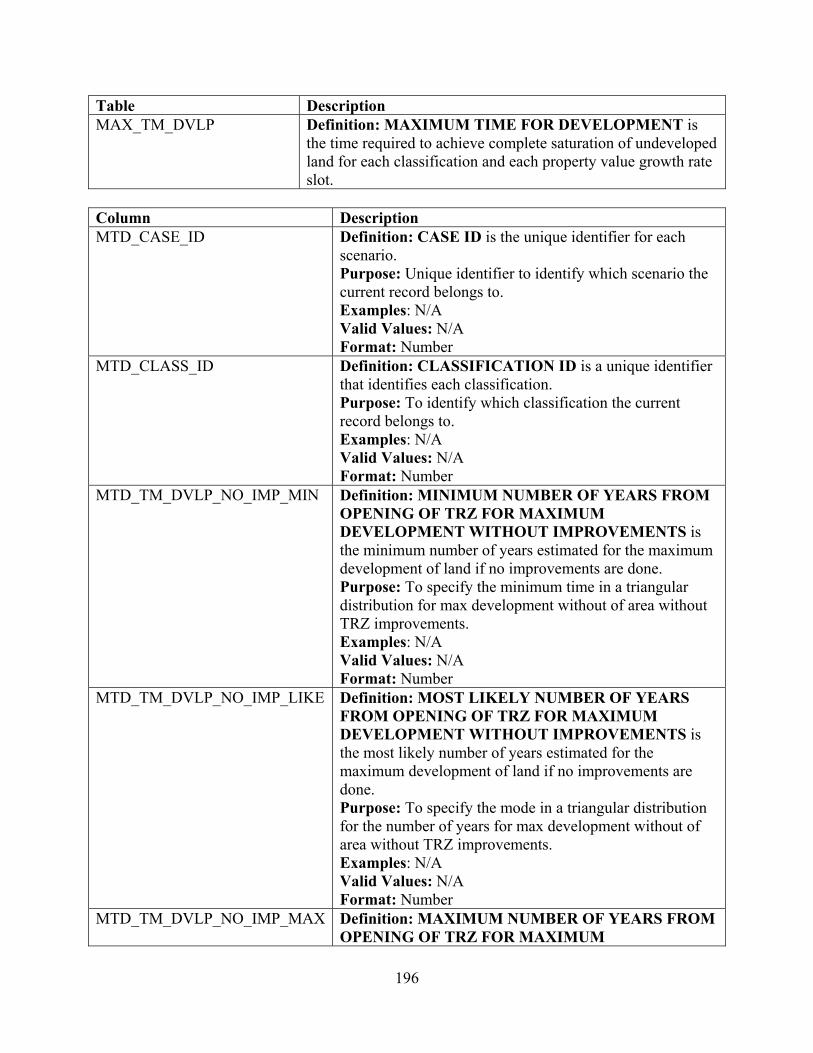
196
Table Description MAX_TM_DVLP Definition: MAXIMUM TIME FOR DEVELOPMENT is
the time required to achieve complete saturation of undeveloped land for each classification and each property value growth rate slot.
Column Description MTD_CASE_ID Definition: CASE ID is the unique identifier for each
scenario. Purpose: Unique identifier to identify which scenario the current record belongs to. Examples: N/A Valid Values: N/A Format: Number
MTD_CLASS_ID Definition: CLASSIFICATION ID is a unique identifier that identifies each classification. Purpose: To identify which classification the current record belongs to. Examples: N/A Valid Values: N/A Format: Number
MTD_TM_DVLP_NO_IMP_MIN Definition: MINIMUM NUMBER OF YEARS FROM OPENING OF TRZ FOR MAXIMUM DEVELOPMENT WITHOUT IMPROVEMENTS is the minimum number of years estimated for the maximum development of land if no improvements are done. Purpose: To specify the minimum time in a triangular distribution for max development without of area without TRZ improvements. Examples: N/A Valid Values: N/A Format: Number
MTD_TM_DVLP_NO_IMP_LIKE Definition: MOST LIKELY NUMBER OF YEARS FROM OPENING OF TRZ FOR MAXIMUM DEVELOPMENT WITHOUT IMPROVEMENTS is the most likely number of years estimated for the maximum development of land if no improvements are done. Purpose: To specify the mode in a triangular distribution for the number of years for max development without of area without TRZ improvements. Examples: N/A Valid Values: N/A Format: Number
MTD_TM_DVLP_NO_IMP_MAX Definition: MAXIMUM NUMBER OF YEARS FROM OPENING OF TRZ FOR MAXIMUM
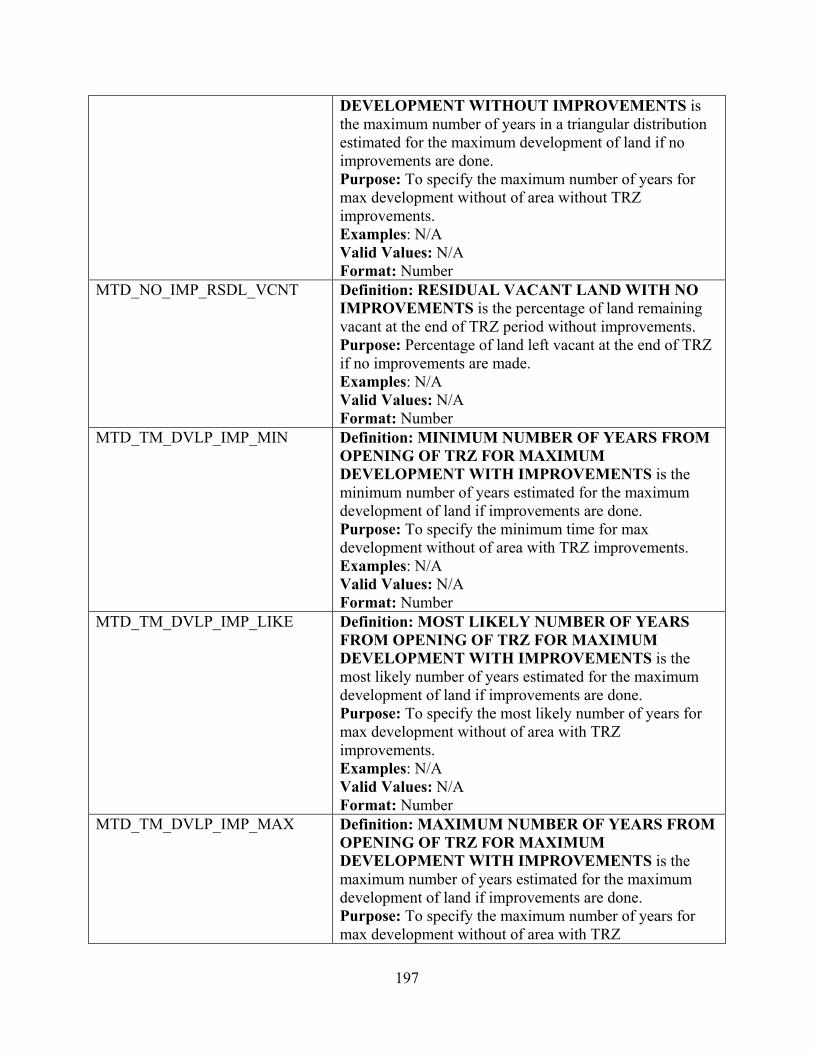
197
DEVELOPMENT WITHOUT IMPROVEMENTS is the maximum number of years in a triangular distribution estimated for the maximum development of land if no improvements are done. Purpose: To specify the maximum number of years for max development without of area without TRZ improvements. Examples: N/A Valid Values: N/A Format: Number
MTD_NO_IMP_RSDL_VCNT Definition: RESIDUAL VACANT LAND WITH NO IMPROVEMENTS is the percentage of land remaining vacant at the end of TRZ period without improvements. Purpose: Percentage of land left vacant at the end of TRZ if no improvements are made. Examples: N/A Valid Values: N/A Format: Number
MTD_TM_DVLP_IMP_MIN Definition: MINIMUM NUMBER OF YEARS FROM OPENING OF TRZ FOR MAXIMUM DEVELOPMENT WITH IMPROVEMENTS is the minimum number of years estimated for the maximum development of land if improvements are done. Purpose: To specify the minimum time for max development without of area with TRZ improvements. Examples: N/A Valid Values: N/A Format: Number
MTD_TM_DVLP_IMP_LIKE Definition: MOST LIKELY NUMBER OF YEARS FROM OPENING OF TRZ FOR MAXIMUM DEVELOPMENT WITH IMPROVEMENTS is the most likely number of years estimated for the maximum development of land if improvements are done. Purpose: To specify the most likely number of years for max development without of area with TRZ improvements. Examples: N/A Valid Values: N/A Format: Number
MTD_TM_DVLP_IMP_MAX Definition: MAXIMUM NUMBER OF YEARS FROM OPENING OF TRZ FOR MAXIMUM DEVELOPMENT WITH IMPROVEMENTS is the maximum number of years estimated for the maximum development of land if improvements are done. Purpose: To specify the maximum number of years for max development without of area with TRZ
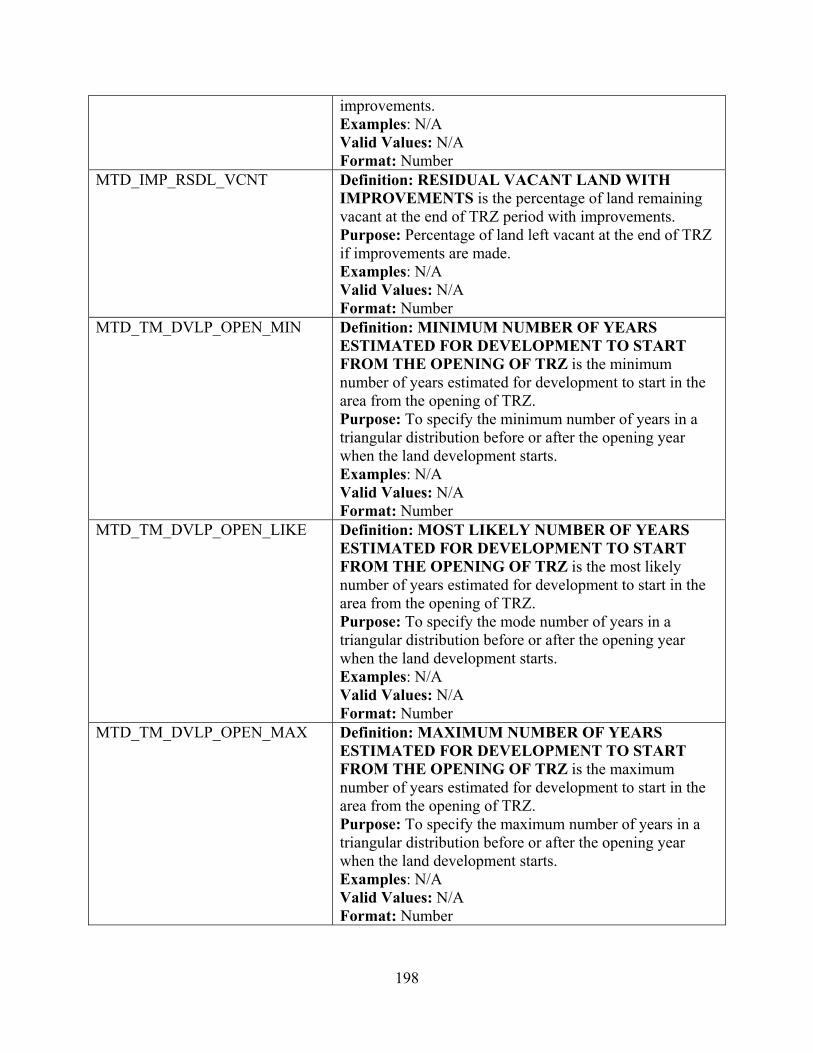
198
improvements. Examples: N/A Valid Values: N/A Format: Number
MTD_IMP_RSDL_VCNT Definition: RESIDUAL VACANT LAND WITH IMPROVEMENTS is the percentage of land remaining vacant at the end of TRZ period with improvements. Purpose: Percentage of land left vacant at the end of TRZ if improvements are made. Examples: N/A Valid Values: N/A Format: Number
MTD_TM_DVLP_OPEN_MIN Definition: MINIMUM NUMBER OF YEARS ESTIMATED FOR DEVELOPMENT TO START FROM THE OPENING OF TRZ is the minimum number of years estimated for development to start in the area from the opening of TRZ. Purpose: To specify the minimum number of years in a triangular distribution before or after the opening year when the land development starts. Examples: N/A Valid Values: N/A Format: Number
MTD_TM_DVLP_OPEN_LIKE Definition: MOST LIKELY NUMBER OF YEARS ESTIMATED FOR DEVELOPMENT TO START FROM THE OPENING OF TRZ is the most likely number of years estimated for development to start in the area from the opening of TRZ. Purpose: To specify the mode number of years in a triangular distribution before or after the opening year when the land development starts. Examples: N/A Valid Values: N/A Format: Number
MTD_TM_DVLP_OPEN_MAX Definition: MAXIMUM NUMBER OF YEARS ESTIMATED FOR DEVELOPMENT TO START FROM THE OPENING OF TRZ is the maximum number of years estimated for development to start in the area from the opening of TRZ. Purpose: To specify the maximum number of years in a triangular distribution before or after the opening year when the land development starts. Examples: N/A Valid Values: N/A Format: Number
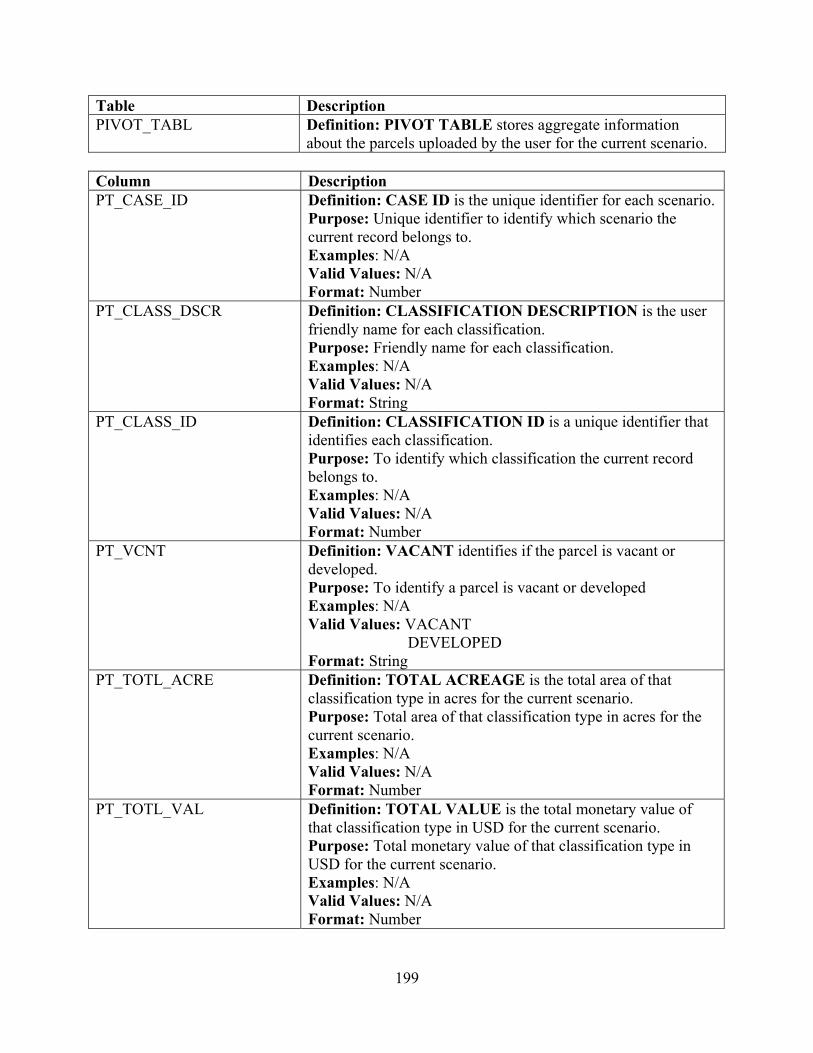
199
Table Description PIVOT_TABL Definition: PIVOT TABLE stores aggregate information
about the parcels uploaded by the user for the current scenario. Column Description PT_CASE_ID Definition: CASE ID is the unique identifier for each scenario.
Purpose: Unique identifier to identify which scenario the current record belongs to. Examples: N/A Valid Values: N/A Format: Number
PT_CLASS_DSCR Definition: CLASSIFICATION DESCRIPTION is the user friendly name for each classification. Purpose: Friendly name for each classification. Examples: N/A Valid Values: N/A Format: String
PT_CLASS_ID Definition: CLASSIFICATION ID is a unique identifier that identifies each classification. Purpose: To identify which classification the current record belongs to. Examples: N/A Valid Values: N/A Format: Number
PT_VCNT Definition: VACANT identifies if the parcel is vacant or developed. Purpose: To identify a parcel is vacant or developed Examples: N/A Valid Values: VACANT DEVELOPED Format: String
PT_TOTL_ACRE Definition: TOTAL ACREAGE is the total area of that classification type in acres for the current scenario. Purpose: Total area of that classification type in acres for the current scenario. Examples: N/A Valid Values: N/A Format: Number
PT_TOTL_VAL Definition: TOTAL VALUE is the total monetary value of that classification type in USD for the current scenario. Purpose: Total monetary value of that classification type in USD for the current scenario. Examples: N/A Valid Values: N/A Format: Number
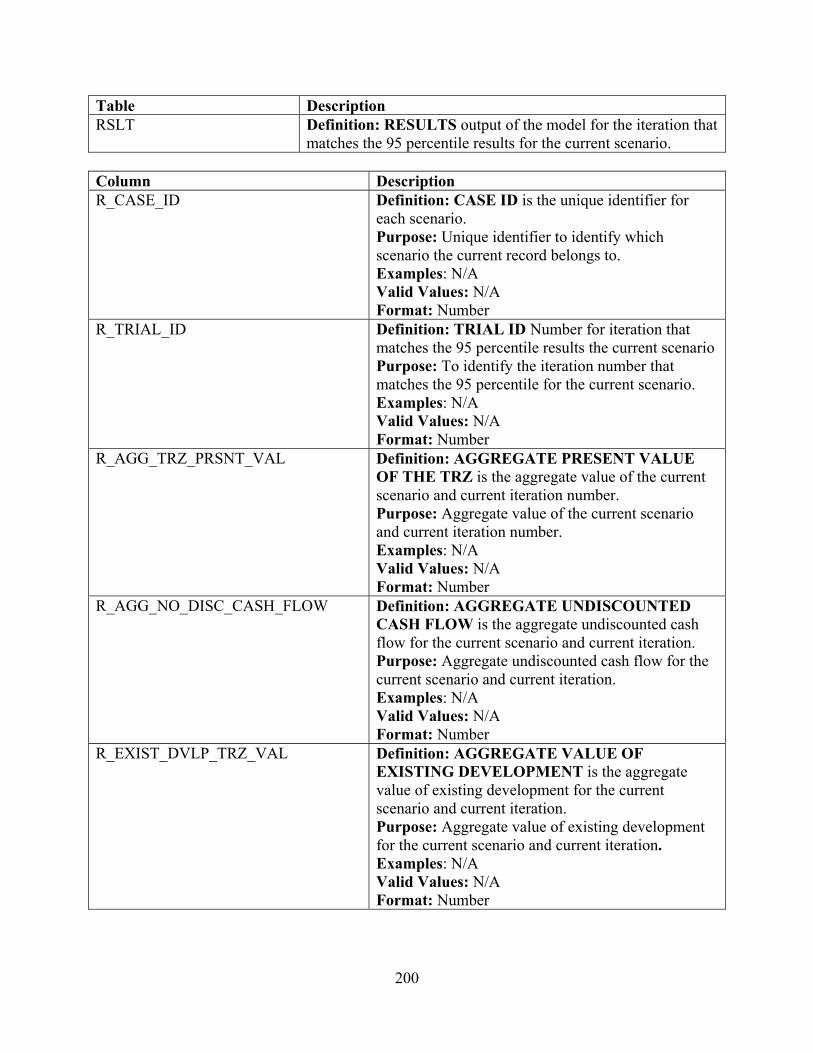
200
Table Description RSLT Definition: RESULTS output of the model for the iteration that
matches the 95 percentile results for the current scenario. Column Description R_CASE_ID Definition: CASE ID is the unique identifier for
each scenario. Purpose: Unique identifier to identify which scenario the current record belongs to. Examples: N/A Valid Values: N/A Format: Number
R_TRIAL_ID Definition: TRIAL ID Number for iteration that matches the 95 percentile results the current scenario Purpose: To identify the iteration number that matches the 95 percentile for the current scenario. Examples: N/A Valid Values: N/A Format: Number
R_AGG_TRZ_PRSNT_VAL Definition: AGGREGATE PRESENT VALUE OF THE TRZ is the aggregate value of the current scenario and current iteration number. Purpose: Aggregate value of the current scenario and current iteration number. Examples: N/A Valid Values: N/A Format: Number
R_AGG_NO_DISC_CASH_FLOW Definition: AGGREGATE UNDISCOUNTED CASH FLOW is the aggregate undiscounted cash flow for the current scenario and current iteration. Purpose: Aggregate undiscounted cash flow for the current scenario and current iteration. Examples: N/A Valid Values: N/A Format: Number
R_EXIST_DVLP_TRZ_VAL Definition: AGGREGATE VALUE OF EXISTING DEVELOPMENT is the aggregate value of existing development for the current scenario and current iteration. Purpose: Aggregate value of existing development for the current scenario and current iteration. Examples: N/A Valid Values: N/A Format: Number
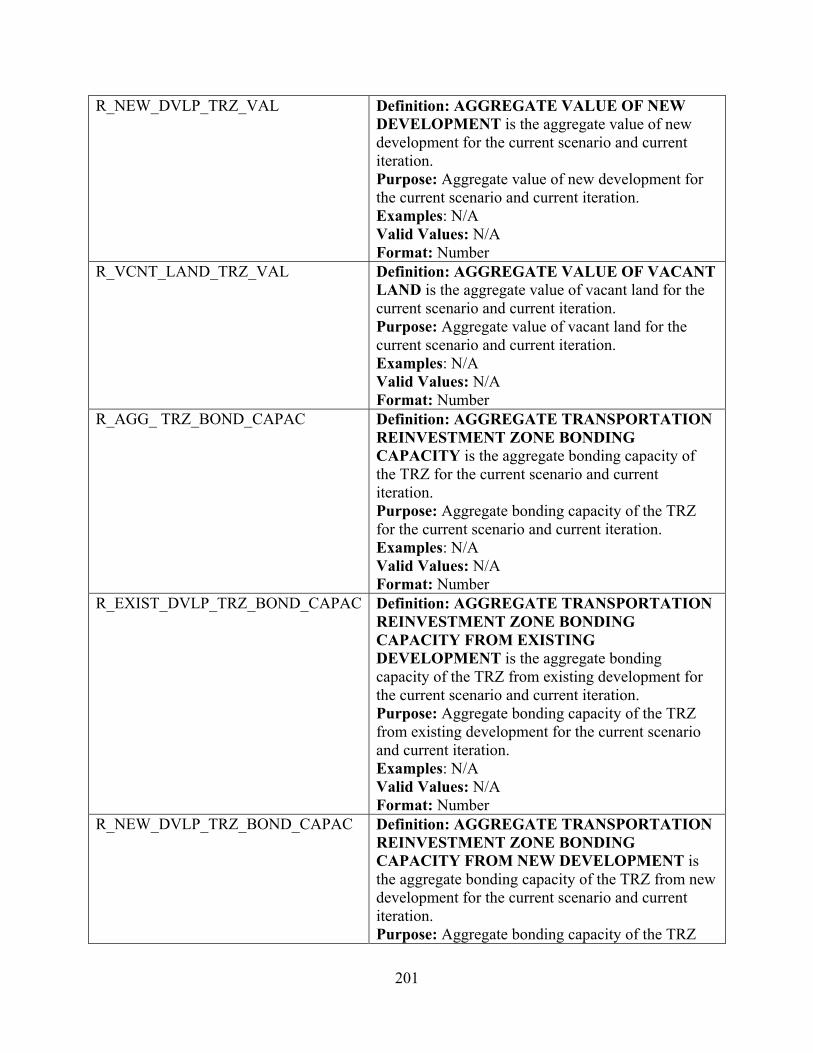
201
R_NEW_DVLP_TRZ_VAL Definition: AGGREGATE VALUE OF NEW DEVELOPMENT is the aggregate value of new development for the current scenario and current iteration. Purpose: Aggregate value of new development for the current scenario and current iteration. Examples: N/A Valid Values: N/A Format: Number
R_VCNT_LAND_TRZ_VAL Definition: AGGREGATE VALUE OF VACANT LAND is the aggregate value of vacant land for the current scenario and current iteration. Purpose: Aggregate value of vacant land for the current scenario and current iteration. Examples: N/A Valid Values: N/A Format: Number
R_AGG_ TRZ_BOND_CAPAC Definition: AGGREGATE TRANSPORTATION REINVESTMENT ZONE BONDING CAPACITY is the aggregate bonding capacity of the TRZ for the current scenario and current iteration. Purpose: Aggregate bonding capacity of the TRZ for the current scenario and current iteration. Examples: N/A Valid Values: N/A Format: Number
R_EXIST_DVLP_TRZ_BOND_CAPAC Definition: AGGREGATE TRANSPORTATION REINVESTMENT ZONE BONDING CAPACITY FROM EXISTING DEVELOPMENT is the aggregate bonding capacity of the TRZ from existing development for the current scenario and current iteration. Purpose: Aggregate bonding capacity of the TRZ from existing development for the current scenario and current iteration. Examples: N/A Valid Values: N/A Format: Number
R_NEW_DVLP_TRZ_BOND_CAPAC Definition: AGGREGATE TRANSPORTATION REINVESTMENT ZONE BONDING CAPACITY FROM NEW DEVELOPMENT is the aggregate bonding capacity of the TRZ from new development for the current scenario and current iteration. Purpose: Aggregate bonding capacity of the TRZ
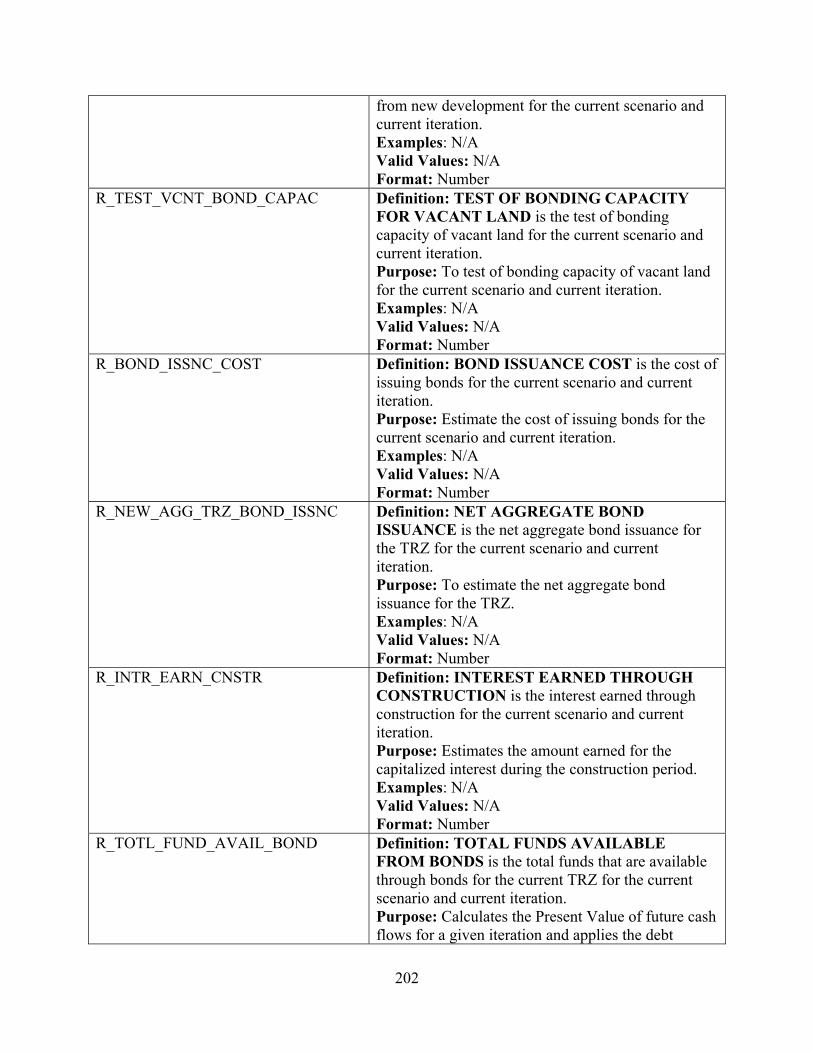
202
from new development for the current scenario and current iteration. Examples: N/A Valid Values: N/A Format: Number
R_TEST_VCNT_BOND_CAPAC Definition: TEST OF BONDING CAPACITY FOR VACANT LAND is the test of bonding capacity of vacant land for the current scenario and current iteration. Purpose: To test of bonding capacity of vacant land for the current scenario and current iteration. Examples: N/A Valid Values: N/A Format: Number
R_BOND_ISSNC_COST Definition: BOND ISSUANCE COST is the cost of issuing bonds for the current scenario and current iteration. Purpose: Estimate the cost of issuing bonds for the current scenario and current iteration. Examples: N/A Valid Values: N/A Format: Number
R_NEW_AGG_TRZ_BOND_ISSNC Definition: NET AGGREGATE BOND ISSUANCE is the net aggregate bond issuance for the TRZ for the current scenario and current iteration. Purpose: To estimate the net aggregate bond issuance for the TRZ. Examples: N/A Valid Values: N/A Format: Number
R_INTR_EARN_CNSTR Definition: INTEREST EARNED THROUGH CONSTRUCTION is the interest earned through construction for the current scenario and current iteration. Purpose: Estimates the amount earned for the capitalized interest during the construction period. Examples: N/A Valid Values: N/A Format: Number
R_TOTL_FUND_AVAIL_BOND Definition: TOTAL FUNDS AVAILABLE FROM BONDS is the total funds that are available through bonds for the current TRZ for the current scenario and current iteration. Purpose: Calculates the Present Value of future cash flows for a given iteration and applies the debt
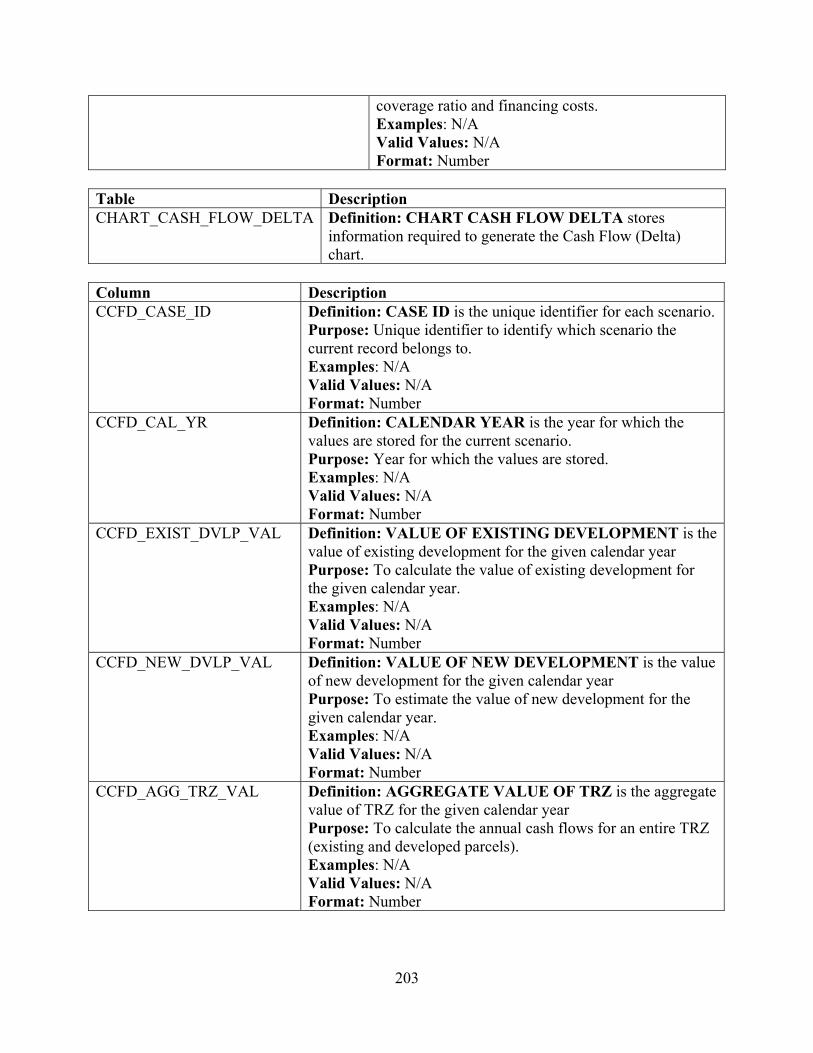
203
coverage ratio and financing costs. Examples: N/A Valid Values: N/A Format: Number
Table Description CHART_CASH_FLOW_DELTA Definition: CHART CASH FLOW DELTA stores
information required to generate the Cash Flow (Delta) chart.
Column Description CCFD_CASE_ID Definition: CASE ID is the unique identifier for each scenario.
Purpose: Unique identifier to identify which scenario the current record belongs to. Examples: N/A Valid Values: N/A Format: Number
CCFD_CAL_YR Definition: CALENDAR YEAR is the year for which the values are stored for the current scenario. Purpose: Year for which the values are stored. Examples: N/A Valid Values: N/A Format: Number
CCFD_EXIST_DVLP_VAL Definition: VALUE OF EXISTING DEVELOPMENT is the value of existing development for the given calendar year Purpose: To calculate the value of existing development for the given calendar year. Examples: N/A Valid Values: N/A Format: Number
CCFD_NEW_DVLP_VAL Definition: VALUE OF NEW DEVELOPMENT is the value of new development for the given calendar year Purpose: To estimate the value of new development for the given calendar year. Examples: N/A Valid Values: N/A Format: Number
CCFD_AGG_TRZ_VAL Definition: AGGREGATE VALUE OF TRZ is the aggregate value of TRZ for the given calendar year Purpose: To calculate the annual cash flows for an entire TRZ (existing and developed parcels). Examples: N/A Valid Values: N/A Format: Number
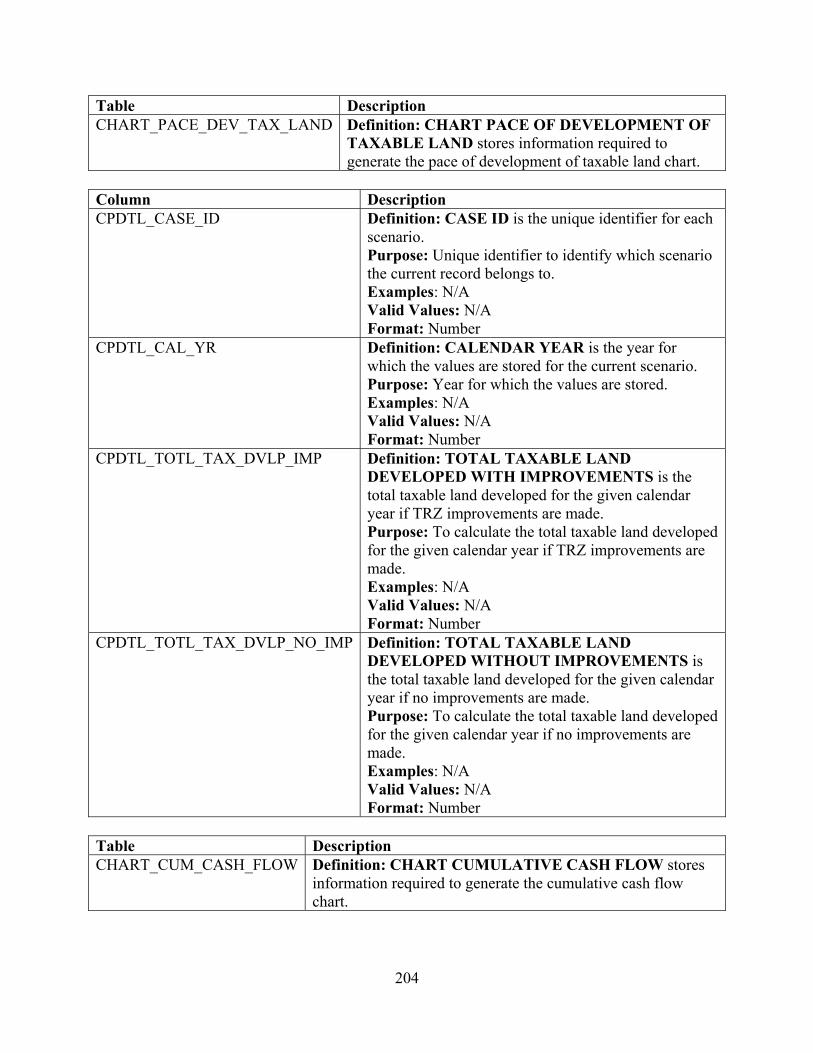
204
Table Description CHART_PACE_DEV_TAX_LAND Definition: CHART PACE OF DEVELOPMENT OF
TAXABLE LAND stores information required to generate the pace of development of taxable land chart.
Column Description CPDTL_CASE_ID Definition: CASE ID is the unique identifier for each
scenario. Purpose: Unique identifier to identify which scenario the current record belongs to. Examples: N/A Valid Values: N/A Format: Number
CPDTL_CAL_YR Definition: CALENDAR YEAR is the year for which the values are stored for the current scenario. Purpose: Year for which the values are stored. Examples: N/A Valid Values: N/A Format: Number
CPDTL_TOTL_TAX_DVLP_IMP Definition: TOTAL TAXABLE LAND DEVELOPED WITH IMPROVEMENTS is the total taxable land developed for the given calendar year if TRZ improvements are made. Purpose: To calculate the total taxable land developed for the given calendar year if TRZ improvements are made. Examples: N/A Valid Values: N/A Format: Number
CPDTL_TOTL_TAX_DVLP_NO_IMP Definition: TOTAL TAXABLE LAND DEVELOPED WITHOUT IMPROVEMENTS is the total taxable land developed for the given calendar year if no improvements are made. Purpose: To calculate the total taxable land developed for the given calendar year if no improvements are made. Examples: N/A Valid Values: N/A Format: Number
Table Description CHART_CUM_CASH_FLOW Definition: CHART CUMULATIVE CASH FLOW stores
information required to generate the cumulative cash flow chart.
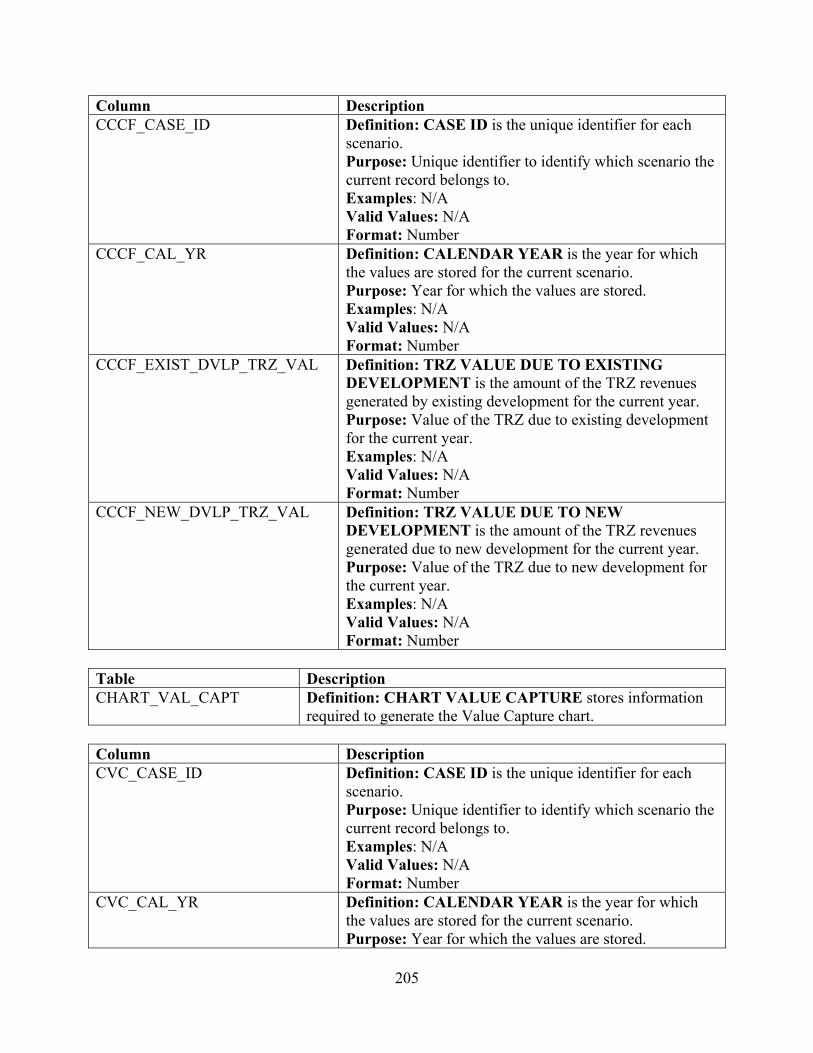
205
Column Description CCCF_CASE_ID Definition: CASE ID is the unique identifier for each
scenario. Purpose: Unique identifier to identify which scenario the current record belongs to. Examples: N/A Valid Values: N/A Format: Number
CCCF_CAL_YR Definition: CALENDAR YEAR is the year for which the values are stored for the current scenario. Purpose: Year for which the values are stored. Examples: N/A Valid Values: N/A Format: Number
CCCF_EXIST_DVLP_TRZ_VAL Definition: TRZ VALUE DUE TO EXISTING DEVELOPMENT is the amount of the TRZ revenues generated by existing development for the current year. Purpose: Value of the TRZ due to existing development for the current year. Examples: N/A Valid Values: N/A Format: Number
CCCF_NEW_DVLP_TRZ_VAL Definition: TRZ VALUE DUE TO NEW DEVELOPMENT is the amount of the TRZ revenues generated due to new development for the current year. Purpose: Value of the TRZ due to new development for the current year. Examples: N/A Valid Values: N/A Format: Number
Table Description CHART_VAL_CAPT Definition: CHART VALUE CAPTURE stores information
required to generate the Value Capture chart. Column Description CVC_CASE_ID Definition: CASE ID is the unique identifier for each
scenario. Purpose: Unique identifier to identify which scenario the current record belongs to. Examples: N/A Valid Values: N/A Format: Number
CVC_CAL_YR Definition: CALENDAR YEAR is the year for which the values are stored for the current scenario. Purpose: Year for which the values are stored.
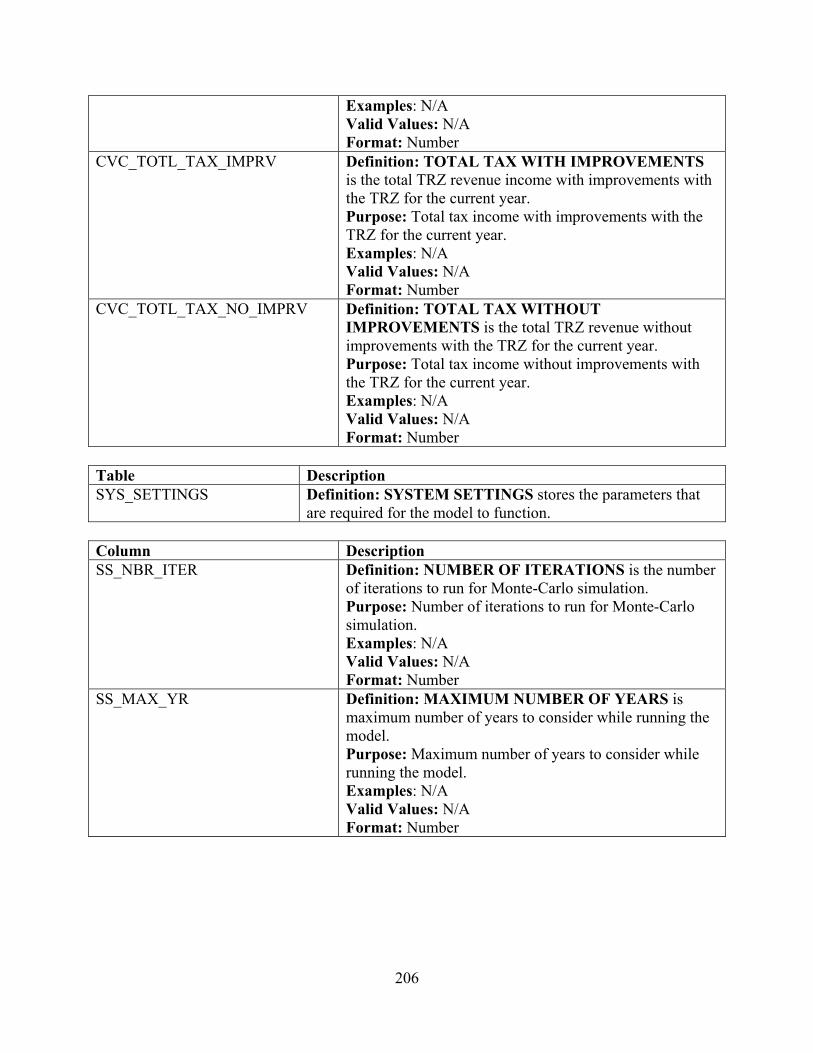
206
Examples: N/A Valid Values: N/A Format: Number
CVC_TOTL_TAX_IMPRV Definition: TOTAL TAX WITH IMPROVEMENTS is the total TRZ revenue income with improvements with the TRZ for the current year. Purpose: Total tax income with improvements with the TRZ for the current year. Examples: N/A Valid Values: N/A Format: Number
CVC_TOTL_TAX_NO_IMPRV Definition: TOTAL TAX WITHOUT IMPROVEMENTS is the total TRZ revenue without improvements with the TRZ for the current year. Purpose: Total tax income without improvements with the TRZ for the current year. Examples: N/A Valid Values: N/A Format: Number
Table Description SYS_SETTINGS Definition: SYSTEM SETTINGS stores the parameters that
are required for the model to function. Column Description SS_NBR_ITER Definition: NUMBER OF ITERATIONS is the number
of iterations to run for Monte-Carlo simulation. Purpose: Number of iterations to run for Monte-Carlo simulation. Examples: N/A Valid Values: N/A Format: Number
SS_MAX_YR Definition: MAXIMUM NUMBER OF YEARS is maximum number of years to consider while running the model. Purpose: Maximum number of years to consider while running the model. Examples: N/A Valid Values: N/A Format: Number
207
ENDNOTES
1. Source: Neighborhood Capital Budget Group. (http://www.ncbg.org/tifs/tifs.htm). 2. Source: Texas Geographic Information Council (TGIC) 2009-2010) 3. Source: Texas Department of Transportation. 4. Sources: Texas Department of Transportation, U.S. Census Bureau 5. Sources: Texas Department of Transportation, U.S. Census Bureau 6. Source: Delaware Valley Regional Planning Commission (2005), “Implementing Transit-Oriented-Development in Pennsylvania: A Summary of Act 238 of 2004”.

Recommended