Policies toward sustainable Policies toward sustainable regional development:regional development:
Integrated modelling of economy, mobility and air pollutionIntegrated modelling of economy, mobility and air pollution
Paul Safonov, Vincent Favrel, and Walter Hecq
Centre for Economic and Social Studies on the Environment (CEESE)Centre for Economic and Social Studies on the Environment (CEESE)Université Libre de Bruxelles - Free University of Brussels (ULB)Université Libre de Bruxelles - Free University of Brussels (ULB)
Center for Economic and Social Studies on the Environment (CEESE), Université Libre de Bruxelles (ULB)
PlanPlanPlanPlan
Four Stage Transport ModelTRIPS - Professional Transport Planning ToolA Case Study: Aim of the ProjectSystem of ModelsData Sources and AvailabilitySoftware SolutionsScenarios and SimulationsPolicy Recommendations
Center for Economic and Social Studies on the Environment (CEESE), Université Libre de Bruxelles (ULB)
Four-stage transport modelFour-stage transport modelFour-stage transport modelFour-stage transport model
Trip generationTrip generationTrip DistributionTrip DistributionModal ChoiceModal ChoiceAssignmentAssignment
Center for Economic and Social Studies on the Environment (CEESE), Université Libre de Bruxelles (ULB)
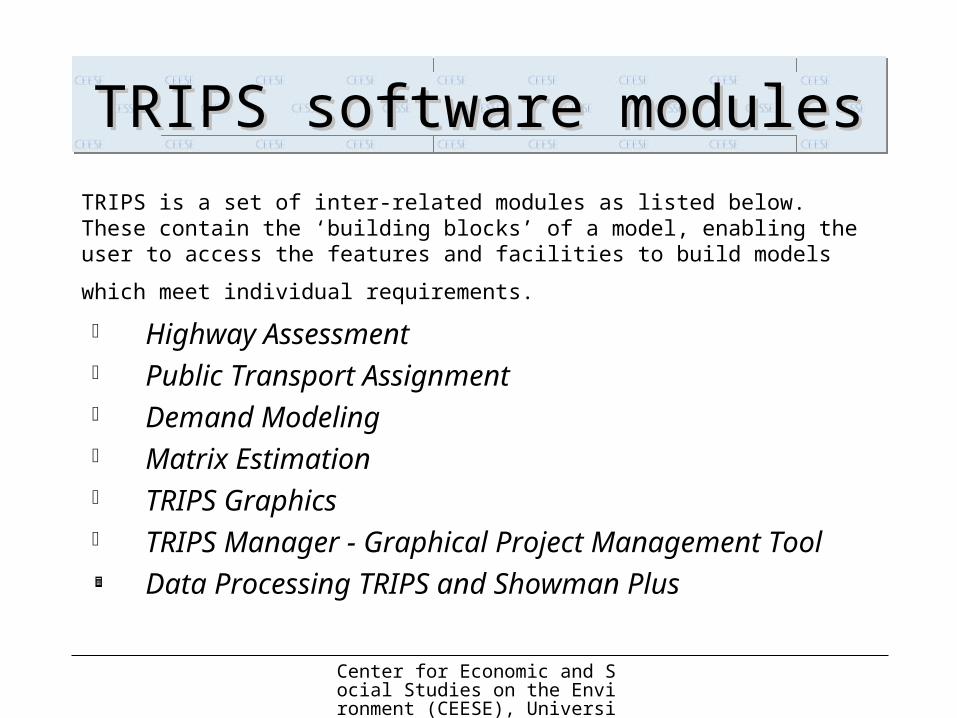
TRIPS software modulesTRIPS software modulesTRIPS software modulesTRIPS software modules
TRIPS is a set of inter-related modules as listed below. These contain the ‘building blocks’ of a model, enabling the user to access the features and facilities
to build models which meet individual requirements. Highway Assessment Public Transport Assignment Demand Modeling Matrix Estimation TRIPS Graphics TRIPS Manager - Graphical Project Management Tool Data Processing TRIPS and Showman Plus
Center for Economic and Social Studies on the Environment (CEESE), Université Libre de Bruxelles (ULB)
Center for Economic and Social Studies on the Environment (CEESE), Université Libre de Bruxelles (ULB)
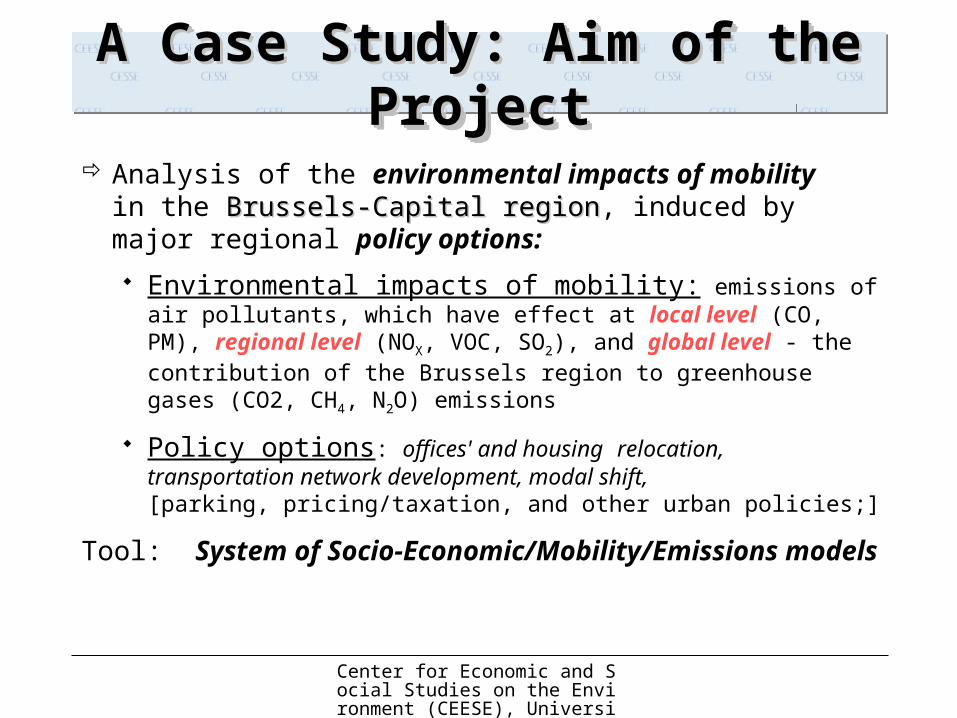
A Case Study: Aim of the ProjectA Case Study: Aim of the ProjectA Case Study: Aim of the ProjectA Case Study: Aim of the Project
Analysis of the environmental impacts of mobility in the Brussels-Capital regionBrussels-Capital region, induced by major regional policy options:
Environmental impacts of mobility: emissions of air pollutants, which have effect at local level (CO, PM), regional level (NOX, VOC, SO2), and global level - the contribution of the Brussels region to greenhouse gases (CO2, CH4, N2O) emissions
Policy options: offices' and housing relocation, transportation network development, modal shift, [parking, pricing/taxation, and other urban policies;]
Tool: System of Socio-Economic/Mobility/Emissions models
Center for Economic and Social Studies on the Environment (CEESE), Université Libre de Bruxelles (ULB)
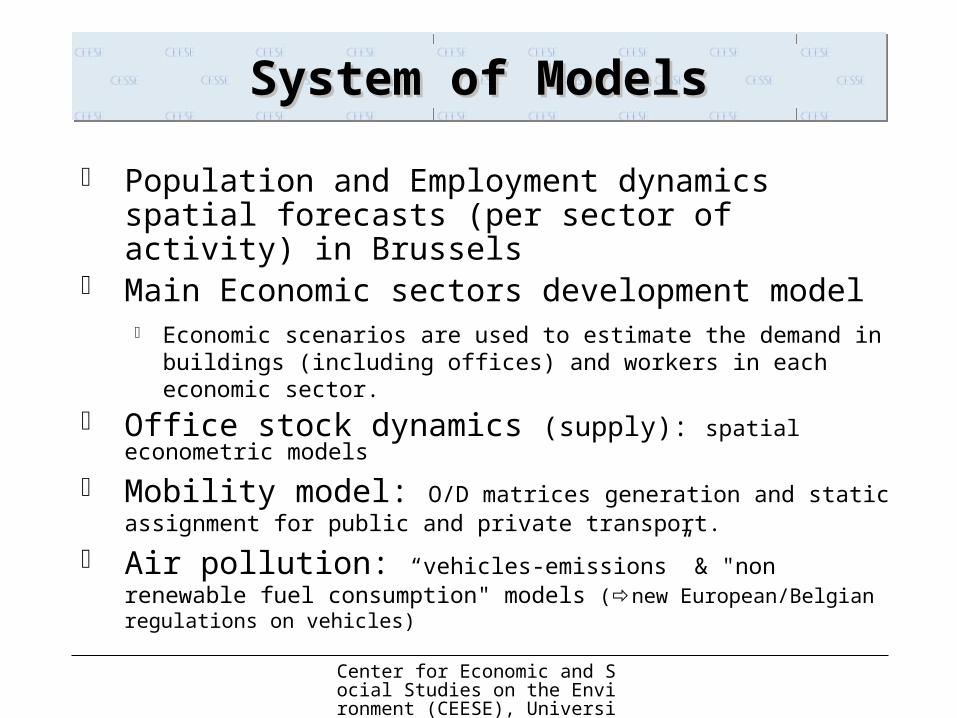
System of ModelsSystem of ModelsSystem of ModelsSystem of Models
Population and Employment dynamics spatial forecasts (per sector of activity) in Brussels
Main Economic sectors development model Economic scenarios are used to estimate the demand in buildings
(including offices) and workers in each economic sector.
Office stock dynamics (supply): spatial econometric models
Mobility model: O/D matrices generation and static assignment for public and private transport.
Air pollution: “vehicles-emissions” & "non renewable fuel consumption" models (new European/Belgian regulations on vehicles)
Center for Economic and Social Studies on the Environment (CEESE), Université Libre de Bruxelles (ULB)
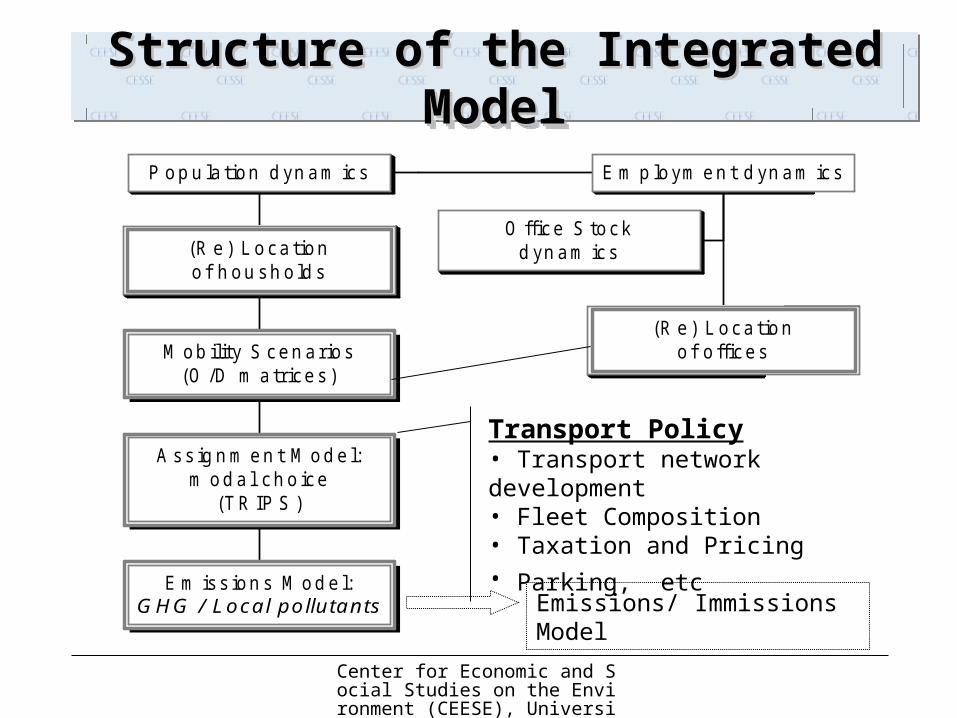
Structure of the Integrated ModelStructure of the Integrated ModelStructure of the Integrated ModelStructure of the Integrated Model
E m iss ion s M od e l:G H G / L o ca l p o llu ta n ts
A ss ig n m en t M od e l:m od a l ch o ice
(TR IP S )
M ob ility S cen arios(O /D m atrices )
(R e) L oca tiono f h ou sh o ld s
P op u la tion d yn am ics
O ffice S tockd yn am ics
(R e) L oca tiono f o ffices
E m p loym en t d yn am ics
Emissions/ Immissions Model
Transport Policy• Transport network development• Fleet Composition• Taxation and Pricing• Parking, etc
Center for Economic and Social Studies on the Environment (CEESE), Université Libre de Bruxelles (ULB)
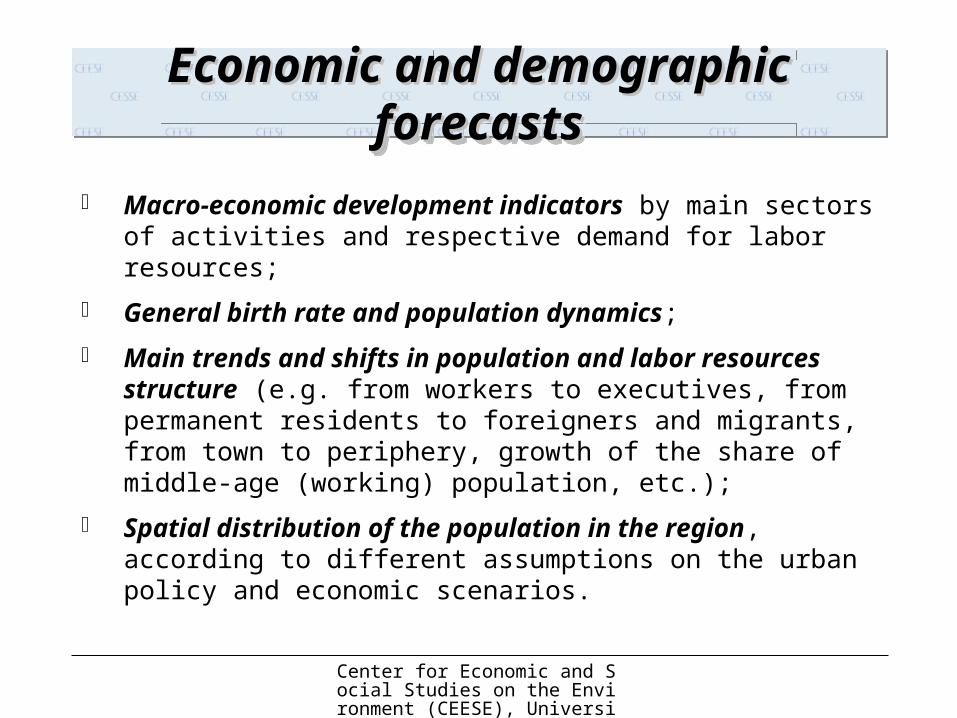
Economic and demographic forecastsEconomic and demographic forecastsEconomic and demographic forecastsEconomic and demographic forecasts
Macro-economic development indicators by main sectors of activities and respective demand for labor resources;
General birth rate and population dynamics;
Main trends and shifts in population and labor resources structure (e.g. from workers to executives, from permanent residents to foreigners and migrants, from town to periphery, growth of the share of middle-age (working) population, etc.);
Spatial distribution of the population in the region, according to different assumptions on the urban policy and economic scenarios.
Center for Economic and Social Studies on the Environment (CEESE), Université Libre de Bruxelles (ULB)
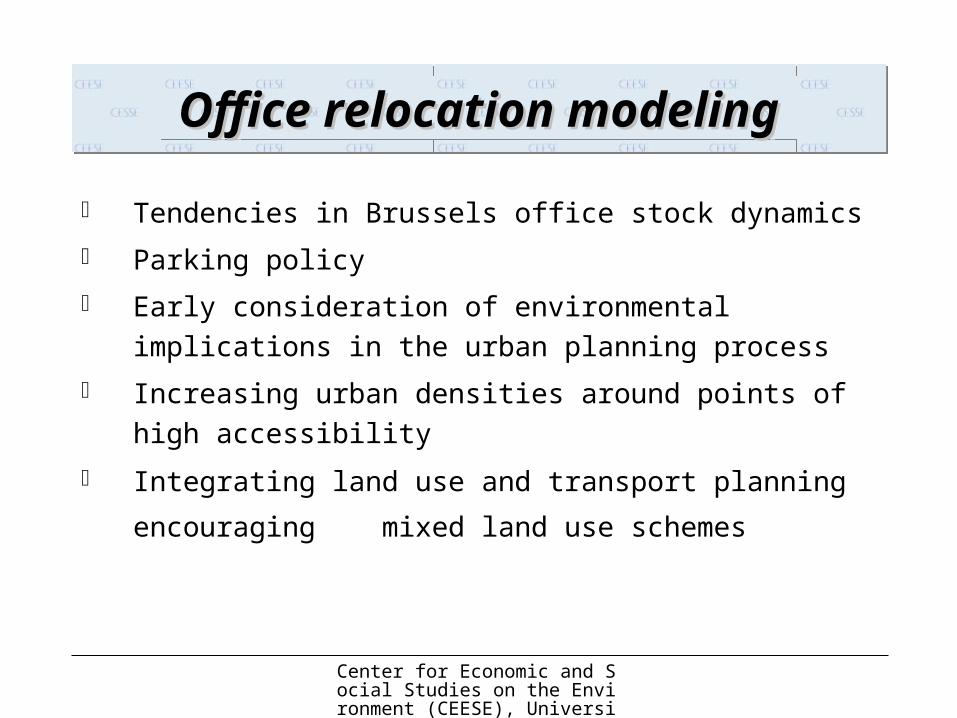
Office relocation modelingOffice relocation modelingOffice relocation modelingOffice relocation modeling
Tendencies in Brussels office stock dynamics
Parking policy
Early consideration of environmental implications in the
urban planning process
Increasing urban densities around points of high
accessibility
Integrating land use and transport planning encouraging
mixed land use schemes
Center for Economic and Social Studies on the Environment (CEESE), Université Libre de Bruxelles (ULB)
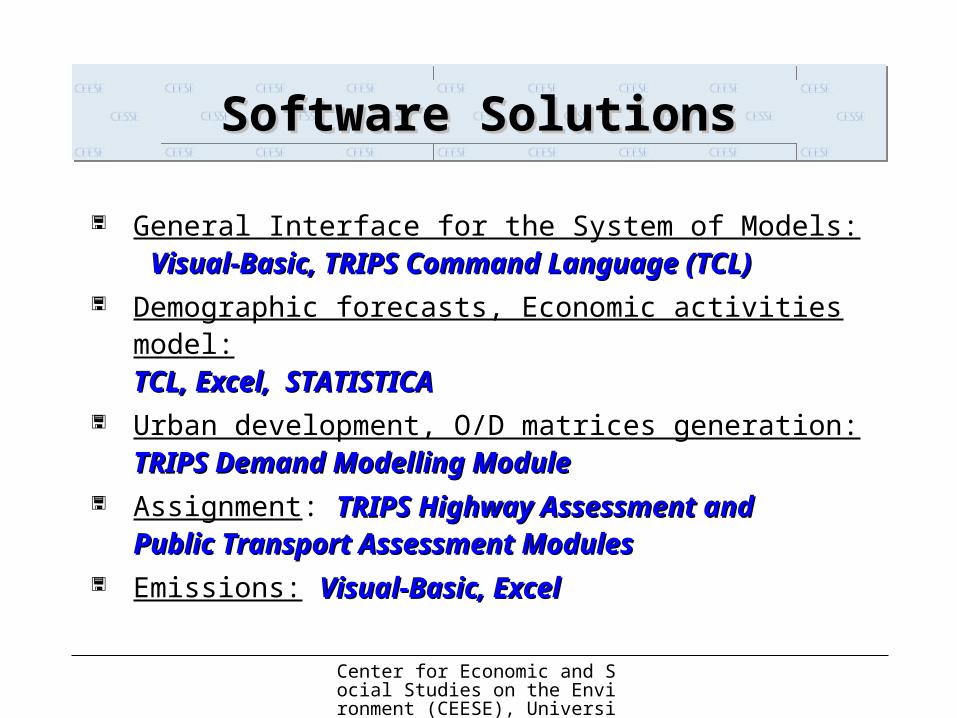
Software SolutionsSoftware SolutionsSoftware SolutionsSoftware Solutions
General Interface for the System of Models: Visual-Basic, TRIPS Command Language (TCL)Visual-Basic, TRIPS Command Language (TCL)
Demographic forecasts, Economic activities model: TCL, Excel, STATISTICATCL, Excel, STATISTICA
Urban development, O/D matrices generation: TRIPS Demand Modelling ModuleTRIPS Demand Modelling Module
Assignment: TRIPS TRIPS Highway Assessment and Highway Assessment and Public Transport Assessment ModulesPublic Transport Assessment Modules
Emissions: Visual-Basic, ExcelVisual-Basic, Excel
Center for Economic and Social Studies on the Environment (CEESE), Université Libre de Bruxelles (ULB)
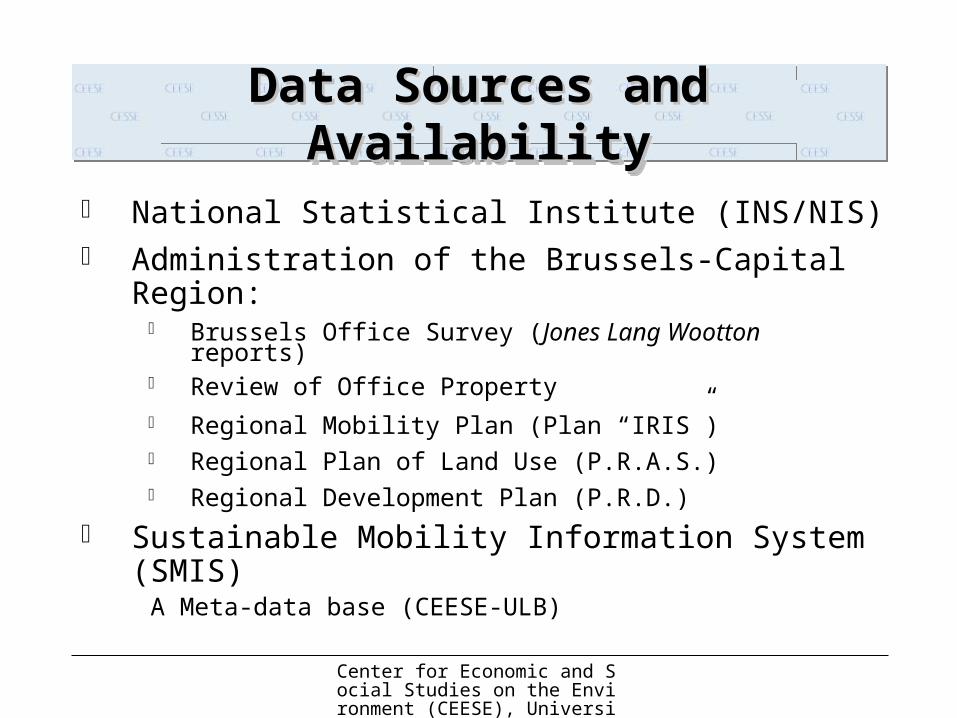
Data Sources and AvailabilityData Sources and AvailabilityData Sources and AvailabilityData Sources and Availability
National Statistical Institute (INS/NIS) Administration of the Brussels-Capital Region:
Brussels Office Survey (Jones Lang Wootton reports) Review of Office Property Regional Mobility Plan (Plan “IRIS”) Regional Plan of Land Use (P.R.A.S.) Regional Development Plan (P.R.D.)
Sustainable Mobility Information System (SMIS) A Meta-data base (CEESE-ULB)
Center for Economic and Social Studies on the Environment (CEESE), Université Libre de Bruxelles (ULB)
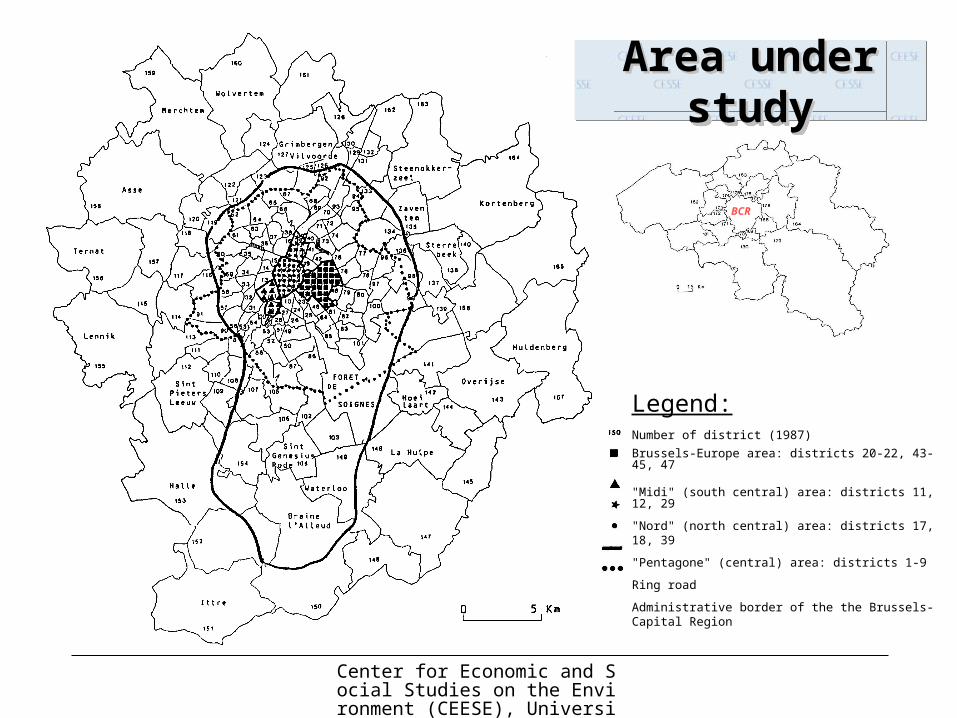
Legend:
Number of district (1987)
Brussels-Europe area: districts 20-22, 43-45, 47
"Midi" (south central) area: districts 11, 12, 29
"Nord" (north central) area: districts 17, 18, 39
"Pentagone" (central) area: districts 1-9
Ring road
Administrative border of the the Brussels-Capital Region
Area under studyArea under studyArea under studyArea under study
BCR
Center for Economic and Social Studies on the Environment (CEESE), Université Libre de Bruxelles (ULB)
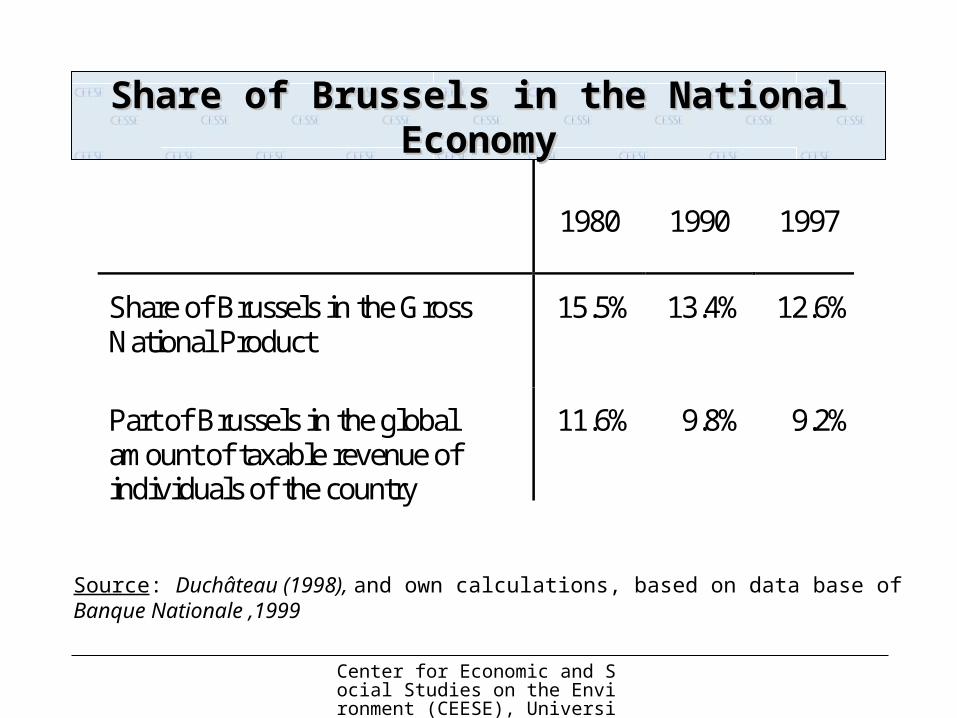
Share of Brussels in the National EconomyShare of Brussels in the National Economy
Source: Duchâteau (1998), and own calculations, based on data base of Banque Nationale ,1999
1980 1990 1997
Share of Brussels in the GrossNational Product
15.5% 13.4% 12.6%
Part of Brussels in the globalamount of taxable revenue ofindividuals of the country
11.6% 9.8% 9.2%
Center for Economic and Social Studies on the Environment (CEESE), Université Libre de Bruxelles (ULB)
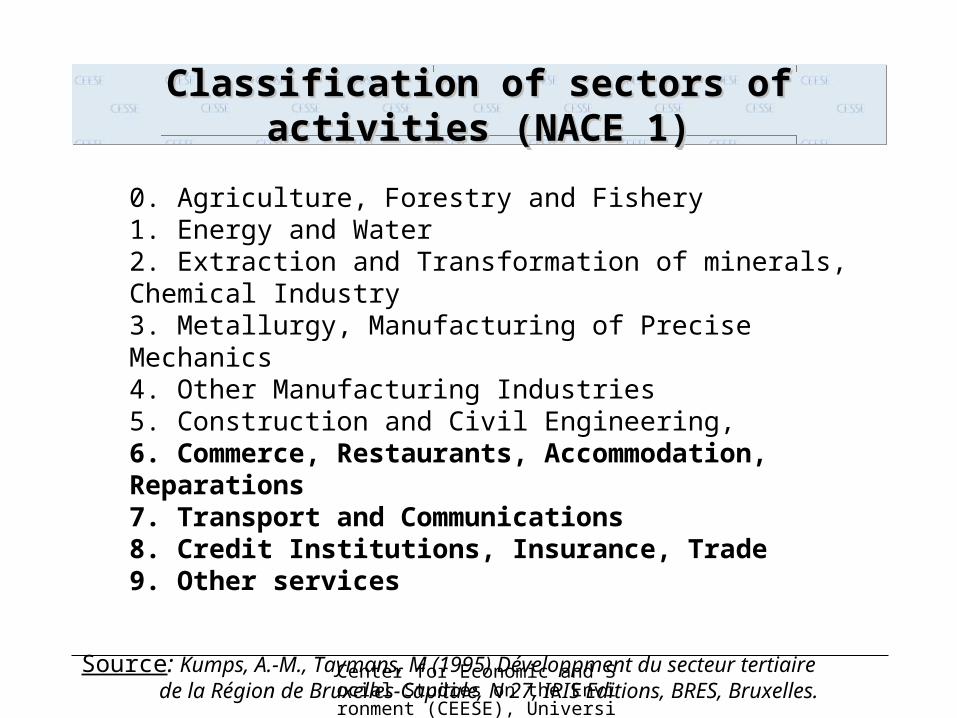
Classification of sectors of activities (NACE 1)Classification of sectors of activities (NACE 1)Classification of sectors of activities (NACE 1)Classification of sectors of activities (NACE 1)
0. Agriculture, Forestry and Fishery1. Energy and Water2. Extraction and Transformation of minerals, Chemical Industry3. Metallurgy, Manufacturing of Precise Mechanics4. Other Manufacturing Industries 5. Construction and Civil Engineering,6. Commerce, Restaurants, Accommodation, Reparations7. Transport and Communications8. Credit Institutions, Insurance, Trade9. Other services
Source: Kumps, A.-M., Taymans, M (1995) Développment du secteur tertiaire de la Région de Bruxelles-Capitale, N 27, IRIS Editions, BRES, Bruxelles.
Center for Economic and Social Studies on the Environment (CEESE), Université Libre de Bruxelles (ULB)
Dynamics of mobility in the Brussels-Capital Region Dynamics of mobility in the Brussels-Capital Region 1985-19981985-1998
Dynamics of mobility in the Brussels-Capital Region Dynamics of mobility in the Brussels-Capital Region 1985-19981985-1998
90
100
110
120
130
140
150
160
170
1985 1986 1987 1988 1989 1990 1991 1992 1993 1994 1995 1996 1997 1998
Year
Tra
ffic
in
de
x (
ba
se
10
0 i
n 1
98
5)
Motorway Regional network Local network Total
Calculated from: Recenment de la Circulation, Ministere des Communications et del'infrastructure, 1998 .
Center for Economic and Social Studies on the Environment (CEESE), Université Libre de Bruxelles (ULB)
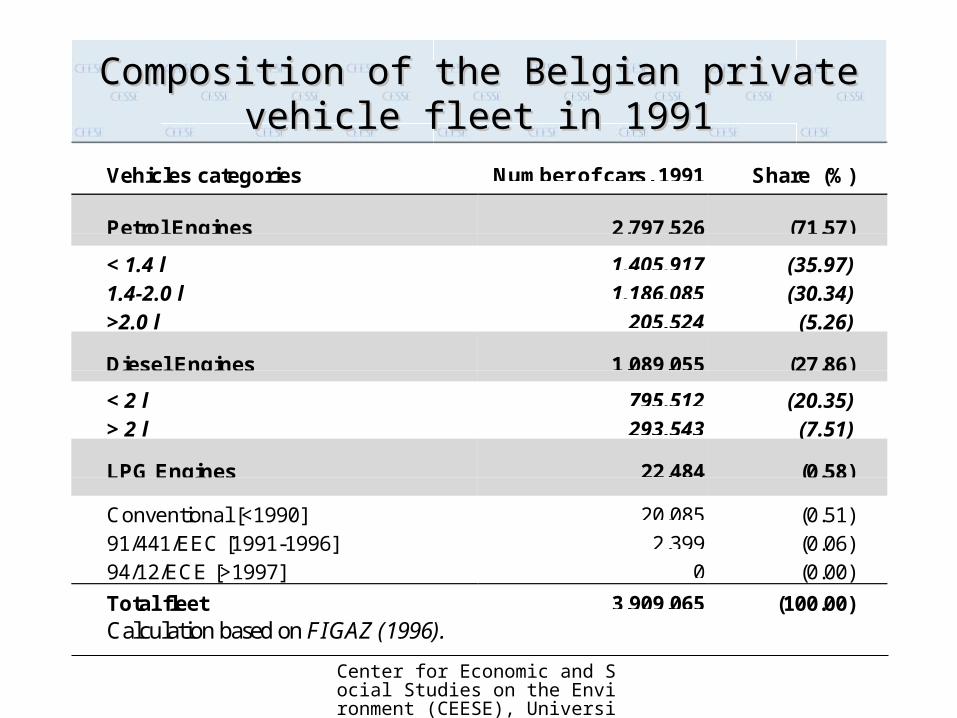
Composition of the Belgian private vehicle fleet in Composition of the Belgian private vehicle fleet in 19911991
Vehicles categories Number of cars, 1991 Share (%)
Petrol Engines 2,797,526 (71.57)
< 1.4 l 1,405,917 (35.97)1.4-2.0 l 1,186,085 (30.34)>2.0 l 205,524 (5.26)
Diesel Engines 1,089,055 (27.86)
< 2 l 795,512 (20.35)> 2 l 293,543 (7.51)
LPG Engines 22,484 (0.58)
Conventional [<1990] 20,085 (0.51)91/441/EEC [1991-1996] 2,399 (0.06)94/12/ECE [>1997] 0 (0.00)
Total fleetCalculation based on FIGAZ (1996).
3,909,065 (100.00)
Center for Economic and Social Studies on the Environment (CEESE), Université Libre de Bruxelles (ULB)
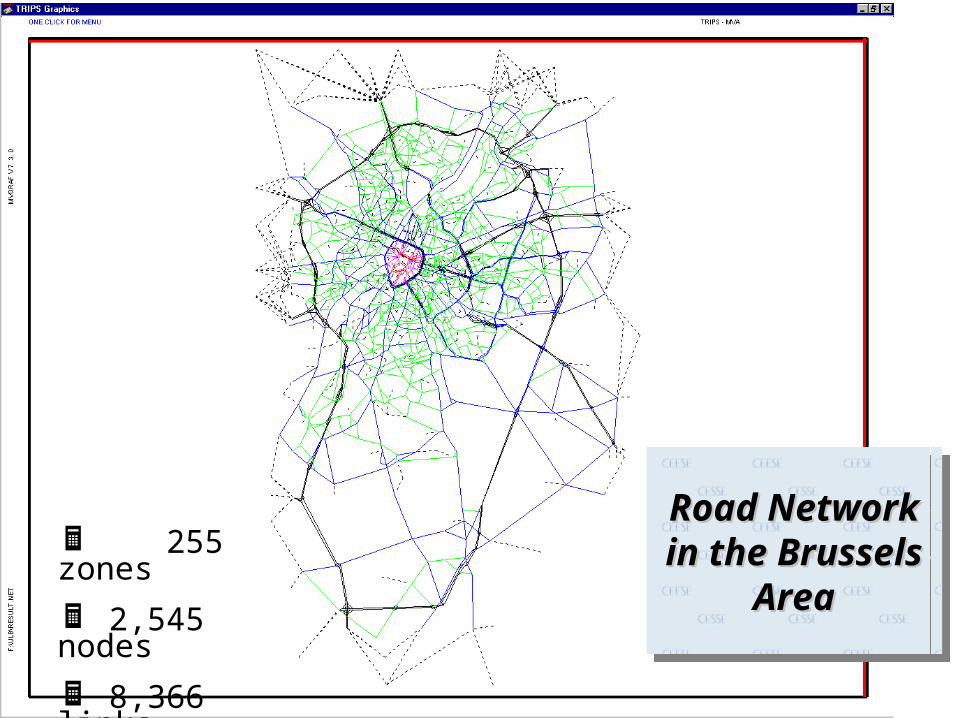
255 zones
2,545 nodes
8,366 links
Road Network in Road Network in the Brussels Areathe Brussels AreaRoad Network in Road Network in the Brussels Areathe Brussels Area
Center for Economic and Social Studies on the Environment (CEESE), Université Libre de Bruxelles (ULB)
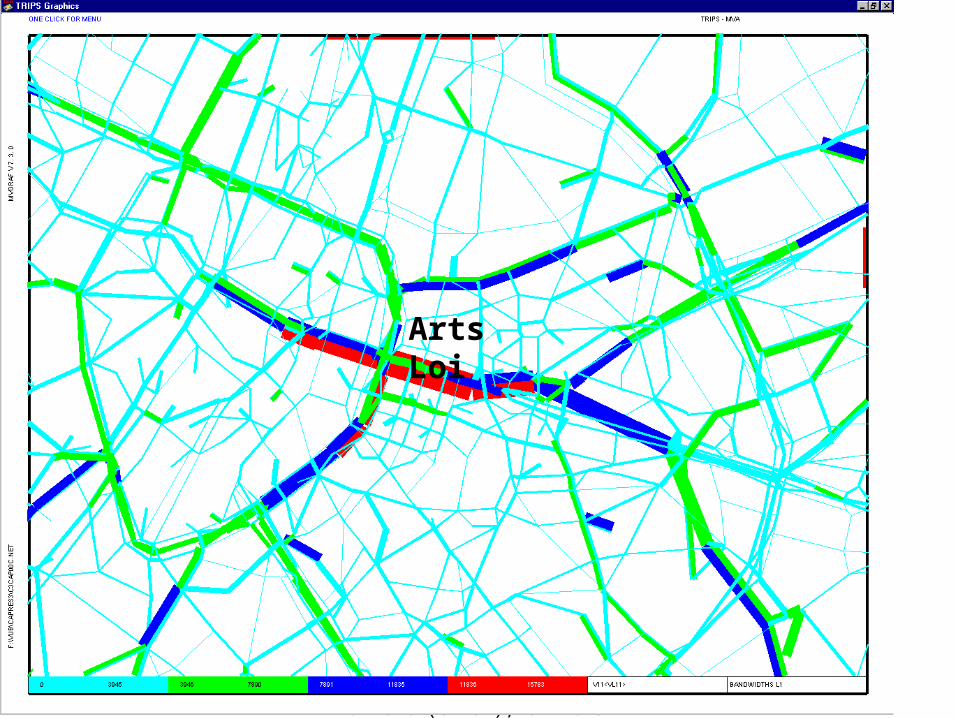
Arts Loi
Center for Economic and Social Studies on the Environment (CEESE), Université Libre de Bruxelles (ULB)
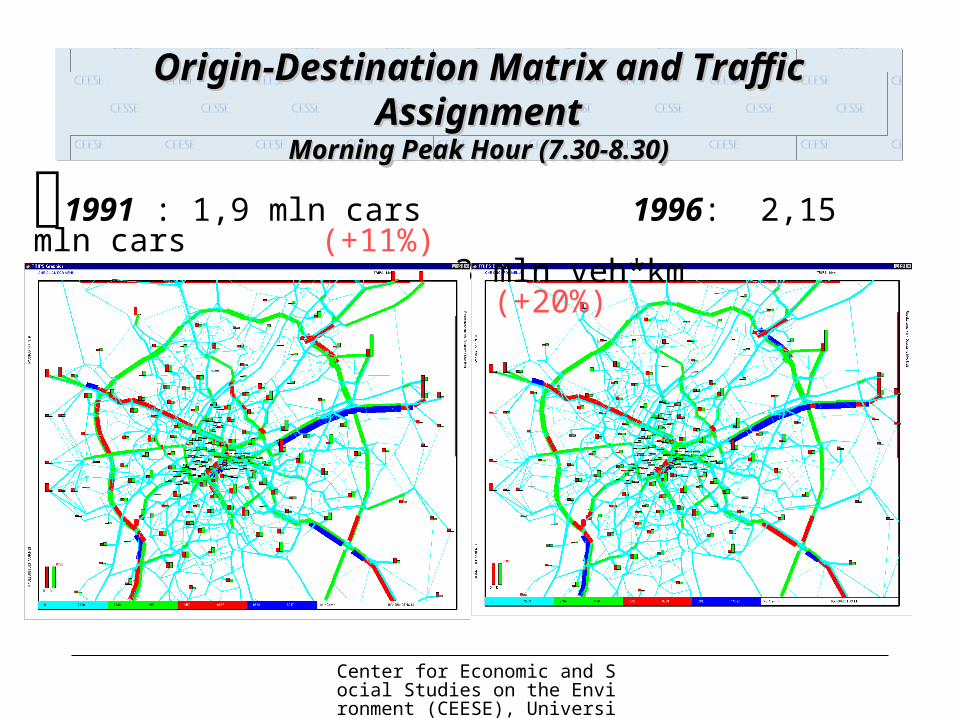
Origin-Destination Matrix and Traffic AssignmentOrigin-Destination Matrix and Traffic AssignmentMorning Peak Hour (7.30-8.30)Morning Peak Hour (7.30-8.30)
Origin-Destination Matrix and Traffic AssignmentOrigin-Destination Matrix and Traffic AssignmentMorning Peak Hour (7.30-8.30)Morning Peak Hour (7.30-8.30)
1991 : 1,9 mln cars 1996: 2,15 mln cars (+11%) 3 mln veh*km 3,6 mln veh*km (+20%)
Center for Economic and Social Studies on the Environment (CEESE), Université Libre de Bruxelles (ULB)
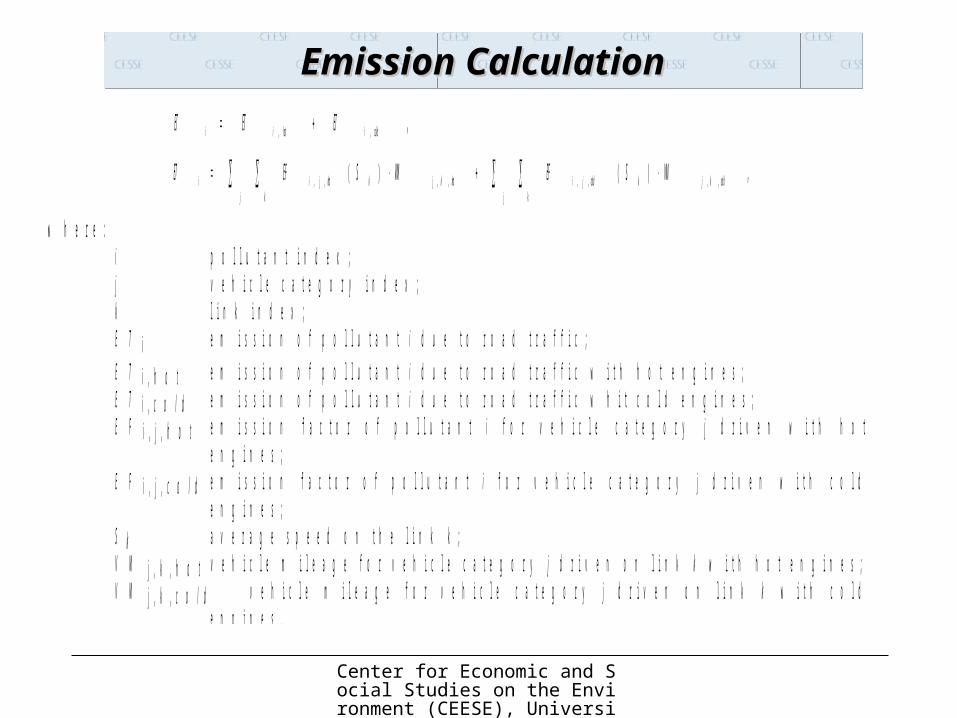
Emission CalculationEmission CalculationEmission CalculationEmission Calculation
,,, col dihotii ETETET
,)()( ,,,,,,,, j k j k
col dkjkcol djihotkjkhotjii VMSEFVMSEFET
w h e r e :i p o l l u t a n t i n d e x ;j v e h i c l e c a t e g o r y i n d e x ;k l i n k i n d e x ;E T i e m i s s i o n o f p o l l u t a n t i d u e t o r o a d t r a f f i c ;
E T i , h o t e m i s s i o n o f p o l l u t a n t i d u e t o r o a d t r a f f i c w i t h h o t e n g i n e s ;E T i , c o l d e m i s s i o n o f p o l l u t a n t i d u e t o r o a d t r a f f i c w h i t c o l d e n g i n e s ;E F i , j , h o t e m i s s i o n f a c t o r o f p o l l u t a n t i f o r v e h i c l e c a t e g o r y j d r i v e n w i t h h o t
e n g i n e s ;E F i , j , c o l d e m i s s i o n f a c t o r o f p o l l u t a n t i f o r v e h i c l e c a t e g o r y j d r i v e n w i t h c o l d
e n g i n e s ;S k a v e r a g e s p e e d o n t h e l i n k k ;V M j , k , h o t v e h i c l e m i l e a g e f o r v e h i c l e c a t e g o r y j d r i v e n o n l i n k k w i t h h o t e n g i n e s ;V M j , k , c o l d v e h i c l e m i l e a g e f o r v e h i c l e c a t e g o r y j d r i v e n o n l i n k k w i t h c o l d
e n g i n e s .
Center for Economic and Social Studies on the Environment (CEESE), Université Libre de Bruxelles (ULB)
Emission FunctionsEmission FunctionsEmission FunctionsEmission FunctionsCO
0
20
40
60
80
10 30 50 70 90 110 130 150
Speed
g/k
mHot Emissions
Cold Start Emissions
NOx
0
1
2
3
4
5
10 30 50 70 90 110 130 150
Speed
g/k
m
VOC
0
2
4
6
8
10 30 50 70 90 110 130 150
Speed
g/k
m
CO2
0
100
200
300
400
500
600
10 30 50 70 90 110 130 150
Speed
g/k
mSO2
0.00
0.05
0.10
0.15
0.20
0.25
10 30 50 70 90 110 130 150
Speed
g/k
m
PM
0.00
0.05
0.10
0.15
0.20
0.25
10 30 50 70 90 110 130 150
Speed
g/k
m
Center for Economic and Social Studies on the Environment (CEESE), Université Libre de Bruxelles (ULB)
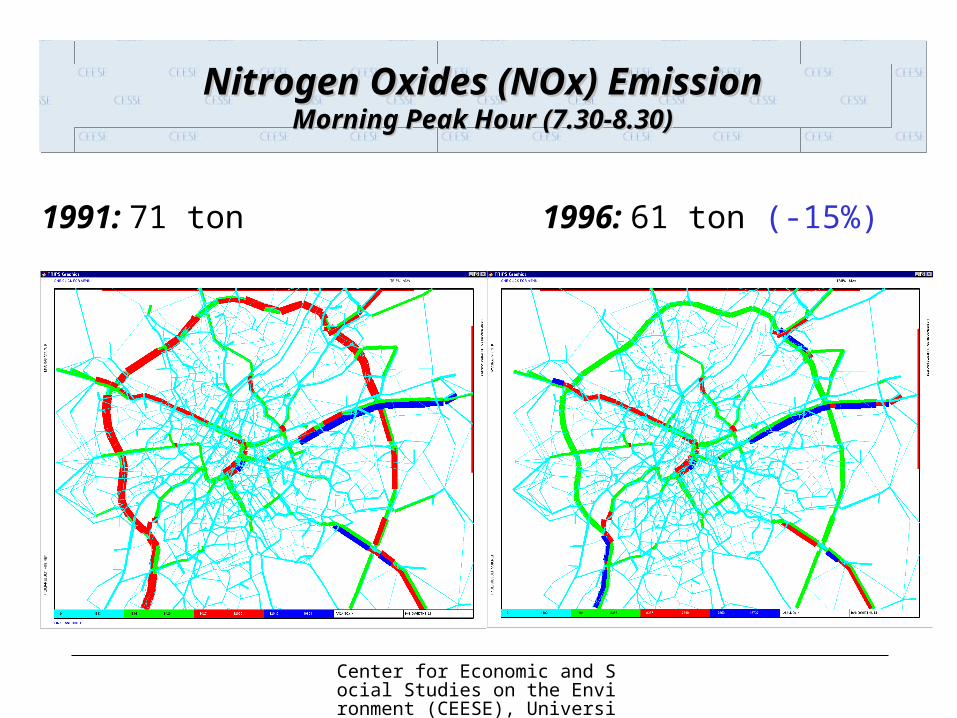
Nitrogen Oxides (NOx) EmissionNitrogen Oxides (NOx) EmissionMorning Peak Hour (7.30-8.30)Morning Peak Hour (7.30-8.30)
Nitrogen Oxides (NOx) EmissionNitrogen Oxides (NOx) EmissionMorning Peak Hour (7.30-8.30)Morning Peak Hour (7.30-8.30)
1991: 71 ton 1996: 61 ton (-15%)
Center for Economic and Social Studies on the Environment (CEESE), Université Libre de Bruxelles (ULB)
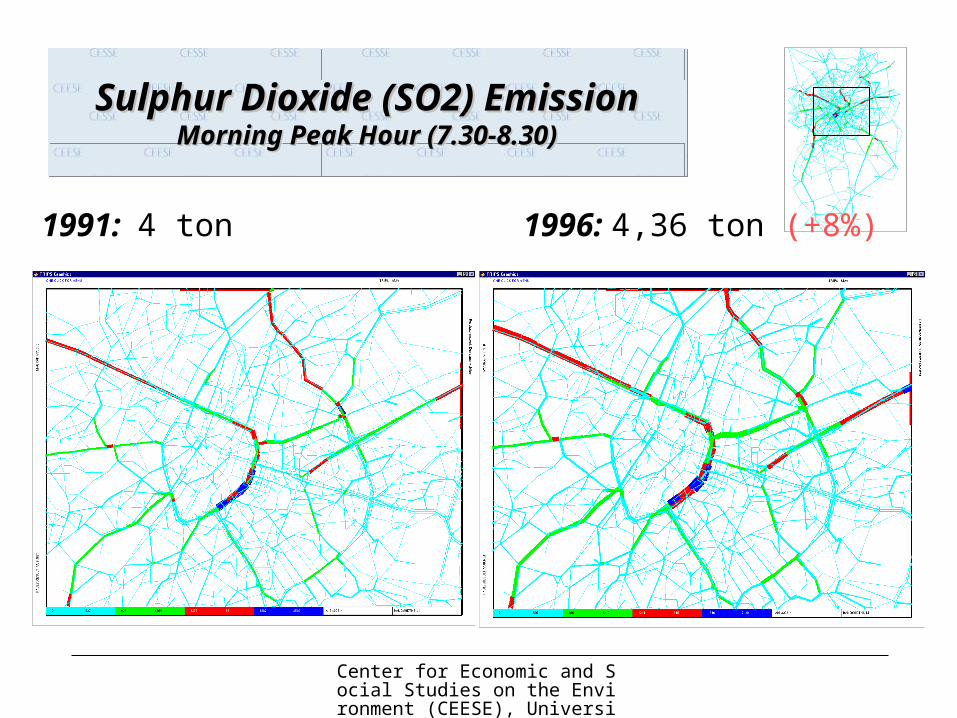
Sulphur Dioxide (SO2) EmissionSulphur Dioxide (SO2) EmissionMorning Peak Hour (7.30-8.30)Morning Peak Hour (7.30-8.30)
Sulphur Dioxide (SO2) EmissionSulphur Dioxide (SO2) EmissionMorning Peak Hour (7.30-8.30)Morning Peak Hour (7.30-8.30)
1991: 4 ton 1996: 4,36 ton (+8%)
Center for Economic and Social Studies on the Environment (CEESE), Université Libre de Bruxelles (ULB)
Considerations for ScenariosConsiderations for ScenariosConsiderations for ScenariosConsiderations for Scenarios
Mobility tendencies in the Region
Modal Choice Patterns
Developments of the Transportation Network
Dynamics of Vehicle Composition
Center for Economic and Social Studies on the Environment (CEESE), Université Libre de Bruxelles (ULB)
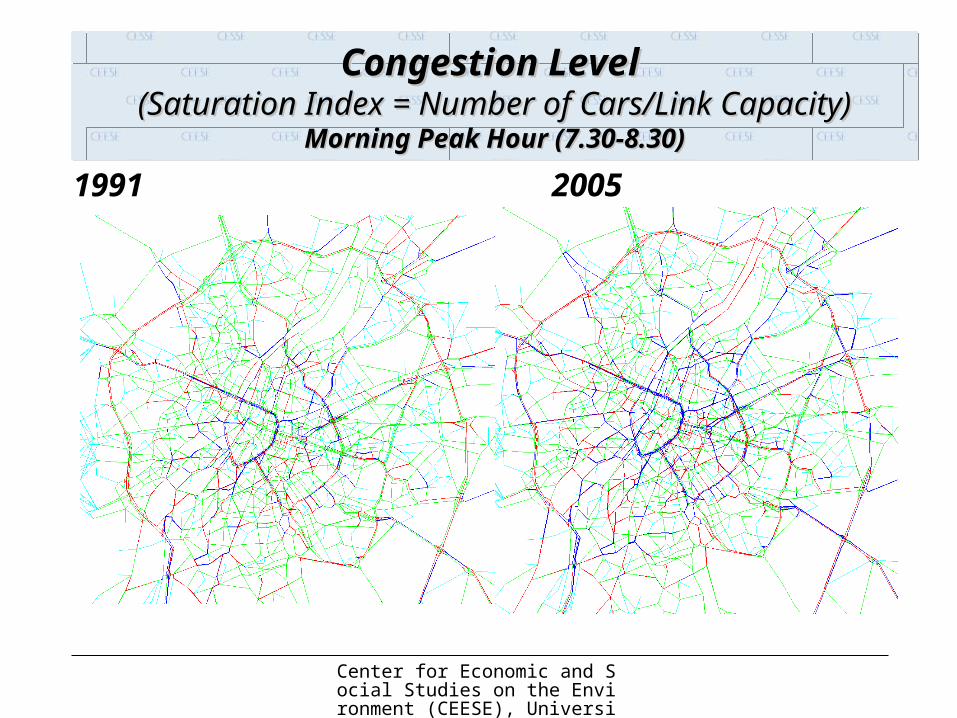
Congestion Level Congestion Level (Saturation Index = Number of Cars/Link Capacity)(Saturation Index = Number of Cars/Link Capacity)
Morning Peak Hour (7.30-8.30)Morning Peak Hour (7.30-8.30)
Congestion Level Congestion Level (Saturation Index = Number of Cars/Link Capacity)(Saturation Index = Number of Cars/Link Capacity)
Morning Peak Hour (7.30-8.30)Morning Peak Hour (7.30-8.30)
1991 2005
Center for Economic and Social Studies on the Environment (CEESE), Université Libre de Bruxelles (ULB)
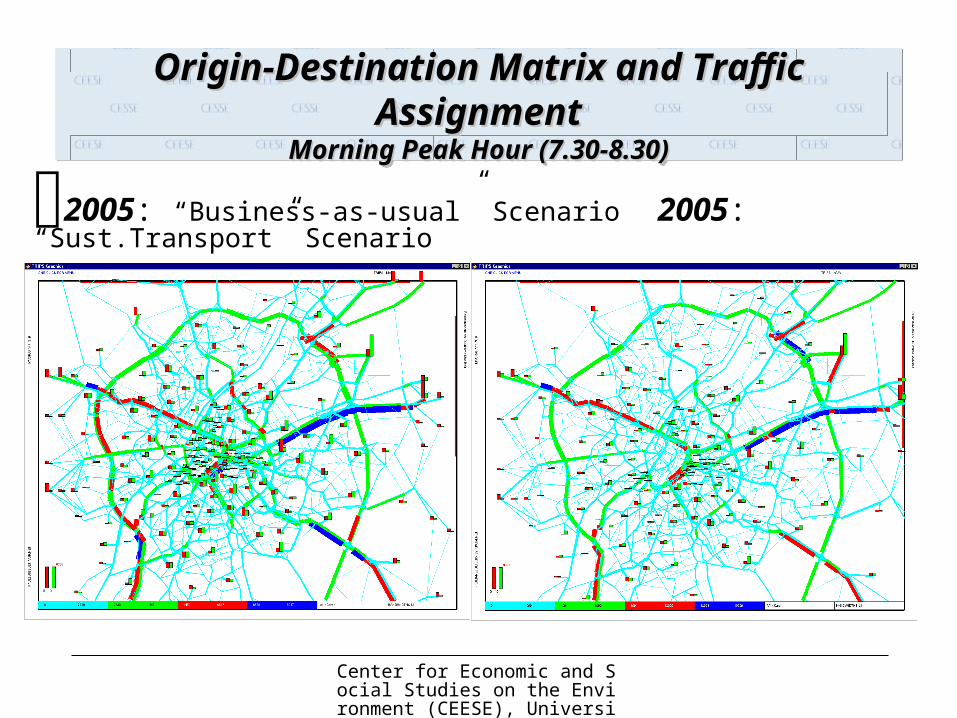
Origin-Destination Matrix and Traffic AssignmentOrigin-Destination Matrix and Traffic AssignmentMorning Peak Hour (7.30-8.30)Morning Peak Hour (7.30-8.30)
Origin-Destination Matrix and Traffic AssignmentOrigin-Destination Matrix and Traffic AssignmentMorning Peak Hour (7.30-8.30)Morning Peak Hour (7.30-8.30)
2005: “Business-as-usual” Scenario 2005: “Sust.Transport” Scenario
Center for Economic and Social Studies on the Environment (CEESE), Université Libre de Bruxelles (ULB)
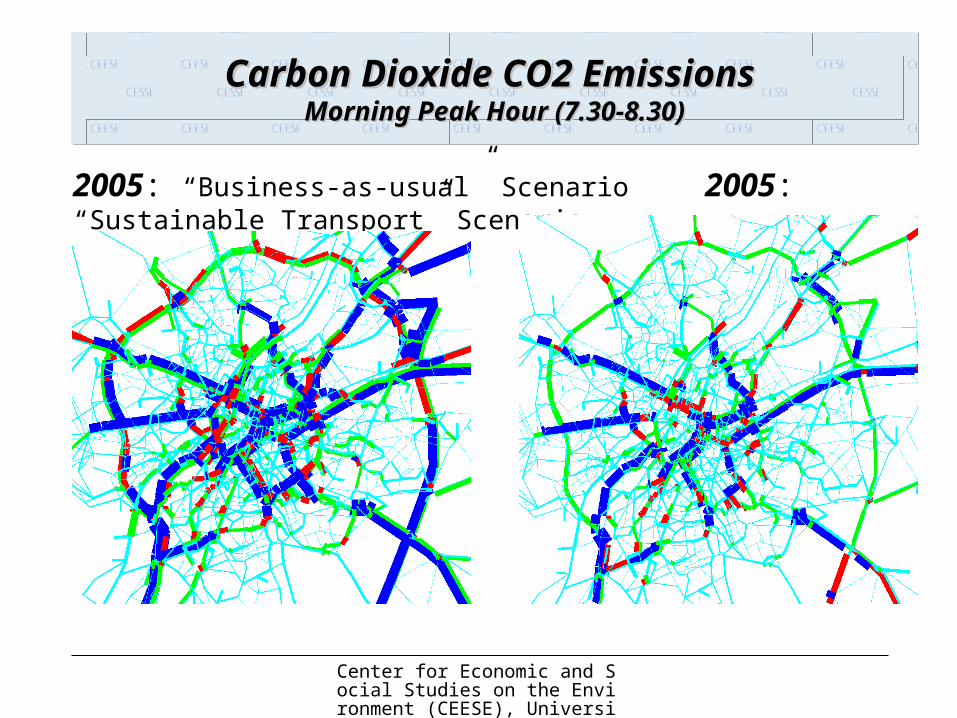
Carbon Dioxide CO2 Emissions Carbon Dioxide CO2 Emissions Morning Peak Hour (7.30-8.30)Morning Peak Hour (7.30-8.30)
Carbon Dioxide CO2 Emissions Carbon Dioxide CO2 Emissions Morning Peak Hour (7.30-8.30)Morning Peak Hour (7.30-8.30)
2005: “Business-as-usual” Scenario 2005: “Sustainable Transport” Scenario
Center for Economic and Social Studies on the Environment (CEESE), Université Libre de Bruxelles (ULB)
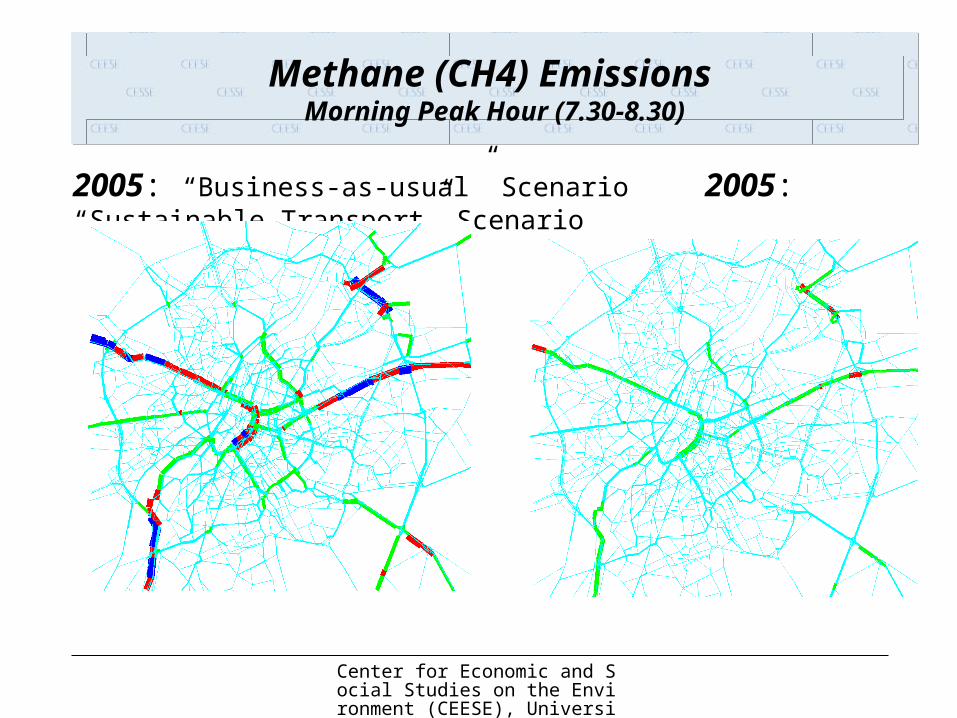
Methane (CH4) Emissions Morning Peak Hour (7.30-8.30)
Methane (CH4) Emissions Morning Peak Hour (7.30-8.30)
2005: “Business-as-usual” Scenario 2005: “Sustainable Transport” Scenario
Center for Economic and Social Studies on the Environment (CEESE), Université Libre de Bruxelles (ULB)
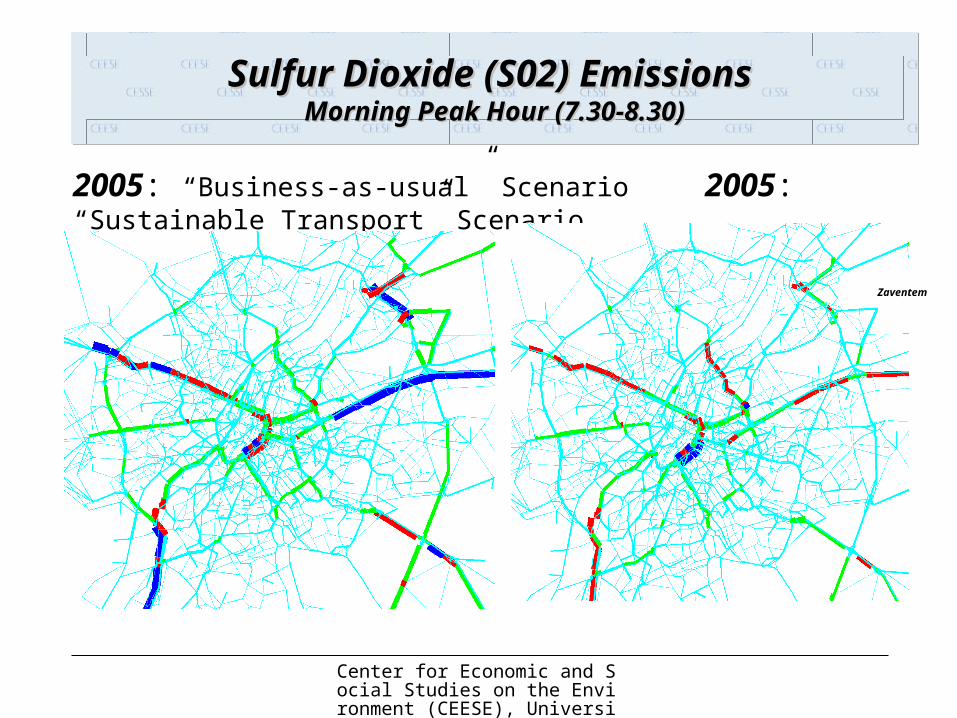
Sulfur Dioxide (S02) Emissions Sulfur Dioxide (S02) Emissions Morning Peak Hour (7.30-8.30)Morning Peak Hour (7.30-8.30)
Sulfur Dioxide (S02) Emissions Sulfur Dioxide (S02) Emissions Morning Peak Hour (7.30-8.30)Morning Peak Hour (7.30-8.30)
2005: “Business-as-usual” Scenario 2005: “Sustainable Transport” Scenario
Zaventem
Center for Economic and Social Studies on the Environment (CEESE), Université Libre de Bruxelles (ULB)
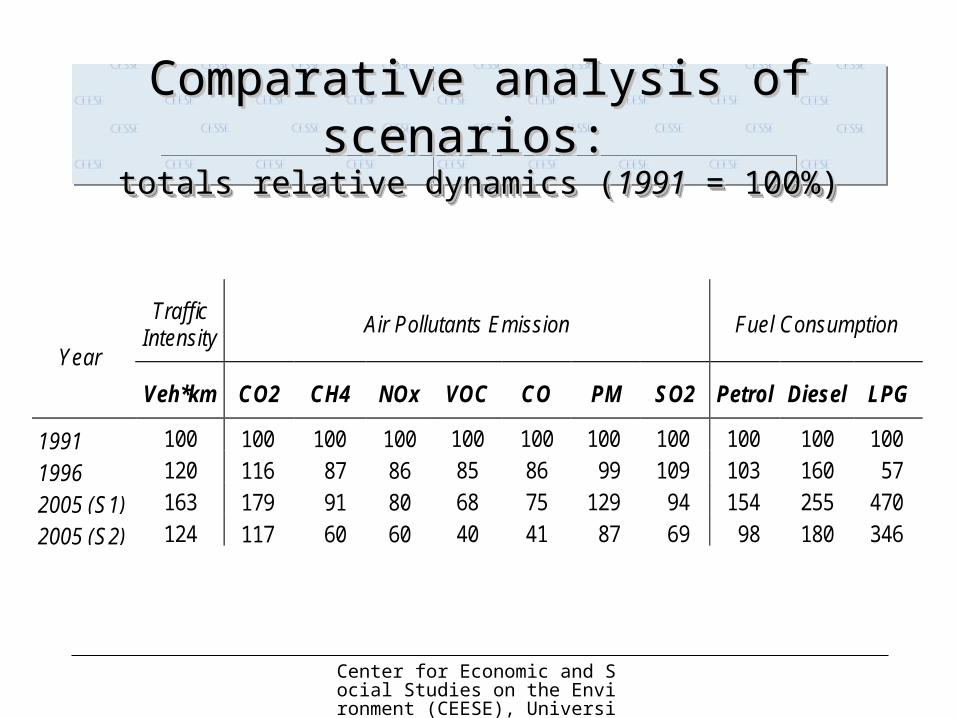
Comparative analysis of scenarios: Comparative analysis of scenarios: totals relative dynamics (totals relative dynamics (19911991 = 100%) = 100%)
Comparative analysis of scenarios: Comparative analysis of scenarios: totals relative dynamics (totals relative dynamics (19911991 = 100%) = 100%)
TrafficIntensity
Air Pollutants Emission Fuel Consumption
Year
Veh*km CO2 CH4 NOx VOC CO PM SO2 Petrol Diesel LPG
1991 100 100 100 100 100 100 100 100 100 100 100
1996 120 116 87 86 85 86 99 109 103 160 57
2005 (S1) 163 179 91 80 68 75 129 94 154 255 470
2005 (S2) 124 117 60 60 40 41 87 69 98 180 346
Center for Economic and Social Studies on the Environment (CEESE), Université Libre de Bruxelles (ULB)
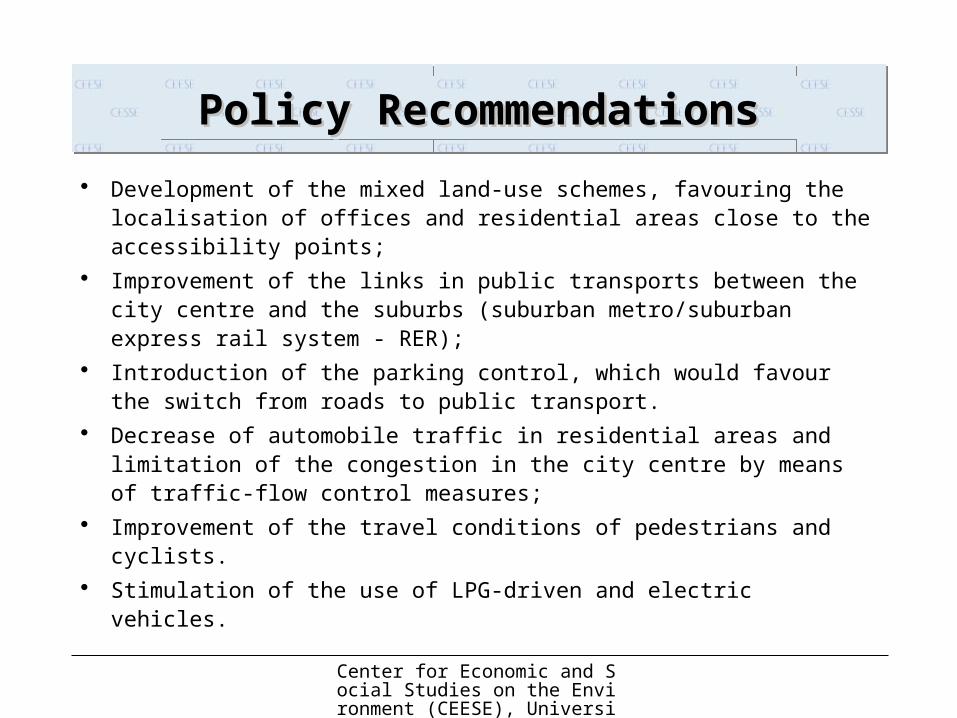
Policy RecommendationsPolicy RecommendationsPolicy RecommendationsPolicy Recommendations
Development of the mixed land-use schemes, favouring the localisation of offices and residential areas close to the accessibility points;
Improvement of the links in public transports between the city centre and the suburbs (suburban metro/suburban express rail system - RER);
Introduction of the parking control, which would favour the switch from roads to public transport.
Decrease of automobile traffic in residential areas and limitation of the congestion in the city centre by means of traffic-flow control measures;
Improvement of the travel conditions of pedestrians and cyclists. Stimulation of the use of LPG-driven and electric vehicles.

Recommended