
Policy Paper No.24
THE PRIVATIZATION PROGRAM
by
Dr. Hafiz. A. Pasha
September, 2014
Social Policy and Development Centre - Karachi

ACRONYMS
ABL Allied Bank Limited
ADB Asian Development Bank
ARL Attock Refinery Limited
CCI Council of Common Interests
CCOP Cabinet Committee on Privatization
CEOs Chief Executive Officers
EFF Extended Fund Facility (EFF)
FDI Foreign Direct Investment
FESCO Faisalabad Electric Supply Company
FPI Foreign Portfolio Investment
GDP Growth Domestic Product
GDR Global Depositary Receipt
GHPL Government Holdings (Private) Limited
HBL Habib Bank Limited
HEC Higher Education Commission
HESCO Hyderabad Electric Supply Company
IESCO Islamabad Electric Supply Company
IMF International Monetary Fund
JPCL Jamshoro Power Company Limited
KAPCO Kot Addu Power Company Limited
KESC Karachi Electric Supply Company
KSE Karachi Stock Exchange
MCB Muslim Commercial Bank
NBP National Bank of Pakistan
NICL National Insurance Company Limited
NIT National Investment Trust
NPCC National Power Construction Corporation
NPGCL Northern Power Generation Company Limited
NRL National Refinery Limited
NSC National Safety Council
OGDCL Oil and Gas Development Company Limited
II
The Privatization Program Policy Paper No.24
PASMIC Pakistan Steel Mill
PECO Pakistan Electric Company
PEPCO Pakistan Electric Power Company
PIA Pakistan International Airline
PIBs Pakistan Investment Bonds
PML(N) Pakistan Muslim League (Nawaz)
PNSC Pakistan National Shipping Corporation
POL Pakistan Oilfields Limited
PPL Pakistan Petroleum Limited
PPP Pakistan People’s Party
PRCL Pakistan Reinsurance Company Limited
PSEs Public State Enterprises
PSO Pakistan State Oil
SBP State Bank of Pakistan
SLIC State Life Insurance Corporation
SME Small and Medium Enterprises
SNGPL Sui Northern Gas Pipelines Limited
SSGC Sui Southern Gas Company
SSGCL Sui Southern Gas Company Limited
UBL United Bank Limited
WAPDA Water and Power Development Authority
III
Policy Paper No.24 The Privatization Program
TABLE OF CONTENTS
Page #s
1. THE FRAMEWORK .........................................................................................2
1.1. The Law ...........................................................................................2
1.2. The PML (N) Manifesto ....................................................................2
2. POST- PRIVATIZATION ...................................................................................4
2.1. Level of Composition .......................................................................4
2.2. Post-Privatization Experience ..........................................................5
2.3 Lessons Learned .............................................................................6
3. THE PRIVATIZATION PORTFOLIO .....................................................................7
3.1. Size, Modalities and Composition ....................................................7
3.2. Progress ........................................................................................10
4. CRITERIA FOR PRIVATIZATION ......................................................................11
4.1. Market Sale of Shares ...................................................................11
4.2. Privatization to Strategic Investor ..................................................12
5. IMPACT OF PRIVATIZATION ...........................................................................14
5.1. Market Sale of Shares ...................................................................14
5.2. Privatization to Strategic Investor ..................................................14
6. CONCLUSIONS AND RECOMMENDATIONS .......................................................15
IV
The Privatization Program Policy Paper No.24
List of Charts and Tables:
Chart 1: Structural Benchmarks in IMF Program .............................................10
Chart 2: Case for Privatization.........................................................................13
Chart 3: Impact of Different Forms of Privatization ..........................................14
Table 1: Privatization Proceeds – 1991-2011 ....................................................4
Table 2: Units up for Privatization in Agreement with IMF .................................7
Table 3: Key Financial Statistics of Major PSEs ................................................8
Table 4: Market Capitalization of Shares by Sector ...........................................9
Table 5: Gains / Loss from Sale of Shares ......................................................12
Table S-1: Application of Criteria for Evaluation of Case for Privatization ...........17
Table S-2: Application of Criteria for Evaluation of Case for Privatization ...........17
1
The Privatization Program Policy Paper 24
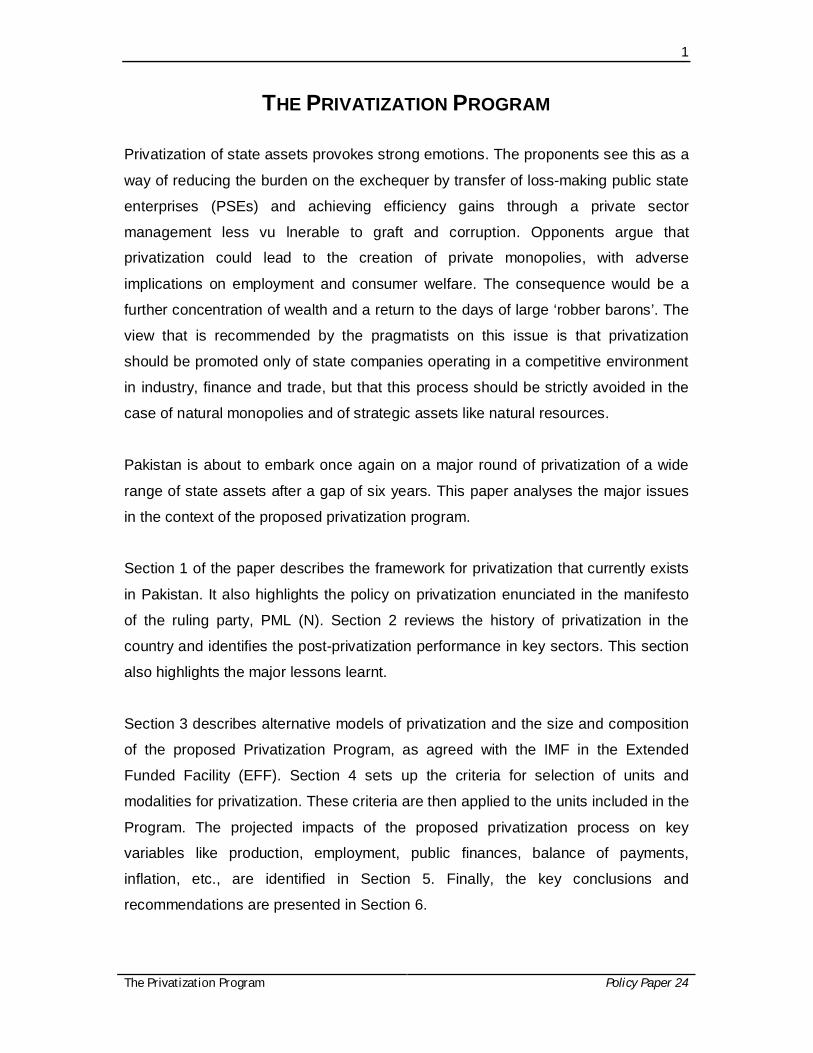
THE PRIVATIZATION PROGRAM
Privatization of state assets provokes strong emotions. The proponents see this as a
way of reducing the burden on the exchequer by transfer of loss-making public state
enterprises (PSEs) and achieving efficiency gains through a private sector
management less vu lnerable to graft and corruption. Opponents argue that
privatization could lead to the creation of private monopolies, with adverse
implications on employment and consumer welfare. The consequence would be a
further concentration of wealth and a return to the days of large ‘robber barons’. The
view that is recommended by the pragmatists on this issue is that privatization
should be promoted only of state companies operating in a competitive environment
in industry, finance and trade, but that this process should be strictly avoided in the
case of natural monopolies and of strategic assets like natural resources.
Pakistan is about to embark once again on a major round of privatization of a wide
range of state assets after a gap of six years. This paper analyses the major issues
in the context of the proposed privatization program.
Section 1 of the paper describes the framework for privatization that currently exists
in Pakistan. It also highlights the policy on privatization enunciated in the manifesto
of the ruling party, PML (N). Section 2 reviews the history of privatization in the
country and identifies the post-privatization performance in key sectors. This section
also highlights the major lessons learnt.
Section 3 describes alternative models of privatization and the size and composition
of the proposed Privatization Program, as agreed with the IMF in the Extended
Funded Facility (EFF). Section 4 sets up the criteria for selection of units and
modalities for privatization. These criteria are then applied to the units included in the
Program. The projected impacts of the proposed privatization process on key
variables like production, employment, public finances, balance of payments,
inflation, etc., are identified in Section 5. Finally, the key conclusions and
recommendations are presented in Section 6.
2
The Privatization Program Policy Paper No.24
1. THE FRAMEWORK 1.1. The Law
Pakistan does not have a comprehensive Privatization Law like Turkey, Philippines,
Algeria, Morocco, Tunisia, Jordan, Bulgaria and others. Instead, privatization is
undertaken under the Privatization Commission Ordinance of 2000. It describes the
structure and functions of the Privatization Commission, the financial provisions, the
process of privatization, jurisdiction of the Courts, regulatory and other provisions.
The Ordinance has a key provision regarding the utilization of privatization proceeds
distributed to the federal government. According to Section 16(2), ten percent shall
be used for the poverty alleviation programme and ninety percent for retirement of
federal government debt.
Also, Section 5 states that the Privatization Commission must “advise the federal
government that monopolies are not created in the process of privatization”. Policy
decisions are taken by the Cabinet Committee on Privatization (CCOP).
The Constitution of Pakistan contains an important provision which has important
implications on the process of privatization. Article 173(2) states the following:
‘Subject to the existing commitments and obligations, mineral oil and
natural gas within a Province … shall vest jointly and equally in that
Province and the Federal Government’.
This may be taken as implying that any state companies in oil and gas exploration,
extraction and distribution should be privatized only after formal approval in the
Council of Common Interests (CCI). Further, the proceeds should be shared on a
50:50 basis between the federal government and provincial governments ( where the
natural resources are located).
1.2. The PML (N) Manifesto
The policy on privatization of the party is given in the section of the manifesto on
‘State Owned Enterprises’, which is part of the first chapter on ‘Economic Revival’.
The focus is on state-owned institutions like PIA, Railway, Pakistan Steel Mills,
3
Policy Paper No.24 The Privatization Program
WAPDA and other institutions who are a major drag on Pakistan’s economy, with
losses of Rs 400 billion per annum. It is proposed to reform these institutions through
a combination of privatization and restructuring.
As such, after induction into power, PML (N) proposed to initiate the following actions
to turn around the loss-making PSEs:
Appoint independent and professional boards who in turn will appoint
competent CEOs of state enterprises. Professional competence and
merit will be the only criteria for appointment of boards and CEOs.
The immediate task of the boards and CEOs will be to manage these
corporations effectively and to plug the losses.
Assign quantifiable targets and monitor on a regular basis.
Performance evaluation will also be carried out to ensure
accountability.
Stop every kind of political interference in the affairs of these
enterprises.
Undertake deep-seated and urgent reforms in the relevant sub-sectors.
Identify enterprises which need to be privatized and assign targets to
the Privatization Commission to ensure completion of the privatization
process within the assigned time frame.
Operational standards will be prescribed and complete autonomy will
be given to achieve them.
PIA shall be transformed into a profitable and reputed airline of the
Region.
There will be a special focus on Pakistan Railways to improve its
operations. It has strategic importance and is the favored mode of
transportation for the common man and cargo carriages. A fully
autonomous board will be set up to oversee the working of Railways.
The initial implementation of the above reforms has been weak.
4
The Privatization Program Policy Paper No.24
2. PAST PRIVATIZATION 2.1. Level and Composition
The major process of privatization started in 1991 during the tenure of the first Nawaz
Sharif government. The peak was attained in the Musharraf period, 1999 to 2008.
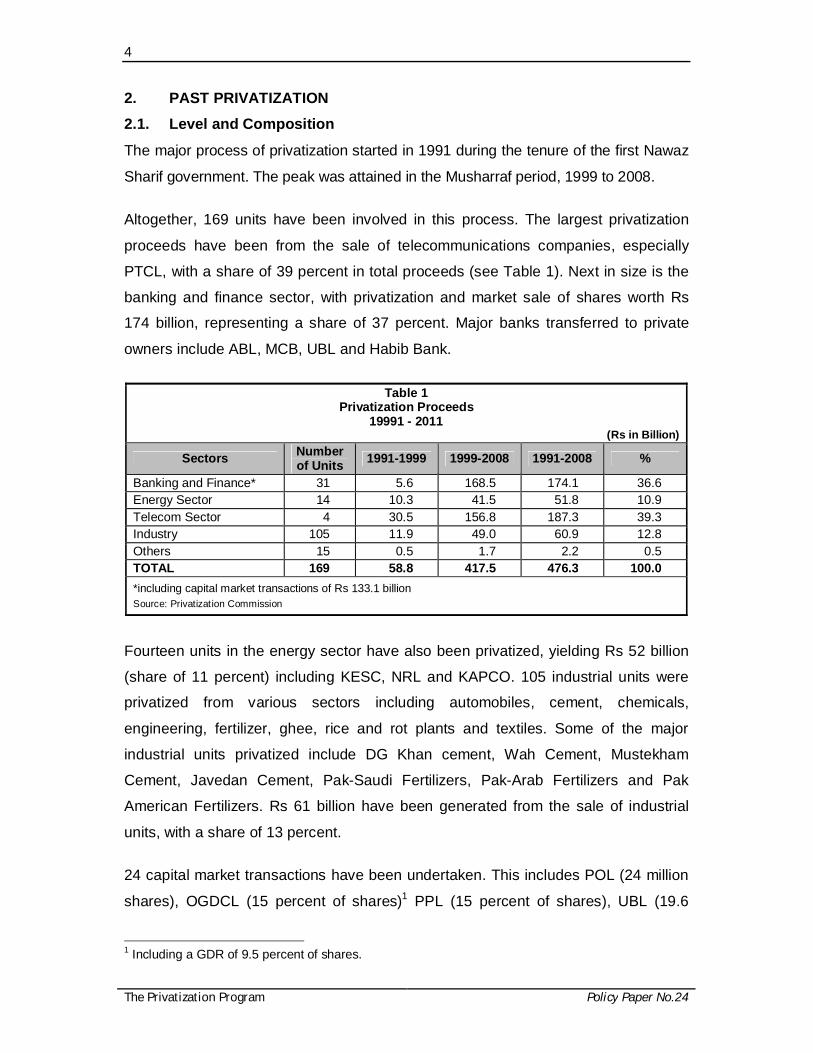
Altogether, 169 units have been involved in this process. The largest privatization
proceeds have been from the sale of telecommunications companies, especially
PTCL, with a share of 39 percent in total proceeds (see Table 1). Next in size is the
banking and finance sector, with privatization and market sale of shares worth Rs
174 billion, representing a share of 37 percent. Major banks transferred to private
owners include ABL, MCB, UBL and Habib Bank.
Table 1
Privatization Proceeds 19991 - 2011
(Rs in Billion)
Sectors Number of Units 1991-1999 1999-2008 1991-2008 %
Banking and Finance* 31 5.6 168.5 174.1 36.6 Energy Sector 14 10.3 41.5 51.8 10.9 Telecom Sector 4 30.5 156.8 187.3 39.3 Industry 105 11.9 49.0 60.9 12.8 Others 15 0.5 1.7 2.2 0.5 TOTAL 169 58.8 417.5 476.3 100.0 *including capital market transactions of Rs 133.1 billion
Source: Privatization Commission
Fourteen units in the energy sector have also been privatized, yielding Rs 52 billion
(share of 11 percent) including KESC, NRL and KAPCO. 105 industrial units were
privatized from various sectors including automobiles, cement, chemicals,
engineering, fertilizer, ghee, rice and rot plants and textiles. Some of the major
industrial units privatized include DG Khan cement, Wah Cement, Mustekham
Cement, Javedan Cement, Pak-Saudi Fertilizers, Pak-Arab Fertilizers and Pak
American Fertilizers. Rs 61 billion have been generated from the sale of industrial
units, with a share of 13 percent.
24 capital market transactions have been undertaken. This includes POL (24 million
shares), OGDCL (15 percent of shares)1 PPL (15 percent of shares), UBL (19.6
1 Including a GDR of 9.5 percent of shares.
5
Policy Paper No.24 The Privatization Program
percent of shares) and HBL (7.5 percent of shares). The total yield from these sales
is Rs 133 billion, about 28 percent of the total proceeds.
Large revenues of Rs 418 billion were generated from privatization during the
Musharraf period, equivalent to 88 percent of the cumulative proceeds since 1991,
including almost $ 6 billion of foreign exchange receipts. This represents a share of
30 percent of the total FDI and FPI combined during this period and 70 percent of
the foreign exchange reserves at the time of transition in 2008 to the PPP
government. Clearly, the Musharraf government used privatization as a way of
promoting FDI and building up foreign exchange reserves. As we shall show later, a
similar policy is now being followed by the PML (N) government.
2.2. Post-Privatization Experience
Asian Development Bank has assessed the performance of 100 units after
privatization in Pakistan. Only 20 units appear to be performing better than before. In
the case of manufacturing, 16 out of the 38 privatized units were performing worse
than in the pre-privatization period. Transparency has been weak and regulatory
mechanisms ineffective and extremely politicized2.
A comparison of nationalized banks in the late 1970s with privatized banks in recent
years yields interesting conclusions. First, the latter are more risk-averse. Only 31
percent of the assets are in the form of credit and as much as 50 percent in
government securities. As opposed to this, nationalized banks devoted 55 percent of
their assets to credit and only 27 percent to investment in risk-free government
treasury bills and bonds.
Second, the share of nationalized bank credit to agriculture was over 13 percent as
compared to 5 percent only by the private banks currently. A credit plan at that time
ensured that enough credit was allocated to priority sectors like agriculture, SMEs
and exports. Third, the margin between the return on advances and on deposits was
lower at about 5 percent in the late 70s as compared to over 7 percent currently.
This highlights the likelihood of cartelization behavior by private banks. 2 Tahir, Pervez (2014), “Privatisation and business-politics nexus”, Daily Express Tribune, September 5, 2014.
6
The Privatization Program Policy Paper No.24
KESC is the only power distribution company that has been privatized. There are ten
other distribution companies under PEPCO. KESC’s performance compares
unfavorably with PEPCO. Transmission and distribution losses are as high as 31
percent as compared to 21 percent in the latter. Billing losses are 15 percent, almost
5 percent higher than in PEPCO.
2.3. Lessons Learned
The above findings clearly indicate that privatization is no guarantee for improved
efficiency. This depends not only on the management skills and experience of the
new private strategic investor but also on the market environment and presence of
effective regulatory mechanisms.
Khan (2012)3, who served as Secretary of the Privatization Commission, has
undertaken a comprehensive study of the Impact of privatization in Pakistan. He has
emphasized on the need for full transparency of transactions and cast some doubts
on the process followed for privatization of MCB and HBL.
There is also a need for proper valuation and coverage of assets of the unit to be
privatized. The Supreme Court stopped the privatization of PASMIC because of this
problem. In some cases, like KESC, despite a commitment, enough investment has
not been made in the renovation and upgradation of assets.
One of the biggest lessons is that gains from privatization hinge crucially on the
presence of autonomous, effective and alert regulatory agencies, free from any
political influence and with quasi-judicial powers. This will prevent monopolistic
behavior or emergence of cartels and protect consumer interests.
There is a view that post-privatization banks have effectively formed a cartel and
raised their margins between the rate of return on advances and deposits.
Apparently, the State Bank of Pakistan (SBP) has not done enough to get this
margin reduced. The same suspicion about price-setting behavior applies to private
cement companies.
3 Khan, A.H, 2012, “The Impact of Privatization in Pakistan”, Ferozesons, Lahore.
7
Policy Paper No.24 The Privatization Program
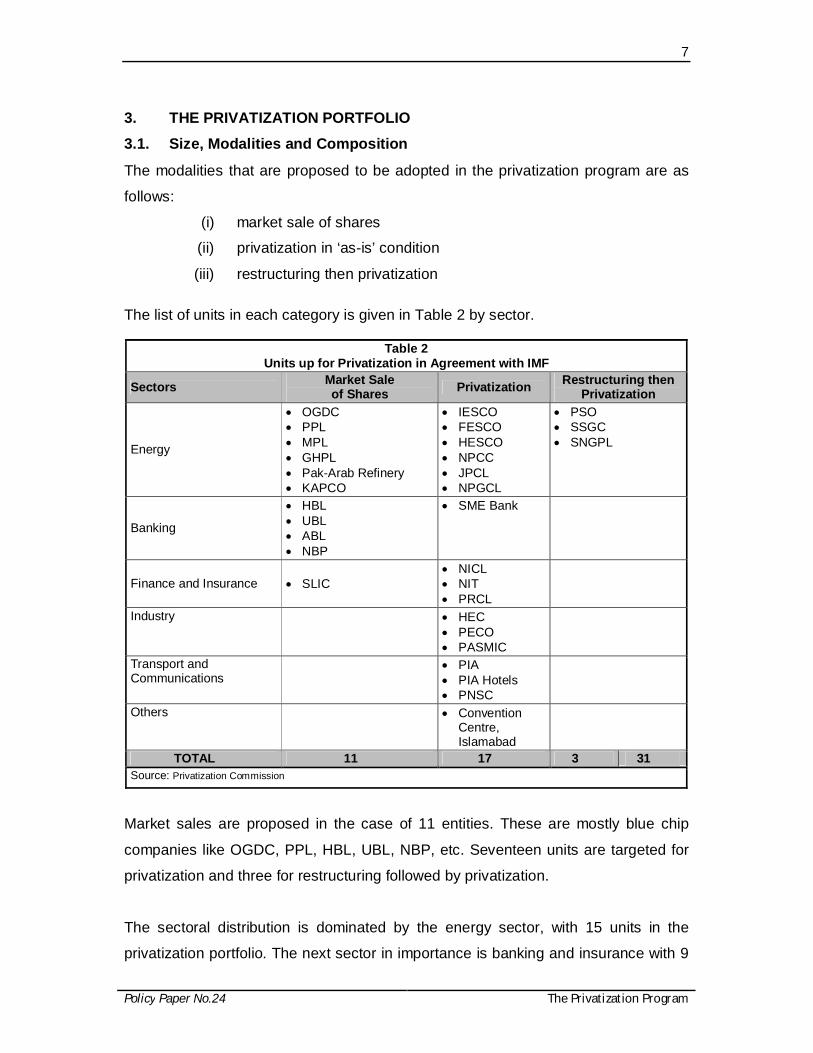
3. THE PRIVATIZATION PORTFOLIO 3.1. Size, Modalities and Composition
The modalities that are proposed to be adopted in the privatization program are as
follows:
(i) market sale of shares
(ii) privatization in ‘as-is’ condition
(iii) restructuring then privatization
The list of units in each category is given in Table 2 by sector.
Table 2 Units up for Privatization in Agreement with IMF
Sectors Market Sale of Shares Privatization Restructuring then
Privatization
Energy
OGDC PPL MPL GHPL Pak-Arab Refinery KAPCO
IESCO FESCO HESCO NPCC JPCL NPGCL
PSO SSGC SNGPL
Banking
HBL UBL ABL NBP
SME Bank
Finance and Insurance SLIC NICL NIT PRCL
Industry
HEC PECO PASMIC
Transport and Communications
PIA PIA Hotels PNSC
Others
Convention Centre, Islamabad
TOTAL 11 17 3 31 Source: Privatization Commission
Market sales are proposed in the case of 11 entities. These are mostly blue chip
companies like OGDC, PPL, HBL, UBL, NBP, etc. Seventeen units are targeted for
privatization and three for restructuring followed by privatization.
The sectoral distribution is dominated by the energy sector, with 15 units in the
privatization portfolio. The next sector in importance is banking and insurance with 9
8
The Privatization Program Policy Paper No.24
units. Three industrial units, viz, HEC, PECO and PASMIC are targeted for
privatization. Three units, namely, PIA (plus hotels) and NSC are from the transport
and communications center.
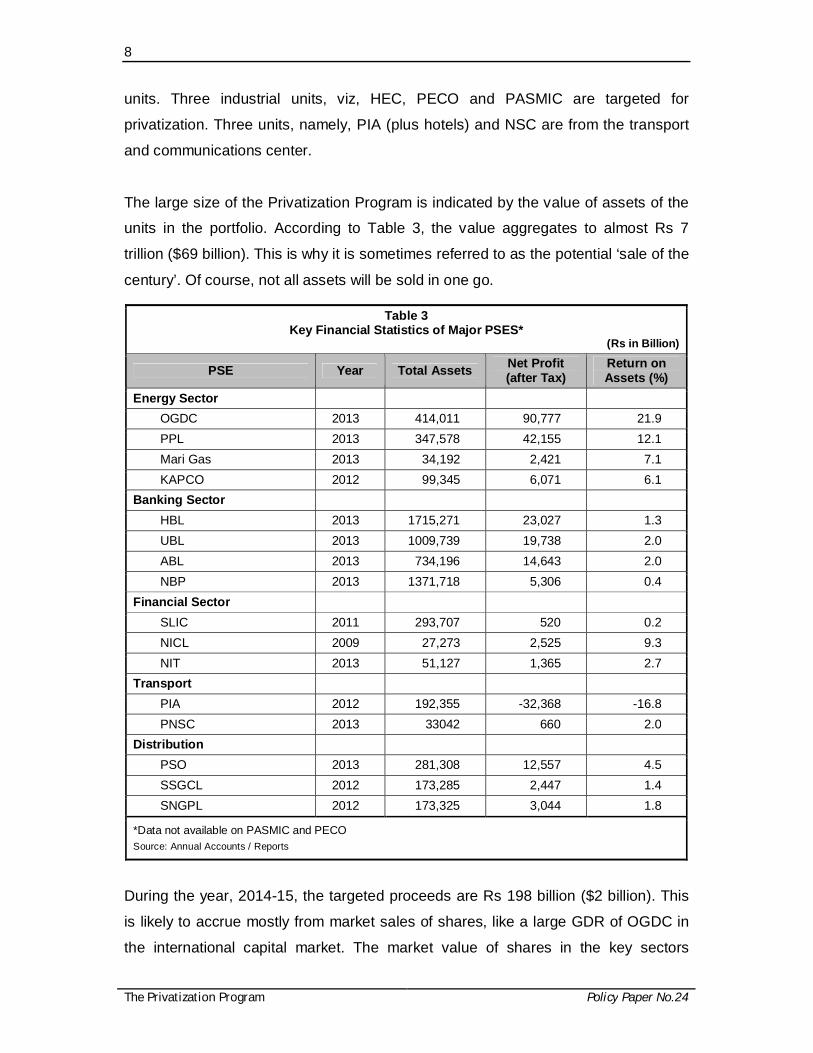
The large size of the Privatization Program is indicated by the value of assets of the
units in the portfolio. According to Table 3, the value aggregates to almost Rs 7
trillion ($69 billion). This is why it is sometimes referred to as the potential ‘sale of the
century’. Of course, not all assets will be sold in one go.
Table 3 Key Financial Statistics of Major PSES*
(Rs in Billion)
PSE Year Total Assets Net Profit (after Tax)
Return on Assets (%)
Energy Sector OGDC 2013 414,011 90,777 21.9 PPL 2013 347,578 42,155 12.1 Mari Gas 2013 34,192 2,421 7.1 KAPCO 2012 99,345 6,071 6.1
Banking Sector HBL 2013 1715,271 23,027 1.3 UBL 2013 1009,739 19,738 2.0 ABL 2013 734,196 14,643 2.0 NBP 2013 1371,718 5,306 0.4
Financial Sector SLIC 2011 293,707 520 0.2 NICL 2009 27,273 2,525 9.3 NIT 2013 51,127 1,365 2.7
Transport PIA 2012 192,355 -32,368 -16.8 PNSC 2013 33042 660 2.0
Distribution PSO 2013 281,308 12,557 4.5 SSGCL 2012 173,285 2,447 1.4 SNGPL 2012 173,325 3,044 1.8
*Data not available on PASMIC and PECO Source: Annual Accounts / Reports
During the year, 2014-15, the targeted proceeds are Rs 198 billion ($2 billion). This
is likely to accrue mostly from market sales of shares, like a large GDR of OGDC in
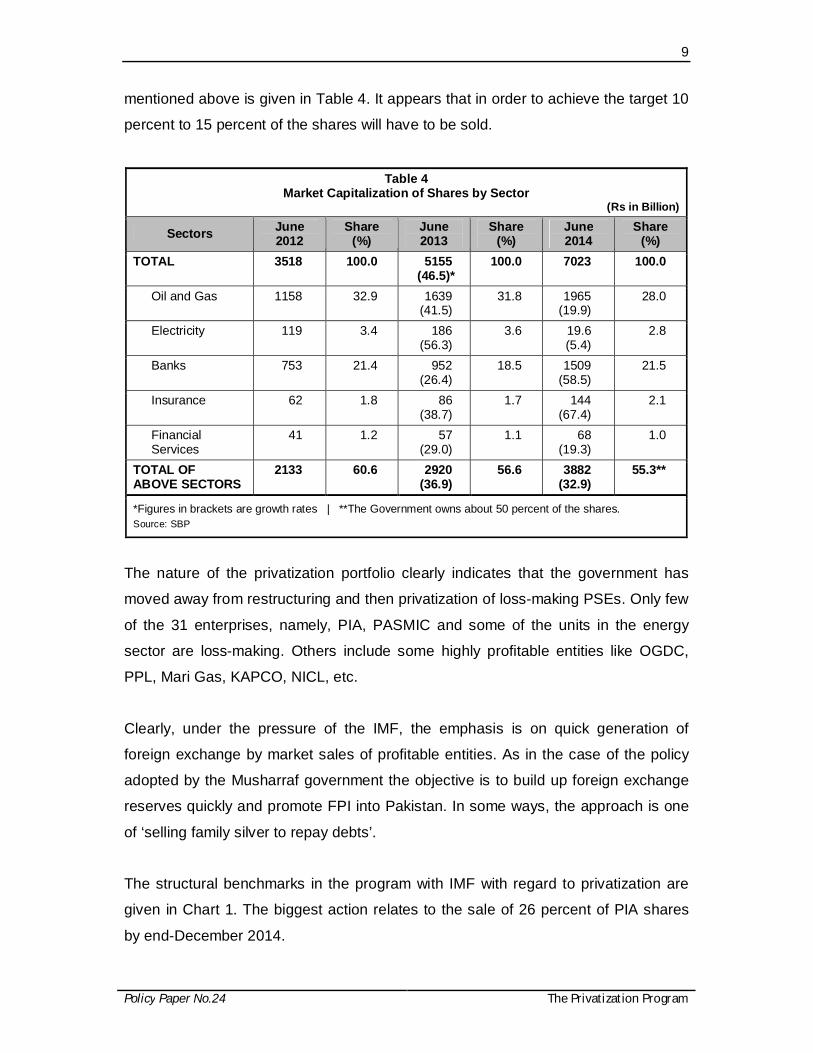
the international capital market. The market value of shares in the key sectors
9
Policy Paper No.24 The Privatization Program
mentioned above is given in Table 4. It appears that in order to achieve the target 10
percent to 15 percent of the shares will have to be sold.
Table 4 Market Capitalization of Shares by Sector
(Rs in Billion)
Sectors June 2012
Share (%)
June 2013
Share (%)
June 2014
Share (%)
TOTAL 3518 100.0 5155 (46.5)*
100.0 7023 100.0
Oil and Gas 1158 32.9 1639 (41.5)
31.8 1965 (19.9)
28.0
Electricity 119 3.4 186 (56.3)
3.6 19.6 (5.4)
2.8
Banks 753 21.4 952 (26.4)
18.5 1509 (58.5)
21.5
Insurance 62 1.8 86 (38.7)
1.7 144 (67.4)
2.1
Financial Services
41 1.2 57 (29.0)
1.1 68 (19.3)
1.0
TOTAL OF ABOVE SECTORS
2133 60.6 2920 (36.9)
56.6 3882 (32.9)
55.3**
*Figures in brackets are growth rates | **The Government owns about 50 percent of the shares.
Source: SBP
The nature of the privatization portfolio clearly indicates that the government has
moved away from restructuring and then privatization of loss-making PSEs. Only few
of the 31 enterprises, namely, PIA, PASMIC and some of the units in the energy
sector are loss-making. Others include some highly profitable entities like OGDC,
PPL, Mari Gas, KAPCO, NICL, etc.
Clearly, under the pressure of the IMF, the emphasis is on quick generation of
foreign exchange by market sales of profitable entities. As in the case of the policy
adopted by the Musharraf government the objective is to build up foreign exchange
reserves quickly and promote FPI into Pakistan. In some ways, the approach is one
of ‘selling family silver to repay debts’.
The structural benchmarks in the program with IMF with regard to privatization are
given in Chart 1. The biggest action relates to the sale of 26 percent of PIA shares
by end-December 2014.
10
The Privatization Program Policy Paper No.24
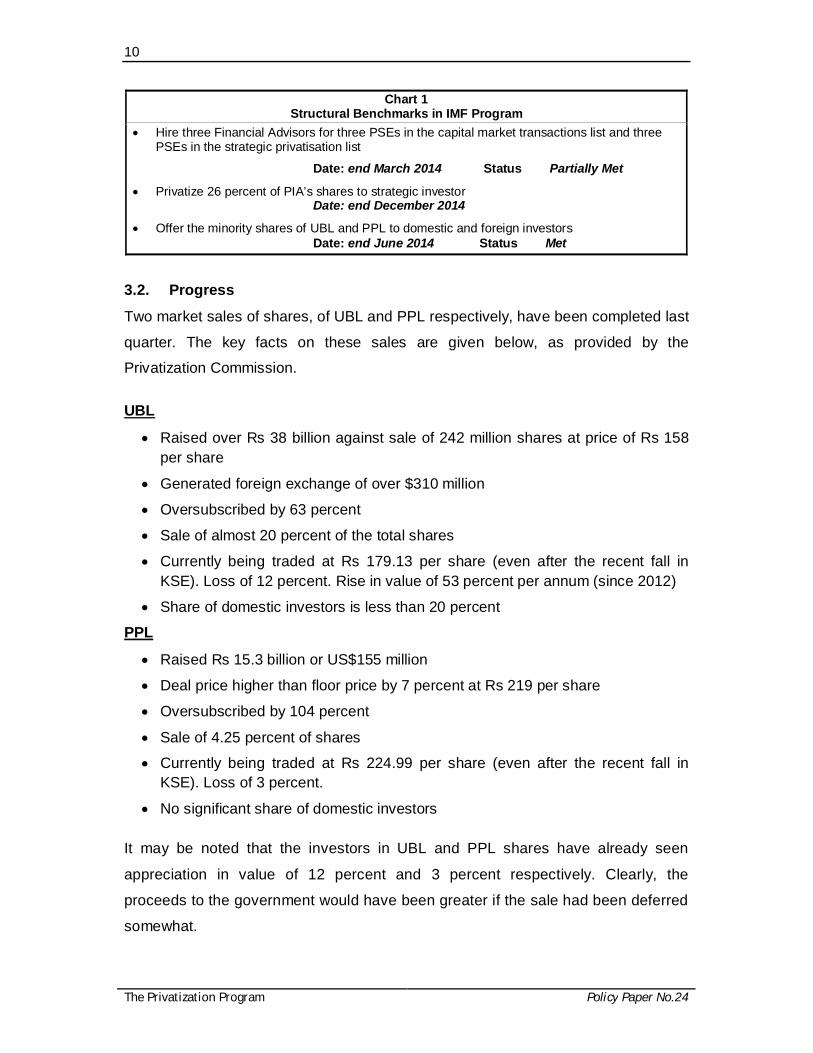
Chart 1 Structural Benchmarks in IMF Program
Hire three Financial Advisors for three PSEs in the capital market transactions list and three PSEs in the strategic privatisation list
Date: end March 2014 Status Partially Met
Privatize 26 percent of PIA’s shares to strategic investor Date: end December 2014
Offer the minority shares of UBL and PPL to domestic and foreign investors Date: end June 2014 Status Met
3.2. Progress
Two market sales of shares, of UBL and PPL respectively, have been completed last
quarter. The key facts on these sales are given below, as provided by the
Privatization Commission.
UBL
Raised over Rs 38 billion against sale of 242 million shares at price of Rs 158 per share
Generated foreign exchange of over $310 million
Oversubscribed by 63 percent
Sale of almost 20 percent of the total shares
Currently being traded at Rs 179.13 per share (even after the recent fall in KSE). Loss of 12 percent. Rise in value of 53 percent per annum (since 2012)
Share of domestic investors is less than 20 percent
PPL
Raised Rs 15.3 billion or US$155 million
Deal price higher than floor price by 7 percent at Rs 219 per share
Oversubscribed by 104 percent
Sale of 4.25 percent of shares
Currently being traded at Rs 224.99 per share (even after the recent fall in KSE). Loss of 3 percent.
No significant share of domestic investors It may be noted that the investors in UBL and PPL shares have already seen
appreciation in value of 12 percent and 3 percent respectively. Clearly, the
proceeds to the government would have been greater if the sale had been deferred
somewhat.
11
Policy Paper No.24 The Privatization Program
4. CRITERIA FOR PRIVATIZATION 4.1. Market Sale of Shares
The basic decision is if a share should be sold by the government from its holding of
equity in a company. The decision depends upon the factors described below.
We designate the following:
gc = projected annual capital gain/loss in the market value of a
share
d = rate of annual dividend on a share
= projected mark-up annually on long term PIBs
Then, market sale of shares owned by the government in a company is justified if;
gc + d < . . . . . .(!)
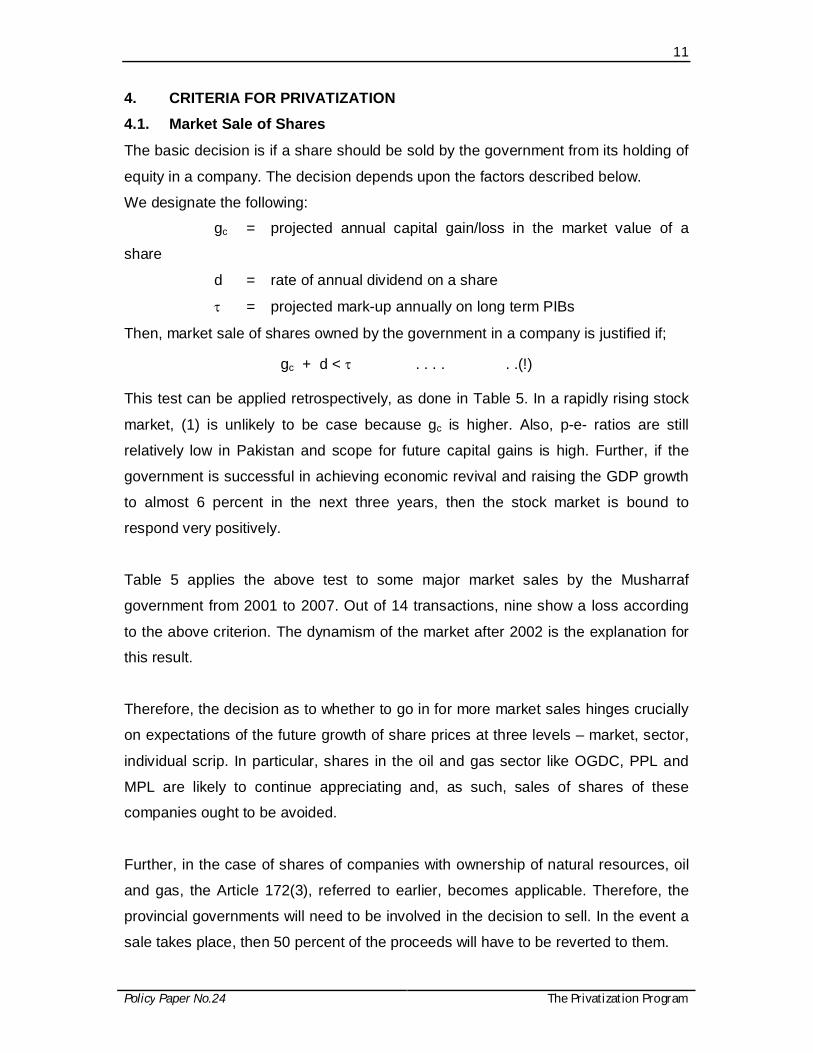
This test can be applied retrospectively, as done in Table 5. In a rapidly rising stock
market, (1) is unlikely to be case because gc is higher. Also, p-e- ratios are still
relatively low in Pakistan and scope for future capital gains is high. Further, if the
government is successful in achieving economic revival and raising the GDP growth
to almost 6 percent in the next three years, then the stock market is bound to
respond very positively.
Table 5 applies the above test to some major market sales by the Musharraf
government from 2001 to 2007. Out of 14 transactions, nine show a loss according
to the above criterion. The dynamism of the market after 2002 is the explanation for
this result.
Therefore, the decision as to whether to go in for more market sales hinges crucially
on expectations of the future growth of share prices at three levels – market, sector,
individual scrip. In particular, shares in the oil and gas sector like OGDC, PPL and
MPL are likely to continue appreciating and, as such, sales of shares of these
companies ought to be avoided.
Further, in the case of shares of companies with ownership of natural resources, oil
and gas, the Article 172(3), referred to earlier, becomes applicable. Therefore, the
provincial governments will need to be involved in the decision to sell. In the event a
sale takes place, then 50 percent of the proceeds will have to be reverted to them.
12
The Privatization Program Policy Paper No.24
Table 5 Gain / Loss from Sale of Shares
(Since 2001)
Sale No. Company
No. of Shares
(million)
Sale Date
Month/Year
Sale Price (Rs)
Current Price (Rs)
(5/9/14)
Annual Rate of Capital Gains (%)
[gc]
Comment (Gain / Loss)
1 NBP 37.3 2/02 10.00 57.90 15.0 Loss 2 MCB 24.0 10/02 27.67 282.82 21.4 Loss 3 POL 28.5 10/02 180.28 588.81 10.4 Loss 4 ARL 10.2 1/03 101.80 188.05 5.4 Gain 5 NBP 37.3 11/02 20.96 57.90 8.8 Loss* 6 DGK Cement 3.6 12/02 17.50 78.93 13.7 Loss 7 NBP 13.1 11/03 46.11 57.90 2.1 Gain 8 OGDC 215.0 11/03 31.86 269.81 21.4 Loss 9 PPL 102.9 7/04 54.74 223.86 15.1 Loss
10 KAPCO 160.8 4/05 29.94 64.00 7.7 Gain 11 UBL 21.9 8/05 49.64 178.06 15.2 Loss 12 OGDC 408.6 12/06 114.93 269.81 11.1 Loss* 13 UBL 202.3 7/07 195.00 178.06 -1.3 Gain 14 HBL 51.7 10/07 235.00 186.77 -3.2 Gain
Source: Privatization Commission | KSE
4.2. Privatization to Strategic Investor
Based on past experience and the need to avoid the creation of monopolies, the
following criteria have been identified to determine if a unit should be privatized and
handed over for management to a strategic investor:
Criteria for Evaluating Case for Privatization Score
1. Profit-Making If losses 1 If small profits ½ If large profits 0
2. Monopoly If a competitive market 1 If a monopoly 0
3. Regulatory Authority If presence of: Strong Regulatory Authority
Weak Regulatory Authority 1 0
4. Valuation of assets If proper and full valuation of assets 1 If not 0
13
Policy Paper No.24 The Privatization Program
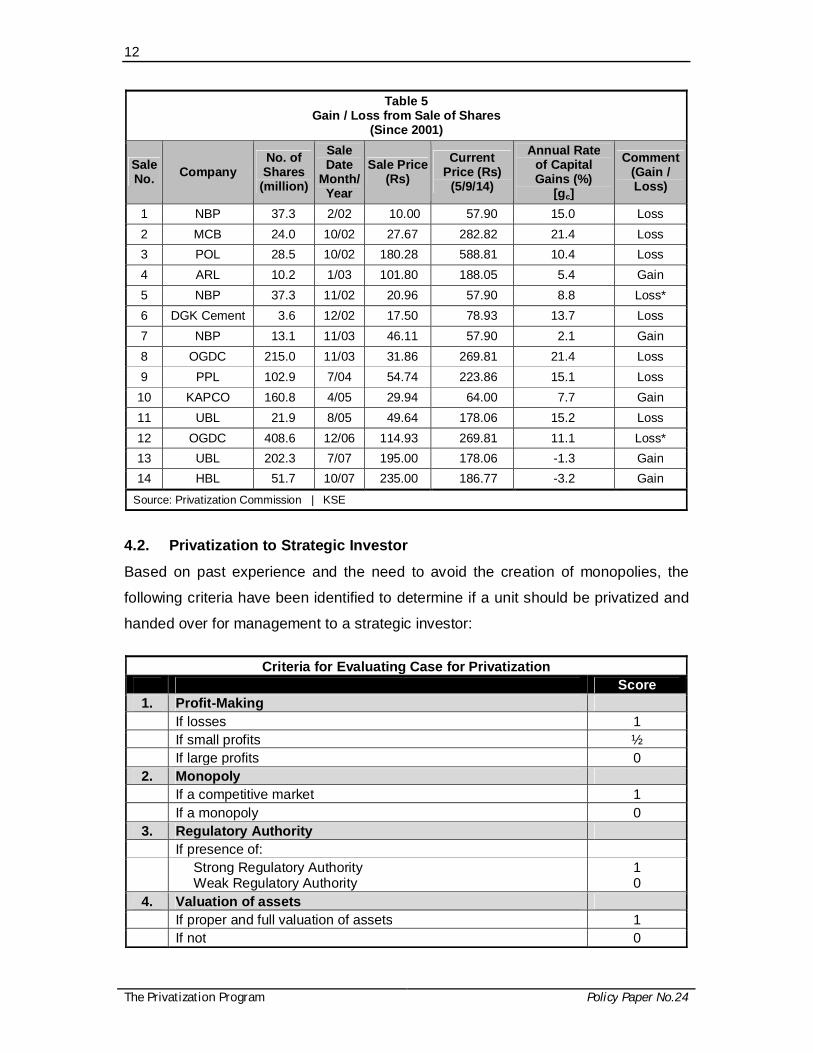
Criteria for Evaluating Case for Privatization Score
5. Outstanding Liabilities If no or small liabilities 1 If large liabilities 0
6. Performance of Social Functions If Social functions not performed 1 If performed 0
7. Over employment If large over employment 1 If no or small over employment 0
8. If Political Opposition / Resistance from Trade Unions / Transparency Issues
If no 1 If yes 0
According to the above criteria, the case for privatization of a unit is strong / weak if it
is making losses/high profits; if it will be in a competitive market / become a
monopoly; if the relevant regulatory authority is effective / ineffective; if it is possible /
not possible to fully evaluate the assets; if there are small / large outstanding
liabilities; if the unit is not performing / performing basic social functions; if there is
over employment / proper level of employment; and if there no political opposition or
resistance from trade unions.
The combined (un-weighted) score is as follows:
Maximum Score 8
Minimum Score 0
A unit has to have a score of at least 5.5 (just over
2/3rds of the maximum score) to be considered for
privatization.
These criteria are applied to the 20 units
earmarked for privatization in the Statistical
Appendix. The results are summarized in Chart 2.
Therefore, according to the above criteria, there is
a case for privatization of ten out of the twenty
units in the proposed privatization portfolio.
Chart 2 Case for Privatization Yes No
PASMIC NSC NIT
SME Bank HEC
Convention Centre NPCC JPCL PRCL
NPGCL
PIA PIA Hotels*
PSO* SSGC SNGPL IESCO FESCO HESCO
NICL PRCL
10 10 *Marginal case
14
The Privatization Program Policy Paper No.24
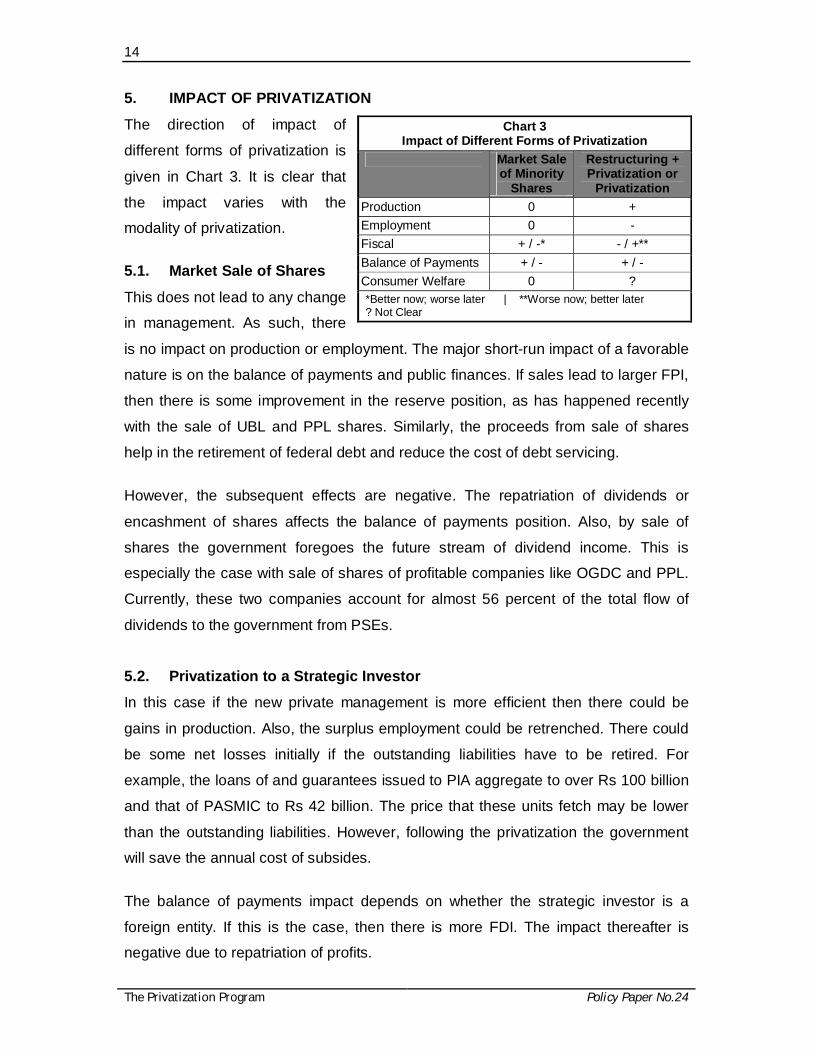
5. IMPACT OF PRIVATIZATION
The direction of impact of
different forms of privatization is
given in Chart 3. It is clear that
the impact varies with the
modality of privatization.
5.1. Market Sale of Shares
This does not lead to any change
in management. As such, there
is no impact on production or employment. The major short-run impact of a favorable
nature is on the balance of payments and public finances. If sales lead to larger FPI,
then there is some improvement in the reserve position, as has happened recently
with the sale of UBL and PPL shares. Similarly, the proceeds from sale of shares
help in the retirement of federal debt and reduce the cost of debt servicing.
However, the subsequent effects are negative. The repatriation of dividends or
encashment of shares affects the balance of payments position. Also, by sale of
shares the government foregoes the future stream of dividend income. This is
especially the case with sale of shares of profitable companies like OGDC and PPL.
Currently, these two companies account for almost 56 percent of the total flow of
dividends to the government from PSEs.
5.2. Privatization to a Strategic Investor
In this case if the new private management is more efficient then there could be
gains in production. Also, the surplus employment could be retrenched. There could
be some net losses initially if the outstanding liabilities have to be retired. For
example, the loans of and guarantees issued to PIA aggregate to over Rs 100 billion
and that of PASMIC to Rs 42 billion. The price that these units fetch may be lower
than the outstanding liabilities. However, following the privatization the government
will save the annual cost of subsides.
The balance of payments impact depends on whether the strategic investor is a
foreign entity. If this is the case, then there is more FDI. The impact thereafter is
negative due to repatriation of profits.
Chart 3 Impact of Different Forms of Privatization
Market Sale of Minority
Shares
Restructuring + Privatization or
Privatization Production 0 + Employment 0 - Fiscal + / -* - / +** Balance of Payments + / - + / - Consumer Welfare 0 ? *Better now; worse later | **Worse now; better later ? Not Clear
15
Policy Paper No.24 The Privatization Program
Consumer welfare gains are ambiguous. If higher efficiency translates into lower
prices consumers may benefit. As opposed to this, there is the danger of exercise of
monopoly power of formation of a cartel. The cement units privatization in the last
decade may have led to cartelization, which the CCP has not been able to break.
Similarly, the SBP has been unable to prevent the increase in the margin between
the returns on advances and no deposits, following the large-scale privatization of
the banking sector.
Under pressure of the IMF, the government has opted for market sale of shares of
profitable companies primarily to build foreign exchange reserves, of up to $2 billion
in 2014-15. Restructuring of loss-making PSEs has taken the back seat. Only some
initial steps have been taken to improve the workings of PIA and the Railway.
6. CONCLUSIONS AND RECOMMENDATIONS
On the basis of application of rational criteria, the paper recommends a truncated
process of privatization. Market sales of shares of profitable companies with valuable
assets like OGDC, PPL, MPL, etc., must be avoided. The shares of such companies
are likely to continue appreciating in future and yield large capital gains.
Privatization to a strategic investor may be resorted to in ten out the twenty units
included in the list agreed with the IMF. As per the manifesto of the PML-N, the focus
should instead be more on restructuring of loss-making PSEs.
In particular, bulk over 80 percent, the losses are in the power sector. The
government has done little to improve efficiency in the sector by replacement and
modernization of old plants and the transmission system, cutting down of billing
losses, build up of arrears, etc. Given the state of the power sector, especially of low
liquidity due to accumulation of circular debt, it is unlikely that any private investor
would like to rapidly take over a GENCO or a DISCO.
It is extremely important that interests of employees are protected. A proper
severance package must be offered. In addition, a portion of the shares being sold
must be allocated to employees, either individually or collectively, subject, of course,
to payment of the reservation price.
16
The Privatization Program Policy Paper No.24
There will be need to strengthen regulatory agencies like CCP, SECP and others to
ensure that no monopoly or cartel emerges post-privatization. Also, to the extent that
units to be privatized are performing social functions, then these should continue
after privatization, possibly with a subsidy from the government.
The posture of the government, which is seen as business-friendly, requires that
transparency of transactions be fully preserved. The development of a business–
political nexus must be avoided. Members of the Privatization Commission have to
be careful about any conflict of interest.
The Privatization Program must be handled carefully and with concern for different
stakeholders. It should not degenerate into a desperate rush for selling ‘family silver’
to acquire foreign exchange, as happened in the earlier years of the Musharraf era.
Instead, if proper restructuring of major national enterprises takes place, as is
beginning to happen in the Railway and PIA, then the benefits to the economy and to
the people in general will be substantially larger.
17
Policy Paper No.24 The Privatization Program
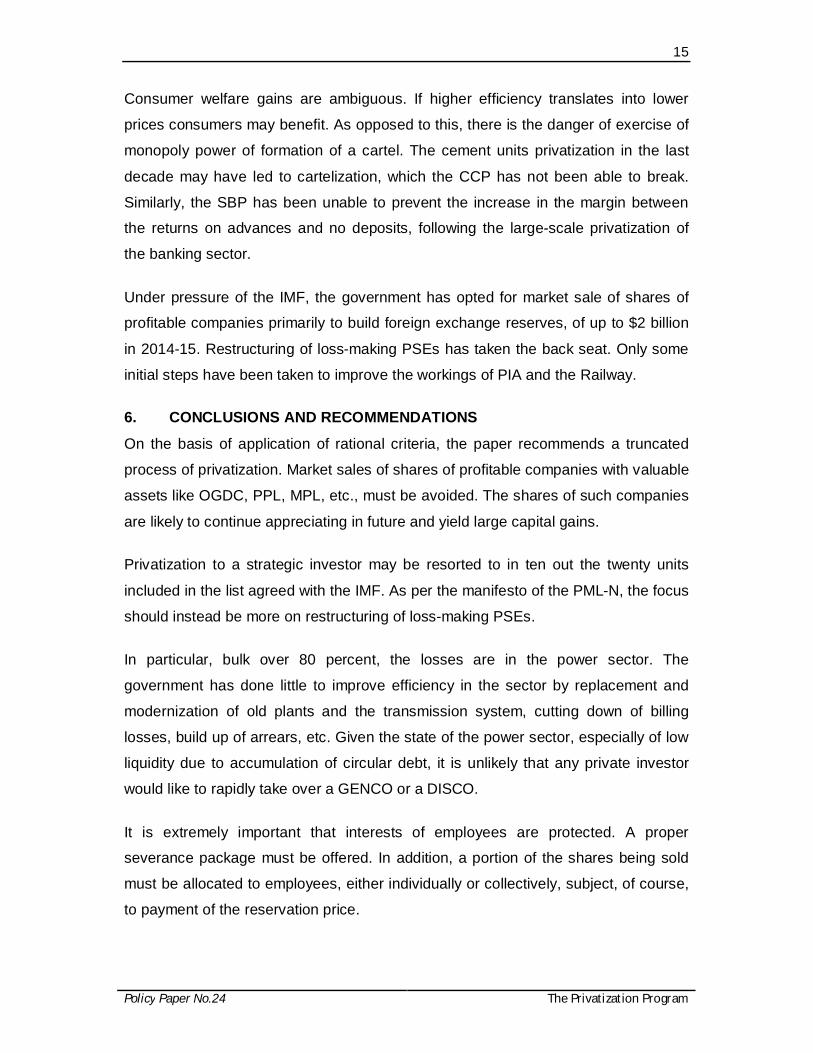
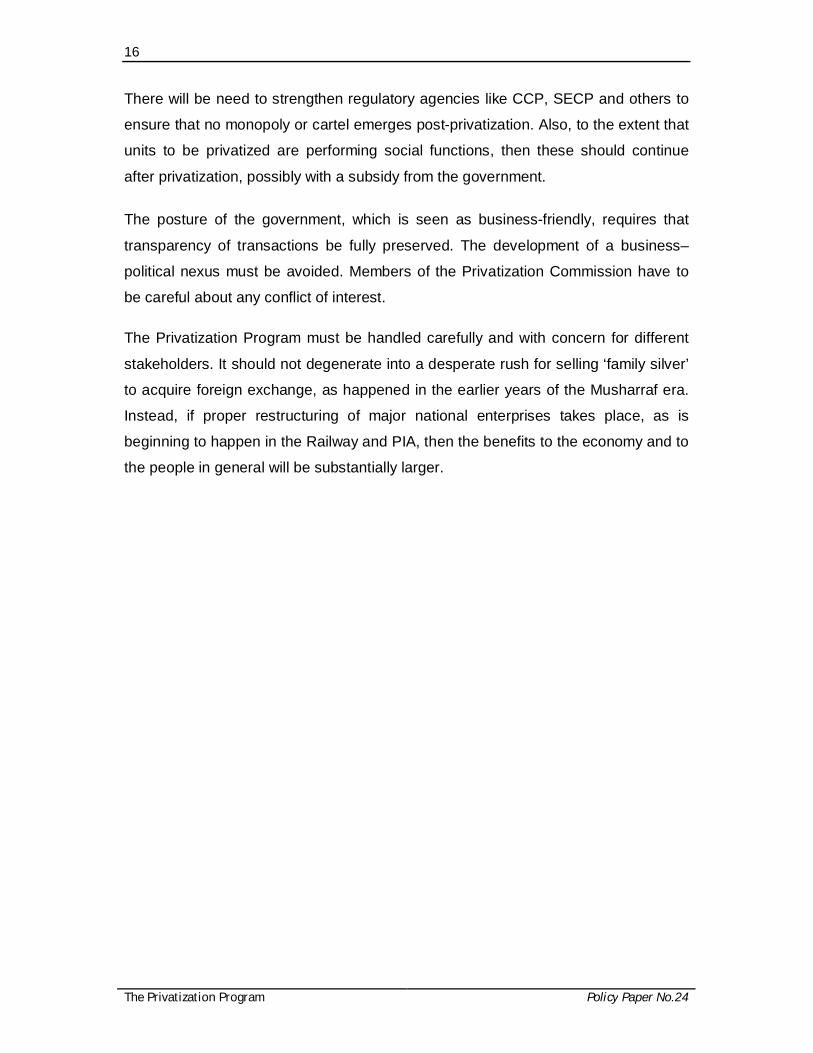
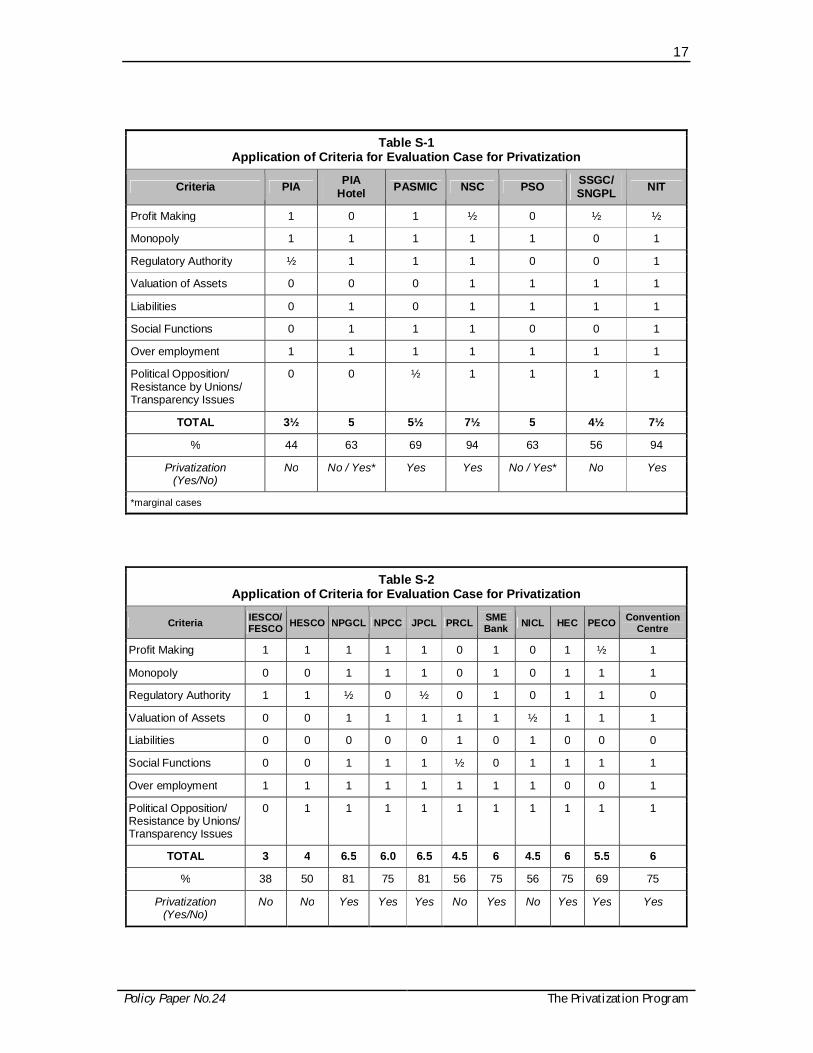
Table S-1 Application of Criteria for Evaluation Case for Privatization
Criteria PIA PIA Hotel PASMIC NSC PSO SSGC/
SNGPL NIT
Profit Making 1 0 1 ½ 0 ½ ½
Monopoly 1 1 1 1 1 0 1
Regulatory Authority ½ 1 1 1 0 0 1
Valuation of Assets 0 0 0 1 1 1 1
Liabilities 0 1 0 1 1 1 1
Social Functions 0 1 1 1 0 0 1
Over employment 1 1 1 1 1 1 1
Political Opposition/ Resistance by Unions/ Transparency Issues
0 0 ½ 1 1 1 1
TOTAL 3½ 5 5½ 7½ 5 4½ 7½
% 44 63 69 94 63 56 94
Privatization (Yes/No)
No No / Yes* Yes Yes No / Yes* No Yes
*marginal cases
Table S-2 Application of Criteria for Evaluation Case for Privatization
Criteria IESCO/ FESCO HESCO NPGCL NPCC JPCL PRCL SME
Bank NICL HEC PECO Convention Centre
Profit Making 1 1 1 1 1 0 1 0 1 ½ 1
Monopoly 0 0 1 1 1 0 1 0 1 1 1
Regulatory Authority 1 1 ½ 0 ½ 0 1 0 1 1 0
Valuation of Assets 0 0 1 1 1 1 1 ½ 1 1 1
Liabilities 0 0 0 0 0 1 0 1 0 0 0
Social Functions 0 0 1 1 1 ½ 0 1 1 1 1
Over employment 1 1 1 1 1 1 1 1 0 0 1
Political Opposition/ Resistance by Unions/ Transparency Issues
0 1 1 1 1 1 1 1 1 1 1
TOTAL 3 4 6.5 6.0 6.5 4.5 6 4.5 6 5.5 6
% 38 50 81 75 81 56 75 56 75 69 75
Privatization (Yes/No)
No No Yes Yes Yes No Yes No Yes Yes Yes
Recommended