Edition 09/2012 - V03 R01 Part No.: 669712
Portable data recorder
HMG 3000
User manual (Translation of the original instruction)
HMG 3000 Page 2
Edition 09/2012 - V03 R01 Part No.: 669712
Table of Contents
1 Tasks and Functions of the HMG 3000 ....................................................... 3
1.1 Standard functions of the HMG 3000 ................................................... 3
2 About Your HMG 3000 .................................................................................. 6
2.1 Items supplied ...................................................................................... 6
2.2 Power supply ........................................................................................ 6
3 Technical Safety ............................................................................................ 6
3.1 Safety information ................................................................................. 7
4 Commissioning ............................................................................................. 8
4.1 Operating Elements .............................................................................. 8
4.2 Ports ..................................................................................................... 9
4.3 Switching on the instrument ................................................................ 10
5 Getting Started Guide ................................................................................. 12
6 Detailed Operating Instructions ............................................................... 17
6.1 Settings Menu ..................................................................................... 17
6.1.1 Change settings of measurement channels ........................... 17
6.1.2 Change display settings ......................................................... 28
6.1.3 Zeroing Measurement Channels ............................................ 30
6.1.4 Change initial setup................................................................ 32
6.1.5 Administer settings (save, load, ...) ............................. 35
6.2 Recording Menu ................................................................................. 37
6.2.1 Aufnahme starten ................................................................... 37
6.2.2 Viewing Recordings ............................................................... 55
6.2.3 Deleting Recording ................................................................. 66
6.3 Extras Menu ........................................................................................ 67
6.4 SMART sensors .................................................................................. 69
6.4.1 Connecting SMART Sensors ................................................. 69
6.4.2 SMART Sensors Menu .......................................................... 70
6.5 Technical Details ................................................................................ 73
7 Cleaning ....................................................................................................... 75
8 Accessories ................................................................................................. 75
9 Examples of Connections .......................................................................... 77
9.1 Pin assignment ................................................................................... 78
HMG 3000 Page 3
Edition 09/2012 - V03 R01 Part No.: 669712
1 Tasks and Functions of the HMG 3000
1.1 Standard functions of the HMG 3000
The HMG 3000 portable data recorder is a hand-held unit for measurement and data ac-
quisition tasks on hydraulic and pneumatic systems. Applications are mainly in mainte-
nance and servicing, troubleshooting and test rigs.
The HMG 3000 can monitor signals from up to ten sensors simultaneously. The unit fea-
tures input jacks for connecting the sensors; if necessary this number can be doubled using
an adapter for measurement operations involving more than 5 sensors. HYDAC offers HSI
sensors (HYDAC Sensor Interface) for pressure, temperature and flow rate with automatic
sensor recognition. The measuring range and unit can be set according to the customer's
requirements.
You also have the option of connecting SMART sensors to the HMG 3000. These represent
a sensor generation from HYDAC which can output several different measured variables.
These sensors are also automatically recognized by the HMG 3000 via HSI, and the meas-
ured values including the measurement unit are shown in the display.
The HMG 3000 can render up to 32 measurement channels in total.
Depending on the sensor type, the sensor has an internal memory for the storage of rec-
orded measured value on a long-term basis. In addition, depending on the sensor type,
preset parameters can be changed and stored in the internal memory as a sensor configu-
ration.
Older model HYDAC sensors or commonly available sensors made by other manufacturers
can also be used. However, these sensors do not have any automatic sensor detection,
consequently the initial set-up has to be entered manually.
The operator can access all of the unit’s functions and settings by means of clearly pre-
sented selection menus. The HMG 3000 has a combination keypad for entering numeric
values and text, similar to a mobile phone.
The HMG 3000 is designed in particular for recording typical measurements (pressure,
temperature, flow rate) in hydraulic and pneumatic systems. A variety of other measure-
ment tasks can be performed using additional inputs for voltage measurement.
For example, checking the actuation of a switching valve or plotting the characteristic curve
of a valve setpoint. In addition, it is also possible to determine differential values between
the measured values of individual sensors. One example of this is taking a flow rate meas-
urement using a differential pressure orifice.
In addition to the analogue measurement inputs, the HMG 3000 features two digital inputs
(e.g. for measuring frequency or speed), thus expanding the unit’s range of potential appli-
cations.
When taking measurements of rapid, dynamic machine processes, all 8 analogue input
signals can be recorded simultaneously at a rate of 0.5 ms.

HMG 3000 Page 4
Edition 09/2012 - V03 R01 Part No.: 669712
One special feature of the HMG 3000 is its ability to also monitor highly dynamic processes
in a machine. To achieve this, two input channels can record measured
values at a rate of 0.1 ms. This function of course requires suitable fast sensors to be used.
The most impressing feature of the HMG 3000 is its ability to record the dynamic processes
of a machine in the form of a measurement curve and render them as a graph — and,
moreover, online and in real time.
The HMG 3000 is equipped with specially developed software providing for fast data collec-
tion and processing. A measurement curve can consist of up to 500,000 measured values.
The HMG 3000 memory is capable of storing at least 100 of such measurement curves.
In addition to enabling simple measurement curves to be recorded, the HMG 3000 also has
other functions enabling event-driven measurements to be taken and event logs to be rec-
orded. Various trigger options are available for triggering events.
Apart from measurement curves, the HMG 3000 can store user-specific settings (user pro-
files). The main advantage of this is to enable identical measurements of various equipment
items to be repeated for the purpose of preventive maintenance. All the user has to do is
retrieve the relevant user profile from the HMG 3000’s memory.
The HMG 3000 has a 3.5" colour display with graphics capabilities, which can show the
measured values either as text or as measurement curve. Individual measured values can
be displayed in a large format (7-segment format), enabling them to be read from far away.
The HMG 3000 also provides a variety of user-friendly features for displaying, evaluating and
processing measured values:
• Table
• Graph
• Scaling
• Ruler
• Tracker
• Zoom
HMG 3000 Page 5
Edition 09/2012 - V03 R01 Part No.: 669712
The HMG 3000 communicates with a computer via a USB or serial port. HYDAC soft-
ware HMGWIN which is specific to the HMG 3000, is supplied for convenient post-
processing, rendering and evaluation of measurements on your computer. It also ena-
bles the HMG 3000 to be operated directly from your computer.
The HYDAC software CMWIN is also supplied as standard with the unit. This software
enables you to communicate directly from your computer with SMART sensors connect-
ed to the HMG 3000.
HMG 3000 Page 6
Edition 09/2012 - V03 R01 Part No.: 669712
2 About Your HMG 3000
2.1 Items supplied
• HMG 3000
• Power supply for 90 ... 230 V
• User Manual
• CD-ROM containing USB drivers and HMGWIN and CMWIN software
(software for analyzing measurement data and sensor communication)
in addition to other product information
• USB connector cable
2.2 Power supply
The HMG 3000 has an internal NiMH battery. To charge the battery, simply connect the
power supply with the HMG 3000 (see HMG 3000 connections). The battery is fully charged
after approx. 2 hours.
A direct current supply (12 – 30 V DC) can be connected to the power input socket for oper-
ating the HMG or charging the battery.
When connecting the power supply to the input socket make sure that +UB is applied to the
inner contact of the plug and 0 V to the outer contact. A JEITA RC 5320-5 plug, for example,
is suitable for this purpose and is available in most electrical/electronics shops.
3 Technical Safety
The individual components of the HMG 3000 portable data recorder and the assembled unit
are subject to strict quality assurance inspection and testing. Each HMG 3000 undergoes a
final test. This ensures that upon delivery, the unit is free from defects and complies with the
designated specifications.
The series HMG 3000 portable data recorders are maintenance-free and work perfectly
when used under the conditions specified. If, however, you do encounter problems, please
contact your HYDAC representative. Any tampering with the switch will cause all warranty
claims to become null and void.
Compliance with European Standards
The HMG 3000 series portable data recorders have the CE mark and thus comply with all
current German regulatory requirements and European standards relating to the operation of
these units. This ensures compliance with the applicable directives relating to electromagnet-
ic compatibility and the safety provisions according to the low-voltage directive.
This product complies with the provisions of the following European directives:
EN 61000-6-1 / 2 / 3 / 4.
We reserve the right to make technical modifications.
HMG 3000 Page 7
Edition 09/2012 - V03 R01 Part No.: 669712
3.1 Safety information
The HMG 3000 series Portable Data Recorder can be operated safely provided it is used
in accordance with its proper, designated use. However, in order to avoid any risk to the
operator or any damage due to incorrect handling of the unit, please adhere strictly to the
following safety instructions:
• The HMG 3000 may not be used unless it is in perfect condition/working order.
• The instructions for use must be strictly adhered to. Functions which involve adjust-
ing the zero point in particular can lead to hazardous situations. For more infor-
mation, please refer to Point 6.1.3 "Zeroing of Measurement Channels".
• If sensors and interfaces are used simultaneously (online measurement), please
ensure equipotential (see chapter 6.1.4 "PC Connection").
• The information on the type code label must be noted.
• Troubleshooting and repair work may only be carried out by the HYDAC Service
Department.
• All relevant and generally recognised safety requirements must be adhered to.
HMG 3000 Seite 8
Stand 04/2012 - V03 R01 Mat.-Nr.: 669712
4 Commissioning
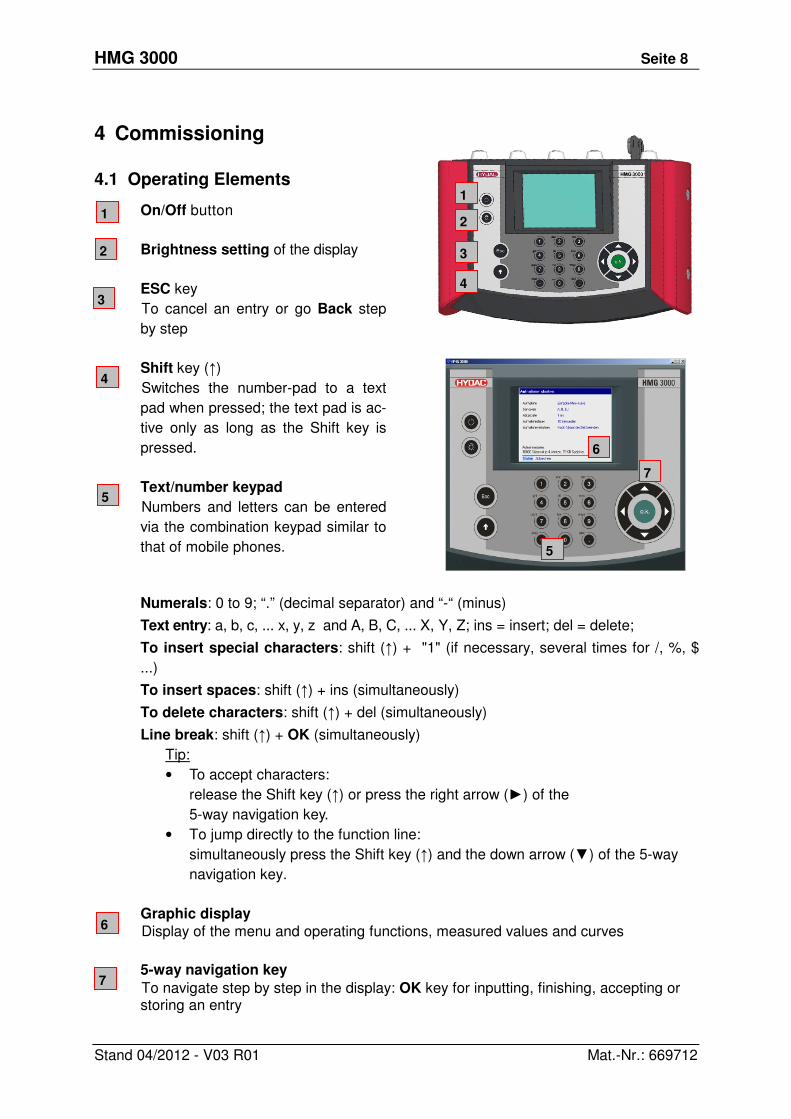
4.1 Operating Elements
On/Off button
Brightness setting of the display
ESC key
To cancel an entry or go Back step
by step
Shift key (↑)
Switches the number-pad to a text
pad when pressed; the text pad is ac-
tive only as long as the Shift key is
pressed.
Text/number keypad
Numbers and letters can be entered
via the combination keypad similar to
that of mobile phones.
Numerals: 0 to 9; “.” (decimal separator) and “-“ (minus)
Text entry: a, b, c, ... x, y, z and A, B, C, ... X, Y, Z; ins = insert; del = delete;
To insert special characters: shift (↑) + "1" (if necessary, several times for /, %, $
...)
To insert spaces: shift (↑) + ins (simultaneously)
To delete characters: shift (↑) + del (simultaneously)
Line break: shift (↑) + OK (simultaneously)
Tip:
• To accept characters:
release the Shift key (↑) or press the right arrow (►) of the
5-way navigation key.
• To jump directly to the function line:
simultaneously press the Shift key (↑) and the down arrow (▼) of the 5-way
navigation key.
Graphic display Display of the menu and operating functions, measured values and curves
5-way navigation key
To navigate step by step in the display: OK key for inputting, finishing, accepting or storing an entry
1
2
3
4
5
6
7
1
3
2
4
6
1
3
2
4
6
7
5
HMG 3000 Seite 9
Stand 04/2012 - V03 R01 Mat.-Nr.: 669712
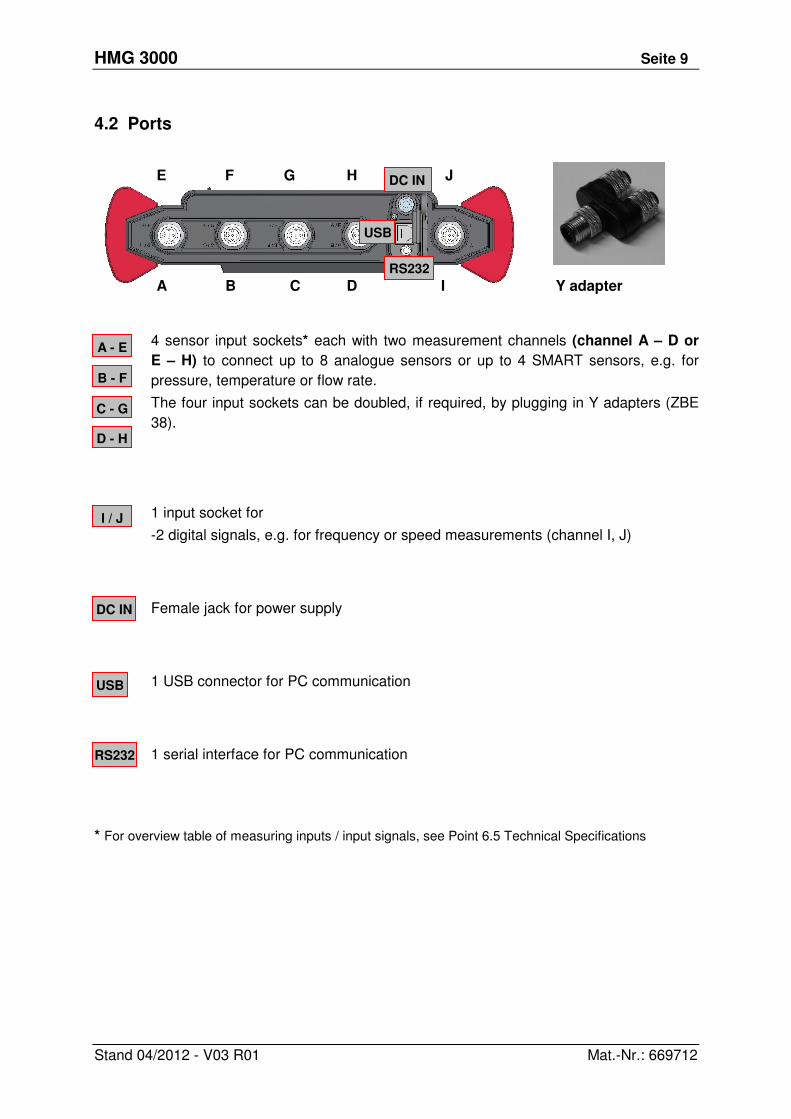
4.2 Ports
E F G H J
A B C D I Y adapter
4 sensor input sockets* each with two measurement channels (channel A – D or
E – H) to connect up to 8 analogue sensors or up to 4 SMART sensors, e.g. for
pressure, temperature or flow rate.
The four input sockets can be doubled, if required, by plugging in Y adapters (ZBE
38).
1 input socket for
-2 digital signals, e.g. for frequency or speed measurements (channel I, J)
Female jack for power supply
1 USB connector for PC communication
1 serial interface for PC communication
* For overview table of measuring inputs / input signals, see Point 6.5 Technical Specifications
DC IN
RS232
USB
B - F
I / J
DC IN
RS232
USB
C - G
D - H
A - E
HMG 3000 Page 10
Edition 09/2012 - V03 R01 Part No.: 669712
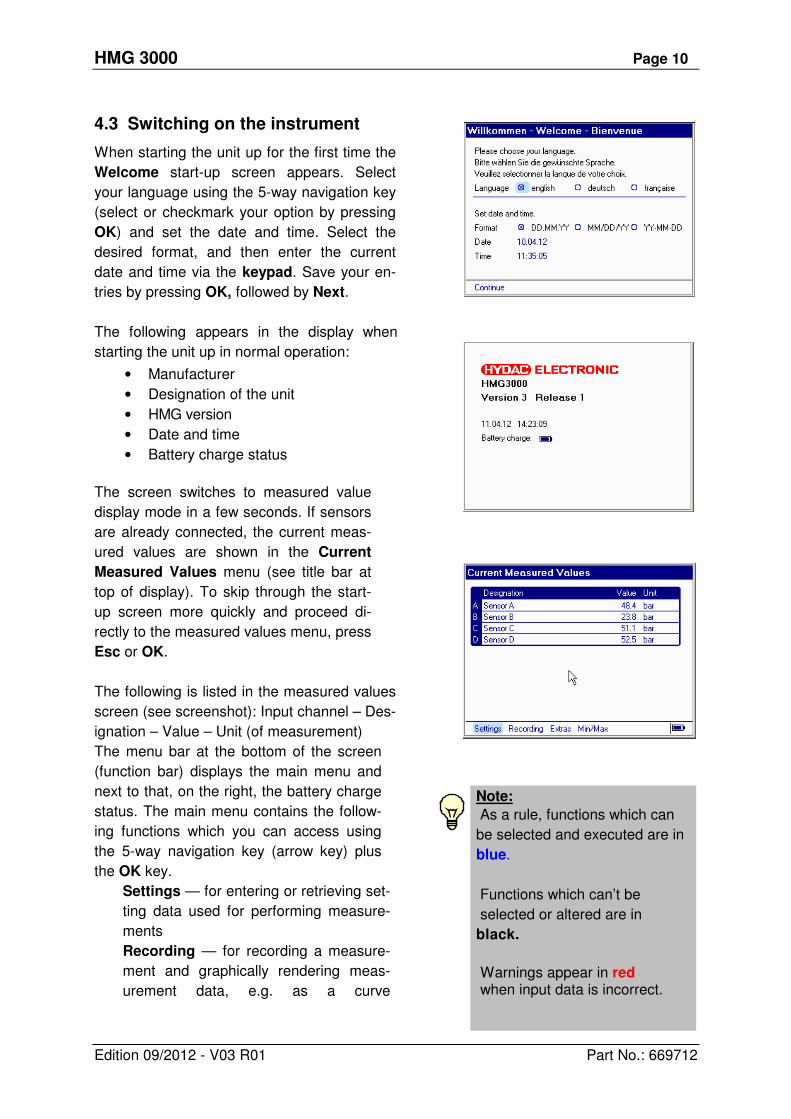
4.3 Switching on the instrument
When starting the unit up for the first time the
Welcome start-up screen appears. Select
your language using the 5-way navigation key
(select or checkmark your option by pressing
OK) and set the date and time. Select the
desired format, and then enter the current
date and time via the keypad. Save your en-
tries by pressing OK, followed by Next.
The following appears in the display when
starting the unit up in normal operation:
• Manufacturer
• Designation of the unit
• HMG version
• Date and time
• Battery charge status The screen switches to measured value
display mode in a few seconds. If sensors
are already connected, the current meas-
ured values are shown in the Current
Measured Values menu (see title bar at
top of display). To skip through the start-
up screen more quickly and proceed di-
rectly to the measured values menu, press
Esc or OK.
The following is listed in the measured values
screen (see screenshot): Input channel – Des-
ignation – Value – Unit (of measurement)
The menu bar at the bottom of the screen
(function bar) displays the main menu and
next to that, on the right, the battery charge
status. The main menu contains the follow-
ing functions which you can access using
the 5-way navigation key (arrow key) plus
the OK key.
Settings — for entering or retrieving set-
ting data used for performing measure-
ments
Recording — for recording a measure-
ment and graphically rendering meas-
urement data, e.g. as a curve
Note:
As a rule, functions which can
be selected and executed are in
blue.
Functions which can’t be
selected or altered are in
black.
Warnings appear in red when input data is incorrect.
4
HMG 3000 Page 11
Edition 09/2012 - V03 R01 Part No.: 669712
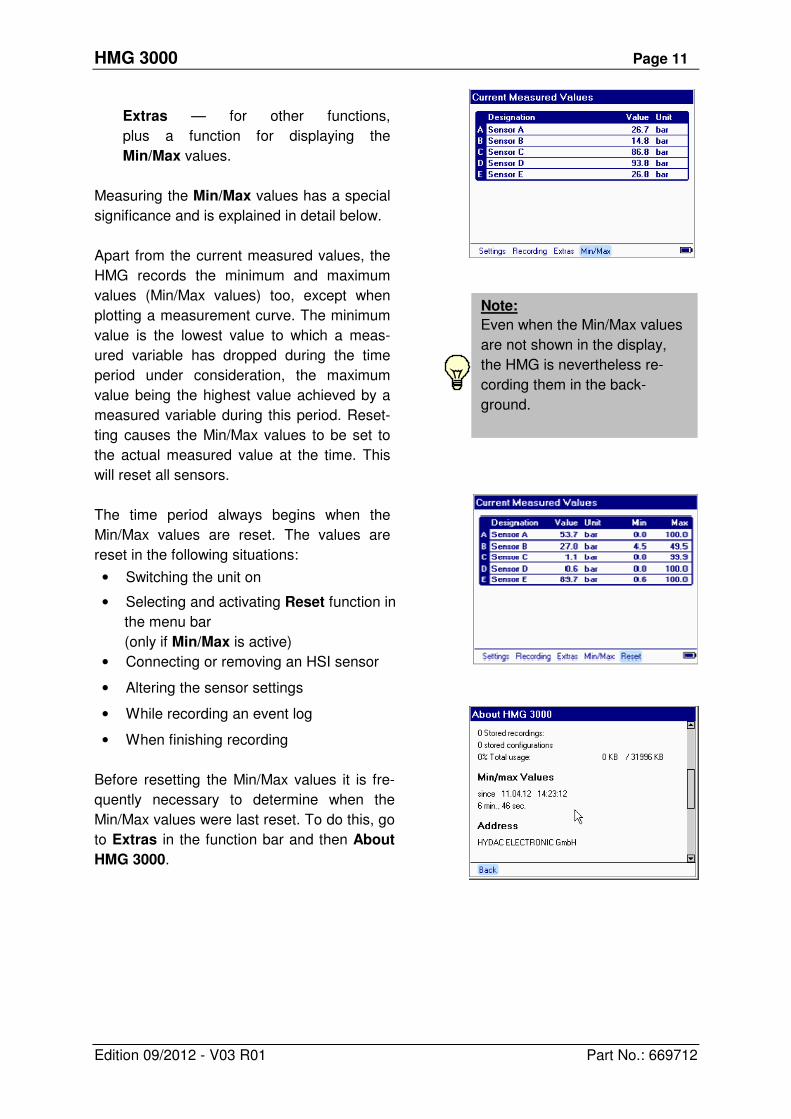
Extras — for other functions,
plus a function for displaying the
Min/Max values.
Measuring the Min/Max values has a special
significance and is explained in detail below.
Apart from the current measured values, the
HMG records the minimum and maximum
values (Min/Max values) too, except when
plotting a measurement curve. The minimum
value is the lowest value to which a meas-
ured variable has dropped during the time
period under consideration, the maximum
value being the highest value achieved by a
measured variable during this period. Reset-
ting causes the Min/Max values to be set to
the actual measured value at the time. This
will reset all sensors.
The time period always begins when the
Min/Max values are reset. The values are
reset in the following situations:
• Switching the unit on
• Selecting and activating Reset function in
the menu bar
(only if Min/Max is active)
• Connecting or removing an HSI sensor
• Altering the sensor settings
• While recording an event log
• When finishing recording
Before resetting the Min/Max values it is fre-
quently necessary to determine when the
Min/Max values were last reset. To do this, go
to Extras in the function bar and then About
HMG 3000.
Note:
Even when the Min/Max values
are not shown in the display,
the HMG is nevertheless re-
cording them in the back-
ground.
HMG 3000 Page 12
Edition 09/2012 - V03 R01 Part No.: 669712
5 Getting Started Guide
This Getting Started Guide outlines the basic steps for conducting a simple measurement
(measured values shown in display) and plotting a measurement curve (graph of measured
values). The examples involve pressure measurement using 2 pressure transmitters with
sensor detection (HSI sensors). For a detailed description of all the settings, see Detailed
Operating Instructions.
The examples are based on the factory settings of the HMG 3000. Simply follow the
steps described here. If you don’t know the status of your HMG 3000 because there
might be more than one user in your company using the HMG, you can simply restore
the unit to its "as supplied" condition (see Manage Settings — Restore Factory Settings).
Preparation for Performing a Measurement
First charge the batteries or connect the power supply as described in Power Supply.
Two HYDAC HDA 4748-H-0400-000 pressure transmitters with automatic sensor detec-
tion are used in the following example.
Example of a Simple Measurement Us-
ing Two Pressure Transmitters
Connect the two pressure transmitters
hydraulically to your machine and connect
the two pressure transmitters using the sen-
sor connector cables, e.g. to sockets
A and B of the HMG 3000.
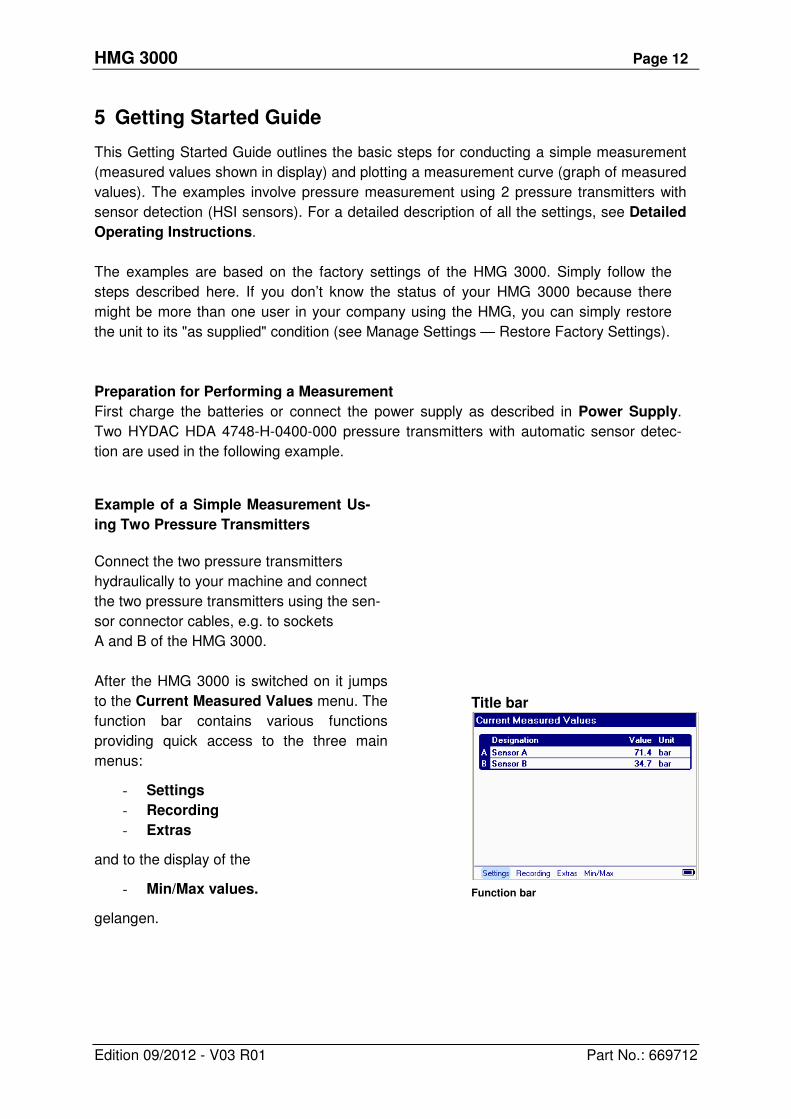
After the HMG 3000 is switched on it jumps
to the Current Measured Values menu. The
function bar contains various functions
providing quick access to the three main
menus:
- Settings
- Recording
- Extras
and to the display of the
- Min/Max values.
gelangen.
Title bar
Function bar

HMG 3000 Page 13
Edition 09/2012 - V03 R01 Part No.: 669712
When HSI sensors with automatic sensor
detection are used, the HMG automatically
detects the measurement range and the unit
of measurement of the two connected pres-
sure transmitters and shows them in the dis-
play with the actual measured values. You
can also display the minimum and maximum
values for the sensors.
To hide or show the Min/Max display, press
the right arrow of the 5-way navigation key
until Min/Max is highlighted in blue and then
press the OK key. The Min/Max values of the
sensors are now also displayed. Press the
OK key again to hide the Min/Max display.
When the Min/Max values are shown, Reset
appears in the function bar, enabling you to
reset the Min/Max values as required. Select
Reset using the arrow keys (blue highlight)
and then press the OK key to reset the
Min/Max values.
The measured values can also be displayed
in a 7-segment pane. To do this, go to Set-
tings in the function bar and then press OK.
In the Settings menu, navigate to Change
display settings using the 5-way navigation
key, and then confirm with OK (see screen-
shot of two-pane display on the next page).
Now select the second item, Measured val-
ue rendering. Measured value table is the
default setting here. Press OK. A drop-
down list appears in which you navigate to
2 display panels using the arrow keys, fol-
lowed by confirming with OK. To return to
the measured value display press Esc
twice.
HMG 3000 Page 14
Edition 09/2012 - V03 R01 Part No.: 669712
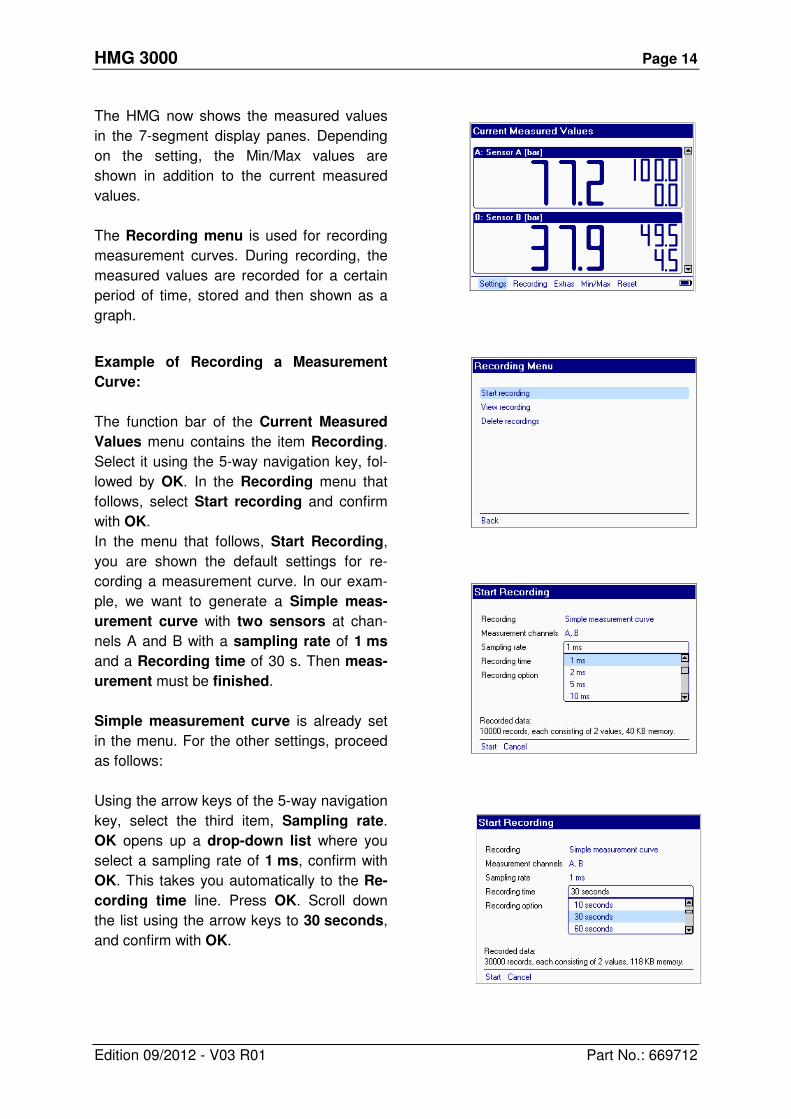
The HMG now shows the measured values
in the 7-segment display panes. Depending
on the setting, the Min/Max values are
shown in addition to the current measured
values.
The Recording menu is used for recording
measurement curves. During recording, the
measured values are recorded for a certain
period of time, stored and then shown as a
graph.
Example of Recording a Measurement
Curve:
The function bar of the Current Measured
Values menu contains the item Recording.
Select it using the 5-way navigation key, fol-
lowed by OK. In the Recording menu that
follows, select Start recording and confirm
with OK.
In the menu that follows, Start Recording,
you are shown the default settings for re-
cording a measurement curve. In our exam-
ple, we want to generate a Simple meas-
urement curve with two sensors at chan-
nels A and B with a sampling rate of 1 ms
and a Recording time of 30 s. Then meas-
urement must be finished.
Simple measurement curve is already set
in the menu. For the other settings, proceed
as follows:
Using the arrow keys of the 5-way navigation
key, select the third item, Sampling rate.
OK opens up a drop-down list where you
select a sampling rate of 1 ms, confirm with
OK. This takes you automatically to the Re-
cording time line. Press OK. Scroll down
the list using the arrow keys to 30 seconds,
and confirm with OK.
HMG 3000 Page 15
Edition 09/2012 - V03 R01 Part No.: 669712
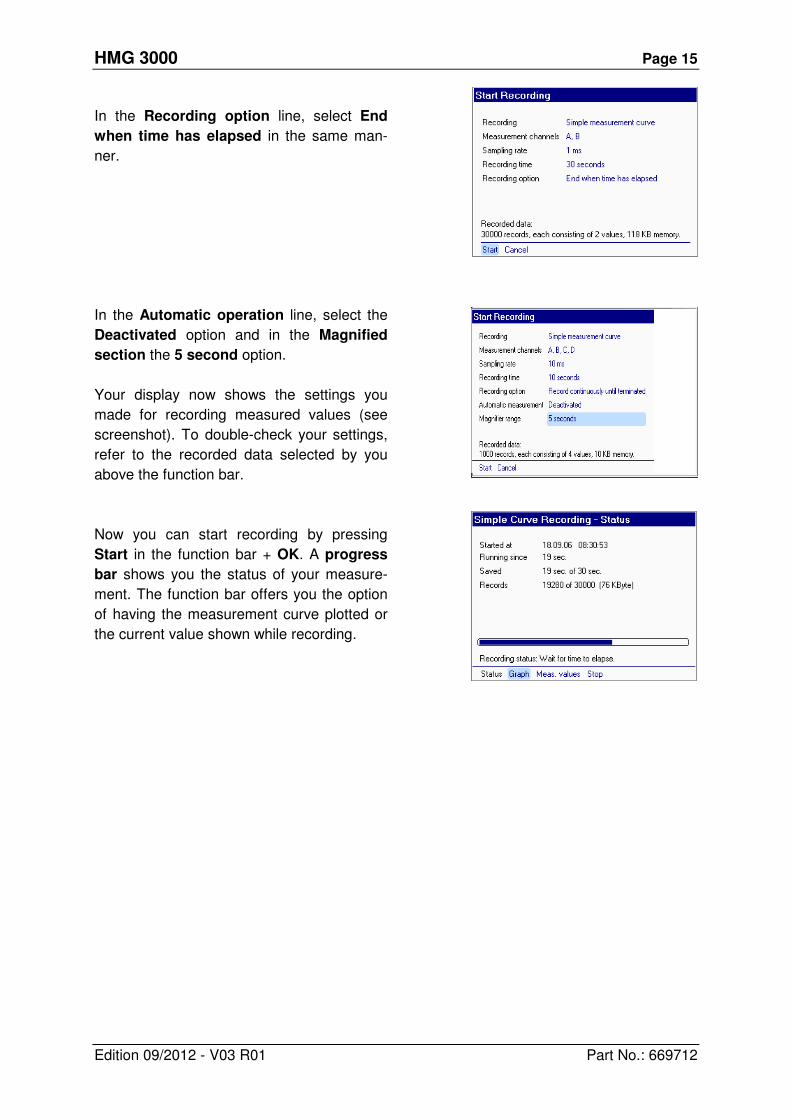
In the Recording option line, select End
when time has elapsed in the same man-
ner.
In the Automatic operation line, select the
Deactivated option and in the Magnified
section the 5 second option.
Your display now shows the settings you
made for recording measured values (see
screenshot). To double-check your settings,
refer to the recorded data selected by you
above the function bar.
Now you can start recording by pressing
Start in the function bar + OK. A progress
bar shows you the status of your measure-
ment. The function bar offers you the option
of having the measurement curve plotted or
the current value shown while recording.

HMG 3000 Page 16
Edition 09/2012 - V03 R01 Part No.: 669712
Graphic rendering provides a faster visual
impression of the changes in the measured
values. To have the measurement curve
displayed while recording, select Graph +
OK. The screenshot on the right shows you
the curve plotted for our example.
When recording is finished, you have the
option of saving or discarding the measure-
ment. To save the recording, select Save
and confirm with OK. The HMG automatical-
ly assigns a name and a consecutive num-
ber, which can also be renamed by you. In
our example, accept the name suggested by
the HMG and save with OK.
You can view any stored recording again or
delete it as you like. For more information on
this, refer to Detailed Operating Instructions.
HMG 3000 Page 17
Edition 09/2012 - V03 R01 Part No.: 669712
6 Detailed Operating Instructions
6.1 Settings Menu
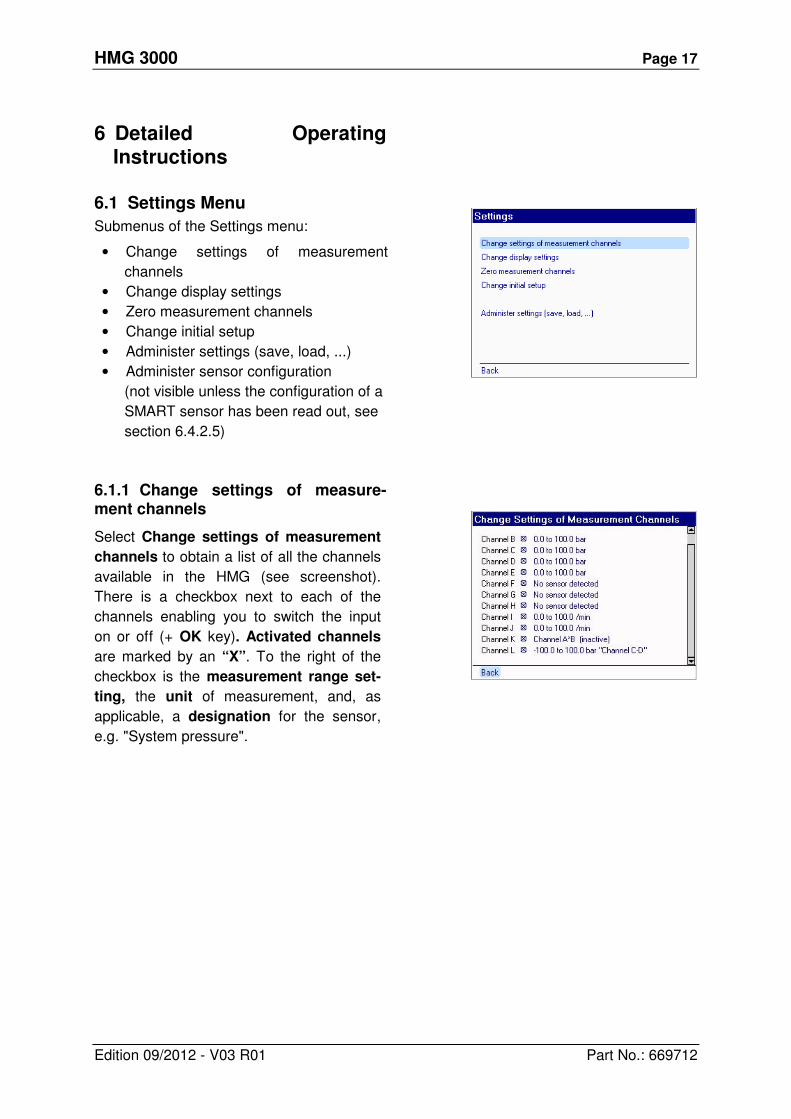
Submenus of the Settings menu:
• Change settings of measurement
channels
• Change display settings
• Zero measurement channels
• Change initial setup
• Administer settings (save, load, ...)
• Administer sensor configuration
(not visible unless the configuration of a
SMART sensor has been read out, see
section 6.4.2.5)
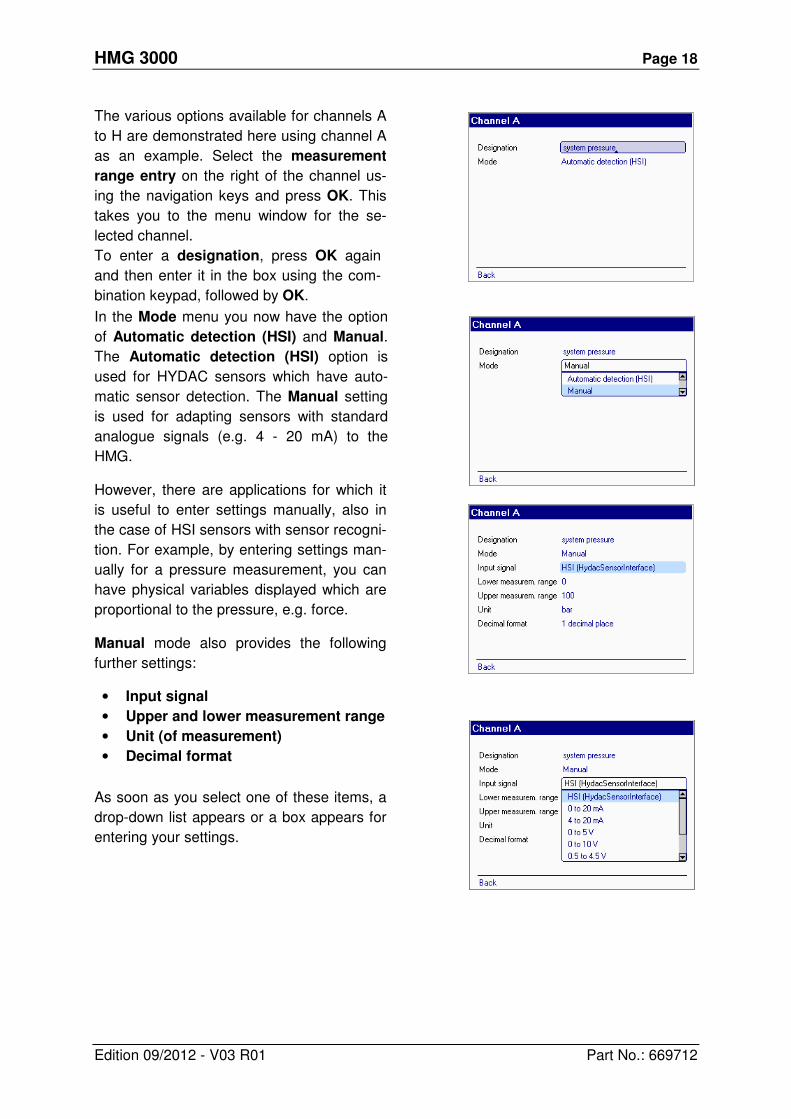
6.1.1 Change settings of measure-ment channels
Select Change settings of measurement
channels to obtain a list of all the channels
available in the HMG (see screenshot).
There is a checkbox next to each of the
channels enabling you to switch the input
on or off (+ OK key). Activated channels
are marked by an “X”. To the right of the
checkbox is the measurement range set-
ting, the unit of measurement, and, as
applicable, a designation for the sensor,
e.g. "System pressure".
HMG 3000 Page 18
Edition 09/2012 - V03 R01 Part No.: 669712
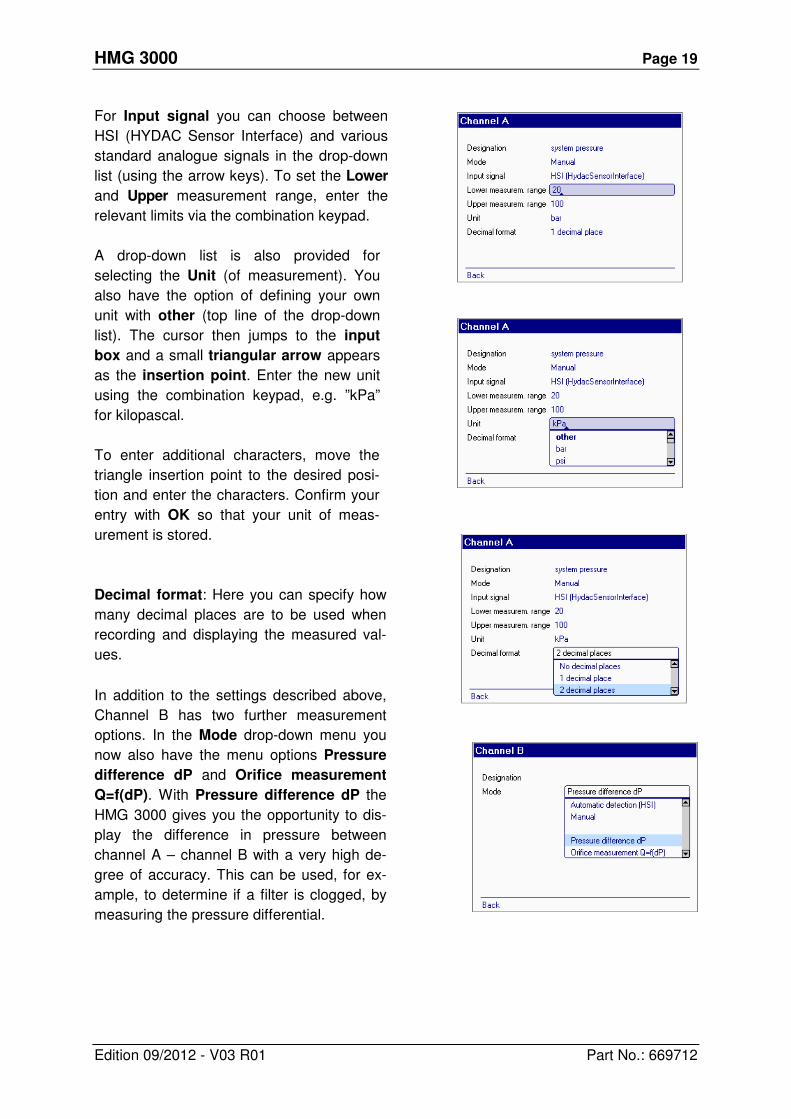
The various options available for channels A
to H are demonstrated here using channel A
as an example. Select the measurement
range entry on the right of the channel us-
ing the navigation keys and press OK. This
takes you to the menu window for the se-
lected channel.
To enter a designation, press OK again
and then enter it in the box using the com-
bination keypad, followed by OK.
In the Mode menu you now have the option
of Automatic detection (HSI) and Manual.
The Automatic detection (HSI) option is
used for HYDAC sensors which have auto-
matic sensor detection. The Manual setting
is used for adapting sensors with standard
analogue signals (e.g. 4 - 20 mA) to the
HMG.
However, there are applications for which it
is useful to enter settings manually, also in
the case of HSI sensors with sensor recogni-
tion. For example, by entering settings man-
ually for a pressure measurement, you can
have physical variables displayed which are
proportional to the pressure, e.g. force.
Manual mode also provides the following
further settings:
• Input signal
• Upper and lower measurement range
• Unit (of measurement)
• Decimal format
As soon as you select one of these items, a
drop-down list appears or a box appears for
entering your settings.
HMG 3000 Page 19
Edition 09/2012 - V03 R01 Part No.: 669712
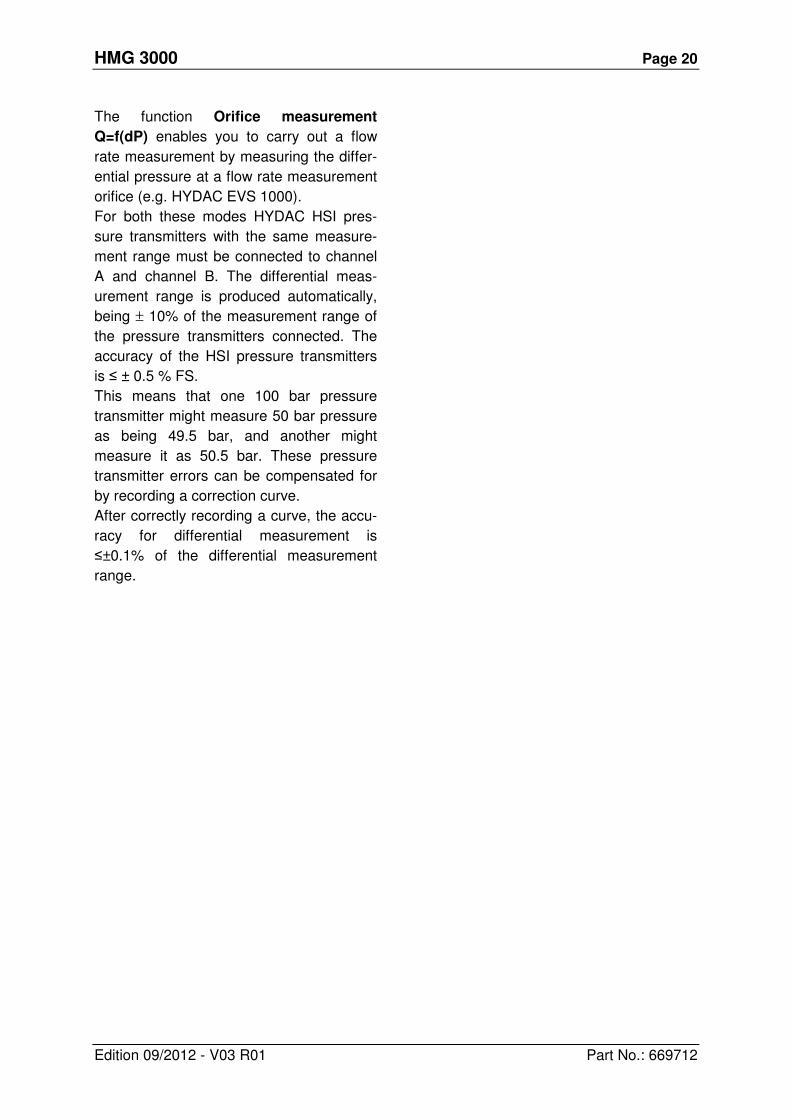
For Input signal you can choose between
HSI (HYDAC Sensor Interface) and various
standard analogue signals in the drop-down
list (using the arrow keys). To set the Lower
and Upper measurement range, enter the
relevant limits via the combination keypad.
A drop-down list is also provided for
selecting the Unit (of measurement). You
also have the option of defining your own
unit with other (top line of the drop-down
list). The cursor then jumps to the input
box and a small triangular arrow appears
as the insertion point. Enter the new unit
using the combination keypad, e.g. ”kPa”
for kilopascal.
To enter additional characters, move the
triangle insertion point to the desired posi-
tion and enter the characters. Confirm your
entry with OK so that your unit of meas-
urement is stored.
Decimal format: Here you can specify how
many decimal places are to be used when
recording and displaying the measured val-
ues.
In addition to the settings described above,
Channel B has two further measurement
options. In the Mode drop-down menu you
now also have the menu options Pressure
difference dP and Orifice measurement
Q=f(dP). With Pressure difference dP the
HMG 3000 gives you the opportunity to dis-
play the difference in pressure between
channel A – channel B with a very high de-
gree of accuracy. This can be used, for ex-
ample, to determine if a filter is clogged, by
measuring the pressure differential.
HMG 3000 Page 20
Edition 09/2012 - V03 R01 Part No.: 669712
The function Orifice measurement
Q=f(dP) enables you to carry out a flow
rate measurement by measuring the differ-
ential pressure at a flow rate measurement
orifice (e.g. HYDAC EVS 1000).
For both these modes HYDAC HSI pres-
sure transmitters with the same measure-
ment range must be connected to channel
A and channel B. The differential meas-
urement range is produced automatically,
being ± 10% of the measurement range of
the pressure transmitters connected. The
accuracy of the HSI pressure transmitters
is ≤ ± 0.5 % FS.
This means that one 100 bar pressure
transmitter might measure 50 bar pressure
as being 49.5 bar, and another might
measure it as 50.5 bar. These pressure
transmitter errors can be compensated for
by recording a correction curve.
After correctly recording a curve, the accu-
racy for differential measurement is
≤±0.1% of the differential measurement
range.
HMG 3000 Page 21
Edition 09/2012 - V03 R01 Part No.: 669712
Example:
For both 100 bar pressure transmitters there is a differential measurement range of -10 –
+10 bar, in other words a measurement margin of 20 bar. The accuracy of ≤ ± 0.1% refers to
this measurement margin. The pressure differential can therefore be measured with an ac-
curacy of ≤ ± 0.02 bar.
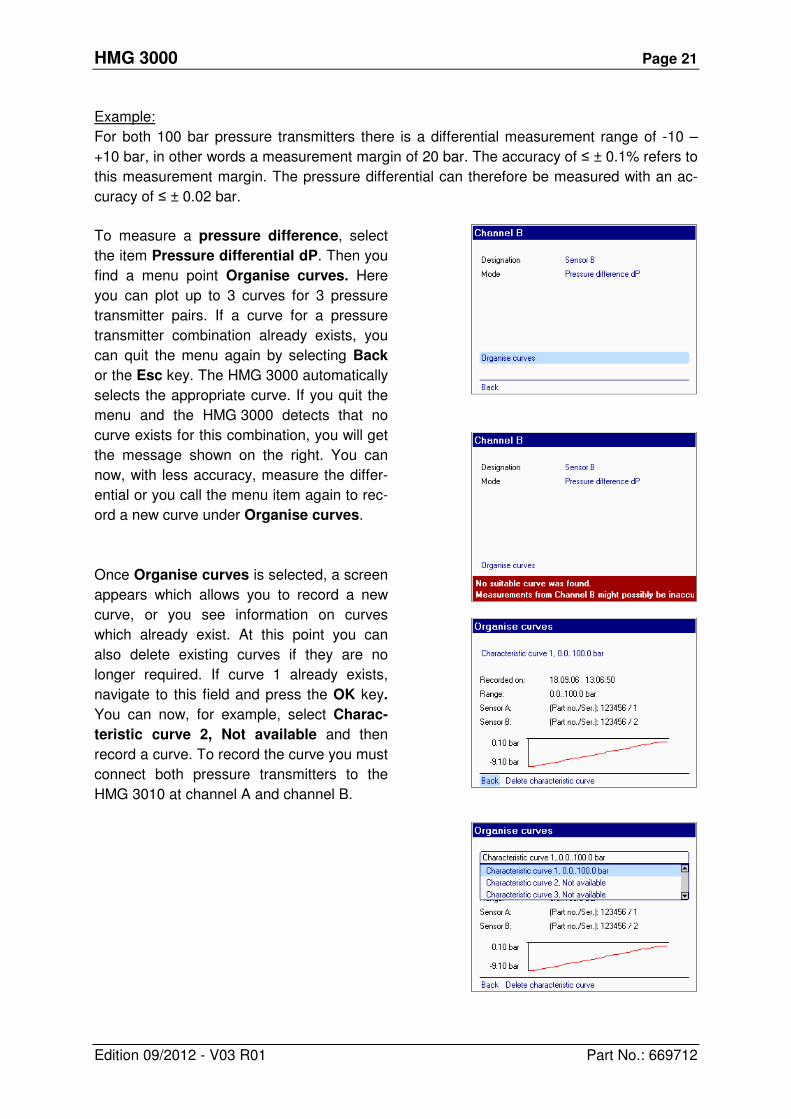
To measure a pressure difference, select
the item Pressure differential dP. Then you
find a menu point Organise curves. Here
you can plot up to 3 curves for 3 pressure
transmitter pairs. If a curve for a pressure
transmitter combination already exists, you
can quit the menu again by selecting Back
or the Esc key. The HMG 3000 automatically
selects the appropriate curve. If you quit the
menu and the HMG 3000 detects that no
curve exists for this combination, you will get
the message shown on the right. You can
now, with less accuracy, measure the differ-
ential or you call the menu item again to rec-
ord a new curve under Organise curves.
Once Organise curves is selected, a screen
appears which allows you to record a new
curve, or you see information on curves
which already exist. At this point you can
also delete existing curves if they are no
longer required. If curve 1 already exists,
navigate to this field and press the OK key.
You can now, for example, select Charac-
teristic curve 2, Not available and then
record a curve. To record the curve you must
connect both pressure transmitters to the
HMG 3010 at channel A and channel B.
HMG 3000 Page 22
Edition 09/2012 - V03 R01 Part No.: 669712
When doing this, identify which pressure
transmitter has been connected to channel A
and which to channel B, since the pressure
transmitters must be re-connected in the
same way later when taking measurements.
Connect the pressure transmitter
hydraulically so that the two instruments are
subjected to the same pressure. The ideal
for recording curves is connecting to a test
rig on which you can increase the pressure
slowly from 0 bar to the full measurement
range of the pressure transmitter and back
again.
However, the minimum requirement is to
record the curves/measured values in the
pressure range in which the differential
measurement is to take place later.
In the example above (to measure the filter
contamination level) both pressure
transmitters might be fitted to the inlet side of
the filter, e.g. using T-fittings and then, with
the machine running, the curve could be
recorded.
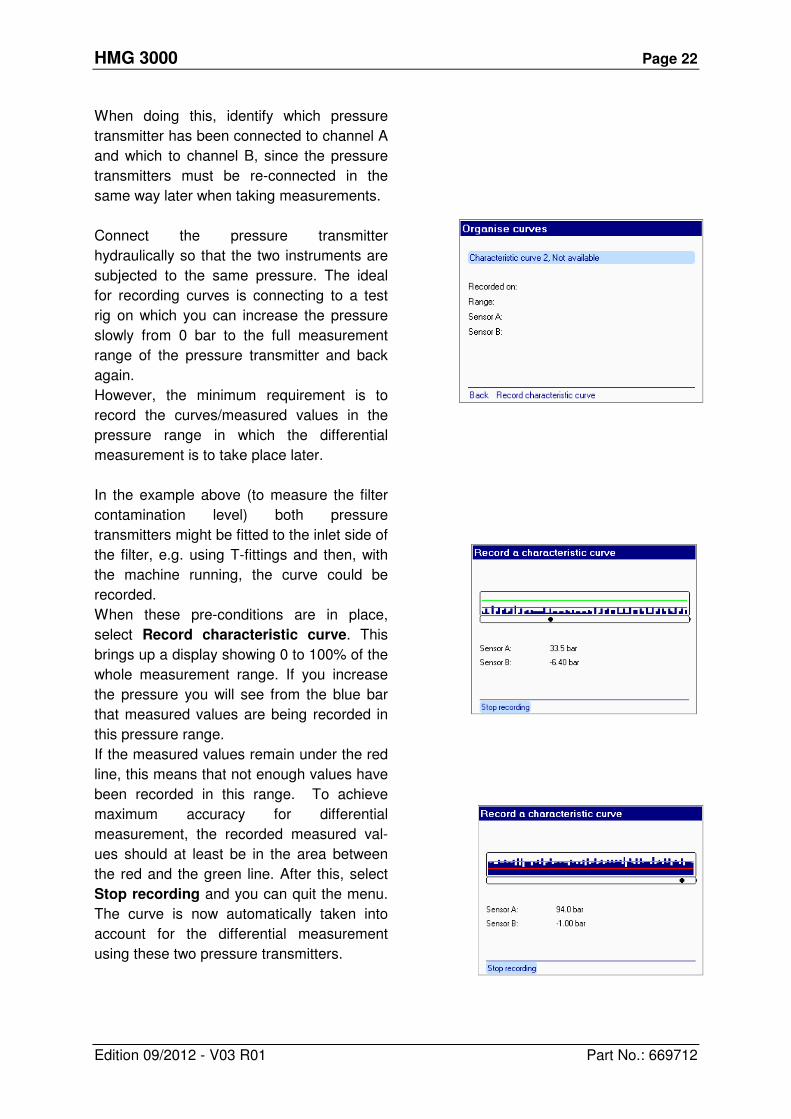
When these pre-conditions are in place,
select Record characteristic curve. This
brings up a display showing 0 to 100% of the
whole measurement range. If you increase
the pressure you will see from the blue bar
that measured values are being recorded in
this pressure range.
If the measured values remain under the red
line, this means that not enough values have
been recorded in this range. To achieve
maximum accuracy for differential
measurement, the recorded measured val-
ues should at least be in the area between
the red and the green line. After this, select
Stop recording and you can quit the menu.
The curve is now automatically taken into
account for the differential measurement
using these two pressure transmitters.
HMG 3000 Page 23
Edition 09/2012 - V03 R01 Part No.: 669712
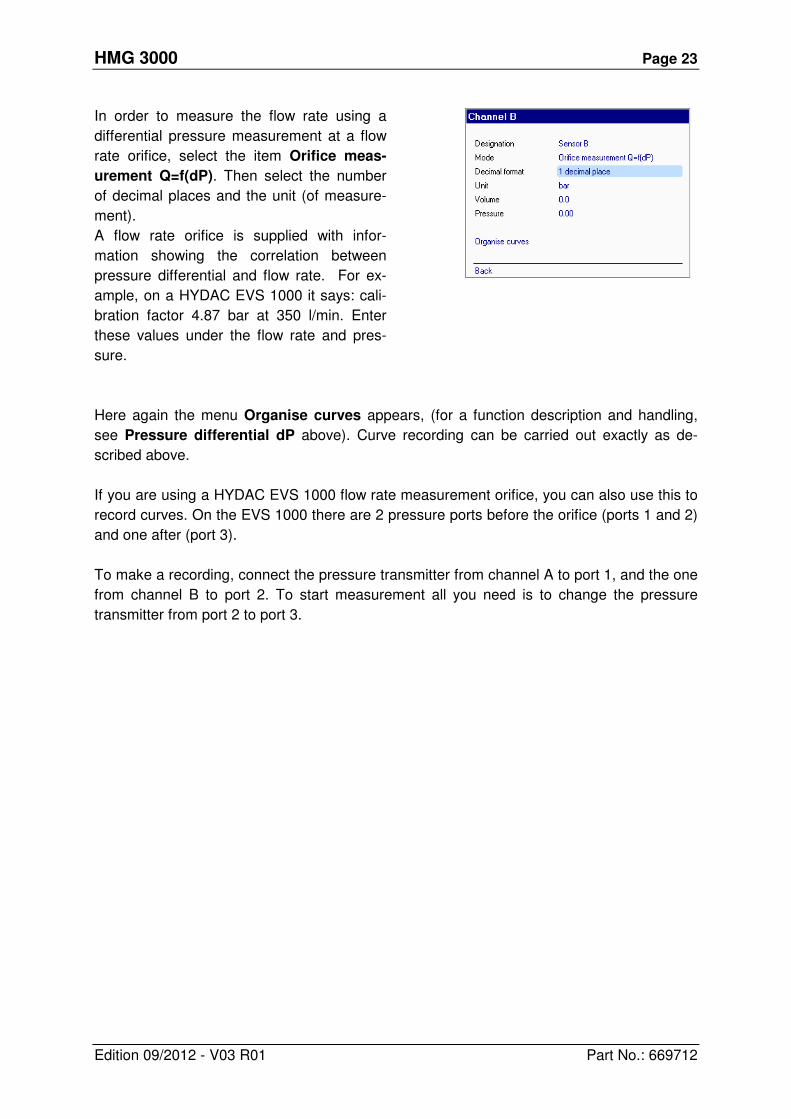
In order to measure the flow rate using a
differential pressure measurement at a flow
rate orifice, select the item Orifice meas-
urement Q=f(dP). Then select the number
of decimal places and the unit (of measure-
ment).
A flow rate orifice is supplied with infor-
mation showing the correlation between
pressure differential and flow rate. For ex-
ample, on a HYDAC EVS 1000 it says: cali-
bration factor 4.87 bar at 350 l/min. Enter
these values under the flow rate and pres-
sure.
Here again the menu Organise curves appears, (for a function description and handling,
see Pressure differential dP above). Curve recording can be carried out exactly as de-
scribed above.
If you are using a HYDAC EVS 1000 flow rate measurement orifice, you can also use this to
record curves. On the EVS 1000 there are 2 pressure ports before the orifice (ports 1 and 2)
and one after (port 3).
To make a recording, connect the pressure transmitter from channel A to port 1, and the one
from channel B to port 2. To start measurement all you need is to change the pressure
transmitter from port 2 to port 3.
HMG 3000 Page 24
Edition 09/2012 - V03 R01 Part No.: 669712
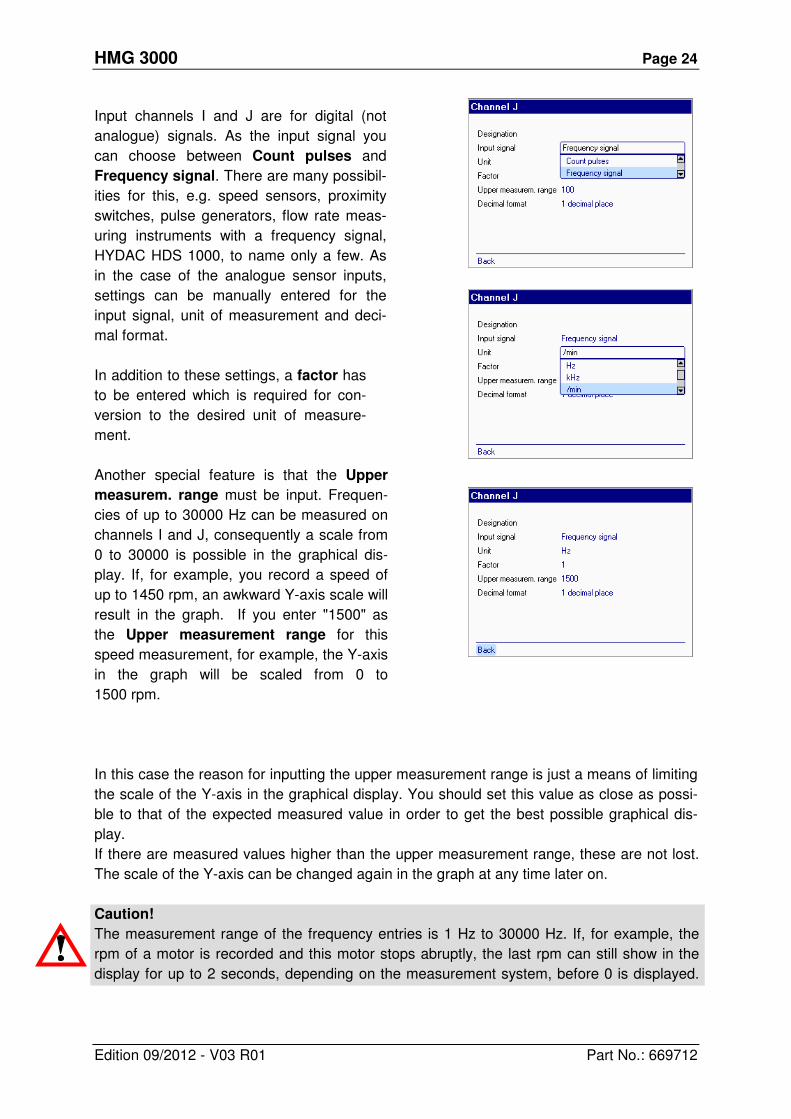
Input channels I and J are for digital (not
analogue) signals. As the input signal you
can choose between Count pulses and
Frequency signal. There are many possibil-
ities for this, e.g. speed sensors, proximity
switches, pulse generators, flow rate meas-
uring instruments with a frequency signal,
HYDAC HDS 1000, to name only a few. As
in the case of the analogue sensor inputs,
settings can be manually entered for the
input signal, unit of measurement and deci-
mal format.
In addition to these settings, a factor has
to be entered which is required for con-
version to the desired unit of measure-
ment.
Another special feature is that the Upper
measurem. range must be input. Frequen-
cies of up to 30000 Hz can be measured on
channels I and J, consequently a scale from
0 to 30000 is possible in the graphical dis-
play. If, for example, you record a speed of
up to 1450 rpm, an awkward Y-axis scale will
result in the graph. If you enter "1500" as
the Upper measurement range for this
speed measurement, for example, the Y-axis
in the graph will be scaled from 0 to
1500 rpm.
In this case the reason for inputting the upper measurement range is just a means of limiting
the scale of the Y-axis in the graphical display. You should set this value as close as possi-
ble to that of the expected measured value in order to get the best possible graphical dis-
play.
If there are measured values higher than the upper measurement range, these are not lost.
The scale of the Y-axis can be changed again in the graph at any time later on.
Caution!
The measurement range of the frequency entries is 1 Hz to 30000 Hz. If, for example, the
rpm of a motor is recorded and this motor stops abruptly, the last rpm can still show in the
display for up to 2 seconds, depending on the measurement system, before 0 is displayed.
HMG 3000 Page 25
Edition 09/2012 - V03 R01 Part No.: 669712
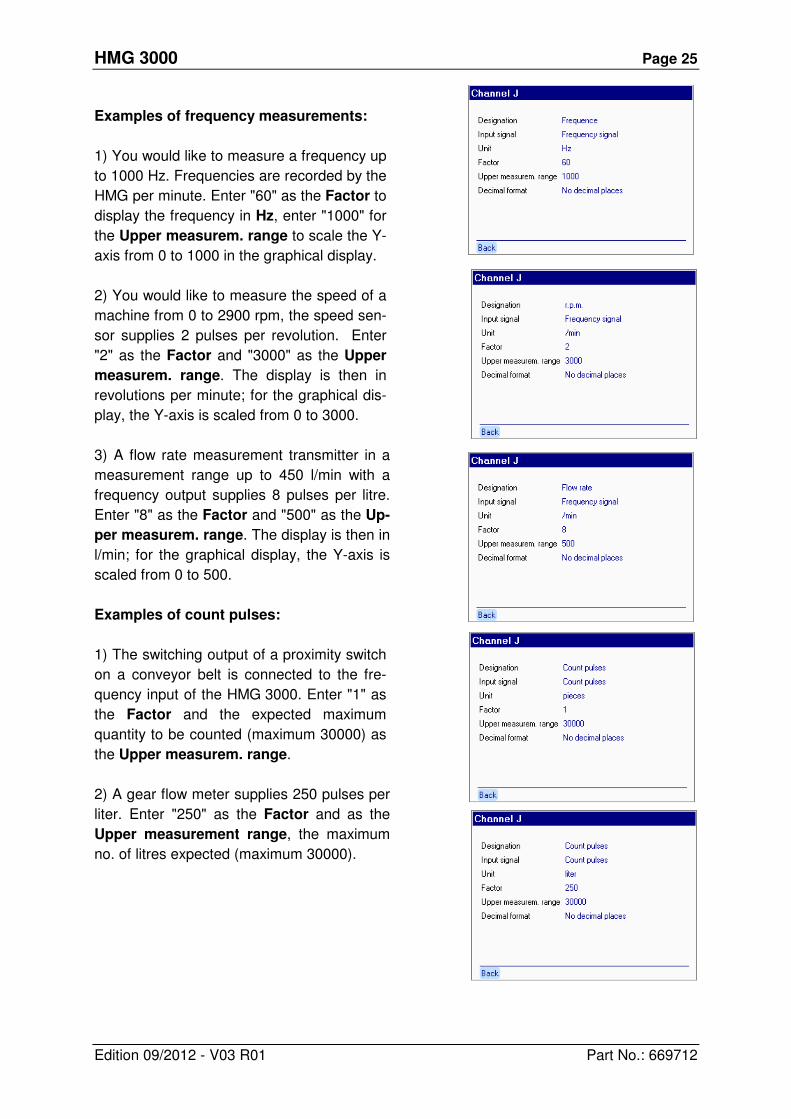
Examples of frequency measurements:
1) You would like to measure a frequency up
to 1000 Hz. Frequencies are recorded by the
HMG per minute. Enter "60" as the Factor to
display the frequency in Hz, enter "1000" for
the Upper measurem. range to scale the Y-
axis from 0 to 1000 in the graphical display.
2) You would like to measure the speed of a
machine from 0 to 2900 rpm, the speed sen-
sor supplies 2 pulses per revolution. Enter
"2" as the Factor and "3000" as the Upper
measurem. range. The display is then in
revolutions per minute; for the graphical dis-
play, the Y-axis is scaled from 0 to 3000.
3) A flow rate measurement transmitter in a
measurement range up to 450 l/min with a
frequency output supplies 8 pulses per litre.
Enter "8" as the Factor and "500" as the Up-
per measurem. range. The display is then in
l/min; for the graphical display, the Y-axis is
scaled from 0 to 500.
Examples of count pulses:
1) The switching output of a proximity switch
on a conveyor belt is connected to the fre-
quency input of the HMG 3000. Enter "1" as
the Factor and the expected maximum
quantity to be counted (maximum 30000) as
the Upper measurem. range.
2) A gear flow meter supplies 250 pulses per
liter. Enter "250" as the Factor and as the
Upper measurement range, the maximum
no. of litres expected (maximum 30000).
HMG 3000 Page 26
Edition 09/2012 - V03 R01 Part No.: 669712
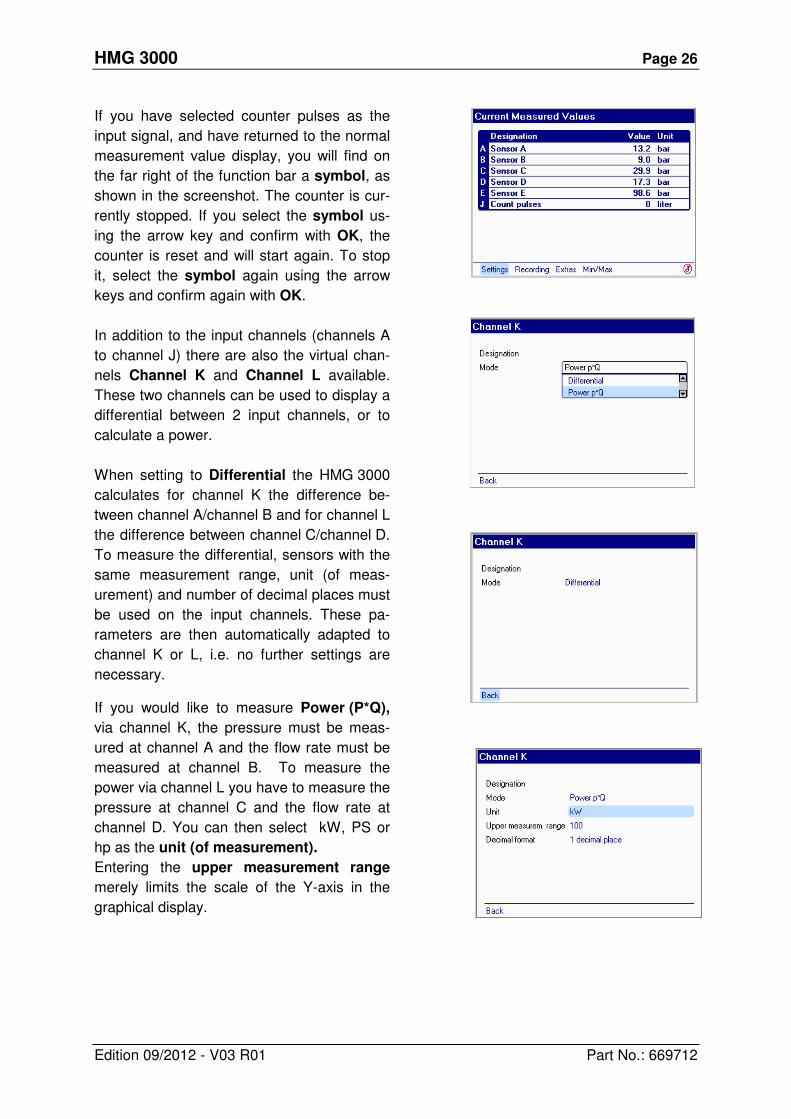
If you have selected counter pulses as the
input signal, and have returned to the normal
measurement value display, you will find on
the far right of the function bar a symbol, as
shown in the screenshot. The counter is cur-
rently stopped. If you select the symbol us-
ing the arrow key and confirm with OK, the
counter is reset and will start again. To stop
it, select the symbol again using the arrow
keys and confirm again with OK.
In addition to the input channels (channels A
to channel J) there are also the virtual chan-
nels Channel K and Channel L available.
These two channels can be used to display a
differential between 2 input channels, or to
calculate a power.
When setting to Differential the HMG 3000
calculates for channel K the difference be-
tween channel A/channel B and for channel L
the difference between channel C/channel D.
To measure the differential, sensors with the
same measurement range, unit (of meas-
urement) and number of decimal places must
be used on the input channels. These pa-
rameters are then automatically adapted to
channel K or L, i.e. no further settings are
necessary.
If you would like to measure Power (P*Q),
via channel K, the pressure must be meas-
ured at channel A and the flow rate must be
measured at channel B. To measure the
power via channel L you have to measure the
pressure at channel C and the flow rate at
channel D. You can then select kW, PS or
hp as the unit (of measurement).
Entering the upper measurement range
merely limits the scale of the Y-axis in the
graphical display.
HMG 3000 Page 27
Edition 09/2012 - V03 R01 Part No.: 669712
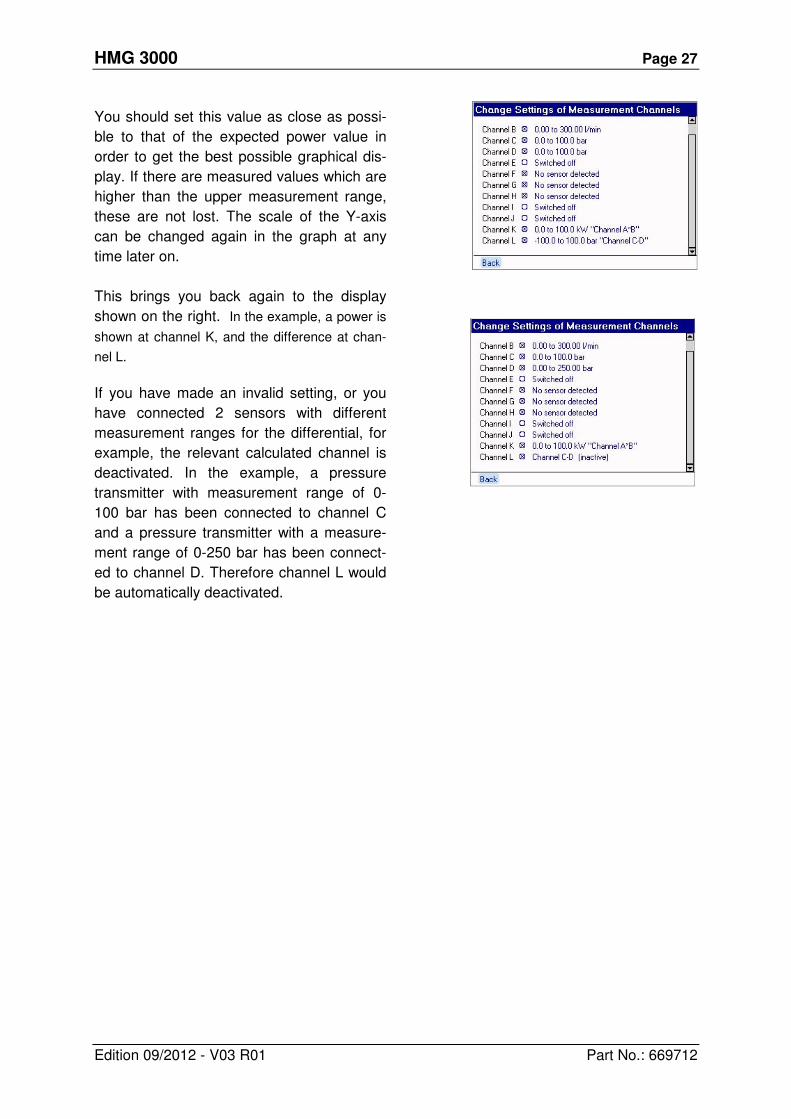
You should set this value as close as possi-
ble to that of the expected power value in
order to get the best possible graphical dis-
play. If there are measured values which are
higher than the upper measurement range,
these are not lost. The scale of the Y-axis
can be changed again in the graph at any
time later on.
This brings you back again to the display
shown on the right. In the example, a power is
shown at channel K, and the difference at chan-
nel L.
If you have made an invalid setting, or you
have connected 2 sensors with different
measurement ranges for the differential, for
example, the relevant calculated channel is
deactivated. In the example, a pressure
transmitter with measurement range of 0-
100 bar has been connected to channel C
and a pressure transmitter with a measure-
ment range of 0-250 bar has been connect-
ed to channel D. Therefore channel L would
be automatically deactivated.
HMG 3000 Page 28
Edition 09/2012 - V03 R01 Part No.: 669712
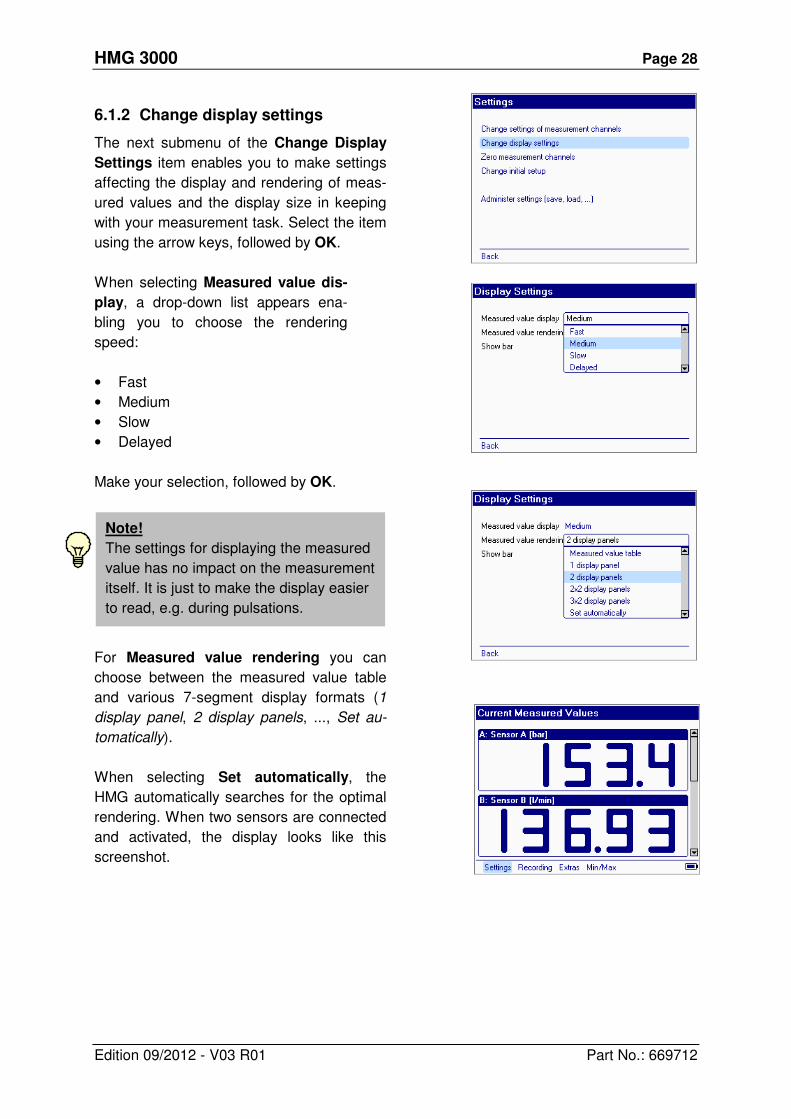
6.1.2 Change display settings
The next submenu of the Change Display
Settings item enables you to make settings
affecting the display and rendering of meas-
ured values and the display size in keeping
with your measurement task. Select the item
using the arrow keys, followed by OK.
When selecting Measured value dis-
play, a drop-down list appears ena-
bling you to choose the rendering
speed:
• Fast
• Medium
• Slow
• Delayed
Make your selection, followed by OK.
For Measured value rendering you can
choose between the measured value table
and various 7-segment display formats (1
display panel, 2 display panels, ..., Set au-
tomatically).
When selecting Set automatically, the
HMG automatically searches for the optimal
rendering. When two sensors are connected
and activated, the display looks like this
screenshot.
Note!
The settings for displaying the measured
value has no impact on the measurement
itself. It is just to make the display easier
to read, e.g. during pulsations.
HMG 3000 Page 29
Edition 09/2012 - V03 R01 Part No.: 669712
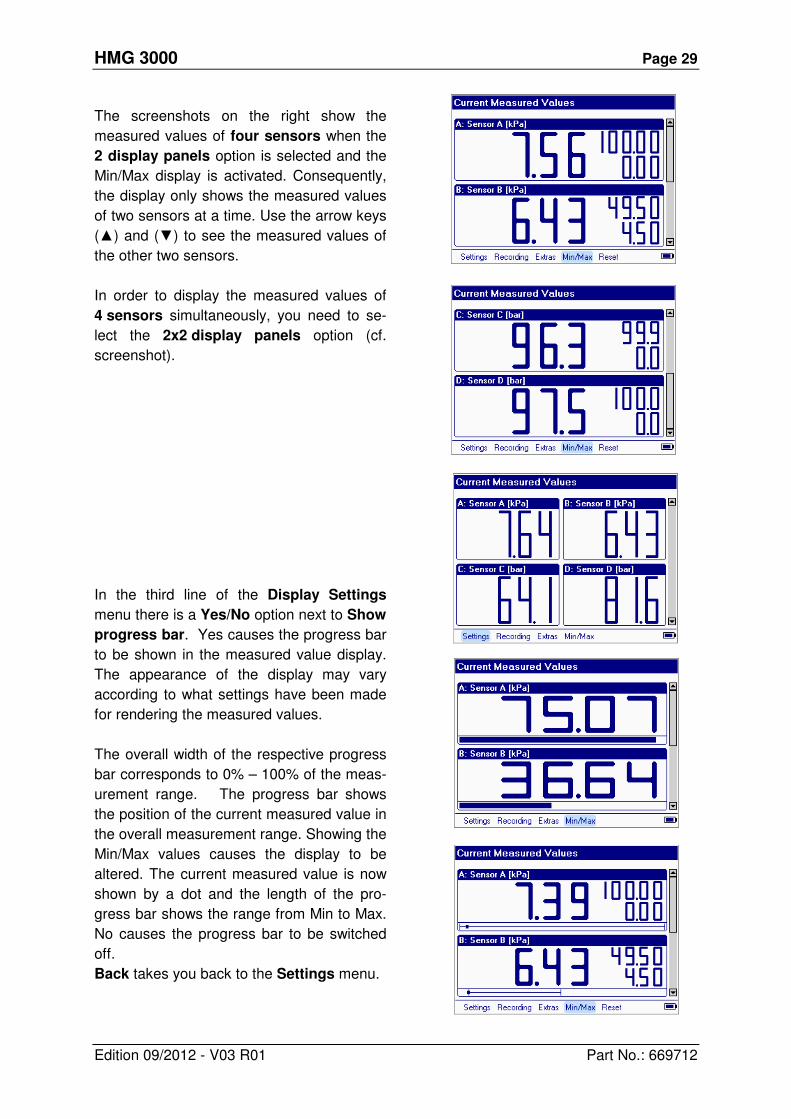
The screenshots on the right show the
measured values of four sensors when the
2 display panels option is selected and the
Min/Max display is activated. Consequently,
the display only shows the measured values
of two sensors at a time. Use the arrow keys
(▲) and (▼) to see the measured values of
the other two sensors.
In order to display the measured values of
4 sensors simultaneously, you need to se-
lect the 2x2 display panels option (cf.
screenshot).
In the third line of the Display Settings
menu there is a Yes/No option next to Show
progress bar. Yes causes the progress bar
to be shown in the measured value display.
The appearance of the display may vary
according to what settings have been made
for rendering the measured values.
The overall width of the respective progress
bar corresponds to 0% – 100% of the meas-
urement range. The progress bar shows
the position of the current measured value in
the overall measurement range. Showing the
Min/Max values causes the display to be
altered. The current measured value is now
shown by a dot and the length of the pro-
gress bar shows the range from Min to Max.
No causes the progress bar to be switched
off.
Back takes you back to the Settings menu.
HMG 3000 Page 30
Edition 09/2012 - V03 R01 Part No.: 669712
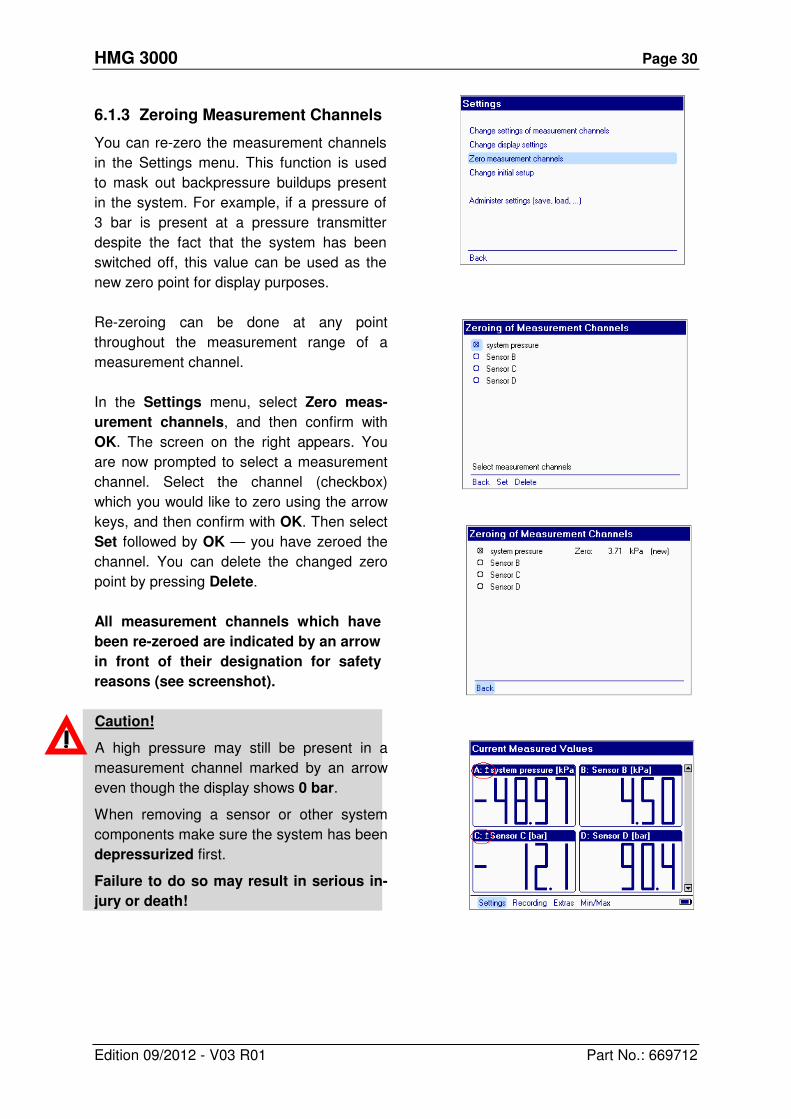
6.1.3 Zeroing Measurement Channels
You can re-zero the measurement channels
in the Settings menu. This function is used
to mask out backpressure buildups present
in the system. For example, if a pressure of
3 bar is present at a pressure transmitter
despite the fact that the system has been
switched off, this value can be used as the
new zero point for display purposes.
Re-zeroing can be done at any point
throughout the measurement range of a
measurement channel.
In the Settings menu, select Zero meas-
urement channels, and then confirm with
OK. The screen on the right appears. You
are now prompted to select a measurement
channel. Select the channel (checkbox)
which you would like to zero using the arrow
keys, and then confirm with OK. Then select
Set followed by OK — you have zeroed the
channel. You can delete the changed zero
point by pressing Delete.
All measurement channels which have
been re-zeroed are indicated by an arrow
in front of their designation for safety
reasons (see screenshot).
Caution!
A high pressure may still be present in a
measurement channel marked by an arrow
even though the display shows 0 bar.
When removing a sensor or other system
components make sure the system has been
depressurized first.
Failure to do so may result in serious in-
jury or death!
HMG 3000 Page 31
Edition 09/2012 - V03 R01 Part No.: 669712
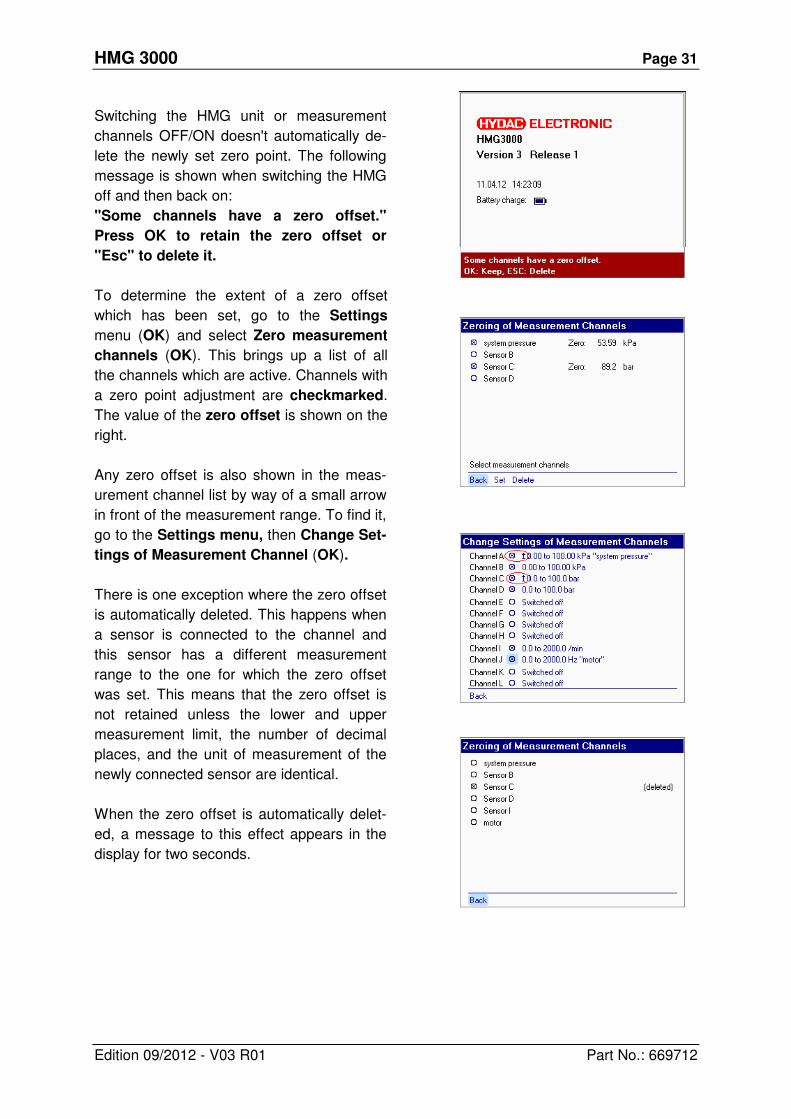
Switching the HMG unit or measurement
channels OFF/ON doesn't automatically de-
lete the newly set zero point. The following
message is shown when switching the HMG
off and then back on:
"Some channels have a zero offset."
Press OK to retain the zero offset or
"Esc" to delete it.
To determine the extent of a zero offset
which has been set, go to the Settings
menu (OK) and select Zero measurement
channels (OK). This brings up a list of all
the channels which are active. Channels with
a zero point adjustment are checkmarked.
The value of the zero offset is shown on the
right.
Any zero offset is also shown in the meas-
urement channel list by way of a small arrow
in front of the measurement range. To find it,
go to the Settings menu, then Change Set-
tings of Measurement Channel (OK).
There is one exception where the zero offset
is automatically deleted. This happens when
a sensor is connected to the channel and
this sensor has a different measurement
range to the one for which the zero offset
was set. This means that the zero offset is
not retained unless the lower and upper
measurement limit, the number of decimal
places, and the unit of measurement of the
newly connected sensor are identical.
When the zero offset is automatically delet-
ed, a message to this effect appears in the
display for two seconds.
4
HMG 3000 Page 32
Edition 09/2012 - V03 R01 Part No.: 669712
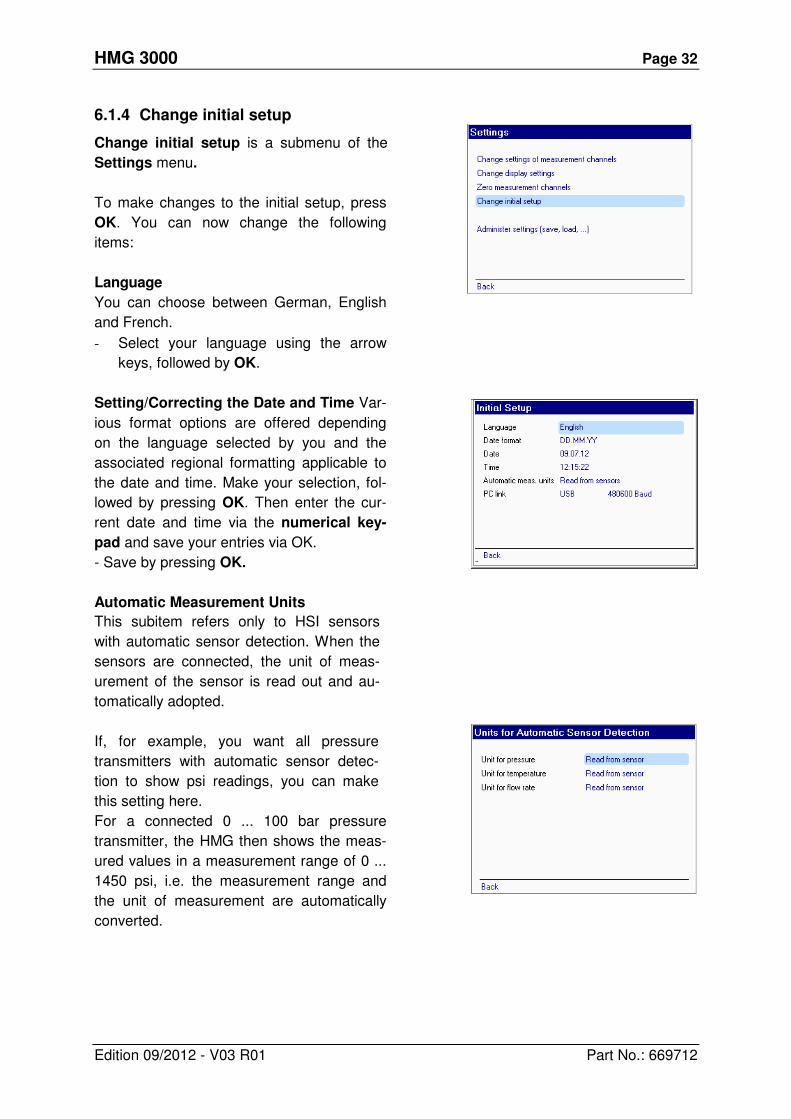
6.1.4 Change initial setup
Change initial setup is a submenu of the
Settings menu.
To make changes to the initial setup, press
OK. You can now change the following
items:
Language
You can choose between German, English
and French.
- Select your language using the arrow
keys, followed by OK.
Setting/Correcting the Date and Time Var-
ious format options are offered depending
on the language selected by you and the
associated regional formatting applicable to
the date and time. Make your selection, fol-
lowed by pressing OK. Then enter the cur-
rent date and time via the numerical key-
pad and save your entries via OK.
- Save by pressing OK.
Automatic Measurement Units
This subitem refers only to HSI sensors
with automatic sensor detection. When the
sensors are connected, the unit of meas-
urement of the sensor is read out and au-
tomatically adopted.
If, for example, you want all pressure
transmitters with automatic sensor detec-
tion to show psi readings, you can make
this setting here.
For a connected 0 ... 100 bar pressure
transmitter, the HMG then shows the meas-
ured values in a measurement range of 0 ...
1450 psi, i.e. the measurement range and
the unit of measurement are automatically
converted.
HMG 3000 Page 33
Edition 09/2012 - V03 R01 Part No.: 669712
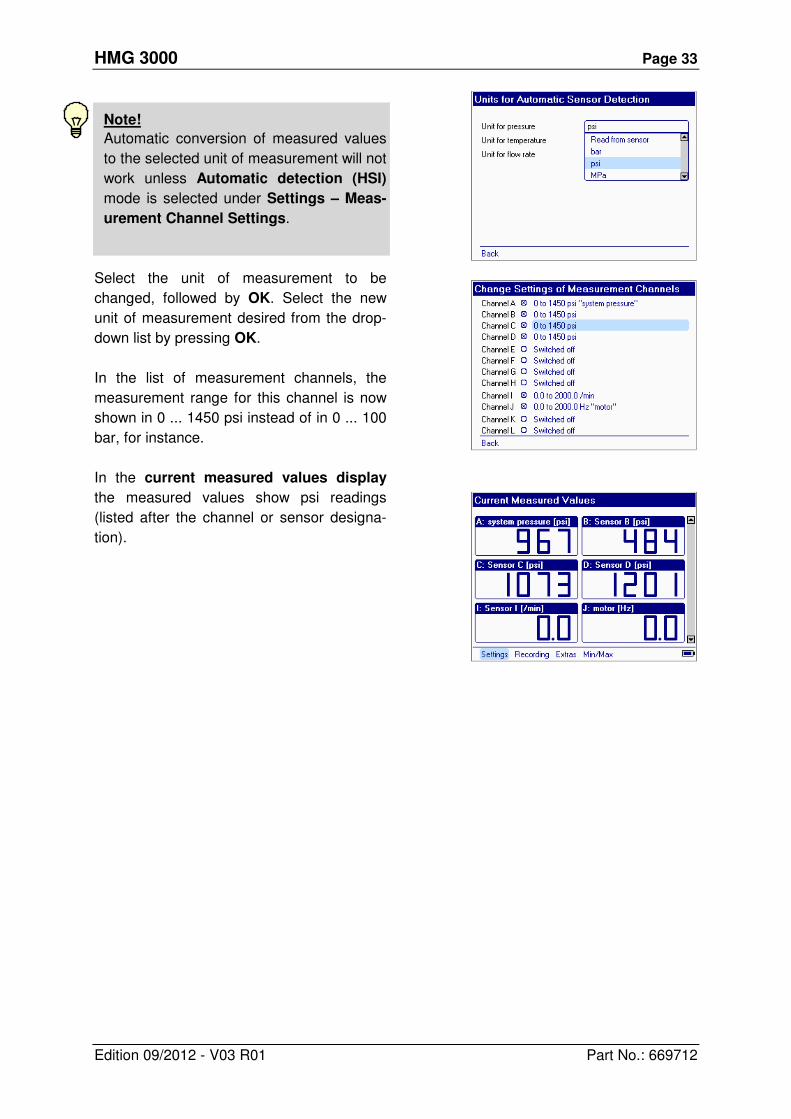
Note!
Automatic conversion of measured values
to the selected unit of measurement will not
work unless Automatic detection (HSI)
mode is selected under Settings – Meas-
urement Channel Settings.
Select the unit of measurement to be
changed, followed by OK. Select the new
unit of measurement desired from the drop-
down list by pressing OK.
In the list of measurement channels, the
measurement range for this channel is now
shown in 0 ... 1450 psi instead of in 0 ... 100
bar, for instance.
In the current measured values display
the measured values show psi readings
(listed after the channel or sensor designa-
tion).
HMG 3000 Page 34
Edition 09/2012 - V03 R01 Part No.: 669712
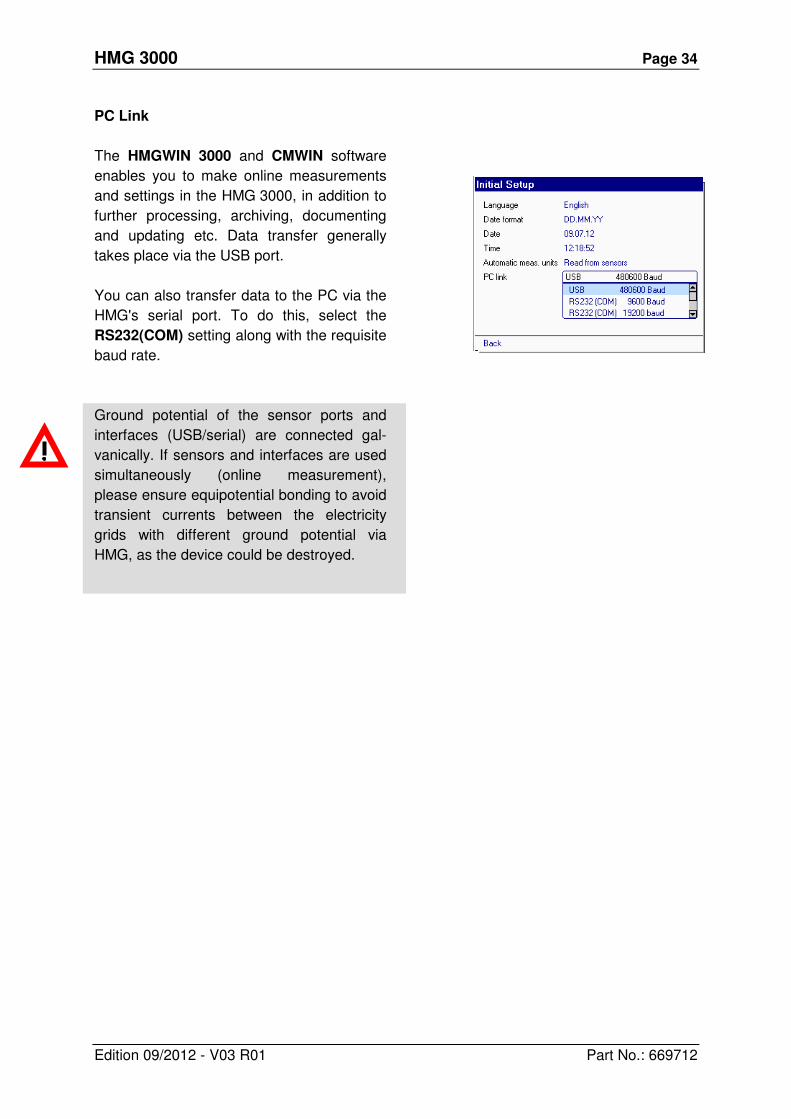
PC Link
The HMGWIN 3000 and CMWIN software
enables you to make online measurements
and settings in the HMG 3000, in addition to
further processing, archiving, documenting
and updating etc. Data transfer generally
takes place via the USB port.
You can also transfer data to the PC via the
HMG's serial port. To do this, select the
RS232(COM) setting along with the requisite
baud rate.
Ground potential of the sensor ports and
interfaces (USB/serial) are connected gal-
vanically. If sensors and interfaces are used
simultaneously (online measurement),
please ensure equipotential bonding to avoid
transient currents between the electricity
grids with different ground potential via
HMG, as the device could be destroyed.
HMG 3000 Page 35
Edition 09/2012 - V03 R01 Part No.: 669712
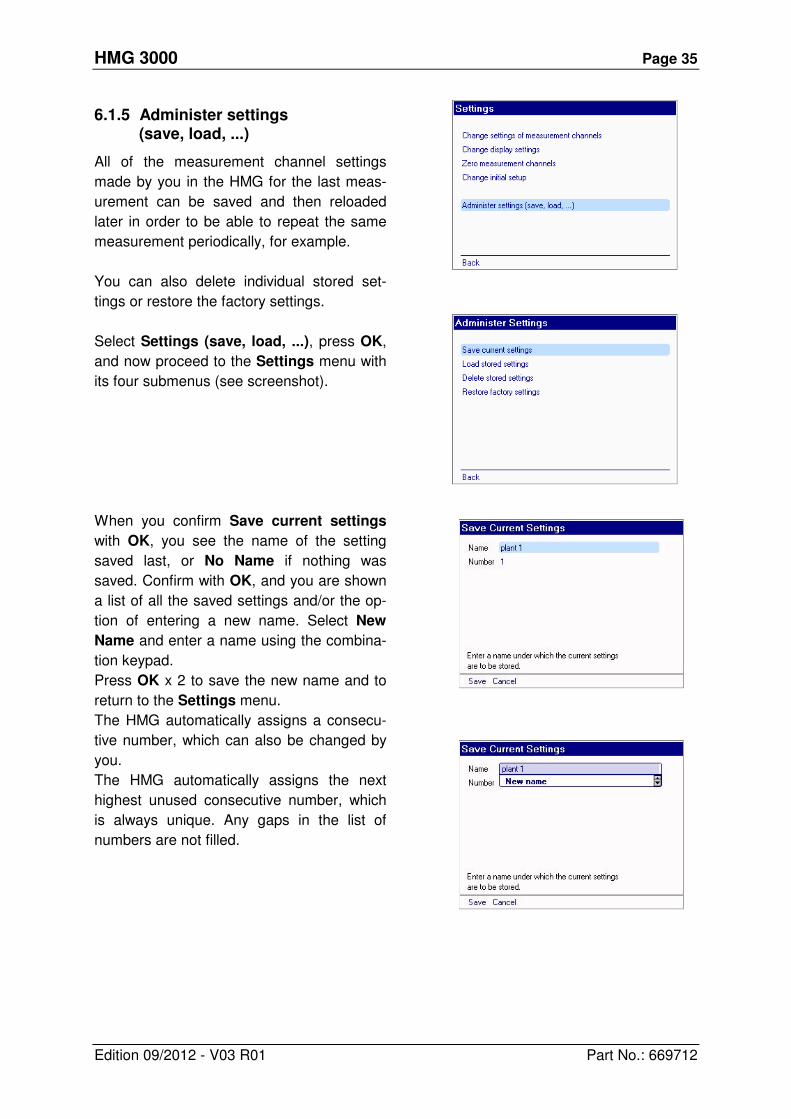
6.1.5 Administer settings (save, load, ...)
All of the measurement channel settings
made by you in the HMG for the last meas-
urement can be saved and then reloaded
later in order to be able to repeat the same
measurement periodically, for example.
You can also delete individual stored set-
tings or restore the factory settings.
Select Settings (save, load, ...), press OK,
and now proceed to the Settings menu with
its four submenus (see screenshot).
When you confirm Save current settings
with OK, you see the name of the setting
saved last, or No Name if nothing was
saved. Confirm with OK, and you are shown
a list of all the saved settings and/or the op-
tion of entering a new name. Select New
Name and enter a name using the combina-
tion keypad.
Press OK x 2 to save the new name and to
return to the Settings menu.
The HMG automatically assigns a consecu-
tive number, which can also be changed by
you.
The HMG automatically assigns the next
highest unused consecutive number, which
is always unique. Any gaps in the list of
numbers are not filled.
HMG 3000 Page 36
Edition 09/2012 - V03 R01 Part No.: 669712
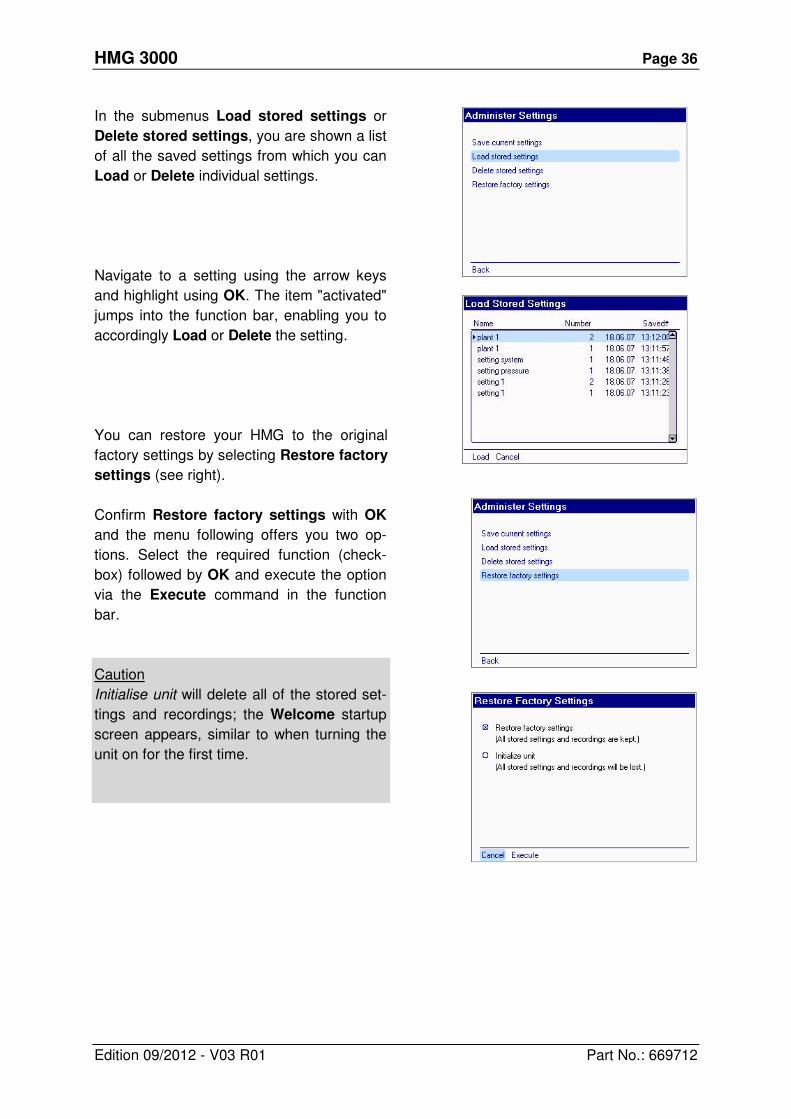
In the submenus Load stored settings or
Delete stored settings, you are shown a list
of all the saved settings from which you can
Load or Delete individual settings.
Navigate to a setting using the arrow keys
and highlight using OK. The item "activated"
jumps into the function bar, enabling you to
accordingly Load or Delete the setting.
You can restore your HMG to the original
factory settings by selecting Restore factory
settings (see right).
Confirm Restore factory settings with OK
and the menu following offers you two op-
tions. Select the required function (check-
box) followed by OK and execute the option
via the Execute command in the function
bar.
Caution
Initialise unit will delete all of the stored set-
tings and recordings; the Welcome startup
screen appears, similar to when turning the
unit on for the first time.
HMG 3000 Page 37
Edition 09/2012 - V03 R01 Part No.: 669712
6.2 Recording Menu
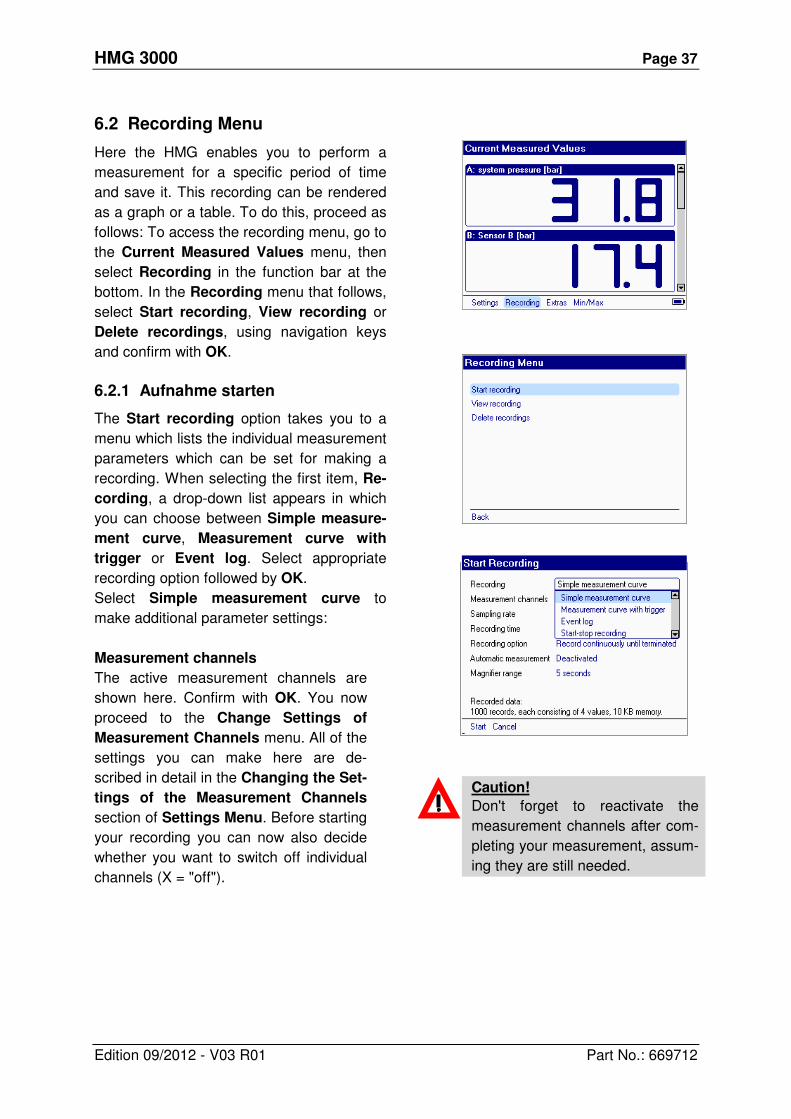
Here the HMG enables you to perform a
measurement for a specific period of time
and save it. This recording can be rendered
as a graph or a table. To do this, proceed as
follows: To access the recording menu, go to
the Current Measured Values menu, then
select Recording in the function bar at the
bottom. In the Recording menu that follows,
select Start recording, View recording or
Delete recordings, using navigation keys
and confirm with OK.
6.2.1 Aufnahme starten
The Start recording option takes you to a
menu which lists the individual measurement
parameters which can be set for making a
recording. When selecting the first item, Re-
cording, a drop-down list appears in which
you can choose between Simple measure-
ment curve, Measurement curve with
trigger or Event log. Select appropriate
recording option followed by OK.
Select Simple measurement curve to
make additional parameter settings:
Measurement channels
The active measurement channels are
shown here. Confirm with OK. You now
proceed to the Change Settings of
Measurement Channels menu. All of the
settings you can make here are de-
scribed in detail in the Changing the Set-
tings of the Measurement Channels
section of Settings Menu. Before starting
your recording you can now also decide
whether you want to switch off individual
channels (X = "off").
Caution!
Don't forget to reactivate the
measurement channels after com-
pleting your measurement, assum-
ing they are still needed.
HMG 3000 Page 38
Edition 09/2012 - V03 R01 Part No.: 669712
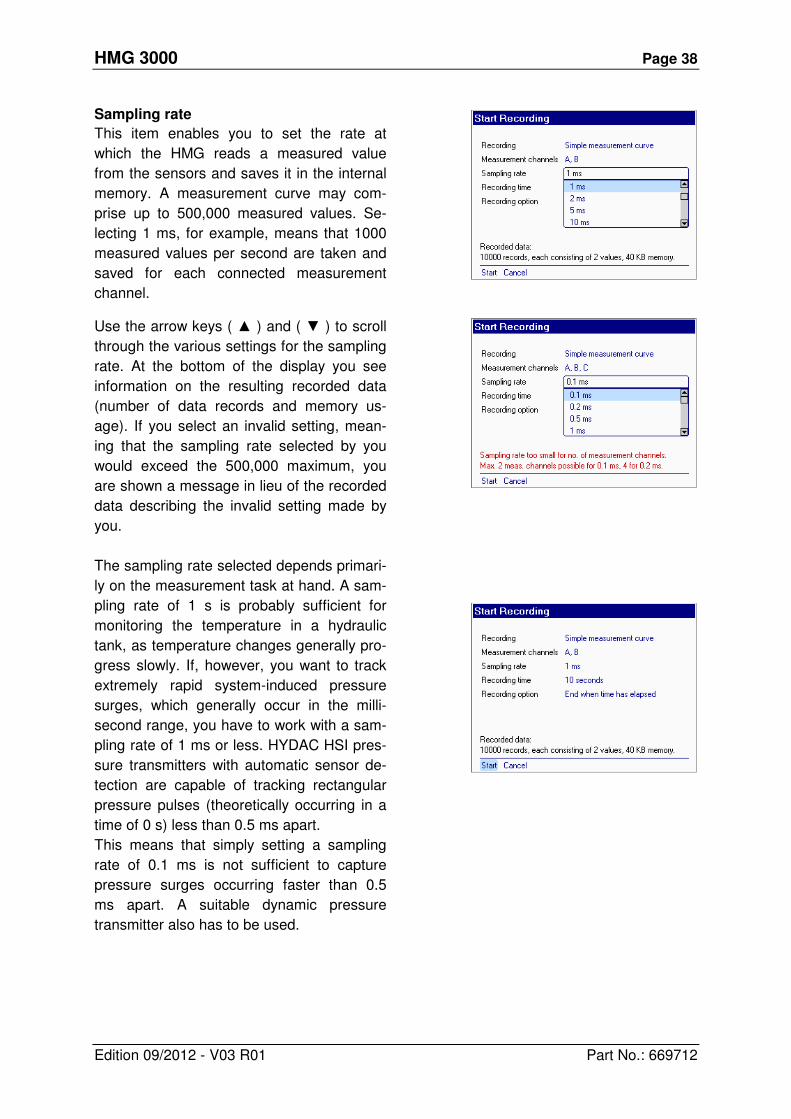
Sampling rate
This item enables you to set the rate at
which the HMG reads a measured value
from the sensors and saves it in the internal
memory. A measurement curve may com-
prise up to 500,000 measured values. Se-
lecting 1 ms, for example, means that 1000
measured values per second are taken and
saved for each connected measurement
channel.
Use the arrow keys ( ▲ ) and ( ▼ ) to scroll
through the various settings for the sampling
rate. At the bottom of the display you see
information on the resulting recorded data
(number of data records and memory us-
age). If you select an invalid setting, mean-
ing that the sampling rate selected by you
would exceed the 500,000 maximum, you
are shown a message in lieu of the recorded
data describing the invalid setting made by
you.
The sampling rate selected depends primari-
ly on the measurement task at hand. A sam-
pling rate of 1 s is probably sufficient for
monitoring the temperature in a hydraulic
tank, as temperature changes generally pro-
gress slowly. If, however, you want to track
extremely rapid system-induced pressure
surges, which generally occur in the milli-
second range, you have to work with a sam-
pling rate of 1 ms or less. HYDAC HSI pres-
sure transmitters with automatic sensor de-
tection are capable of tracking rectangular
pressure pulses (theoretically occurring in a
time of 0 s) less than 0.5 ms apart.
This means that simply setting a sampling
rate of 0.1 ms is not sufficient to capture
pressure surges occurring faster than 0.5
ms apart. A suitable dynamic pressure
transmitter also has to be used.
HMG 3000 Page 39
Edition 09/2012 - V03 R01 Part No.: 669712
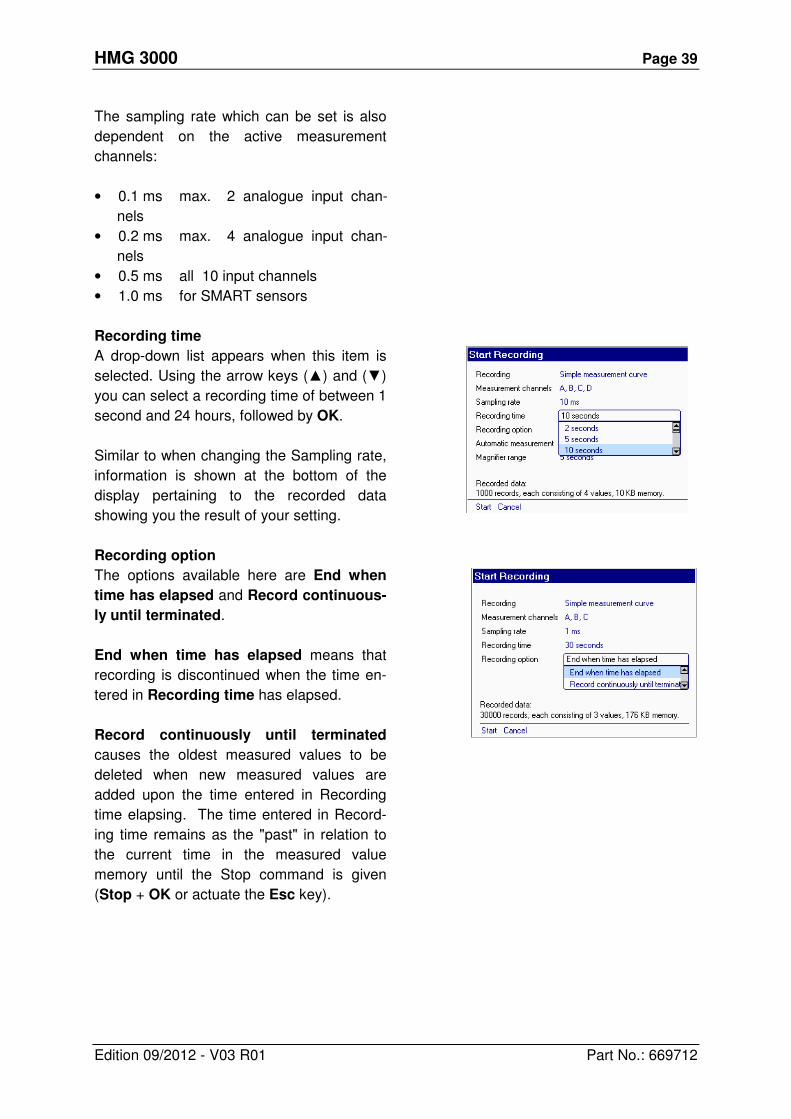
The sampling rate which can be set is also
dependent on the active measurement
channels:
• 0.1 ms max. 2 analogue input chan-
nels
• 0.2 ms max. 4 analogue input chan-
nels
• 0.5 ms all 10 input channels
• 1.0 ms for SMART sensors
Recording time
A drop-down list appears when this item is
selected. Using the arrow keys (▲) and (▼)
you can select a recording time of between 1
second and 24 hours, followed by OK.
Similar to when changing the Sampling rate,
information is shown at the bottom of the
display pertaining to the recorded data
showing you the result of your setting.
Recording option
The options available here are End when
time has elapsed and Record continuous-
ly until terminated.
End when time has elapsed means that
recording is discontinued when the time en-
tered in Recording time has elapsed.
Record continuously until terminated
causes the oldest measured values to be
deleted when new measured values are
added upon the time entered in Recording
time elapsing. The time entered in Record-
ing time remains as the "past" in relation to
the current time in the measured value
memory until the Stop command is given
(Stop + OK or actuate the Esc key).
HMG 3000 Page 40
Edition 09/2012 - V03 R01 Part No.: 669712
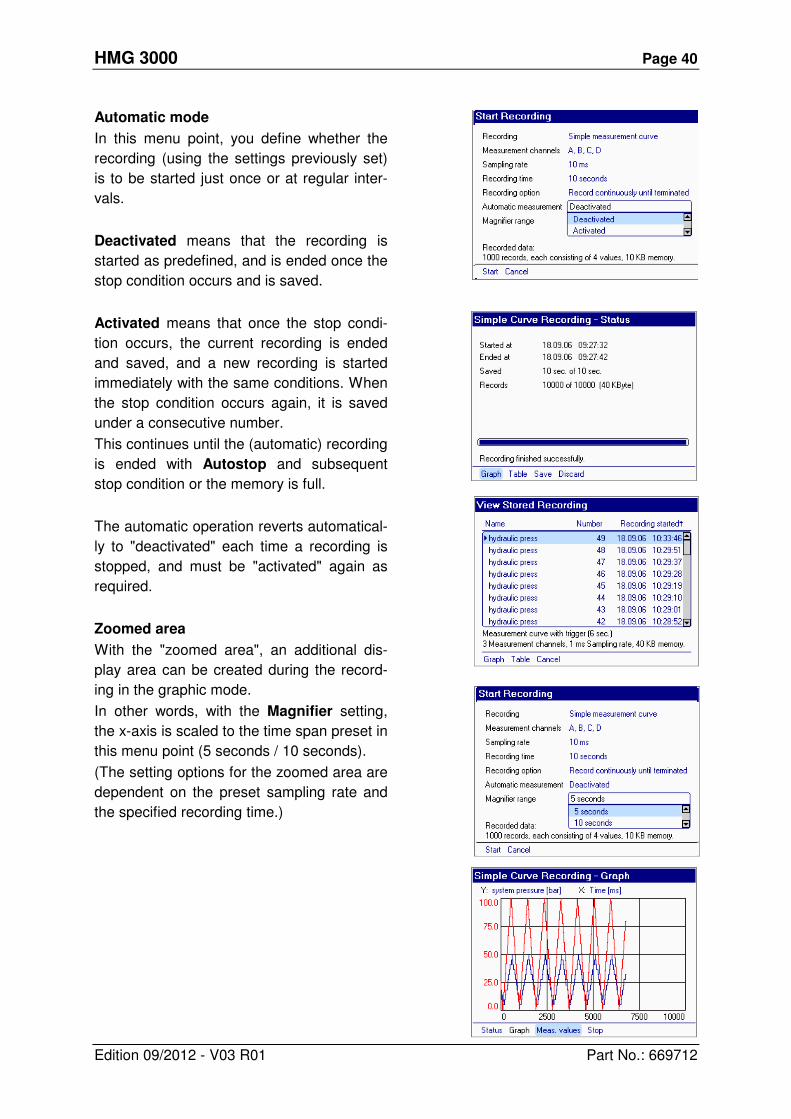
Automatic mode
In this menu point, you define whether the
recording (using the settings previously set)
is to be started just once or at regular inter-
vals.
Deactivated means that the recording is
started as predefined, and is ended once the
stop condition occurs and is saved.
Activated means that once the stop condi-
tion occurs, the current recording is ended
and saved, and a new recording is started
immediately with the same conditions. When
the stop condition occurs again, it is saved
under a consecutive number.
This continues until the (automatic) recording
is ended with Autostop and subsequent
stop condition or the memory is full.
The automatic operation reverts automatical-
ly to "deactivated" each time a recording is
stopped, and must be "activated" again as
required.
Zoomed area
With the "zoomed area", an additional dis-
play area can be created during the record-
ing in the graphic mode.
In other words, with the Magnifier setting,
the x-axis is scaled to the time span preset in
this menu point (5 seconds / 10 seconds).
(The setting options for the zoomed area are
dependent on the preset sampling rate and
the specified recording time.)
HMG 3000 Page 41
Edition 09/2012 - V03 R01 Part No.: 669712
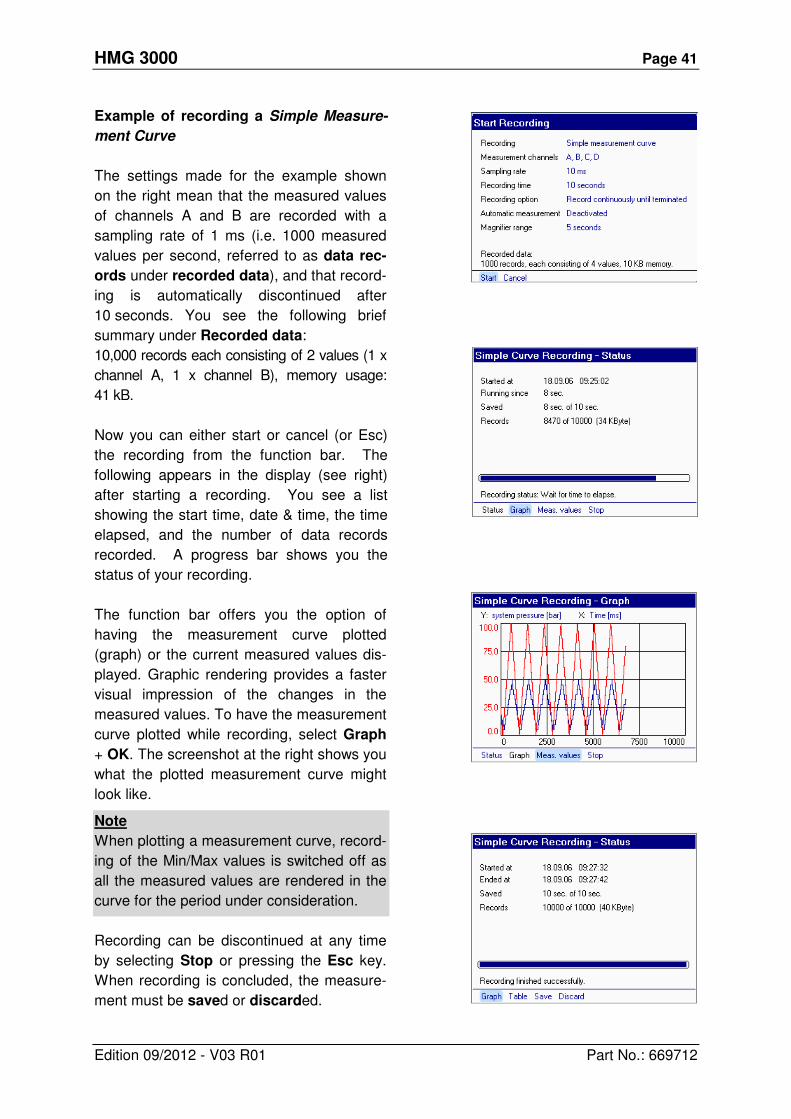
Example of recording a Simple Measure-
ment Curve
The settings made for the example shown
on the right mean that the measured values
of channels A and B are recorded with a
sampling rate of 1 ms (i.e. 1000 measured
values per second, referred to as data rec-
ords under recorded data), and that record-
ing is automatically discontinued after
10 seconds. You see the following brief
summary under Recorded data:
10,000 records each consisting of 2 values (1 x
channel A, 1 x channel B), memory usage:
41 kB.
Now you can either start or cancel (or Esc)
the recording from the function bar. The
following appears in the display (see right)
after starting a recording. You see a list
showing the start time, date & time, the time
elapsed, and the number of data records
recorded. A progress bar shows you the
status of your recording.
The function bar offers you the option of
having the measurement curve plotted
(graph) or the current measured values dis-
played. Graphic rendering provides a faster
visual impression of the changes in the
measured values. To have the measurement
curve plotted while recording, select Graph
+ OK. The screenshot at the right shows you
what the plotted measurement curve might
look like.
Note
When plotting a measurement curve, record-
ing of the Min/Max values is switched off as
all the measured values are rendered in the
curve for the period under consideration.
Recording can be discontinued at any time
by selecting Stop or pressing the Esc key.
When recording is concluded, the measure-
ment must be saved or discarded.
HMG 3000 Page 42
Edition 09/2012 - V03 R01 Part No.: 669712
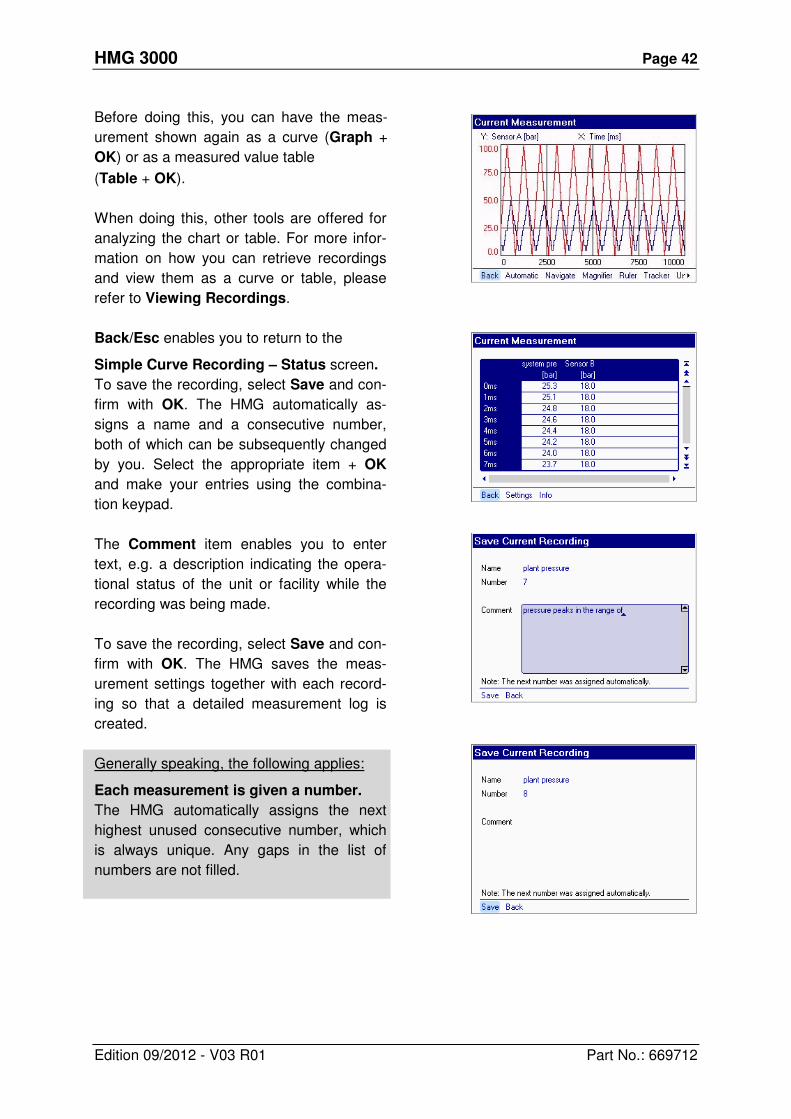
Before doing this, you can have the meas-
urement shown again as a curve (Graph +
OK) or as a measured value table
(Table + OK).
When doing this, other tools are offered for
analyzing the chart or table. For more infor-
mation on how you can retrieve recordings
and view them as a curve or table, please
refer to Viewing Recordings.
Back/Esc enables you to return to the
Simple Curve Recording – Status screen.
To save the recording, select Save and con-
firm with OK. The HMG automatically as-
signs a name and a consecutive number,
both of which can be subsequently changed
by you. Select the appropriate item + OK
and make your entries using the combina-
tion keypad.
The Comment item enables you to enter
text, e.g. a description indicating the opera-
tional status of the unit or facility while the
recording was being made.
To save the recording, select Save and con-
firm with OK. The HMG saves the meas-
urement settings together with each record-
ing so that a detailed measurement log is
created.
Generally speaking, the following applies:
Each measurement is given a number.
The HMG automatically assigns the next
highest unused consecutive number, which
is always unique. Any gaps in the list of
numbers are not filled.
HMG 3000 Page 43
Edition 09/2012 - V03 R01 Part No.: 669712
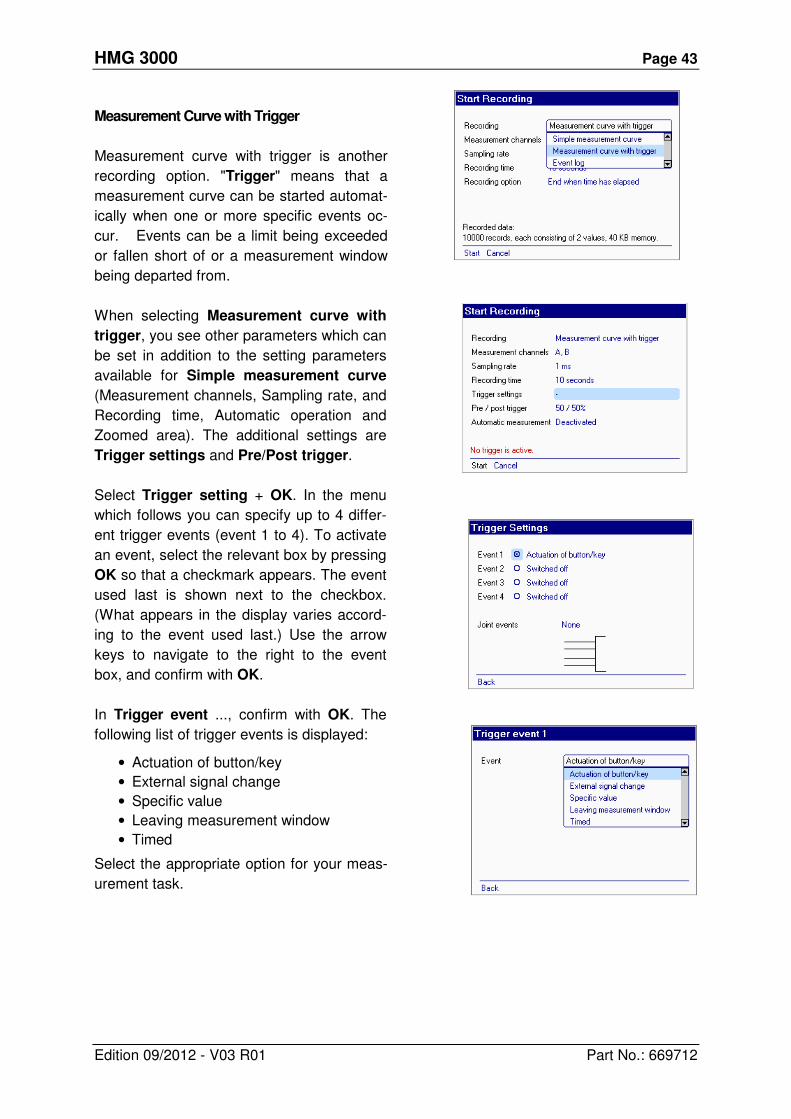
Measurement Curve with Trigger
Measurement curve with trigger is another
recording option. "Trigger" means that a
measurement curve can be started automat-
ically when one or more specific events oc-
cur. Events can be a limit being exceeded
or fallen short of or a measurement window
being departed from.
When selecting Measurement curve with
trigger, you see other parameters which can
be set in addition to the setting parameters
available for Simple measurement curve
(Measurement channels, Sampling rate, and
Recording time, Automatic operation and
Zoomed area). The additional settings are
Trigger settings and Pre/Post trigger.
Select Trigger setting + OK. In the menu
which follows you can specify up to 4 differ-
ent trigger events (event 1 to 4). To activate
an event, select the relevant box by pressing
OK so that a checkmark appears. The event
used last is shown next to the checkbox.
(What appears in the display varies accord-
ing to the event used last.) Use the arrow
keys to navigate to the right to the event
box, and confirm with OK.
In Trigger event ..., confirm with OK. The
following list of trigger events is displayed:
• Actuation of button/key
• External signal change
• Specific value
• Leaving measurement window
• Timed
Select the appropriate option for your meas-
urement task.
HMG 3000 Page 44
Edition 09/2012 - V03 R01 Part No.: 669712
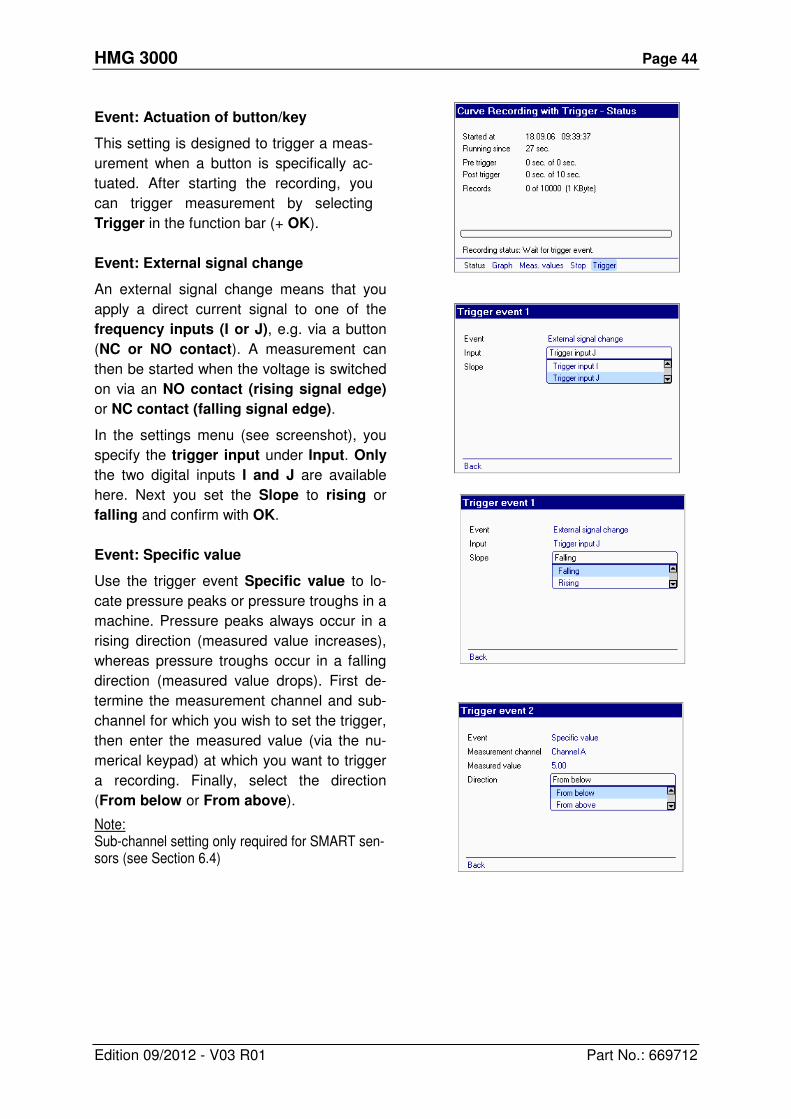
Event: Actuation of button/key
This setting is designed to trigger a meas-
urement when a button is specifically ac-
tuated. After starting the recording, you
can trigger measurement by selecting
Trigger in the function bar (+ OK).
Event: External signal change
An external signal change means that you
apply a direct current signal to one of the
frequency inputs (I or J), e.g. via a button
(NC or NO contact). A measurement can
then be started when the voltage is switched
on via an NO contact (rising signal edge)
or NC contact (falling signal edge).
In the settings menu (see screenshot), you
specify the trigger input under Input. Only
the two digital inputs I and J are available
here. Next you set the Slope to rising or
falling and confirm with OK.
Event: Specific value
Use the trigger event Specific value to lo-
cate pressure peaks or pressure troughs in a
machine. Pressure peaks always occur in a
rising direction (measured value increases),
whereas pressure troughs occur in a falling
direction (measured value drops). First de-
termine the measurement channel and sub-
channel for which you wish to set the trigger,
then enter the measured value (via the nu-
merical keypad) at which you want to trigger
a recording. Finally, select the direction
(From below or From above).
Note: Sub-channel setting only required for SMART sen-sors (see Section 6.4)
HMG 3000 Page 45
Edition 09/2012 - V03 R01 Part No.: 669712
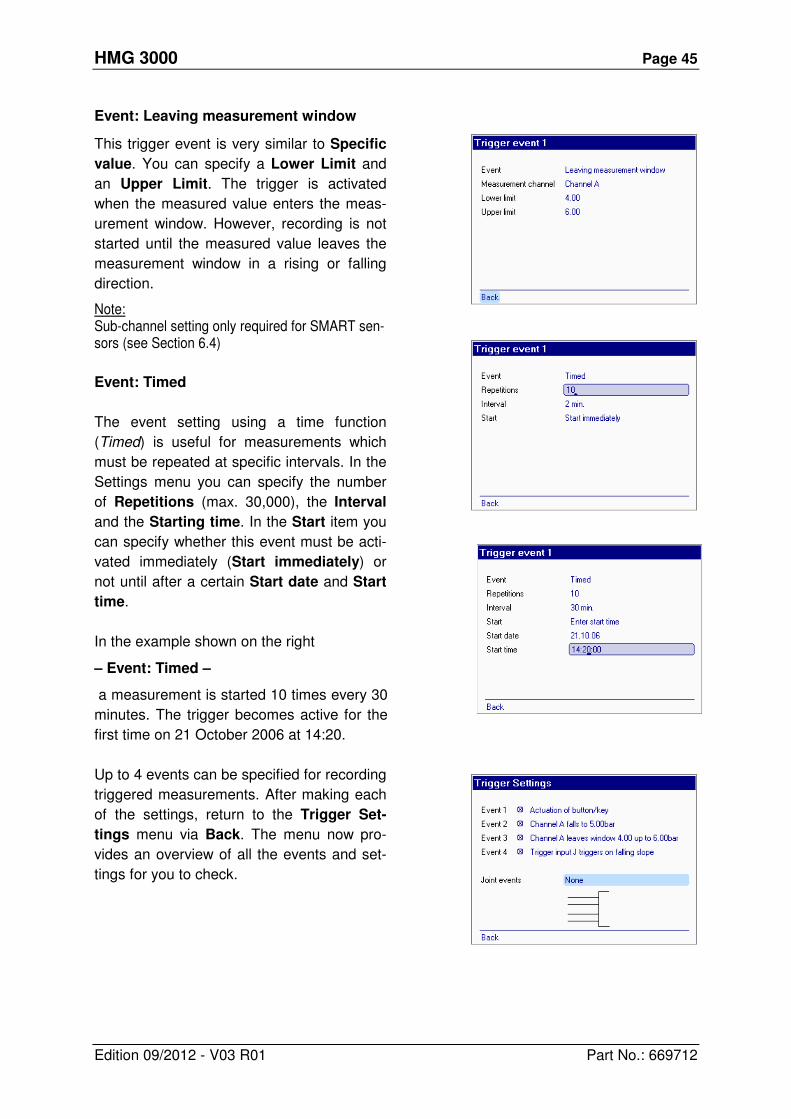
Event: Leaving measurement window
This trigger event is very similar to Specific
value. You can specify a Lower Limit and
an Upper Limit. The trigger is activated
when the measured value enters the meas-
urement window. However, recording is not
started until the measured value leaves the
measurement window in a rising or falling
direction.
Note: Sub-channel setting only required for SMART sen-sors (see Section 6.4)
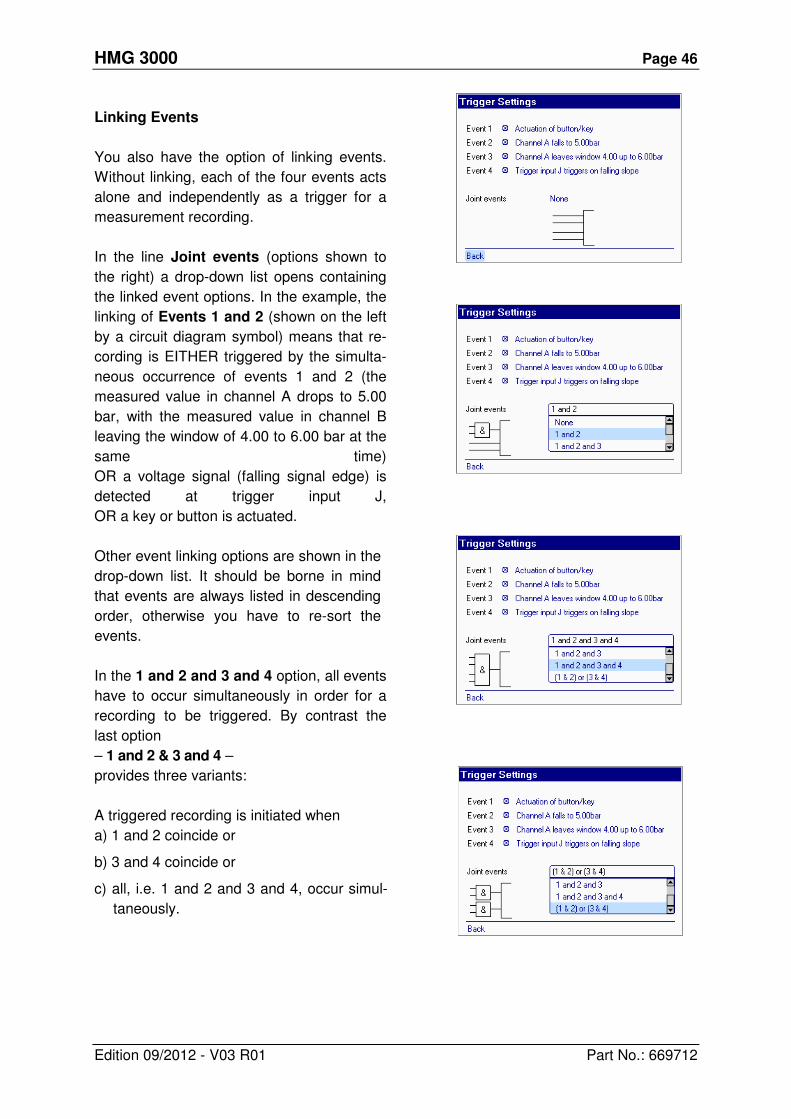
Event: Timed
The event setting using a time function
(Timed) is useful for measurements which
must be repeated at specific intervals. In the
Settings menu you can specify the number
of Repetitions (max. 30,000), the Interval
and the Starting time. In the Start item you
can specify whether this event must be acti-
vated immediately (Start immediately) or
not until after a certain Start date and Start
time.
In the example shown on the right
– Event: Timed –
a measurement is started 10 times every 30
minutes. The trigger becomes active for the
first time on 21 October 2006 at 14:20.
Up to 4 events can be specified for recording
triggered measurements. After making each
of the settings, return to the Trigger Set-
tings menu via Back. The menu now pro-
vides an overview of all the events and set-
tings for you to check.
HMG 3000 Page 46
Edition 09/2012 - V03 R01 Part No.: 669712
Linking Events
You also have the option of linking events.
Without linking, each of the four events acts
alone and independently as a trigger for a
measurement recording.
In the line Joint events (options shown to
the right) a drop-down list opens containing
the linked event options. In the example, the
linking of Events 1 and 2 (shown on the left
by a circuit diagram symbol) means that re-
cording is EITHER triggered by the simulta-
neous occurrence of events 1 and 2 (the
measured value in channel A drops to 5.00
bar, with the measured value in channel B
leaving the window of 4.00 to 6.00 bar at the
same time)
OR a voltage signal (falling signal edge) is
detected at trigger input J,
OR a key or button is actuated.
Other event linking options are shown in the
drop-down list. It should be borne in mind
that events are always listed in descending
order, otherwise you have to re-sort the
events.
In the 1 and 2 and 3 and 4 option, all events
have to occur simultaneously in order for a
recording to be triggered. By contrast the
last option
– 1 and 2 & 3 and 4 –
provides three variants:
A triggered recording is initiated when
a) 1 and 2 coincide or
b) 3 and 4 coincide or
c) all, i.e. 1 and 2 and 3 and 4, occur simul-
taneously.
HMG 3000 Page 47
Edition 09/2012 - V03 R01 Part No.: 669712
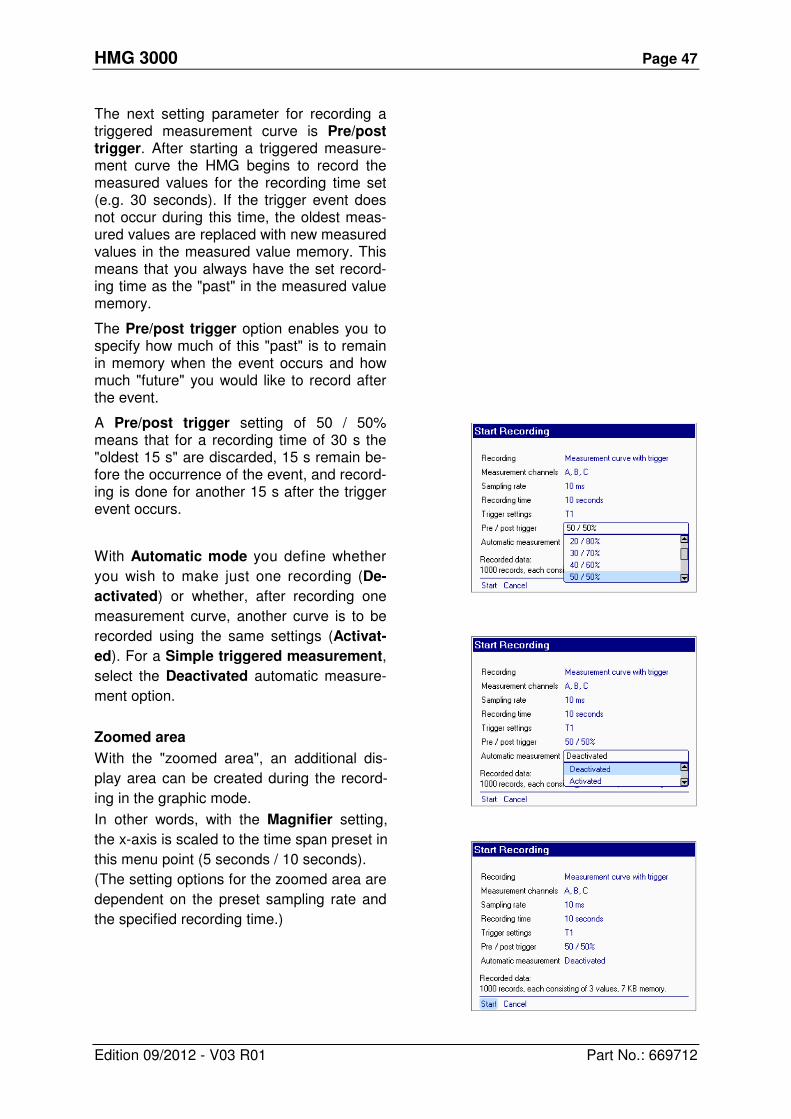
The next setting parameter for recording a triggered measurement curve is Pre/post trigger. After starting a triggered measure-ment curve the HMG begins to record the measured values for the recording time set (e.g. 30 seconds). If the trigger event does not occur during this time, the oldest meas-ured values are replaced with new measured values in the measured value memory. This means that you always have the set record-ing time as the "past" in the measured value memory.
The Pre/post trigger option enables you to specify how much of this "past" is to remain in memory when the event occurs and how much "future" you would like to record after the event.
A Pre/post trigger setting of 50 / 50% means that for a recording time of 30 s the "oldest 15 s" are discarded, 15 s remain be-fore the occurrence of the event, and record-ing is done for another 15 s after the trigger event occurs.
With Automatic mode you define whether
you wish to make just one recording (De-
activated) or whether, after recording one
measurement curve, another curve is to be
recorded using the same settings (Activat-
ed). For a Simple triggered measurement,
select the Deactivated automatic measure-
ment option.
Zoomed area
With the "zoomed area", an additional dis-
play area can be created during the record-
ing in the graphic mode.
In other words, with the Magnifier setting,
the x-axis is scaled to the time span preset in
this menu point (5 seconds / 10 seconds).
(The setting options for the zoomed area are
dependent on the preset sampling rate and
the specified recording time.)

HMG 3000 Page 48
Edition 09/2012 - V03 R01 Part No.: 669712
Example of an Automatically Triggered
Measurement
The following occur in a hydraulic press from
time to time: defective components, ruptured
hoses or cracked cylinders. You suspect
there may be extremely high pressure peak-
ing in three hydraulic circuits and want to
monitor the press for pressure surges for an
extended period of time.
To do this, you make the following settings:
• Recording: Measurement curve
with trigger
• Channels: A, B, C
• Sampling rate: 1 ms
• Recording time: 30 seconds
Trigger settings:
• Event 1: channel A increases to 180
bar
• Event 2: channel B increases to 230
bar
• Event 3: channel C increases to 280
bar
(Each of these pressures is 50 bar higher
than is normally allowed.)
• Pre/post trigger: 80 / 20%
(You select this option because you are
interested in knowing what happened in
the other pressure circuits before the trig-
ger was actuated and you want to record
the pressure curve somewhat longer after
the trigger event.)
• Automatic measurement: Activated
When actuating Start (+ OK) in the function
bar, in the next screen you are prompted
for a name and number for the measure-
ment. The measurement is then stored un-
der this name with a consecutive number
after every trigger event. You also have the
option of entering a comment, e.g. the op-
erating condition of the machine.
HMG 3000 Page 49
Edition 09/2012 - V03 R01 Part No.: 669712
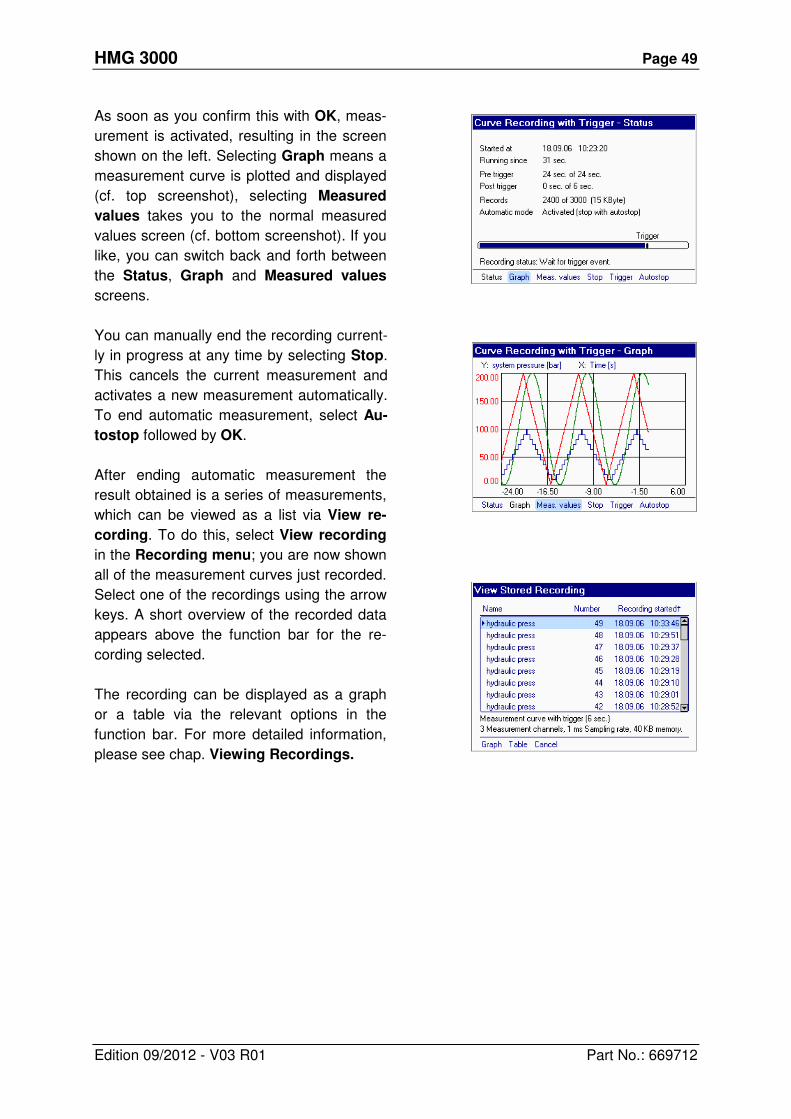
As soon as you confirm this with OK, meas-
urement is activated, resulting in the screen
shown on the left. Selecting Graph means a
measurement curve is plotted and displayed
(cf. top screenshot), selecting Measured
values takes you to the normal measured
values screen (cf. bottom screenshot). If you
like, you can switch back and forth between
the Status, Graph and Measured values
screens.
You can manually end the recording current-
ly in progress at any time by selecting Stop.
This cancels the current measurement and
activates a new measurement automatically.
To end automatic measurement, select Au-
tostop followed by OK.
After ending automatic measurement the
result obtained is a series of measurements,
which can be viewed as a list via View re-
cording. To do this, select View recording
in the Recording menu; you are now shown
all of the measurement curves just recorded.
Select one of the recordings using the arrow
keys. A short overview of the recorded data
appears above the function bar for the re-
cording selected.
The recording can be displayed as a graph
or a table via the relevant options in the
function bar. For more detailed information,
please see chap. Viewing Recordings.
HMG 3000 Page 50
Edition 09/2012 - V03 R01 Part No.: 669712
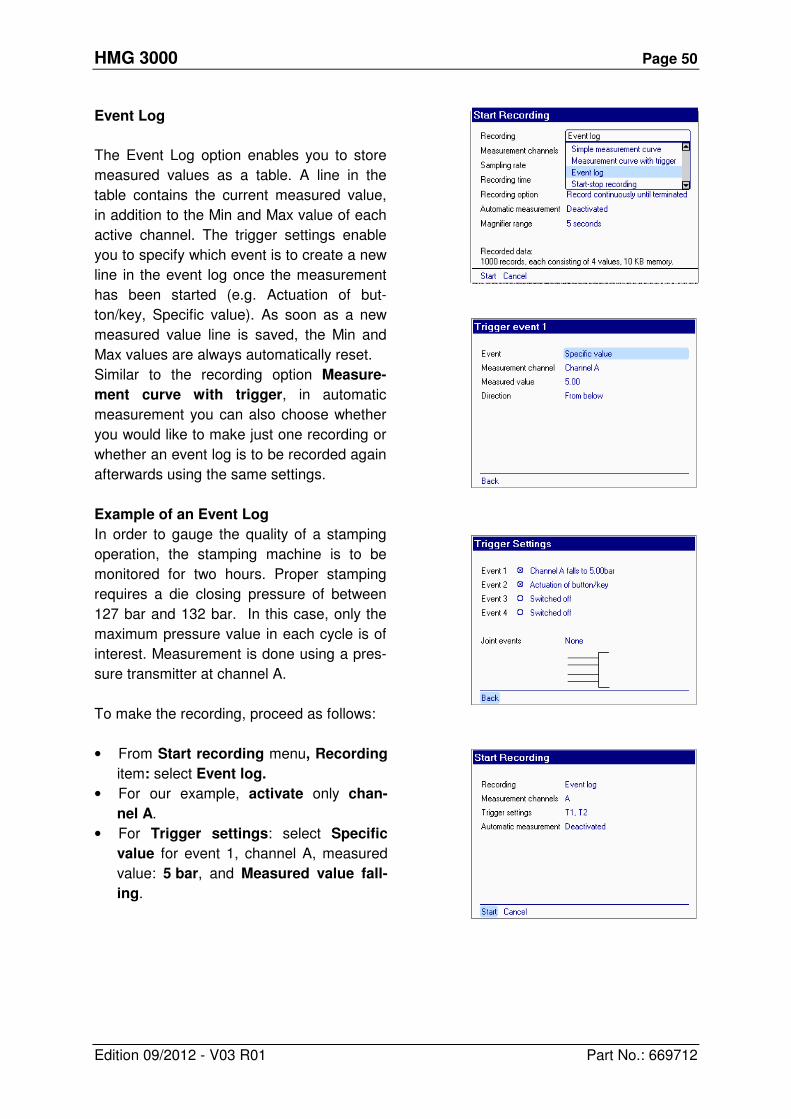
Event Log
The Event Log option enables you to store
measured values as a table. A line in the
table contains the current measured value,
in addition to the Min and Max value of each
active channel. The trigger settings enable
you to specify which event is to create a new
line in the event log once the measurement
has been started (e.g. Actuation of but-
ton/key, Specific value). As soon as a new
measured value line is saved, the Min and
Max values are always automatically reset.
Similar to the recording option Measure-
ment curve with trigger, in automatic
measurement you can also choose whether
you would like to make just one recording or
whether an event log is to be recorded again
afterwards using the same settings.
Example of an Event Log
In order to gauge the quality of a stamping
operation, the stamping machine is to be
monitored for two hours. Proper stamping
requires a die closing pressure of between
127 bar and 132 bar. In this case, only the
maximum pressure value in each cycle is of
interest. Measurement is done using a pres-
sure transmitter at channel A.
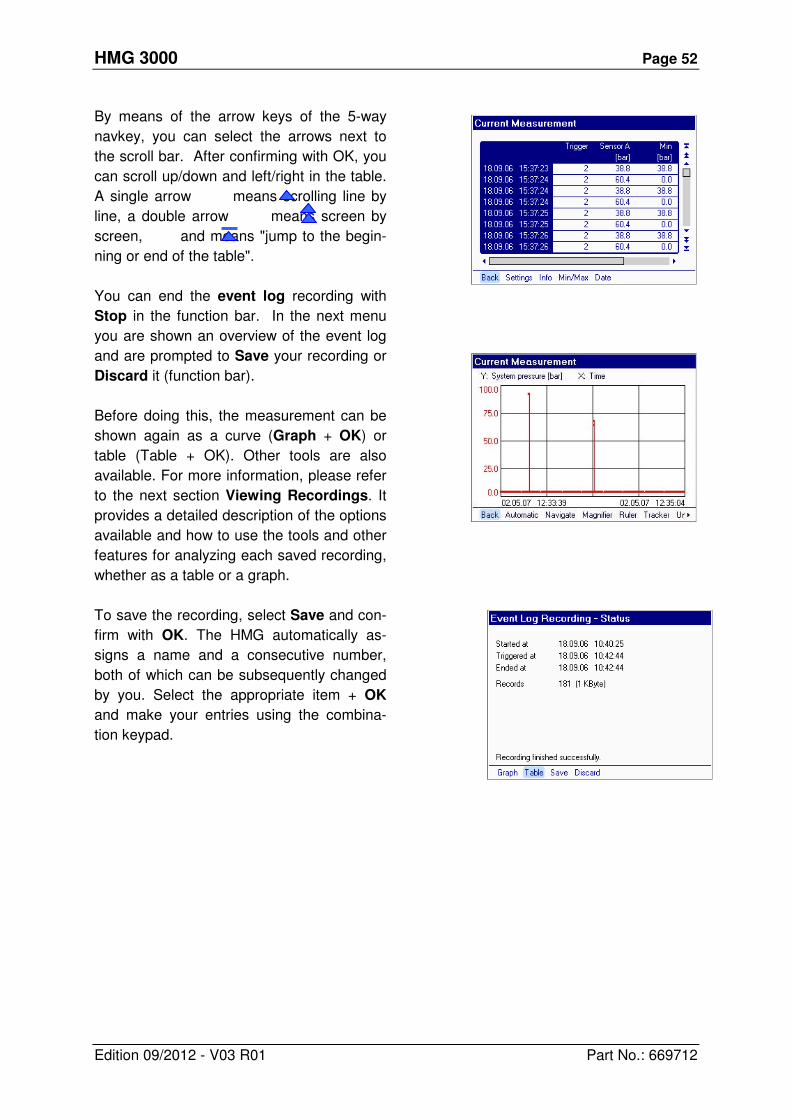
To make the recording, proceed as follows:
• From Start recording menu, Recording
item: select Event log.
• For our example, activate only chan-
nel A.
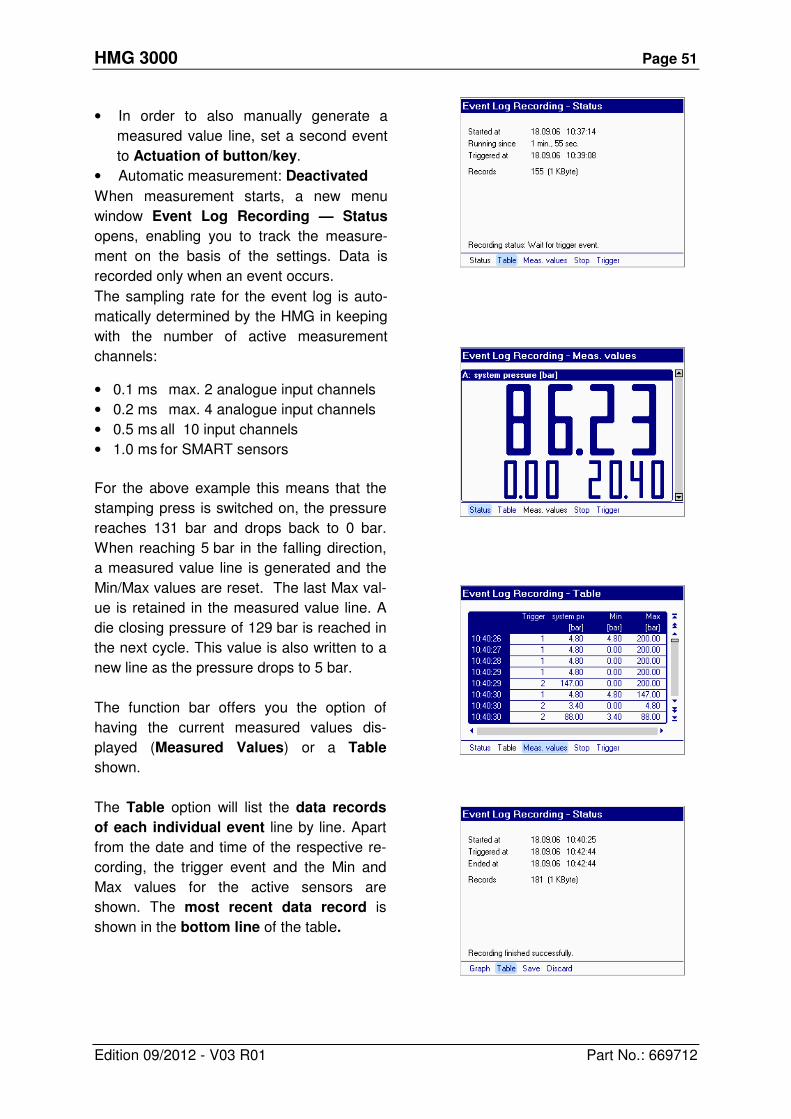
• For Trigger settings: select Specific
value for event 1, channel A, measured
value: 5 bar, and Measured value fall-
ing.
HMG 3000 Page 51
Edition 09/2012 - V03 R01 Part No.: 669712
• In order to also manually generate a
measured value line, set a second event
to Actuation of button/key.
• Automatic measurement: Deactivated
When measurement starts, a new menu
window Event Log Recording — Status
opens, enabling you to track the measure-
ment on the basis of the settings. Data is
recorded only when an event occurs.
The sampling rate for the event log is auto-
matically determined by the HMG in keeping
with the number of active measurement
channels:
• 0.1 ms max. 2 analogue input channels
• 0.2 ms max. 4 analogue input channels
• 0.5 ms all 10 input channels
• 1.0 ms for SMART sensors
For the above example this means that the
stamping press is switched on, the pressure
reaches 131 bar and drops back to 0 bar.
When reaching 5 bar in the falling direction,
a measured value line is generated and the
Min/Max values are reset. The last Max val-
ue is retained in the measured value line. A
die closing pressure of 129 bar is reached in
the next cycle. This value is also written to a
new line as the pressure drops to 5 bar.
The function bar offers you the option of
having the current measured values dis-
played (Measured Values) or a Table
shown.
The Table option will list the data records
of each individual event line by line. Apart
from the date and time of the respective re-
cording, the trigger event and the Min and
Max values for the active sensors are
shown. The most recent data record is
shown in the bottom line of the table.
HMG 3000 Page 52
Edition 09/2012 - V03 R01 Part No.: 669712
By means of the arrow keys of the 5-way
navkey, you can select the arrows next to
the scroll bar. After confirming with OK, you
can scroll up/down and left/right in the table.
A single arrow means scrolling line by
line, a double arrow means screen by
screen, and means "jump to the begin-
ning or end of the table".
You can end the event log recording with
Stop in the function bar. In the next menu
you are shown an overview of the event log
and are prompted to Save your recording or
Discard it (function bar).
Before doing this, the measurement can be
shown again as a curve (Graph + OK) or
table (Table + OK). Other tools are also
available. For more information, please refer
to the next section Viewing Recordings. It
provides a detailed description of the options
available and how to use the tools and other
features for analyzing each saved recording,
whether as a table or a graph.
To save the recording, select Save and con-
firm with OK. The HMG automatically as-
signs a name and a consecutive number,
both of which can be subsequently changed
by you. Select the appropriate item + OK
and make your entries using the combina-
tion keypad.
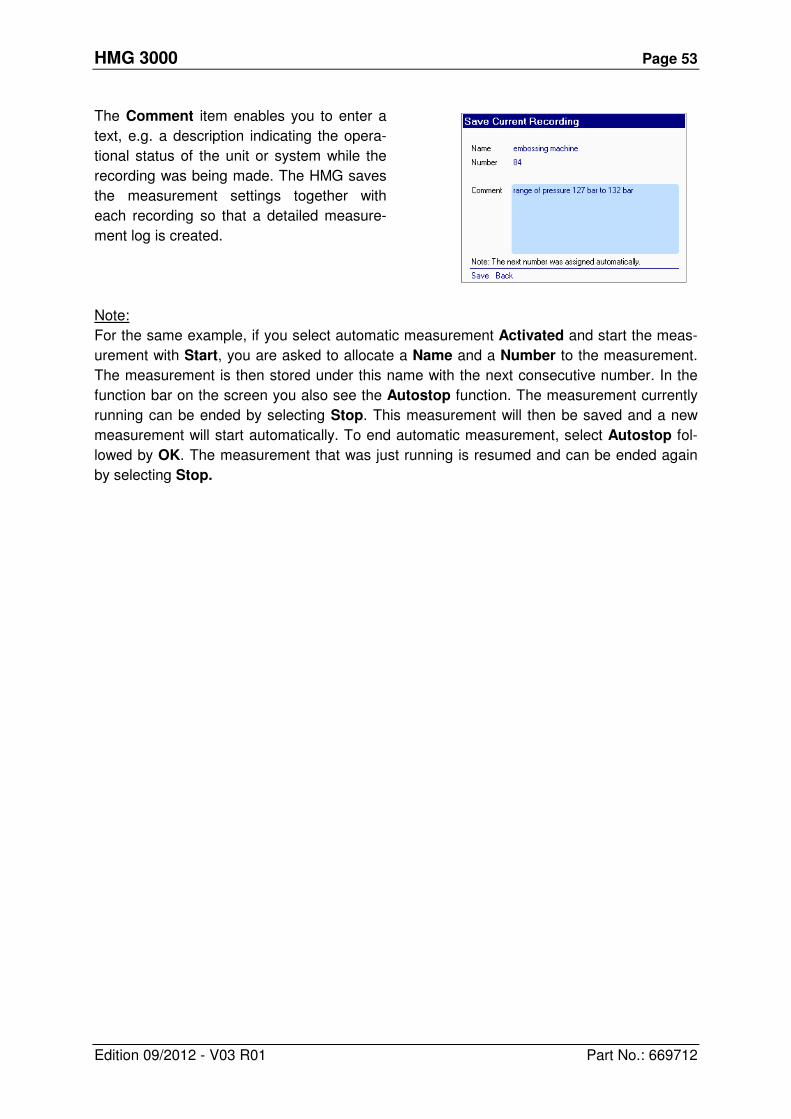
HMG 3000 Page 53
Edition 09/2012 - V03 R01 Part No.: 669712
The Comment item enables you to enter a
text, e.g. a description indicating the opera-
tional status of the unit or system while the
recording was being made. The HMG saves
the measurement settings together with
each recording so that a detailed measure-
ment log is created.
Note:
For the same example, if you select automatic measurement Activated and start the meas-
urement with Start, you are asked to allocate a Name and a Number to the measurement.
The measurement is then stored under this name with the next consecutive number. In the
function bar on the screen you also see the Autostop function. The measurement currently
running can be ended by selecting Stop. This measurement will then be saved and a new
measurement will start automatically. To end automatic measurement, select Autostop fol-
lowed by OK. The measurement that was just running is resumed and can be ended again
by selecting Stop.

HMG 3000 Page 54
Edition 09/2012 - V03 R01 Part No.: 669712
Start-Stop Measurement
The Start-Stop Measurement option allows
you to start a recording when triggered by a
defined condition and to stop it again when
triggered by a second defined condition.
If the stop condition does not occur within
the pre-set recording time, then the record-
ing will stop after the specified time has
elapsed.
Example of a Start-Stop Measurement:
Under Trigger 1 (Start) and Trigger 2
(Stop) select the relevant start and stop
condition and confirm with OK.
Under Recording time, define the time at
which the measurement must stop automati-
cally if the Trigger-Condition 2 (Stop) has not
occurred by then.
With Automatic mode you define whether
you wish to make just one measurement
(Deactivated) or whether, after recording
one measurement curve, another curve is to
be recorded using the same settings (Acti-
vated).
Zoomed area
With the "zoomed area", an additional dis-
play area can be created during the record-
ing in the graphic mode.
In other words, with the Magnifier setting,
the x-axis is scaled to the time span preset in
this menu point (5 seconds / 10 seconds /
...).
(The setting options for the zoomed area are
dependent on the preset sampling rate and
the specified recording time.)
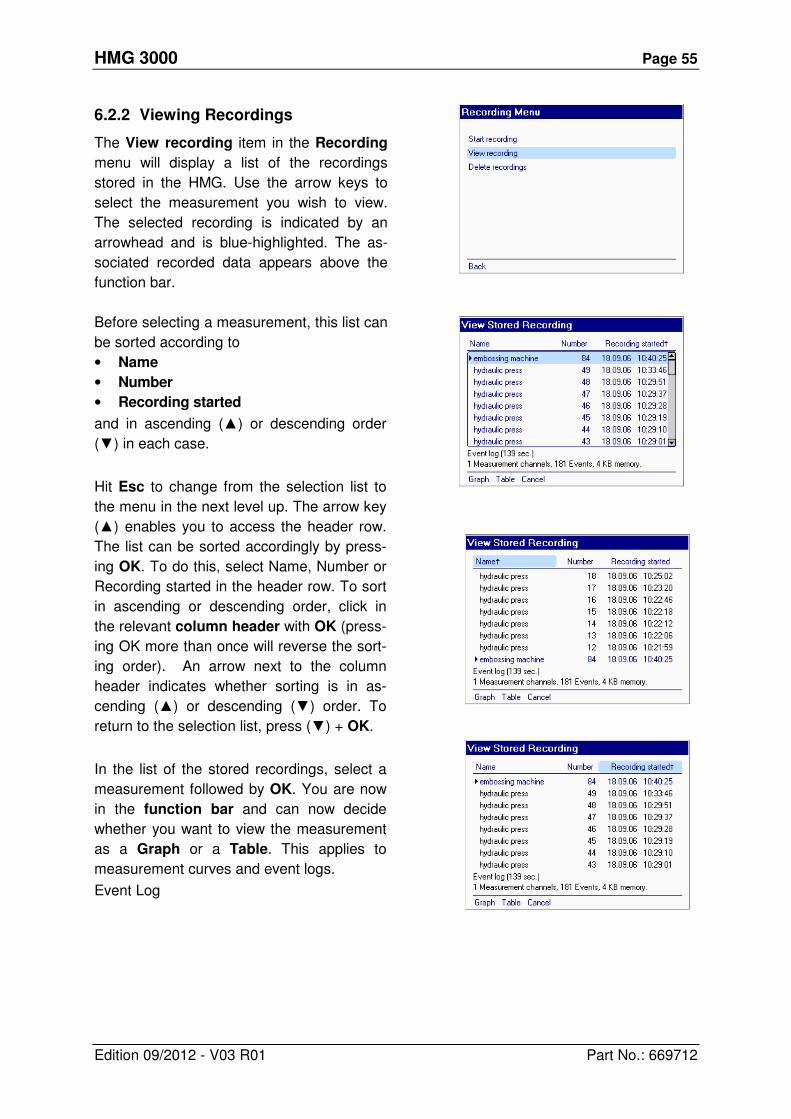
HMG 3000 Page 55
Edition 09/2012 - V03 R01 Part No.: 669712
6.2.2 Viewing Recordings
The View recording item in the Recording
menu will display a list of the recordings
stored in the HMG. Use the arrow keys to
select the measurement you wish to view.
The selected recording is indicated by an
arrowhead and is blue-highlighted. The as-
sociated recorded data appears above the
function bar.
Before selecting a measurement, this list can
be sorted according to
• Name
• Number
• Recording started
and in ascending (▲) or descending order
(▼) in each case.
Hit Esc to change from the selection list to
the menu in the next level up. The arrow key
(▲) enables you to access the header row.
The list can be sorted accordingly by press-
ing OK. To do this, select Name, Number or
Recording started in the header row. To sort
in ascending or descending order, click in
the relevant column header with OK (press-
ing OK more than once will reverse the sort-
ing order). An arrow next to the column
header indicates whether sorting is in as-
cending (▲) or descending (▼) order. To
return to the selection list, press (▼) + OK.
In the list of the stored recordings, select a
measurement followed by OK. You are now
in the function bar and can now decide
whether you want to view the measurement
as a Graph or a Table. This applies to
measurement curves and event logs.
Event Log
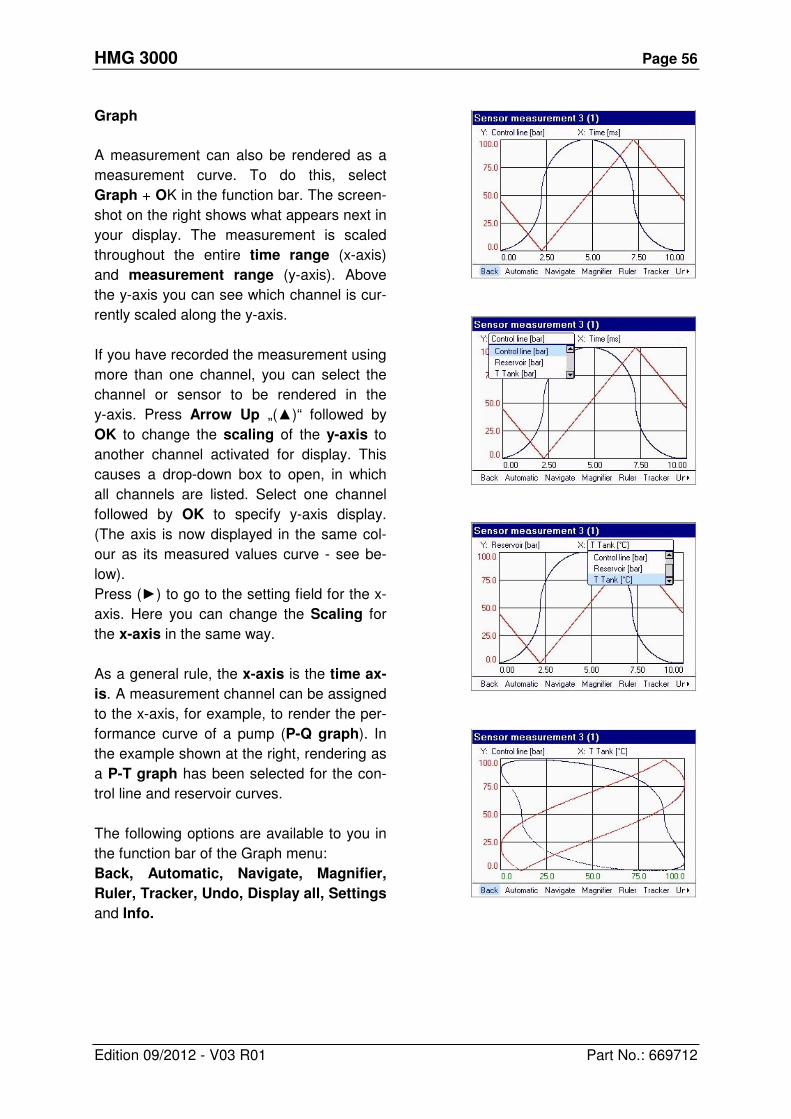
HMG 3000 Page 56
Edition 09/2012 - V03 R01 Part No.: 669712
Graph
A measurement can also be rendered as a
measurement curve. To do this, select
Graph + OK in the function bar. The screen-
shot on the right shows what appears next in
your display. The measurement is scaled
throughout the entire time range (x-axis)
and measurement range (y-axis). Above
the y-axis you can see which channel is cur-
rently scaled along the y-axis.
If you have recorded the measurement using
more than one channel, you can select the
channel or sensor to be rendered in the
y-axis. Press Arrow Up „(▲)“ followed by
OK to change the scaling of the y-axis to
another channel activated for display. This
causes a drop-down box to open, in which
all channels are listed. Select one channel
followed by OK to specify y-axis display.
(The axis is now displayed in the same col-
our as its measured values curve - see be-
low).
Press (►) to go to the setting field for the x-
axis. Here you can change the Scaling for
the x-axis in the same way.
As a general rule, the x-axis is the time ax-
is. A measurement channel can be assigned
to the x-axis, for example, to render the per-
formance curve of a pump (P-Q graph). In
the example shown at the right, rendering as
a P-T graph has been selected for the con-
trol line and reservoir curves.
The following options are available to you in
the function bar of the Graph menu:
Back, Automatic, Navigate, Magnifier,
Ruler, Tracker, Undo, Display all, Settings
and Info.
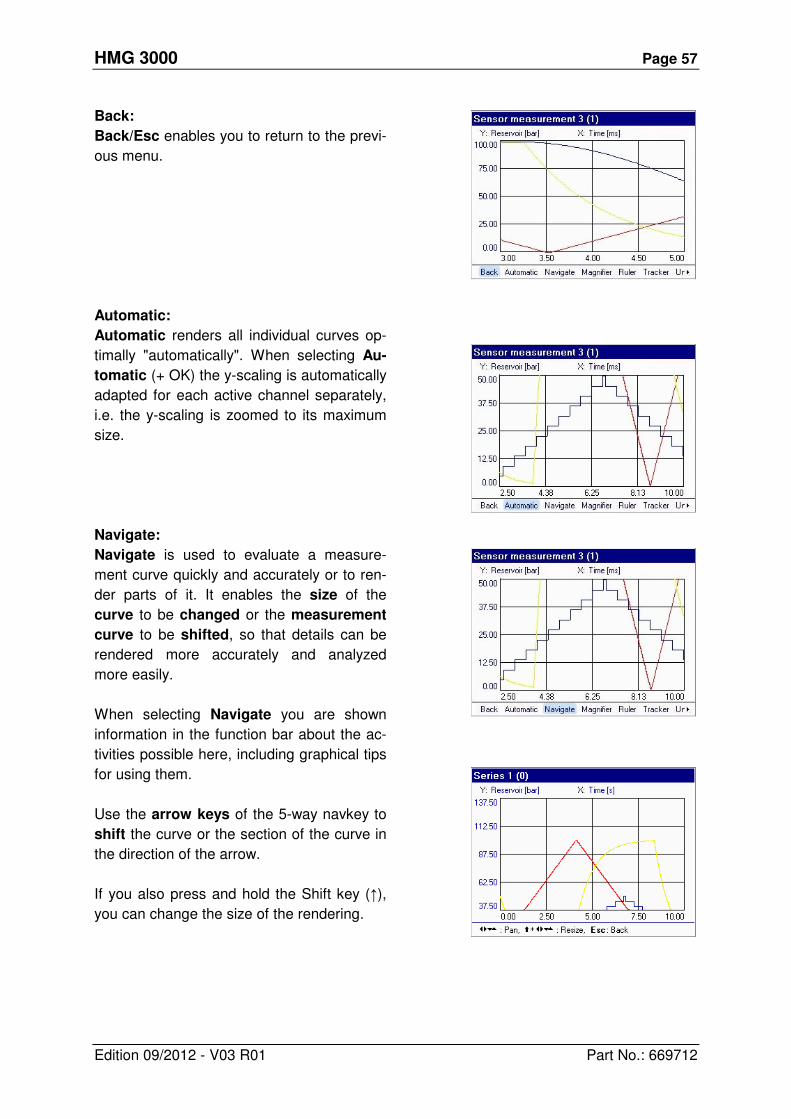
HMG 3000 Page 57
Edition 09/2012 - V03 R01 Part No.: 669712
Back:
Back/Esc enables you to return to the previ-
ous menu.
Automatic:
Automatic renders all individual curves op-
timally "automatically". When selecting Au-
tomatic (+ OK) the y-scaling is automatically
adapted for each active channel separately,
i.e. the y-scaling is zoomed to its maximum
size.
Navigate:
Navigate is used to evaluate a measure-
ment curve quickly and accurately or to ren-
der parts of it. It enables the size of the
curve to be changed or the measurement
curve to be shifted, so that details can be
rendered more accurately and analyzed
more easily.
When selecting Navigate you are shown
information in the function bar about the ac-
tivities possible here, including graphical tips
for using them.
Use the arrow keys of the 5-way navkey to
shift the curve or the section of the curve in
the direction of the arrow.
If you also press and hold the Shift key (↑),
you can change the size of the rendering.
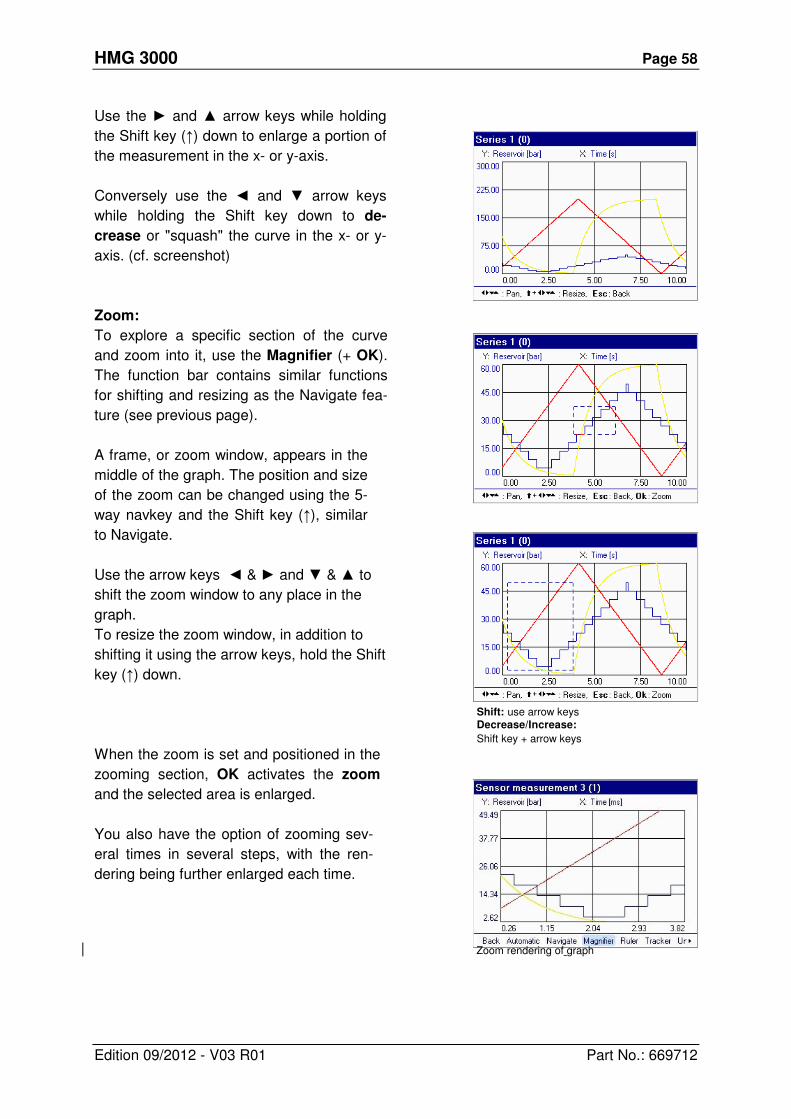
HMG 3000 Page 58
Edition 09/2012 - V03 R01 Part No.: 669712
Use the ► and ▲ arrow keys while holding
the Shift key (↑) down to enlarge a portion of
the measurement in the x- or y-axis.
Conversely use the ◄ and ▼ arrow keys
while holding the Shift key down to de-
crease or "squash" the curve in the x- or y-
axis. (cf. screenshot)
Zoom:
To explore a specific section of the curve
and zoom into it, use the Magnifier (+ OK).
The function bar contains similar functions
for shifting and resizing as the Navigate fea-
ture (see previous page).
A frame, or zoom window, appears in the
middle of the graph. The position and size
of the zoom can be changed using the 5-
way navkey and the Shift key (↑), similar
to Navigate.
Use the arrow keys ◄ & ► and ▼ & ▲ to
shift the zoom window to any place in the
graph.
To resize the zoom window, in addition to
shifting it using the arrow keys, hold the Shift
key (↑) down.
When the zoom is set and positioned in the
zooming section, OK activates the zoom
and the selected area is enlarged.
You also have the option of zooming sev-
eral times in several steps, with the ren-
dering being further enlarged each time.
Shift: use arrow keys Decrease/Increase:
Shift key + arrow keys
Zoom rendering of graph
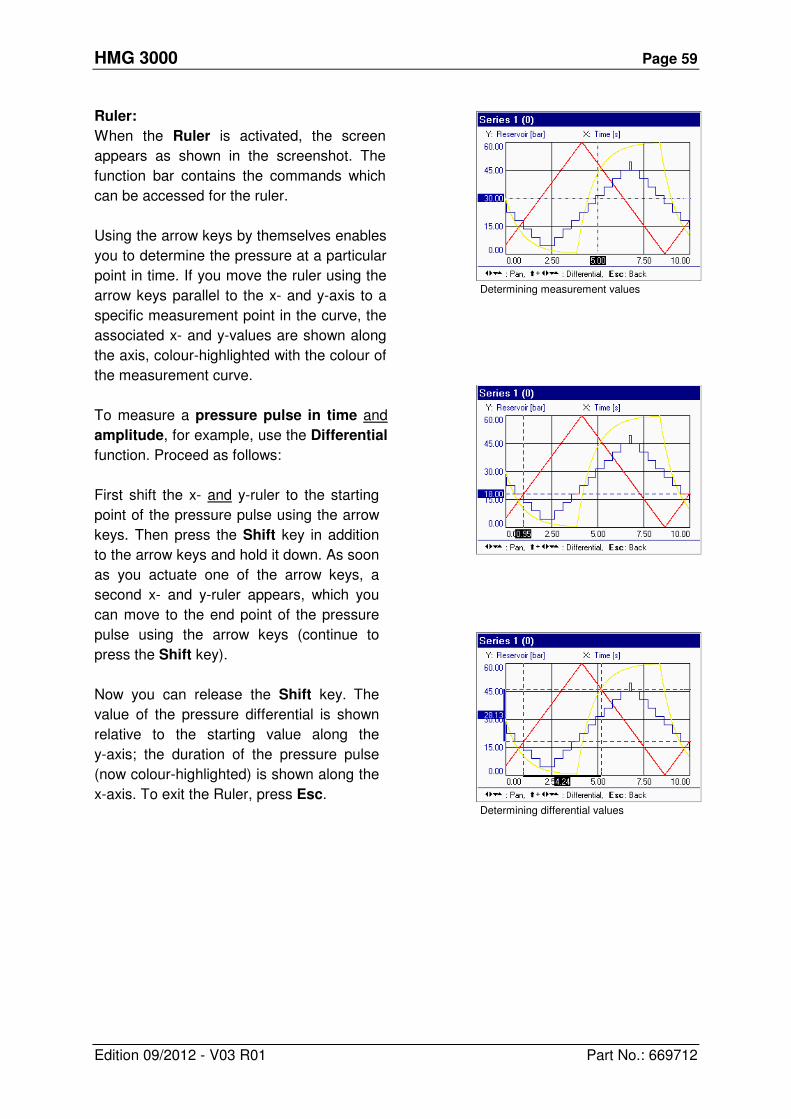
HMG 3000 Page 59
Edition 09/2012 - V03 R01 Part No.: 669712
Ruler:
When the Ruler is activated, the screen
appears as shown in the screenshot. The
function bar contains the commands which
can be accessed for the ruler.
Using the arrow keys by themselves enables
you to determine the pressure at a particular
point in time. If you move the ruler using the
arrow keys parallel to the x- and y-axis to a
specific measurement point in the curve, the
associated x- and y-values are shown along
the axis, colour-highlighted with the colour of
the measurement curve.
To measure a pressure pulse in time and
amplitude, for example, use the Differential
function. Proceed as follows:
First shift the x- and y-ruler to the starting
point of the pressure pulse using the arrow
keys. Then press the Shift key in addition
to the arrow keys and hold it down. As soon
as you actuate one of the arrow keys, a
second x- and y-ruler appears, which you
can move to the end point of the pressure
pulse using the arrow keys (continue to
press the Shift key).
Now you can release the Shift key. The
value of the pressure differential is shown
relative to the starting value along the
y-axis; the duration of the pressure pulse
(now colour-highlighted) is shown along the
x-axis. To exit the Ruler, press Esc.
Determining measurement values
Determining differential values
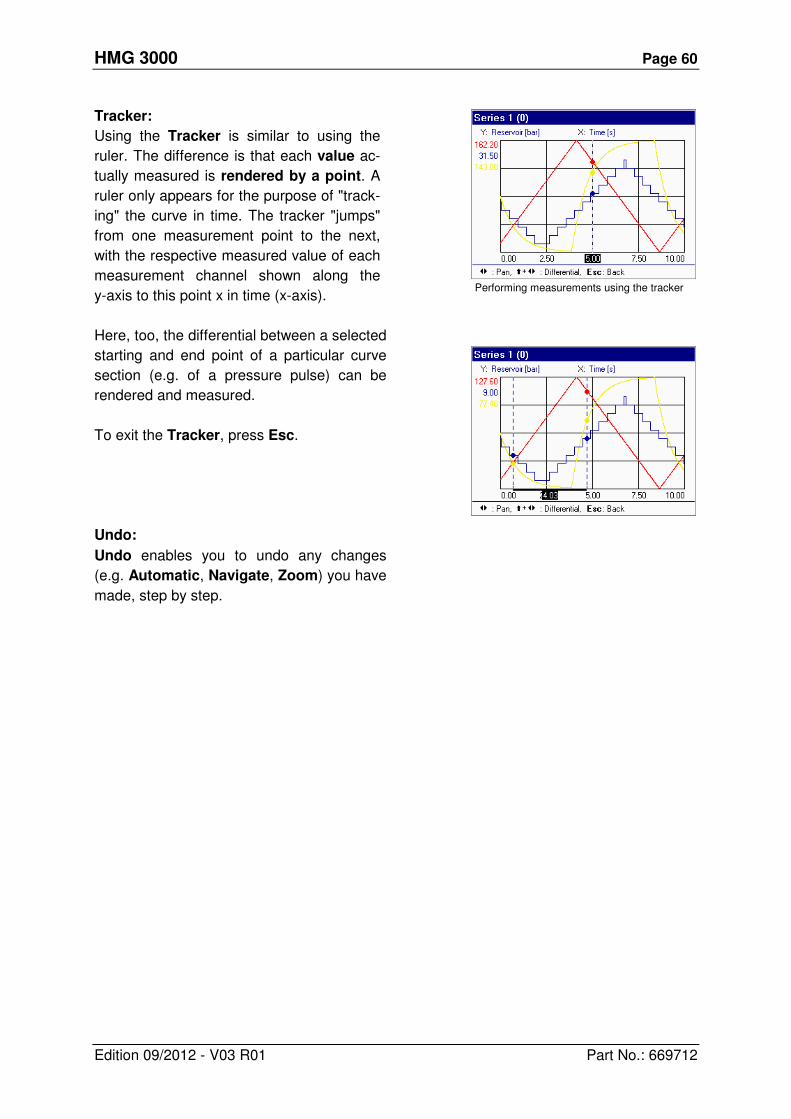
HMG 3000 Page 60
Edition 09/2012 - V03 R01 Part No.: 669712
Tracker:
Using the Tracker is similar to using the
ruler. The difference is that each value ac-
tually measured is rendered by a point. A
ruler only appears for the purpose of "track-
ing" the curve in time. The tracker "jumps"
from one measurement point to the next,
with the respective measured value of each
measurement channel shown along the
y-axis to this point x in time (x-axis).
Here, too, the differential between a selected
starting and end point of a particular curve
section (e.g. of a pressure pulse) can be
rendered and measured.
To exit the Tracker, press Esc.
Undo:
Undo enables you to undo any changes
(e.g. Automatic, Navigate, Zoom) you have
made, step by step.
Performing measurements using the tracker
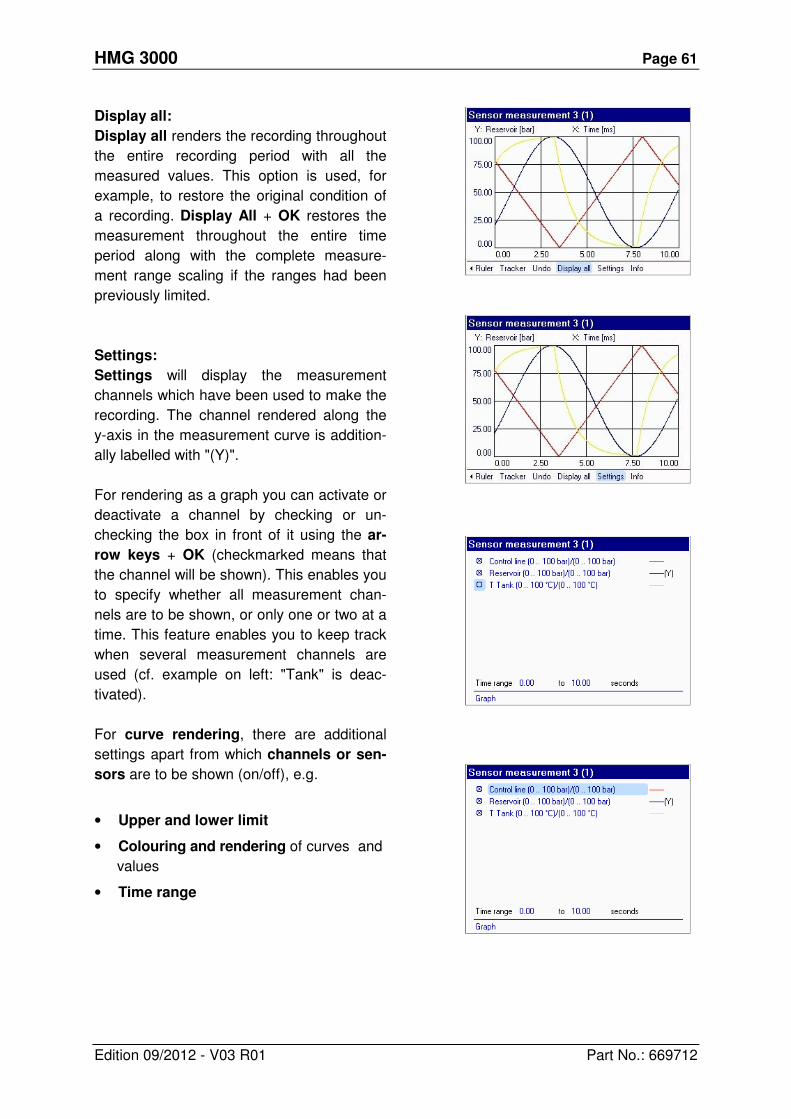
HMG 3000 Page 61
Edition 09/2012 - V03 R01 Part No.: 669712
Display all:
Display all renders the recording throughout
the entire recording period with all the
measured values. This option is used, for
example, to restore the original condition of
a recording. Display All + OK restores the
measurement throughout the entire time
period along with the complete measure-
ment range scaling if the ranges had been
previously limited.
Settings:
Settings will display the measurement
channels which have been used to make the
recording. The channel rendered along the
y-axis in the measurement curve is addition-
ally labelled with "(Y)".
For rendering as a graph you can activate or
deactivate a channel by checking or un-
checking the box in front of it using the ar-
row keys + OK (checkmarked means that
the channel will be shown). This enables you
to specify whether all measurement chan-
nels are to be shown, or only one or two at a
time. This feature enables you to keep track
when several measurement channels are
used (cf. example on left: "Tank" is deac-
tivated).
For curve rendering, there are additional
settings apart from which channels or sen-
sors are to be shown (on/off), e.g.
• Upper and lower limit
• Colouring and rendering of curves and
values
• Time range
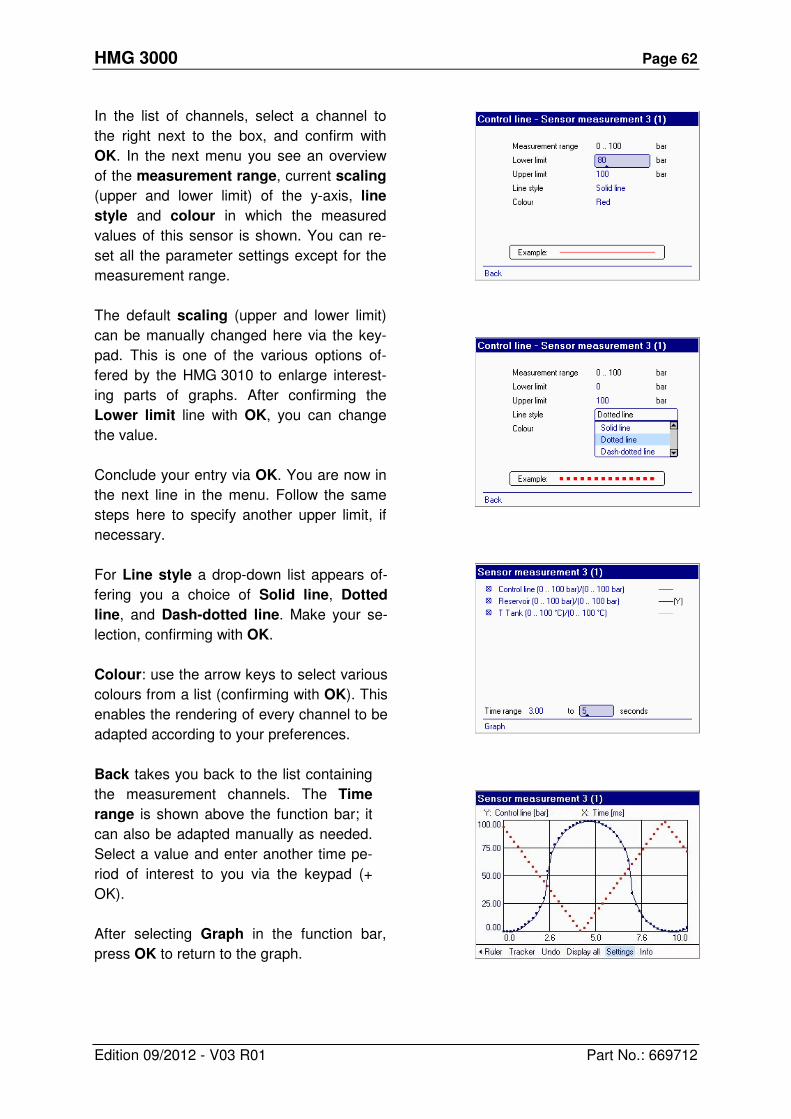
HMG 3000 Page 62
Edition 09/2012 - V03 R01 Part No.: 669712
In the list of channels, select a channel to
the right next to the box, and confirm with
OK. In the next menu you see an overview
of the measurement range, current scaling
(upper and lower limit) of the y-axis, line
style and colour in which the measured
values of this sensor is shown. You can re-
set all the parameter settings except for the
measurement range.
The default scaling (upper and lower limit)
can be manually changed here via the key-
pad. This is one of the various options of-
fered by the HMG 3010 to enlarge interest-
ing parts of graphs. After confirming the
Lower limit line with OK, you can change
the value.
Conclude your entry via OK. You are now in
the next line in the menu. Follow the same
steps here to specify another upper limit, if
necessary.
For Line style a drop-down list appears of-
fering you a choice of Solid line, Dotted
line, and Dash-dotted line. Make your se-
lection, confirming with OK.
Colour: use the arrow keys to select various
colours from a list (confirming with OK). This
enables the rendering of every channel to be
adapted according to your preferences.
Back takes you back to the list containing
the measurement channels. The Time
range is shown above the function bar; it
can also be adapted manually as needed.
Select a value and enter another time pe-
riod of interest to you via the keypad (+
OK).
After selecting Graph in the function bar,
press OK to return to the graph.
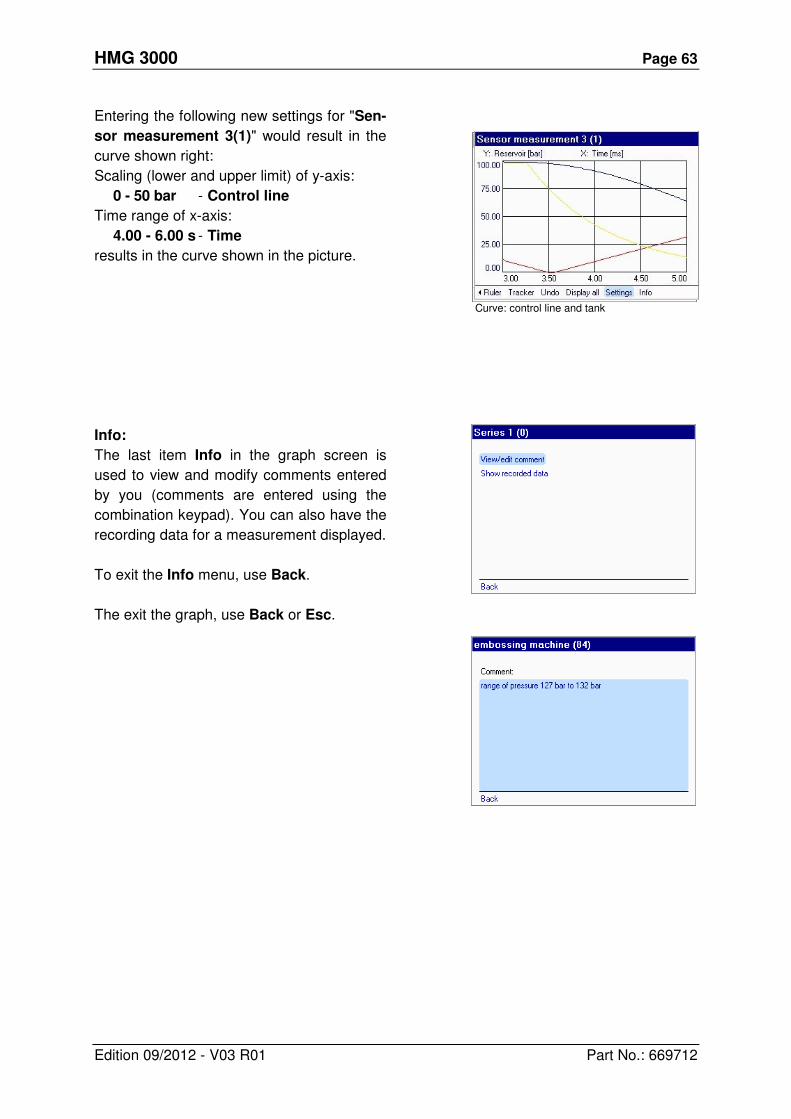
HMG 3000 Page 63
Edition 09/2012 - V03 R01 Part No.: 669712
Entering the following new settings for "Sen-
sor measurement 3(1)" would result in the
curve shown right:
Scaling (lower and upper limit) of y-axis:
0 - 50 bar - Control line
Time range of x-axis:
4.00 - 6.00 s - Time
results in the curve shown in the picture.
Info:
The last item Info in the graph screen is
used to view and modify comments entered
by you (comments are entered using the
combination keypad). You can also have the
recording data for a measurement displayed.
To exit the Info menu, use Back.
The exit the graph, use Back or Esc.
Curve: control line and tank
50.0
0.0
37.5
25.0
12.5
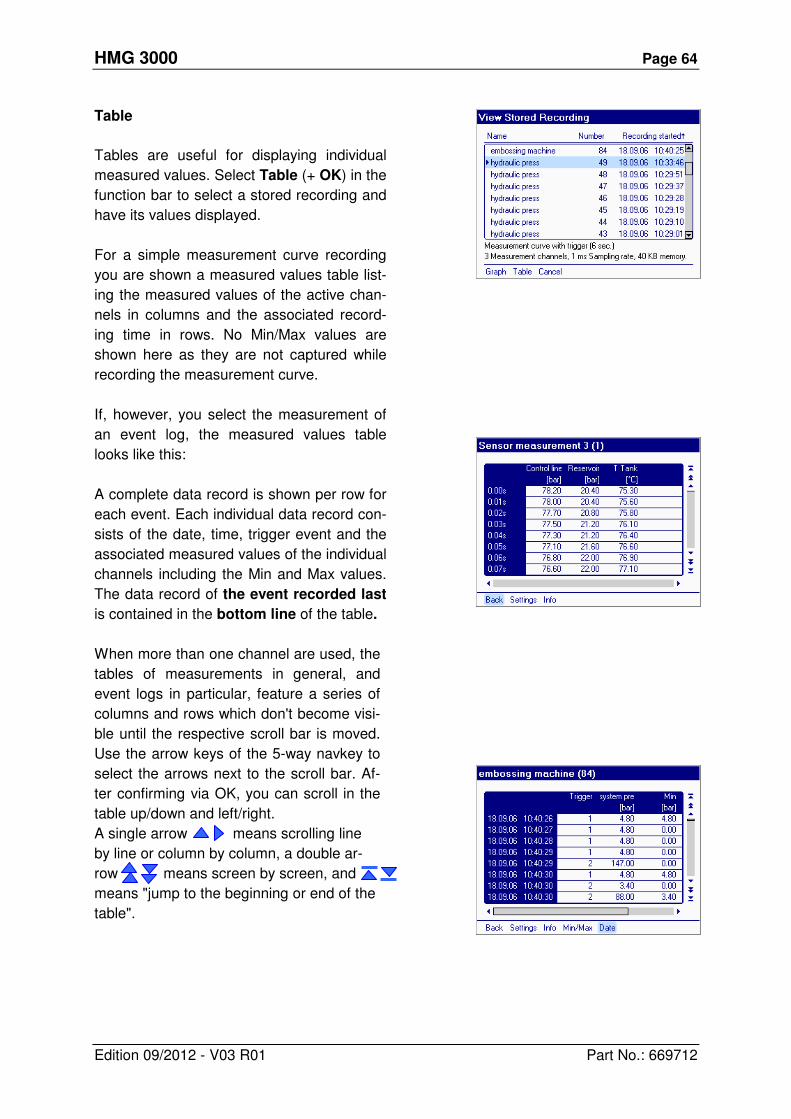
HMG 3000 Page 64
Edition 09/2012 - V03 R01 Part No.: 669712
Table
Tables are useful for displaying individual
measured values. Select Table (+ OK) in the
function bar to select a stored recording and
have its values displayed.
For a simple measurement curve recording
you are shown a measured values table list-
ing the measured values of the active chan-
nels in columns and the associated record-
ing time in rows. No Min/Max values are
shown here as they are not captured while
recording the measurement curve.
If, however, you select the measurement of
an event log, the measured values table
looks like this:
A complete data record is shown per row for
each event. Each individual data record con-
sists of the date, time, trigger event and the
associated measured values of the individual
channels including the Min and Max values.
The data record of the event recorded last
is contained in the bottom line of the table.
When more than one channel are used, the
tables of measurements in general, and
event logs in particular, feature a series of
columns and rows which don't become visi-
ble until the respective scroll bar is moved.
Use the arrow keys of the 5-way navkey to
select the arrows next to the scroll bar. Af-
ter confirming via OK, you can scroll in the
table up/down and left/right.
A single arrow means scrolling line
by line or column by column, a double ar-
row means screen by screen, and
means "jump to the beginning or end of the
table".
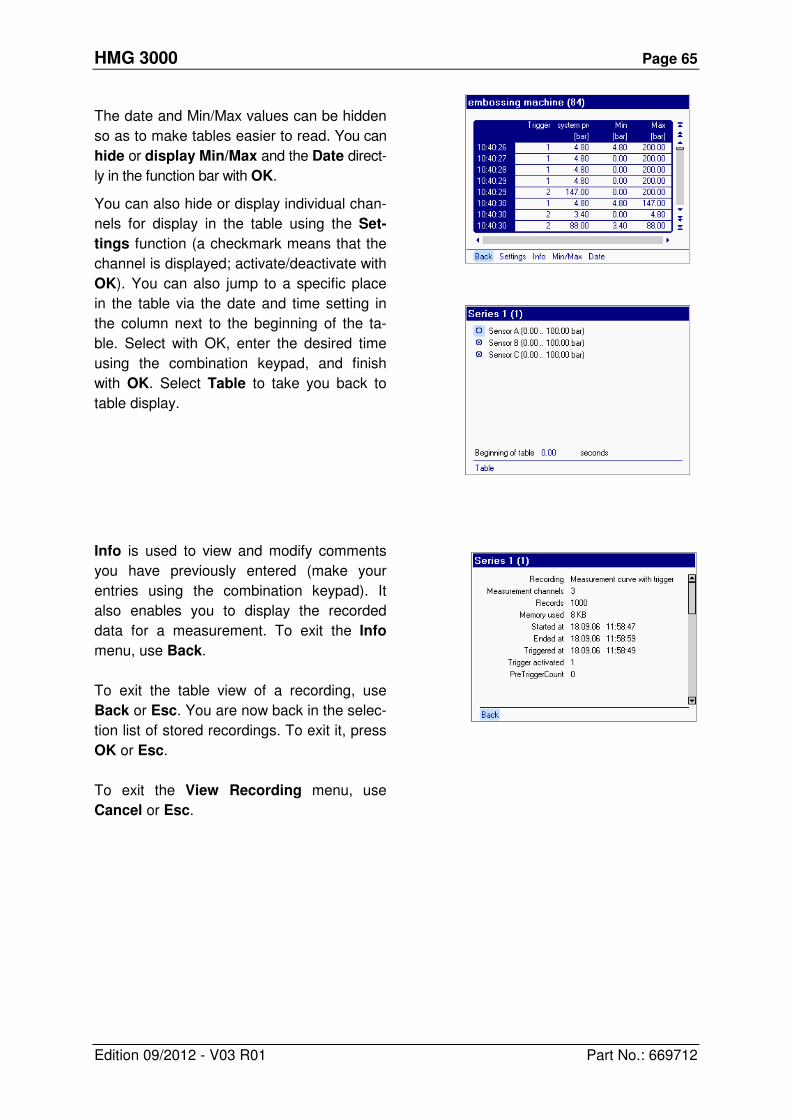
HMG 3000 Page 65
Edition 09/2012 - V03 R01 Part No.: 669712
The date and Min/Max values can be hidden
so as to make tables easier to read. You can
hide or display Min/Max and the Date direct-
ly in the function bar with OK.
You can also hide or display individual chan-
nels for display in the table using the Set-
tings function (a checkmark means that the
channel is displayed; activate/deactivate with
OK). You can also jump to a specific place
in the table via the date and time setting in
the column next to the beginning of the ta-
ble. Select with OK, enter the desired time
using the combination keypad, and finish
with OK. Select Table to take you back to
table display.
Info is used to view and modify comments
you have previously entered (make your
entries using the combination keypad). It
also enables you to display the recorded
data for a measurement. To exit the Info
menu, use Back.
To exit the table view of a recording, use
Back or Esc. You are now back in the selec-
tion list of stored recordings. To exit it, press
OK or Esc.
To exit the View Recording menu, use
Cancel or Esc.
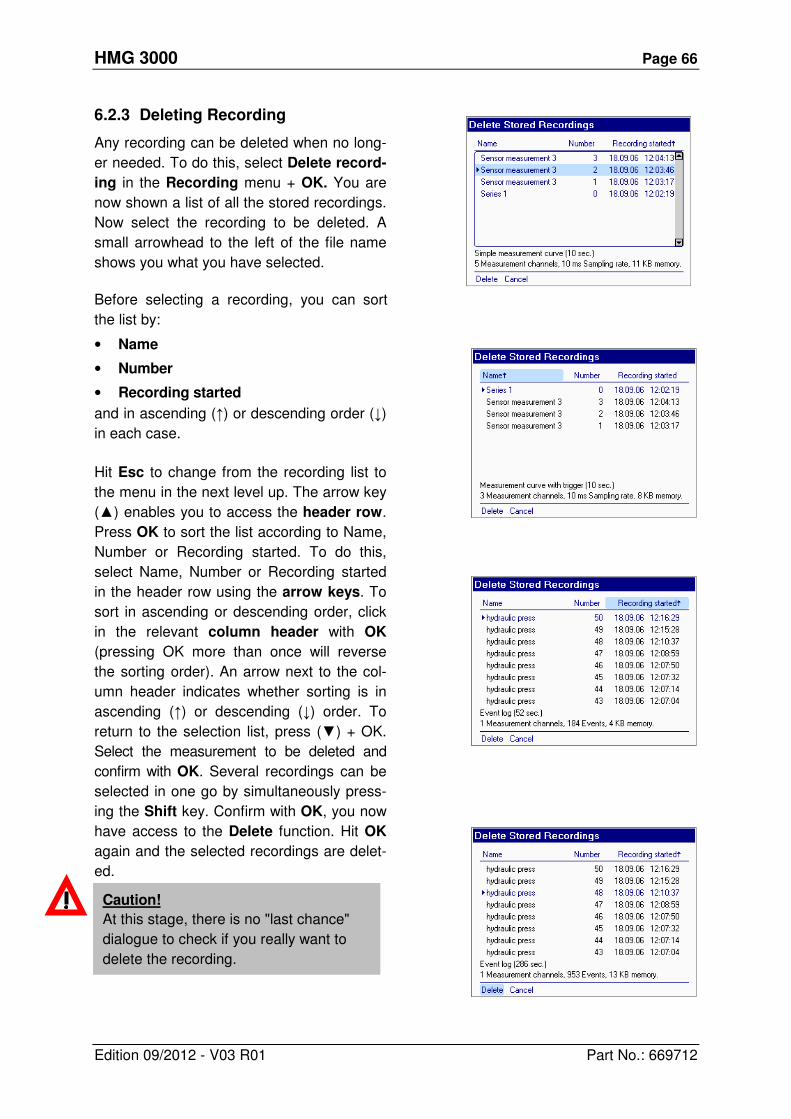
HMG 3000 Page 66
Edition 09/2012 - V03 R01 Part No.: 669712
6.2.3 Deleting Recording
Any recording can be deleted when no long-
er needed. To do this, select Delete record-
ing in the Recording menu + OK. You are
now shown a list of all the stored recordings.
Now select the recording to be deleted. A
small arrowhead to the left of the file name
shows you what you have selected.
Before selecting a recording, you can sort
the list by:
• Name
• Number
• Recording started
and in ascending (↑) or descending order (↓)
in each case.
Hit Esc to change from the recording list to
the menu in the next level up. The arrow key
(▲) enables you to access the header row.
Press OK to sort the list according to Name,
Number or Recording started. To do this,
select Name, Number or Recording started
in the header row using the arrow keys. To
sort in ascending or descending order, click
in the relevant column header with OK
(pressing OK more than once will reverse
the sorting order). An arrow next to the col-
umn header indicates whether sorting is in
ascending (↑) or descending (↓) order. To
return to the selection list, press (▼) + OK.
Select the measurement to be deleted and
confirm with OK. Several recordings can be
selected in one go by simultaneously press-
ing the Shift key. Confirm with OK, you now
have access to the Delete function. Hit OK
again and the selected recordings are delet-
ed.
Caution!
At this stage, there is no "last chance"
dialogue to check if you really want to
delete the recording.
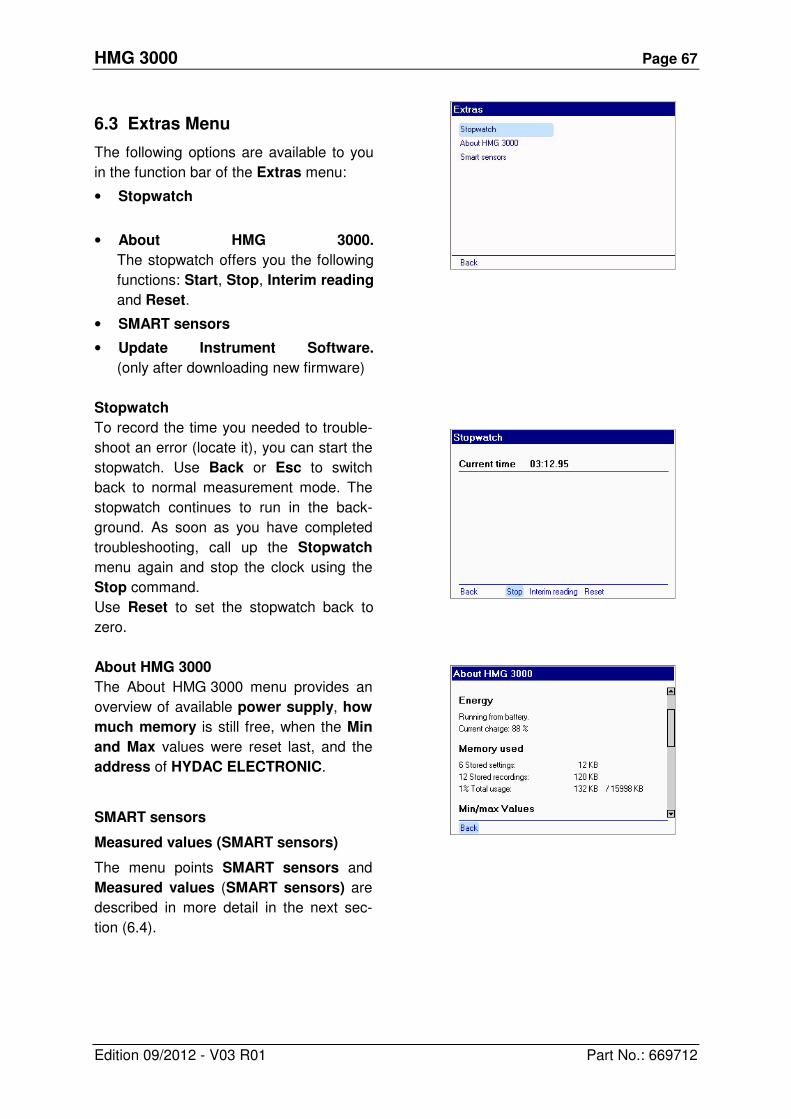
HMG 3000 Page 67
Edition 09/2012 - V03 R01 Part No.: 669712
6.3 Extras Menu
The following options are available to you
in the function bar of the Extras menu:
• Stopwatch
• About HMG 3000.
The stopwatch offers you the following
functions: Start, Stop, Interim reading
and Reset.
• SMART sensors
• Update Instrument Software.
(only after downloading new firmware)
Stopwatch
To record the time you needed to trouble-
shoot an error (locate it), you can start the
stopwatch. Use Back or Esc to switch
back to normal measurement mode. The
stopwatch continues to run in the back-
ground. As soon as you have completed
troubleshooting, call up the Stopwatch
menu again and stop the clock using the
Stop command.
Use Reset to set the stopwatch back to
zero.
About HMG 3000
The About HMG 3000 menu provides an
overview of available power supply, how
much memory is still free, when the Min
and Max values were reset last, and the
address of HYDAC ELECTRONIC.
SMART sensors
Measured values (SMART sensors)
The menu points SMART sensors and
Measured values (SMART sensors) are
described in more detail in the next sec-
tion (6.4).
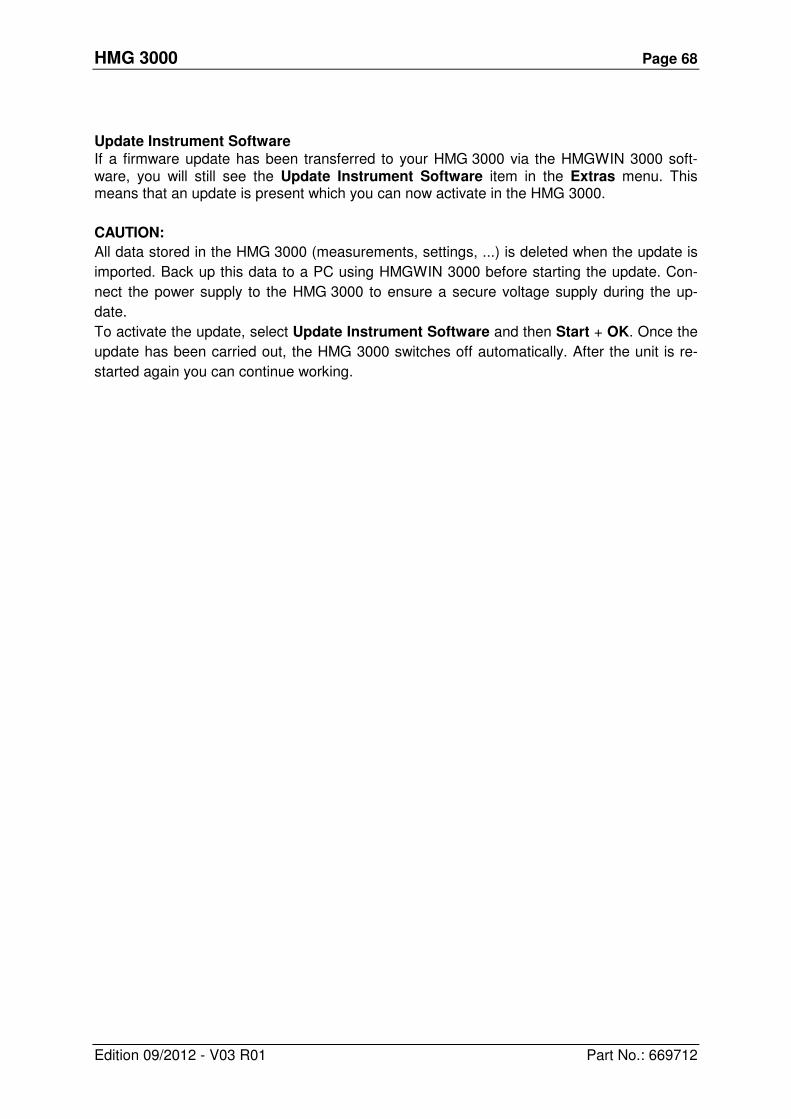
HMG 3000 Page 68
Edition 09/2012 - V03 R01 Part No.: 669712
Update Instrument Software
If a firmware update has been transferred to your HMG 3000 via the HMGWIN 3000 soft-ware, you will still see the Update Instrument Software item in the Extras menu. This means that an update is present which you can now activate in the HMG 3000.
CAUTION:
All data stored in the HMG 3000 (measurements, settings, ...) is deleted when the update is
imported. Back up this data to a PC using HMGWIN 3000 before starting the update. Con-
nect the power supply to the HMG 3000 to ensure a secure voltage supply during the up-
date.
To activate the update, select Update Instrument Software and then Start + OK. Once the
update has been carried out, the HMG 3000 switches off automatically. After the unit is re-
started again you can continue working.
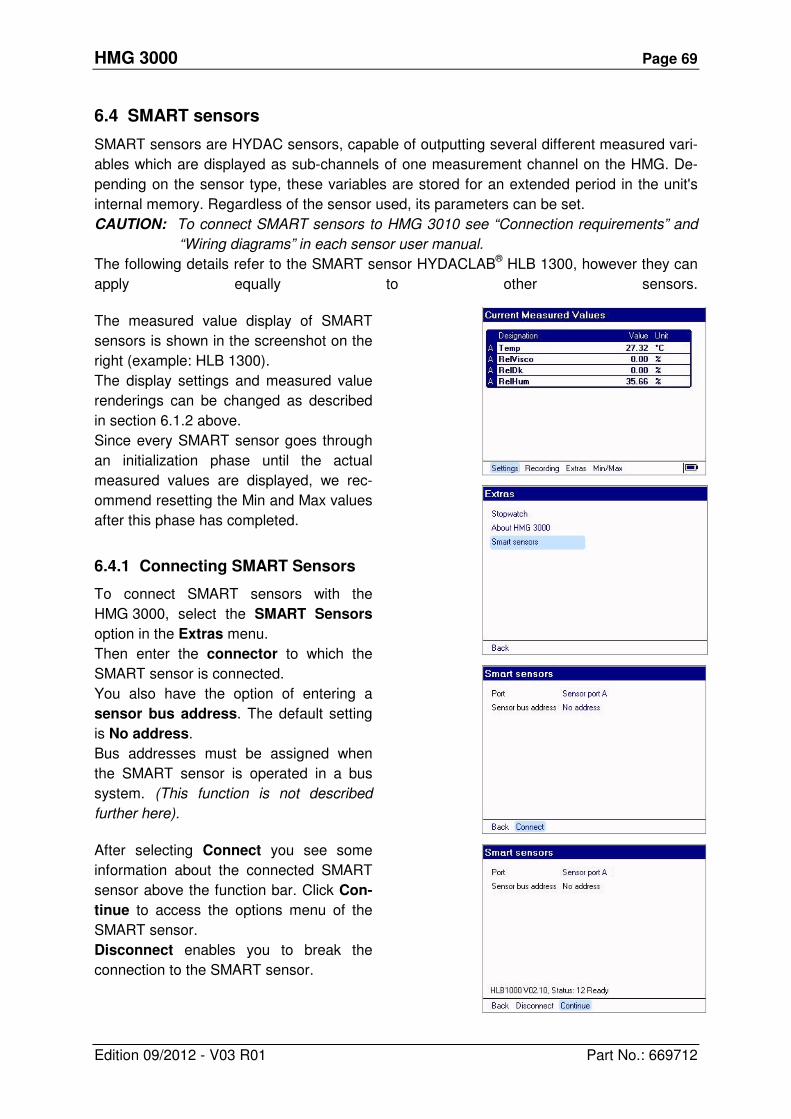
HMG 3000 Page 69
Edition 09/2012 - V03 R01 Part No.: 669712
6.4 SMART sensors
SMART sensors are HYDAC sensors, capable of outputting several different measured vari-
ables which are displayed as sub-channels of one measurement channel on the HMG. De-
pending on the sensor type, these variables are stored for an extended period in the unit's
internal memory. Regardless of the sensor used, its parameters can be set.
CAUTION: To connect SMART sensors to HMG 3010 see “Connection requirements” and
“Wiring diagrams” in each sensor user manual.
The following details refer to the SMART sensor HYDACLAB® HLB 1300, however they can
apply equally to other sensors.
The measured value display of SMART
sensors is shown in the screenshot on the
right (example: HLB 1300).
The display settings and measured value
renderings can be changed as described
in section 6.1.2 above.
Since every SMART sensor goes through
an initialization phase until the actual
measured values are displayed, we rec-
ommend resetting the Min and Max values
after this phase has completed.
6.4.1 Connecting SMART Sensors
To connect SMART sensors with the
HMG 3000, select the SMART Sensors
option in the Extras menu.
Then enter the connector to which the
SMART sensor is connected.
You also have the option of entering a
sensor bus address. The default setting
is No address.
Bus addresses must be assigned when
the SMART sensor is operated in a bus
system. (This function is not described
further here).
After selecting Connect you see some
information about the connected SMART
sensor above the function bar. Click Con-
tinue to access the options menu of the
SMART sensor.
Disconnect enables you to break the
connection to the SMART sensor.
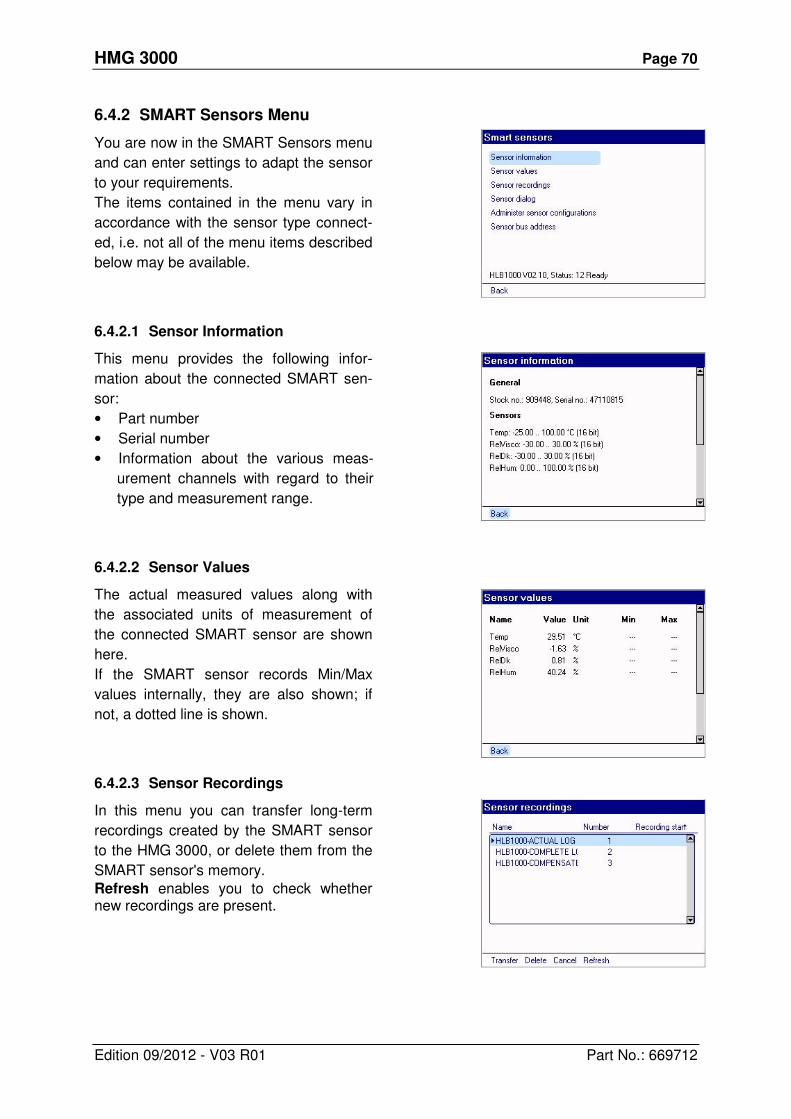
HMG 3000 Page 70
Edition 09/2012 - V03 R01 Part No.: 669712
6.4.2 SMART Sensors Menu
You are now in the SMART Sensors menu
and can enter settings to adapt the sensor
to your requirements.
The items contained in the menu vary in
accordance with the sensor type connect-
ed, i.e. not all of the menu items described
below may be available. 6.4.2.1 Sensor Information
This menu provides the following infor-
mation about the connected SMART sen-
sor:
• Part number
• Serial number
• Information about the various meas-
urement channels with regard to their
type and measurement range. 6.4.2.2 Sensor Values
The actual measured values along with
the associated units of measurement of
the connected SMART sensor are shown
here.
If the SMART sensor records Min/Max
values internally, they are also shown; if
not, a dotted line is shown. 6.4.2.3 Sensor Recordings
In this menu you can transfer long-term
recordings created by the SMART sensor
to the HMG 3000, or delete them from the
SMART sensor's memory.
Refresh enables you to check whether new recordings are present.

HMG 3000 Page 71
Edition 09/2012 - V03 R01 Part No.: 669712
After selecting a recording and the Trans-
fer option, you see the following screen:
Now you can determine whether the se-
lected recording is to be stored in the
HMG 3000 under the combination of
name+number, or whether you would like
to assign a new designation. 6.4.2.4 Sensor Dialogue
This menu enables you to modify the con-
figuration of the SMART sensor.
Note that what is shown in this menu de-
pends on the SMART sensor connected.
For detailed information on the possible
settings, please refer to the particular sen-
sor documentation.
6.4.2.5 Administer Sensor Configura-tion
Here you have the possibility of reading
the current configuration of the SMART
sensor, or transferring saved settings into
the SMART sensor.
You can also have a saved configuration
displayed or deleted. Read configuration from sensor
This menu item enables you to read the
configuration of the SMART sensor and
transfer it to the HMG 3000. You can ac-
cept the suggested name+number combi-
nation, or enter a new one.
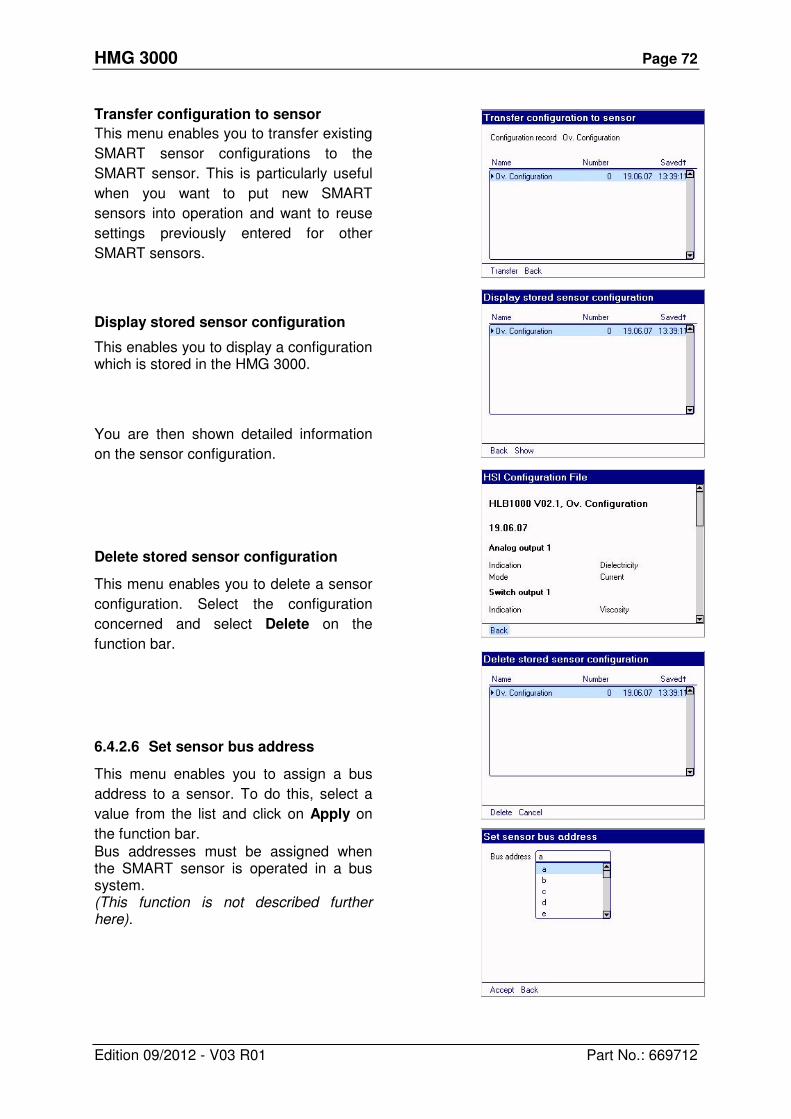
HMG 3000 Page 72
Edition 09/2012 - V03 R01 Part No.: 669712
Transfer configuration to sensor
This menu enables you to transfer existing
SMART sensor configurations to the
SMART sensor. This is particularly useful
when you want to put new SMART
sensors into operation and want to reuse
settings previously entered for other
SMART sensors. Display stored sensor configuration
This enables you to display a configuration which is stored in the HMG 3000.
You are then shown detailed information
on the sensor configuration. Delete stored sensor configuration
This menu enables you to delete a sensor
configuration. Select the configuration
concerned and select Delete on the
function bar. 6.4.2.6 Set sensor bus address
This menu enables you to assign a bus
address to a sensor. To do this, select a
value from the list and click on Apply on
the function bar. Bus addresses must be assigned when the SMART sensor is operated in a bus system. (This function is not described further here).
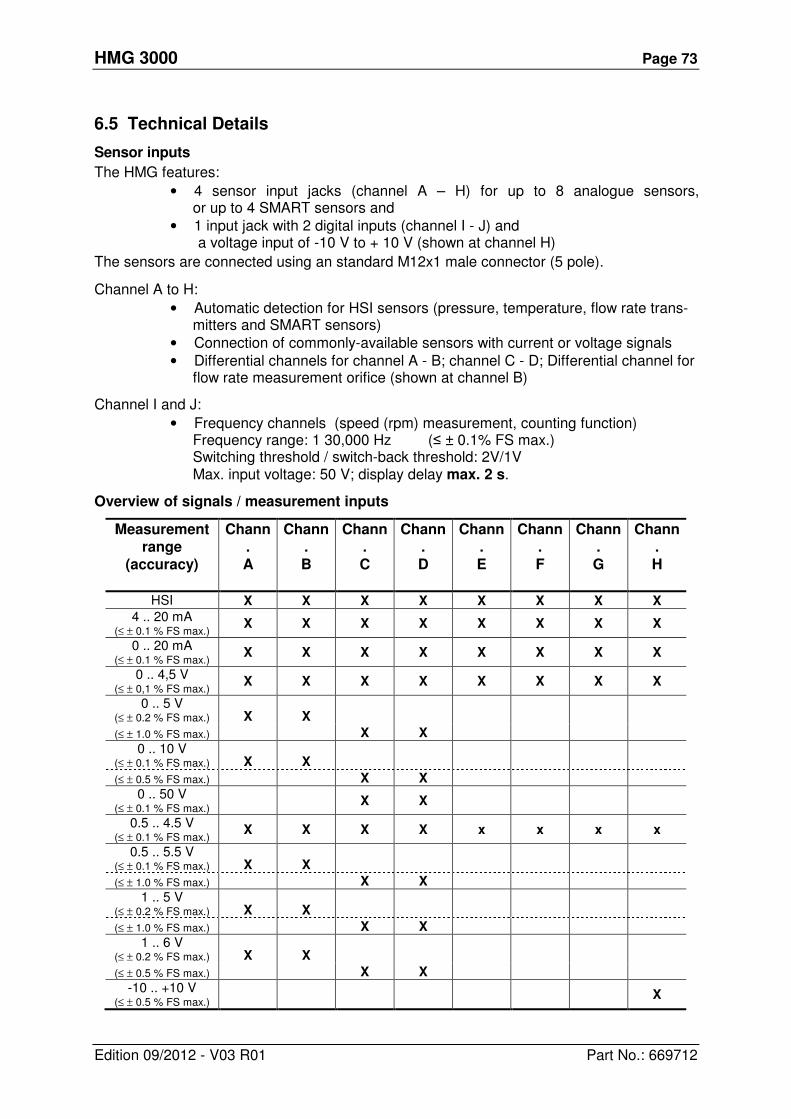
HMG 3000 Page 73
Edition 09/2012 - V03 R01 Part No.: 669712
6.5 Technical Details
Sensor inputs
The HMG features:
• 4 sensor input jacks (channel A – H) for up to 8 analogue sensors, or up to 4 SMART sensors and
• 1 input jack with 2 digital inputs (channel I - J) and a voltage input of -10 V to + 10 V (shown at channel H)
The sensors are connected using an standard M12x1 male connector (5 pole).
Channel A to H:
• Automatic detection for HSI sensors (pressure, temperature, flow rate trans-mitters and SMART sensors)
• Connection of commonly-available sensors with current or voltage signals • Differential channels for channel A - B; channel C - D; Differential channel for
flow rate measurement orifice (shown at channel B)
Channel I and J:
• Frequency channels (speed (rpm) measurement, counting function) Frequency range: 1 30,000 Hz (≤ ± 0.1% FS max.) Switching threshold / switch-back threshold: 2V/1V Max. input voltage: 50 V; display delay max. 2 s.
Overview of signals / measurement inputs
Measurement range
(accuracy)
Chann. A
Chann. B
Chann. C
Chann. D
Chann. E
Chann. F
Chann. G
Chann. H
HSI X X X X X X X X
4 .. 20 mA (≤ ± 0.1 % FS max.)
X X X X X X X X
0 .. 20 mA (≤ ± 0.1 % FS max.)
X X X X X X X X
0 .. 4,5 V (≤ ± 0,1 % FS max.)
X X X X X X X X
0 .. 5 V (≤ ± 0.2 % FS max.) X X
(≤ ± 1.0 % FS max.) X X
0 .. 10 V (≤ ± 0.1 % FS max.) X X
(≤ ± 0.5 % FS max.) X X
0 .. 50 V (≤ ± 0.1 % FS max.)
X X
0.5 .. 4.5 V (≤ ± 0.1 % FS max.)
X X X X x x x x
0.5 .. 5.5 V (≤ ± 0.1 % FS max.) X X
(≤ ± 1.0 % FS max.) X X
1 .. 5 V (≤ ± 0.2 % FS max.) X X
(≤ ± 1.0 % FS max.) X X
1 .. 6 V (≤ ± 0.2 % FS max.) X X
(≤ ± 0.5 % FS max.) X X
-10 .. +10 V (≤ ± 0.5 % FS max.)
X
HMG 3000 Page 74
Edition 09/2012 - V03 R01 Part No.: 669712
Battery life (from fully charged)
• HMG 3000 without sensors approx. 11 hours
• HMG 3000 with 2 sensors approx. 9 hours
• HMG 3000 with 4 sensors approx. 7 hours
• HMG 3000 with 8 sensors approx. 4 hours
Sampling rates
• Sampling rate: 0.1 ms .. 1 min
• Sampling rate: 0.1 ms for a maximum of two sensors (other sensor
inputs inactive); e.g. for pressure peak measurements
The sampling rate which can be set is dependent on the active measurement channels. The
following applies:
• 0.1 ms max. 2 analogue input channels
• 0.2 ms max. 4 analogue input channels
• 0.5 ms all 10 input channels
• 1.0 ms for SMART sensors
Measured value memory
• Single recording: up to 500,000 measured values
• Archive memory: 128 MB
(for min. 100 individual recordings)
PC link interfaces
• USB port
• Serial interface (RS 232)
For communication and evaluation using the HYDAC HMGWIN 3000 or CMWIN
software and using HSP log
Dimensions and weight
• Dimensions: 246 x 174 x 58 mm
• Weight: 1100 g
Operating and ambient conditions
• Operating temperature: 0 ... 50 °C
• Storage temperature: -20 ... 60 °C
• Relative humidity: 0 ... 70 %
Technical standards
• EMC: EN 61000-6-1/2/3/4
• Safety: EN 61010
• Protection class: IP 40
Supply voltage
• 12 … 30V DC
HMG 3000 Page 75
Edition 09/2012 - V03 R01 Part No.: 669712
7 Cleaning
The HMG 3000 must not be cleaned with aggressive agents (e.g. alcohol, screen clean-
er,...). For cleaning we recommend using a slightly damp cloth.
8 Accessories
• Pressure Transmitter (with HSI-interface) of the measuring ranges:
- 1 ... 9 bar, 0 ... 16 bar, 0 ... 100 bar, 0 ... 250 bar, 0 ... 400 bar, 0 ... 600 bar
Part no. 909429 Part descr. HDA 4748-H-0009-000 (- 1 ... 9 bar)
Part no. 909425 Part descr. HDA 4748-H-0016-000
Part no. 909554 Part descr. HDA 4748-H-0060-000
Part no. 909426 Part descr. HDA 4748-H-0100-000
Part no. 909337 Part descr. HDA 4748-H-0250-000
Part no. 909427 Part descr. HDA 4748-H-0400-000
Part no. 909428 Part descr. HDA 4748-H-0600-000
• Temperature Transmitter (with HSI-interface)
Part no. 909298 Part descr. ETS 4548-H-000 (-25 to +100 °C)
• Flow Rate Transmitter (with HSI-interface)
Part no. 909293 Part descr. EVS 3100-H-1 (006 - 060 l/min)
Part no. 909403 Part descr. EVS 3100-H-2 (040 - 600 l/min)
Part no. 909404 Part descr. EVS 3100-H-3 (015 - 300 l/min)
Part no. 909405 Part descr. EVS 3100-H-5 ( 1.2 - 020 l/min)
Part no. 909406 Part descr. EVS 3110-H-1 (006 - 060 l/min)
Part no. 909407 Part descr. EVS 3110-H-2 (040 - 600 l/min)
Part no. 909408 Part descr. EVS 3110-H-3 (015 - 300 l/min)
Part no. 909409 Part descr. EVS 3110-H-5 ( 1.2 - 020 l/min)
• Rpm Probe
Part no. 909436 Part descr. HDS 1000-002 (male M12x1)
Part no. 904812 Part descr. HDS 1000 reflective foil set (quantity 25)
• Sensor Simulator for 2 HSI Transmitters
Part no. 909414 Part descr. SSH 1000-H-3 (simulator for HMG 3000)
ideal for training purposes
HMG 3000 Page 76
Edition 09/2012 - V03 R01 Part No.: 669712
• Other accessories
Part no. 6042959 Part descr. Case for HMG 3000 & accessories
Part no. 909795 Part descr. Bag with carrying strap for HMG 3000
Part no. 909739 Part descr. ZBE 31 (car charger for HMG 3000)
Part no. 3236597 Part descr. ZBE 34 (adapter M12/Binder; 4 .. 20 mA,
2-conductor)
Part no. 3236601 Part descr. ZBE 35 (adapter M12/Hirschmann; 4..20 mA,
2-conductor)
Part no. 3224436 Part descr. ZBE 38 (Y adapter)
Part no. 3304374 Part descr. ZBE 26 (Y adapter blue for HLB 1000)
Part no. 909737 Part descr. ZBE 36 (connection adapter for AS 1000)
Part no. 910000 Part descr. ZBE 41 (Y adapter yellow for CS 1000)
Part no. 6040851 Part descr. ZBE 30-02 (sensor cable M12x1, 5-pole) 2m
Part no. 6040852 Part descr. ZBE 30-05 (sensor cable M12x1, 5-pole) 5m
Part no. 909752 Part descr. UVM 3000 Adapter (for
non-HYDAC sensors)
Part no. 903083 Part descr. Hydraulic adapter kit for the HMG
Contents:
2 adapter hoses DN 2 / 400 mm 1620 / 1620
2 adapter hoses DN 2 / 1000 mm 1620 / 1620
2 pressure gauge direct connection adapters 1620 / G 1/4
2 adapters 1615 / 1620
2 bulkhead couplings 1620 / 1620
• Spare parts
Part no. 6054296 Part descr. Power supply for HMG 3000
Part no. 6040585 Part descr. Connection cable HMG 3000 – PC (USB)
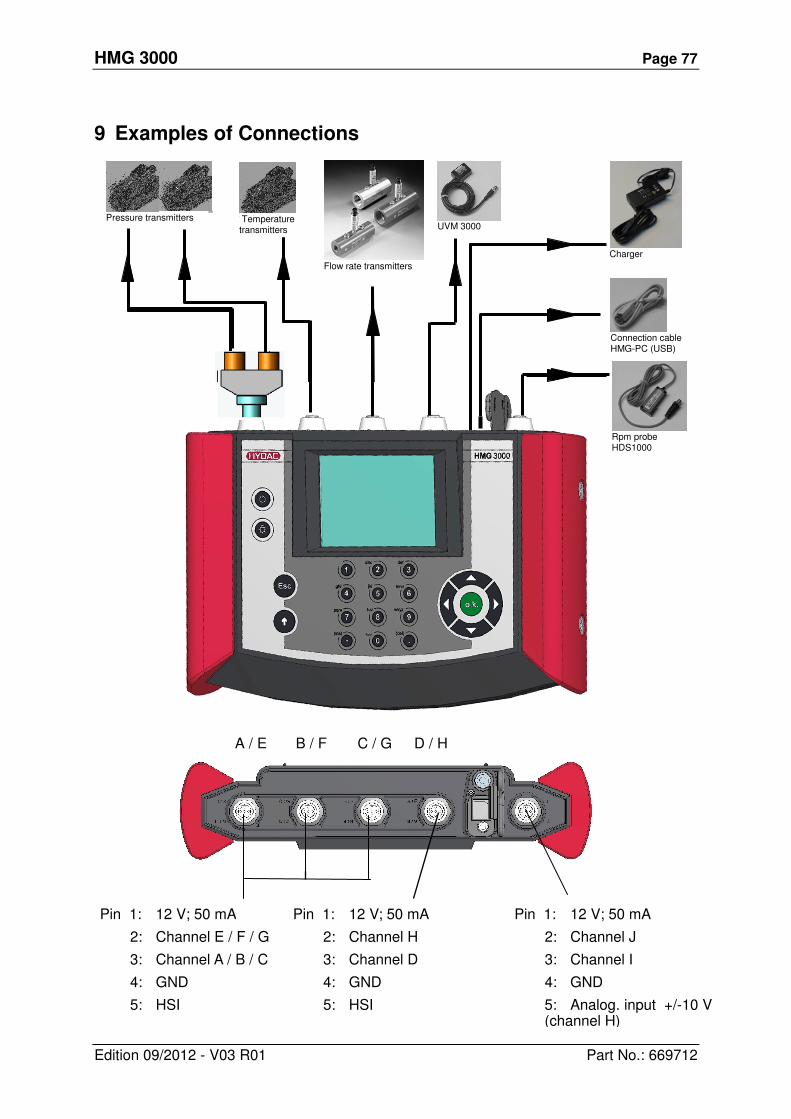
HMG 3000 Page 77
Edition 09/2012 - V03 R01 Part No.: 669712
9 Examples of Connections
Rpm probe HDS1000
Temperature transmitters
Flow rate transmitters
Connection cable HMG-PC (USB)
Pressure transmitters
Pin 1: 12 V; 50 mA
2: Channel E / F / G
3: Channel A / B / C
4: GND
5: HSI
Pin 1: 12 V; 50 mA
2: Channel J
3: Channel I
4: GND
5: Analog. input +/-10 V (channel H)
UVM 3000
A / E B / F C / G D / H
Pin 1: 12 V; 50 mA
2: Channel H
3: Channel D
4: GND
5: HSI
Temperature transmitters
Flow rate transmitters
UVM 3000
Charger
Pressure transmitters
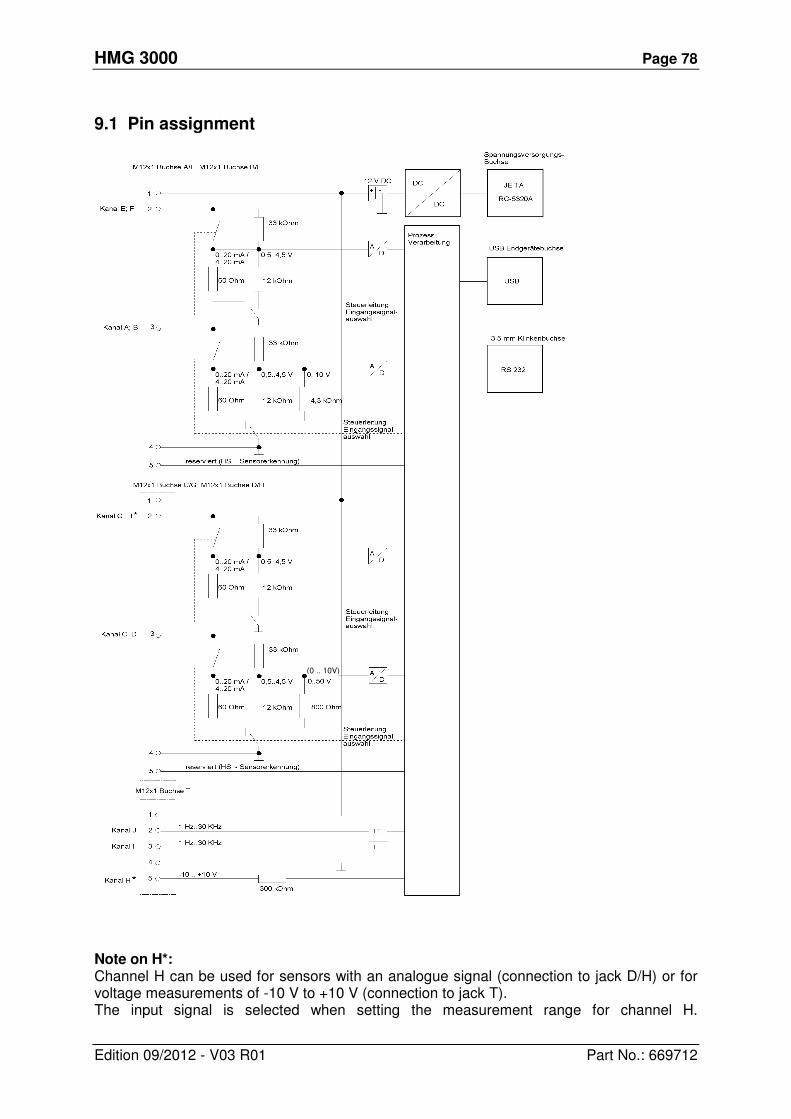
HMG 3000 Page 78
Edition 09/2012 - V03 R01 Part No.: 669712
9.1 Pin assignment
Note on H*: Channel H can be used for sensors with an analogue signal (connection to jack D/H) or for voltage measurements of -10 V to +10 V (connection to jack T). The input signal is selected when setting the measurement range for channel H.
(0 .. 10V)
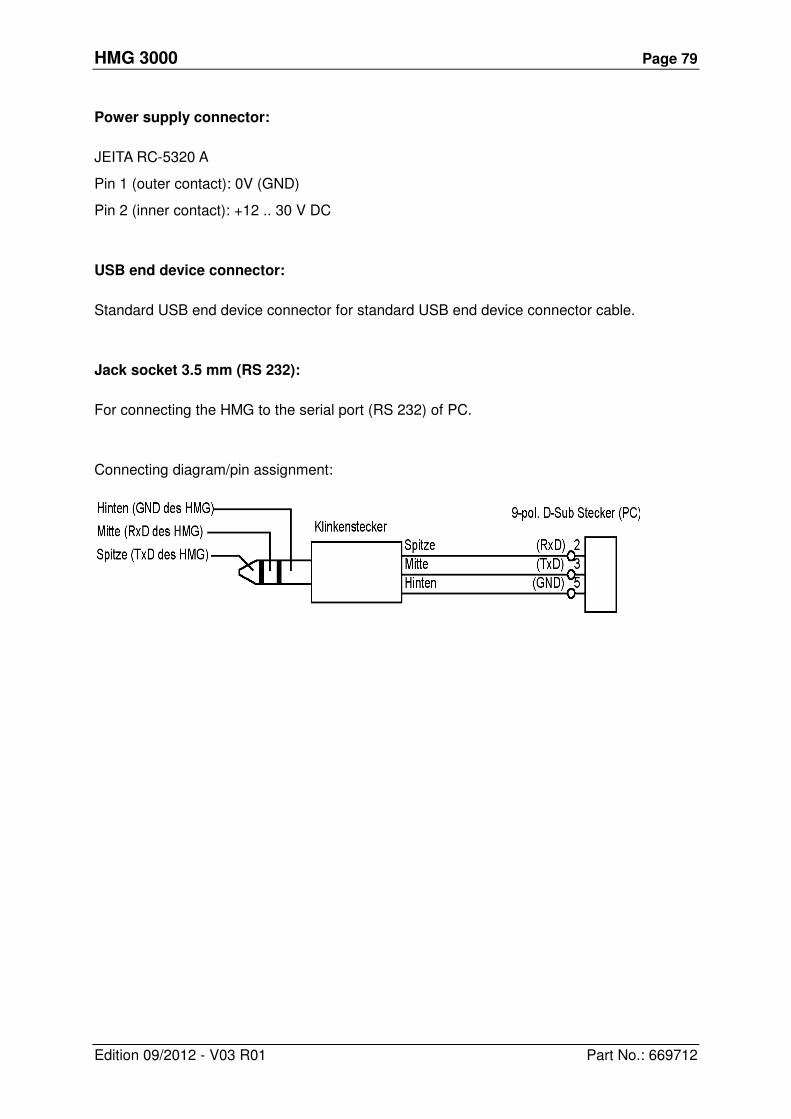
HMG 3000 Page 79
Edition 09/2012 - V03 R01 Part No.: 669712
Power supply connector:
JEITA RC-5320 A
Pin 1 (outer contact): 0V (GND)
Pin 2 (inner contact): +12 .. 30 V DC
USB end device connector:
Standard USB end device connector for standard USB end device connector cable.
Jack socket 3.5 mm (RS 232):
For connecting the HMG to the serial port (RS 232) of PC.
Connecting diagram/pin assignment:
HMG 3000 Page 80
Edition 09/2012 - V03 R01 Part No.: 669712
HYDAC ELECTRONIC GMBH
Hauptstr. 27
D-66128 Saarbrücken
Germany
Web: www.hydac.com
E-Mail: [email protected]
Phone: +49-(0)6897-509-01
Fax: +49-(0)6897-509-1726
HYDAC Service
If you have any questions
concerning repair work,
please do not hesitate to
contact HYDAC Service:
HYDAC SERVICE GMBH
Hauptstr. 27
D-66128 Saarbrücken
Germany
Phone: +49-(0)6897-509-1936
Fax: +49-(0)6897-509-1933
Note
The information and particulars provided in this manual apply to the operating conditions
and applications described herein. For applications and operating conditions not de-
scribed, please contact the relevant technical department.
If you have any questions, suggestions, or encounter any problems of a technical na-
ture, please contact your Hydac representative.
Subject to technical modifications.
Recommended


![Portable MiniDisc Recorder - 소니코리아| 최신 ... · 3-234-030-52(1) Portable MiniDisc Recorder ... filename[D:\sn01112-1\02KR-MZR909JEW\020REGTOC.fm] 5 bX˛žMˆBœ!˛ž ‘](https://img.pdfslide.net/doc/110x75/5b3a9cc27f8b9a26728b97da/portable-minidisc-recorder-3-234-030-521-portable.jpg)