PRESENTATIONON
POWER QUALITY
DISTURBANCES AND
MONITORING
Made By: Aishwarya Verma
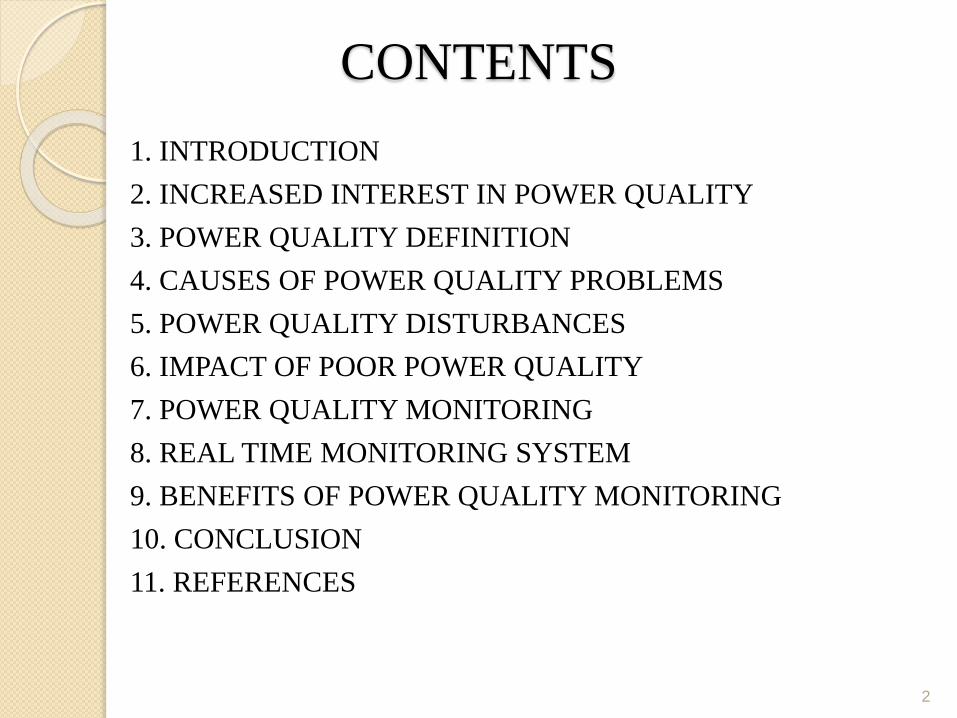
CONTENTS
1. INTRODUCTION
2. INCREASED INTEREST IN POWER QUALITY
3. POWER QUALITY DEFINITION
4. CAUSES OF POWER QUALITY PROBLEMS
5. POWER QUALITY DISTURBANCES
6. IMPACT OF POOR POWER QUALITY
7. POWER QUALITY MONITORING
8. REAL TIME MONITORING SYSTEM
9. BENEFITS OF POWER QUALITY MONITORING
10. CONCLUSION
11. REFERENCES
2
INTRODUCTION
The aim of the power system has always been to supply electrical energy to customers.
Today electric power is viewed as a product with certain characteristics which can be measured, predicted, guaranteed, improved etc. Moreover it has become an integral part of our life. The term ‘power quality’ emerged as a result of the new emphasis placed on the customer utility relationship.
Power quality has always been important. However, for many years the equation defining power quality was very simple:
POWER QUALITY = RELIABILITY
Understanding the problems associated with power quality variations is the first step towards developing standards and the optimum approach to solutions.
This presentation represents an overviews of electric power quality with special emphasis on power quality problems.
The adverse impact on utility of customers and their mitigation techniques.
3
INCREASED INTEREST IN
POWER QUALITY
Customer loads were linear in nature. When a sinusoidal voltage was
supplied to them, they drew a sinusoidal current. They typically fell
into the categories of lighting, heating and motors. In general, they
were not very sensitive to momentary variations in the supply voltage.
Two major changes in the characteristics of customer loads and systems
have completely changed the nature of the power quality equation:
1. The first is the sensitivity of the loads themselves.
2. Interconnected loads in extensive networks and
automated processes.
4
1. The sensitivity of the loads: The devices and equipment being
applied in industrial and commercial facilities are more sensitive to
power quality variations than equipment applied in the past. New
equipment includes microprocessor-based controls and power
electronics devices that are sensitive to many types of disturbances
besides actual interruptions. Controls can be affected by
momentary voltage sags or relatively minor transient voltages,
resulting in nuisance tripping or misoperation of an important
process.
2. The fact that these sensitive loads are interconnected in extensive
networks and automated processes. This makes the whole system
as sensitive as the most sensitive device and increases the problem
by requiring a good zero potential ground reference for the entire
system.
5
POWER QUALITY DEFINITION
6
The definition of power quality given in the IEEE dictionary is as follows:
“Power quality is the set of parameters defining the properties of the power
supply as delivered to the user in normal operating conditions in terms of
the continuity of voltage and voltage characteristics”.
Modern electronic and power electronic devices are not only sensitive to
voltage disturbances; it also causes disturbances for other customers. These
devices become the source and victims of power quality problems. As such
the term power quality is used to define the interaction of electronic
equipments within the electrical environment.
Different parameters of power quality are:-
Voltage quality :Voltage quality concerns with the deviation of the voltage
from the ideal characteristics. The ideal voltage is a single frequency sine
wave of constant frequency and constant magnitude.
Current quality: Current quality concerns with the deviation of the current
from the ideal characteristics. The ideal current is again a single frequency
sine wave of constant magnitude and frequency. An additional requirement
is that the sine wave should be in phase with the supply voltage.
Power quality : Power quality is the combination of voltage quality and
current quality. Thus power quality is concerned with the deviations of
voltage and/or current from the ideal characteristics.
Thus Power Quality is the set of parameters defining the properties of the
power supply as delivered to the user in normal operating conditions, in
terms of the continuity of voltage and voltage characteristics.
7
CAUSES OF POWER QUALITY
PROBLEMS
Difficult to point an exact cause for a specific problem.
Broadly divided into 2 categories:
1.Internal causes
i) About 80% of Power Quality problems originate within a business
facility.
ii) Due to large equipments start or shut down, improper wiring and
grounding, overloaded circuits or harmonics.
2.External causes
i)About 20% of Power Quality problems originate within the utility
transmission and distribution system.
ii)Due to lightning strikes, equipments failure, weather conditions etc.
8
POWER QUALITY DISTURBANCES Power Quality disturbances can be divided into 2 basic categories:
1.Steady-state variations:-Small deviations from the desired voltage or current
values.
i) Voltage fluctuations
ii) Voltage and current unbalance
iii) Harmonic distortion
2.Events:-Significant sudden deviations of voltage or current from the nominal
or ideal wave shape.
i) Interruptions
ii) Voltage sag
iii) Voltage swell
iv) Transients
9
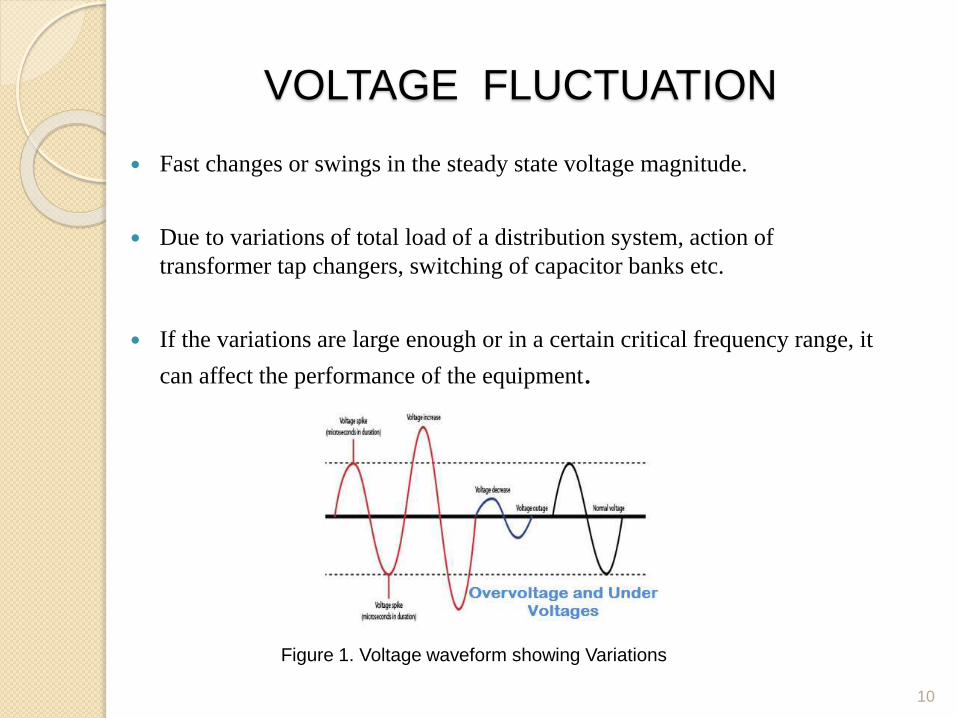
VOLTAGE FLUCTUATION
Fast changes or swings in the steady state voltage magnitude.
Due to variations of total load of a distribution system, action of
transformer tap changers, switching of capacitor banks etc.
If the variations are large enough or in a certain critical frequency range, it
can affect the performance of the equipment.
10
Figure 1. Voltage waveform showing Variations
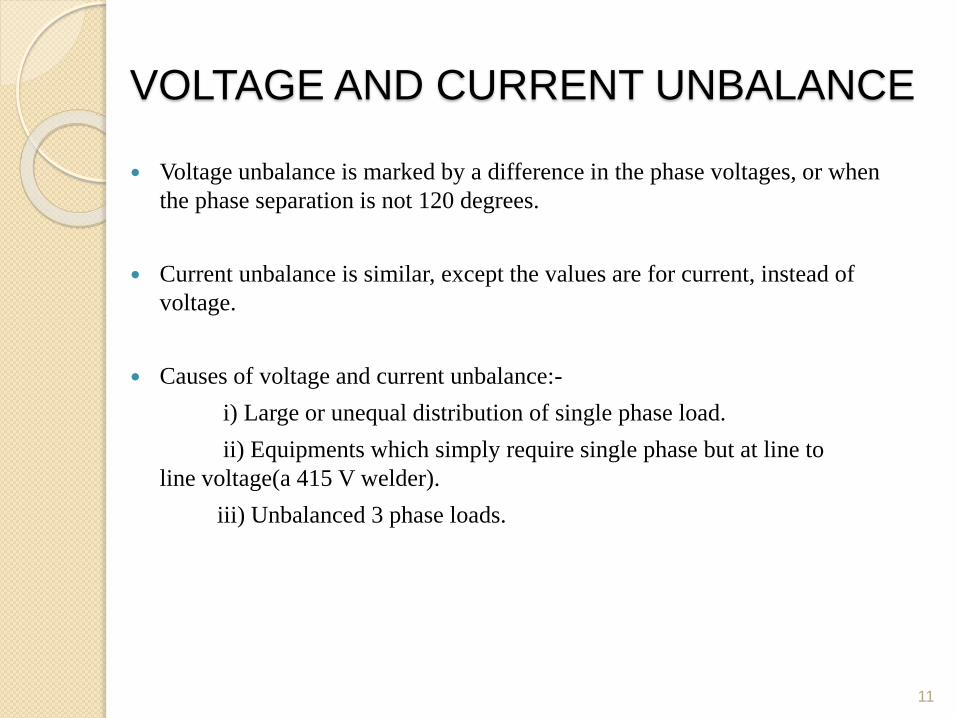
VOLTAGE AND CURRENT UNBALANCE
Voltage unbalance is marked by a difference in the phase voltages, or when
the phase separation is not 120 degrees.
Current unbalance is similar, except the values are for current, instead of
voltage.
Causes of voltage and current unbalance:-
i) Large or unequal distribution of single phase load.
ii) Equipments which simply require single phase but at line to
line voltage(a 415 V welder).
iii) Unbalanced 3 phase loads.
11
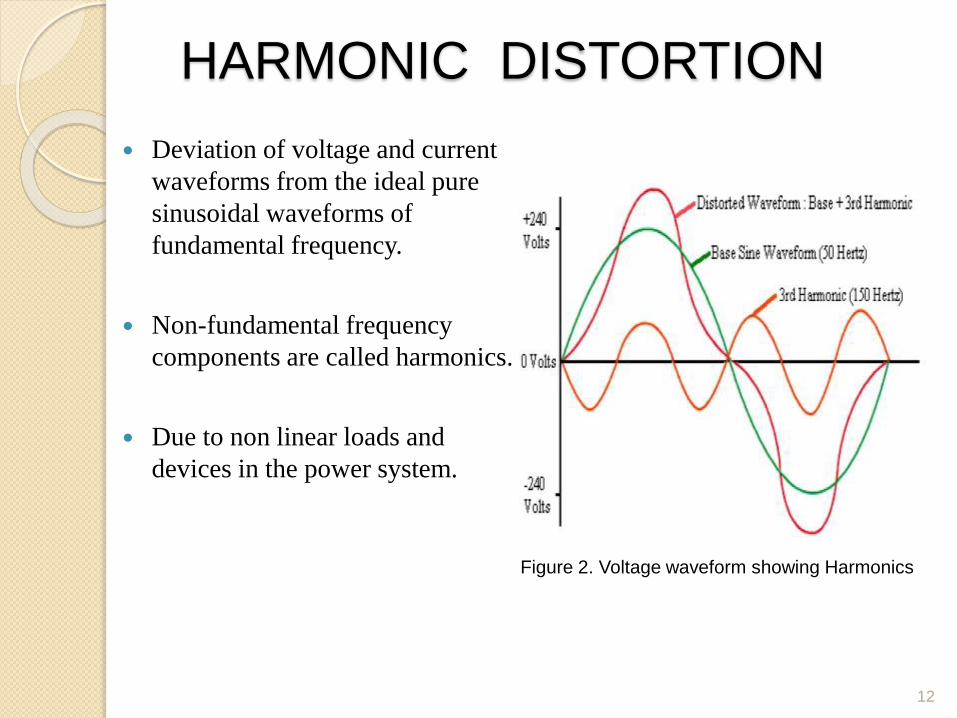
HARMONIC DISTORTION
Deviation of voltage and current
waveforms from the ideal pure
sinusoidal waveforms of
fundamental frequency.
Non-fundamental frequency
components are called harmonics.
Due to non linear loads and
devices in the power system.
12
Figure 2. Voltage waveform showing Harmonics
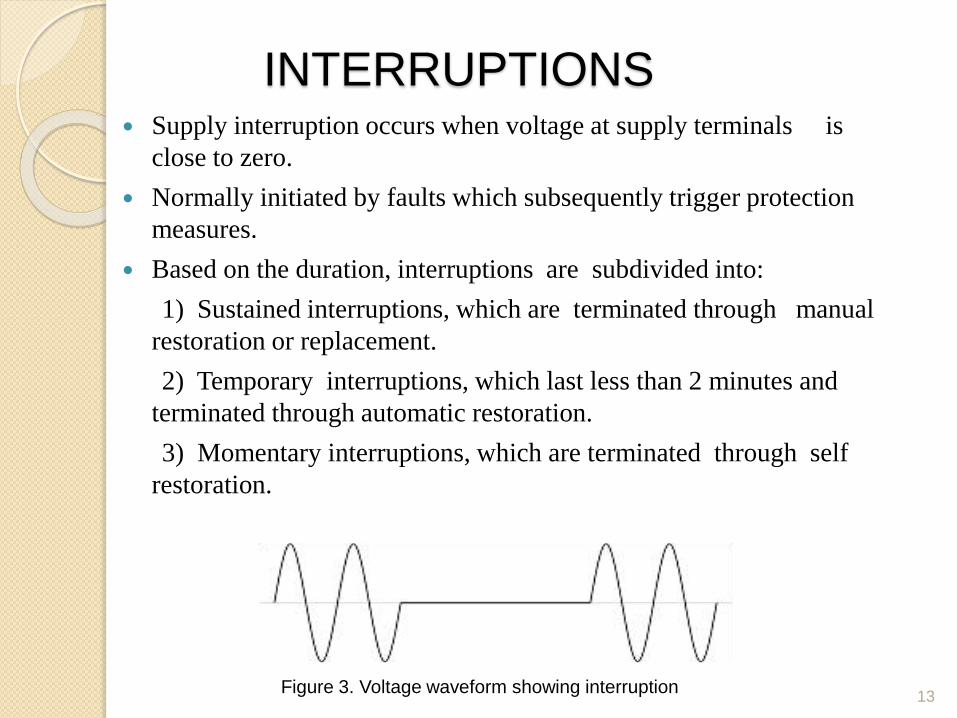
INTERRUPTIONS Supply interruption occurs when voltage at supply terminals is
close to zero.
Normally initiated by faults which subsequently trigger protection
measures.
Based on the duration, interruptions are subdivided into:
1) Sustained interruptions, which are terminated through manual
restoration or replacement.
2) Temporary interruptions, which last less than 2 minutes and
terminated through automatic restoration.
3) Momentary interruptions, which are terminated through self
restoration.
13Figure 3. Voltage waveform showing interruption
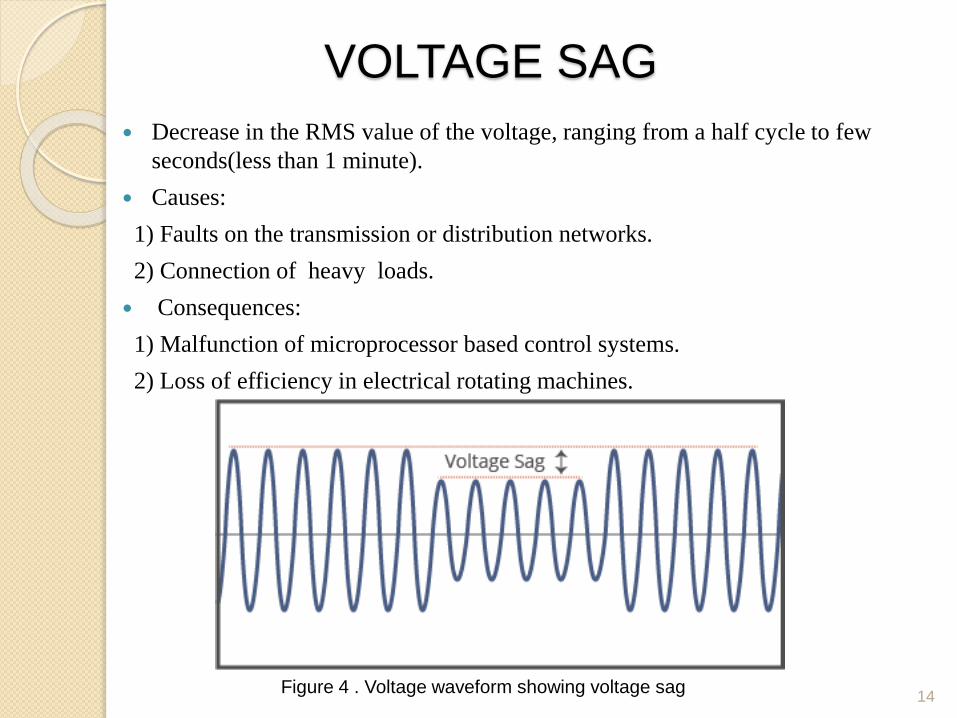
VOLTAGE SAG
Decrease in the RMS value of the voltage, ranging from a half cycle to few
seconds(less than 1 minute).
Causes:
1) Faults on the transmission or distribution networks.
2) Connection of heavy loads.
Consequences:
1) Malfunction of microprocessor based control systems.
2) Loss of efficiency in electrical rotating machines.
14Figure 4 . Voltage waveform showing voltage sag
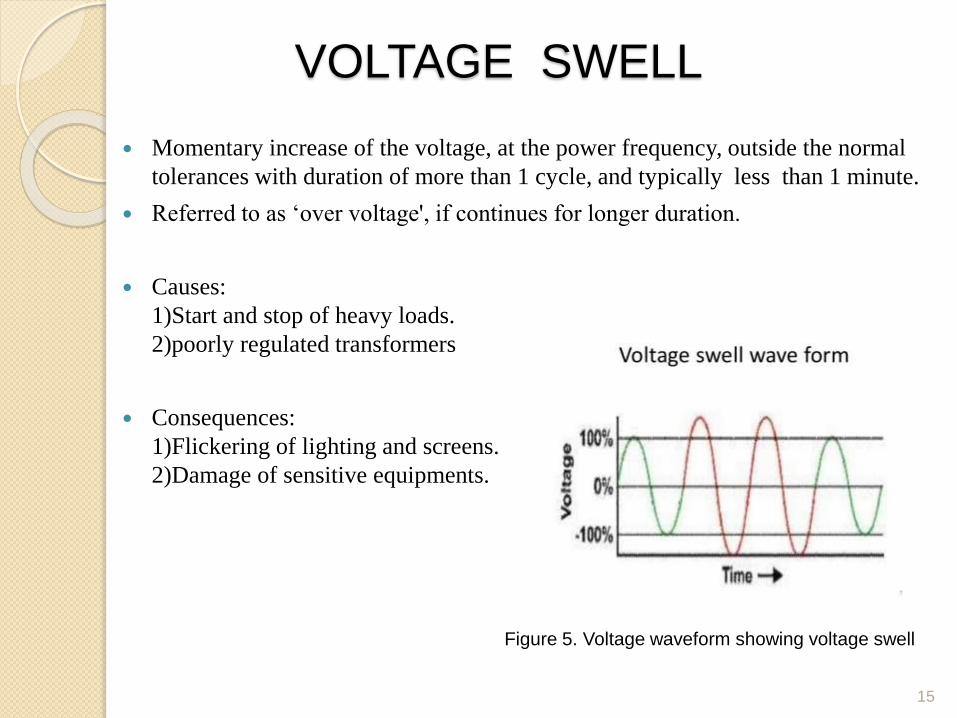
VOLTAGE SWELL
Momentary increase of the voltage, at the power frequency, outside the normal
tolerances with duration of more than 1 cycle, and typically less than 1 minute.
Referred to as ‘over voltage', if continues for longer duration.
Causes:
1)Start and stop of heavy loads.
2)poorly regulated transformers
Consequences:
1)Flickering of lighting and screens.
2)Damage of sensitive equipments.
15
Figure 5. Voltage waveform showing voltage swell
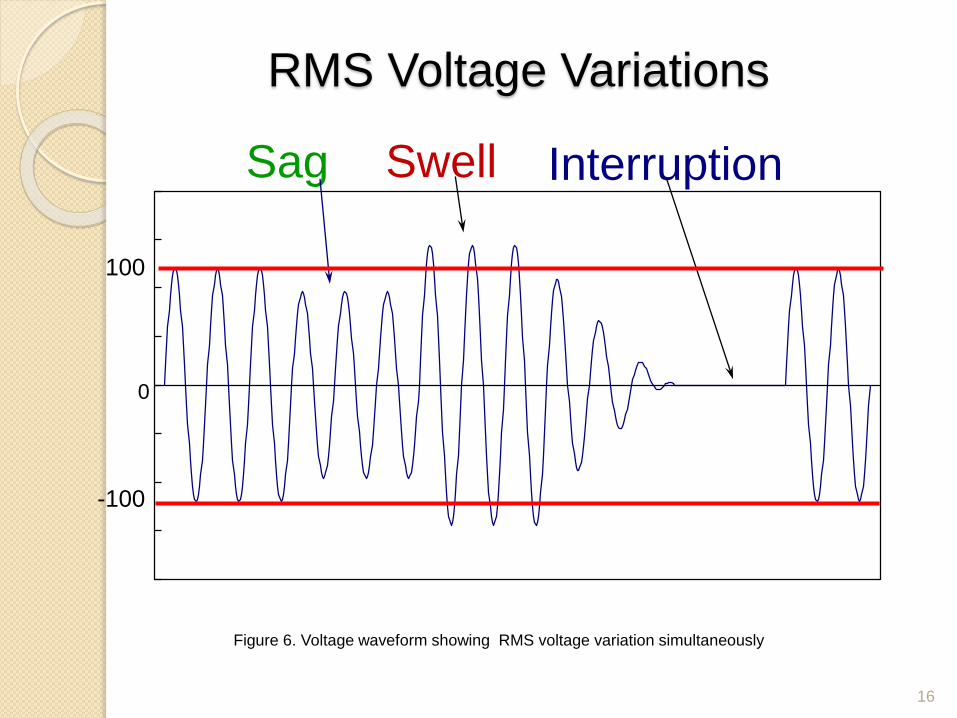
RMS Voltage Variations
0
Sag Swell Interruption
100
-100
Figure 6. Voltage waveform showing RMS voltage variation simultaneously
16
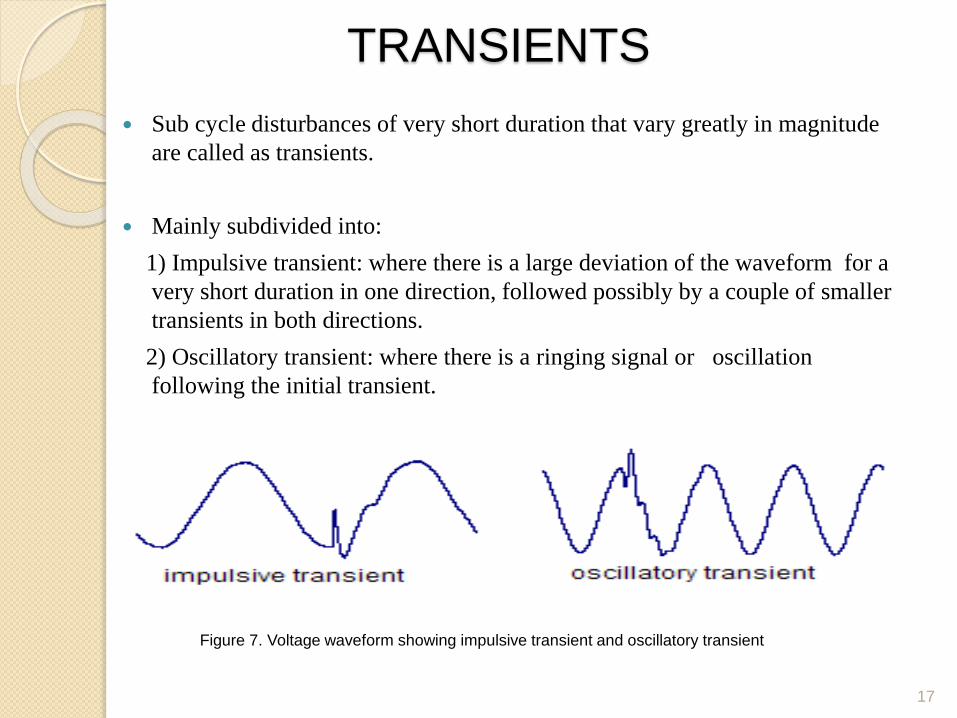
TRANSIENTS
Sub cycle disturbances of very short duration that vary greatly in magnitude
are called as transients.
Mainly subdivided into:
1) Impulsive transient: where there is a large deviation of the waveform for a
very short duration in one direction, followed possibly by a couple of smaller
transients in both directions.
2) Oscillatory transient: where there is a ringing signal or oscillation
following the initial transient.
17
Figure 7. Voltage waveform showing impulsive transient and oscillatory transient
18
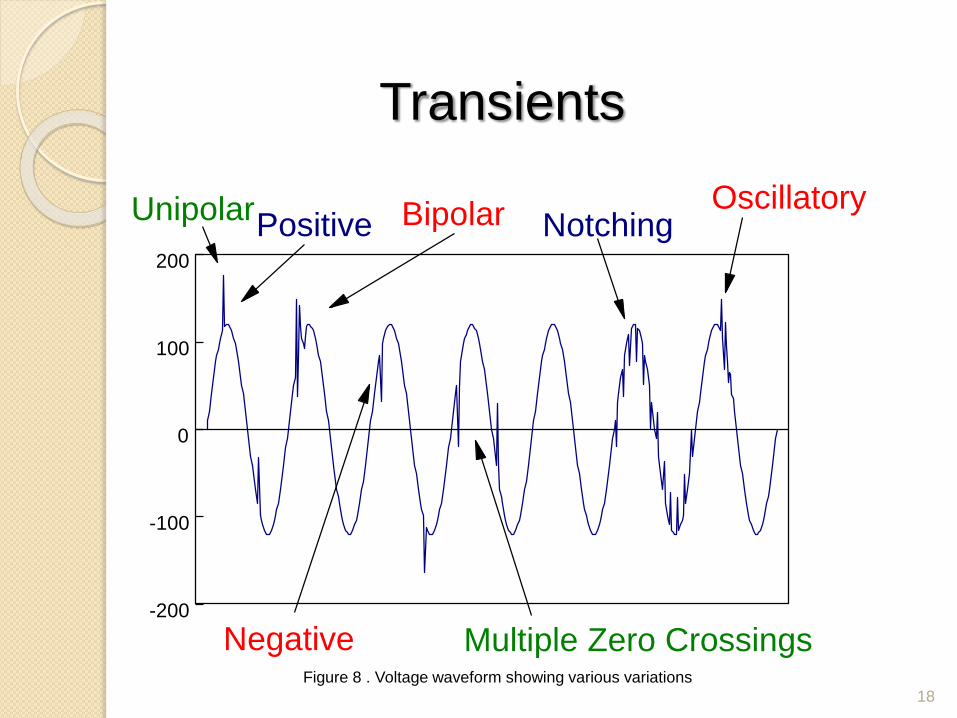
Transients
-200
-100
0
100
200
Positive
Negative
NotchingOscillatory
Multiple Zero Crossings
BipolarUnipolar
Figure 8 . Voltage waveform showing various variations
19
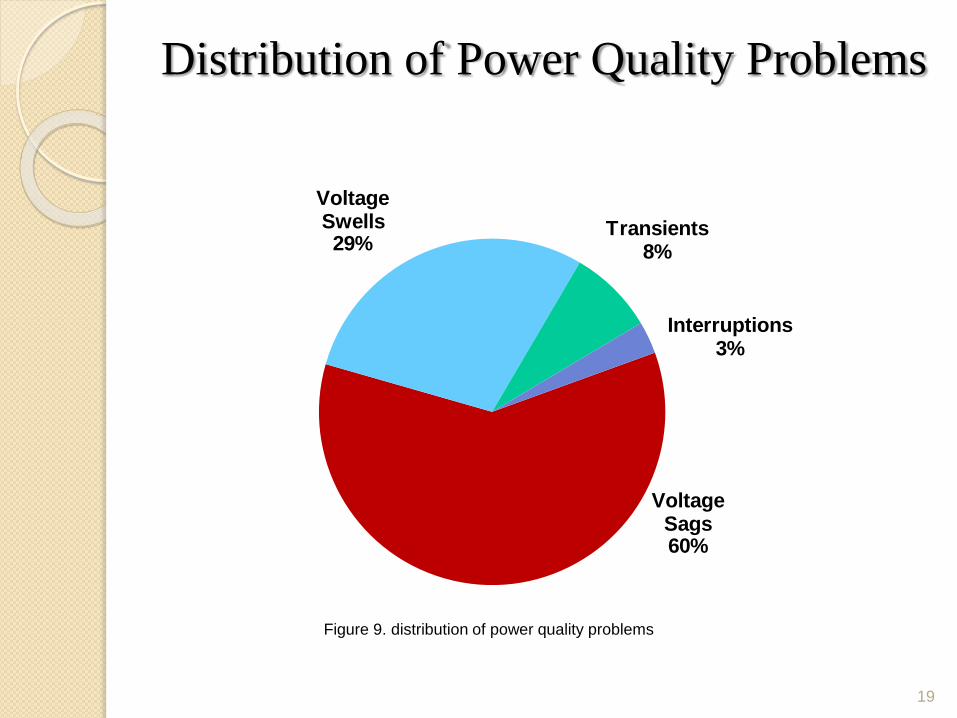
Distribution of Power Quality Problems
Voltage Sags60%
Voltage Swells29%
Transients8%
Interruptions3%
Figure 9. distribution of power quality problems
IMPACT OF POOR POWER QUALITY
The effect of poor power quality problems has serious implication on
the utilities and customers.
Higher losses in transformers, cables.
Energy meters will give faulty readings.
Solid state protective relays may damaged .
Speed drives may shut down.
Motor will increase core and cu losses
Non sinusoidal waveforms will reduce the efficiency of motors.
Electronic computer may loss data due to voltage variation .
Domestics TV and other equipments are affected by the poor quality.
20
POWER QUALITY MONITORING
It is a multi-pronged approach to identifying, analyzing and correcting
power quality problems.
Helps to identify the cause of power system disturbances.
Helps to identify problem conditions before they cause interruptions or
disturbances, in some cases.
Objectives for power quality monitoring are generally classified into:
◦ Proactive approach
Intended to characterize the system performance.
Helps to understand and thus match the system performance with
customer needs.
◦ Reactive approach
Intended to characterize a specific problem.
Performs short term monitoring at specific customers or at different
loads.
21
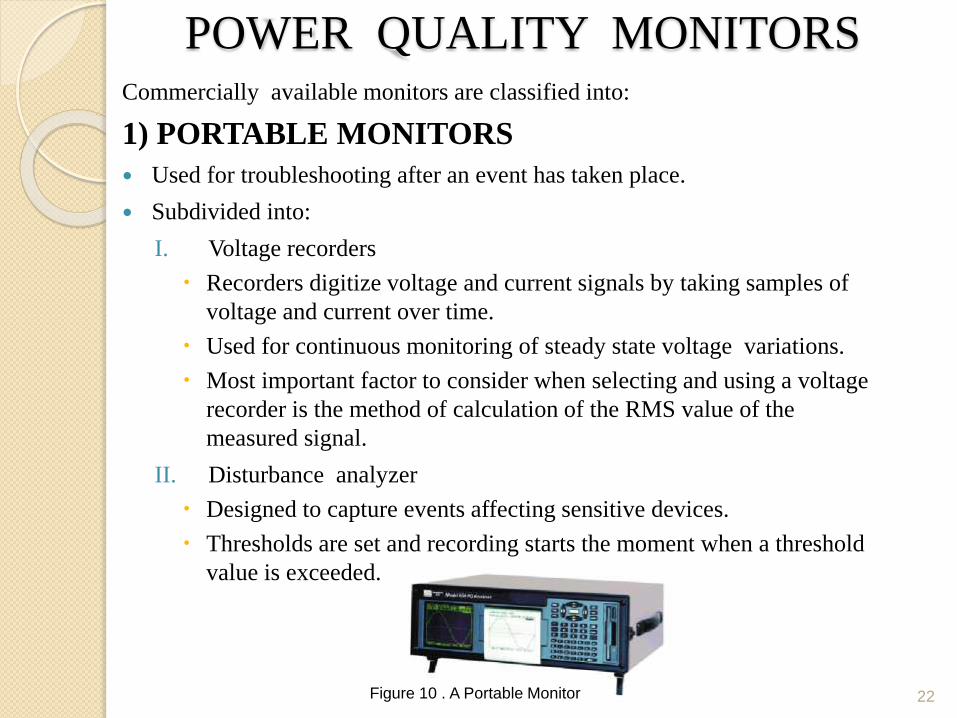
POWER QUALITY MONITORSCommercially available monitors are classified into:
1) PORTABLE MONITORS
Used for troubleshooting after an event has taken place.
Subdivided into:
I. Voltage recorders
Recorders digitize voltage and current signals by taking samples of
voltage and current over time.
Used for continuous monitoring of steady state voltage variations.
Most important factor to consider when selecting and using a voltage
recorder is the method of calculation of the RMS value of the
measured signal.
II. Disturbance analyzer
Designed to capture events affecting sensitive devices.
Thresholds are set and recording starts the moment when a threshold
value is exceeded.
22Figure 10 . A Portable Monitor
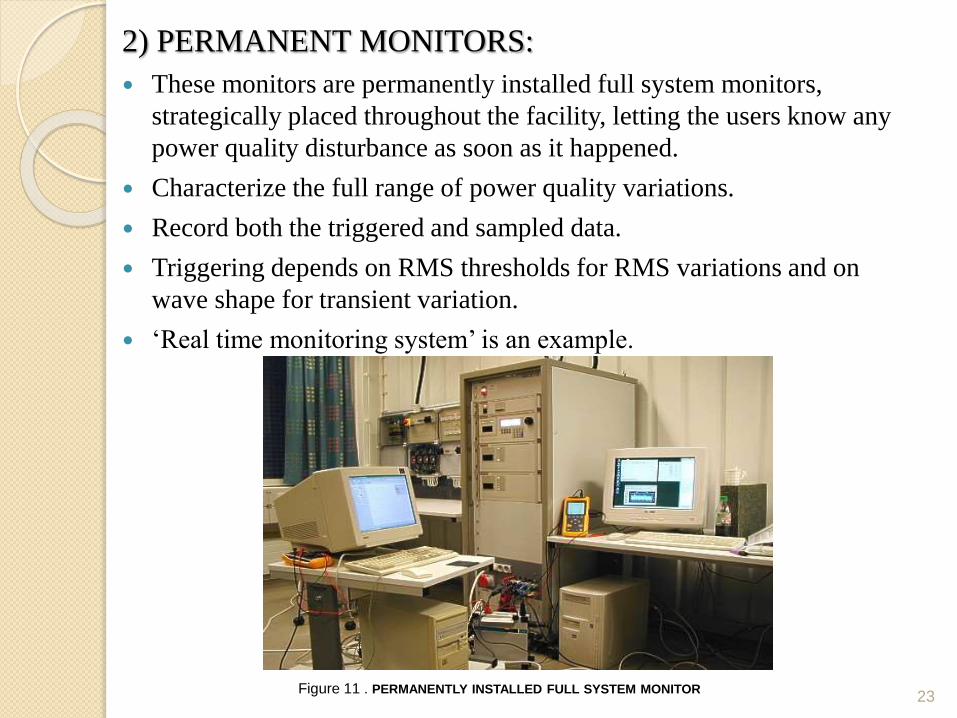
2) PERMANENT MONITORS:
These monitors are permanently installed full system monitors,
strategically placed throughout the facility, letting the users know any
power quality disturbance as soon as it happened.
Characterize the full range of power quality variations.
Record both the triggered and sampled data.
Triggering depends on RMS thresholds for RMS variations and on
wave shape for transient variation.
‘Real time monitoring system’ is an example.
23Figure 11 . PERMANENTLY INSTALLED FULL SYSTEM MONITOR
24
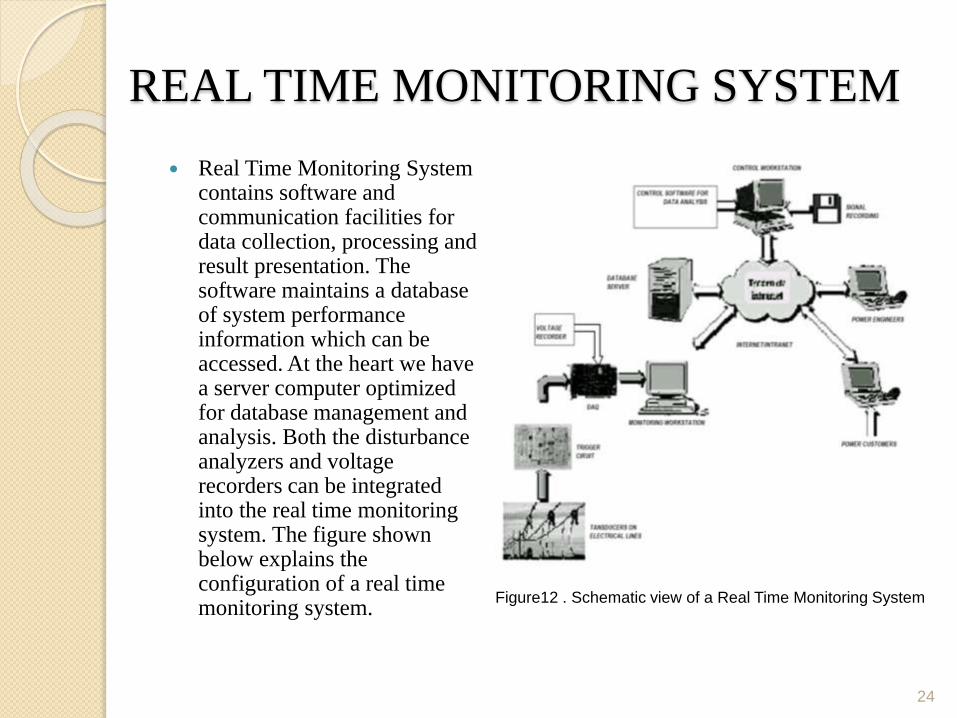
REAL TIME MONITORING SYSTEM
Real Time Monitoring System contains software and communication facilities for data collection, processing and result presentation. The software maintains a database of system performance information which can be accessed. At the heart we have a server computer optimized for database management and analysis. Both the disturbance analyzers and voltage recorders can be integrated into the real time monitoring system. The figure shown below explains the configuration of a real time monitoring system.
Figure12 . Schematic view of a Real Time Monitoring System
This permanent monitoring system has the following
components :-
1) Measurement instruments
Involves both the voltage recorder and disturbance analyzer.
Has a trigger circuit to detect events.
Includes a data acquisition board to acquire all the triggered and sampled data.
2) Monitoring workstation
Used to gather all information from the measuring instruments.
Periodically send information to a control workstation.
3) Control workstation
This station configures the parameters of measuring instruments.
Gathers and stores the data coming from the remote monitoring workstations.
Does the data analysis and export.
25
.4) Control software
This software drives the control workstation.
Does the analysis and processing of data.
Algorithms used for processing varies according to the system used.
Algorithms used may be based on wavelet transforms or expert systems or some other advanced technique.
5) Database server
Database management system should provide fast and concurrent access to many users without critical performance degradation.
Also, it should avoid any form of unauthorized access.
6) Communication channels
Selection of communication channel strongly depends on monitoring instruments, connectivity functions and on their physical locations.
Some of the possible channels are fixed telephone channels by using a modem and mobile communication system by using a GSM modem.
26
BENEFITS OF POWER QUALITY
MONITORING
Ensures power system reliability.
Identify the source and frequency of events.
Helps in the preventive and predictive maintenance.
Evaluation of incoming electrical supply and distribution to
determine if power quality disturbances are impacting.
Determine the need for mitigation equipments.
Reduction of energy expenses and risk avoidances.
Process improvements-monitoring systems allows to identify the
most sensitive equipments and install power conditioning systems
wherever necessary.
27
CONCLUSION
Electric power quality, which is a current interest to several power
utilities all over the world, is often severely affected by various
power quality disturbances like harmonics and transient
disturbances. Deterioration of power quality has always been a
leading cause of economic losses and damage of sensitive
equipments.
Various types of power quality disturbances are analyzed. Automatic
Power Quality Disturbance Classifiers are discussed in detail, along
with different classification approaches, with a case study. Power
Quality Monitoring systems and techniques are presented,
emphasizing the ‘real time monitoring systems'. Data analysis and
benefits of Power Quality Monitoring are also presented.
28

29
Recommended