14
M1
544
000
2
3/0
3/1
5
Precinct 15
Blackshaws Road
Altona North
Development / Structure Plan
Transport Assessment

© GTA Consultants (GTA Consultants (VIC) Pty Ltd) 2015
The information contained in this document is confidential and
intended solely for the use of the client for the purpose for which it has
been prepared and no representation is made or is to be implied as
being made to any third party. Use or copying of this document in
whole or in part without the written permission of GTA Consultants
constitutes an infringement of copyright. The intellectual property
contained in this document remains the property of GTA Consultants.
TIA
/RSA
MA
- V
IC (
)
Precinct 15
Blackshaws Road, Altona North
Development / Structure Plan Transport Assessment
Issue: C 23/03/15
Client: Precinct 15 Land Owners
Reference: 14M1544000
GTA Consultants Office: VIC
Quality Record
Issue Date Description Prepared By Checked By Approved By Signed
A-Dr 11/07/14 Draft Alex Blackett David Graham David Graham -
A 03/10/14 Final Alex Blackett David Graham David Graham David Graham
B 04/12/14 Revised Final Alex Blackett David Graham David Graham David Graham
C 23/03/15 Revised Final Alex Blackett David Graham David Graham
Table of Contents
14M1544000 23/03/15
Precinct 15, Blackshaws Road, Altona North Issue: C
Development / Structure Plan Transport Assessment
Table of Contents
1. Introduction 1
1.1 Background 1
1.2 Purpose of this Report 1
1.3 References 2
2. Transport Policy 3
2.1 Strategic Context 3
2.2 Plan Melbourne 3
2.3 SmartRoads Policy 3
2.4 Transport Integration Act 2010 4
2.5 State Planning Policy Framework (Clause 18 – Hobsons Bay Planning Scheme) 5
2.6 Local Planning Policy Framework (Clause 21.09 - Hobsons Bay Planning Scheme) 6
2.7 Strategic Studies 7
3. Existing Conditions 10
3.1 Subject Site 10
3.2 Road Network 11
3.3 Car Parking 20
3.4 Sustainable Transport Infrastructure 20
3.5 Surrounding Land Use Developments 24
4. Land Use Concept 26
4.1 Land Uses 26
4.2 Vehicle Access Approach 26
4.3 Public Transport Facilities 28
5. Existing Travel Characteristics 29
5.1 Preamble 29
5.2 Existing Mode Splits 29
5.3 Journey to Work 31
6. Traffic Impact Assessment 33
6.1 Assessment Context 33
6.2 Traffic Generation 34
6.3 Traffic Distribution 35
6.4 Other Developments 37
6.5 Post Development Analysis 38
6.6 Summary 45
7. Integrated Transport Infrastructure 46
7.1 Preamble 46
7.2 Walking and Cycling 46
7.3 Public Transport 48

Table of Contents
14M1544000 23/03/15
Precinct 15, Blackshaws Road, Altona North Issue: C
Development / Structure Plan Transport Assessment
7.4 Neighbourhood Street 48
8. Car Parking 52
8.1 Residential Dwellings 52
8.2 Apartments 52
8.3 Mixed Use Zone 52
9. Conclusion 53
Appendices
A: SIDRA INTERSECTION Results – Existing Conditions
B: SIDRA INTERSECTION Results – Post Development
C: SIDRA INTERSECTION Results – Access Intersections
Figures
Figure 2.1: VicRoads SmartRoads Network Operating Plan – City of Hobsons Bay 4
Figure 2.2: Hobsons Bay Integrated Transport Strategy – Proposed Bus Network
Improvements 7
Figure 2.3: Industrial Land Future Directions Map (June 2008) – City of Hobsons Bay 8
Figure 2.4: Hobsons Bay Strategic Bicycle Plan – Proposed Bicycle Network 9
Figure 3.1: Subject Site and its Environs 10
Figure 3.2: Land Zoning Map 11
Figure 3.3: Blackshaws Road (Adjacent to Site, looking east) 13
Figure 3.4: Blackshaws Road (Adjacent to Site, looking west) 13
Figure 3.5: New Street (Adjacent to Site) 13
Figure 3.6: Kyle Road (Adjacent to Site) 13
Figure 3.7: Existing AM Peak Hour Traffic Volumes 15
Figure 3.8: Existing PM Peak Hour Traffic Volumes 15
Figure 3.9: Casualty Accident History 20
Figure 3.10: Nearby Sustainable Transport Options 21
Figure 3.11: Existing Public Transport Services and Stops 22
Figure 3.12: PBN Routes (Purple Lines) 23
Figure 3.13: Nearby Development Sites 24
Figure 4.1: Land Use Plan 26
Figure 5.1: Existing Weekday Mode Split 29
Figure 5.2: Existing Weekend Mode Split 29
Figure 5.3: Proportion of Public Transport Trips 30
Figure 5.4: Proportion of Walking / Cycling Trips 30
Figure 5.5: Proportion of Car Trips (car as driver or passenger) 31
Figure 5.6: Trips Originating in Hobsons Bay 32
Figure 5.7: Trips Finishing in Hobsons Bay 32

Table of Contents
14M1544000 23/03/15
Precinct 15, Blackshaws Road, Altona North Issue: C
Development / Structure Plan Transport Assessment
Figure 6.1: AM Peak Hour Site Generated Traffic Volumes 36
Figure 6.2: PM Peak Hour Site Generated Traffic Volumes 37
Figure 6.3: AM Peak Hour Other Development Generated Traffic Volumes 38
Figure 6.4: PM Peak Hour Other Development Generated Traffic Volumes 38
Figure 6.5: Post-Development AM Peak Hour Traffic Volumes 39
Figure 6.6: Post-Development PM Peak Hour Traffic Volumes 39
Figure 7.1: Indicative Street Network Hierarchy 49
Tables
Table 3.1: Nominated Intersections – Existing Operating Conditions 17
Table 3.2: Casualty Accident History (1 July 2008 – 30 June 2013) 19
Table 3.3: Road Based Public Transport Provision 22
Table 4.1: Indicative Development Schedule 26
Table 6.1: Traffic Generation Estimates 34
Table 6.2: Estimated Traffic Distributions 36
Table 6.3: Directional Split of Traffic 36
Table 6.4: Traffic Generation Estimates 37
Table 6.5: Post-Development Intersection Operation 39
Table 6.6: Modified Millers Road / Blackshaws Road Intersection
–Post-Development Operation 42
Table 6.7: Proposed Access Intersections – Post-Development Operation 42
Table 6.8: Midblock Capacity Analysis 44
Table 7.1: Proposed Road Hierarchy Details 50

Introduction
14M1544000 23/03/15
Precinct 15, Blackshaws Road, Altona North Issue: C
Development / Structure Plan Transport Assessment Page: 1
1. Introduction
1.1 Background
Amendment C33 to the Hobsons Bay Planning Scheme was prepared in 2007 and approved on
23 December 2008. It forms part of a review of the Industrial Land Management Strategy and
Industrial Development Design Guidelines for a number of Strategic Redevelopment Areas where
rezoning from industrial use is likely to occur within the municipality.
One of these areas is Precinct 15, which is an irregularly shaped piece of land located in Altona
North and generally bound by Blackshaws Road to the south, New Street to the east, West Gate
Freeway to the north and Kyle Road to the west.
Approval is now being sought for a Development / Structure Plan to guide the development and
future use of Precinct 15. This is proposed to generally consist of its rezoning from and industrial use
to a predominately residential use. The proposed development is likely to incorporate 3,000
dwellings and a mixed use area, including the potential for a neighbourhood activity centre of up
to 5,550sqm of retail floor space.
GTA Consultants has been involved with the development of the Precinct 15 Development /
Structure Plan over a number of years, and most recently was commissioned on behalf of the
Precinct 15 land owners in June 2014 to provide traffic engineering and transport planning
services regarding the Development /Structure Plan.
1.2 Purpose of this Report
This report sets out an assessment of the anticipated traffic and transport implications of the
proposed rezoning and development of Precinct 15, including consideration of the:
i existing road network and traffic conditions surrounding the site
ii accessibility of the site by public and active transport modes
iii traffic generation characteristics of the proposed development
iv internal road hierarchy and proposed access arrangements for the site
v existing and future public transport facilities and provisions
vi existing and future bicycle and walking facilities and provisions
vii impact of the development proposal on the surrounding transport network.
The assessment also compares the development against the relevant sections of Clause 56 of the
Hobsons Bay Planning Scheme, which includes a number of provisions made up of objectives
and standards for implementation within the design of a new subdivision. The Clause states the
following in respect to objectives and standards:
“Objectives. An objective describes the desired outcome to be achieved in the
completed subdivision.
Standards. A standard contains the requirements to meet the objective.
A standard should normally be met. However, if the responsible authority is satisfied that an
application for an alternative design solution meets the objective, the alternative design solution
may be considered.”
The relevant traffic and access areas of Clause 56 that will be considered within this report are
included within the following sub clauses:
Clause 56.01 – Subdivision site and Context Description and Design Response

Introduction
14M1544000 23/03/15
Precinct 15, Blackshaws Road, Altona North Issue: C
Development / Structure Plan Transport Assessment Page: 2
Clause 56.06 – Access and Mobility Management.
It is noted that some areas of Clause 56.01 and 56.06 are not within the realms of the expertise of
traffic engineers or possible to be considered at the planning stage of the development and
therefore would be assessed by the relevant consultants at the appropriate time.
It is important to emphasise that as a Development Plan is being sought in the first instance, the
nominated development uses and associated access strategy for the site are still being
considered and are subject to change. Accordingly, the analysis contained in this document is
directed at assisting the Responsible Authority in identifying key traffic development parameters,
rather than involving a comprehensive analysis of a specific design which is likely to change as
development details are subsequently refined.
Nevertheless, it is anticipated that the various traffic issues which have been investigated and are
documented in this report will provide necessary technical information to assist with the further
assessment of the site.
1.3 References
In preparing this report, a number of references have been made, including:
Hobsons Bay Planning Scheme
Concept plans for the proposed draft Development Plan prepared by Tract
traffic and car parking surveys undertaken by GTA Consultants as referenced in the
context of this report
Community Information Session on Monday 2 July 2012 at the Paxton Street Community
Centre, South Kingsville
‘Without Prejudice comments on GTA Structure Plan assessment (Draft)’ issued by
Hobsons Bay City Council, dated 24/08/12
reports prepared by GTA Consultants for the Precinct 15 / Caltex site
various technical data as referenced in this report
an inspection of the site and its surrounds
other documents as nominated.

Transport Policy
14M1544000 23/03/15
Precinct 15, Blackshaws Road, Altona North Issue: C
Development / Structure Plan Transport Assessment Page: 3
2. Transport Policy
2.1 Strategic Context
There are a number of key State Government policy documents applicable to the subject land
which provides guidance on appropriate land use and development. Those that are relevant in
the context of transport planning are as follows:
Plan Melbourne
SmartRoads Policy
Transport Integration Act (2010)
These documents along with a number of relevant policies and strategic studies are discussed
below.
2.2 Plan Melbourne
The Victorian Government released the Metropolitan Planning Strategy, Plan Melbourne (The
Plan) on 20 May 2014. The Plan is intended to guide Melbourne’s housing, commercial and
industrial development through to 2050.
The Plan includes the following key concepts to cater for the anticipated population growth:
i delivering a new ‘integrated economic triangle’, connecting key employment clusters,
industrial precincts and economic gateways
ii protecting the suburbs by delivering density in defined locations
iii strengthening regional cities – distributing future growth to benefit all of Victoria
(regional projects)
iv delivering a pipeline of large scale, city shaping infrastructure and urban renewal
projects
v better use of existing assets, including increasing efficiency of road based transport and
transport – land use integration
vi 20 minute neighbourhoods - places where people have access to local shops, schools,
parks, jobs and a range of community services within 20 minutes of their home.
The Plan is underpinned by seven objectives and a range of supporting actions. The delivery of
the Plan will be a central focus for the new Metropolitan Planning Authority, which was created in
October 2013 alongside the release of the draft Plan Melbourne strategy.
The Plan identifies Altona North as an Activity Centre, which is located approximately 800m west
of the site. As such, the subject site is already located proximate to a range of employment and
services. This arrangement supports more efficient use of existing infrastructure and mode shift
away from private vehicle use.
2.3 SmartRoads Policy
SmartRoads is a VicRoads policy which sets ‘modal’ priorities on the road network and underpins
many of the strategies significant to the Victorian Transport Plan surrounding the issue of public
transport prioritisation.
“SmartRoads is an approach that manages competing interests for limited road space by giving
priority use of the road to different transport modes at particular times of the day.”

Transport Policy
14M1544000 23/03/15
Precinct 15, Blackshaws Road, Altona North Issue: C
Development / Structure Plan Transport Assessment Page: 4
All road users will continue to have access to all roads. However, certain routes will be managed
to work better for cars while others will be managed for public transport, cyclists and
pedestrians.”1
The VicRoads SmartRoads Network Operating Plan for the area surrounding the subject site has
been reproduced in Figure 2.1.
Figure 2.1: VicRoads SmartRoads Network Operating Plan – City of Hobsons Bay
Source: VicRoads Website (September 2014)
Figure 2.1 illustrates that Blackshaws Road, Millers Road and Melbourne Road (Williamstown Road)
in the vicinity of the subject site are nominated as Other Traffic/Bus Priority routes, while the West
Gate Freeway is nominated as a Preferred Traffic Route.
Based on VicRoads’ website (September 2014), road use priority routes (for buses and trams)
have been identified to ensure:
“Prioritise trams and buses on key public transport routes that link activity centres during morning
and afternoon peak periods.”
2.4 Transport Integration Act 2010
The Transport Integration Act is the primary transport statute for Victoria, and has caused
significant change to the way transport and land use authorities make decisions and work
together. The Act enshrines a triple bottom line approach to decision making about transport
and land use.
The Act requires that all transport agencies work together to achieve an integrated and
sustainable transport system, and that land use agencies such as the Department of Economic
1 Sourced from VicRoads
Subject Site
Transport Policy
14M1544000 23/03/15
Precinct 15, Blackshaws Road, Altona North Issue: C
Development / Structure Plan Transport Assessment Page: 5
Development, Jobs, Transport and Resources (DEDLTR) take account of transport issues in land
use decisions. The Act has been effective to date in changing the focus of organisations that
traditionally only considered a single transport mode.
The Act:
unifies all elements of the transport portfolio to ensure that transport agencies work
together towards the common goal of an integrated transport system
provides a framework for integrated and sustainable transport policy and operations
recognises that the transport system should be conceived and planned as a single
system performing multiple tasks rather than separate transport modes
integrates land use and transport planning and decision-making by extending the
framework to land use agencies whose decisions can significantly impact on transport
("interface bodies")
re-constitutes transport agencies and aligns their charters to make them consistent with
the framework.
The Transport Integration Act forms an overarching legislative framework for transport related
state planning policies and has been integrated within Clause 18 of the Victorian Planning
Provisions.
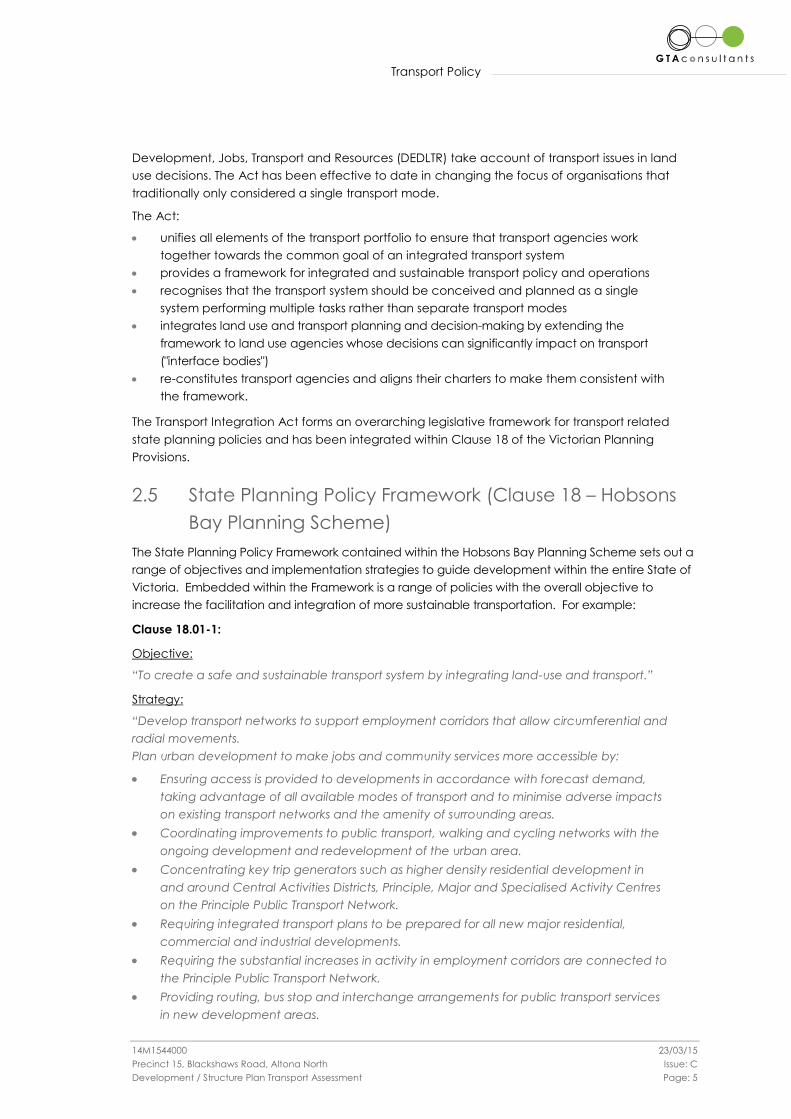
2.5 State Planning Policy Framework (Clause 18 – Hobsons
Bay Planning Scheme)
The State Planning Policy Framework contained within the Hobsons Bay Planning Scheme sets out a
range of objectives and implementation strategies to guide development within the entire State of
Victoria. Embedded within the Framework is a range of policies with the overall objective to
increase the facilitation and integration of more sustainable transportation. For example:
Clause 18.01-1:
Objective:
“To create a safe and sustainable transport system by integrating land-use and transport.”
Strategy:
“Develop transport networks to support employment corridors that allow circumferential and
radial movements.
Plan urban development to make jobs and community services more accessible by:
Ensuring access is provided to developments in accordance with forecast demand,
taking advantage of all available modes of transport and to minimise adverse impacts
on existing transport networks and the amenity of surrounding areas.
Coordinating improvements to public transport, walking and cycling networks with the
ongoing development and redevelopment of the urban area.
Concentrating key trip generators such as higher density residential development in
and around Central Activities Districts, Principle, Major and Specialised Activity Centres
on the Principle Public Transport Network.
Requiring integrated transport plans to be prepared for all new major residential,
commercial and industrial developments.
Requiring the substantial increases in activity in employment corridors are connected to
the Principle Public Transport Network.
Providing routing, bus stop and interchange arrangements for public transport services
in new development areas.

Transport Policy
14M1544000 23/03/15
Precinct 15, Blackshaws Road, Altona North Issue: C
Development / Structure Plan Transport Assessment Page: 6
Providing safe, convenient and direct pedestrian and cycling access to activity
centres, public transport interchanges and other strategic redevelopment sites.
Integrate public transport services and infrastructure into new development.”
Clause 18.02-1:
Objective:
“To promote the use of sustainable personal transport.”
Strategy:
“Encourage the use of walking and cycling by creating environments that are safe and
attractive.
Develop high quality pedestrian environments that are accessible to footpath-bound vehicles
such as wheelchairs, prams and scooters.
Ensure development provides opportunities to create more sustainable transport options such as
walking, cycling and public transport.
Ensure cycling routes and infrastructure are constructed early in new developments.”
The proposed redevelopment of Precinct 15 represents a prime opportunity to promote the
visions of State Planning Policy, by encouraging mixed use development and the use of more
sustainable forms of transport through the provision of suitable facilities within the site, such as
sealed footpaths, shared paths and dedicated bicycle paths adjacent to the roads and through
the open space areas. These facilities can be expected to be integrated with the existing active
transport facilities and public transport services in the area through the following connections:
Signalised pedestrian crossing facilities at the signalised intersections along Blackshaws
Road.
Shared path to the Federation Trail along Brunel Street and The Avenue, with there
being a potential alternate more direct connection being considered via a pedestrian
bridge over the railway at the northeast corner of the site.
Shared path to Birmingham Street, as outlined in the Bay Strategic Bicycle Plan, to
accommodate an off-road facility that will connect with the Spotswood Train Station.
Also, the potential for public transport bus services to travel through the site is being provided via
the connector level road network should PTV chose to do so.
2.6 Local Planning Policy Framework (Clause 21.09 -
Hobsons Bay Planning Scheme)
The Local Planning Policy Framework contained within the Hobsons Bay Planning Scheme sets out
a range of objectives and implementation strategies to guide development with a more local
focus within Hobsons Bay.
Clause 21.09 of the Hobsons Bay Planning Scheme sets out a range of objectives and
implementation strategies to guide development within Hobsons Bay.
The Clause sets out a number of Transport and Mobility objectives, as follows:
“To provide access to, through and within the municipality by all modes of transport,
including waling, cycling, public transport and private and commercial vehicles.
To protect residential and other sensitive land uses from the adverse effects of vehicular
traffic.
To support increased use of public transport and an efficient network.”
Transport Policy
14M1544000 23/03/15
Precinct 15, Blackshaws Road, Altona North Issue: C
Development / Structure Plan Transport Assessment Page: 7
Again, and as outlined above, Precinct 15 represents a prime opportunity to promote the visions
of Local Planning Policy, by encouraging mixed use development and the use of more
sustainable forms of transport through the provision of suitable facilities within the site, and
integrating with the existing active transport facilities and public transport services in the area.
2.7 Strategic Studies
In addition to the policy documents outlined above, a number of strategic studies have been
prepared by or on behalf of Hobsons Bay City Council and other relevant authorities over recent
years. The studies which have direct relevance to Precinct 15 are discussed further as follows.
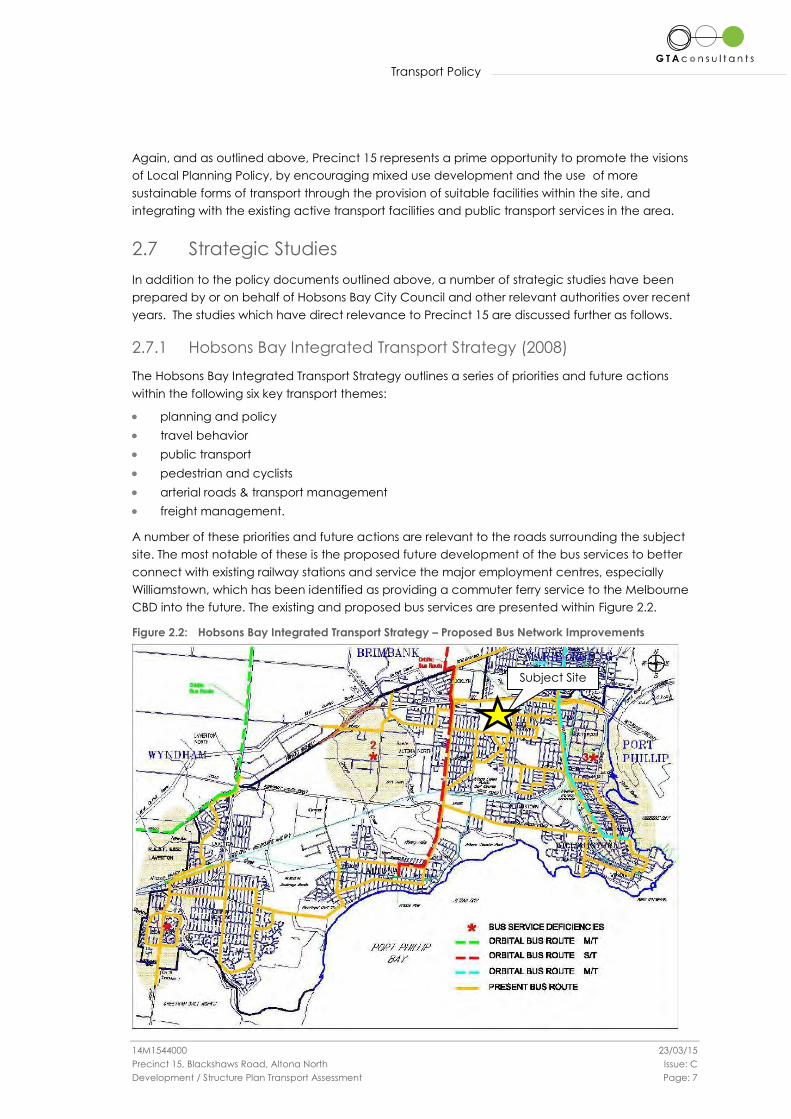
2.7.1 Hobsons Bay Integrated Transport Strategy (2008)
The Hobsons Bay Integrated Transport Strategy outlines a series of priorities and future actions
within the following six key transport themes:
planning and policy
travel behavior
public transport
pedestrian and cyclists
arterial roads & transport management
freight management.
A number of these priorities and future actions are relevant to the roads surrounding the subject
site. The most notable of these is the proposed future development of the bus services to better
connect with existing railway stations and service the major employment centres, especially
Williamstown, which has been identified as providing a commuter ferry service to the Melbourne
CBD into the future. The existing and proposed bus services are presented within Figure 2.2.
Figure 2.2: Hobsons Bay Integrated Transport Strategy – Proposed Bus Network Improvements
Subject Site

Transport Policy
14M1544000 23/03/15
Precinct 15, Blackshaws Road, Altona North Issue: C
Development / Structure Plan Transport Assessment Page: 8
2.7.2 Hobsons Bay Industrial Land Management Strategy (2008)
This document aims to provide a clear direction in relation to the future use and development of
industrial land in Hobson Bay over the next 15 years and to set the foundation for continued
development beyond that point.
The Industrial Land Management Strategy 2008 states that:
“Hobson Bay currently has 1,782 hectares of land zoned for the purpose of industry, which
accounts for approximately one third of all of the land in Hobson Bay.”
Figure 2.3 shows the location of the subject site within the Industrial Land Future Directions Map
(June 2008), relative to the Hobson Bay Growth Area.
Figure 2.3: Industrial Land Future Directions Map (June 2008) – City of Hobsons Bay
2.7.3 Hobsons Bay Strategic Bicycle Plan (2003)
The Hobsons Bay Strategic Bicycle Plan includes an Action Plan that details and sets out
recommended projects in terms of their location, whether it will be part of the Principal Bicycle
Network (PBN), cost estimates and funding source.
A number of the items proposed within the Action Plan are relevant to the roads surrounding the
subject site. The proposed facilities on these surrounding roads are presented within Figure 2.4.
Subject Site

Transport Policy
14M1544000 23/03/15
Precinct 15, Blackshaws Road, Altona North Issue: C
Development / Structure Plan Transport Assessment Page: 9
Figure 2.4: Hobsons Bay Strategic Bicycle Plan – Proposed Bicycle Network
Source: Hobsons Bay Strategic Bicycle Plan, 2003
Subject Site

Existing Conditions
14M1544000 23/03/15
Precinct 15, Blackshaws Road, Altona North Issue: C
Development / Structure Plan Transport Assessment Page: 10
3. Existing Conditions
3.1 Subject Site
The subject site is located in Altona North and generally bound by Blackshaws Road to the south,
New Street to the east, West Gate Freeway to the north and Kyle Road to the west. The site of
approximately 67ha is irregular in shape and has frontages of 850m to Blackshaws Road, 640m to
Kyle Road, 360m to West Gate Freeway, 190m to the freight rail line, 130m to Watson Street and
810m to New Street.
In addition, there is a separate rectangular section of the site located to the west, north of
Clematis Avenue, which is approximately 4,430sqm and has a frontage of 35m to Kyle Road.
The site currently consists of a mix of large and small lots under a variety of ownerships, and is
contained within Industrial 1 and 3 Zones (IN1Z & IN3Z). There is an SP Power substation located to
the northwest of the site, with the surrounding land uses generally consisting of residential uses to
the east, south and west, and industrial land uses to the north.
The location of the subject site and the surrounding environs is shown in Figure 3.1, and the land
zoning is shown in Figure 3.2.
Figure 3.1: Subject Site and its Environs
(Reproduced with Permission from Melway Publishing Pty Ltd September 2014)
Subject Site

Existing Conditions
14M1544000 23/03/15
Precinct 15, Blackshaws Road, Altona North Issue: C
Development / Structure Plan Transport Assessment Page: 11
Figure 3.2: Land Zoning Map
(Reproduced from Land Channel web site September 2014)
3.2 Road Network
3.2.1 Surrounding Roads
West Gate Freeway
West Gate Freeway is a key link in Melbourne’s road network both commercially and for private
use. It is the major connection between the western suburbs and the Melbourne CBD, with
connections to other major roads such as the Monash Freeway to the east, Princes Freeway to
the West and CityLink to the north.
In the vicinity of the subject site, the West Gate Freeway functions as a freeway and is located
within a Road Zone 1 in the Hobsons Bay Planning Scheme. It is a two-way road aligned in an
east-west direction and configured with divided four-lane, 20 metre wide carriageways in each
direction, set within a 63 metre wide road reserve (approx.).
The Williamstown Road / Melbourne Road and Millers Road interchanges are closest to the
subject site, located 1.3km to the northeast and 900m northwest respectively. Sound walls have
been constructed along the length of the Freeway although they are not continuous along the
Precinct frontage.
Subject Site
Existing Conditions
14M1544000 23/03/15
Precinct 15, Blackshaws Road, Altona North Issue: C
Development / Structure Plan Transport Assessment Page: 12
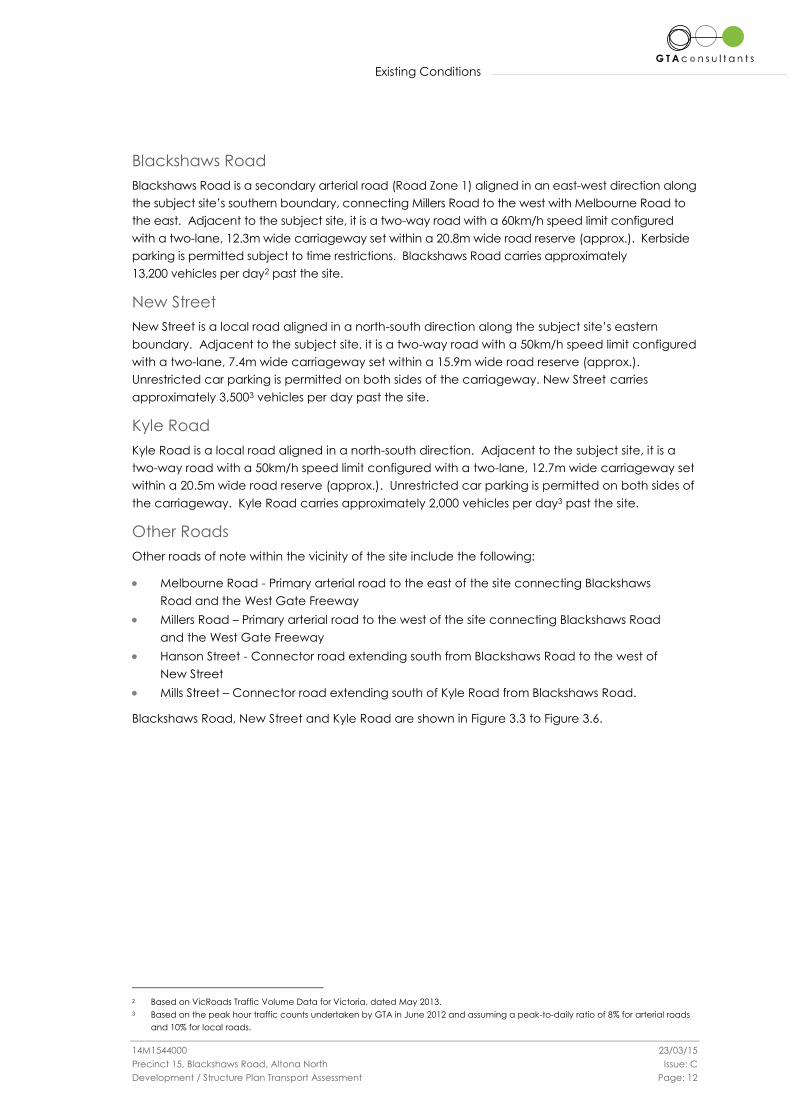
Blackshaws Road
Blackshaws Road is a secondary arterial road (Road Zone 1) aligned in an east-west direction along
the subject site’s southern boundary, connecting Millers Road to the west with Melbourne Road to
the east. Adjacent to the subject site, it is a two-way road with a 60km/h speed limit configured
with a two-lane, 12.3m wide carriageway set within a 20.8m wide road reserve (approx.). Kerbside
parking is permitted subject to time restrictions. Blackshaws Road carries approximately
13,200 vehicles per day2 past the site.
New Street
New Street is a local road aligned in a north-south direction along the subject site’s eastern
boundary. Adjacent to the subject site, it is a two-way road with a 50km/h speed limit configured
with a two-lane, 7.4m wide carriageway set within a 15.9m wide road reserve (approx.).
Unrestricted car parking is permitted on both sides of the carriageway. New Street carries
approximately 3,5003 vehicles per day past the site.
Kyle Road
Kyle Road is a local road aligned in a north-south direction. Adjacent to the subject site, it is a
two-way road with a 50km/h speed limit configured with a two-lane, 12.7m wide carriageway set
within a 20.5m wide road reserve (approx.). Unrestricted car parking is permitted on both sides of
the carriageway. Kyle Road carries approximately 2,000 vehicles per day3 past the site.
Other Roads
Other roads of note within the vicinity of the site include the following:
Melbourne Road - Primary arterial road to the east of the site connecting Blackshaws
Road and the West Gate Freeway
Millers Road – Primary arterial road to the west of the site connecting Blackshaws Road
and the West Gate Freeway
Hanson Street - Connector road extending south from Blackshaws Road to the west of
New Street
Mills Street – Connector road extending south of Kyle Road from Blackshaws Road.
Blackshaws Road, New Street and Kyle Road are shown in Figure 3.3 to Figure 3.6.
2 Based on VicRoads Traffic Volume Data for Victoria, dated May 2013.
3 Based on the peak hour traffic counts undertaken by GTA in June 2012 and assuming a peak-to-daily ratio of 8% for arterial roads
and 10% for local roads.

Existing Conditions
14M1544000 23/03/15
Precinct 15, Blackshaws Road, Altona North Issue: C
Development / Structure Plan Transport Assessment Page: 13
Figure 3.3: Blackshaws Road
(Adjacent to Site, looking east)
Figure 3.4: Blackshaws Road
(Adjacent to Site, looking west)
Figure 3.5: New Street (Adjacent to Site) Figure 3.6: Kyle Road (Adjacent to Site)
3.2.2 Surrounding Intersections
The following intersections exist along the frontage of the site:
New Street / Watson Street (unsignalised T-intersection)
New Street / Brunel Street (unsignalised T-intersection)
New Street / Aloha Street (unsignalised T-intersection)
Blackshaws Road / New Street (unsignalised T-intersection)
Blackshaws Road / Hansen Street (unsignalised T-intersection)
Blackshaws Road / The Broadway (unsignalised T-intersection)
Blackshaws Road / Macdonald Avenue (unsignalised T-intersection)
Blackshaws Road / Angus Avenue (unsignalised T-intersection)
Blackshaws Road / Mills Street / Kyle Road (signalised X-intersection)
Kyle Road / Cyclamen Avenue (unsignalised T-intersection)
Kyle Road / Marigold Avenue (unsignalised T-intersection)
Kyle Road / Clematis Avenue (unsignalised T-intersection).
The following other intersections of note generally connect the site to the surrounding arterial
road network:
Melbourne Road / The Avenue (signalised X-intersection)
Melbourne Road / Hudsons Road (signalised X-intersection)
Melbourne Road / Blackshaws Road (unsignalised T-intersection)

Existing Conditions
14M1544000 23/03/15
Precinct 15, Blackshaws Road, Altona North Issue: C
Development / Structure Plan Transport Assessment Page: 14
Melbourne Road / Ross Street (unsignalised T-intersection)
Millers Road / Marigold Avenue / Dousa Road (signalised X-intersection)
Blackshaws Road / Schutt Street (unsignalised T-intersection)
Millers Road / Blackshaws Road (signalised X-intersection)
Millers Road / Marigold Avenue / Duosa Road (signalised X-intersection).
3.2.3 Traffic Volumes
GTA Consultants sourced VicRoads SCATS data for the Millers Road / Blackshaws Road
intersection for the week commencing 21 May 2012. Subsequent surveys of left-turn slip lane
movements were undertaken 5 June 2012 to determine their relative ratio to through movements,
given that there are no detectors to record them. Also, phasing data and queue lengths were
recorded during the PM peak hour on 17 July 2012 and the AM peak hour on 18 July 2012.
Similarly, GTA Consultants sourced VicRoads SCATS data for the following intersections for the
week commencing 24 October 2012:
Melbourne Road / The Avenue (signalised X-intersection)
Melbourne Road / Hudsons Road (signalised X-intersection)
Millers Road / Marigold Avenue / Dousa Road (signalised X-intersection).
Phasing data and queue lengths were recorded during the AM and PM peak hours on 6
December 2012. Also, surveys of left-turn slip lane movements were undertaken on 17 December
2012 to determine their relative ratio to through movements, given that there are no detectors to
record them.
Traffic movement counts were undertaken by GTA at the following intersections between 7:30am
– 9:30am and 4:00pm - 6:00pm on Tuesday 20 March 2012:
Blackshaws Road / Schutt Street
Melbourne Road / Blackshaws Road
Melbourne Road / Ross Street.
Traffic movement counts were also undertaken by GTA between 7:30am – 9:30am and 4:00pm -
6:00pm on Tuesday 5 June 2012 for the below three intersections:
Blackshaws Road / Mills Street / Kyle Road
Blackshaws Road / Hansen Street
Blackshaws Road / New Street.
It is unlikely that current 2014 traffic volumes would be notably different to the surveyed 2012
volumes and therefore the traffic data is still considered to be current and reliable.
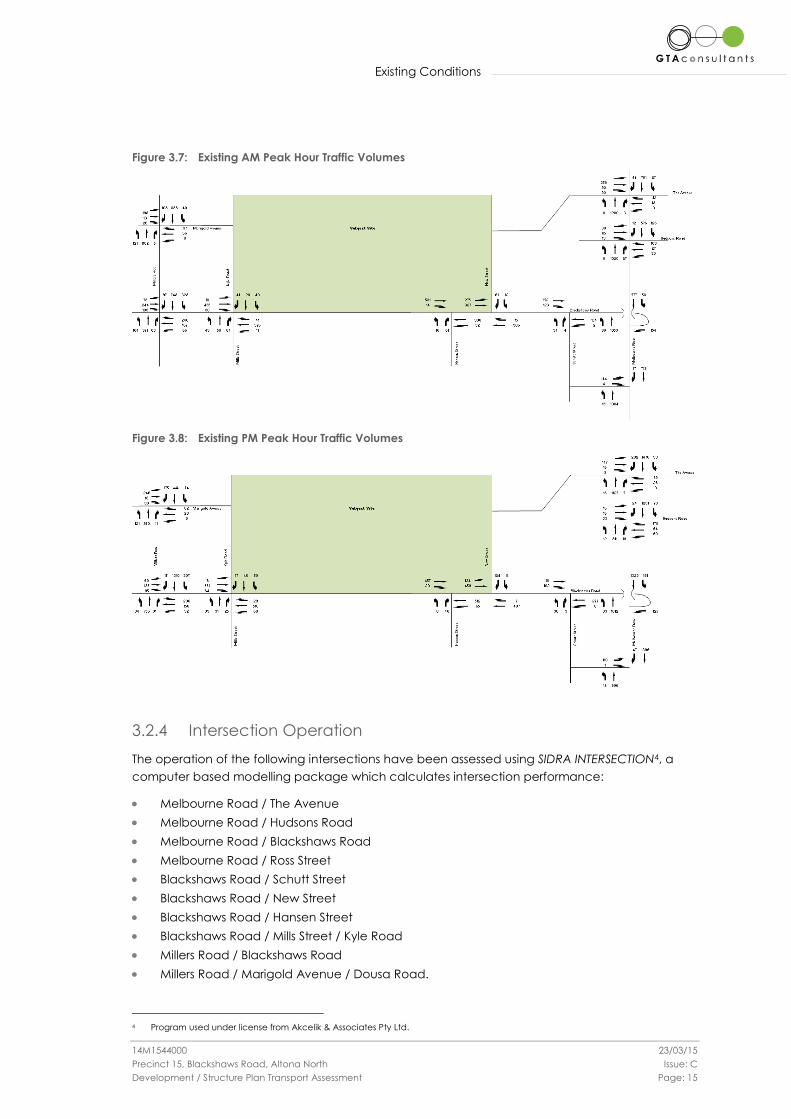
From the above, the existing AM and PM peak hour traffic volumes of key intersections in the vicinity
of the site are shown in Figure 3.7 and Figure 3.8, respectively.
Existing Conditions
14M1544000 23/03/15
Precinct 15, Blackshaws Road, Altona North Issue: C
Development / Structure Plan Transport Assessment Page: 15
Figure 3.7: Existing AM Peak Hour Traffic Volumes
Figure 3.8: Existing PM Peak Hour Traffic Volumes
3.2.4 Intersection Operation
The operation of the following intersections have been assessed using SIDRA INTERSECTION4, a
computer based modelling package which calculates intersection performance:
Melbourne Road / The Avenue
Melbourne Road / Hudsons Road
Melbourne Road / Blackshaws Road
Melbourne Road / Ross Street
Blackshaws Road / Schutt Street
Blackshaws Road / New Street
Blackshaws Road / Hansen Street
Blackshaws Road / Mills Street / Kyle Road
Millers Road / Blackshaws Road
Millers Road / Marigold Avenue / Dousa Road.
4 Program used under license from Akcelik & Associates Pty Ltd.
Existing Conditions
14M1544000 23/03/15
Precinct 15, Blackshaws Road, Altona North Issue: C
Development / Structure Plan Transport Assessment Page: 16
The commonly used measure of intersection performance is referred to as the Degree of
Saturation (DOS). The DOS represents the flow-to-capacity ratio for the most critical movement
on each leg of the intersection. For signalised and unsignalised intersections, a DOS of around
0.95 and 0.90 respectively, has been typically considered the practical limit, beyond which
queues and delays increase disproportionately5.
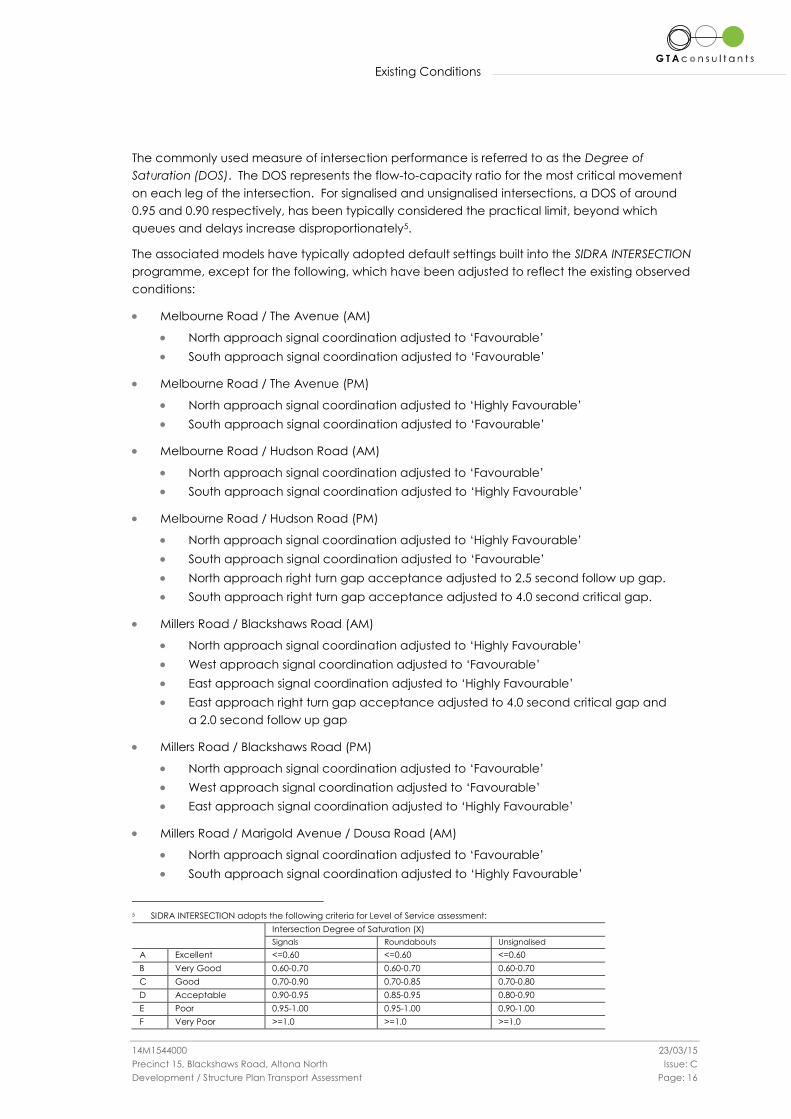
The associated models have typically adopted default settings built into the SIDRA INTERSECTION
programme, except for the following, which have been adjusted to reflect the existing observed
conditions:
Melbourne Road / The Avenue (AM)
North approach signal coordination adjusted to ‘Favourable’
South approach signal coordination adjusted to ‘Favourable’
Melbourne Road / The Avenue (PM)
North approach signal coordination adjusted to ‘Highly Favourable’
South approach signal coordination adjusted to ‘Favourable’
Melbourne Road / Hudson Road (AM)
North approach signal coordination adjusted to ‘Favourable’
South approach signal coordination adjusted to ‘Highly Favourable’
Melbourne Road / Hudson Road (PM)
North approach signal coordination adjusted to ‘Highly Favourable’
South approach signal coordination adjusted to ‘Favourable’
North approach right turn gap acceptance adjusted to 2.5 second follow up gap.
South approach right turn gap acceptance adjusted to 4.0 second critical gap.
Millers Road / Blackshaws Road (AM)
North approach signal coordination adjusted to ‘Highly Favourable’
West approach signal coordination adjusted to ‘Favourable’
East approach signal coordination adjusted to ‘Highly Favourable’
East approach right turn gap acceptance adjusted to 4.0 second critical gap and
a 2.0 second follow up gap
Millers Road / Blackshaws Road (PM)
North approach signal coordination adjusted to ‘Favourable’
West approach signal coordination adjusted to ‘Favourable’
East approach signal coordination adjusted to ‘Highly Favourable’
Millers Road / Marigold Avenue / Dousa Road (AM)
North approach signal coordination adjusted to ‘Favourable’
South approach signal coordination adjusted to ‘Highly Favourable’
5 SIDRA INTERSECTION adopts the following criteria for Level of Service assessment:
Intersection Degree of Saturation (X)
Signals Roundabouts Unsignalised
A Excellent <=0.60 <=0.60 <=0.60
B Very Good 0.60-0.70 0.60-0.70 0.60-0.70
C Good 0.70-0.90 0.70-0.85 0.70-0.80
D Acceptable 0.90-0.95 0.85-0.95 0.80-0.90
E Poor 0.95-1.00 0.95-1.00 0.90-1.00
F Very Poor >=1.0 >=1.0 >=1.0

Existing Conditions
14M1544000 23/03/15
Precinct 15, Blackshaws Road, Altona North Issue: C
Development / Structure Plan Transport Assessment Page: 17
Millers Road / Marigold Avenue / Dousa Road (PM)
South approach signal coordination adjusted to ‘Highly Favourable’
Table 3.1 presents a summary of the existing operation of the intersections, with full results
presented in Appendix A of this report.
Table 3.1: Nominated Intersections – Existing Operating Conditions
Intersection Period Approach DOS Average
Delay (sec)
95th Percentile
Queue (m)
Melbourne Road /
The Avenue
AM
Melbourne Road (south) 0.54 8 sec 85 m
The Avenue (east) 0.43 53 sec 43 m
Melbourne Road (north) 0.52 12 sec 45 m
The Avenue (west) # 0.80 25 sec 77 m
PM
Melbourne Road (south) 0.54 11 sec 94 m
The Avenue (east) 0.31 55 sec 20 m
Melbourne Road (north) # 0.75 9 sec 80 m
The Avenue (west) 0.29 16 sec 13 m
Melbourne Road /
Hudsons Road
AM
Melbourne Road (south) # 0.75 18 sec 121 m
Hudsons Road (east) 0.70 45 sec 37 m
Melbourne Road (north) 0.52 25 sec 82 m
Hudsons Road (west) 0.35 36 sec 36 m
PM
Melbourne Road (south) 0.59 21 sec 105 m
Hudsons Road (east) 0.87 45 sec 65 m
Melbourne Road (north) # 0.88 20 sec 205 m
Hudsons Road (west) 0.64 59 sec 24 m
Melbourne Road /
Blackshaws Road
AM
Melbourne Road (south) # 0.28 1 sec 0 m
Blackshaws Road (east) 0.16 7 sec 4 m
Melbourne Road (north) 0.16 1 sec 0 m
PM
Melbourne Road (south) 0.27 1 sec 0 m
Blackshaws Road (east) 0.22 10 sec 6 m
Melbourne Road (north) # 0.35 1 sec 0 m
Melbourne Road /
Ross Street
AM
Melbourne Road (south) 0.28 0 sec 0 m
Ross Street (east) 0.19 0 sec 1 m
Melbourne Road (north) # 0.31 17 sec 8 m
PM
Melbourne Road (south) 0.26 0 sec 0 m
Ross Street (east) # 0.37 1 sec 3 m
Melbourne Road (north) 0.21 16 sec 5 m
Blackshaws Road /
Schutt Street
AM
Schutt Street (south) 0.04 6 sec 1 m
Blackshaws Road (east) 0.08 0 sec 0 m
Blackshaws Road (west) # 0.11 3 sec 3 m
PM
Schutt Street (south) 0.04 7 sec 1 m
Blackshaws Road (east) # 0.15 0 sec 0 m
Blackshaws Road (west) 0.10 3 sec 3 m
Blackshaws Road /
New Street
AM
Blackshaws Road (east) 0.17 0 sec 1 m
New Street(north) 0.10 11 sec 3 m
Blackshaws Road (west) # 0.33 3 sec 0 m
PM
Blackshaws Road (east) 0.22 0 sec 0 m
New Street(north) # 0.40 20 sec 12 m
Blackshaws Road (west) 0.32 1 sec 0 m

Existing Conditions
14M1544000 23/03/15
Precinct 15, Blackshaws Road, Altona North Issue: C
Development / Structure Plan Transport Assessment Page: 18
Intersection Period Approach DOS Average
Delay (sec)
95th Percentile
Queue (m)
Blackshaws Road /
Hansen Street
AM
Hansen Street (south) 0.25 18 sec 6 m
Blackshaws Road (east) 0.20 1 sec 0 m
Blackshaws Road (west) # 0.29 0 sec 0 m
PM
Hansen Street (south) 0.20 21 sec 4 m
Blackshaws Road (east) # 0.31 1 sec 0 m
Blackshaws Road (west) 0.25 0 sec 1 m
Blackshaws Road /
Mills Street /
Kyle Road
AM
Kyle Road (south) # 0.42 38 sec 38 m
Blackshaws Road (east) 0.39 10 sec 64 m
Mills Street(north) 0.27 38 sec 17 m
Blackshaws Road (west) 0.42 9 sec 73 m
PM
Kyle Road (south) 0.28 40 sec 16 m
Blackshaws Road (east) 0.47 9 sec 84 m
Mills Street(north) 0.36 40 sec 16 m
Blackshaws Road (west) # 0.50 9 sec 86 m
Millers Road /
Blackshaws Road
AM
Millers Road (south) # 0.82 39 sec 187 m
Blackshaws Road (east) 0.58 28 sec 64 m
Millers Road (north) 0.63 22 sec 103 m
Blackshaws Road (west) 0.61 35 sec 86 m
PM
Millers Road (south) 0.63 24 sec 100 m
Blackshaws Road (east) 0.69 33 sec 64 m
Millers Road (north) # 0.77 22 sec 186 m
Blackshaws Road (west) 0.48 32 sec 42 m
Millers Road /
Marigold Avenue /
Dousa Road
AM
Millers Road (south) # 0.73 14 sec 134 m
Marigold Ave (east) 0.34 41 sec 35 m
Millers Road (north) 0.49 16 sec 71 m
Dousa Road (west) 0.38 32 sec 48 m
PM
Millers Road (south) 0.59 13 sec 87 m
Marigold Ave (east) 0.53 49 sec 34 m
Millers Road (north) # 0.79 24 sec 171 m
Dousa Road (west) 0.42 42 sec 75 m
DOS – Degree of saturation, # - Intersection DOS
On the basis of the above assessment, it is clear that all of the assessed intersections in the vicinity
of the site currently operate well with reasonable queues and delays on all approaches.
3.2.5 Accident Statistics
A review of the reported casualty accident history for the roads and intersections adjoining and
connecting the subject site to the surrounding arterial road network has been sourced from the
VicRoads CrashStats accident database. This database records all accidents causing injury that
have occurred in Victoria since 1987 (as recorded by Victorian Police).
A summary of the reported accidents causing injury for the last available five year period (July
2008 to June 2013) is presented in Table 3.2 and Figure 3.9.

Existing Conditions
14M1544000 23/03/15
Precinct 15, Blackshaws Road, Altona North Issue: C
Development / Structure Plan Transport Assessment Page: 19
Table 3.2: Casualty Accident History (1 July 2008 – 30 June 2013)
Location Accident No.
Fatality [1] Serious Injury [2] Other Injury [3]
On Millers Road b/w Clematis Ave &Marigold Ave 1
Intersection of Millers Rd and Edward Avenue 1
Intersection of Millers Rd and Beuron Rd 1 2
Intersection of Millers Rd & Cyclamen Ave 1 5
Intersection of Millers Rd & Dousa Rd 5
On The Avenue b/w Fogarty Ave & Strong St 1
Intersection of Kernot St & The Avenue 1
Intersection of Brunel St & Paxton St 1
Intersection of Kernot St & Montgomery Crescent 1
On The Avenue b/w Andrews St & Stephenson St 1
On The Avenue b/w Derham St & Hick St 1
Intersection of Hudsons Rd & Stephenson St 1
Intersection of Williamstown Rd & Reed St 1
On Melbourne Rd b/w Hudsons Rd & Reed St 1
Intersection of Williamstown Rd & Hudsons Rd 2
Intersection of Williamstown Rd & Mary St 2 1
Intersection of Williamstown Rd& The Avenue 2 4
Intersection of Cullen St & Mary St 1
Intersection of Blackshaws Rd & Millers Rd 5 3
Intersection of Blackshaws Rd & Seventh Ave 2
On Blackshaws Rd b/w Mahon Ave & Fifth Ave 1
Intersection of Blackshaws Ave & Fifth Ave 1
On Millers Rd b/w Edward Ave & Blackshaws Ave 1
Intersection of Blackshaws Rd & Third Ave 1 1
Intersection of Blackshaws Rd & Second Ave 1
On Blackshaws Rd b/w Second Ave & Begonia Ave 1
Intersection of Blackshaws Rd & Begonia Ave 1
On Blackshaws Rd b/w Begonia Ave & Kyle Rd 1
Intersection of Blackshaws Rd & Kyle Rd 2
Intersection of Blackshaws Rd & McDonald Ave 1
Intersection of Blackshaws Rd & The Broadway 1 1
On Blackshaws Rd b/w The Broadway & Hansen St 1 2
Intersection of Blackshaws Rd & Hansen St 1
Intersection of Blackshaws Rd & New St 1
On Blackshaws Rd b/w New St & Charlotte St 2
Intersection of Blackshaws Rd & Charlotte St 1
On Blackshaws Rd b/w Charlotte St & Saltley St 1
On Blackshaws Rd b/w Truman St & Graham St 1
Intersection of Aloha St & Truman St 1
On Blackshaws Rd b/w Stephenson St & Johnson St 2 2
On Melbourne Rd b/w Birmingham St & Williamstown Rd 1 2
Intersection of Blackshaws Rd & Schutt St 1
Total 0 29 51
Source: VicRoads
[1] Fatality: At least one person was killed in the accident or died within 30 days as a result of the accident.
[2] Serious injury: At least one person was sent to hospital as a result of the accident.
[3] Other injury: At least one person required medical treatment as a result of the accident.

Existing Conditions
14M1544000 23/03/15
Precinct 15, Blackshaws Road, Altona North Issue: C
Development / Structure Plan Transport Assessment Page: 20
Figure 3.9: Casualty Accident History
Table 3.2 and Figure 3.9 indicate that there is a moderate history of reported accidents causing
injury in the vicinity of the subject site, with the intersections of Blackshaws Road / Millers Road
and Melbourne Road / The Avenue recording the highest number of accidents. It is worth noting
that the intersection of Melbourne Road / The Avenue has been recently upgraded to a
signalised intersection and the intersection of Blackshaws Road / Millers Road is to be upgraded
as part of this development. These upgrades are expected to improve the safety of each
intersection.
3.3 Car Parking
Car parking (subject to various time and clearway restrictions) is generally provided on each of
the roads in the vicinity of the Precinct.
GTA Consultants compiled an inventory of publicly available on-street car parking along the
frontages of the subject site. The inventory identified a total of 192 on-street spaces, including
147 spaces that are unrestricted during business hours.
On-site observations indicate that current on-street car parking demands along the frontages of
the subject site are generally low.
3.4 Sustainable Transport Infrastructure
3.4.1 Preamble
The subject site enjoys access to a range of existing sustainable transport infrastructure
alternatives, including public transport, bicycle and pedestrian facilities. These are most clearly
set out within the Hobsons Bay municipality ‘TravelSmart’ map, a portion of which is presented in
Figure 3.10.
1
1
2
2
1
1
1
29
correct
4
1
1
1
5
1 1 11
11
1
2
1
1
1
12
2
1
1
1
5
1
2
3 2 1 1 111
2
2 1 11 12
11
11
4
1
2
2
1
11 1
LEGEND
SERIOUS INJURY
OTHER INJURYX
X
SUBJECT SITE
1 2

Existing Conditions
14M1544000 23/03/15
Precinct 15, Blackshaws Road, Altona North Issue: C
Development / Structure Plan Transport Assessment Page: 21
The sustainable transport infrastructure options surrounding the subject site are described in
further detail within the following sections of this report.
Figure 3.10: Nearby Sustainable Transport Options
(Downloaded June 2012)
3.4.2 Public Transport
Figure 3.11 shows the subject site in relation to existing public transport services within its vicinity
whilst Table 3.3 summarises the road based routes and major destinations that can be reached
using these services.
Subject Site

Existing Conditions
14M1544000 23/03/15
Precinct 15, Blackshaws Road, Altona North Issue: C
Development / Structure Plan Transport Assessment Page: 22
Figure 3.11: Existing Public Transport Services and Stops
Source: PTV Website September 2014
Table 3.3: Road Based Public Transport Provision
Route
Nos
Route
Description
Distance to
Nearest Stop Significant Destinations On Route
232
Altona North –
Queen Victoria
Market
700m
Altona North Bus Interchange, Altona Gate S.C., West Gate Fwy,
Todd Rd, Williamstown Rd, Montague St, Charles Grimes Bridge,
Flinders St, Queen Victoria Market
412 Laverton –
Footscray 50m
Laverton Railway Station, Victoria St, Queen St, Millers Rd, Berkeley
Cr, Mills St, Blackshaws Rd, Millers Rd, Altona Gate S.C., Geelong Rd,
Paisley Street
432 Newport –
Yarraville 50m
Newport Railway Station, The Broadway, The Circle, Millers Rd,
Marigold Av, Kyle Rd, Blackshaws Rd, Stephenson St, Aloha St, Brunel
St, The Avenue, Fogarty Avenue, Wembley Av, Anderson Street,
Yarraville Railway Station
471 Williamstown -
Sunshine 50m
The Esplanade, Melbourne Rd to Newport Railway Station, The
Broadway, The Circle, Blackshaws Rd, Altona Gate Shopping
Centre, Duosa Rd, Princes Hwy, Sunshine Railway Station
It is noted that the Altona Gate Shopping Centre accommodates a major bus interchange
servicing a number of bus routes as follows:
Bus route 232 travels from Altona Gate Shopping Centre to Queen Victoria Market via
the West Gate Freeway, Port Melbourne, and the Melbourne Convention Centre and
along Queen Street to the markets.
Bus routes 411 and 412 travel from Laverton to Footscray via Altona, Altona Gate
Shopping Centre and West Footscray.
Bus route 432 travels from Newport to Yarraville via Altona North, South Kingsville,
Spotswood and Yarraville.
Subject Site
Existing Conditions
14M1544000 23/03/15
Precinct 15, Blackshaws Road, Altona North Issue: C
Development / Structure Plan Transport Assessment Page: 23
Bus route 471 travels from Williamstown to Sunshine via Williamstown, Newport, Altona
North and Sunshine West.
Bus route 903 is a Smart Bus route and travels from Altona to Mordialloc via Sunshine,
Essendon, Preston, Heidelberg, Doncaster, Burwood, Chadstone, Oakleigh and
Mentone.
In addition to road based public transport, Spotswood Railway Station on the Werribee and
Williamstown lines is located approximately 1.6 kilometres east of the subject site. Further, the
Yarraville and Newport Railway Stations are located 2.2km and 1.9km from the subject site,
respectively.
3.4.3 Pedestrian Infrastructure
Pedestrian paths are generally provided on both sides of all roads in the vicinity of the subject
site. Signalised pedestrian crossings are provided at the Blackshaws Road / Mills Street / Kyle
Road intersection, while a pedestrian zebra crossing, with flashing lights, is provided on
Blackshaws Road between Begona Avenue and Kyle Road.
3.4.4 Cycle Infrastructure
Bicycle lanes are provided on both sides of Millers Road.
The Federation Bike Trail runs from Werribee to Brooklyn and currently terminates north of the Site.
The trail will ultimately be developed along the north side of the West Gate Freeway to provide a
link from the existing start / end of the trail at Millers Road to the existing shared pedestrian / cycle
trail on Hyde Street in Yarraville. This will provide direct access for pedestrians and cyclists to the
Melbourne CBD.
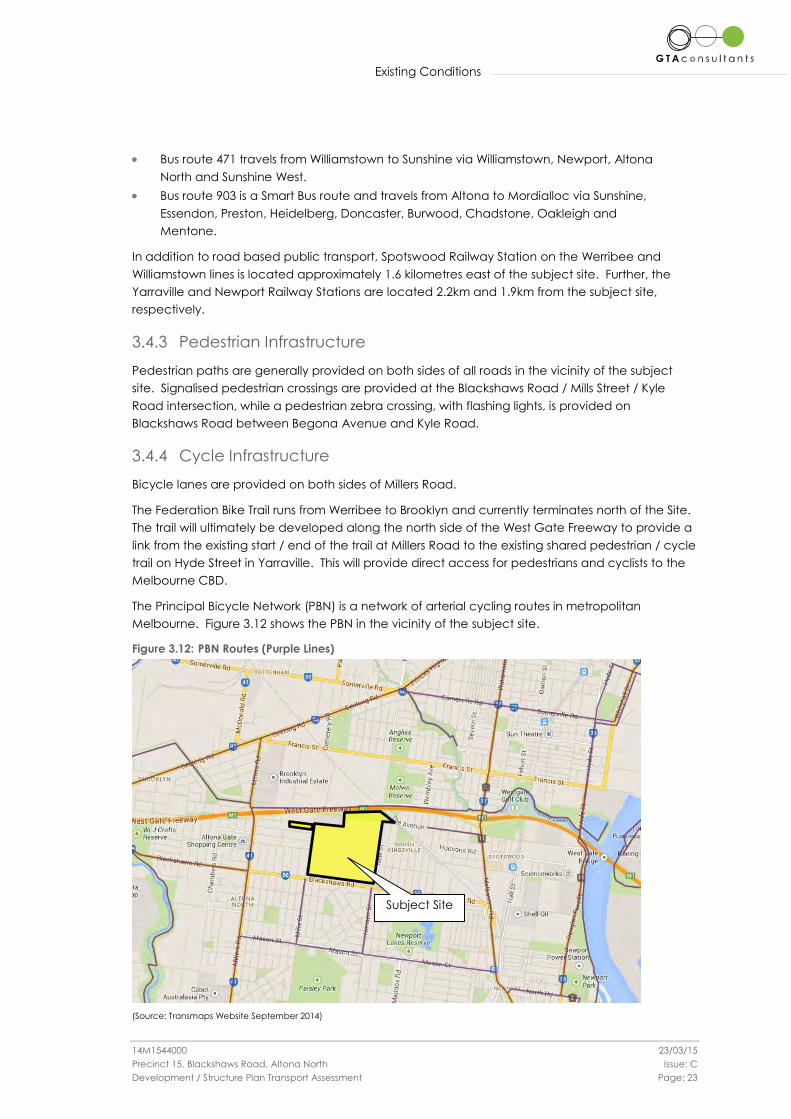
The Principal Bicycle Network (PBN) is a network of arterial cycling routes in metropolitan
Melbourne. Figure 3.12 shows the PBN in the vicinity of the subject site.
Figure 3.12: PBN Routes (Purple Lines)
(Source: Transmaps Website September 2014)
Subject Site

Existing Conditions
14M1544000 23/03/15
Precinct 15, Blackshaws Road, Altona North Issue: C
Development / Structure Plan Transport Assessment Page: 24
Figure 3.12 indicates that in the vicinity of the subject site the Federation Bike Trail on the northern
side of the West Gate Freeway, Melbourne Road, The Avenue, Hansen Street, Mills Road and
Millers Road all form part of the PBN. This is generally consistent with Hobsons Bay Strategic Bicycle
Plan (refer to Figure 2.4), except for Blackshaws Road and New Street.
3.5 Surrounding Land Use Developments
It is understood that there are a number of proposed land use changes within the vicinity of the
subject site which are at various stages of development. The location of these developments are
shown in Figure 3.13 and discussed in further detail below.
Figure 3.13: Nearby Development Sites
(Source: Google Maps)
1. Bradmill Site, Francis Street, Yarraville (Approved)
Potential to cater for approximately 1,500 dwellings, neighbourhood activity centre
and community centre.
Includes a north-south collector road along the eastern side of the site between
Francis Street and The Avenue.
Expected to provide provision for bus stops along Francis Street and the north-
south collector road, as well as pedestrian and bicycle facilities throughout.
Development is approved and construction is expected to commence late 2014.
Subject Site
1
2
3

Existing Conditions
14M1544000 23/03/15
Precinct 15, Blackshaws Road, Altona North Issue: C
Development / Structure Plan Transport Assessment Page: 25
2. 41 - 59 Stephenson Street, South Kingsville6
Potential to cater for approximately 250 dwellings, with no town planning process
having commenced as yet.
3. Caltex Terminal Site
Potential to cater for approximately 670 dwellings.
The site was rezoned as per Amendment C82 of the Hobson Bay Planning Scheme
subject to the application of the Design and Development Overlay Schedule 10.
It is also noted that there was an additional proposal, known as the Newport Flour Mill, which was
scheduled to be heard by a Planning Panel for site rezoning. However, the rezoning has been
abandoned and therefore, this site has not been considered in the traffic assessment contained
within this report.
6 Information provided by the land owners CVC Ventures Pty Ltd.

Land Use Concept
14M1544000 23/03/15
Precinct 15, Blackshaws Road, Altona North Issue: C
Development / Structure Plan Transport Assessment Page: 26
4. Land Use Concept
4.1 Land Uses
The preliminary Development / Structure Plan work completed to date anticipates the rezoning
of the site to a predominantly residential use, with a mixed use zone and some public open
space. The anticipated development schedule is presented in Table 4.1 and shown in Figure 4.1.
Table 4.1: Indicative Development Schedule
Use Size
Residential Approx. 3,000 dwellings in a mixture of densities
Mixed Use Zone Potential for up to 5,550m2 retail floor space (4,200m2 supermarket + 1,350m2 specialty retail)
Figure 4.1: Land Use Plan
Source: Tract – Land Use Plan, dated 20/03/2015
4.2 Vehicle Access Approach
4.2.1 General Approach
The general vehicle access approach for the development is to try and encourage site
generated traffic to primarily access the precinct via Blackshaws Road. This is to be achieved by
providing the higher capacity site accesses to Blackshaws Road, and designing the internal road
network to maximise traffic movement efficiency in the north-south direction, rather than the

Land Use Concept
14M1544000 23/03/15
Precinct 15, Blackshaws Road, Altona North Issue: C
Development / Structure Plan Transport Assessment Page: 27
east-west direction. Furthermore, improvements to the level of service for motorists travelling
along Blackshaws Road, especially through the intersections, have been investigated to make it
more attractive to access the precinct from the surrounding arterial road network via Blackshaws
Road instead of any local streets in the area.
This approach is considered to be consistent with best practice vehicle access planning and
consistent with relevant Austroads Guidelines. Also, it is acknowledged that there is only limited
remaining capacity within the surrounding local road network to accommodate additional traffic
volumes, and that there would be significant amenity impacts on local residents in the local
streets should they be relied upon in accessing the precinct.
4.2.2 Site Access Points
The precinct is bounded on three sides by existing roads and it is anticipated that access will be
obtained via a number of intersections with these roads to allow the new development to
seamlessly mesh in with the existing residential street network which surrounds it.
Specifically the draft Development Plan work currently envisages access to the precinct from:
i upgrades to the existing signalised intersections of Millers Road / Blackshaws Road and
Blackshaws Road / Kyle Road / Mills Street
ii increased lengths of ‘No Stopping’ parking restrictions and introduction of dedicated
right turn lanes at the Kyle Road, New Street, Hansen Street and The Broadway
unsignalised intersections along Blackshaws Road
iii a new signalised intersection with Blackshaws Road towards the east of the precinct,
between The Broadway and Hansen Street
iv additional unsignalised accesses from Blackshaws Road
v additional access points from Kyle Road
vi additional access points from New Street, including an upgraded intersection with
Brunel Street.
Further details of these works are provided in Section 6 of this report.
4.2.3 Internal Road Network
The potential layout of the future internal road network broadly proposes a road hierarchy
consisting of connector streets and access streets within the subject site to access the proposed
uses and connect with the surrounding road network. Of particular note, there is an anticipated
east-west connector street between Kyle Street / Cyclamen Avenue / Marigold Avenue and New
Street / Brunel Street linking to a north-south connector street from the proposed signalised
intersection on Blackshaws Road. These will provide efficient access with the external road
network, to the internal access street network and the potential mixed use zone, while minimising
the attractiveness for local vehicles to drive east-west through the site.
4.2.4 Pedestrian and Bicycle Facilities
The draft Development Plan anticipates a number of pedestrian and bicycle links through the
site, through the provision of sealed footpaths, shared paths and dedicated bicycle paths
adjacent to the roads and through the open space areas. Particularly strong connections will be
provided to the likely mixed use zone and the ‘Quarry Park’ central area contemplated for
significant open space.
The paths will be connected to the surrounding residential network through the signalised
pedestrian crossing facilities at the proposed signalised intersections along Blackshaws Road.
Land Use Concept
14M1544000 23/03/15
Precinct 15, Blackshaws Road, Altona North Issue: C
Development / Structure Plan Transport Assessment Page: 28
Connection will be expected to be provided to the Federation Trail along Brunel Street and The
Avenue, with there being a potential alternate more direct connection being considered via a
pedestrian bridge over the railway at the northeast corner of the site.
Consideration is also being given to providing a connection to Birmingham Street, as outlined in
the Bay Strategic Bicycle Plan, to accommodate an off-road facility that will connect with the
Spotswood Train Station.
4.3 Public Transport Facilities
The proposed connector streets will be designed to accommodate potential future bus services.
A bus service through the site along the central connector street would allow all dwellings to be
within 400m of a bus route, in accordance with DEDJTR guidelines.

Existing Travel Characteristics
14M1544000 23/03/15
Precinct 15, Blackshaws Road, Altona North Issue: C
Development / Structure Plan Transport Assessment Page: 29
5. Existing Travel Characteristics
5.1 Preamble
Guidance on the existing travel characteristics of Hobsons Bay residents has been sought from
the Victorian Integrated Survey of Travel Activity 2009 (VISTA 09) prepared by the then
Department of Transport (now DEDJTR). The travel habits of residents in each of the municipalities
in Melbourne and major regional centres within Victoria was collected as part of VISTA 09 and
provides guidance on existing mode splits.
5.2 Existing Mode Splits
On this basis, Figure 5.1 and Figure 5.2 have been prepared to summarise the existing mode
shares based on total number of trips undertaken (i.e. trips associated with work, education,
retail, recreation, etc.) within the municipality of Hobsons Bay for the respective days of the week.
Figure 5.1: Existing Weekday Mode Split Figure 5.2: Existing Weekend Mode Split
Source: Vista 09 data
Figure 5.1 and Figure 5.2 indicate that while 77% of weekday and 83% of weekend trips
undertaken within the municipality of Hobsons Bay are by car / passenger, 22% of weekday and
16% of weekend trips involve public transport, walking or cycling.
By way of comparison, Figure 5.3 to Figure 5.5 provides a summary of the existing mode share for
each of: public transport, walking/cycling and car trips, for all trips made by residents living in
Hobsons Bay and other municipalities in Melbourne.

Existing Travel Characteristics
14M1544000 23/03/15
Precinct 15, Blackshaws Road, Altona North Issue: C
Development / Structure Plan Transport Assessment Page: 30
Figure 5.3: Proportion of Public Transport Trips
Source: Vista 07 data
Figure 5.4: Proportion of Walking / Cycling Trips
Source: Vista 07 data
% Public Transport Trips
% Walking / Cycling Trips

Existing Travel Characteristics
14M1544000 23/03/15
Precinct 15, Blackshaws Road, Altona North Issue: C
Development / Structure Plan Transport Assessment Page: 31
Figure 5.5: Proportion of Car Trips (car as driver or passenger)
Source: Vista 07 data
From these figures the following is noted for Hobsons Bay:
a reasonably high proportion of public transport trips
the tenth highest proportion of walking and cycling trips
the tenth highest proportion of sustainable mode share (i.e. public transport, walking
and cycling trips)
the tenth lowest proportion of vehicle trips.
The reasons for this is partly due to the municipality being well located in respect to supporting
public transport and active transport infrastructure, and hence generates relatively low levels of
private vehicle activity and higher public transport, walking and cycle trips, but also due to its
proximity to both the Footscray CAD and Melbourne CAD, and the current level of traffic
congestion on the West Gate Freeway, which reduces the attractiveness of accessing these
CADs through private motor vehicles.
5.3 Journey to Work
VISTA 09 also provides guidance on where people are travelling to and from. The results are
summarised in Figure 5.6 and Figure 5.7, which summarise trips originating in Hobsons Bay and
those finishing in Hobsons Bay, respectively.
% Car Trips

Existing Travel Characteristics
14M1544000 23/03/15
Precinct 15, Blackshaws Road, Altona North Issue: C
Development / Structure Plan Transport Assessment Page: 32
Figure 5.6: Trips Originating in Hobsons Bay
Source: Vista 07 data
Figure 5.7: Trips Finishing in Hobsons Bay
Source: Vista 07 data
From these figures the following is noted for Hobsons Bay:
Half of trips (approx. 50%) are originating and finishing from within the municipality.
Almost one quarter of all trips originating from Hobsons Bay travel east towards Melbourne.
Almost one fifth of trips to Hobsons Bay travel south from Maribyrnong and other
northern municipalities.
The above distributions could be reasonably expected to exist into the future. However, noting
current planning approaches is to develop a more multi-centred metropolitan Melbourne and
reduce the reliance on the use of private motor vehicles. As such, it could be expected that an
increased proportion of trips would be internal and with the adjacent central and major activity
centres of Hobsons Bay by alternate transport modes through their progressive improvement.
Trips within Hobsons Bay – 53%
17%
24%
5%
1%
Trips within Hobsons Bay – 52%
19%
8%
16%
5%

Traffic Impact Assessment
14M1544000 23/03/15
Precinct 15, Blackshaws Road, Altona North Issue: C
Development / Structure Plan Transport Assessment Page: 33
6. Traffic Impact Assessment
6.1 Assessment Context
Land use planning policy in Victoria indicates that where a development site abuts (or does not
abut, but may impact on) any part of a road declared as a freeway or an arterial road under the
Road Management Act 2004 and if the development is expected to increase traffic movements
at intersections the form part of the main road network, the development will be referred to the
Roads Corporation (VicRoads).
With assessing development land use proposals, VicRoads generally requires an assessment of:
i existing road network performance
ii traffic generation rates for proposed land use
iii a “base case” assessment prior to development traffic superimposition
iv a post-development assessment
v identification of mitigation measures where necessary to minimise the impacts of the
development and/or maintain, within practical limitations, the performance of the
network that would have existed without the development.
The important aspect to note regarding the above is that mitigation is typically required only
where necessary (not wherever an impact is generated). To determine whether such works are
necessary, it is common to assess the relative impact of the proposed development and whether
mitigation is practical/feasible.
Furthermore, it is VicRoads practice that the following approach is applied to the proposed
access arrangements to the site and for existing road infrastructure:
For new access arrangements direct to the site – provision is made for all access
arrangements to operate safely and efficiently into the future (at least 10 years after full
development).
For existing road infrastructure - any potential adverse impacts from land use
development proposals on road safety and operational efficiency are identified and,
where necessary, developers provide mitigating road improvement works as part of the
development costs to minimise these effects and retain within practical limitations, the
level of safety and operational efficiency that would have existed without the
development.”
In applying the above approach to the subject site, it is expected that the site access
arrangements onto Blackshaws Road need to be designed to accommodate 10 years of traffic
volume growth, while the existing surrounding intersections need only be designed for the
immediate post-development conditions. The traffic assessment of the subject site is accordingly
not required to assess the broader impacts of surrounding development sites at existing
surrounding intersections.
The traffic analysis presented within the following sections has generally been prepared as
described above.
Traffic Impact Assessment
14M1544000 23/03/15
Precinct 15, Blackshaws Road, Altona North Issue: C
Development / Structure Plan Transport Assessment Page: 34
6.2 Traffic Generation
6.2.1 Residential
A single house on a standard lot in an outer metropolitan area will typically generate 8 to 10 trips
per day. Closer to the Melbourne CAD the rate reduces to in the order of 3 to 6 trips per day
depending on dwelling size, parking provisions and accessibility to public transport and local
amenities, among other things. Peak hour rates are typically 10–12% of daily rates.
The Victorian Integrated Survey of Travel and Activity 2009 (VISTA 09) was a large-scale survey of
travel activity undertaken by the Victorian Government. It found that households in Hobsons Bay
made an average of 3.9 car driver trips to/from home on a typical weekday, in addition to
vehicle trips to/from a house by non-residents (i.e. tradesmen, visitors, taxis etc.).
Given the proposed mix of dwelling types, the location of the subject site and the above
information it can be assumed that the dwellings will each generate an average of up to 5
vehicle movements per day, including 0.5 vehicle movements in a peak hour.
This may be conservative on the high side, given the expected shift away from private car use
into the future. This is on the basis of the level of development expected in the area, and the
subject site’s proximity and likely future accessibility to bus services and train stations, as well as
the Melbourne CBD and other key employment areas.
6.2.2 Mixed Use Zone
The proposed mixed land zone is anticipated to have up to 5,550sqm of retail floor area.
In order to determine the likely traffic generation of the mixed use zone reference is made to the
NSW RTA (now RMS) ‘Guide to Traffic Generating Developments’ rates. For shopping centres
ranging in size from 0 to 10,000sqm, this guide suggests a daily vehicle generation rate of 121
movements/100sqm floor area, and an evening commuter peak hour rate of 12.5
movements/100sqm floor area.
The Guide does not specify a generation rate for the morning commuter peak hour, as shopping
centres are generally not fully operational during the AM peak hour. For the purpose of this
analysis it has been assumed that the AM peak hour trips will be 10% of the PM peak trips (i.e. 1.25
movements /100m2) and will account for staff and servicing activities.
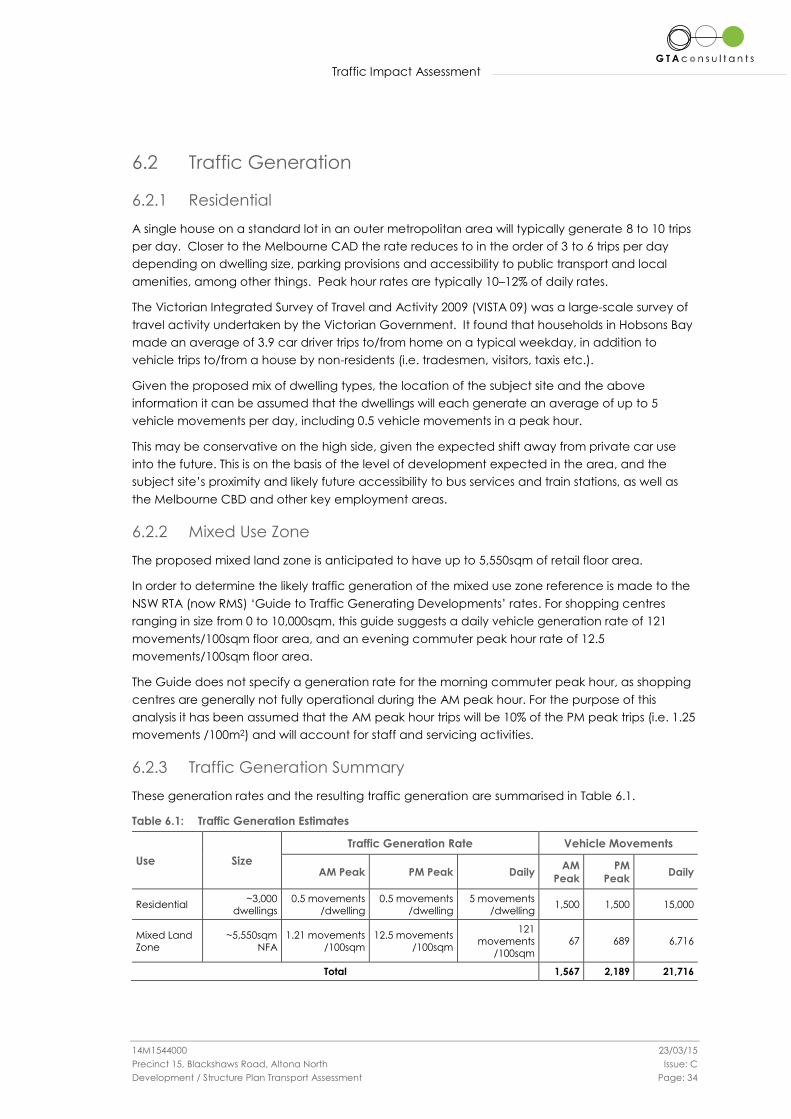
6.2.3 Traffic Generation Summary
These generation rates and the resulting traffic generation are summarised in Table 6.1.
Table 6.1: Traffic Generation Estimates
Use Size
Traffic Generation Rate Vehicle Movements
AM Peak PM Peak Daily AM
Peak
PM
Peak Daily
Residential ~3,000
dwellings
0.5 movements
/dwelling
0.5 movements
/dwelling
5 movements
/dwelling 1,500 1,500 15,000
Mixed Land
Zone
~5,550sqm
NFA
1.21 movements
/100sqm
12.5 movements
/100sqm
121
movements
/100sqm
67 689 6,716
Total 1,567 2,189 21,716
Traffic Impact Assessment
14M1544000 23/03/15
Precinct 15, Blackshaws Road, Altona North Issue: C
Development / Structure Plan Transport Assessment Page: 35
As shown in Table 6.1, adding the traffic from the two uses together results in a total traffic
generation of up to 21,716 vehicle movements per day, including 1,567 vehicle movements and
2,189 vehicle movements during the AM and PM commuter peak hours respectively.
However, the above includes some ‘double counting’ of trips from the dwellings to the mixed use
zone and vice versa, and some trips which will remain internal to the precinct. It is anticipated
that approximately 1/3 of the trips generated by the mixed use zone will be from within the
precinct. Similarly, in the order of 10% of the trips generated by the residential use will remain
internal to the precinct (including trips to the mixed use zone). As such, the daily vehicle
movements accessing the external road network is anticipated to be in the order of 17,999
movements, including 1,395 vehicle movements and 1,815 vehicle movements during the AM
and PM commuter peak hours respectively.
It is also noted that there are existing industrial uses that currently operate within Precinct 15.
These existing uses currently generate traffic movements in their own right and contribute to the
existing traffic volumes that have been recorded in the vicinity of the site. As such, the
application of the above additional traffic volumes generated by the two proposed land uses to
the external road network, beyond the site access points, is considered to be conservative and
on the high side.
On this basis, it is considered appropriate to discount the additional traffic volumes expected to
be experienced on the external road network, beyond the site related access movements, by
the level of traffic likely to be generated by the existing industrial uses. In this regard, the existing
traffic volumes accessing the subject site could be expected to equate to 4.0 and 0.75 vehicle
movements per car parking space currently provided on site daily and within peak traffic hours
respectively. Based on aerial photography of the subject site, there are approximately 265 car
parking spaces currently provided on-site. As such, there could be expected to be a total of
1,060 and 200 movements currently generated daily and in the AM and PM peak hours
respectively.
Subtracting these current movements from the above anticipated additional traffic movements
expected to be generated by the proposed development results in a total in the order of 15,828
additional movements per day, including 1,195 vehicle movements and 1,615 vehicle
movements during the AM and PM commuter peak hours respectively, experienced by the
external road network, beyond the site access points, as a result of the proposed development.
6.3 Traffic Distribution
The directional distribution and assignment of traffic generated by the proposed development
within the precinct will be influenced by a number of factors, including the:
i configuration of the arterial road network in the immediate vicinity of the site
ii operation of intersections providing access between the local and arterial road
network
iii distribution of households in the vicinity of the site
iv surrounding employment centres, retail centres and schools in relation to the site
v configuration of access points to the site.
In order to estimate the expected distribution of traffic generated by the Precinct, strategic
modelling has been undertaken using the VITM model developed by the then Department of
Transport (now DEDJTR). An indicative potential development on the site was modelled for the
2021 road network scenario, which resulted in the distributions shown in Table 6.2.

Traffic Impact Assessment
14M1544000 23/03/15
Precinct 15, Blackshaws Road, Altona North Issue: C
Development / Structure Plan Transport Assessment Page: 36
Table 6.2: Estimated Traffic Distributions
Direction AM Peak PM Peak
To/from west 46% 44%
To/from southwest 10% 9%
To/from southeast 8% 9%
To/from east 36% 38%
Furthermore, the directional split of traffic (i.e. the ratio between the inbound and outbound
traffic movements) for the proposed and exiting peak hour traffic movements anticipated to be
generated by the subject site are presented in Table 6.3.
Table 6.3: Directional Split of Traffic
Use AM PM
Residential (Proposed) 20% In / 80% Out 60% In / 40% Out
Mixed Use Zone (Proposed) 90% In / 10% Out 40% In / 60% Out
Industrial (Existing) 90% In / 10% Out 10% In / 90% Out
Based on the above, Figure 6.1 and Figure 6.2 have been prepared to show the estimated increase
in turning movements in the vicinity of the subject property following full site development.
Furthermore, it has been assumed that of the vehicles accessing the site from the north along
Millers Road, 50% will utilise Marigold Avenue and 50% will utilise Blackshaws Road. Of the vehicles
accessing the site from the north along Melbourne Road, 25% will utilise The Avenue and 75% will
utilise Blackshaws Road. This is considered to be reflective of the ability to access the site through
the connecting local roads, their ability to accommodate the traffic volumes and expected
motorist travel times to properties within the site.
Figure 6.1: AM Peak Hour Site Generated Traffic Volumes
5 13 0
85
43
0
0
5
0 11.7 13 0
0 0 115 0
5 43
0 128 0 13 0
128 Marigold Avenue Subject Site 43 0
0 130 0
0 25 87 10 0 Hudsons Road
0 181 0 5 0
0
0
0 115 0
Mill
ers
Ro
ad
Kyl
e R
oad
2n
d S
ITE
AC
CES
S
MA
IN S
ITE
AC
CES
S
New
Str
eet
0 0 12 43 21 21 96 64 308.7 213 43 13
0 5 14 33 213 141
18 37 58 85 85 213 115
0 0 Blackshaws Road
181 3 8 31 31 5 37
145 319 311 10 31
0 0 12 36 0 3 10 85 10 0 23 115 141
Mill
s St
reet
Han
sen
Str
eet
Sch
utt
Str
eet
Mel
bo
urn
e R
oad
141
To/from
West 0.46 115
Southwest 0.1
Southeast 0.08
East 0.36
Total 1
23
The Avenue

Traffic Impact Assessment
14M1544000 23/03/15
Precinct 15, Blackshaws Road, Altona North Issue: C
Development / Structure Plan Transport Assessment Page: 37
Figure 6.2: PM Peak Hour Site Generated Traffic Volumes
6.4 Other Developments
A number of other developments are proposed within the vicinity of the subject site. These
developments are outlined in Section 3.5.
Adopting the same residential dwelling traffic generation rate, the estimated traffic generation of
these developments is presented in Table 6.4, with the exception of the Bradmill Site, which is only
expected to contribute a minimal amount of traffic to the proximate road network surrounding
the subject site.
Table 6.4: Traffic Generation Estimates
Development Size Traffic Generation Rate Vehicle Movements
Peak Hour Daily Peak Hour Daily
41 - 59 Stephenson
Street 250 dwellings 0.5 movements
/dwelling
5 movements
/dwelling
125 movements 1,250 movements
Caltex Terminal Site 670 dwellings 335 movements 3,350 movements
Total 460 movements 4,600 movements
Adopting a distribution of 60% to the east and 40% to the west along Blackshaws Road7, there
can be expected to be an additional 184 vehicle movements in the peak hours that travel past
the subject site along Blackshaws Road following the full development of these other sites.
Given that these additional traffic volumes are generated by residential land uses, they are likely
to have peak hour direction splits of 20% in / 80% out in the AM and 60% in / 40% out in the PM.
Based on the above, Figure 6.3 and Figure 6.4 have been prepared to show the estimated
increase in turning movements in the vicinity of the subject property following full development of
these other sites.
7 This traffic distribution is consistent with the estimates adopted by the Planning Panel for C82 to the Hobsons Bay Planning Scheme.
39 146 0
51
26
0
0
39
0 88 88 0
0 0 75 0
39 149
0 98 0 146 0
89 Marigold Avenue Subject Site 33 0
0 115 0
0 90 66 80 0 Hudsons Road
0 86 0 40 0
0
0
0 75 0
Mill
ers
Ro
ad
Kyl
e R
oad
2n
d S
ITE
AC
CES
S
MA
IN S
ITE
AC
CES
S
New
Str
eet
0 0 88 26 13 19 74 57 196.5 172 26 146
0 39 110 209 141 91
117 244 224 64 57 141 75
0 0 Blackshaws Road
86 29 60 259 254 39 293
67 166 183 88 254
0 0 78 38 0 20 68 45 88 0 146 75 91
Mill
s St
reet
Han
sen
Str
eet
Sch
utt
Str
eet
Mel
bo
urn
e R
oad
91
To/from
West 0.46 75
Southwest 0.1
Southeast 0.08
East 0.36
Total 1
146
The Avenue
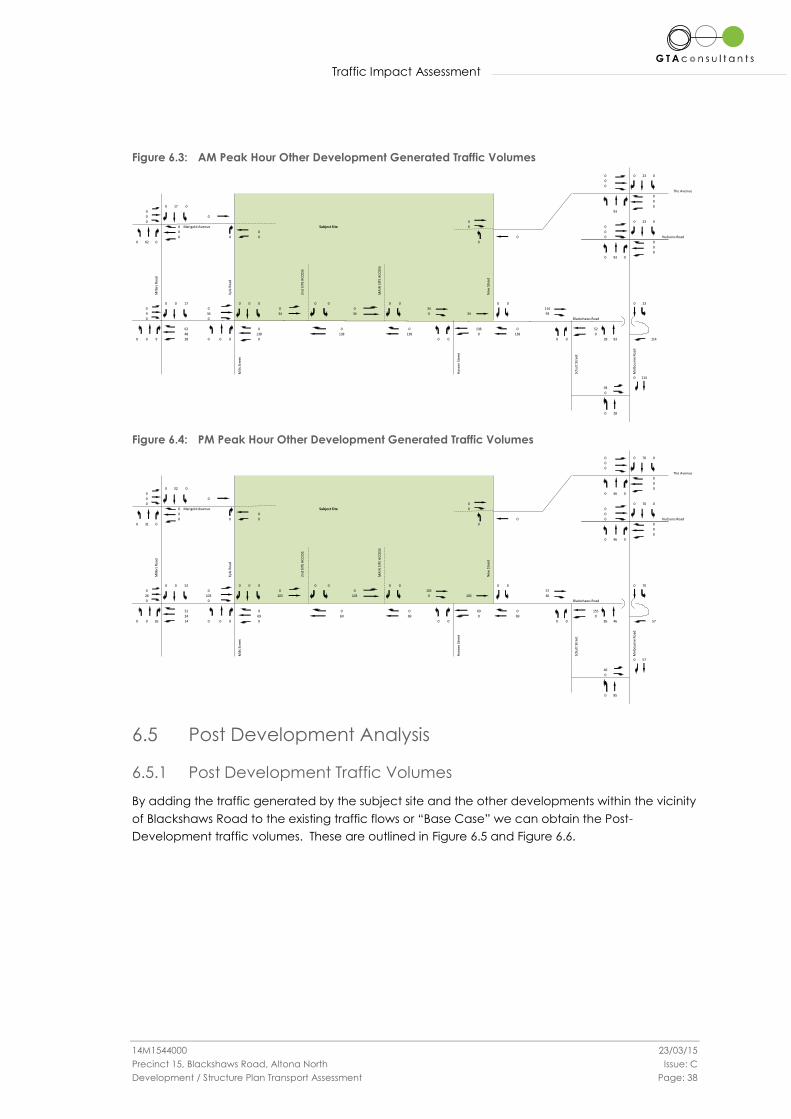
Traffic Impact Assessment
14M1544000 23/03/15
Precinct 15, Blackshaws Road, Altona North Issue: C
Development / Structure Plan Transport Assessment Page: 38
Figure 6.3: AM Peak Hour Other Development Generated Traffic Volumes
Figure 6.4: PM Peak Hour Other Development Generated Traffic Volumes
6.5 Post Development Analysis
6.5.1 Post Development Traffic Volumes
By adding the traffic generated by the subject site and the other developments within the vicinity
of Blackshaws Road to the existing traffic flows or “Base Case” we can obtain the Post-
Development traffic volumes. These are outlined in Figure 6.5 and Figure 6.6.
0 0 23 0
0
0
0
0
0 17 0 0
0 93
0 0
0 0 0 23 0
0 Marigold Avenue Subject Site 0 0
0 0 0
0 0 0 0 0 Hudsons Road
0 62 0 0 0
0
0
0 93 0
Mill
ers
Ro
ad
Kyl
e R
oad
2n
d S
ITE
AC
CES
S
MA
IN S
ITE
AC
CES
S
New
Str
eet
0 0 17 0 0 0 0 0 0 0 0 0 0 23
0 0 0 0 34 114
9 34 34 34 0 34 93
0 0 Blackshaws Road
62 0 0 0 138 0 52
48 138 138 138 0 138 0
0 0 9 28 0 0 0 0 0 0 0 0 28 93 114
Mill
s St
reet
Han
sen
Str
eet
Sch
utt
Str
eet
Mel
bo
urn
e R
oad
0 114
93
0
0 28
The Avenue
0 0 70 0
0
0
0
0
0 52 0 0
0 0 46 0
0 0
0 0 0 70 0
0 Marigold Avenue Subject Site 0 0
0 0 0
0 0 0 0 0 Hudsons Road
0 31 0 0 0
0
0
0 46 0
Mill
ers
Ro
ad
Kyl
e R
oad
2n
d S
ITE
AC
CES
S
MA
IN S
ITE
AC
CES
S
New
Str
eet
0 0 52 0 0 0 0 0 0 0 0 0 0 70
0 0 0 0 103 57
26 103 103 103 0 103 46
0 0 Blackshaws Road
31 0 0 0 69 0 155
24 69 69 69 0 69 0
0 0 26 14 0 0 0 0 0 0 0 0 85 46 57
Mill
s St
reet
Han
sen
Str
eet
Sch
utt
Str
eet
Mel
bo
urn
e R
oad
0 57
46
0
0 85
The Avenue

Traffic Impact Assessment
14M1544000 23/03/15
Precinct 15, Blackshaws Road, Altona North Issue: C
Development / Structure Plan Transport Assessment Page: 39
Figure 6.5: Post-Development AM Peak Hour Traffic Volumes
Figure 6.6: Post-Development PM Peak Hour Traffic Volumes
6.5.2 Post Development Traffic Performance
Existing Intersections
The impact of all the development traffic upon the existing intersections in the vicinity of the site was
assessed using SIDRA INTERSECTION. On the basis of the turning movement estimates presented
above, Table 6.5 presents a summary of the anticipated future operation of the nominated existing
intersections following the full development of the site and the other developments in the area.
Detailed results of this analysis are provided in Appendix B of this report.
Table 6.5: Post-Development Intersection Operation
Intersection Period Approach DOS Average
Delay (sec)
95th Percentile
Queue (m)
Melbourne Road /
The Avenue
AM
Melbourne Road (south) 0.64 10 sec 121 m
The Avenue (east) 0.57 58 sec 46 m
Melbourne Road (north) 0.34 11 sec 45 m
The Avenue (west) # 0.95 25 sec 98 m
PM Melbourne Road (south) 0.60 11 sec 110 m
The Avenue (east) 0.75 57 sec 25 m
52.22 714 27
443
64.6
22
112
23.2
108 909.7 53 0
198 0 1315 3
18.22 43
26 127.7 12 589 126
164.7 Marigold Avenue Subject Site 42.58 30
66 130 85
0 24.8 86.8 10 13 Hudsons Road
127 1343 5 5 109
27
30
0 1135 27
Mill
ers
Ro
ad
Kyl
e R
oad
2n
d S
ITE
AC
CES
S
MA
IN S
ITE
AC
CES
S
New
Str
eet
97 748 339.7 83.6 41.3 61.3 96 64 308.7 213 61 54.6 577 71.05
79 23 14 33 744 275 293
262.3 532 673 630 99.2 539.9 238
109 30 Blackshaws Road
421 43.6 8 31.3 361 20.2 191
311.8 695 739 356 32 337 2
104 971 94.7 102.2 43 52.6 94.4 96.2 26.4 61 34 4 113 1168 295
Mill
s St
reet
Han
sen
Str
eet
Sch
utt
Str
eet
Mel
bo
urn
e R
oad
17 859.5
To/from
West 0.46 259
Southwest 0.1 4
Southeast 0.08
East 0.36
Total 1
19 1027
The Avenue
241 1616 39
198
42
9
52
65
175 1487 162 0
246 16 1200 5
57 149
98 98 24 1437 79
151 Marigold Avenue Subject Site 33 16
23 115 16
8 90 66 80 33 Hudsons Road
121 1056 11 40 178
64
60
12 986 19
Mill
ers
Ro
ad
Kyl
e R
oad
2n
d S
ITE
AC
CES
S
MA
IN S
ITE
AC
CES
S
New
Str
eet
111 1310 395 43 53 69 74 57 197 172 124 34 1323 327
62 55 110 209 598 134 209
252.1 795 848 696 77 600 177
95 64 Blackshaws Road
292 58 60 259 766 46 570
217 676 765 603 65 661 8
94 756 169 130 39 51 93 105 96 40 36 3 245 1087 216
Mill
s St
reet
Han
sen
Str
eet
Sch
utt
Str
eet
Mel
bo
urn
e R
oad
47 1487
To/from
West 0.46 185
Southwest 0.1 1
Southeast 0.08
East 0.36
Total 1
14 1142
The Avenue

Traffic Impact Assessment
14M1544000 23/03/15
Precinct 15, Blackshaws Road, Altona North Issue: C
Development / Structure Plan Transport Assessment Page: 40
Intersection Period Approach DOS Average
Delay (sec)
95th Percentile
Queue (m)
Melbourne Road (north) # 0.86 11 sec 105 m
The Avenue (west) 0.41 19 sec 21 m
Melbourne Road /
Hudsons Road
AM
Melbourne Road (south) # 0.88 22 sec 181 m
Hudsons Road (east) 0.79 47 sec 39 m
Melbourne Road (north) 0.53 24 sec 84 m
Hudsons Road (west) 0.35 36 sec 36 m
PM
Melbourne Road (south) 0.60 18 sec 110 m
Hudsons Road (east) # 0.92 47 sec 65 m
Melbourne Road (north) 0.92 21 sec 255 m
Hudsons Road (west) 0.64 59 sec 24 m
Melbourne Road /
Blackshaws Road
AM
Melbourne Road (south) 0.34 1 sec 0 m
Blackshaws Road (east) # 0.43 8 sec 18 m
Melbourne Road (north) 0.16 1 sec 0 m
PM
Melbourne Road (south) 0.30 1 sec 0 m
Blackshaws Road (east) # 0.45 12 sec 16 m
Melbourne Road (north) 0.35 1 sec 0 m
Melbourne Road /
Ross Street
AM
Melbourne Road (south) 0.30 0 sec 0 m
Ross Street (east) 0.26 0 sec 1 m
Melbourne Road (north) # 0.73 22 sec 34 m
PM
Melbourne Road (south) 0.35 0 sec 0 m
Ross Street (east) 0.40 1 sec 5 m
Melbourne Road (north) # 0.62 27 sec 21 m
Blackshaws Road /
Schutt Street
AM
Schutt Street (south) 0.05 8 sec 1 m
Blackshaws Road (east) 0.13 0 sec 0 m
Blackshaws Road (west) # 0.31 3 sec 10 m
PM
Schutt Street (south) 0.09 12 sec 2 m
Blackshaws Road (east) # 0.39 0 sec 0 m
Blackshaws Road (west) 0.41 6 sec 14 m
Blackshaws Road /
New Street
AM
Blackshaws Road (east) 0.25 1 sec 1 m
New Street(north) 0.32 19 sec 10 m
Blackshaws Road (west) # 0.47 2 sec 0 m
PM
Blackshaws Road (east) 0.39 1 sec 2 m
New Street(north) # 0.89 70 sec 44 m
Blackshaws Road (west) 0.45 1 sec 0 m
Blackshaws Road /
Hansen Street
AM
Hansen Street (south) # 0.47 32 sec 13 m
Blackshaws Road (east) 0.28 0 sec 0 m
Blackshaws Road (west) 0.42 1 sec 3 m
PM
Hansen Street (south) # 0.72 44 sec 24 m
Blackshaws Road (east) 0.48 1 sec 0 m
Blackshaws Road (west) 0.37 1 sec 4 m
Blackshaws Road /
Mills Street /
Kyle Road
AM
Kyle Road (south) 0.64 45 sec 47 m
Blackshaws Road (east) # 0.76 11 sec 190 m
Mills Street(north) 0.56 44 sec 39 m
Blackshaws Road (west) 0.51 12 sec 97 m
PM
Kyle Road (south) 0.59 45 sec 44 m
Blackshaws Road (east) # 0.83 23 sec 232 m
Mills Street(north) 0.44 42 sec 27 m
Blackshaws Road (west) 0.87 25 sec 267 m
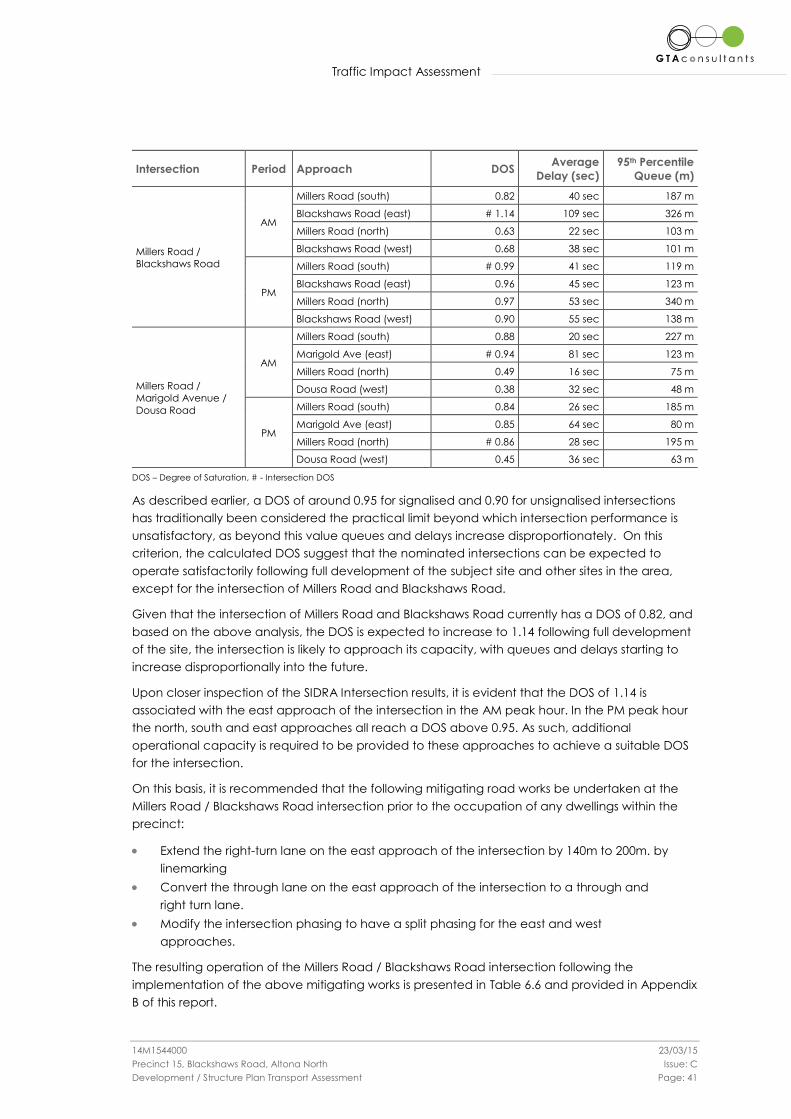
Traffic Impact Assessment
14M1544000 23/03/15
Precinct 15, Blackshaws Road, Altona North Issue: C
Development / Structure Plan Transport Assessment Page: 41
Intersection Period Approach DOS Average
Delay (sec)
95th Percentile
Queue (m)
Millers Road /
Blackshaws Road
AM
Millers Road (south) 0.82 40 sec 187 m
Blackshaws Road (east) # 1.14 109 sec 326 m
Millers Road (north) 0.63 22 sec 103 m
Blackshaws Road (west) 0.68 38 sec 101 m
PM
Millers Road (south) # 0.99 41 sec 119 m
Blackshaws Road (east) 0.96 45 sec 123 m
Millers Road (north) 0.97 53 sec 340 m
Blackshaws Road (west) 0.90 55 sec 138 m
Millers Road /
Marigold Avenue /
Dousa Road
AM
Millers Road (south) 0.88 20 sec 227 m
Marigold Ave (east) # 0.94 81 sec 123 m
Millers Road (north) 0.49 16 sec 75 m
Dousa Road (west) 0.38 32 sec 48 m
PM
Millers Road (south) 0.84 26 sec 185 m
Marigold Ave (east) 0.85 64 sec 80 m
Millers Road (north) # 0.86 28 sec 195 m
Dousa Road (west) 0.45 36 sec 63 m
DOS – Degree of Saturation, # - Intersection DOS
As described earlier, a DOS of around 0.95 for signalised and 0.90 for unsignalised intersections
has traditionally been considered the practical limit beyond which intersection performance is
unsatisfactory, as beyond this value queues and delays increase disproportionately. On this
criterion, the calculated DOS suggest that the nominated intersections can be expected to
operate satisfactorily following full development of the subject site and other sites in the area,
except for the intersection of Millers Road and Blackshaws Road.
Given that the intersection of Millers Road and Blackshaws Road currently has a DOS of 0.82, and
based on the above analysis, the DOS is expected to increase to 1.14 following full development
of the site, the intersection is likely to approach its capacity, with queues and delays starting to
increase disproportionally into the future.
Upon closer inspection of the SIDRA Intersection results, it is evident that the DOS of 1.14 is
associated with the east approach of the intersection in the AM peak hour. In the PM peak hour
the north, south and east approaches all reach a DOS above 0.95. As such, additional
operational capacity is required to be provided to these approaches to achieve a suitable DOS
for the intersection.
On this basis, it is recommended that the following mitigating road works be undertaken at the
Millers Road / Blackshaws Road intersection prior to the occupation of any dwellings within the
precinct:
Extend the right-turn lane on the east approach of the intersection by 140m to 200m. by
linemarking
Convert the through lane on the east approach of the intersection to a through and
right turn lane.
Modify the intersection phasing to have a split phasing for the east and west
approaches.
The resulting operation of the Millers Road / Blackshaws Road intersection following the
implementation of the above mitigating works is presented in Table 6.6 and provided in Appendix
B of this report.

Traffic Impact Assessment
14M1544000 23/03/15
Precinct 15, Blackshaws Road, Altona North Issue: C
Development / Structure Plan Transport Assessment Page: 42
Table 6.6: Modified Millers Road / Blackshaws Road Intersection –Post-Development Operation
Intersection Period Approach DOS Average
Delay (sec)
95th Percentile
Queue (m)
Millers Road /
Blackshaws Road
AM
Millers Road (south) 0.93 58 sec 236 m
Blackshaws Road (east) # 0.93 50 sec 202 m
Millers Road (north) 0.86 27 sec 119 m
Blackshaws Road (west) 0.90 61 sec 142 m
PM
Millers Road (south) 0.93 37 sec 114 m
Blackshaws Road (east) 0.95 57 sec 137 m
Millers Road (north) 0.96 58 sec 373 m
Blackshaws Road (west) 0.98 80 sec 179 m
It is noted that the north and west approaches are expected to operate beyond a DOS of 0.95 in
the PM peak hour following full development of the site, the others in the area and the proposed
mitigating works. However, the resulting DOS of 0.96 and 0.98 are considered to only be
marginally above the theoretical limit of 0.95, which is considered to not be uncommon for such
an arterial road in an inner Melbourne location servicing the West Gate Freeway.
Proposed Access Intersections
In terms of the operation of the proposed access intersections following full development of the
site and the others in the area, only the two main access intersections that permit full turning
movements located along Blackshaws Road are expected to require any operational
assessment.
As such, these have been assessed through SIDRA INTERSECTION. Table 6.7 presents a summary of
the anticipated operation of the two main access intersections proposed along Blackshaws
Road following the full development of the site. Detailed results of this analysis are provided in
Appendix C of this report.
Table 6.7: Proposed Access Intersections – Post-Development Operation
Intersection Period Approach DOS Average
Delay (sec)
95th Percentile
Queue (m)
Main Site Access /
Blackshaws Road
(Signalised)
AM
Blackshaws Road (east) 0.46 12 sec 89 m
Main Site Access (north) 0.60 38 sec 87 m
Blackshaws Road (west) # 0.62 9 sec 94 m
PM
Blackshaws Road (east) # 0.72 10 sec 92 m
Main Site Access (north) 0.71 50 sec 59 m
Blackshaws Road (west) 0.59 4 sec 29 m
2nd Site Access /
Blackshaws Road
(Unsignalised)
AM
Blackshaws Road (east) 0.40 0 sec 1 m
2nd Site Access (north) # 0.54 24 sec 15 m
Blackshaws Road (west) 0.37 0 sec 0 m
PM
Blackshaws Road (east) 0.44 1 sec 3 m
2nd Site Access (north) # 0.80 60 sec 23 m
Blackshaws Road (west) 0.54 1 sec 0 m
DOS – Degree of Saturation, # - Intersection DOS
Table 6.7 indicates that the proposed access intersections can be expected to operate
satisfactorily following full development of the site and others in the area.
The assessment typically required of the future operation of the proposed site access intersections
(i.e. 10 years following their construction) is considered to have been addressed through the
inclusion of traffic from the other proposed developments in the area. These other developments
Traffic Impact Assessment
14M1544000 23/03/15
Precinct 15, Blackshaws Road, Altona North Issue: C
Development / Structure Plan Transport Assessment Page: 43
are considered to represent the majority of any additional traffic volumes that could reasonable
expected to be generated in the area and travel along Blackshaws Road past the site.
Surrounding Arterial Road Network Based on the proposed vehicle access approach it is expected that the majority of the
anticipated additional site generated traffic will utilise Blackshaws Road to access the
surrounding arterial road network, and particularly Millers Road and Melbourne Road. While the
above intersection assessments consider there to be sufficient capacity following some mitigating
works to enable a suitable level of access between the precinct and the surrounding arterial
road network, it is noted that there are current significant capacity constraints within the arterial
network in the area, especially in accessing the West Gate Freeway in the northbound direction
in the AM peak hour and southbound in the PM peak hour.
This is an existing constraint that could not be reasonably expected to be mitigated by any one
development. Moreover, the level of impact this development and the others in the area will
have on this existing constraint is expected to be moderate, given the traffic volumes involved.
Rather, it is expected that this existing constraint will be addressed at a more macro level through
initiatives implemented by Council, VicRoads, DPTLI, and other associated agencies over the
medium to long-term, through such initiatives as those indicated in Section 2 of this report.
However, at a precinct level, it is recommended that suitable initiatives to provide the
opportunity and encouragement of residents to use alternative transport modes be investigated
to generate a significant mode shift away from the use of private motor vehicles, especially when
travelling to and from employment, so the anticipated traffic generated by the developments in
the area are not fully achieved.
At this point in the development of the Development / Structure Plan, such initiatives have been
considered for the Precinct through the provision of suitable cycling and pedestrian facilities and
access to the current bus services travelling along the frontages of the Precinct. The ability for bus
services to travel through the Precinct is also provided, which should help connect potential
residents to the local employment centres and train network. Further consideration of supporting
and encouraging the use of alternative transport modes by potential residents of the Precinct is
discussed throughout this report and is expected to be considered further within a Precinct
focused Integrated Transport Plan8 that will be prepared later in the planning process.
Surrounding Local Road Network Whilst the site access strategy seeks to maximise the use of Blackshaws Road to access the site, it
is anticipated that there will be some additional traffic that will access the site through the local
roads to the east and west of the site.
In this regard, based on the analysis in Section 6.3 of this report, Table 6.8 has been prepared to
summarise the likely post development traffic volumes on the local roads in the vicinity of the
subject areas likely to be used to access the site.
8 In line with Department of Transports Land Use and Development Guidelines for an integrated transport network:
http://www.transport.vic.gov.au/__data/assets/pdf_file/0018/31239/PTGuidelinesLandUseDevelopment.pdf

Traffic Impact Assessment
14M1544000 23/03/15
Precinct 15, Blackshaws Road, Altona North Issue: C
Development / Structure Plan Transport Assessment Page: 44
Table 6.8: Midblock Capacity Analysis
Location PM Peak Two-way Flows Mid-Block Capacity [3]
(vpd) Base Case (vpd) Post Development (vpd)
The Avenue 5,939 [1] 7,369 7,000
Kernot Street 5,068 [1] 6,498 7,000
Brunel Street 2,682 [2] 4,112 7,000
Hudsons Road 1,756 [2] 1,756 3,000
Marigold Avenue 1,900 [1] 3,910 3,000
[1] Based on week-long pneumatic tube count data provided by Hobsons Bay City Council for the associated streets completed in
April, 2012
[2] Based on week-long pneumatic tube counts undertaken by GTA Consultants in June, 2012
[3] Source: Hobsons Bay Planning Scheme, Clause 56.06.
vpd – Vehicles per day
Table 6.8 indicates that the road network in the vicinity of the subject site currently operates with
a satisfactory level of service, and will generally continue under post development conditions for
the subject site and others in the area.
However, it is noted that The Avenue and Marigold Avenue could potentially operate over their
indicative midblock capacities.
With regard to The Avenue, this is only expected to occur for the section between Melbourne
Road and Kernot Street, which has an increased carriageway width compared to typical
carriageway dimensions for a connector street, and can be expected to be able to
accommodate the marginally higher daily traffic volumes than indicated within Table C1 of
Clause 56.08-8 of the Hobsons Bay Planning Scheme. Also, the indicated post-development two-
way daily traffic volumes are considered to be conservative on the high side, as vehicles can
access Melbourne Road through other local roads, such as Hudsons Road. Furthermore, within an
urban environment, the capacity of intersections is considered to be more of a constraint than
mid-block volumes. This has been considered through the post-development analysis of the
Melbourne Road / The Avenue signalised intersection assessment, which indicates that the
intersection can be expected to operate satisfactorily with a DOS of 0.94 following full
development of the subject site and others in the area.
With regards to Marigold Street, the indicated post-development two-way daily traffic volumes
are considered to be conservative on the high side, as vehicles from the north can access the
site through other local roads, such as Clematis Avenue and Cyclemen Avenue. Further, and as
mentioned above, the intersection operation is generally considered to provide a better
indication of the ability to accommodate such traffic volumes. This has been considered through
the post-development analysis of the Millers Road / Marigold Avenue signalised intersection
assessment, which indicates that the intersection can be expected to operate satisfactorily with
a DOS of 0.94 following full development of the subject site and others in the area.
Moreover, at a more macro-level and given the current and expected levels of traffic congestion
on the West Gate Freeway, there is expected to be a shift away from the use of private motor
vehicles for at least commuter trips to the Melbourne CBD, and therefore the anticipated traffic
volumes may not be fully realised by the proposed development in the area.

Traffic Impact Assessment
14M1544000 23/03/15
Precinct 15, Blackshaws Road, Altona North Issue: C
Development / Structure Plan Transport Assessment Page: 45
6.6 Summary
On the basis of the above discussions and analysis, it is considered that the anticipated traffic
generated by the proposed rezoning and development of Precinct 15, can be accommodated
by the surrounding road network under immediate post-development conditions, subject to the
following mitigating road works to the existing road infrastructure:
At the Millers Road / Blackshaws Road signalised intersection:
Extend the right-turn lane on the east approach of the intersection by 140m to
200m through modification to road markings and introduction of parking
restrictions that at least restricts kerbside parking during the commuter traffic
peaks.
Convert the through lane on the east approach of the intersection to a through
and right turn lane by modifying the directional arrow markings.
Modify the intersection phasing to have a split phasing for the east and west
approaches.
Increase the lengths of ‘No Stopping’ parking restrictions and install line marked right
turn lanes on Blackshaws Road at the unsignalised intersections with Kyle Road, New
Street, Hansen Street and The Broadway,
Additionally, it will be necessary to install traffic signals at the new site access intersection to
Blackshaws Road adjacent to the proposed mixed use zone and construct other site access
intersections.
It is expected that the full costs of implementing the above mitigating works and the proposed
access arrangements will be implemented through a Development Contributions Plan (funded
by developers, Council and VicRoads) and/or conditions of a planning permit.

Integrated Transport Infrastructure
14M1544000 23/03/15
Precinct 15, Blackshaws Road, Altona North Issue: C
Development / Structure Plan Transport Assessment Page: 46
7. Integrated Transport Infrastructure
7.1 Preamble
As the proposal is only in the Development Plan and rezoning phase, the details are still being
developed. However, eventually the development of the site will need to accord with the
requirements of Clause 56 of the Hobson Bay Planning Scheme. Therefore, this section of the
report assesses the proposed development against the access and mobility requirements set out
within Clause 56.06 of the Planning Scheme for subdivisions.
Clause 56.06 aims to:
“achieve an urban structure where compact and walkable neighbourhoods are clustered to
support larger activity centres on the Principal Public Transport Network in Metropolitan
Melbourne and on the regional public transport network outside Metropolitan Melbourne.
To provide for walking (including persons with impaired mobility), cycling, public transport and
other motor vehicles in an integrated manner.
To contribute to reduced car dependence, improved energy efficiency, reduced greenhouse
gas emissions and reduced air pollution.”
Standard C14 of the Clause requires that a plan of the layout of the neighbourhood be prepared
that meets the objectives of:
Clause 56.06-2 Walking and cycling network
Clause 56.06-3 Public Transport network
Clause 56.06-4 Neighbourhood street network.
Clause 56.06 divides walking and cycling facilities, public transport facilities and street network
design into two areas, being Network Objectives and Detail Objectives, of which much of the
latter is a matter for detailed design and therefore cannot be assessed at this stage.
7.2 Walking and Cycling
Statutory Requirements
The walking and cycling network and detailed objectives set out within Clause 56.06-2 and 56.06-
5 respectively state the following:
Clause 56.06-2
“To contribute to community health and well-being by encouraging walking and
cycling as part of the daily lives of residents, employees and visitors.
To provide safe and direct movement through and between neighbourhoods by
pedestrian and cyclists.
To reduce car use, greenhouse gas emissions and air pollution.”
Clause 56.06-5
“To design and construct footpaths, shared cycle path networks that are safe,
comfortably, well constructed and accessible for people with disabilities.
To design footpaths to accommodate wheelchairs, prams, scooters and other
footpath vehicles”
Standards C15 and C18 set out the requirements that should be met to meet the objectives of
these Clauses.
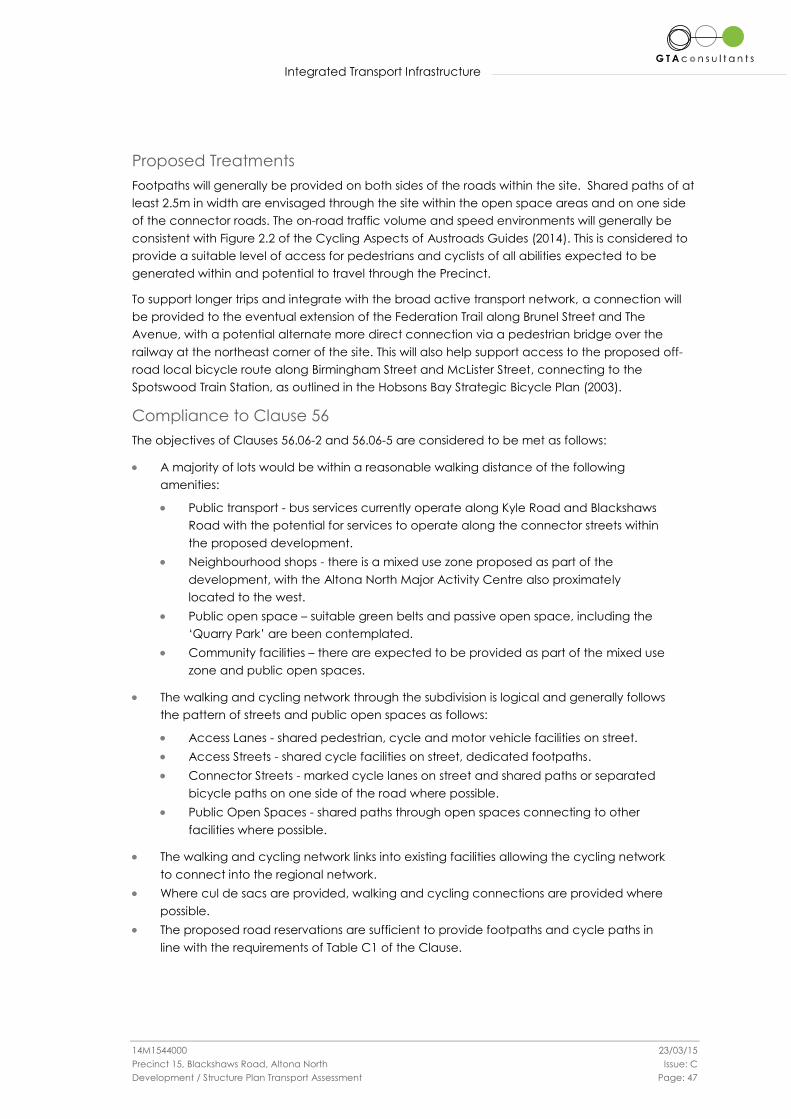
Integrated Transport Infrastructure
14M1544000 23/03/15
Precinct 15, Blackshaws Road, Altona North Issue: C
Development / Structure Plan Transport Assessment Page: 47
Proposed Treatments
Footpaths will generally be provided on both sides of the roads within the site. Shared paths of at
least 2.5m in width are envisaged through the site within the open space areas and on one side
of the connector roads. The on-road traffic volume and speed environments will generally be
consistent with Figure 2.2 of the Cycling Aspects of Austroads Guides (2014). This is considered to
provide a suitable level of access for pedestrians and cyclists of all abilities expected to be
generated within and potential to travel through the Precinct.
To support longer trips and integrate with the broad active transport network, a connection will
be provided to the eventual extension of the Federation Trail along Brunel Street and The
Avenue, with a potential alternate more direct connection via a pedestrian bridge over the
railway at the northeast corner of the site. This will also help support access to the proposed off-
road local bicycle route along Birmingham Street and McLister Street, connecting to the
Spotswood Train Station, as outlined in the Hobsons Bay Strategic Bicycle Plan (2003).
Compliance to Clause 56
The objectives of Clauses 56.06-2 and 56.06-5 are considered to be met as follows:
A majority of lots would be within a reasonable walking distance of the following
amenities:
Public transport - bus services currently operate along Kyle Road and Blackshaws
Road with the potential for services to operate along the connector streets within
the proposed development.
Neighbourhood shops - there is a mixed use zone proposed as part of the
development, with the Altona North Major Activity Centre also proximately
located to the west.
Public open space – suitable green belts and passive open space, including the
‘Quarry Park’ are been contemplated.
Community facilities – there are expected to be provided as part of the mixed use
zone and public open spaces.
The walking and cycling network through the subdivision is logical and generally follows
the pattern of streets and public open spaces as follows:
Access Lanes - shared pedestrian, cycle and motor vehicle facilities on street.
Access Streets - shared cycle facilities on street, dedicated footpaths.
Connector Streets - marked cycle lanes on street and shared paths or separated
bicycle paths on one side of the road where possible.
Public Open Spaces - shared paths through open spaces connecting to other
facilities where possible.
The walking and cycling network links into existing facilities allowing the cycling network
to connect into the regional network.
Where cul de sacs are provided, walking and cycling connections are provided where
possible.
The proposed road reservations are sufficient to provide footpaths and cycle paths in
line with the requirements of Table C1 of the Clause.

Integrated Transport Infrastructure
14M1544000 23/03/15
Precinct 15, Blackshaws Road, Altona North Issue: C
Development / Structure Plan Transport Assessment Page: 48
7.3 Public Transport
Statutory Requirements
Clause 56.06-3 and 56.06-6 set out the public transport network and detailed design objectives for
subdivisions as follows:
Clause 56.06-3
“To provide an arterial road and neighbourhood street network that supports a direct efficient
and safe public transport system.
To encourage maximum use of public transport.”
Clause 56.06-6
“To provide for the safe, efficient operation of public transport and the comfort and convenience
of public transport users; and.
To provide public transport stops that are accessible to people with disabilities.”
Standards C16 and C19 set out the standards that need to be met in relation to bus routes and
the location and design of bus and tram stops.
Proposed Treatments
Provision has been made to accommodate future bus routes on the connector streets within the
Precinct, with the ability to accommodate future kerbside bus stops along the east-west
connector street between Kyle Road and New Street.
In combination with the surrounding existing bus routes almost the whole of the subject site would
be within 400m walking distance of a bus stop if a future route operates along the connector
streets.
Compliance with Clause 56
Section 2.5 of this report discusses the integrated transport network surrounding the development
site from which it is apparent that public transport would be accessible to residents within the
new subdivision.
Although the proposed development is considered large enough to suggest that public transport
services through the site could be viable, the implementation of these services is a matter for the
public transport operators and DEDJTR. However, the objectives of Clause 56.06-3 and 56.06-6
are considered to be met.
7.4 Neighbourhood Street
Statutory Requirements
Clauses 56.06.4 and 56.06-7 set out the neighbourhood street network and detail objectives and
aims as follows:
Clause 56.06.4
“Provide for a direct, safe and easy movement through and between neighbourhoods for
pedestrians, cyclists, public transport and other motor vehicles using the neighbourhood street
network.”
Clause 56.06.7
“To design and construct street carriageways and verges so that the geometry and traffic speeds
provide an accessible and safe neighbourhood street system for all users.”
Standards C17 and C20 set out a number of standards that should be met to achieve the aims of
Clauses 56.06-4 and Clause 56.06-7.

Integrated Transport Infrastructure
14M1544000 23/03/15
Precinct 15, Blackshaws Road, Altona North Issue: C
Development / Structure Plan Transport Assessment Page: 49
Proposed Treatments
The proposed subdivision would connect into the existing street network at the following
locations:
A new signalised intersection with Blackshaws Road towards the east of the precinct,
between The Broadway and Hansen Street.
Additional unsignalised accesses from Blackshaws Road.
Additional access points from Kyle Road, including an upgraded intersection with
Cyclamen Avenue.
Additional access points from New Street, including an upgraded intersection with
Brunel Street.
In terms of the internal neighbourhood street network, an indicative street hierarchy is shown in
Figure 7.1.
Figure 7.1: Indicative Street Network Hierarchy
Note: Subject to change at detailed design
Compliance with Clause 56
Table 7.1 assesses the proposed road hierarchy against the requirements of Clause 56.06-7 of the
Hobsons Bay Planning Scheme.
Access Lane
Access Street – Level 1
Access Street – Level 2
Connector Street – Level 1
Connector Street – Level 2

Integrated Transport Infrastructure
14M1544000 23/03/15
Precinct 15, Blackshaws Road, Altona North Issue: C
Development / Structure Plan Transport Assessment Page: 50
Table 7.1: Proposed Road Hierarchy Details
Street Type Target
Speed
Indicative Road
Reservation Width [1]
Parking Provision
Theoretical
Capacity Daily
Traffic Volume
Anticipated
Peak Daily
Traffic Volume
Access Lane 10kph 5.5m None 300 vehicles per
day <300 vpd
Access Street –
Level 1 30kph 13.5m
Kerbside parking
along one side of
the road
1,000 to 2,000
vehicles per day
<2,000 vpd
Access Street –
Level 2 40kph 16m to 16.5m
Kerbside parking
along both sides of
the road
2,000 to 3,000
vehicles per day
Connector
Street – Level 1 50kph 17.4m to 24m
Kerbside or
indented parking
on both sides of
the road
3,000 vehicles per
day
6,500 vpd3
Connector
Street – Level 2 60kph
20.4m to 27m
[2]
Potential for
indented parking
on both sides of
the road
3,000 to 7,000
vehicles per day
[1] Minimum road reserve calculated based on minimum carriageway width and verge width set out within Table C1 of Clause 56.06
plus indented parking bay width of 2.1m plus 0.5m clearance where provided.
[2] Minimum road reservation clear of intersections with connector street level 2 and arterial roads where road reservation needs to
increase to provide for turning lanes.
[3] The short section of the north-south connector street adjacent to the eastern side of the contemplated mixed use zone is
expected to carry up to 7,850 vpd, but will be suitably designed to accommodate such traffic volumes.
As indicated within Table 7.1 the proposed road hierarchy accords with the minimum
requirements necessary to allow carriageways, footpaths and cycle paths to be accommodated
appropriate to the road type as specified within Table C1 of Clause 56.06.
It is noted that all road reservations include additional widths at intersections in order to
incorporate the visibility splay requirements set out within Standard C20.
The speed targets for the internal street network would be met due to the inclusion of the
following:
network design incorporating bends as slow points
provision of slow points or other similar suitable treatments to limit maximum leg lengths
to achieve target speed.
The design of the latter would be undertaken as part of the detailed design of the street network
and those that would be located on connector streets should be designed to accommodate
buses.
The contemplated internal road network is anticipated to accommodate traffic volumes less
than the associated road type’s theoretical capacity, except for the short section of the
proposed north-south connector street adjacent to the eastern side of the mixed use zone.
At this location the roadway would be expected to carry up to 7,850 vehicles per day. While this
exceeds the theoretical capacity of 7,000 vehicles per day for a connector street, this section of
the north-south connector street could be widened to accommodate a central median, with no
kerbside parking permitted to maximise its capacity.
In addition, it is noted that no dedicated on-road bicycle lanes are proposed on the connector
streets. Instead, off-road facilities are being contemplated on one side of the connector street
carriageways within the road reserves, and with suitable crossing facilities they would be
appropriate for the majority of potential users. Moreover, if vehicle speeds are managed
appropriately on the connector streets mixed traffic conditions are considered to be appropriate

Integrated Transport Infrastructure
14M1544000 23/03/15
Precinct 15, Blackshaws Road, Altona North Issue: C
Development / Structure Plan Transport Assessment Page: 51
for those users that wish to cycle on the road. Furthermore, widening the carriageway to
accommodate dedicated bicycle lanes is considered to be counterproductive in trying to
manage vehicle speeds.

Car Parking
14M1544000 23/03/15
Precinct 15, Blackshaws Road, Altona North Issue: C
Development / Structure Plan Transport Assessment Page: 52
8. Car Parking
8.1 Residential Dwellings
Car parking for the proposed residential dwelling lots should be provided in accordance with the
requirements of Clause 52.06 of the Hobsons Bay Planning Scheme through a minimum provision
of single garages for one and two bedroom dwellings and double garages for three or more
bedroom dwellings. Visitor car parking demands are expected to be able to be accommodated
on-street.
8.2 Apartments
Integrated car parking facilities should be provided for any apartment buildings, with a typical
on-site car parking provision of one space for one and two bedroom apartments and two spaces
for three or more bedroom apartments.
Residential visitor car parking demands are expected to be able to be accommodated on-
street.
Consideration could also be given to reducing the above car parking provision to help
encourage the use of alternative transport modes, especially for any small one-bedroom
dwellings.
8.3 Mixed Use Zone
While the specific details for approx. 5,550sqm of retail floor space within a mixed use zone have
not been confirmed at this time, it is expected to include typical shop, supermarket and café
uses, with the potential for some limited office and/or medical centre facilities. It is likely that a
provision of in the order of 280 car spaces will be needed to be consistent with the statutory car
parking rates for such land uses within Clause 52.06 of the Hobsons Bay Planning Scheme. A future
permit application for the mixed use zone would include a detailed parking assessment, including
the impacts of shared parking arrangements.

Conclusion
14M1544000 23/03/15
Precinct 15, Blackshaws Road, Altona North Issue: C
Development / Structure Plan Transport Assessment Page: 53
9. Conclusion
Based on the analysis and discussions presented within this report, the following conclusions are
made:
i The proposed land uses associated with the development of the site following rezoning
would be expected to generate approximately 16,888 vehicle movements per day and
up to 1,700 vehicle movements per peak hour external to the site.
ii Over and above the existing traffic volumes experienced in the surrounding road
network, the proposed development would distribute approximately 15,828 additional
vehicle movements per day and up to 1,500 vehicles per peak hour when
consideration is given to the traffic movements currently generated by the existing land
uses.
iii There is sufficient capacity within the existing immediate road network to
accommodate the additional traffic movements, subject to the following mitigating
road works at the Millers Road / Blackshaws Road intersection:
Extend the right-turn lane on the east approach of the intersection by 140m to
200m.
Convert the through lane on the east approach of the intersection to a through
and right turn lane.
Modify the intersection phasing to have a split phasing for the east and west
approaches.
vi In addition, it is expected that increased lengths of ‘No Stopping’ parking restrictions
and right turn lanes will need to be provided on Blackshaws Road at the intersections
with Schutt Street, New Street, Hansen Street and The Broadway to improve the level of
service and attractiveness of Blackshaws Road in accessing the Precinct.
iv The internal road network and access arrangements as contemplated are considered
appropriate and are expected to operate safely and efficiently.
v The proposed development will be expected to include walking and cycling routes
that connect all dwellings with local major trip generators and the surrounding bus
services and passenger train lines. This, along with other macro-level transport
conditions and initiatives, should help see a shift away from the use of private motor
vehicles for at least commuter trips into the future and therefore the above anticipated
traffic volumes may not be fully realised on the surrounding road network.

Appendix A
14M1544000 23/03/15
Precinct 15, Blackshaws Road, Altona North Issue: C
Development / Structure Plan Transport Assessment
Ap
pe
nd
ix A
Appendix A
SIDRA INTERSECTION Results – Existing Conditions


MOVEMENT SUMMARY Site: Melbourne Road/The Avenue - AM Peak
Melbourne Road / The Avenue Signals - Fixed Time Cycle Time = 116 seconds (User-Given Cycle Time)
Movement Performance - Vehicles
Mov ID Turn Demand Flow
HV Deg. Satn Average Delay
Level of Service
95% Back of Queue Prop. Queued
Effective Stop Rate
Average Speed Vehicles Distance
veh/h % v/c sec veh m per veh km/h
South: Melbourne Road (S)
1 L 1 0.0 0.537 16.3 LOS B 12.1 84.9 0.37 1.02 42.7
2 T 1263 0.0 0.537 8.1 LOS A 12.1 84.9 0.37 0.34 47.7
3 R 3 0.0 0.060 66.7 LOS E 0.2 1.2 0.97 0.62 21.1
Approach 1267 0.0 0.537 8.3 LOS A 12.1 84.9 0.37 0.34 47.5
East: The Avenue (E)
4 L 1 0.0 0.206 49.5 LOS D 0.9 6.5 0.85 0.75 26.5
5 T 19 0.0 0.206 41.3 LOS D 0.9 6.5 0.85 0.59 27.0
6 R 118 0.0 0.426 54.7 LOS D 6.1 42.5 0.93 0.80 23.9
Approach 138 0.0 0.426 52.8 LOS D 6.1 42.5 0.92 0.77 24.3
North: Melbourne Road (N)
7 L 28 0.0 0.333 16.5 LOS B 6.5 45.4 0.33 0.98 42.3
8 T 738 0.0 0.333 7.5 LOS A 6.5 45.4 0.31 0.27 48.4
9 R 49 0.0 0.515 70.3 LOS E 2.9 20.6 1.00 0.74 20.4
Approach 816 0.0 0.515 11.6 LOS B 6.5 45.4 0.35 0.32 44.5
West: The Avenue (W)
10 L 377 0.0 0.801 22.2 LOS C 11.0 77.1 0.49 0.81 37.5
11 T 23 0.0 0.151 42.7 LOS D 2.2 15.5 0.87 0.66 25.9
12 R 23 0.0 0.151 50.9 LOS D 2.2 15.5 0.87 0.77 25.5
Approach 423 0.0 0.801 24.9 LOS C 11.0 77.1 0.53 0.80 35.7
All Vehicles 2644 0.0 0.801 14.3 LOS B 12.1 84.9 0.42 0.43 42.3
Level of Service (LOS) Method: Delay (HCM 2000).
Vehicle movement LOS values are based on average delay per movement
Intersection and Approach LOS values are based on average delay for all vehicle movements.
SIDRA Standard Delay Model used.
Movement Performance - Pedestrians
Mov ID
Description Demand
Flow Average
Delay Level of Service
Average Back of Queue Prop. Queued
Effective Stop Rate Pedestrian Distance
ped/h sec ped m per ped
P1 Across S approach 53 49.3 LOS E 0.2 0.2 0.92 0.92
P3 Across E approach 53 18.2 LOS B 0.1 0.1 0.56 0.56
P5 Across N approach 53 49.3 LOS E 0.2 0.2 0.92 0.92
P7 Across W approach 53 17.1 LOS B 0.1 0.1 0.54 0.54
All Pedestrians 212 33.5 LOS D 0.74 0.74
Level of Service (LOS) Method: SIDRA Pedestrian LOS Method (Based on Average Delay)
Pedestrian movement LOS values are based on average delay per pedestrian movement.
Intersection LOS value for Pedestrians is based on average delay for all pedestrian movements.
Processed: Wednesday, 9 July 2014 2:19:52 PM SIDRA INTERSECTION 5.1.13.2093
Copyright © 2000-2011 Akcelik and Associates Pty Ltd www.sidrasolutions.com
Project: P:\14M1500-1599\14M1544000 Lot 14, Precinct 15, Blackshaws Rd\Modelling\SIDRA\140708sid-14M1544000-Melbourne Road The Avenue.sip 8000056, GTA CONSULTANTS, ENTERPRISE

MOVEMENT SUMMARY Site: Melbourne Road/The Avenue - PM Peak
Melbourne Road / The Avenue Signals - Fixed Time Cycle Time = 111 seconds (User-Given Phase Times)
Movement Performance - Vehicles
Mov ID Turn Demand Flow
HV Deg. Satn Average Delay
Level of Service
95% Back of Queue Prop. Queued
Effective Stop Rate
Average Speed Vehicles Distance
veh/h % v/c sec veh m per veh km/h
South: Melbourne Road (S)
1 L 17 0.0 0.543 18.6 LOS B 13.4 94.0 0.45 0.99 41.1
2 T 1184 0.0 0.543 10.4 LOS B 13.4 94.0 0.45 0.40 45.1
3 R 5 0.0 0.091 61.4 LOS E 0.3 1.9 0.93 0.64 22.3
Approach 1206 0.0 0.543 10.7 LOS B 13.4 94.0 0.45 0.41 44.9
East: The Avenue (E)
4 L 1 0.0 0.312 56.4 LOS E 1.4 9.9 0.93 0.74 24.5
5 T 27 0.0 0.312 48.2 LOS D 1.4 9.9 0.93 0.66 24.8
6 R 55 0.0 0.298 58.4 LOS E 2.8 19.8 0.95 0.76 23.0
Approach 83 0.0 0.312 55.0 LOS E 2.8 19.8 0.95 0.73 23.6
North: Melbourne Road (N)
7 L 41 0.0 0.660 10.9 LOS B 6.6 46.0 0.18 1.03 46.8
8 T 1547 0.0 0.660 2.2 LOS A 6.6 46.0 0.16 0.15 55.7
9 R 213 0.0 0.748 59.6 LOS E 11.4 79.9 0.99 0.86 22.7
Approach 1801 0.0 0.748 9.2 LOS A 11.4 79.9 0.26 0.25 47.4
West: The Avenue (W)
10 L 155 0.0 0.290 10.2 LOS B 1.9 13.0 0.31 0.68 46.9
11 T 17 0.0 0.134 48.7 LOS D 1.3 9.2 0.93 0.68 24.3
12 R 9 0.0 0.134 56.8 LOS E 1.3 9.2 0.93 0.74 24.0
Approach 181 0.0 0.290 16.2 LOS B 1.9 13.0 0.40 0.68 41.3
All Vehicles 3272 0.0 0.748 11.3 LOS B 13.4 94.0 0.35 0.35 44.9
Level of Service (LOS) Method: Delay (HCM 2000).
Vehicle movement LOS values are based on average delay per movement
Intersection and Approach LOS values are based on average delay for all vehicle movements.
SIDRA Standard Delay Model used.
Movement Performance - Pedestrians
Mov ID
Description Demand
Flow Average
Delay Level of Service
Average Back of Queue Prop. Queued
Effective Stop Rate Pedestrian Distance
ped/h sec ped m per ped
P3 Across E approach 53 21.4 LOS C 0.1 0.1 0.62 0.62
P7 Across W approach 53 20.2 LOS C 0.1 0.1 0.60 0.60
All Pedestrians 106 20.8 LOS C 0.61 0.61
Level of Service (LOS) Method: SIDRA Pedestrian LOS Method (Based on Average Delay)
Pedestrian movement LOS values are based on average delay per pedestrian movement.
Intersection LOS value for Pedestrians is based on average delay for all pedestrian movements.
Processed: Wednesday, 9 July 2014 2:20:35 PM SIDRA INTERSECTION 5.1.13.2093
Copyright © 2000-2011 Akcelik and Associates Pty Ltd www.sidrasolutions.com
Project: P:\14M1500-1599\14M1544000 Lot 14, Precinct 15, Blackshaws Rd\Modelling\SIDRA\140708sid-14M1544000-Melbourne Road The Avenue.sip 8000056, GTA CONSULTANTS, ENTERPRISE


MOVEMENT SUMMARY Site: Melbourne Road/Hudson Road - AM Existing
New Site Signals - Fixed Time Cycle Time = 90 seconds (User-Given Cycle Time)
Movement Performance - Vehicles
Mov ID Turn Demand Flow
HV Deg. Satn Average Delay
Level of Service
95% Back of Queue Prop. Queued
Effective Stop Rate
Average Speed Vehicles Distance
veh/h % v/c sec veh m per veh km/h
South: Melbourne Road (S)
1 L 1 0.0 0.752 25.3 LOS C 17.3 121.4 0.77 0.94 37.4
2 T 1074 0.0 0.752 17.1 LOS B 17.3 121.4 0.77 0.69 38.8
3 R 28 0.0 0.230 51.8 LOS D 1.2 8.5 0.94 0.71 24.7
Approach 1103 0.0 0.752 18.0 LOS B 17.3 121.4 0.78 0.69 38.3
East: Hudson Road (E)
4 L 32 0.0 0.086 28.1 LOS C 1.7 12.0 0.68 0.79 34.5
5 T 28 0.0 0.086 19.9 LOS B 1.7 12.0 0.68 0.53 36.1
6 R 115 0.0 0.695 55.1 LOS E 5.3 37.3 1.00 0.84 23.8
Approach 175 0.0 0.695 44.5 LOS D 5.3 37.3 0.89 0.78 26.8
North: Melbourne Road (N)
7 L 133 0.0 0.521 31.2 LOS C 11.6 81.5 0.77 0.87 33.3
8 T 606 0.0 0.521 22.6 LOS C 11.6 81.5 0.75 0.64 35.1
9 R 13 0.0 0.102 53.2 LOS D 0.6 3.9 0.97 0.68 24.3
Approach 752 0.0 0.521 24.7 LOS C 11.6 81.5 0.75 0.68 34.5
West: Hudson Road (W)
10 L 32 0.0 0.347 41.4 LOS D 5.1 36.0 0.90 0.81 29.0
11 T 89 0.0 0.347 33.2 LOS C 5.1 36.0 0.90 0.72 29.4
12 R 14 0.0 0.347 41.4 LOS D 5.1 36.0 0.90 0.81 29.0
Approach 135 0.0 0.347 36.0 LOS D 5.1 36.0 0.90 0.75 29.3
All Vehicles 2164 0.0 0.752 23.6 LOS C 17.3 121.4 0.78 0.70 35.1
Level of Service (LOS) Method: Delay (HCM 2000).
Vehicle movement LOS values are based on average delay per movement
Intersection and Approach LOS values are based on average delay for all vehicle movements.
SIDRA Standard Delay Model used.
Movement Performance - Pedestrians
Mov ID
Description Demand
Flow Average
Delay Level of Service
Average Back of Queue Prop. Queued
Effective Stop Rate Pedestrian Distance
ped/h sec ped m per ped
P1 Across S approach 53 39.2 LOS D 0.1 0.1 0.93 0.93
P5 Across N approach 53 39.2 LOS D 0.1 0.1 0.93 0.93
All Pedestrians 106 39.2 LOS D 0.93 0.93
Level of Service (LOS) Method: SIDRA Pedestrian LOS Method (Based on Average Delay)
Pedestrian movement LOS values are based on average delay per pedestrian movement.
Intersection LOS value for Pedestrians is based on average delay for all pedestrian movements.
Processed: Friday, 21 December 2012 12:31:06 PM SIDRA INTERSECTION 5.1.13.2093
Copyright © 2000-2011 Akcelik and Associates Pty Ltd www.sidrasolutions.com
Project: P:\14M1500-1599\14M1544000 Lot 14, Precinct 15, Blackshaws Rd\Modelling\SIDRA\140708sid-14M1544000-Melbourne Road Hudson Road.sip 8000056, GTA CONSULTANTS, ENTERPRISE

MOVEMENT SUMMARY Site: Melbourne Road/Hudson Road - PM Existing
Melbourne Road / Hudson Road Signals - Fixed Time Cycle Time = 97 seconds (User-Given Cycle Time)
Movement Performance - Vehicles
Mov ID Turn Demand Flow
HV Deg. Satn Average Delay
Level of Service
95% Back of Queue Prop. Queued
Effective Stop Rate
Average Speed Vehicles Distance
veh/h % v/c sec veh m per veh km/h
South: Melbourne Road (S)
1 L 13 0.0 0.590 28.3 LOS C 15.0 104.9 0.70 0.94 35.3
2 T 959 0.0 0.590 20.1 LOS C 15.0 105.1 0.70 0.62 37.0
3 R 20 0.0 0.174 57.6 LOS E 0.9 6.6 0.96 0.70 23.2
Approach 992 0.0 0.590 21.0 LOS C 15.0 105.1 0.71 0.62 36.5
East: Hudson Road (E)
4 L 63 0.0 0.208 33.3 LOS C 4.4 31.1 0.76 0.82 32.0
5 T 67 0.0 0.208 25.1 LOS C 4.4 31.1 0.76 0.62 33.1
6 R 187 0.0 0.872 56.3 LOS E 9.3 65.3 0.93 0.95 23.5
Approach 318 0.0 0.872 45.1 LOS D 9.3 65.3 0.86 0.85 26.6
North: Melbourne Road (N)
7 L 83 0.0 0.877 27.1 LOS C 29.1 203.8 0.83 0.98 36.1
8 T 1359 0.0 0.877 18.9 LOS B 29.3 204.8 0.83 0.82 37.3
9 R 25 0.0 0.220 55.8 LOS E 1.2 8.2 0.95 0.71 23.6
Approach 1467 0.0 0.877 20.0 LOS C 29.3 204.8 0.84 0.82 36.9
West: Hudson Road (W)
10 L 17 0.0 0.637 60.8 LOS E 3.5 24.3 1.00 0.80 22.6
11 T 17 0.0 0.637 52.6 LOS D 3.5 24.3 1.00 0.80 22.8
12 R 35 0.0 0.637 60.8 LOS E 3.5 24.3 1.00 0.80 22.7
Approach 68 0.0 0.637 58.8 LOS E 3.5 24.3 1.00 0.80 22.7
All Vehicles 2845 0.0 0.877 24.1 LOS C 29.3 204.8 0.80 0.76 34.7
Level of Service (LOS) Method: Delay (HCM 2000).
Vehicle movement LOS values are based on average delay per movement
Intersection and Approach LOS values are based on average delay for all vehicle movements.
SIDRA Standard Delay Model used.
Processed: Friday, 21 December 2012 12:31:48 PM SIDRA INTERSECTION 5.1.13.2093
Copyright © 2000-2011 Akcelik and Associates Pty Ltd www.sidrasolutions.com
Project: P:\14M1500-1599\14M1544000 Lot 14, Precinct 15, Blackshaws Rd\Modelling\SIDRA\140708sid-14M1544000-Melbourne Road Hudson Road.sip 8000056, GTA CONSULTANTS, ENTERPRISE


MOVEMENT SUMMARY
Site: Melbourne Road / Blackshaws Road - AM Peak Hour Existing Melbourne Road / Blackshaws Road Giveway / Yield (Two-Way)
Movement Performance - Vehicles
Mov ID ODMov
Demand Flows Deg. Satn Average Delay
Level of Service
95% Back of Queue Prop. Queued
Effective Stop Rate
Average Speed Total HV Vehicles Distance
veh/h % v/c sec veh m per veh km/h
South: Melbourne Road
1 L2 95 0.0 0.051 5.6 LOS A 0.0 0.0 0.00 0.53 54.9
2 T1 1108 0.0 0.284 0.0 LOS A 0.0 0.0 0.00 0.00 59.9
Approach 1203 0.0 0.284 0.5 NA 0.0 0.0 0.00 0.04 59.5
East: Blackshaws Road
4 L2 162 0.0 0.164 7.1 LOS A 0.6 4.4 0.39 0.63 52.9
Approach 162 0.0 0.164 7.1 LOS A 0.6 4.4 0.39 0.63 52.9
North: Melbourne Road
7 L2 61 0.0 0.033 5.6 LOS A 0.0 0.0 0.00 0.53 54.9
8 T1 607 0.0 0.156 0.0 LOS A 0.0 0.0 0.00 0.00 60.0
Approach 668 0.0 0.156 0.5 NA 0.0 0.0 0.00 0.05 59.5
All Vehicles 2034 0.0 0.284 1.0 NA 0.6 4.4 0.03 0.09 58.9
Level of Service (LOS) Method: Delay (HCM 2000).
Vehicle movement LOS values are based on average delay per movement
Minor Road Approach LOS values are based on average delay for all vehicle movements.
NA: Intersection LOS and Major Road Approach LOS values are Not Applicable for two-way sign control since the average delay is not a good LOS measure due to zero delays associated with major road movements.
SIDRA Standard Delay Model is used. Control Delay includes Geometric Delay.
Gap-Acceptance Capacity: SIDRA Standard (Akçelik M3D).
HV (%) values are calculated for All Movement Classes of All Heavy Vehicle Model Designation.
Processed: Tuesday, 30 September 2014 12:54:40 PM SIDRA INTERSECTION 6.0.24.4877
Copyright © 2000-2014 Akcelik and Associates Pty Ltd www.sidrasolutions.com
Project: P:\14M1500-1599\14M1544000 Lot 14, Precinct 15, Blackshaws Rd\Modelling\SIDRA\140930sid-14M1544000-Melbourne Road Blackshaws Road.sip6 8000056, 6017418, GTA CONSULTANTS, NETWORK / Enterprise

MOVEMENT SUMMARY
Site: Melbourne Road / Blackshaws Road - PM Peak Hour Existing Melbourne Road / Blackshaws Road Giveway / Yield (Two-Way)
Movement Performance - Vehicles
Mov ID ODMov
Demand Flows Deg. Satn Average Delay
Level of Service
95% Back of Queue Prop. Queued
Effective Stop Rate
Average Speed Total HV Vehicles Distance
veh/h % v/c sec veh m per veh km/h
South: Melbourne Road
1 L2 102 0.0 0.055 5.6 LOS A 0.0 0.0 0.00 0.53 54.9
2 T1 1043 0.0 0.268 0.0 LOS A 0.0 0.0 0.00 0.00 59.9
Approach 1145 0.0 0.268 0.5 NA 0.0 0.0 0.00 0.05 59.4
East: Blackshaws Road
4 L2 129 0.0 0.215 10.3 LOS B 0.8 5.5 0.61 0.83 50.8
Approach 129 0.0 0.215 10.3 LOS B 0.8 5.5 0.61 0.83 50.8
North: Melbourne Road
7 L2 187 0.0 0.100 5.6 LOS A 0.0 0.0 0.00 0.53 54.9
8 T1 1364 0.0 0.350 0.0 LOS A 0.0 0.0 0.00 0.00 59.9
Approach 1551 0.0 0.350 0.7 NA 0.0 0.0 0.00 0.06 59.3
All Vehicles 2825 0.0 0.350 1.1 NA 0.8 5.5 0.03 0.09 58.9
Level of Service (LOS) Method: Delay (HCM 2000).
Vehicle movement LOS values are based on average delay per movement
Minor Road Approach LOS values are based on average delay for all vehicle movements.
NA: Intersection LOS and Major Road Approach LOS values are Not Applicable for two-way sign control since the average delay is not a good LOS measure due to zero delays associated with major road movements.
SIDRA Standard Delay Model is used. Control Delay includes Geometric Delay.
Gap-Acceptance Capacity: SIDRA Standard (Akçelik M3D).
HV (%) values are calculated for All Movement Classes of All Heavy Vehicle Model Designation.
Processed: Tuesday, 30 September 2014 12:54:42 PM SIDRA INTERSECTION 6.0.24.4877
Copyright © 2000-2014 Akcelik and Associates Pty Ltd www.sidrasolutions.com
Project: P:\14M1500-1599\14M1544000 Lot 14, Precinct 15, Blackshaws Rd\Modelling\SIDRA\140930sid-14M1544000-Melbourne Road Blackshaws Road.sip6 8000056, 6017418, GTA CONSULTANTS, NETWORK / Enterprise

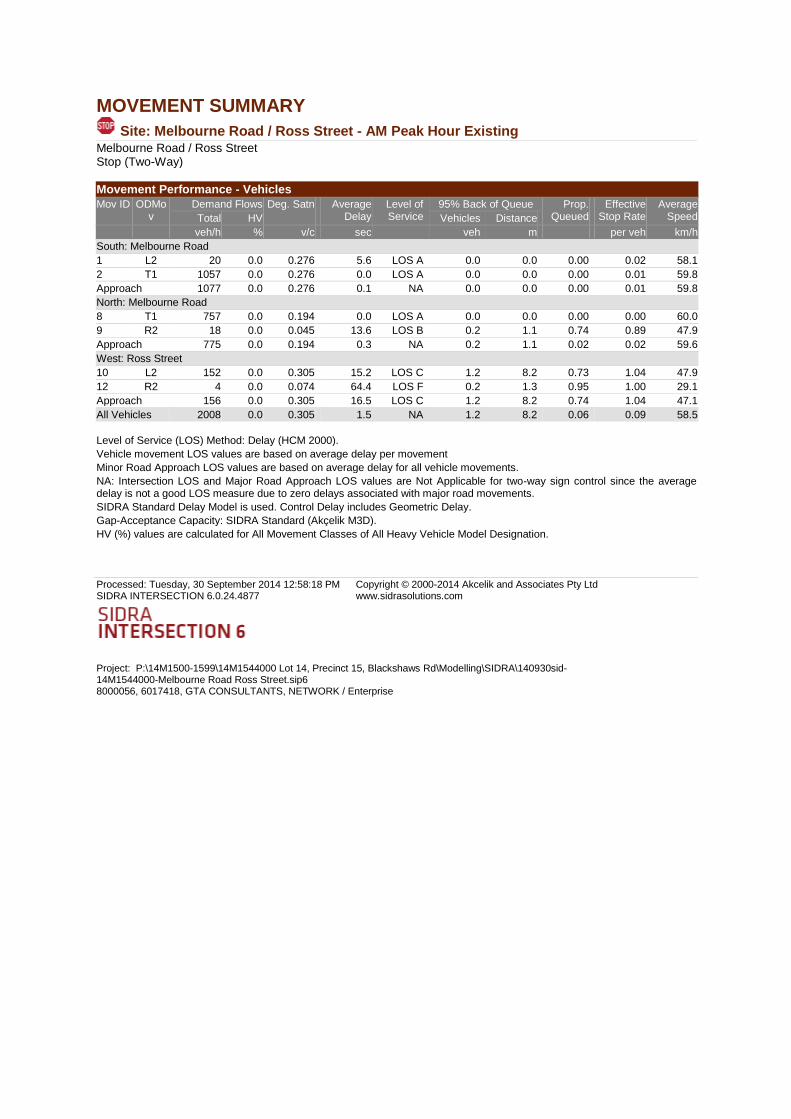
MOVEMENT SUMMARY
Site: Melbourne Road / Ross Street - AM Peak Hour Existing Melbourne Road / Ross Street Stop (Two-Way)
Movement Performance - Vehicles
Mov ID ODMov
Demand Flows Deg. Satn Average Delay
Level of Service
95% Back of Queue Prop. Queued
Effective Stop Rate
Average Speed Total HV Vehicles Distance
veh/h % v/c sec veh m per veh km/h
South: Melbourne Road
1 L2 20 0.0 0.276 5.6 LOS A 0.0 0.0 0.00 0.02 58.1
2 T1 1057 0.0 0.276 0.0 LOS A 0.0 0.0 0.00 0.01 59.8
Approach 1077 0.0 0.276 0.1 NA 0.0 0.0 0.00 0.01 59.8
North: Melbourne Road
8 T1 757 0.0 0.194 0.0 LOS A 0.0 0.0 0.00 0.00 60.0
9 R2 18 0.0 0.045 13.6 LOS B 0.2 1.1 0.74 0.89 47.9
Approach 775 0.0 0.194 0.3 NA 0.2 1.1 0.02 0.02 59.6
West: Ross Street
10 L2 152 0.0 0.305 15.2 LOS C 1.2 8.2 0.73 1.04 47.9
12 R2 4 0.0 0.074 64.4 LOS F 0.2 1.3 0.95 1.00 29.1
Approach 156 0.0 0.305 16.5 LOS C 1.2 8.2 0.74 1.04 47.1
All Vehicles 2008 0.0 0.305 1.5 NA 1.2 8.2 0.06 0.09 58.5
Level of Service (LOS) Method: Delay (HCM 2000).
Vehicle movement LOS values are based on average delay per movement
Minor Road Approach LOS values are based on average delay for all vehicle movements.
NA: Intersection LOS and Major Road Approach LOS values are Not Applicable for two-way sign control since the average delay is not a good LOS measure due to zero delays associated with major road movements.
SIDRA Standard Delay Model is used. Control Delay includes Geometric Delay.
Gap-Acceptance Capacity: SIDRA Standard (Akçelik M3D).
HV (%) values are calculated for All Movement Classes of All Heavy Vehicle Model Designation.
Processed: Tuesday, 30 September 2014 12:58:18 PM SIDRA INTERSECTION 6.0.24.4877
Copyright © 2000-2014 Akcelik and Associates Pty Ltd www.sidrasolutions.com
Project: P:\14M1500-1599\14M1544000 Lot 14, Precinct 15, Blackshaws Rd\Modelling\SIDRA\140930sid-14M1544000-Melbourne Road Ross Street.sip6 8000056, 6017418, GTA CONSULTANTS, NETWORK / Enterprise

MOVEMENT SUMMARY
Site: Melbourne Road / Ross Street - PM Peak Hour Existing Melbourne Road / Ross Street Stop (Two-Way)
Movement Performance - Vehicles
Mov ID ODMov
Demand Flows Deg. Satn Average Delay
Level of Service
95% Back of Queue Prop. Queued
Effective Stop Rate
Average Speed Total HV Vehicles Distance
veh/h % v/c sec veh m per veh km/h
South: Melbourne Road
1 L2 14 0.0 0.264 5.6 LOS A 0.0 0.0 0.00 0.02 58.2
2 T1 1016 0.0 0.264 0.0 LOS A 0.0 0.0 0.00 0.01 59.9
Approach 1031 0.0 0.264 0.1 NA 0.0 0.0 0.00 0.01 59.8
North: Melbourne Road
8 T1 1424 0.0 0.365 0.0 LOS A 0.0 0.0 0.00 0.00 59.9
9 R2 49 0.0 0.116 13.3 LOS B 0.4 2.8 0.73 0.89 48.2
Approach 1473 0.0 0.365 0.5 NA 0.4 2.8 0.02 0.03 59.4
West: Ross Street
10 L2 112 0.0 0.214 13.9 LOS B 0.7 5.2 0.69 1.01 48.7
12 R2 1 0.0 0.092 273.3 LOS F 0.2 1.5 0.99 1.00 10.9
Approach 113 0.0 0.214 16.3 LOS C 0.7 5.2 0.69 1.01 47.2
All Vehicles 2617 0.0 0.365 1.0 NA 0.7 5.2 0.04 0.06 58.9
Level of Service (LOS) Method: Delay (HCM 2000).
Vehicle movement LOS values are based on average delay per movement
Minor Road Approach LOS values are based on average delay for all vehicle movements.
NA: Intersection LOS and Major Road Approach LOS values are Not Applicable for two-way sign control since the average delay is not a good LOS measure due to zero delays associated with major road movements.
SIDRA Standard Delay Model is used. Control Delay includes Geometric Delay.
Gap-Acceptance Capacity: SIDRA Standard (Akçelik M3D).
HV (%) values are calculated for All Movement Classes of All Heavy Vehicle Model Designation.
Processed: Tuesday, 30 September 2014 12:58:21 PM SIDRA INTERSECTION 6.0.24.4877
Copyright © 2000-2014 Akcelik and Associates Pty Ltd www.sidrasolutions.com
Project: P:\14M1500-1599\14M1544000 Lot 14, Precinct 15, Blackshaws Rd\Modelling\SIDRA\140930sid-14M1544000-Melbourne Road Ross Street.sip6 8000056, 6017418, GTA CONSULTANTS, NETWORK / Enterprise


MOVEMENT SUMMARY
Site: Schutt Street / Blackshaws Road - AM Peak Hour Existing Blackshaws Road / Schutt Street Giveway / Yield (Two-Way)
Movement Performance - Vehicles
Mov ID ODMov
Demand Flows Deg. Satn Average Delay
Level of Service
95% Back of Queue Prop. Queued
Effective Stop Rate
Average Speed Total HV Vehicles Distance
veh/h % v/c sec veh m per veh km/h
South: Schutt Street
1 L2 36 0.0 0.036 6.4 LOS A 0.1 1.0 0.27 0.56 52.8
3 R2 4 0.0 0.036 6.3 LOS A 0.1 1.0 0.27 0.56 52.3
Approach 40 0.0 0.036 6.4 LOS A 0.1 1.0 0.27 0.56 52.7
East: Blackshaws Road
4 L2 2 0.0 0.084 5.5 LOS A 0.0 0.0 0.00 0.01 58.3
5 T1 162 0.0 0.084 0.0 LOS A 0.0 0.0 0.00 0.01 59.9
Approach 164 0.0 0.084 0.1 NA 0.0 0.0 0.00 0.01 59.9
West: Blackshaws Road
11 T1 160 0.0 0.082 0.0 LOS A 0.0 0.0 0.00 0.00 60.0
12 R2 129 0.0 0.105 6.1 LOS A 0.4 3.0 0.28 0.59 52.4
Approach 289 0.0 0.105 2.7 NA 0.4 3.0 0.13 0.26 56.3
All Vehicles 494 0.0 0.105 2.2 NA 0.4 3.0 0.10 0.20 57.1
Level of Service (LOS) Method: Delay (HCM 2000).
Vehicle movement LOS values are based on average delay per movement
Minor Road Approach LOS values are based on average delay for all vehicle movements.
NA: Intersection LOS and Major Road Approach LOS values are Not Applicable for two-way sign control since the average delay is not a good LOS measure due to zero delays associated with major road movements.
SIDRA Standard Delay Model is used. Control Delay includes Geometric Delay.
Gap-Acceptance Capacity: SIDRA Standard (Akçelik M3D).
HV (%) values are calculated for All Movement Classes of All Heavy Vehicle Model Designation.
Processed: Tuesday, 30 September 2014 12:31:49 PM SIDRA INTERSECTION 6.0.24.4877
Copyright © 2000-2014 Akcelik and Associates Pty Ltd www.sidrasolutions.com
Project: P:\14M1500-1599\14M1544000 Lot 14, Precinct 15, Blackshaws Rd\Modelling\SIDRA\140930sid-14M1544000-Blackshaws Road Schutt Street.sip6 8000056, 6017418, GTA CONSULTANTS, NETWORK / Enterprise

MOVEMENT SUMMARY
Site: Schutt Street / Blackshaws Road - PM Peak Hour Existing Blackshaws Road / Schutt Street Giveway / Yield (Two-Way)
Movement Performance - Vehicles
Mov ID ODMov
Demand Flows Deg. Satn Average Delay
Level of Service
95% Back of Queue Prop. Queued
Effective Stop Rate
Average Speed Total HV Vehicles Distance
veh/h % v/c sec veh m per veh km/h
South: Schutt Street
1 L2 38 0.0 0.041 7.0 LOS A 0.2 1.1 0.38 0.61 52.4
3 R2 3 0.0 0.041 6.9 LOS A 0.2 1.1 0.38 0.61 51.9
Approach 41 0.0 0.041 7.0 LOS A 0.2 1.1 0.38 0.61 52.4
East: Blackshaws Road
4 L2 8 0.0 0.154 5.6 LOS A 0.0 0.0 0.00 0.02 58.2
5 T1 292 0.0 0.154 0.0 LOS A 0.0 0.0 0.00 0.02 59.8
Approach 300 0.0 0.154 0.2 NA 0.0 0.0 0.00 0.02 59.8
West: Blackshaws Road
11 T1 124 0.0 0.064 0.0 LOS A 0.0 0.0 0.00 0.00 60.0
12 R2 107 0.0 0.101 6.8 LOS A 0.4 2.8 0.39 0.64 52.1
Approach 232 0.0 0.101 3.2 NA 0.4 2.8 0.18 0.30 56.0
All Vehicles 573 0.0 0.154 1.9 NA 0.4 2.8 0.10 0.17 57.6
Level of Service (LOS) Method: Delay (HCM 2000).
Vehicle movement LOS values are based on average delay per movement
Minor Road Approach LOS values are based on average delay for all vehicle movements.
NA: Intersection LOS and Major Road Approach LOS values are Not Applicable for two-way sign control since the average delay is not a good LOS measure due to zero delays associated with major road movements.
SIDRA Standard Delay Model is used. Control Delay includes Geometric Delay.
Gap-Acceptance Capacity: SIDRA Standard (Akçelik M3D).
HV (%) values are calculated for All Movement Classes of All Heavy Vehicle Model Designation.
Processed: Tuesday, 30 September 2014 12:31:52 PM SIDRA INTERSECTION 6.0.24.4877
Copyright © 2000-2014 Akcelik and Associates Pty Ltd www.sidrasolutions.com
Project: P:\14M1500-1599\14M1544000 Lot 14, Precinct 15, Blackshaws Rd\Modelling\SIDRA\140930sid-14M1544000-Blackshaws Road Schutt Street.sip6 8000056, 6017418, GTA CONSULTANTS, NETWORK / Enterprise

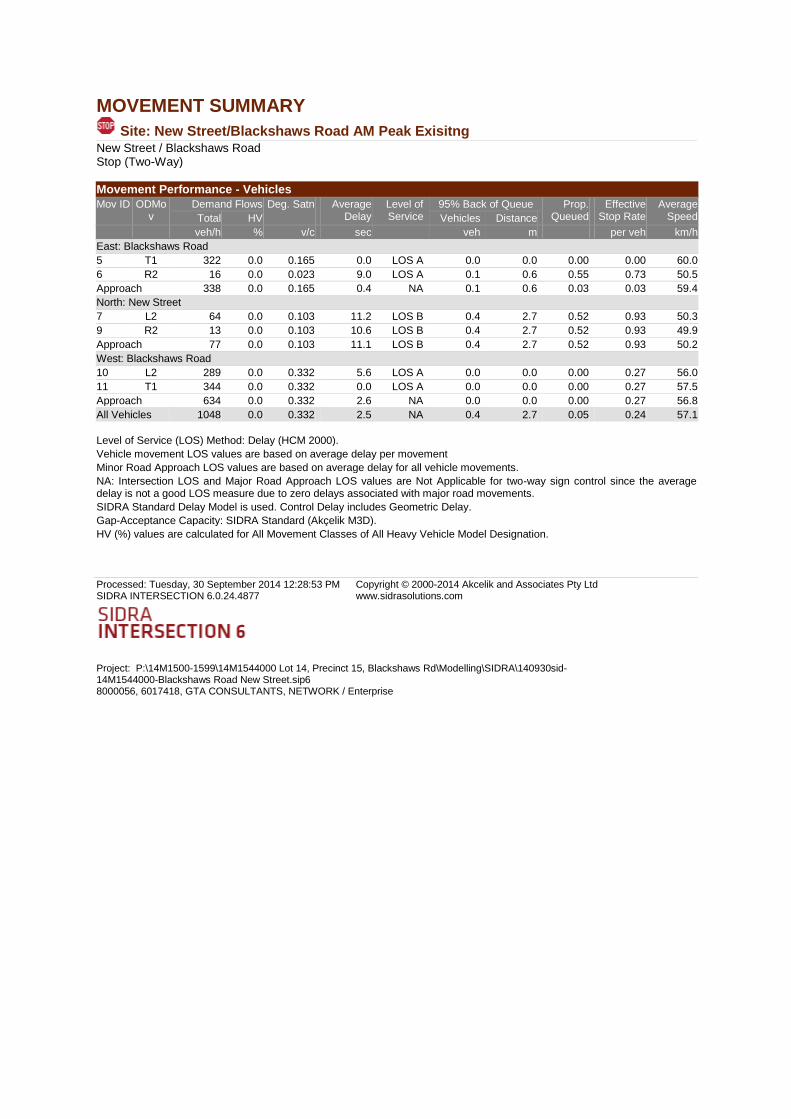
MOVEMENT SUMMARY
Site: New Street/Blackshaws Road AM Peak Exisitng New Street / Blackshaws Road Stop (Two-Way)
Movement Performance - Vehicles
Mov ID ODMov
Demand Flows Deg. Satn Average Delay
Level of Service
95% Back of Queue Prop. Queued
Effective Stop Rate
Average Speed Total HV Vehicles Distance
veh/h % v/c sec veh m per veh km/h
East: Blackshaws Road
5 T1 322 0.0 0.165 0.0 LOS A 0.0 0.0 0.00 0.00 60.0
6 R2 16 0.0 0.023 9.0 LOS A 0.1 0.6 0.55 0.73 50.5
Approach 338 0.0 0.165 0.4 NA 0.1 0.6 0.03 0.03 59.4
North: New Street
7 L2 64 0.0 0.103 11.2 LOS B 0.4 2.7 0.52 0.93 50.3
9 R2 13 0.0 0.103 10.6 LOS B 0.4 2.7 0.52 0.93 49.9
Approach 77 0.0 0.103 11.1 LOS B 0.4 2.7 0.52 0.93 50.2
West: Blackshaws Road
10 L2 289 0.0 0.332 5.6 LOS A 0.0 0.0 0.00 0.27 56.0
11 T1 344 0.0 0.332 0.0 LOS A 0.0 0.0 0.00 0.27 57.5
Approach 634 0.0 0.332 2.6 NA 0.0 0.0 0.00 0.27 56.8
All Vehicles 1048 0.0 0.332 2.5 NA 0.4 2.7 0.05 0.24 57.1
Level of Service (LOS) Method: Delay (HCM 2000).
Vehicle movement LOS values are based on average delay per movement
Minor Road Approach LOS values are based on average delay for all vehicle movements.
NA: Intersection LOS and Major Road Approach LOS values are Not Applicable for two-way sign control since the average delay is not a good LOS measure due to zero delays associated with major road movements.
SIDRA Standard Delay Model is used. Control Delay includes Geometric Delay.
Gap-Acceptance Capacity: SIDRA Standard (Akçelik M3D).
HV (%) values are calculated for All Movement Classes of All Heavy Vehicle Model Designation.
Processed: Tuesday, 30 September 2014 12:28:53 PM SIDRA INTERSECTION 6.0.24.4877
Copyright © 2000-2014 Akcelik and Associates Pty Ltd www.sidrasolutions.com
Project: P:\14M1500-1599\14M1544000 Lot 14, Precinct 15, Blackshaws Rd\Modelling\SIDRA\140930sid-14M1544000-Blackshaws Road New Street.sip6 8000056, 6017418, GTA CONSULTANTS, NETWORK / Enterprise

MOVEMENT SUMMARY
Site: New Street/Blackshaws Road PM Peak Exisitng New Street / Blackshaws Road Stop (Two-Way)
Movement Performance - Vehicles
Mov ID ODMov
Demand Flows Deg. Satn Average Delay
Level of Service
95% Back of Queue Prop. Queued
Effective Stop Rate
Average Speed Total HV Vehicles Distance
veh/h % v/c sec veh m per veh km/h
East: Blackshaws Road
5 T1 428 0.0 0.220 0.0 LOS A 0.0 0.0 0.00 0.00 60.0
6 R2 7 0.0 0.011 8.9 LOS A 0.0 0.3 0.55 0.69 50.6
Approach 436 0.0 0.220 0.2 NA 0.0 0.3 0.01 0.01 59.8
North: New Street
7 L2 8 0.0 0.395 20.1 LOS C 1.7 11.6 0.80 1.07 45.2
9 R2 131 0.0 0.395 19.5 LOS C 1.7 11.6 0.80 1.07 44.9
Approach 139 0.0 0.395 19.6 LOS C 1.7 11.6 0.80 1.07 44.9
West: Blackshaws Road
10 L2 141 0.0 0.324 5.6 LOS A 0.0 0.0 0.00 0.13 57.2
11 T1 483 0.0 0.324 0.0 LOS A 0.0 0.0 0.00 0.13 58.7
Approach 624 0.0 0.324 1.3 NA 0.0 0.0 0.00 0.13 58.4
All Vehicles 1199 0.0 0.395 3.0 NA 1.7 11.6 0.10 0.20 56.9
Level of Service (LOS) Method: Delay (HCM 2000).
Vehicle movement LOS values are based on average delay per movement
Minor Road Approach LOS values are based on average delay for all vehicle movements.
NA: Intersection LOS and Major Road Approach LOS values are Not Applicable for two-way sign control since the average delay is not a good LOS measure due to zero delays associated with major road movements.
SIDRA Standard Delay Model is used. Control Delay includes Geometric Delay.
Gap-Acceptance Capacity: SIDRA Standard (Akçelik M3D).
HV (%) values are calculated for All Movement Classes of All Heavy Vehicle Model Designation.
Processed: Tuesday, 30 September 2014 12:28:56 PM SIDRA INTERSECTION 6.0.24.4877
Copyright © 2000-2014 Akcelik and Associates Pty Ltd www.sidrasolutions.com
Project: P:\14M1500-1599\14M1544000 Lot 14, Precinct 15, Blackshaws Rd\Modelling\SIDRA\140930sid-14M1544000-Blackshaws Road New Street.sip6 8000056, 6017418, GTA CONSULTANTS, NETWORK / Enterprise


MOVEMENT SUMMARY
Site: Hansen Street/Blackshaws Road - AM Peak Existing Hansen Street / Blackshaws Road Stop (Two-Way)
Movement Performance - Vehicles
Mov ID ODMov
Demand Flows Deg. Satn Average Delay
Level of Service
95% Back of Queue Prop. Queued
Effective Stop Rate
Average Speed Total HV Vehicles Distance
veh/h % v/c sec veh m per veh km/h
South: Hansen Street
1 L2 17 0.0 0.245 18.3 LOS C 0.9 6.0 0.71 1.00 46.2
3 R2 64 0.0 0.245 17.7 LOS C 0.9 6.0 0.71 1.00 45.8
Approach 81 0.0 0.245 17.8 LOS C 0.9 6.0 0.71 1.00 45.8
East: Blackshaws Road
4 L2 34 0.0 0.196 5.6 LOS A 0.0 0.0 0.00 0.05 57.9
5 T1 347 0.0 0.196 0.0 LOS A 0.0 0.0 0.00 0.05 59.5
Approach 381 0.0 0.196 0.5 NA 0.0 0.0 0.00 0.05 59.3
West: Blackshaws Road
11 T1 559 0.0 0.287 0.0 LOS A 0.0 0.0 0.00 0.00 59.9
12 R2 15 0.0 0.015 7.1 LOS A 0.1 0.4 0.42 0.62 51.9
Approach 574 0.0 0.287 0.2 NA 0.1 0.4 0.01 0.02 59.7
All Vehicles 1036 0.0 0.287 1.7 NA 0.9 6.0 0.06 0.11 58.2
Level of Service (LOS) Method: Delay (HCM 2000).
Vehicle movement LOS values are based on average delay per movement
Minor Road Approach LOS values are based on average delay for all vehicle movements.
NA: Intersection LOS and Major Road Approach LOS values are Not Applicable for two-way sign control since the average delay is not a good LOS measure due to zero delays associated with major road movements.
SIDRA Standard Delay Model is used. Control Delay includes Geometric Delay.
Gap-Acceptance Capacity: SIDRA Standard (Akçelik M3D).
HV (%) values are calculated for All Movement Classes of All Heavy Vehicle Model Designation.
Processed: Tuesday, 30 September 2014 12:20:36 PM SIDRA INTERSECTION 6.0.24.4877
Copyright © 2000-2014 Akcelik and Associates Pty Ltd www.sidrasolutions.com
Project: P:\14M1500-1599\14M1544000 Lot 14, Precinct 15, Blackshaws Rd\Modelling\SIDRA\140930sid-14M1544000-Blackshaws Road Hansen Street.sip6 8000056, 6017418, GTA CONSULTANTS, NETWORK / Enterprise

MOVEMENT SUMMARY
Site: Hansen Street/Blackshaws Road - PM Peak Existing Hansen Street / Blackshaws Road Stop (Two-Way)
Movement Performance - Vehicles
Mov ID ODMov
Demand Flows Deg. Satn Average Delay
Level of Service
95% Back of Queue Prop. Queued
Effective Stop Rate
Average Speed Total HV Vehicles Distance
veh/h % v/c sec veh m per veh km/h
South: Hansen Street
1 L2 8 0.0 0.198 21.3 LOS C 0.6 4.4 0.79 1.01 44.6
3 R2 42 0.0 0.198 20.7 LOS C 0.6 4.4 0.79 1.01 44.2
Approach 51 0.0 0.198 20.8 LOS C 0.6 4.4 0.79 1.01 44.3
East: Blackshaws Road
4 L2 68 0.0 0.313 5.6 LOS A 0.0 0.0 0.00 0.07 57.7
5 T1 539 0.0 0.313 0.0 LOS A 0.0 0.0 0.00 0.07 59.3
Approach 607 0.0 0.313 0.7 NA 0.0 0.0 0.00 0.07 59.1
West: Blackshaws Road
11 T1 481 0.0 0.247 0.0 LOS A 0.0 0.0 0.00 0.00 59.9
12 R2 21 0.0 0.030 8.8 LOS A 0.1 0.7 0.54 0.73 50.6
Approach 502 0.0 0.247 0.4 NA 0.1 0.7 0.02 0.03 59.5
All Vehicles 1160 0.0 0.313 1.4 NA 0.6 4.4 0.04 0.09 58.4
Level of Service (LOS) Method: Delay (HCM 2000).
Vehicle movement LOS values are based on average delay per movement
Minor Road Approach LOS values are based on average delay for all vehicle movements.
NA: Intersection LOS and Major Road Approach LOS values are Not Applicable for two-way sign control since the average delay is not a good LOS measure due to zero delays associated with major road movements.
SIDRA Standard Delay Model is used. Control Delay includes Geometric Delay.
Gap-Acceptance Capacity: SIDRA Standard (Akçelik M3D).
HV (%) values are calculated for All Movement Classes of All Heavy Vehicle Model Designation.
Processed: Tuesday, 30 September 2014 12:20:39 PM SIDRA INTERSECTION 6.0.24.4877
Copyright © 2000-2014 Akcelik and Associates Pty Ltd www.sidrasolutions.com
Project: P:\14M1500-1599\14M1544000 Lot 14, Precinct 15, Blackshaws Rd\Modelling\SIDRA\140930sid-14M1544000-Blackshaws Road Hansen Street.sip6 8000056, 6017418, GTA CONSULTANTS, NETWORK / Enterprise


MOVEMENT SUMMARY Site: Kyle/Mills/Blackshaws - AM Peak Existing
Kyle Road / Mills Street / Blackshaws Road Signals - Fixed Time Cycle Time = 90 seconds (User-Given Cycle Time)
Movement Performance - Vehicles
Mov ID Turn Demand Flow
HV Deg. Satn Average Delay
Level of Service
95% Back of Queue Prop. Queued
Effective Stop Rate
Average Speed Vehicles Distance
veh/h % v/c sec veh m per veh km/h
South: Mills Street
1 L 45 0.0 0.292 38.5 LOS D 1.6 11.2 0.83 0.73 29.1
2 T 53 0.0 0.417 33.3 LOS C 5.5 38.3 0.90 0.74 28.9
3 R 88 0.0 0.417 41.4 LOS D 5.5 38.3 0.90 0.81 28.5
Approach 186 0.0 0.417 38.4 LOS D 5.5 38.3 0.89 0.77 28.8
East: Blackshaws Road
4 L 12 0.0 0.119 14.3 LOS B 0.6 4.1 0.38 0.84 44.0
5 T 396 0.0 0.390 9.3 LOS A 9.2 64.2 0.54 0.47 45.6
6 R 43 0.0 0.390 17.7 LOS B 9.2 64.2 0.55 0.94 42.0
Approach 451 0.0 0.390 10.2 LOS B 9.2 64.2 0.53 0.52 45.2
North: Kyle Road
7 L 42 0.0 0.271 38.4 LOS D 1.5 10.4 0.83 0.72 29.1
8 T 21 0.0 0.197 32.2 LOS C 2.4 16.6 0.86 0.67 29.4
9 R 43 0.0 0.197 40.4 LOS D 2.4 16.6 0.86 0.77 28.8
Approach 106 0.0 0.271 38.0 LOS D 2.4 16.6 0.85 0.73 29.0
West: Blackshaws Road
10 L 19 0.0 0.154 14.5 LOS B 1.4 10.1 0.39 0.89 44.0
11 T 521 0.0 0.416 8.4 LOS A 10.4 73.0 0.52 0.45 46.6
12 R 32 0.0 0.416 16.9 LOS B 10.4 73.0 0.54 0.96 42.6
Approach 572 0.0 0.416 9.1 LOS A 10.4 73.0 0.51 0.50 46.3
All Vehicles 1315 0.0 0.417 16.0 LOS B 10.4 73.0 0.60 0.56 40.5
Level of Service (LOS) Method: Delay (HCM 2000).
Vehicle movement LOS values are based on average delay per movement
Intersection and Approach LOS values are based on average delay for all vehicle movements.
SIDRA Standard Delay Model used.
Movement Performance - Pedestrians
Mov ID
Description Demand
Flow Average
Delay Level of Service
Average Back of Queue Prop. Queued
Effective Stop Rate Pedestrian Distance
ped/h sec ped m per ped
P1 Across S approach 53 9.8 LOS A 0.1 0.1 0.47 0.47
P3 Across E approach 53 35.6 LOS D 0.1 0.1 0.89 0.89
P5 Across N approach 53 9.8 LOS A 0.1 0.1 0.47 0.47
P7 Across W approach 53 35.6 LOS D 0.1 0.1 0.89 0.89
All Pedestrians 212 22.7 LOS C 0.68 0.68
Level of Service (LOS) Method: SIDRA Pedestrian LOS Method (Based on Average Delay)
Pedestrian movement LOS values are based on average delay per pedestrian movement.
Intersection LOS value for Pedestrians is based on average delay for all pedestrian movements.
Processed: Wednesday, 9 July 2014 3:52:56 PM SIDRA INTERSECTION 5.1.13.2093
Copyright © 2000-2011 Akcelik and Associates Pty Ltd www.sidrasolutions.com
Project: P:\14M1500-1599\14M1544000 Lot 14, Precinct 15, Blackshaws Rd\Modelling\SIDRA\140708sid-14M1544000-Blackshaws Road Mills Street Kyle Road.sip 8000056, GTA CONSULTANTS, ENTERPRISE

MOVEMENT SUMMARY Site: Kyle/Mills/Blackshaws - PM Peak Existing
Kyle Road / Mills Street / Blackshaws Road Signals - Fixed Time Cycle Time = 90 seconds (User-Given Cycle Time)
Movement Performance - Vehicles
Mov ID Turn Demand Flow
HV Deg. Satn Average Delay
Level of Service
95% Back of Queue Prop. Queued
Effective Stop Rate
Average Speed Vehicles Distance
veh/h % v/c sec veh m per veh km/h
South: Mills Street (S)
1 L 41 0.0 0.281 42.3 LOS D 1.5 10.8 0.87 0.73 27.7
2 T 33 0.0 0.211 35.1 LOS D 2.3 15.9 0.89 0.69 28.5
3 R 26 0.0 0.211 43.2 LOS D 2.3 15.9 0.89 0.78 28.1
Approach 100 0.0 0.281 40.2 LOS D 2.3 15.9 0.88 0.73 28.1
East: Blackshaws Road (E)
4 L 63 0.0 0.178 12.9 LOS B 0.9 6.1 0.34 0.70 44.2
5 T 537 0.0 0.467 7.7 LOS A 11.9 83.5 0.52 0.47 47.3
6 R 31 0.0 0.467 15.9 LOS B 11.9 83.5 0.52 0.97 43.5
Approach 631 0.0 0.467 8.6 LOS A 11.9 83.5 0.50 0.52 46.8
North: Kyle Road (N)
7 L 53 0.0 0.361 42.5 LOS D 2.0 14.0 0.88 0.74 27.6
8 T 42 0.0 0.200 34.8 LOS C 2.3 16.1 0.89 0.68 28.8
9 R 18 0.0 0.200 43.0 LOS D 2.3 16.1 0.89 0.78 28.4
Approach 113 0.0 0.361 39.7 LOS D 2.3 16.1 0.89 0.72 28.2
West: Blackshaws Road (W)
10 L 17 0.0 0.186 13.1 LOS B 1.7 11.9 0.35 0.93 45.3
11 T 580 0.0 0.504 7.9 LOS A 12.2 85.6 0.52 0.46 47.0
12 R 67 0.0 0.504 16.7 LOS B 12.2 85.6 0.55 0.95 42.8
Approach 664 0.0 0.504 8.9 LOS A 12.2 85.6 0.52 0.52 46.5
All Vehicles 1507 0.0 0.504 13.2 LOS B 12.2 85.6 0.56 0.55 42.7
Level of Service (LOS) Method: Delay (HCM 2000).
Vehicle movement LOS values are based on average delay per movement
Intersection and Approach LOS values are based on average delay for all vehicle movements.
SIDRA Standard Delay Model used.
Movement Performance - Pedestrians
Mov ID
Description Demand
Flow Average
Delay Level of Service
Average Back of Queue Prop. Queued
Effective Stop Rate Pedestrian Distance
ped/h sec ped m per ped
P1 Across S approach 53 8.0 LOS A 0.1 0.1 0.42 0.42
P3 Across E approach 53 39.2 LOS D 0.1 0.1 0.93 0.93
P5 Across N approach 53 8.0 LOS A 0.1 0.1 0.42 0.42
P7 Across W approach 53 39.2 LOS D 0.1 0.1 0.93 0.93
All Pedestrians 212 23.6 LOS C 0.68 0.68
Level of Service (LOS) Method: SIDRA Pedestrian LOS Method (Based on Average Delay)
Pedestrian movement LOS values are based on average delay per pedestrian movement.
Intersection LOS value for Pedestrians is based on average delay for all pedestrian movements.
Processed: Wednesday, 9 July 2014 3:52:57 PM SIDRA INTERSECTION 5.1.13.2093
Copyright © 2000-2011 Akcelik and Associates Pty Ltd www.sidrasolutions.com
Project: P:\14M1500-1599\14M1544000 Lot 14, Precinct 15, Blackshaws Rd\Modelling\SIDRA\140708sid-14M1544000-Blackshaws Road Mills Street Kyle Road.sip 8000056, GTA CONSULTANTS, ENTERPRISE

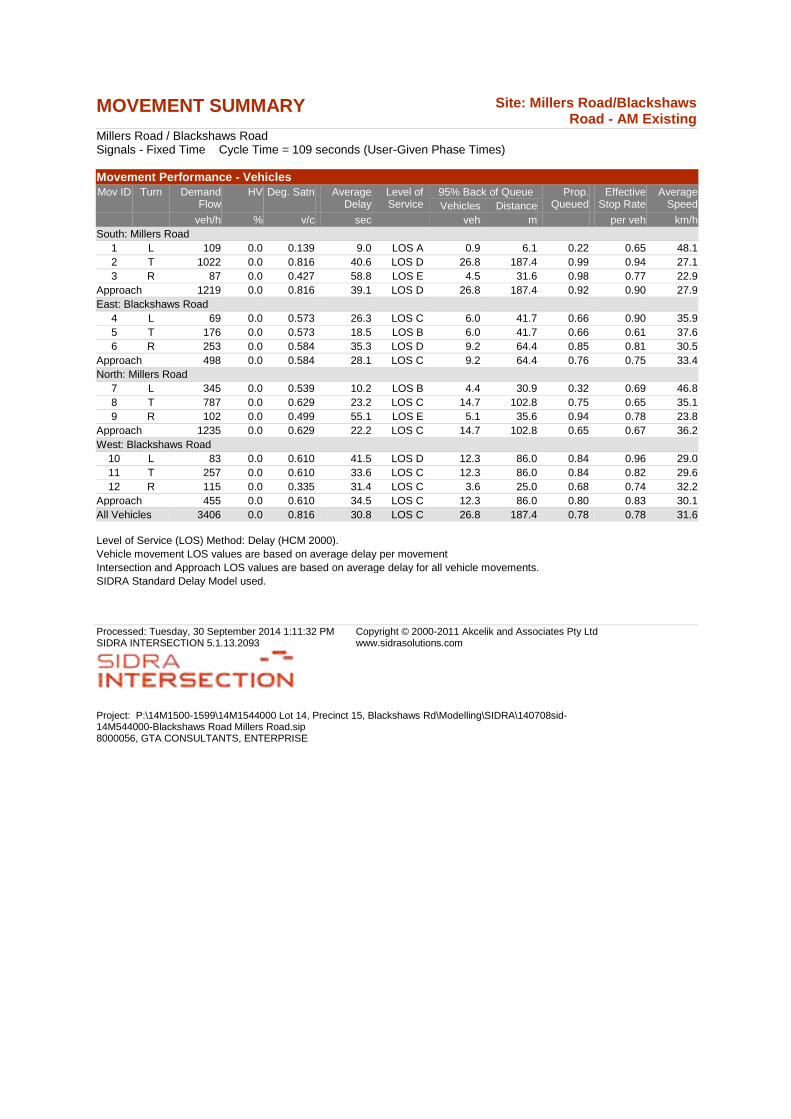
MOVEMENT SUMMARY Site: Millers Road/Blackshaws Road - AM Existing
Millers Road / Blackshaws Road Signals - Fixed Time Cycle Time = 109 seconds (User-Given Phase Times)
Movement Performance - Vehicles
Mov ID Turn Demand Flow
HV Deg. Satn Average Delay
Level of Service
95% Back of Queue Prop. Queued
Effective Stop Rate
Average Speed Vehicles Distance
veh/h % v/c sec veh m per veh km/h
South: Millers Road
1 L 109 0.0 0.139 9.0 LOS A 0.9 6.1 0.22 0.65 48.1
2 T 1022 0.0 0.816 40.6 LOS D 26.8 187.4 0.99 0.94 27.1
3 R 87 0.0 0.427 58.8 LOS E 4.5 31.6 0.98 0.77 22.9
Approach 1219 0.0 0.816 39.1 LOS D 26.8 187.4 0.92 0.90 27.9
East: Blackshaws Road
4 L 69 0.0 0.573 26.3 LOS C 6.0 41.7 0.66 0.90 35.9
5 T 176 0.0 0.573 18.5 LOS B 6.0 41.7 0.66 0.61 37.6
6 R 253 0.0 0.584 35.3 LOS D 9.2 64.4 0.85 0.81 30.5
Approach 498 0.0 0.584 28.1 LOS C 9.2 64.4 0.76 0.75 33.4
North: Millers Road
7 L 345 0.0 0.539 10.2 LOS B 4.4 30.9 0.32 0.69 46.8
8 T 787 0.0 0.629 23.2 LOS C 14.7 102.8 0.75 0.65 35.1
9 R 102 0.0 0.499 55.1 LOS E 5.1 35.6 0.94 0.78 23.8
Approach 1235 0.0 0.629 22.2 LOS C 14.7 102.8 0.65 0.67 36.2
West: Blackshaws Road
10 L 83 0.0 0.610 41.5 LOS D 12.3 86.0 0.84 0.96 29.0
11 T 257 0.0 0.610 33.6 LOS C 12.3 86.0 0.84 0.82 29.6
12 R 115 0.0 0.335 31.4 LOS C 3.6 25.0 0.68 0.74 32.2
Approach 455 0.0 0.610 34.5 LOS C 12.3 86.0 0.80 0.83 30.1
All Vehicles 3406 0.0 0.816 30.8 LOS C 26.8 187.4 0.78 0.78 31.6
Level of Service (LOS) Method: Delay (HCM 2000).
Vehicle movement LOS values are based on average delay per movement
Intersection and Approach LOS values are based on average delay for all vehicle movements.
SIDRA Standard Delay Model used.
Processed: Tuesday, 30 September 2014 1:11:32 PM SIDRA INTERSECTION 5.1.13.2093
Copyright © 2000-2011 Akcelik and Associates Pty Ltd www.sidrasolutions.com
Project: P:\14M1500-1599\14M1544000 Lot 14, Precinct 15, Blackshaws Rd\Modelling\SIDRA\140708sid-14M544000-Blackshaws Road Millers Road.sip 8000056, GTA CONSULTANTS, ENTERPRISE
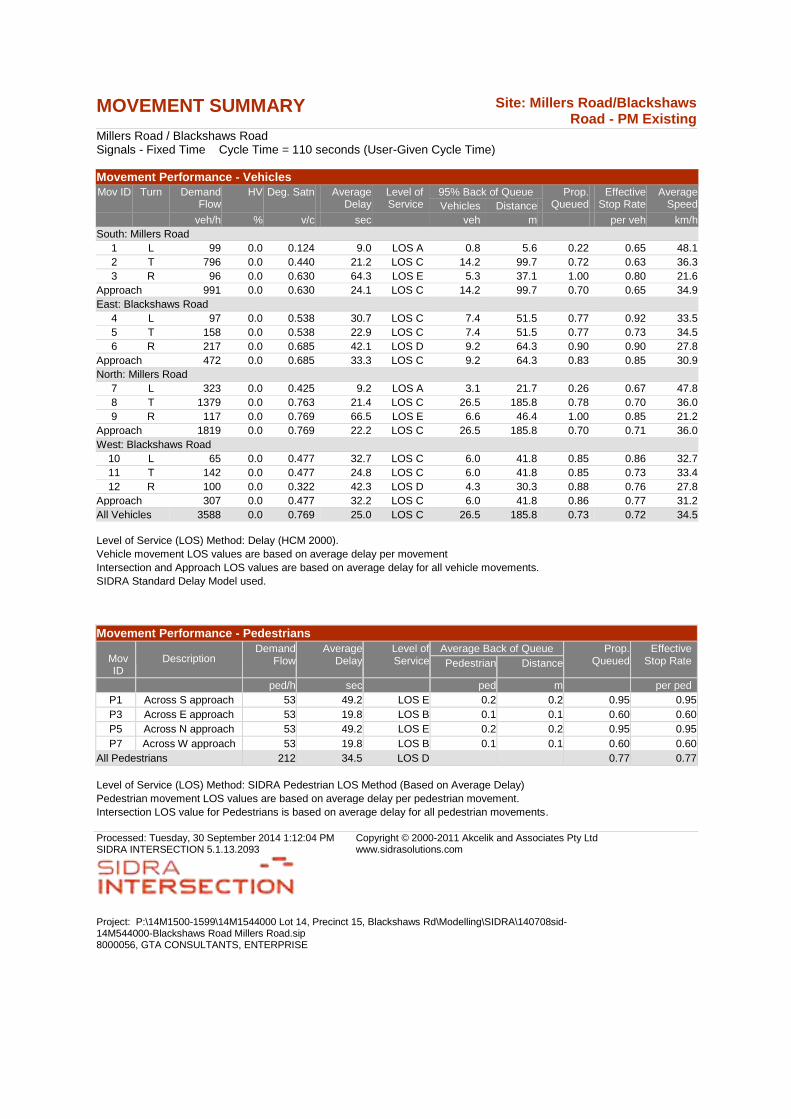
MOVEMENT SUMMARY Site: Millers Road/Blackshaws Road - PM Existing
Millers Road / Blackshaws Road Signals - Fixed Time Cycle Time = 110 seconds (User-Given Cycle Time)
Movement Performance - Vehicles
Mov ID Turn Demand Flow
HV Deg. Satn Average Delay
Level of Service
95% Back of Queue Prop. Queued
Effective Stop Rate
Average Speed Vehicles Distance
veh/h % v/c sec veh m per veh km/h
South: Millers Road
1 L 99 0.0 0.124 9.0 LOS A 0.8 5.6 0.22 0.65 48.1
2 T 796 0.0 0.440 21.2 LOS C 14.2 99.7 0.72 0.63 36.3
3 R 96 0.0 0.630 64.3 LOS E 5.3 37.1 1.00 0.80 21.6
Approach 991 0.0 0.630 24.1 LOS C 14.2 99.7 0.70 0.65 34.9
East: Blackshaws Road
4 L 97 0.0 0.538 30.7 LOS C 7.4 51.5 0.77 0.92 33.5
5 T 158 0.0 0.538 22.9 LOS C 7.4 51.5 0.77 0.73 34.5
6 R 217 0.0 0.685 42.1 LOS D 9.2 64.3 0.90 0.90 27.8
Approach 472 0.0 0.685 33.3 LOS C 9.2 64.3 0.83 0.85 30.9
North: Millers Road
7 L 323 0.0 0.425 9.2 LOS A 3.1 21.7 0.26 0.67 47.8
8 T 1379 0.0 0.763 21.4 LOS C 26.5 185.8 0.78 0.70 36.0
9 R 117 0.0 0.769 66.5 LOS E 6.6 46.4 1.00 0.85 21.2
Approach 1819 0.0 0.769 22.2 LOS C 26.5 185.8 0.70 0.71 36.0
West: Blackshaws Road
10 L 65 0.0 0.477 32.7 LOS C 6.0 41.8 0.85 0.86 32.7
11 T 142 0.0 0.477 24.8 LOS C 6.0 41.8 0.85 0.73 33.4
12 R 100 0.0 0.322 42.3 LOS D 4.3 30.3 0.88 0.76 27.8
Approach 307 0.0 0.477 32.2 LOS C 6.0 41.8 0.86 0.77 31.2
All Vehicles 3588 0.0 0.769 25.0 LOS C 26.5 185.8 0.73 0.72 34.5
Level of Service (LOS) Method: Delay (HCM 2000).
Vehicle movement LOS values are based on average delay per movement
Intersection and Approach LOS values are based on average delay for all vehicle movements.
SIDRA Standard Delay Model used.
Movement Performance - Pedestrians
Mov ID
Description Demand
Flow Average
Delay Level of Service
Average Back of Queue Prop. Queued
Effective Stop Rate Pedestrian Distance
ped/h sec ped m per ped
P1 Across S approach 53 49.2 LOS E 0.2 0.2 0.95 0.95
P3 Across E approach 53 19.8 LOS B 0.1 0.1 0.60 0.60
P5 Across N approach 53 49.2 LOS E 0.2 0.2 0.95 0.95
P7 Across W approach 53 19.8 LOS B 0.1 0.1 0.60 0.60
All Pedestrians 212 34.5 LOS D 0.77 0.77
Level of Service (LOS) Method: SIDRA Pedestrian LOS Method (Based on Average Delay)
Pedestrian movement LOS values are based on average delay per pedestrian movement.
Intersection LOS value for Pedestrians is based on average delay for all pedestrian movements.
Processed: Tuesday, 30 September 2014 1:12:04 PM SIDRA INTERSECTION 5.1.13.2093
Copyright © 2000-2011 Akcelik and Associates Pty Ltd www.sidrasolutions.com
Project: P:\14M1500-1599\14M1544000 Lot 14, Precinct 15, Blackshaws Rd\Modelling\SIDRA\140708sid-14M544000-Blackshaws Road Millers Road.sip 8000056, GTA CONSULTANTS, ENTERPRISE


MOVEMENT SUMMARY Site: Millers / Marigold - AM Existing
New Site Signals - Fixed Time Cycle Time = 109 seconds (User-Given Phase Times)
Movement Performance - Vehicles
Mov ID Turn Demand Flow
HV Deg. Satn Average Delay
Level of Service
95% Back of Queue Prop. Queued
Effective Stop Rate
Average Speed Vehicles Distance
veh/h % v/c sec veh m per veh km/h
South: Millers Road (S)
1 L 134 0.0 0.234 18.2 LOS B 2.2 15.7 0.34 0.72 40.0
2 T 1223 0.0 0.727 13.6 LOS B 19.1 133.5 0.63 0.57 41.8
3 R 5 0.0 0.074 61.0 LOS E 0.3 1.9 0.93 0.64 22.4
Approach 1362 0.0 0.727 14.2 LOS B 19.1 133.5 0.61 0.58 41.5
East: Marigold Ave (E)
4 L 1 0.0 0.337 45.9 LOS D 4.9 34.5 0.87 0.82 27.3
5 T 69 0.0 0.337 37.8 LOS D 4.9 34.5 0.87 0.71 27.8
6 R 39 0.0 0.337 45.8 LOS D 4.9 34.5 0.87 0.81 27.3
Approach 109 0.0 0.337 40.7 LOS D 4.9 34.5 0.87 0.75 27.6
North: Millers Road (N)
7 L 42 0.0 0.063 16.8 LOS B 0.6 4.4 0.30 0.70 41.0
8 T 945 0.0 0.448 11.2 LOS B 10.2 71.4 0.44 0.39 44.4
9 R 114 0.0 0.486 52.6 LOS D 5.5 38.4 0.93 0.78 24.5
Approach 1101 0.0 0.486 15.7 LOS B 10.2 71.4 0.49 0.44 40.9
West: Dousa Road (W)
10 L 208 0.0 0.382 29.7 LOS C 6.8 47.8 0.84 0.80 33.0
11 T 14 0.0 0.127 38.0 LOS D 1.8 12.5 0.85 0.64 27.4
12 R 27 0.0 0.127 45.8 LOS D 1.8 12.5 0.85 0.75 27.0
Approach 249 0.0 0.382 31.9 LOS C 6.8 47.8 0.84 0.79 31.8
All Vehicles 2822 0.0 0.727 17.4 LOS B 19.1 133.5 0.59 0.55 39.4
Level of Service (LOS) Method: Delay (HCM 2000).
Vehicle movement LOS values are based on average delay per movement
Intersection and Approach LOS values are based on average delay for all vehicle movements.
SIDRA Standard Delay Model used.
Movement Performance - Pedestrians
Mov ID
Description Demand
Flow Average
Delay Level of Service
Average Back of Queue Prop. Queued
Effective Stop Rate Pedestrian Distance
ped/h sec ped m per ped
P1 Across S approach 53 46.8 LOS E 0.2 0.2 0.93 0.93
P3 Across E approach 53 20.6 LOS C 0.1 0.1 0.61 0.61
P5 Across N approach 53 46.8 LOS E 0.2 0.2 0.93 0.93
P7 Across W approach 53 25.8 LOS C 0.1 0.1 0.69 0.69
All Pedestrians 212 35.0 LOS D 0.79 0.79
Level of Service (LOS) Method: SIDRA Pedestrian LOS Method (Based on Average Delay)
Pedestrian movement LOS values are based on average delay per pedestrian movement.
Intersection LOS value for Pedestrians is based on average delay for all pedestrian movements.
Processed: Tuesday, 30 September 2014 1:32:11 PM SIDRA INTERSECTION 5.1.13.2093
Copyright © 2000-2011 Akcelik and Associates Pty Ltd www.sidrasolutions.com
Project: P:\14M1500-1599\14M1544000 Lot 14, Precinct 15, Blackshaws Rd\Modelling\SIDRA\140708sid-14M1544000-Millers Road Marigold Road.sip 8000056, GTA CONSULTANTS, ENTERPRISE

MOVEMENT SUMMARY Site: Millers / Marigold - PM Existing
New Site Signals - Fixed Time Cycle Time = 110 seconds (User-Given Phase Times)
Movement Performance - Vehicles
Mov ID Turn Demand Flow
HV Deg. Satn Average Delay
Level of Service
95% Back of Queue Prop. Queued
Effective Stop Rate
Average Speed Vehicles Distance
veh/h % v/c sec veh m per veh km/h
South: Millers Road (S)
1 L 127 0.0 0.211 17.1 LOS B 2.0 13.7 0.31 0.71 40.8
2 T 1021 0.0 0.588 11.4 LOS B 12.4 86.9 0.49 0.44 44.1
3 R 12 0.0 0.167 62.2 LOS E 0.6 4.2 0.94 0.67 22.1
Approach 1160 0.0 0.588 12.5 LOS B 12.4 86.9 0.48 0.47 43.3
East: Marigold Ave (E)
4 L 8 0.0 0.531 51.4 LOS D 4.9 34.3 0.93 0.81 25.1
5 T 24 0.0 0.531 43.2 LOS D 4.9 34.3 0.93 0.76 25.4
6 R 65 0.0 0.531 51.2 LOS D 4.9 34.3 0.93 0.81 25.2
Approach 98 0.0 0.531 49.2 LOS D 4.9 34.3 0.93 0.80 25.2
North: Millers Road (N)
7 L 78 0.0 0.136 16.9 LOS B 1.5 10.7 0.54 0.72 40.9
8 T 1473 0.0 0.742 20.5 LOS C 24.4 170.6 0.85 0.85 36.5
9 R 184 0.0 0.790 58.7 LOS E 9.9 69.6 0.97 0.90 22.9
Approach 1735 0.0 0.790 24.4 LOS C 24.4 170.6 0.85 0.85 34.5
West: Dousa Road (W)
10 L 259 0.0 0.415 38.4 LOS D 10.7 74.9 0.82 0.82 29.1
11 T 19 0.0 0.414 42.4 LOS D 5.9 41.0 0.92 0.74 25.7
12 R 103 0.0 0.414 50.2 LOS D 5.9 41.0 0.92 0.80 25.4
Approach 381 0.0 0.415 41.8 LOS D 10.7 74.9 0.85 0.81 27.8
All Vehicles 3374 0.0 0.790 23.0 LOS C 24.4 170.6 0.72 0.71 35.6
Level of Service (LOS) Method: Delay (HCM 2000).
Vehicle movement LOS values are based on average delay per movement
Intersection and Approach LOS values are based on average delay for all vehicle movements.
SIDRA Standard Delay Model used.
Movement Performance - Pedestrians
Mov ID
Description Demand
Flow Average
Delay Level of Service
Average Back of Queue Prop. Queued
Effective Stop Rate Pedestrian Distance
ped/h sec ped m per ped
P1 Across S approach 53 49.2 LOS E 0.2 0.2 0.95 0.95
P3 Across E approach 53 19.8 LOS B 0.1 0.1 0.60 0.60
P5 Across N approach 53 49.2 LOS E 0.2 0.2 0.95 0.95
P7 Across W approach 53 24.9 LOS C 0.1 0.1 0.67 0.67
All Pedestrians 212 35.8 LOS D 0.79 0.79
Level of Service (LOS) Method: SIDRA Pedestrian LOS Method (Based on Average Delay)
Pedestrian movement LOS values are based on average delay per pedestrian movement.
Intersection LOS value for Pedestrians is based on average delay for all pedestrian movements.
Processed: Tuesday, 30 September 2014 1:32:12 PM SIDRA INTERSECTION 5.1.13.2093
Copyright © 2000-2011 Akcelik and Associates Pty Ltd www.sidrasolutions.com
Project: P:\14M1500-1599\14M1544000 Lot 14, Precinct 15, Blackshaws Rd\Modelling\SIDRA\140708sid-14M1544000-Millers Road Marigold Road.sip 8000056, GTA CONSULTANTS, ENTERPRISE
Appendix B
14M1544000 23/03/15
Precinct 15, Blackshaws Road, Altona North Issue: C
Development / Structure Plan Transport Assessment
Ap
pe
nd
ix B
Appendix B
SIDRA INTERSECTION Results – Post Development


MOVEMENT SUMMARY Site: Melbourne Road/The Avenue - AM Post Dev
Melbourne Road / The Avenue Signals - Fixed Time Cycle Time = 116 seconds (User-Given Cycle Time)
Movement Performance - Vehicles
Mov ID Turn Demand Flow
HV Deg. Satn Average Delay
Level of Service
95% Back of Queue Prop. Queued
Effective Stop Rate
Average Speed Vehicles Distance
veh/h % v/c sec veh m per veh km/h
South: Melbourne Road (S)
1 L 1 0.0 0.637 17.7 LOS B 17.2 120.7 0.45 1.01 41.8
2 T 1477 0.0 0.637 9.6 LOS A 17.2 120.7 0.45 0.41 45.9
3 R 3 0.0 0.060 66.7 LOS E 0.2 1.2 0.97 0.62 21.1
Approach 1481 0.0 0.637 9.7 LOS A 17.2 120.7 0.45 0.41 45.8
East: The Avenue (E)
4 L 1 0.0 0.270 52.6 LOS D 1.2 8.5 0.88 0.75 25.5
5 T 24 0.0 0.270 44.4 LOS D 1.2 8.5 0.88 0.62 26.0
6 R 118 0.0 0.568 60.5 LOS E 6.5 45.5 0.98 0.80 22.5
Approach 143 0.0 0.568 57.7 LOS E 6.5 45.5 0.96 0.77 23.0
North: Melbourne Road (N)
7 L 28 0.0 0.338 16.0 LOS B 6.4 45.1 0.32 0.99 42.7
8 T 774 0.0 0.338 6.5 LOS A 6.4 45.1 0.28 0.25 49.7
9 R 55 0.0 0.342 64.3 LOS E 3.0 21.3 0.98 0.75 21.6
Approach 857 0.0 0.342 10.5 LOS B 6.4 45.1 0.32 0.30 45.7
West: The Avenue (W)
10 L 466 0.0 0.947 19.7 LOS B 14.0 97.9 0.61 0.81 39.1
11 T 68 0.0 0.320 47.0 LOS D 4.7 32.7 0.93 0.73 24.9
12 R 23 0.0 0.320 55.1 LOS E 4.7 32.7 0.93 0.80 24.6
Approach 558 0.0 0.947 24.6 LOS C 14.0 97.9 0.66 0.80 35.7
All Vehicles 3039 0.0 0.947 14.9 LOS B 17.2 120.7 0.48 0.47 41.7
Level of Service (LOS) Method: Delay (HCM 2000).
Vehicle movement LOS values are based on average delay per movement
Intersection and Approach LOS values are based on average delay for all vehicle movements.
SIDRA Standard Delay Model used.
Movement Performance - Pedestrians
Mov ID
Description Demand
Flow Average
Delay Level of Service
Average Back of Queue Prop. Queued
Effective Stop Rate Pedestrian Distance
ped/h sec ped m per ped
P1 Across S approach 53 52.2 LOS E 0.2 0.2 0.95 0.95
P3 Across E approach 53 18.8 LOS B 0.1 0.1 0.57 0.57
P5 Across N approach 53 52.2 LOS E 0.2 0.2 0.95 0.95
P7 Across W approach 53 17.7 LOS B 0.1 0.1 0.55 0.55
All Pedestrians 212 35.2 LOS D 0.75 0.75
Level of Service (LOS) Method: SIDRA Pedestrian LOS Method (Based on Average Delay)
Pedestrian movement LOS values are based on average delay per pedestrian movement.
Intersection LOS value for Pedestrians is based on average delay for all pedestrian movements.
Processed: Wednesday, 9 July 2014 2:20:59 PM SIDRA INTERSECTION 5.1.13.2093
Copyright © 2000-2011 Akcelik and Associates Pty Ltd www.sidrasolutions.com
Project: P:\14M1500-1599\14M1544000 Lot 14, Precinct 15, Blackshaws Rd\Modelling\SIDRA\140708sid-14M1544000-Melbourne Road The Avenue.sip 8000056, GTA CONSULTANTS, ENTERPRISE
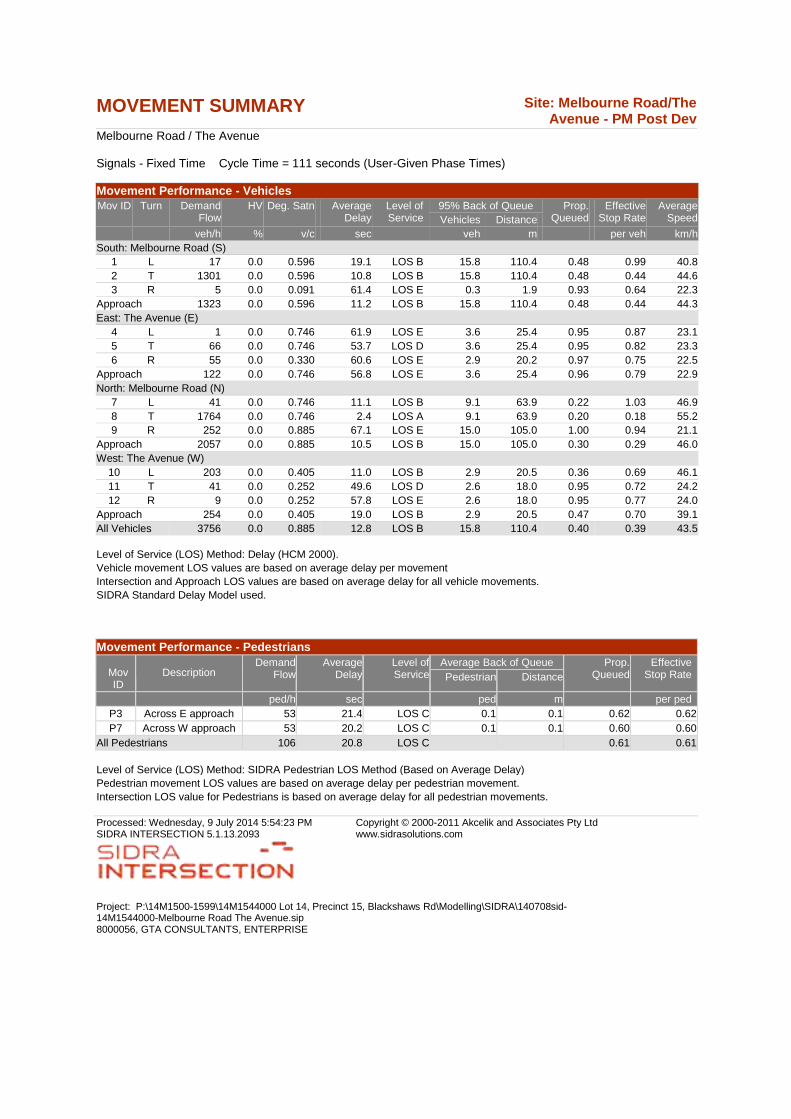
MOVEMENT SUMMARY Site: Melbourne Road/The Avenue - PM Post Dev
Melbourne Road / The Avenue Signals - Fixed Time Cycle Time = 111 seconds (User-Given Phase Times)
Movement Performance - Vehicles
Mov ID Turn Demand Flow
HV Deg. Satn Average Delay
Level of Service
95% Back of Queue Prop. Queued
Effective Stop Rate
Average Speed Vehicles Distance
veh/h % v/c sec veh m per veh km/h
South: Melbourne Road (S)
1 L 17 0.0 0.596 19.1 LOS B 15.8 110.4 0.48 0.99 40.8
2 T 1301 0.0 0.596 10.8 LOS B 15.8 110.4 0.48 0.44 44.6
3 R 5 0.0 0.091 61.4 LOS E 0.3 1.9 0.93 0.64 22.3
Approach 1323 0.0 0.596 11.2 LOS B 15.8 110.4 0.48 0.44 44.3
East: The Avenue (E)
4 L 1 0.0 0.746 61.9 LOS E 3.6 25.4 0.95 0.87 23.1
5 T 66 0.0 0.746 53.7 LOS D 3.6 25.4 0.95 0.82 23.3
6 R 55 0.0 0.330 60.6 LOS E 2.9 20.2 0.97 0.75 22.5
Approach 122 0.0 0.746 56.8 LOS E 3.6 25.4 0.96 0.79 22.9
North: Melbourne Road (N)
7 L 41 0.0 0.746 11.1 LOS B 9.1 63.9 0.22 1.03 46.9
8 T 1764 0.0 0.746 2.4 LOS A 9.1 63.9 0.20 0.18 55.2
9 R 252 0.0 0.885 67.1 LOS E 15.0 105.0 1.00 0.94 21.1
Approach 2057 0.0 0.885 10.5 LOS B 15.0 105.0 0.30 0.29 46.0
West: The Avenue (W)
10 L 203 0.0 0.405 11.0 LOS B 2.9 20.5 0.36 0.69 46.1
11 T 41 0.0 0.252 49.6 LOS D 2.6 18.0 0.95 0.72 24.2
12 R 9 0.0 0.252 57.8 LOS E 2.6 18.0 0.95 0.77 24.0
Approach 254 0.0 0.405 19.0 LOS B 2.9 20.5 0.47 0.70 39.1
All Vehicles 3756 0.0 0.885 12.8 LOS B 15.8 110.4 0.40 0.39 43.5
Level of Service (LOS) Method: Delay (HCM 2000).
Vehicle movement LOS values are based on average delay per movement
Intersection and Approach LOS values are based on average delay for all vehicle movements.
SIDRA Standard Delay Model used.
Movement Performance - Pedestrians
Mov ID
Description Demand
Flow Average
Delay Level of Service
Average Back of Queue Prop. Queued
Effective Stop Rate Pedestrian Distance
ped/h sec ped m per ped
P3 Across E approach 53 21.4 LOS C 0.1 0.1 0.62 0.62
P7 Across W approach 53 20.2 LOS C 0.1 0.1 0.60 0.60
All Pedestrians 106 20.8 LOS C 0.61 0.61
Level of Service (LOS) Method: SIDRA Pedestrian LOS Method (Based on Average Delay)
Pedestrian movement LOS values are based on average delay per pedestrian movement.
Intersection LOS value for Pedestrians is based on average delay for all pedestrian movements.
Processed: Wednesday, 9 July 2014 5:54:23 PM SIDRA INTERSECTION 5.1.13.2093
Copyright © 2000-2011 Akcelik and Associates Pty Ltd www.sidrasolutions.com
Project: P:\14M1500-1599\14M1544000 Lot 14, Precinct 15, Blackshaws Rd\Modelling\SIDRA\140708sid-14M1544000-Melbourne Road The Avenue.sip 8000056, GTA CONSULTANTS, ENTERPRISE


MOVEMENT SUMMARY Site: Melbourne Road/Hudson Road - AM Post Dev
New Site Signals - Fixed Time Cycle Time = 90 seconds (User-Given Cycle Time)
Movement Performance - Vehicles
Mov ID Turn Demand Flow
HV Deg. Satn Average Delay
Level of Service
95% Back of Queue Prop. Queued
Effective Stop Rate
Average Speed Vehicles Distance
veh/h % v/c sec veh m per veh km/h
South: Melbourne Road (S)
1 L 1 0.0 0.875 29.7 LOS C 25.9 181.2 0.89 0.99 35.0
2 T 1287 0.0 0.875 21.5 LOS C 25.9 181.2 0.89 0.87 35.7
3 R 28 0.0 0.230 51.8 LOS D 1.2 8.5 0.94 0.71 24.7
Approach 1317 0.0 0.875 22.2 LOS C 25.9 181.2 0.89 0.87 35.4
East: Hudson Road (E)
4 L 32 0.0 0.089 28.8 LOS C 1.7 12.2 0.70 0.79 34.1
5 T 28 0.0 0.089 20.6 LOS C 1.7 12.2 0.70 0.54 35.7
6 R 115 0.0 0.794 58.4 LOS E 5.6 39.0 1.00 0.90 23.0
Approach 175 0.0 0.794 46.9 LOS D 5.6 39.0 0.90 0.82 26.0
North: Melbourne Road (N)
7 L 133 0.0 0.530 30.4 LOS C 12.1 84.4 0.76 0.87 33.7
8 T 642 0.0 0.530 21.8 LOS C 12.1 84.4 0.74 0.64 35.6
9 R 13 0.0 0.102 53.2 LOS D 0.6 3.9 0.97 0.68 24.3
Approach 787 0.0 0.530 23.8 LOS C 12.1 84.4 0.75 0.68 35.0
West: Hudson Road (W)
10 L 32 0.0 0.347 41.4 LOS D 5.1 36.0 0.90 0.81 29.0
11 T 89 0.0 0.347 33.2 LOS C 5.1 36.0 0.90 0.72 29.4
12 R 14 0.0 0.347 41.4 LOS D 5.1 36.0 0.90 0.81 29.0
Approach 135 0.0 0.347 36.0 LOS D 5.1 36.0 0.90 0.75 29.3
All Vehicles 2414 0.0 0.875 25.3 LOS C 25.9 181.2 0.84 0.80 34.0
Level of Service (LOS) Method: Delay (HCM 2000).
Vehicle movement LOS values are based on average delay per movement
Intersection and Approach LOS values are based on average delay for all vehicle movements.
SIDRA Standard Delay Model used.
Movement Performance - Pedestrians
Mov ID
Description Demand
Flow Average
Delay Level of Service
Average Back of Queue Prop. Queued
Effective Stop Rate Pedestrian Distance
ped/h sec ped m per ped
P1 Across S approach 53 39.2 LOS D 0.1 0.1 0.93 0.93
P5 Across N approach 53 39.2 LOS D 0.1 0.1 0.93 0.93
All Pedestrians 106 39.2 LOS D 0.93 0.93
Level of Service (LOS) Method: SIDRA Pedestrian LOS Method (Based on Average Delay)
Pedestrian movement LOS values are based on average delay per pedestrian movement.
Intersection LOS value for Pedestrians is based on average delay for all pedestrian movements.
Processed: Wednesday, 9 July 2014 2:27:46 PM SIDRA INTERSECTION 5.1.13.2093
Copyright © 2000-2011 Akcelik and Associates Pty Ltd www.sidrasolutions.com
Project: P:\14M1500-1599\14M1544000 Lot 14, Precinct 15, Blackshaws Rd\Modelling\SIDRA\140708sid-14M1544000-Melbourne Road Hudson Road.sip 8000056, GTA CONSULTANTS, ENTERPRISE

MOVEMENT SUMMARY Site: Melbourne Road/Hudson Road - PM Post Dev
Melbourne Road / Hudson Road Signals - Fixed Time Cycle Time = 97 seconds (User-Given Cycle Time)
Movement Performance - Vehicles
Mov ID Turn Demand Flow
HV Deg. Satn Average Delay
Level of Service
95% Back of Queue Prop. Queued
Effective Stop Rate
Average Speed Vehicles Distance
veh/h % v/c sec veh m per veh km/h
South: Melbourne Road (S)
1 L 13 0.0 0.602 25.1 LOS C 15.6 109.0 0.65 0.95 37.1
2 T 1076 0.0 0.602 17.0 LOS B 15.6 109.1 0.65 0.58 39.2
3 R 20 0.0 0.174 57.6 LOS E 0.9 6.6 0.96 0.70 23.2
Approach 1108 0.0 0.602 17.8 LOS B 15.6 109.1 0.66 0.59 38.7
East: Hudson Road (E)
4 L 63 0.0 0.237 36.6 LOS D 4.7 33.1 0.80 0.81 30.6
5 T 67 0.0 0.237 28.4 LOS C 4.7 33.1 0.80 0.65 31.4
6 R 187 0.0 0.920 57.2 LOS E 9.3 65.3 0.98 0.90 23.3
Approach 318 0.0 0.920 47.0 LOS D 9.3 65.3 0.91 0.83 25.9
North: Melbourne Road (N)
7 L 83 0.0 0.919 28.4 LOS C 36.3 254.4 0.85 1.03 35.5
8 T 1576 0.0 0.919 20.2 LOS C 36.5 255.4 0.85 0.88 36.5
9 R 25 0.0 0.220 55.8 LOS E 1.2 8.2 0.95 0.71 23.6
Approach 1684 0.0 0.919 21.1 LOS C 36.5 255.4 0.85 0.88 36.2
West: Hudson Road (W)
10 L 17 0.0 0.637 60.8 LOS E 3.5 24.3 1.00 0.80 22.6
11 T 17 0.0 0.637 52.6 LOS D 3.5 24.3 1.00 0.80 22.8
12 R 35 0.0 0.637 60.8 LOS E 3.5 24.3 1.00 0.80 22.7
Approach 68 0.0 0.637 58.8 LOS E 3.5 24.3 1.00 0.80 22.7
All Vehicles 3179 0.0 0.920 23.3 LOS C 36.5 255.4 0.79 0.77 35.1
Level of Service (LOS) Method: Delay (HCM 2000).
Vehicle movement LOS values are based on average delay per movement
Intersection and Approach LOS values are based on average delay for all vehicle movements.
SIDRA Standard Delay Model used.
Processed: Wednesday, 9 July 2014 5:56:18 PM SIDRA INTERSECTION 5.1.13.2093
Copyright © 2000-2011 Akcelik and Associates Pty Ltd www.sidrasolutions.com
Project: P:\14M1500-1599\14M1544000 Lot 14, Precinct 15, Blackshaws Rd\Modelling\SIDRA\140708sid-14M1544000-Melbourne Road Hudson Road.sip 8000056, GTA CONSULTANTS, ENTERPRISE


MOVEMENT SUMMARY
Site: Melbourne Road / Blackshaws Road - AM Peak Hour Post Dev Melbourne Road / Blackshaws Road Giveway / Yield (Two-Way)
Movement Performance - Vehicles
Mov ID ODMov
Demand Flows Deg. Satn Average Delay
Level of Service
95% Back of Queue Prop. Queued
Effective Stop Rate
Average Speed Total HV Vehicles Distance
veh/h % v/c sec veh m per veh km/h
South: Melbourne Road
1 L2 146 0.0 0.079 5.6 LOS A 0.0 0.0 0.00 0.53 54.9
2 T1 1322 0.0 0.339 0.0 LOS A 0.0 0.0 0.00 0.00 59.9
Approach 1468 0.0 0.339 0.6 NA 0.0 0.0 0.00 0.05 59.4
East: Blackshaws Road
4 L2 424 0.0 0.429 8.0 LOS A 2.5 17.8 0.49 0.73 52.5
Approach 424 0.0 0.429 8.0 LOS A 2.5 17.8 0.49 0.73 52.5
North: Melbourne Road
7 L2 97 0.0 0.052 5.6 LOS A 0.0 0.0 0.00 0.53 54.9
8 T1 607 0.0 0.156 0.0 LOS A 0.0 0.0 0.00 0.00 60.0
Approach 704 0.0 0.156 0.8 NA 0.0 0.0 0.00 0.07 59.2
All Vehicles 2597 0.0 0.429 1.9 NA 2.5 17.8 0.08 0.17 58.1
Level of Service (LOS) Method: Delay (HCM 2000).
Vehicle movement LOS values are based on average delay per movement
Minor Road Approach LOS values are based on average delay for all vehicle movements.
NA: Intersection LOS and Major Road Approach LOS values are Not Applicable for two-way sign control since the average delay is not a good LOS measure due to zero delays associated with major road movements.
SIDRA Standard Delay Model is used. Control Delay includes Geometric Delay.
Gap-Acceptance Capacity: SIDRA Standard (Akçelik M3D).
HV (%) values are calculated for All Movement Classes of All Heavy Vehicle Model Designation.
Processed: Tuesday, 30 September 2014 12:54:45 PM SIDRA INTERSECTION 6.0.24.4877
Copyright © 2000-2014 Akcelik and Associates Pty Ltd www.sidrasolutions.com
Project: P:\14M1500-1599\14M1544000 Lot 14, Precinct 15, Blackshaws Rd\Modelling\SIDRA\140930sid-14M1544000-Melbourne Road Blackshaws Road.sip6 8000056, 6017418, GTA CONSULTANTS, NETWORK / Enterprise

MOVEMENT SUMMARY
Site: Melbourne Road / Blackshaws Road - PM Peak Hour Post Dev Melbourne Road / Blackshaws Road Giveway / Yield (Two-Way)
Movement Performance - Vehicles
Mov ID ODMov
Demand Flows Deg. Satn Average Delay
Level of Service
95% Back of Queue Prop. Queued
Effective Stop Rate
Average Speed Total HV Vehicles Distance
veh/h % v/c sec veh m per veh km/h
South: Melbourne Road
1 L2 330 0.0 0.178 5.6 LOS A 0.0 0.0 0.00 0.53 54.9
2 T1 1158 0.0 0.297 0.0 LOS A 0.0 0.0 0.00 0.00 59.9
Approach 1488 0.0 0.297 1.3 NA 0.0 0.0 0.00 0.12 58.7
East: Blackshaws Road
4 L2 269 0.0 0.449 12.3 LOS B 2.3 15.9 0.69 0.95 49.4
Approach 269 0.0 0.449 12.3 LOS B 2.3 15.9 0.69 0.95 49.4
North: Melbourne Road
7 L2 399 0.0 0.215 5.6 LOS A 0.0 0.0 0.00 0.53 54.9
8 T1 1364 0.0 0.350 0.0 LOS A 0.0 0.0 0.00 0.00 59.9
Approach 1763 0.0 0.350 1.3 NA 0.0 0.0 0.00 0.12 58.7
All Vehicles 3520 0.0 0.449 2.1 NA 2.3 15.9 0.05 0.18 57.9
Level of Service (LOS) Method: Delay (HCM 2000).
Vehicle movement LOS values are based on average delay per movement
Minor Road Approach LOS values are based on average delay for all vehicle movements.
NA: Intersection LOS and Major Road Approach LOS values are Not Applicable for two-way sign control since the average delay is not a good LOS measure due to zero delays associated with major road movements.
SIDRA Standard Delay Model is used. Control Delay includes Geometric Delay.
Gap-Acceptance Capacity: SIDRA Standard (Akçelik M3D).
HV (%) values are calculated for All Movement Classes of All Heavy Vehicle Model Designation.
Processed: Tuesday, 30 September 2014 12:54:48 PM SIDRA INTERSECTION 6.0.24.4877
Copyright © 2000-2014 Akcelik and Associates Pty Ltd www.sidrasolutions.com
Project: P:\14M1500-1599\14M1544000 Lot 14, Precinct 15, Blackshaws Rd\Modelling\SIDRA\140930sid-14M1544000-Melbourne Road Blackshaws Road.sip6 8000056, 6017418, GTA CONSULTANTS, NETWORK / Enterprise


MOVEMENT SUMMARY
Site: Melbourne Road / Ross Street - AM Peak Hour Post Dev Melbourne Road / Ross Street Stop (Two-Way)
Movement Performance - Vehicles
Mov ID ODMov
Demand Flows Deg. Satn Average Delay
Level of Service
95% Back of Queue Prop. Queued
Effective Stop Rate
Average Speed Total HV Vehicles Distance
veh/h % v/c sec veh m per veh km/h
South: Melbourne Road
1 L2 48 0.0 0.297 5.6 LOS A 0.0 0.0 0.00 0.05 57.9
2 T1 1108 0.0 0.297 0.0 LOS A 0.0 0.0 0.00 0.02 59.7
Approach 1157 0.0 0.297 0.3 NA 0.0 0.0 0.00 0.03 59.6
North: Melbourne Road
8 T1 1019 0.0 0.261 0.0 LOS A 0.0 0.0 0.00 0.00 59.9
9 R2 18 0.0 0.046 13.8 LOS B 0.1 1.0 0.74 0.89 47.8
Approach 1037 0.0 0.261 0.3 NA 0.1 1.0 0.01 0.02 59.7
West: Ross Street
10 L2 365 0.0 0.725 21.4 LOS C 4.9 34.3 0.87 1.28 44.5
12 R2 4 0.0 0.098 83.3 LOS F 0.3 1.8 0.96 1.00 25.3
Approach 369 0.0 0.725 22.1 LOS C 4.9 34.3 0.87 1.28 44.1
All Vehicles 2563 0.0 0.725 3.4 NA 4.9 34.3 0.13 0.20 56.8
Level of Service (LOS) Method: Delay (HCM 2000).
Vehicle movement LOS values are based on average delay per movement
Minor Road Approach LOS values are based on average delay for all vehicle movements.
NA: Intersection LOS and Major Road Approach LOS values are Not Applicable for two-way sign control since the average delay is not a good LOS measure due to zero delays associated with major road movements.
SIDRA Standard Delay Model is used. Control Delay includes Geometric Delay.
Gap-Acceptance Capacity: SIDRA Standard (Akçelik M3D).
HV (%) values are calculated for All Movement Classes of All Heavy Vehicle Model Designation.
Processed: Tuesday, 30 September 2014 12:58:24 PM SIDRA INTERSECTION 6.0.24.4877
Copyright © 2000-2014 Akcelik and Associates Pty Ltd www.sidrasolutions.com
Project: P:\14M1500-1599\14M1544000 Lot 14, Precinct 15, Blackshaws Rd\Modelling\SIDRA\140930sid-14M1544000-Melbourne Road Ross Street.sip6 8000056, 6017418, GTA CONSULTANTS, NETWORK / Enterprise

MOVEMENT SUMMARY
Site: Melbourne Road / Ross Street - PM Peak Hour Post Dev Melbourne Road / Ross Street Stop (Two-Way)
Movement Performance - Vehicles
Mov ID ODMov
Demand Flows Deg. Satn Average Delay
Level of Service
95% Back of Queue Prop. Queued
Effective Stop Rate
Average Speed Total HV Vehicles Distance
veh/h % v/c sec veh m per veh km/h
South: Melbourne Road
1 L2 97 0.0 0.345 5.6 LOS A 0.0 0.0 0.00 0.09 57.6
2 T1 1242 0.0 0.345 0.0 LOS A 0.0 0.0 0.00 0.04 59.6
Approach 1339 0.0 0.345 0.4 NA 0.0 0.0 0.00 0.04 59.4
North: Melbourne Road
8 T1 1563 0.0 0.401 0.1 LOS A 0.0 0.0 0.00 0.00 59.9
9 R2 48 0.0 0.191 20.3 LOS C 0.6 4.5 0.85 0.95 44.1
Approach 1611 0.0 0.401 0.7 NA 0.6 4.5 0.03 0.03 59.3
West: Ross Street
10 L2 226 0.0 0.615 23.0 LOS C 2.9 20.5 0.88 1.16 43.6
12 R2 1 0.0 0.279 982.4 LOS F 0.6 4.3 1.00 1.00 3.5
Approach 227 0.0 0.615 27.3 LOS D 2.9 20.5 0.88 1.16 41.5
All Vehicles 3177 0.0 0.615 2.5 NA 2.9 20.5 0.08 0.12 57.6
Level of Service (LOS) Method: Delay (HCM 2000).
Vehicle movement LOS values are based on average delay per movement
Minor Road Approach LOS values are based on average delay for all vehicle movements.
NA: Intersection LOS and Major Road Approach LOS values are Not Applicable for two-way sign control since the average delay is not a good LOS measure due to zero delays associated with major road movements.
SIDRA Standard Delay Model is used. Control Delay includes Geometric Delay.
Gap-Acceptance Capacity: SIDRA Standard (Akçelik M3D).
HV (%) values are calculated for All Movement Classes of All Heavy Vehicle Model Designation.
Processed: Tuesday, 30 September 2014 12:58:26 PM SIDRA INTERSECTION 6.0.24.4877
Copyright © 2000-2014 Akcelik and Associates Pty Ltd www.sidrasolutions.com
Project: P:\14M1500-1599\14M1544000 Lot 14, Precinct 15, Blackshaws Rd\Modelling\SIDRA\140930sid-14M1544000-Melbourne Road Ross Street.sip6 8000056, 6017418, GTA CONSULTANTS, NETWORK / Enterprise


MOVEMENT SUMMARY
Site: Schutt Street / Blackshaws Road - AM Peak Hour Post Dev Blackshaws Road / Schutt Street Giveway / Yield (Two-Way)
Movement Performance - Vehicles
Mov ID ODMov
Demand Flows Deg. Satn Average Delay
Level of Service
95% Back of Queue Prop. Queued
Effective Stop Rate
Average Speed Total HV Vehicles Distance
veh/h % v/c sec veh m per veh km/h
South: Schutt Street
1 L2 36 0.0 0.048 7.7 LOS A 0.2 1.2 0.38 0.60 52.0
3 R2 4 0.0 0.048 7.6 LOS A 0.2 1.2 0.38 0.60 51.5
Approach 40 0.0 0.048 7.7 LOS A 0.2 1.2 0.38 0.60 52.0
East: Blackshaws Road
4 L2 2 0.0 0.129 5.6 LOS A 0.0 0.0 0.00 0.01 58.3
5 T1 249 0.0 0.129 0.0 LOS A 0.0 0.0 0.00 0.01 59.9
Approach 252 0.0 0.129 0.1 NA 0.0 0.0 0.00 0.01 59.9
West: Blackshaws Road
11 T1 422 0.0 0.216 0.0 LOS A 0.0 0.0 0.00 0.00 60.0
12 R2 343 0.0 0.306 6.8 LOS A 1.5 10.2 0.42 0.66 52.0
Approach 765 0.0 0.306 3.1 NA 1.5 10.2 0.19 0.29 56.1
All Vehicles 1057 0.0 0.306 2.5 NA 1.5 10.2 0.15 0.24 56.8
Level of Service (LOS) Method: Delay (HCM 2000).
Vehicle movement LOS values are based on average delay per movement
Minor Road Approach LOS values are based on average delay for all vehicle movements.
NA: Intersection LOS and Major Road Approach LOS values are Not Applicable for two-way sign control since the average delay is not a good LOS measure due to zero delays associated with major road movements.
SIDRA Standard Delay Model is used. Control Delay includes Geometric Delay.
Gap-Acceptance Capacity: SIDRA Standard (Akçelik M3D).
HV (%) values are calculated for All Movement Classes of All Heavy Vehicle Model Designation.
Processed: Tuesday, 30 September 2014 12:31:55 PM SIDRA INTERSECTION 6.0.24.4877
Copyright © 2000-2014 Akcelik and Associates Pty Ltd www.sidrasolutions.com
Project: P:\14M1500-1599\14M1544000 Lot 14, Precinct 15, Blackshaws Rd\Modelling\SIDRA\140930sid-14M1544000-Blackshaws Road Schutt Street.sip6 8000056, 6017418, GTA CONSULTANTS, NETWORK / Enterprise

MOVEMENT SUMMARY
Site: Schutt Street / Blackshaws Road - PM Peak Hour Post Dev Blackshaws Road / Schutt Street Giveway / Yield (Two-Way)
Movement Performance - Vehicles
Mov ID ODMov
Demand Flows Deg. Satn Average Delay
Level of Service
95% Back of Queue Prop. Queued
Effective Stop Rate
Average Speed Total HV Vehicles Distance
veh/h % v/c sec veh m per veh km/h
South: Schutt Street
1 L2 38 0.0 0.086 11.7 LOS B 0.3 2.0 0.66 0.86 49.2
3 R2 3 0.0 0.086 11.6 LOS B 0.3 2.0 0.66 0.86 48.7
Approach 41 0.0 0.086 11.7 LOS B 0.3 2.0 0.66 0.86 49.1
East: Blackshaws Road
4 L2 8 0.0 0.385 5.6 LOS A 0.0 0.0 0.00 0.01 58.2
5 T1 741 0.0 0.385 0.1 LOS A 0.0 0.0 0.00 0.01 59.8
Approach 749 0.0 0.385 0.1 NA 0.0 0.0 0.00 0.01 59.8
West: Blackshaws Road
11 T1 267 0.0 0.137 0.0 LOS A 0.0 0.0 0.00 0.00 60.0
12 R2 224 0.0 0.405 12.9 LOS B 1.9 13.6 0.73 0.97 47.9
Approach 492 0.0 0.405 5.9 NA 1.9 13.6 0.33 0.44 53.8
All Vehicles 1282 0.0 0.405 2.7 NA 1.9 13.6 0.15 0.20 57.0
Level of Service (LOS) Method: Delay (HCM 2000).
Vehicle movement LOS values are based on average delay per movement
Minor Road Approach LOS values are based on average delay for all vehicle movements.
NA: Intersection LOS and Major Road Approach LOS values are Not Applicable for two-way sign control since the average delay is not a good LOS measure due to zero delays associated with major road movements.
SIDRA Standard Delay Model is used. Control Delay includes Geometric Delay.
Gap-Acceptance Capacity: SIDRA Standard (Akçelik M3D).
HV (%) values are calculated for All Movement Classes of All Heavy Vehicle Model Designation.
Processed: Tuesday, 30 September 2014 12:31:57 PM SIDRA INTERSECTION 6.0.24.4877
Copyright © 2000-2014 Akcelik and Associates Pty Ltd www.sidrasolutions.com
Project: P:\14M1500-1599\14M1544000 Lot 14, Precinct 15, Blackshaws Rd\Modelling\SIDRA\140930sid-14M1544000-Blackshaws Road Schutt Street.sip6 8000056, 6017418, GTA CONSULTANTS, NETWORK / Enterprise
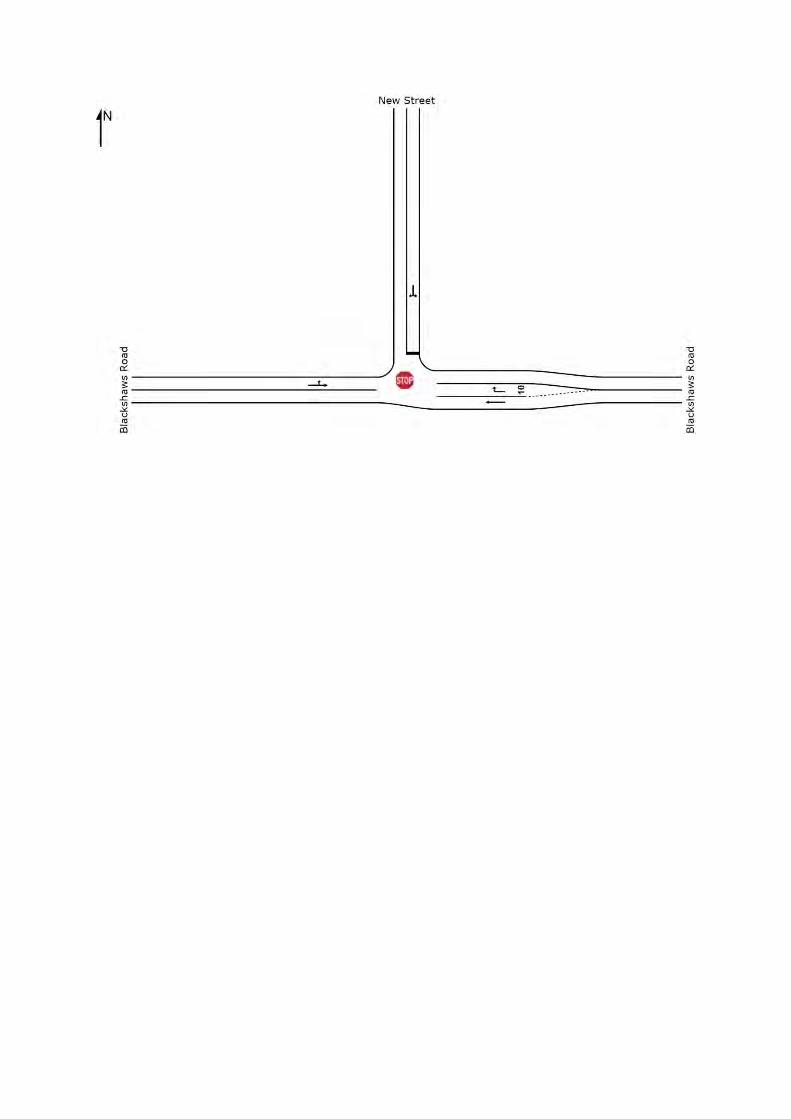

MOVEMENT SUMMARY
Site: New Street/Blackshaws Road AM Peak Post Dev New Street / Blackshaws Road Stop (Two-Way)
Movement Performance - Vehicles
Mov ID ODMov
Demand Flows Deg. Satn Average Delay
Level of Service
95% Back of Queue Prop. Queued
Effective Stop Rate
Average Speed Total HV Vehicles Distance
veh/h % v/c sec veh m per veh km/h
East: Blackshaws Road
5 T1 491 0.0 0.252 0.0 LOS A 0.0 0.0 0.00 0.00 59.9
6 R2 21 0.0 0.041 11.7 LOS B 0.2 1.1 0.65 0.81 48.7
Approach 512 0.0 0.252 0.5 NA 0.2 1.1 0.03 0.03 59.4
North: New Street
7 L2 58 0.0 0.324 18.9 LOS C 1.4 9.5 0.74 1.05 45.8
9 R2 64 0.0 0.324 18.3 LOS C 1.4 9.5 0.74 1.05 45.4
Approach 122 0.0 0.324 18.6 LOS C 1.4 9.5 0.74 1.05 45.6
West: Blackshaws Road
10 L2 289 0.0 0.465 5.6 LOS A 0.0 0.0 0.00 0.19 56.6
11 T1 602 0.0 0.465 0.1 LOS A 0.0 0.0 0.00 0.19 58.1
Approach 892 0.0 0.465 1.9 NA 0.0 0.0 0.00 0.19 57.6
All Vehicles 1525 0.0 0.465 2.7 NA 1.4 9.5 0.07 0.21 57.0
Level of Service (LOS) Method: Delay (HCM 2000).
Vehicle movement LOS values are based on average delay per movement
Minor Road Approach LOS values are based on average delay for all vehicle movements.
NA: Intersection LOS and Major Road Approach LOS values are Not Applicable for two-way sign control since the average delay is not a good LOS measure due to zero delays associated with major road movements.
SIDRA Standard Delay Model is used. Control Delay includes Geometric Delay.
Gap-Acceptance Capacity: SIDRA Standard (Akçelik M3D).
HV (%) values are calculated for All Movement Classes of All Heavy Vehicle Model Designation.
Processed: Tuesday, 30 September 2014 12:28:59 PM SIDRA INTERSECTION 6.0.24.4877
Copyright © 2000-2014 Akcelik and Associates Pty Ltd www.sidrasolutions.com
Project: P:\14M1500-1599\14M1544000 Lot 14, Precinct 15, Blackshaws Rd\Modelling\SIDRA\140930sid-14M1544000-Blackshaws Road New Street.sip6 8000056, 6017418, GTA CONSULTANTS, NETWORK / Enterprise

MOVEMENT SUMMARY
Site: New Street/Blackshaws Road PM Peak Post Dev New Street / Blackshaws Road Stop (Two-Way)
Movement Performance - Vehicles
Mov ID ODMov
Demand Flows Deg. Satn Average Delay
Level of Service
95% Back of Queue Prop. Queued
Effective Stop Rate
Average Speed Total HV Vehicles Distance
veh/h % v/c sec veh m per veh km/h
East: Blackshaws Road
5 T1 753 0.0 0.386 0.1 LOS A 0.0 0.0 0.00 0.00 59.9
6 R2 46 0.0 0.086 11.4 LOS B 0.3 2.4 0.65 0.84 48.9
Approach 799 0.0 0.386 0.7 NA 0.3 2.4 0.04 0.05 59.1
North: New Street
7 L2 33 0.0 0.887 70.5 LOS F 6.2 43.6 0.96 1.48 27.9
9 R2 131 0.0 0.887 69.9 LOS F 6.2 43.6 0.96 1.48 27.7
Approach 163 0.0 0.887 70.0 LOS F 6.2 43.6 0.96 1.48 27.8
West: Blackshaws Road
10 L2 141 0.0 0.445 5.6 LOS A 0.0 0.0 0.00 0.10 57.4
11 T1 719 0.0 0.445 0.1 LOS A 0.0 0.0 0.00 0.10 59.0
Approach 860 0.0 0.445 1.0 NA 0.0 0.0 0.00 0.10 58.7
All Vehicles 1822 0.0 0.887 7.0 NA 6.2 43.6 0.10 0.20 53.5
Level of Service (LOS) Method: Delay (HCM 2000).
Vehicle movement LOS values are based on average delay per movement
Minor Road Approach LOS values are based on average delay for all vehicle movements.
NA: Intersection LOS and Major Road Approach LOS values are Not Applicable for two-way sign control since the average delay is not a good LOS measure due to zero delays associated with major road movements.
SIDRA Standard Delay Model is used. Control Delay includes Geometric Delay.
Gap-Acceptance Capacity: SIDRA Standard (Akçelik M3D).
HV (%) values are calculated for All Movement Classes of All Heavy Vehicle Model Designation.
Processed: Tuesday, 30 September 2014 12:29:01 PM SIDRA INTERSECTION 6.0.24.4877
Copyright © 2000-2014 Akcelik and Associates Pty Ltd www.sidrasolutions.com
Project: P:\14M1500-1599\14M1544000 Lot 14, Precinct 15, Blackshaws Rd\Modelling\SIDRA\140930sid-14M1544000-Blackshaws Road New Street.sip6 8000056, 6017418, GTA CONSULTANTS, NETWORK / Enterprise


MOVEMENT SUMMARY
Site: Hansen Street/Blackshaws Road - AM Peak Post Dev Hansen Street / Blackshaws Road Stop (Two-Way)
Movement Performance - Vehicles
Mov ID ODMov
Demand Flows Deg. Satn Average Delay
Level of Service
95% Back of Queue Prop. Queued
Effective Stop Rate
Average Speed Total HV Vehicles Distance
veh/h % v/c sec veh m per veh km/h
South: Hansen Street
1 L2 27 0.0 0.467 32.6 LOS D 1.8 12.6 0.86 1.09 39.2
3 R2 64 0.0 0.467 32.0 LOS D 1.8 12.6 0.86 1.09 38.9
Approach 92 0.0 0.467 32.2 LOS D 1.8 12.6 0.86 1.09 39.0
East: Blackshaws Road
4 L2 34 0.0 0.283 5.6 LOS A 0.0 0.0 0.00 0.04 58.0
5 T1 516 0.0 0.283 0.0 LOS A 0.0 0.0 0.00 0.04 59.6
Approach 549 0.0 0.283 0.4 NA 0.0 0.0 0.00 0.04 59.5
West: Blackshaws Road
11 T1 817 0.0 0.419 0.1 LOS A 0.0 0.0 0.00 0.00 59.9
12 R2 104 0.0 0.136 8.6 LOS A 0.4 3.0 0.50 0.77 50.8
Approach 921 0.0 0.419 1.0 NA 0.4 3.0 0.06 0.09 58.7
All Vehicles 1562 0.0 0.467 2.6 NA 1.8 12.6 0.08 0.13 57.3
Level of Service (LOS) Method: Delay (HCM 2000).
Vehicle movement LOS values are based on average delay per movement
Minor Road Approach LOS values are based on average delay for all vehicle movements.
NA: Intersection LOS and Major Road Approach LOS values are Not Applicable for two-way sign control since the average delay is not a good LOS measure due to zero delays associated with major road movements.
SIDRA Standard Delay Model is used. Control Delay includes Geometric Delay.
Gap-Acceptance Capacity: SIDRA Standard (Akçelik M3D).
HV (%) values are calculated for All Movement Classes of All Heavy Vehicle Model Designation.
Processed: Tuesday, 30 September 2014 12:20:41 PM SIDRA INTERSECTION 6.0.24.4877
Copyright © 2000-2014 Akcelik and Associates Pty Ltd www.sidrasolutions.com
Project: P:\14M1500-1599\14M1544000 Lot 14, Precinct 15, Blackshaws Rd\Modelling\SIDRA\140930sid-14M1544000-Blackshaws Road Hansen Street.sip6 8000056, 6017418, GTA CONSULTANTS, NETWORK / Enterprise

MOVEMENT SUMMARY
Site: Hansen Street/Blackshaws Road - PM Peak Post Dev Hansen Street / Blackshaws Road Stop (Two-Way)
Movement Performance - Vehicles
Mov ID ODMov
Demand Flows Deg. Satn Average Delay
Level of Service
95% Back of Queue Prop. Queued
Effective Stop Rate
Average Speed Total HV Vehicles Distance
veh/h % v/c sec veh m per veh km/h
South: Hansen Street
1 L2 97 0.0 0.715 44.6 LOS E 3.4 24.1 0.92 1.23 34.7
3 R2 42 0.0 0.715 44.0 LOS E 3.4 24.1 0.92 1.23 34.5
Approach 139 0.0 0.715 44.4 LOS E 3.4 24.1 0.92 1.23 34.7
East: Blackshaws Road
4 L2 68 0.0 0.479 5.6 LOS A 0.0 0.0 0.00 0.04 57.9
5 T1 863 0.0 0.479 0.1 LOS A 0.0 0.0 0.00 0.04 59.5
Approach 932 0.0 0.479 0.5 NA 0.0 0.0 0.00 0.04 59.3
West: Blackshaws Road
11 T1 717 0.0 0.368 0.0 LOS A 0.0 0.0 0.00 0.00 59.9
12 R2 75 0.0 0.195 14.4 LOS B 0.6 3.9 0.77 0.92 47.0
Approach 792 0.0 0.368 1.4 NA 0.6 3.9 0.07 0.09 58.4
All Vehicles 1862 0.0 0.715 4.1 NA 3.4 24.1 0.10 0.15 56.0
Level of Service (LOS) Method: Delay (HCM 2000).
Vehicle movement LOS values are based on average delay per movement
Minor Road Approach LOS values are based on average delay for all vehicle movements.
NA: Intersection LOS and Major Road Approach LOS values are Not Applicable for two-way sign control since the average delay is not a good LOS measure due to zero delays associated with major road movements.
SIDRA Standard Delay Model is used. Control Delay includes Geometric Delay.
Gap-Acceptance Capacity: SIDRA Standard (Akçelik M3D).
HV (%) values are calculated for All Movement Classes of All Heavy Vehicle Model Designation.
Processed: Tuesday, 30 September 2014 12:20:44 PM SIDRA INTERSECTION 6.0.24.4877
Copyright © 2000-2014 Akcelik and Associates Pty Ltd www.sidrasolutions.com
Project: P:\14M1500-1599\14M1544000 Lot 14, Precinct 15, Blackshaws Rd\Modelling\SIDRA\140930sid-14M1544000-Blackshaws Road Hansen Street.sip6 8000056, 6017418, GTA CONSULTANTS, NETWORK / Enterprise


MOVEMENT SUMMARY Site: Kyle/Mills/Blackshaws - AM Peak Post Dev
Kyle Road / Mills Street / Blackshaws Road Signals - Fixed Time Cycle Time = 90 seconds (User-Given Cycle Time)
Movement Performance - Vehicles
Mov ID Turn Demand Flow
HV Deg. Satn Average Delay
Level of Service
95% Back of Queue Prop. Queued
Effective Stop Rate
Average Speed Vehicles Distance
veh/h % v/c sec veh m per veh km/h
South: Mills Street
1 L 45 0.0 0.310 42.4 LOS D 1.7 11.9 0.88 0.73 27.7
2 T 55 0.0 0.636 40.8 LOS D 6.7 47.0 0.99 0.83 26.1
3 R 99 0.0 0.636 48.9 LOS D 6.7 47.0 0.99 0.84 26.0
Approach 199 0.0 0.636 45.2 LOS D 6.7 47.0 0.96 0.81 26.4
East: Blackshaws Road
4 L 101 0.0 0.286 13.0 LOS B 1.4 10.0 0.35 0.71 44.1
5 T 880 0.0 0.758 10.8 LOS B 27.2 190.1 0.73 0.68 43.7
6 R 45 0.0 0.758 19.0 LOS B 27.2 190.1 0.73 0.96 41.7
Approach 1026 0.0 0.758 11.4 LOS B 27.2 190.1 0.69 0.69 43.7
North: Kyle Road
7 L 64 0.0 0.441 42.8 LOS D 2.5 17.2 0.89 0.75 27.5
8 T 43 0.0 0.559 39.7 LOS D 5.6 39.2 0.97 0.78 26.5
9 R 88 0.0 0.559 47.9 LOS D 5.6 39.2 0.97 0.80 26.3
Approach 196 0.0 0.559 44.4 LOS D 5.6 39.2 0.95 0.78 26.7
West: Blackshaws Road
10 L 24 0.0 0.191 13.1 LOS B 1.7 12.2 0.35 0.91 45.2
11 T 592 0.0 0.519 11.0 LOS B 13.8 96.7 0.60 0.53 43.9
12 R 32 0.0 0.519 20.5 LOS C 13.8 96.7 0.65 0.95 40.3
Approach 647 0.0 0.519 11.6 LOS B 13.8 96.7 0.59 0.56 43.7
All Vehicles 2068 0.0 0.758 17.8 LOS B 27.2 190.1 0.71 0.67 38.9
Level of Service (LOS) Method: Delay (HCM 2000).
Vehicle movement LOS values are based on average delay per movement
Intersection and Approach LOS values are based on average delay for all vehicle movements.
SIDRA Standard Delay Model used.
Movement Performance - Pedestrians
Mov ID
Description Demand
Flow Average
Delay Level of Service
Average Back of Queue Prop. Queued
Effective Stop Rate Pedestrian Distance
ped/h sec ped m per ped
P1 Across S approach 53 8.0 LOS A 0.1 0.1 0.42 0.42
P3 Across E approach 53 39.2 LOS D 0.1 0.1 0.93 0.93
P5 Across N approach 53 8.0 LOS A 0.1 0.1 0.42 0.42
P7 Across W approach 53 39.2 LOS D 0.1 0.1 0.93 0.93
All Pedestrians 212 23.6 LOS C 0.68 0.68
Level of Service (LOS) Method: SIDRA Pedestrian LOS Method (Based on Average Delay)
Pedestrian movement LOS values are based on average delay per pedestrian movement.
Intersection LOS value for Pedestrians is based on average delay for all pedestrian movements.
Processed: Wednesday, 9 July 2014 3:52:57 PM SIDRA INTERSECTION 5.1.13.2093
Copyright © 2000-2011 Akcelik and Associates Pty Ltd www.sidrasolutions.com
Project: P:\14M1500-1599\14M1544000 Lot 14, Precinct 15, Blackshaws Rd\Modelling\SIDRA\140708sid-14M1544000-Blackshaws Road Mills Street Kyle Road.sip 8000056, GTA CONSULTANTS, ENTERPRISE

MOVEMENT SUMMARY Site: Kyle/Mills/Blackshaws - PM Peak Post Dev
Kyle Road / Mills Street / Blackshaws Road Signals - Fixed Time Cycle Time = 90 seconds (User-Given Cycle Time)
Movement Performance - Vehicles
Mov ID Turn Demand Flow
HV Deg. Satn Average Delay
Level of Service
95% Back of Queue Prop. Queued
Effective Stop Rate
Average Speed Vehicles Distance
veh/h % v/c sec veh m per veh km/h
South: Mills Street (S)
1 L 41 0.0 0.281 42.3 LOS D 1.5 10.8 0.87 0.73 27.7
2 T 53 0.0 0.594 40.0 LOS D 6.3 44.3 0.98 0.80 26.4
3 R 95 0.0 0.594 48.2 LOS D 6.3 44.3 0.98 0.82 26.2
Approach 188 0.0 0.594 44.6 LOS D 6.3 44.3 0.96 0.79 26.6
East: Blackshaws Road (E)
4 L 105 0.0 0.298 13.0 LOS B 1.5 10.4 0.35 0.71 44.1
5 T 762 0.0 0.834 23.5 LOS C 33.1 231.7 0.91 0.89 34.5
6 R 51 0.0 0.834 31.6 LOS C 33.1 231.7 0.91 0.99 33.9
Approach 918 0.0 0.834 22.7 LOS C 33.1 231.7 0.85 0.87 35.3
North: Kyle Road (N)
7 L 64 0.0 0.441 42.8 LOS D 2.5 17.2 0.89 0.75 27.5
8 T 54 0.0 0.364 37.2 LOS D 3.9 27.1 0.93 0.73 27.7
9 R 42 0.0 0.364 45.4 LOS D 3.9 27.1 0.93 0.79 27.4
Approach 160 0.0 0.441 41.6 LOS D 3.9 27.1 0.91 0.75 27.5
West: Blackshaws Road (W)
10 L 56 0.0 0.321 13.3 LOS B 3.1 21.6 0.37 0.89 44.9
11 T 928 0.0 0.871 24.4 LOS C 38.1 266.9 0.85 0.86 34.0
12 R 67 0.0 0.871 36.3 LOS D 38.1 266.9 0.94 1.02 31.6
Approach 1052 0.0 0.871 24.6 LOS C 38.1 266.9 0.83 0.87 34.3
All Vehicles 2318 0.0 0.871 26.6 LOS C 38.1 266.9 0.85 0.86 33.3
Level of Service (LOS) Method: Delay (HCM 2000).
Vehicle movement LOS values are based on average delay per movement
Intersection and Approach LOS values are based on average delay for all vehicle movements.
SIDRA Standard Delay Model used.
Movement Performance - Pedestrians
Mov ID
Description Demand
Flow Average
Delay Level of Service
Average Back of Queue Prop. Queued
Effective Stop Rate Pedestrian Distance
ped/h sec ped m per ped
P1 Across S approach 53 8.0 LOS A 0.1 0.1 0.42 0.42
P3 Across E approach 53 39.2 LOS D 0.1 0.1 0.93 0.93
P5 Across N approach 53 8.0 LOS A 0.1 0.1 0.42 0.42
P7 Across W approach 53 39.2 LOS D 0.1 0.1 0.93 0.93
All Pedestrians 212 23.6 LOS C 0.68 0.68
Level of Service (LOS) Method: SIDRA Pedestrian LOS Method (Based on Average Delay)
Pedestrian movement LOS values are based on average delay per pedestrian movement.
Intersection LOS value for Pedestrians is based on average delay for all pedestrian movements.
Processed: Wednesday, 9 July 2014 6:10:33 PM SIDRA INTERSECTION 5.1.13.2093
Copyright © 2000-2011 Akcelik and Associates Pty Ltd www.sidrasolutions.com
Project: P:\14M1500-1599\14M1544000 Lot 14, Precinct 15, Blackshaws Rd\Modelling\SIDRA\140708sid-14M1544000-Blackshaws Road Mills Street Kyle Road.sip 8000056, GTA CONSULTANTS, ENTERPRISE
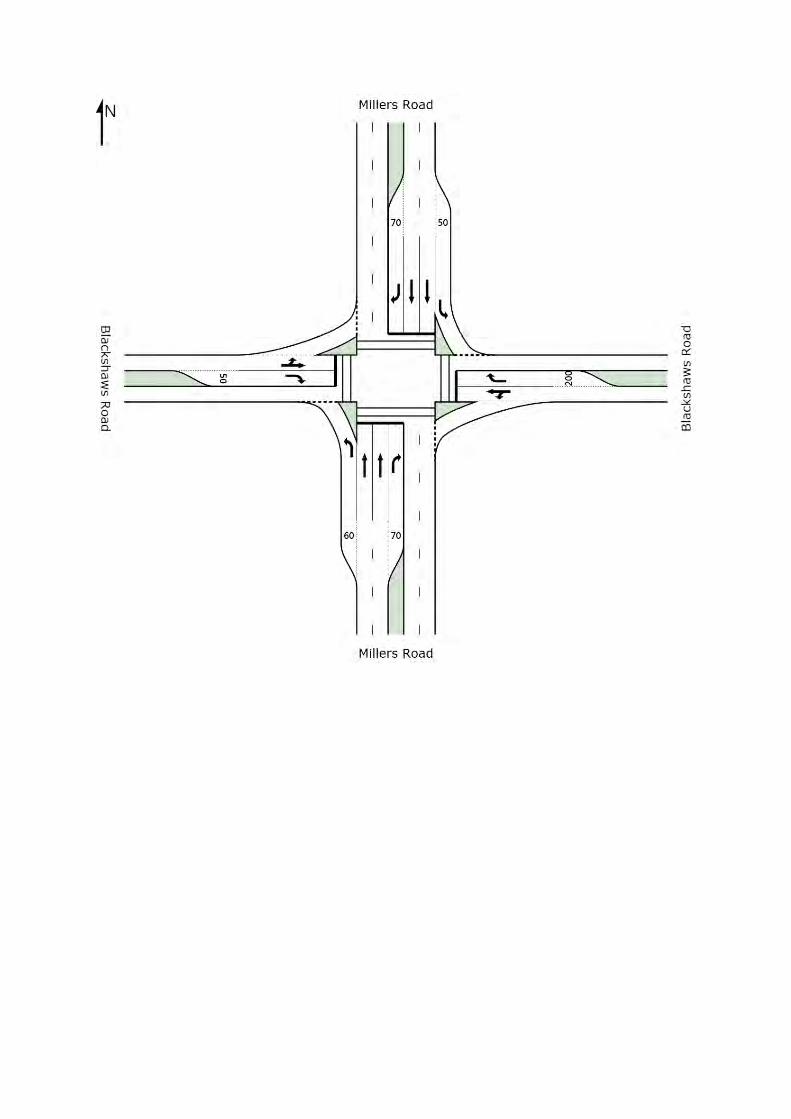

MOVEMENT SUMMARY Site: Millers Road/Blackshaws Road - AM Post Dev
Millers Road / Blackshaws Road Signals - Fixed Time Cycle Time = 109 seconds (User-Given Phase Times)
Movement Performance - Vehicles
Mov ID Turn Demand Flow
HV Deg. Satn Average Delay
Level of Service
95% Back of Queue Prop. Queued
Effective Stop Rate
Average Speed Vehicles Distance
veh/h % v/c sec veh m per veh km/h
South: Millers Road
1 L 109 0.0 0.184 12.4 LOS B 1.7 12.2 0.37 0.68 44.8
2 T 1022 0.0 0.816 40.6 LOS D 26.8 187.4 0.99 0.94 27.1
3 R 107 0.0 0.525 59.5 LOS E 5.6 39.3 0.99 0.79 22.7
Approach 1239 0.0 0.816 39.8 LOS D 26.8 187.4 0.93 0.90 27.6
East: Blackshaws Road
4 L 135 0.0 0.953 58.6 LOS E 33.3 233.3 1.00 1.17 23.7
5 T 416 0.0 0.953 50.7 LOS D 33.3 233.3 1.00 1.17 23.7
6 R 466 0.0 1.141 175.9 LOS F 46.6 326.4 1.00 1.44 10.3
Approach 1017 0.0 1.141 109.1 LOS F 46.6 326.4 1.00 1.29 14.8
North: Millers Road
7 L 374 0.0 0.626 11.2 LOS B 5.7 39.7 0.37 0.70 45.9
8 T 787 0.0 0.629 23.2 LOS C 14.7 102.8 0.75 0.65 35.1
9 R 102 0.0 0.499 55.1 LOS E 5.1 35.6 0.94 0.78 23.8
Approach 1263 0.0 0.629 22.2 LOS C 14.7 102.8 0.65 0.67 36.2
West: Blackshaws Road
10 L 83 0.0 0.676 45.1 LOS D 14.4 101.0 0.89 0.97 27.8
11 T 283 0.0 0.676 37.2 LOS D 14.4 101.0 0.89 0.87 28.1
12 R 115 0.0 0.403 34.8 LOS C 3.9 27.2 0.87 0.77 30.7
Approach 481 0.0 0.676 38.0 LOS D 14.4 101.0 0.88 0.86 28.6
All Vehicles 4000 0.0 1.141 51.6 LOS D 46.6 326.4 0.86 0.92 24.3
Level of Service (LOS) Method: Delay (HCM 2000).
Vehicle movement LOS values are based on average delay per movement
Intersection and Approach LOS values are based on average delay for all vehicle movements.
SIDRA Standard Delay Model used.
Movement Performance - Pedestrians
Mov ID
Description Demand
Flow Average
Delay Level of Service
Average Back of Queue Prop. Queued
Effective Stop Rate Pedestrian Distance
ped/h sec ped m per ped
P1 Across S approach 53 40.5 LOS E 0.1 0.1 0.86 0.86
P3 Across E approach 53 30.1 LOS D 0.1 0.1 0.74 0.74
P5 Across N approach 53 40.5 LOS E 0.1 0.1 0.86 0.86
P7 Across W approach 53 30.1 LOS D 0.1 0.1 0.74 0.74
All Pedestrians 212 35.3 LOS D 0.80 0.80
Level of Service (LOS) Method: SIDRA Pedestrian LOS Method (Based on Average Delay)
Pedestrian movement LOS values are based on average delay per pedestrian movement.
Intersection LOS value for Pedestrians is based on average delay for all pedestrian movements.
Processed: Tuesday, 30 September 2014 1:26:45 PM SIDRA INTERSECTION 5.1.13.2093
Copyright © 2000-2011 Akcelik and Associates Pty Ltd www.sidrasolutions.com
Project: P:\14M1500-1599\14M1544000 Lot 14, Precinct 15, Blackshaws Rd\Modelling\SIDRA\140708sid-14M544000-Blackshaws Road Millers Road.sip 8000056, GTA CONSULTANTS, ENTERPRISE

MOVEMENT SUMMARY Site: Millers Road/Blackshaws Road - PM Post Dev
Millers Road / Blackshaws Road Signals - Fixed Time Cycle Time = 110 seconds (User-Given Cycle Time)
Movement Performance - Vehicles
Mov ID Turn Demand Flow
HV Deg. Satn Average Delay
Level of Service
95% Back of Queue Prop. Queued
Effective Stop Rate
Average Speed Vehicles Distance
veh/h % v/c sec veh m per veh km/h
South: Millers Road
1 L 99 0.0 0.138 9.9 LOS A 1.1 7.6 0.27 0.66 47.1
2 T 796 0.0 0.561 30.0 LOS C 17.0 119.2 0.85 0.74 31.4
3 R 200 0.0 0.987 97.2 LOS F 14.9 104.0 1.00 1.12 16.3
Approach 1095 0.0 0.987 40.5 LOS D 17.0 119.2 0.83 0.80 27.6
East: Blackshaws Road
4 L 146 0.0 0.812 42.8 LOS D 15.6 109.2 0.93 1.05 28.4
5 T 245 0.0 0.812 35.0 LOS C 15.6 109.2 0.93 1.00 28.7
6 R 329 0.0 0.964 53.5 LOS D 17.6 123.1 1.00 0.99 24.3
Approach 721 0.0 0.964 45.0 LOS D 17.6 123.1 0.96 1.01 26.5
North: Millers Road
7 L 463 0.0 0.775 17.8 LOS B 11.1 78.0 0.46 0.75 40.5
8 T 1379 0.0 0.972 63.5 LOS E 48.6 339.9 1.00 1.19 21.1
9 R 117 0.0 0.577 60.5 LOS E 6.1 42.7 0.98 0.79 22.5
Approach 1959 0.0 0.972 52.5 LOS D 48.6 339.9 0.87 1.06 23.9
West: Blackshaws Road
10 L 65 0.0 0.898 66.4 LOS E 19.7 137.7 1.00 1.10 22.0
11 T 285 0.0 0.898 58.5 LOS E 19.7 137.7 1.00 1.10 22.0
12 R 100 0.0 0.355 35.2 LOS D 3.7 26.0 0.85 0.76 30.5
Approach 451 0.0 0.898 54.5 LOS D 19.7 137.7 0.97 1.03 23.5
All Vehicles 4225 0.0 0.987 48.3 LOS D 48.6 339.9 0.89 0.98 25.2
Level of Service (LOS) Method: Delay (HCM 2000).
Vehicle movement LOS values are based on average delay per movement
Intersection and Approach LOS values are based on average delay for all vehicle movements.
SIDRA Standard Delay Model used.
Movement Performance - Pedestrians
Mov ID
Description Demand
Flow Average
Delay Level of Service
Average Back of Queue Prop. Queued
Effective Stop Rate Pedestrian Distance
ped/h sec ped m per ped
P1 Across S approach 53 49.2 LOS E 0.2 0.2 0.95 0.95
P3 Across E approach 53 27.0 LOS C 0.1 0.1 0.70 0.70
P5 Across N approach 53 49.2 LOS E 0.2 0.2 0.95 0.95
P7 Across W approach 53 27.0 LOS C 0.1 0.1 0.70 0.70
All Pedestrians 212 38.1 LOS D 0.82 0.82
Level of Service (LOS) Method: SIDRA Pedestrian LOS Method (Based on Average Delay)
Pedestrian movement LOS values are based on average delay per pedestrian movement.
Intersection LOS value for Pedestrians is based on average delay for all pedestrian movements.
Processed: Tuesday, 30 September 2014 1:26:47 PM SIDRA INTERSECTION 5.1.13.2093
Copyright © 2000-2011 Akcelik and Associates Pty Ltd www.sidrasolutions.com
Project: P:\14M1500-1599\14M1544000 Lot 14, Precinct 15, Blackshaws Rd\Modelling\SIDRA\140708sid-14M544000-Blackshaws Road Millers Road.sip 8000056, GTA CONSULTANTS, ENTERPRISE
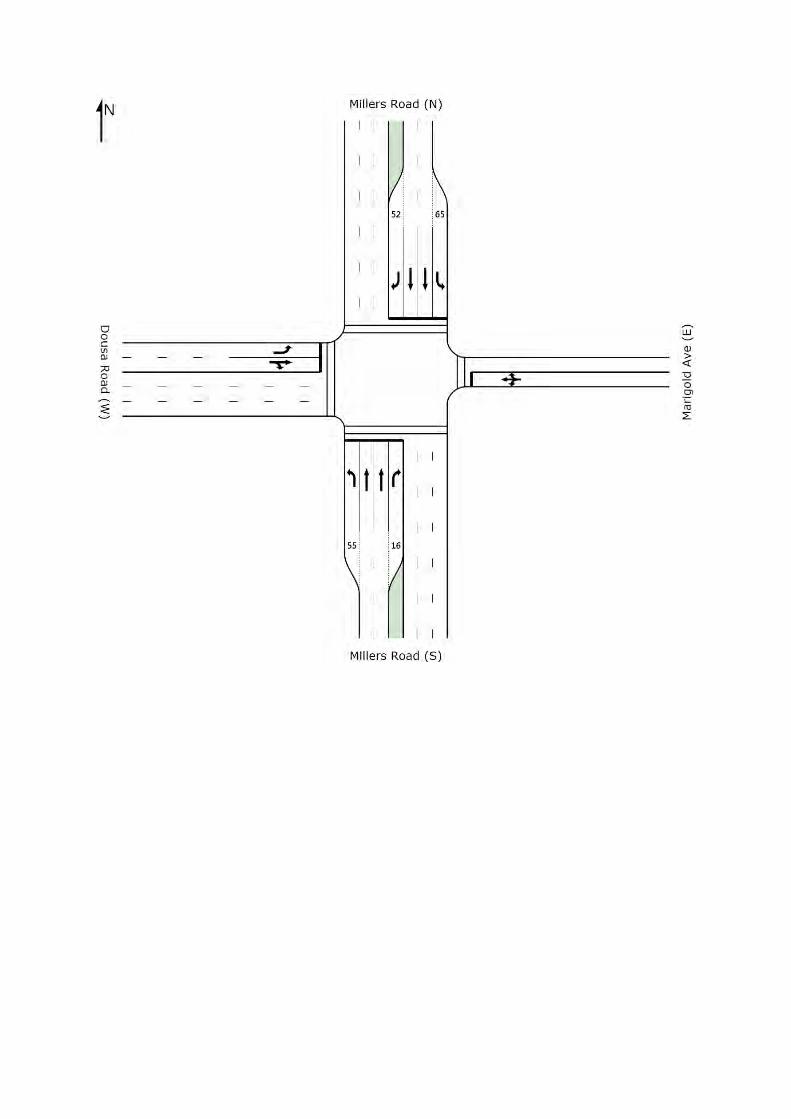

MOVEMENT SUMMARY Site: Millers / Marigold - AM Post Dev
New Site Signals - Fixed Time Cycle Time = 109 seconds (User-Given Phase Times)
Movement Performance - Vehicles
Mov ID Turn Demand Flow
HV Deg. Satn Average Delay
Level of Service
95% Back of Queue Prop. Queued
Effective Stop Rate
Average Speed Vehicles Distance
veh/h % v/c sec veh m per veh km/h
South: Millers Road (S)
1 L 134 0.0 0.234 18.2 LOS B 2.2 15.7 0.34 0.72 40.0
2 T 1476 0.0 0.878 19.5 LOS B 32.5 227.4 0.82 0.80 37.1
3 R 5 0.0 0.074 61.0 LOS E 0.3 1.9 0.93 0.64 22.4
Approach 1615 0.0 0.878 19.5 LOS B 32.5 227.4 0.78 0.79 37.2
East: Marigold Ave (E)
4 L 1 0.0 0.940 83.0 LOS F 17.6 123.2 1.00 1.16 18.4
5 T 69 0.0 0.940 74.9 LOS E 17.6 123.2 1.00 1.16 18.5
6 R 174 0.0 0.940 82.9 LOS F 17.6 123.2 1.00 1.16 18.5
Approach 244 0.0 0.940 80.6 LOS F 17.6 123.2 1.00 1.16 18.5
North: Millers Road (N)
7 L 55 0.0 0.082 16.9 LOS B 0.8 5.8 0.30 0.70 41.0
8 T 974 0.0 0.461 11.3 LOS B 10.7 74.6 0.45 0.40 44.3
9 R 114 0.0 0.486 52.6 LOS D 5.5 38.4 0.93 0.78 24.5
Approach 1142 0.0 0.486 15.7 LOS B 10.7 74.6 0.49 0.45 40.9
West: Dousa Road (W)
10 L 208 0.0 0.382 29.7 LOS C 6.8 47.8 0.84 0.80 33.0
11 T 19 0.0 0.151 39.1 LOS D 2.1 14.4 0.86 0.66 27.1
12 R 27 0.0 0.151 47.0 LOS D 2.1 14.4 0.86 0.76 26.7
Approach 255 0.0 0.382 32.3 LOS C 6.8 47.8 0.84 0.79 31.6
All Vehicles 3256 0.0 0.940 23.8 LOS C 32.5 227.4 0.70 0.70 35.2
Level of Service (LOS) Method: Delay (HCM 2000).
Vehicle movement LOS values are based on average delay per movement
Intersection and Approach LOS values are based on average delay for all vehicle movements.
SIDRA Standard Delay Model used.
Movement Performance - Pedestrians
Mov ID
Description Demand
Flow Average
Delay Level of Service
Average Back of Queue Prop. Queued
Effective Stop Rate Pedestrian Distance
ped/h sec ped m per ped
P1 Across S approach 53 46.8 LOS E 0.2 0.2 0.93 0.93
P3 Across E approach 53 20.6 LOS C 0.1 0.1 0.61 0.61
P5 Across N approach 53 46.8 LOS E 0.2 0.2 0.93 0.93
P7 Across W approach 53 25.8 LOS C 0.1 0.1 0.69 0.69
All Pedestrians 212 35.0 LOS D 0.79 0.79
Level of Service (LOS) Method: SIDRA Pedestrian LOS Method (Based on Average Delay)
Pedestrian movement LOS values are based on average delay per pedestrian movement.
Intersection LOS value for Pedestrians is based on average delay for all pedestrian movements.
Processed: Tuesday, 30 September 2014 1:32:14 PM SIDRA INTERSECTION 5.1.13.2093
Copyright © 2000-2011 Akcelik and Associates Pty Ltd www.sidrasolutions.com
Project: P:\14M1500-1599\14M1544000 Lot 14, Precinct 15, Blackshaws Rd\Modelling\SIDRA\140708sid-14M1544000-Millers Road Marigold Road.sip 8000056, GTA CONSULTANTS, ENTERPRISE
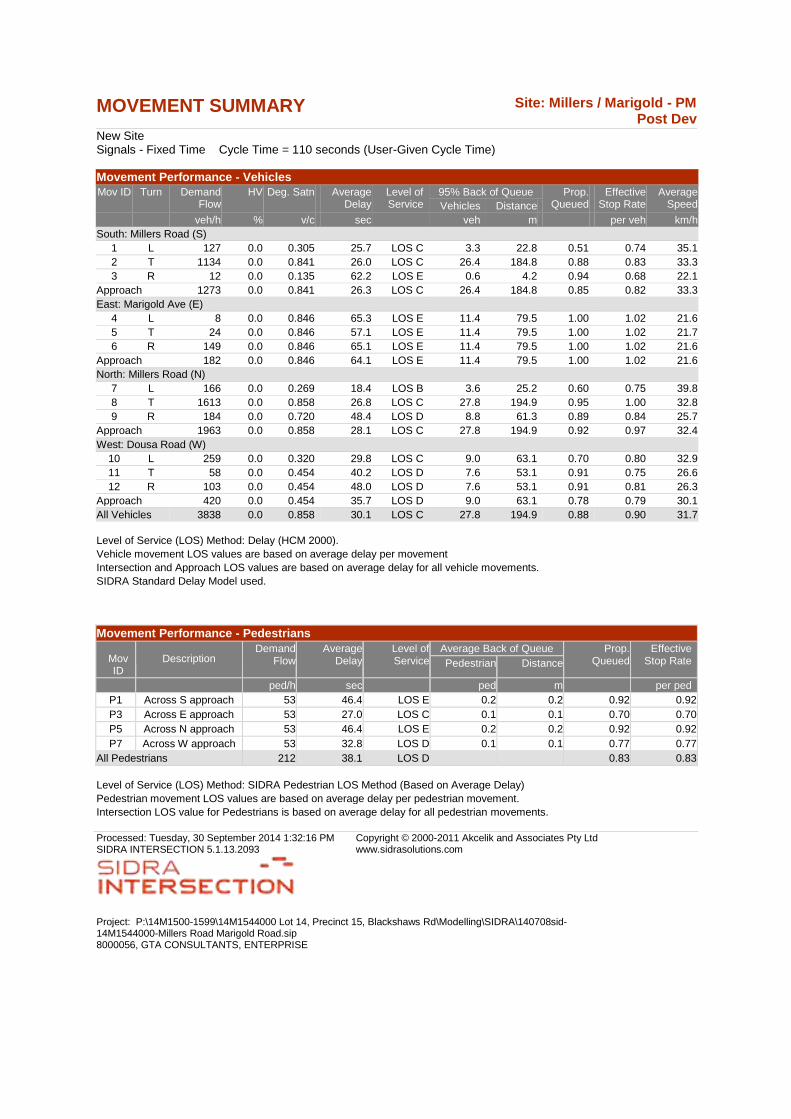
MOVEMENT SUMMARY Site: Millers / Marigold - PM Post Dev
New Site Signals - Fixed Time Cycle Time = 110 seconds (User-Given Cycle Time)
Movement Performance - Vehicles
Mov ID Turn Demand Flow
HV Deg. Satn Average Delay
Level of Service
95% Back of Queue Prop. Queued
Effective Stop Rate
Average Speed Vehicles Distance
veh/h % v/c sec veh m per veh km/h
South: Millers Road (S)
1 L 127 0.0 0.305 25.7 LOS C 3.3 22.8 0.51 0.74 35.1
2 T 1134 0.0 0.841 26.0 LOS C 26.4 184.8 0.88 0.83 33.3
3 R 12 0.0 0.135 62.2 LOS E 0.6 4.2 0.94 0.68 22.1
Approach 1273 0.0 0.841 26.3 LOS C 26.4 184.8 0.85 0.82 33.3
East: Marigold Ave (E)
4 L 8 0.0 0.846 65.3 LOS E 11.4 79.5 1.00 1.02 21.6
5 T 24 0.0 0.846 57.1 LOS E 11.4 79.5 1.00 1.02 21.7
6 R 149 0.0 0.846 65.1 LOS E 11.4 79.5 1.00 1.02 21.6
Approach 182 0.0 0.846 64.1 LOS E 11.4 79.5 1.00 1.02 21.6
North: Millers Road (N)
7 L 166 0.0 0.269 18.4 LOS B 3.6 25.2 0.60 0.75 39.8
8 T 1613 0.0 0.858 26.8 LOS C 27.8 194.9 0.95 1.00 32.8
9 R 184 0.0 0.720 48.4 LOS D 8.8 61.3 0.89 0.84 25.7
Approach 1963 0.0 0.858 28.1 LOS C 27.8 194.9 0.92 0.97 32.4
West: Dousa Road (W)
10 L 259 0.0 0.320 29.8 LOS C 9.0 63.1 0.70 0.80 32.9
11 T 58 0.0 0.454 40.2 LOS D 7.6 53.1 0.91 0.75 26.6
12 R 103 0.0 0.454 48.0 LOS D 7.6 53.1 0.91 0.81 26.3
Approach 420 0.0 0.454 35.7 LOS D 9.0 63.1 0.78 0.79 30.1
All Vehicles 3838 0.0 0.858 30.1 LOS C 27.8 194.9 0.88 0.90 31.7
Level of Service (LOS) Method: Delay (HCM 2000).
Vehicle movement LOS values are based on average delay per movement
Intersection and Approach LOS values are based on average delay for all vehicle movements.
SIDRA Standard Delay Model used.
Movement Performance - Pedestrians
Mov ID
Description Demand
Flow Average
Delay Level of Service
Average Back of Queue Prop. Queued
Effective Stop Rate Pedestrian Distance
ped/h sec ped m per ped
P1 Across S approach 53 46.4 LOS E 0.2 0.2 0.92 0.92
P3 Across E approach 53 27.0 LOS C 0.1 0.1 0.70 0.70
P5 Across N approach 53 46.4 LOS E 0.2 0.2 0.92 0.92
P7 Across W approach 53 32.8 LOS D 0.1 0.1 0.77 0.77
All Pedestrians 212 38.1 LOS D 0.83 0.83
Level of Service (LOS) Method: SIDRA Pedestrian LOS Method (Based on Average Delay)
Pedestrian movement LOS values are based on average delay per pedestrian movement.
Intersection LOS value for Pedestrians is based on average delay for all pedestrian movements.
Processed: Tuesday, 30 September 2014 1:32:16 PM SIDRA INTERSECTION 5.1.13.2093
Copyright © 2000-2011 Akcelik and Associates Pty Ltd www.sidrasolutions.com
Project: P:\14M1500-1599\14M1544000 Lot 14, Precinct 15, Blackshaws Rd\Modelling\SIDRA\140708sid-14M1544000-Millers Road Marigold Road.sip 8000056, GTA CONSULTANTS, ENTERPRISE


MOVEMENT SUMMARY Site: Millers Road/Blackshaws Road - AM Post Dev
(Modified) Millers Road / Blackshaws Road Signals - Fixed Time Cycle Time = 110 seconds (User-Given Cycle Time)
Movement Performance - Vehicles
Mov ID Turn Demand Flow
HV Deg. Satn Average Delay
Level of Service
95% Back of Queue Prop. Queued
Effective Stop Rate
Average Speed Vehicles Distance
veh/h % v/c sec veh m per veh km/h
South: Millers Road
1 L 109 0.0 0.172 11.6 LOS B 1.5 10.8 0.34 0.67 45.6
2 T 1022 0.0 0.930 61.1 LOS E 33.7 235.7 1.00 1.13 21.6
3 R 107 0.0 0.909 77.2 LOS E 6.8 47.5 1.00 1.00 19.2
Approach 1239 0.0 0.930 58.1 LOS E 33.7 235.7 0.94 1.08 22.4
East: Blackshaws Road
4 L 137 0.0 0.931 41.5 LOS D 26.6 186.4 1.00 1.04 29.0
5 T 379 0.0 0.931 33.7 LOS C 26.6 186.4 1.00 1.04 29.1
6 R 508 0.0 0.931 64.4 LOS E 28.8 201.5 1.00 1.01 21.7
Approach 1024 0.0 0.931 50.0 LOS D 28.8 201.5 1.00 1.02 24.9
North: Millers Road
7 L 375 0.0 0.554 11.4 LOS B 5.8 40.8 0.37 0.69 45.7
8 T 787 0.0 0.716 28.6 LOS C 17.0 119.3 0.85 0.74 32.1
9 R 102 0.0 0.864 67.6 LOS E 6.0 42.0 1.00 0.87 20.9
Approach 1264 0.0 0.864 26.6 LOS C 17.0 119.3 0.72 0.74 33.7
West: Blackshaws Road
10 L 83 0.0 0.897 70.0 LOS E 20.3 142.2 1.00 1.15 21.2
11 T 283 0.0 0.897 62.2 LOS E 20.3 142.2 1.00 1.15 21.2
12 R 115 0.0 0.485 52.0 LOS D 5.3 36.8 0.88 0.78 24.7
Approach 481 0.0 0.897 61.1 LOS E 20.3 142.2 0.97 1.06 21.9
All Vehicles 4008 0.0 0.931 46.5 LOS D 33.7 235.7 0.89 0.95 25.7
Level of Service (LOS) Method: Delay (HCM 2000).
Vehicle movement LOS values are based on average delay per movement
Intersection and Approach LOS values are based on average delay for all vehicle movements.
SIDRA Standard Delay Model used.
Movement Performance - Pedestrians
Mov ID
Description Demand
Flow Average
Delay Level of Service
Average Back of Queue Prop. Queued
Effective Stop Rate Pedestrian Distance
ped/h sec ped m per ped
P1 Across S approach 53 40.2 LOS E 0.1 0.1 0.85 0.85
P3 Across E approach 53 33.6 LOS D 0.1 0.1 0.78 0.78
P5 Across N approach 53 49.2 LOS E 0.2 0.2 0.95 0.95
P7 Across W approach 53 33.6 LOS D 0.1 0.1 0.78 0.78
All Pedestrians 212 39.1 LOS D 0.84 0.84
Level of Service (LOS) Method: SIDRA Pedestrian LOS Method (Based on Average Delay)
Pedestrian movement LOS values are based on average delay per pedestrian movement.
Intersection LOS value for Pedestrians is based on average delay for all pedestrian movements.
Processed: Thursday, 25 September 2014 4:37:19 PM SIDRA INTERSECTION 5.1.13.2093
Copyright © 2000-2011 Akcelik and Associates Pty Ltd www.sidrasolutions.com
Project: P:\14M1500-1599\14M1544000 Lot 14, Precinct 15, Blackshaws Rd\Modelling\SIDRA\140708sid-14M544000-Blackshaws Road Millers Road.sip 8000056, GTA CONSULTANTS, ENTERPRISE

MOVEMENT SUMMARY Site: Millers Road/Blackshaws Road - PM Post Dev
(Modified) Millers Road / Blackshaws Road Signals - Fixed Time Cycle Time = 120 seconds (User-Given Cycle Time)
Movement Performance - Vehicles
Mov ID Turn Demand Flow
HV Deg. Satn Average Delay
Level of Service
95% Back of Queue Prop. Queued
Effective Stop Rate
Average Speed Vehicles Distance
veh/h % v/c sec veh m per veh km/h
South: Millers Road
1 L 99 0.0 0.130 9.8 LOS A 1.1 7.4 0.25 0.65 47.3
2 T 796 0.0 0.556 30.0 LOS C 16.3 113.8 0.75 0.65 31.6
3 R 201 0.0 0.928 79.6 LOS E 13.7 95.8 1.00 0.98 18.8
Approach 1096 0.0 0.928 37.3 LOS D 16.3 113.8 0.75 0.71 28.9
East: Blackshaws Road
4 L 147 0.0 0.945 47.0 LOS D 19.2 134.6 1.00 1.03 26.9
5 T 246 0.0 0.945 39.1 LOS D 19.2 134.6 1.00 1.03 27.0
6 R 331 0.0 0.945 75.6 LOS E 19.6 136.9 1.00 1.02 19.6
Approach 724 0.0 0.945 57.4 LOS E 19.6 136.9 1.00 1.02 23.0
North: Millers Road
7 L 465 0.0 0.612 15.6 LOS B 11.0 76.8 0.49 0.75 42.1
8 T 1379 0.0 0.964 71.4 LOS E 53.3 373.4 1.00 1.19 19.6
9 R 117 0.0 0.539 63.8 LOS E 6.7 46.7 0.99 0.79 21.7
Approach 1961 0.0 0.964 57.7 LOS E 53.3 373.4 0.88 1.06 22.6
West: Blackshaws Road
10 L 65 0.0 0.975 92.8 LOS F 25.6 179.1 1.00 1.24 17.4
11 T 286 0.0 0.975 85.0 LOS F 25.6 179.1 1.00 1.24 17.4
12 R 100 0.0 0.484 57.2 LOS E 5.3 37.1 0.93 0.78 23.3
Approach 452 0.0 0.975 80.0 LOS E 25.6 179.1 0.99 1.13 18.4
All Vehicles 4233 0.0 0.975 54.7 LOS D 53.3 373.4 0.88 0.97 23.4
Level of Service (LOS) Method: Delay (HCM 2000).
Vehicle movement LOS values are based on average delay per movement
Intersection and Approach LOS values are based on average delay for all vehicle movements.
SIDRA Standard Delay Model used.
Movement Performance - Pedestrians
Mov ID
Description Demand
Flow Average
Delay Level of Service
Average Back of Queue Prop. Queued
Effective Stop Rate Pedestrian Distance
ped/h sec ped m per ped
P1 Across S approach 53 54.2 LOS E 0.2 0.2 0.95 0.95
P3 Across E approach 53 28.7 LOS C 0.1 0.1 0.69 0.69
P5 Across N approach 53 54.2 LOS E 0.2 0.2 0.95 0.95
P7 Across W approach 53 28.7 LOS C 0.1 0.1 0.69 0.69
All Pedestrians 212 41.4 LOS E 0.82 0.82
Level of Service (LOS) Method: SIDRA Pedestrian LOS Method (Based on Average Delay)
Pedestrian movement LOS values are based on average delay per pedestrian movement.
Intersection LOS value for Pedestrians is based on average delay for all pedestrian movements.
Processed: Thursday, 25 September 2014 4:47:32 PM SIDRA INTERSECTION 5.1.13.2093
Copyright © 2000-2011 Akcelik and Associates Pty Ltd www.sidrasolutions.com
Project: P:\14M1500-1599\14M1544000 Lot 14, Precinct 15, Blackshaws Rd\Modelling\SIDRA\140708sid-14M544000-Blackshaws Road Millers Road.sip 8000056, GTA CONSULTANTS, ENTERPRISE

Appendix C
14M1544000 23/03/15
Precinct 15, Blackshaws Road, Altona North Issue: C
Development / Structure Plan Transport Assessment
Ap
pe
nd
ix C
Appendix C
SIDRA INTERSECTION Results – Access Intersections

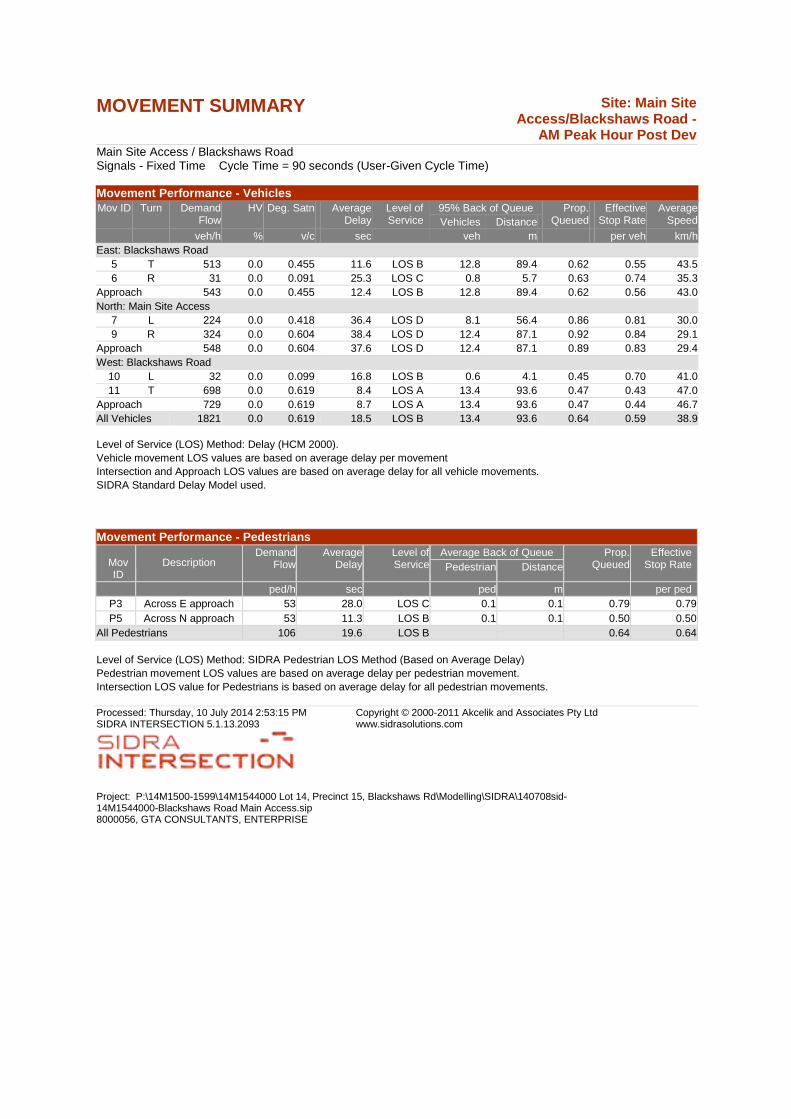
MOVEMENT SUMMARY Site: Main Site Access/Blackshaws Road -
AM Peak Hour Post Dev Main Site Access / Blackshaws Road Signals - Fixed Time Cycle Time = 90 seconds (User-Given Cycle Time)
Movement Performance - Vehicles
Mov ID Turn Demand Flow
HV Deg. Satn Average Delay
Level of Service
95% Back of Queue Prop. Queued
Effective Stop Rate
Average Speed Vehicles Distance
veh/h % v/c sec veh m per veh km/h
East: Blackshaws Road
5 T 513 0.0 0.455 11.6 LOS B 12.8 89.4 0.62 0.55 43.5
6 R 31 0.0 0.091 25.3 LOS C 0.8 5.7 0.63 0.74 35.3
Approach 543 0.0 0.455 12.4 LOS B 12.8 89.4 0.62 0.56 43.0
North: Main Site Access
7 L 224 0.0 0.418 36.4 LOS D 8.1 56.4 0.86 0.81 30.0
9 R 324 0.0 0.604 38.4 LOS D 12.4 87.1 0.92 0.84 29.1
Approach 548 0.0 0.604 37.6 LOS D 12.4 87.1 0.89 0.83 29.4
West: Blackshaws Road
10 L 32 0.0 0.099 16.8 LOS B 0.6 4.1 0.45 0.70 41.0
11 T 698 0.0 0.619 8.4 LOS A 13.4 93.6 0.47 0.43 47.0
Approach 729 0.0 0.619 8.7 LOS A 13.4 93.6 0.47 0.44 46.7
All Vehicles 1821 0.0 0.619 18.5 LOS B 13.4 93.6 0.64 0.59 38.9
Level of Service (LOS) Method: Delay (HCM 2000).
Vehicle movement LOS values are based on average delay per movement
Intersection and Approach LOS values are based on average delay for all vehicle movements.
SIDRA Standard Delay Model used.
Movement Performance - Pedestrians
Mov ID
Description Demand
Flow Average
Delay Level of Service
Average Back of Queue Prop. Queued
Effective Stop Rate Pedestrian Distance
ped/h sec ped m per ped
P3 Across E approach 53 28.0 LOS C 0.1 0.1 0.79 0.79
P5 Across N approach 53 11.3 LOS B 0.1 0.1 0.50 0.50
All Pedestrians 106 19.6 LOS B 0.64 0.64
Level of Service (LOS) Method: SIDRA Pedestrian LOS Method (Based on Average Delay)
Pedestrian movement LOS values are based on average delay per pedestrian movement.
Intersection LOS value for Pedestrians is based on average delay for all pedestrian movements.
Processed: Thursday, 10 July 2014 2:53:15 PM SIDRA INTERSECTION 5.1.13.2093
Copyright © 2000-2011 Akcelik and Associates Pty Ltd www.sidrasolutions.com
Project: P:\14M1500-1599\14M1544000 Lot 14, Precinct 15, Blackshaws Rd\Modelling\SIDRA\140708sid-14M1544000-Blackshaws Road Main Access.sip 8000056, GTA CONSULTANTS, ENTERPRISE
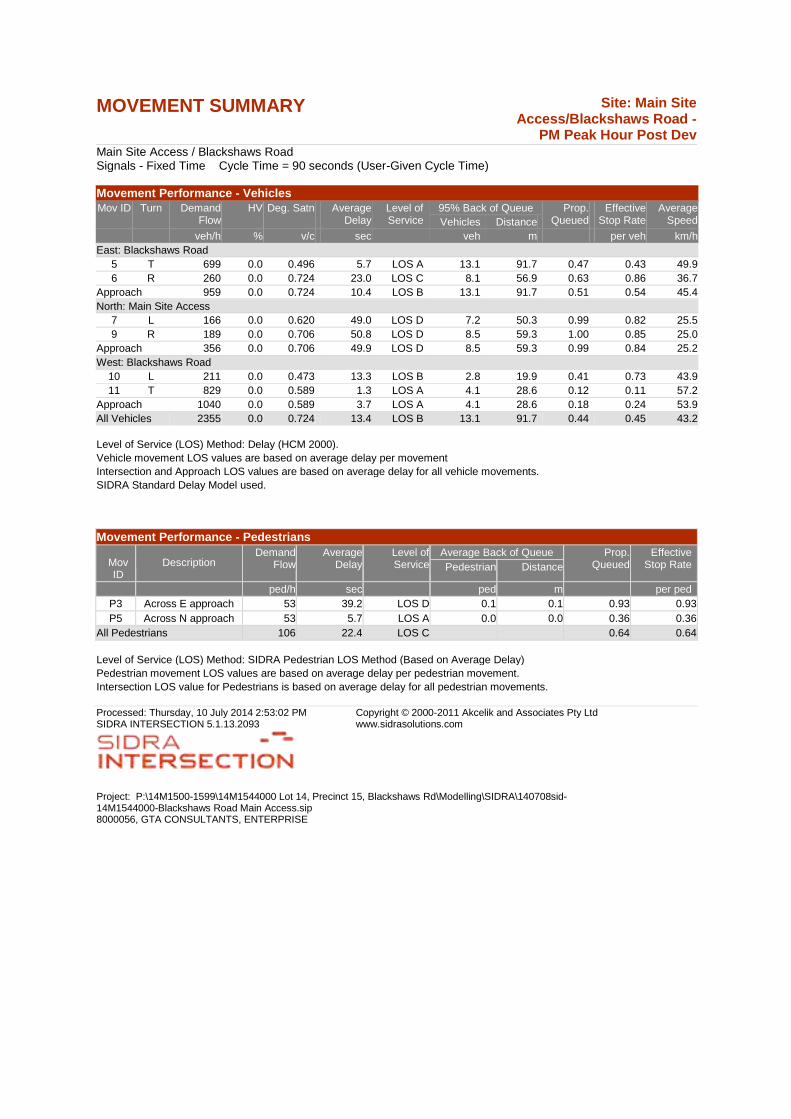
MOVEMENT SUMMARY Site: Main Site Access/Blackshaws Road -
PM Peak Hour Post Dev Main Site Access / Blackshaws Road Signals - Fixed Time Cycle Time = 90 seconds (User-Given Cycle Time)
Movement Performance - Vehicles
Mov ID Turn Demand Flow
HV Deg. Satn Average Delay
Level of Service
95% Back of Queue Prop. Queued
Effective Stop Rate
Average Speed Vehicles Distance
veh/h % v/c sec veh m per veh km/h
East: Blackshaws Road
5 T 699 0.0 0.496 5.7 LOS A 13.1 91.7 0.47 0.43 49.9
6 R 260 0.0 0.724 23.0 LOS C 8.1 56.9 0.63 0.86 36.7
Approach 959 0.0 0.724 10.4 LOS B 13.1 91.7 0.51 0.54 45.4
North: Main Site Access
7 L 166 0.0 0.620 49.0 LOS D 7.2 50.3 0.99 0.82 25.5
9 R 189 0.0 0.706 50.8 LOS D 8.5 59.3 1.00 0.85 25.0
Approach 356 0.0 0.706 49.9 LOS D 8.5 59.3 0.99 0.84 25.2
West: Blackshaws Road
10 L 211 0.0 0.473 13.3 LOS B 2.8 19.9 0.41 0.73 43.9
11 T 829 0.0 0.589 1.3 LOS A 4.1 28.6 0.12 0.11 57.2
Approach 1040 0.0 0.589 3.7 LOS A 4.1 28.6 0.18 0.24 53.9
All Vehicles 2355 0.0 0.724 13.4 LOS B 13.1 91.7 0.44 0.45 43.2
Level of Service (LOS) Method: Delay (HCM 2000).
Vehicle movement LOS values are based on average delay per movement
Intersection and Approach LOS values are based on average delay for all vehicle movements.
SIDRA Standard Delay Model used.
Movement Performance - Pedestrians
Mov ID
Description Demand
Flow Average
Delay Level of Service
Average Back of Queue Prop. Queued
Effective Stop Rate Pedestrian Distance
ped/h sec ped m per ped
P3 Across E approach 53 39.2 LOS D 0.1 0.1 0.93 0.93
P5 Across N approach 53 5.7 LOS A 0.0 0.0 0.36 0.36
All Pedestrians 106 22.4 LOS C 0.64 0.64
Level of Service (LOS) Method: SIDRA Pedestrian LOS Method (Based on Average Delay)
Pedestrian movement LOS values are based on average delay per pedestrian movement.
Intersection LOS value for Pedestrians is based on average delay for all pedestrian movements.
Processed: Thursday, 10 July 2014 2:53:02 PM SIDRA INTERSECTION 5.1.13.2093
Copyright © 2000-2011 Akcelik and Associates Pty Ltd www.sidrasolutions.com
Project: P:\14M1500-1599\14M1544000 Lot 14, Precinct 15, Blackshaws Rd\Modelling\SIDRA\140708sid-14M1544000-Blackshaws Road Main Access.sip 8000056, GTA CONSULTANTS, ENTERPRISE


MOVEMENT SUMMARY
Site: 2nd Site Access/Blackshaws Road - AM Peak Hour Post Dev 2nd Site Access / Blackshaws Road Giveway / Yield (Two-Way)
Movement Performance - Vehicles
Mov ID ODMov
Demand Flows Deg. Satn Average Delay
Level of Service
95% Back of Queue Prop. Queued
Effective Stop Rate
Average Speed Total HV Vehicles Distance
veh/h % v/c sec veh m per veh km/h
East: Blackshaws Road
5 T1 776 0.0 0.398 0.1 LOS A 0.0 0.0 0.00 0.00 59.9
6 R2 19 0.0 0.022 8.7 LOS A 0.1 0.6 0.53 0.68 51.0
Approach 795 0.0 0.398 0.3 NA 0.1 0.6 0.01 0.02 59.6
North: 2nd Site Access
7 L2 68 0.0 0.102 9.7 LOS A 0.4 2.8 0.59 0.79 50.6
9 R2 102 0.0 0.540 33.8 LOS D 2.2 15.3 0.92 1.07 37.6
Approach 171 0.0 0.540 24.1 LOS C 2.2 15.3 0.79 0.96 41.9
West: Blackshaws Road
10 L2 35 0.0 0.370 5.6 LOS A 0.0 0.0 0.00 0.03 58.0
11 T1 684 0.0 0.370 0.0 LOS A 0.0 0.0 0.00 0.03 59.6
Approach 719 0.0 0.370 0.3 NA 0.0 0.0 0.00 0.03 59.6
All Vehicles 1684 0.0 0.540 2.7 NA 2.2 15.3 0.09 0.12 57.2
Level of Service (LOS) Method: Delay (HCM 2000).
Vehicle movement LOS values are based on average delay per movement
Minor Road Approach LOS values are based on average delay for all vehicle movements.
NA: Intersection LOS and Major Road Approach LOS values are Not Applicable for two-way sign control since the average delay is not a good LOS measure due to zero delays associated with major road movements.
SIDRA Standard Delay Model is used. Control Delay includes Geometric Delay.
Gap-Acceptance Capacity: SIDRA Standard (Akçelik M3D).
HV (%) values are calculated for All Movement Classes of All Heavy Vehicle Model Designation.
Processed: Tuesday, 30 September 2014 12:18:14 PM SIDRA INTERSECTION 6.0.24.4877
Copyright © 2000-2014 Akcelik and Associates Pty Ltd www.sidrasolutions.com
Project: P:\14M1500-1599\14M1544000 Lot 14, Precinct 15, Blackshaws Rd\Modelling\SIDRA\140930sid-14M1544000-Blackshaws Road 2nd Access.sip6 8000056, 6017418, GTA CONSULTANTS, NETWORK / Enterprise

MOVEMENT SUMMARY
Site: 2nd Site Access/Blackshaws Road - PM Peak Hour Post Dev 2nd Site Access / Blackshaws Road Giveway / Yield (Two-Way)
Movement Performance - Vehicles
Mov ID ODMov
Demand Flows Deg. Satn Average Delay
Level of Service
95% Back of Queue Prop. Queued
Effective Stop Rate
Average Speed Total HV Vehicles Distance
veh/h % v/c sec veh m per veh km/h
East: Blackshaws Road
5 T1 856 0.0 0.439 0.1 LOS A 0.0 0.0 0.00 0.00 59.9
6 R2 60 0.0 0.120 12.8 LOS B 0.4 2.8 0.75 0.90 48.3
Approach 916 0.0 0.439 0.9 NA 0.4 2.8 0.05 0.06 58.9
North: 2nd Site Access
7 L2 56 0.0 0.127 13.2 LOS B 0.5 3.2 0.72 0.88 48.2
9 R2 72 0.0 0.798 95.7 LOS F 3.3 23.3 0.98 1.18 22.9
Approach 127 0.0 0.798 59.5 LOS F 3.3 23.3 0.87 1.05 29.8
West: Blackshaws Road
10 L2 111 0.0 0.536 5.6 LOS A 0.0 0.0 0.00 0.06 57.7
11 T1 928 0.0 0.536 0.1 LOS A 0.0 0.0 0.00 0.06 59.2
Approach 1039 0.0 0.536 0.7 NA 0.0 0.0 0.00 0.06 59.1
All Vehicles 2082 0.0 0.798 4.4 NA 3.3 23.3 0.07 0.12 55.7
Level of Service (LOS) Method: Delay (HCM 2000).
Vehicle movement LOS values are based on average delay per movement
Minor Road Approach LOS values are based on average delay for all vehicle movements.
NA: Intersection LOS and Major Road Approach LOS values are Not Applicable for two-way sign control since the average delay is not a good LOS measure due to zero delays associated with major road movements.
SIDRA Standard Delay Model is used. Control Delay includes Geometric Delay.
Gap-Acceptance Capacity: SIDRA Standard (Akçelik M3D).
HV (%) values are calculated for All Movement Classes of All Heavy Vehicle Model Designation.
Processed: Tuesday, 30 September 2014 12:18:17 PM SIDRA INTERSECTION 6.0.24.4877
Copyright © 2000-2014 Akcelik and Associates Pty Ltd www.sidrasolutions.com
Project: P:\14M1500-1599\14M1544000 Lot 14, Precinct 15, Blackshaws Rd\Modelling\SIDRA\140930sid-14M1544000-Blackshaws Road 2nd Access.sip6 8000056, 6017418, GTA CONSULTANTS, NETWORK / Enterprise

www.gta.com.au
Melbourne
A Level 25, 55 Collins Street
PO Box 24055
MELBOURNE VIC 3000
P +613 9851 9600
F +613 9851 9610
Canberra
A Unit 4, Level 1, Sparta Building, 55 Woolley Street
PO Box 62
DICKSON ACT 2602
P +612 6243 4826
F +612 6243 4848
Townsville
A Level 1, 25 Sturt Street
PO Box 1064
TOWNSVILLE QLD 4810
P +617 4722 2765
F +617 4722 2761
Sydney
A Level 6, 15 Help Street
CHATSWOOD NSW 2067
PO Box 5254
WEST CHATSWOOD NSW 1515
P +612 8448 1800
F +612 8448 1810
Adelaide
A Suite 4, Level 1, 136 The Parade
PO Box 3421
NORWOOD SA 5067
P +618 8334 3600
F +618 8334 3610
Brisbane
A Level 4, 283 Elizabeth Street
BRISBANE QLD 4000
GPO Box 115
BRISBANE QLD 4001
P +617 3113 5000
F +617 3113 5010
Gold Coast
A Level 9, Corporate Centre 2
Box 37
1 Corporate Court
BUNDALL QLD 4217
P +617 5510 4800
F +617 5510 4814
Recommended