PRESS RELEASE
UNIVISION COMMUNICATIONS INC. Page 1 of 17
UNIVISION COMMUNICATIONS INC. ANNOUNCES 2018 THIRD QUARTER RESULTS1
NEW YORK, NY – November 14, 2018 – Univision Communications Inc. (the “Company”), the leading media
company serving Hispanic America, today announced financial results for the third quarter ended September 30,
2018.
Continuing Operations Results - Third Quarter 2018 Compared to Third Quarter 2017
• Total revenue decreased 17.3% to $628.2 million from $759.4 million. Total core revenue2 decreased
8.2% to $648.9 million from $706.7 million.
• Income from continuing operations3 was $12.4 million compared to $109.6 million.
• Adjusted OIBDA4 decreased 33.7% to $231.0 million from $348.4 million. Adjusted Core OIBDA5
decreased 17.0% to $247.3 million from $298.0 million.
• Interest expense decreased 8.3% to $98.3 million from $107.2 million. The Company continued to
deleverage and has reduced total indebtedness, net of cash and cash equivalents by $336.5 million for the
nine months ended September 30, 2018.
“Third quarter financial results were impacted by headwinds including our dispute with Dish, the World Cup’s
impact on advertising, lower ratings and the 2018 Televisa PLA rate increase,” said Vince Sadusky, CEO of
Univision. “Longer term, our refocused mission is gaining momentum evidenced by Univision being on pace to
win the November Sweeps in Spanish language even without carriage on Dish. Our teams are rededicated to the
Company’s core mission of serving Hispanic America and with many structural and organizational changes now
in place, I am optimistic about our strategy going forward. We have the #1 Spanish-language network, the #1
Spanish-language sports network and many of our local TV and radio stations are #1 in local news and
entertainment, English or Spanish. We have a great base to build from.”
1 During the third quarter of 2018, as part of an overall strategic review, the Company initiated a process to sell its English-language digital assets. In accordance with
the applicable accounting guidance for the disposal of long-lived assets and discontinued operations, the results of the English-language digital assets have been excluded
from both continuing operations and operating segments results for all periods presented. 2 Total core revenue excludes political/advocacy advertising and content licensing revenue in both periods, an estimated revenue adjustment in 2018 from a contractual obligation which is not expected to impact revenues in 2019 and the estimated incremental impact of major soccer in 2017. These items have been excluded to allow for
compatibility between both periods. 3 See page 4 for a description of certain significant items affecting the comparability of Income from continuing operations for the third quarter ended September 30, 2018 and 2017. 4 See pages 11-16 for a description of the non-GAAP term Adjusted OIBDA, a reconciliation to Income from continuing operations and limitations on its use. 5 Adjusted Core OIBDA excludes political /advocacy advertising and content licensing revenue in both periods, an estimated revenue adjustment in 2018 from a contractual obligation which is not expected to impact revenues in 2019 and the estimated incremental impact of major soccer in 2017 to allow for comparability between both
periods. To further allow for comparability between both periods, Adjusted Core OIBDA for the 2017 periods are further adjusted to reflect the 2018 contractual base
rates in the program license agreement with Grupo Televisa S.A.B. and its affiliates (“Televisa”) (the “PLA”) on the basis they were in effect in 2017 for the same relevant periods as in 2018. Under its PLA, Univision Communications Inc. pays a percentage of substantially all of its Spanish-language media networks revenue to Televisa.
Beginning January 1, 2018, the royalty base rate increased to 16.13%, and on June 1, 2018, the rate further increased to 16.45%.
PRESS RELEASE
UNIVISION COMMUNICATIONS INC. Page 2 of 17
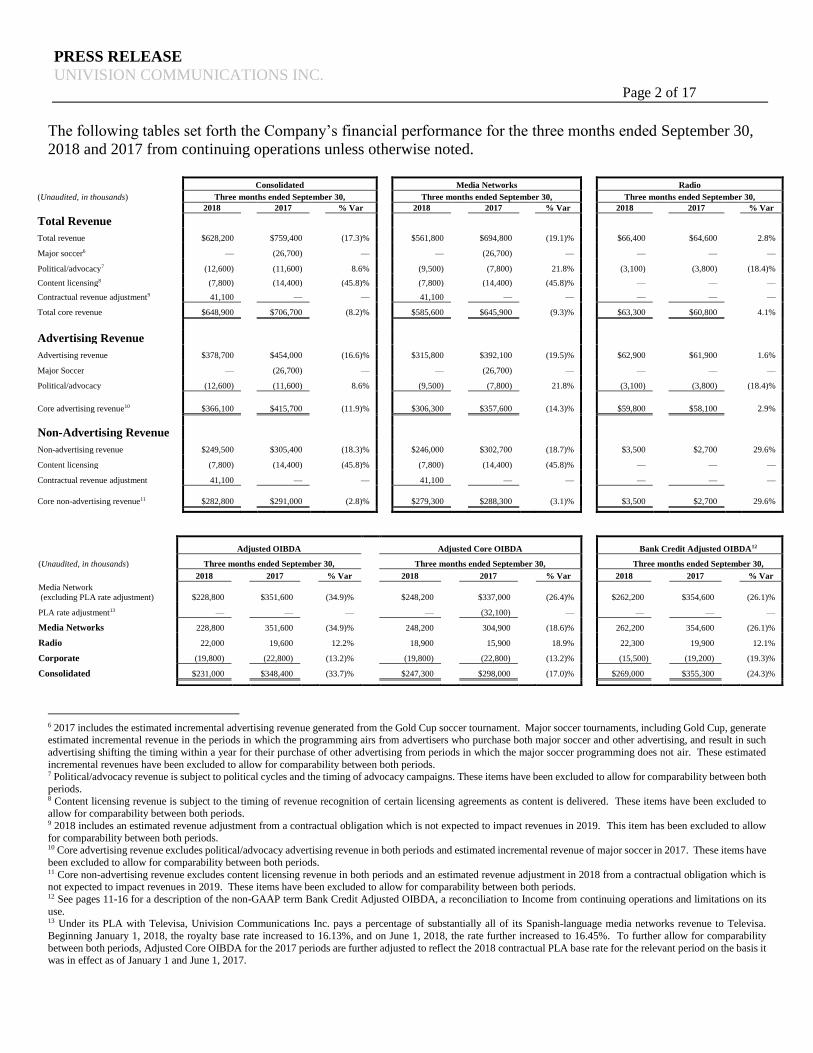
The following tables set forth the Company’s financial performance for the three months ended September 30,
2018 and 2017 from continuing operations unless otherwise noted.
6 2017 includes the estimated incremental advertising revenue generated from the Gold Cup soccer tournament. Major soccer tournaments, including Gold Cup, generate estimated incremental revenue in the periods in which the programming airs from advertisers who purchase both major soccer and other advertising, and result in such
advertising shifting the timing within a year for their purchase of other advertising from periods in which the major soccer programming does not air. These estimated
incremental revenues have been excluded to allow for comparability between both periods. 7 Political/advocacy revenue is subject to political cycles and the timing of advocacy campaigns. These items have been excluded to allow for comparability between both
periods. 8 Content licensing revenue is subject to the timing of revenue recognition of certain licensing agreements as content is delivered. These items have been excluded to
allow for comparability between both periods. 9 2018 includes an estimated revenue adjustment from a contractual obligation which is not expected to impact revenues in 2019. This item has been excluded to allow
for comparability between both periods. 10 Core advertising revenue excludes political/advocacy advertising revenue in both periods and estimated incremental revenue of major soccer in 2017. These items have
been excluded to allow for comparability between both periods. 11 Core non-advertising revenue excludes content licensing revenue in both periods and an estimated revenue adjustment in 2018 from a contractual obligation which is not expected to impact revenues in 2019. These items have been excluded to allow for comparability between both periods. 12 See pages 11-16 for a description of the non-GAAP term Bank Credit Adjusted OIBDA, a reconciliation to Income from continuing operations and limitations on its
use. 13 Under its PLA with Televisa, Univision Communications Inc. pays a percentage of substantially all of its Spanish-language media networks revenue to Televisa.
Beginning January 1, 2018, the royalty base rate increased to 16.13%, and on June 1, 2018, the rate further increased to 16.45%. To further allow for comparability
between both periods, Adjusted Core OIBDA for the 2017 periods are further adjusted to reflect the 2018 contractual PLA base rate for the relevant period on the basis it was in effect as of January 1 and June 1, 2017.
Consolidated Media Networks Radio
(Unaudited, in thousands) Three months ended September 30, Three months ended September 30, Three months ended September 30,
2018 2017 % Var 2018 2017 % Var 2018 2017 % Var
Total Revenue
Total revenue $628,200 $759,400 (17.3)% $561,800 $694,800 (19.1)% $66,400 $64,600 2.8%
Major soccer6 — (26,700) — — (26,700) — — — —
Political/advocacy7 (12,600) (11,600) 8.6% (9,500) (7,800) 21.8% (3,100) (3,800) (18.4)%
Content licensing8 (7,800) (14,400) (45.8)% (7,800) (14,400) (45.8)% — — —
Contractual revenue adjustment9 41,100 — — 41,100 — — — — —
Total core revenue $648,900 $706,700 (8.2)% $585,600 $645,900 (9.3)% $63,300 $60,800 4.1%
Advertising Revenue
Advertising revenue $378,700 $454,000 (16.6)% $315,800 $392,100 (19.5)% $62,900 $61,900 1.6%
Major Soccer — (26,700) — — (26,700) — — — —
Political/advocacy (12,600) (11,600) 8.6% (9,500) (7,800) 21.8% (3,100) (3,800) (18.4)%
Core advertising revenue10 $366,100 $415,700 (11.9)% $306,300 $357,600 (14.3)% $59,800 $58,100 2.9%
Non-Advertising Revenue
Non-advertising revenue $249,500 $305,400 (18.3)% $246,000 $302,700 (18.7)% $3,500 $2,700 29.6%
Content licensing (7,800) (14,400) (45.8)% (7,800) (14,400) (45.8)% — — —
Contractual revenue adjustment 41,100 — — 41,100 — — — — —
Core non-advertising revenue11 $282,800 $291,000 (2.8)% $279,300 $288,300 (3.1)% $3,500 $2,700 29.6%
Adjusted OIBDA Adjusted Core OIBDA Bank Credit Adjusted OIBDA12
(Unaudited, in thousands) Three months ended September 30, Three months ended September 30, Three months ended September 30,
2018 2017 % Var 2018 2017 % Var 2018 2017 % Var
Media Network
(excluding PLA rate adjustment) $228,800 $351,600 (34.9)% $248,200 $337,000 (26.4)% $262,200 $354,600 (26.1)%
PLA rate adjustment13 — — — — (32,100) — — — —
Media Networks 228,800 351,600 (34.9)% 248,200 304,900 (18.6)% 262,200 354,600 (26.1)%
Radio 22,000 19,600 12.2% 18,900 15,900 18.9% 22,300 19,900 12.1%
Corporate (19,800) (22,800) (13.2)% (19,800) (22,800) (13.2)% (15,500) (19,200) (19.3)%
Consolidated $231,000 $348,400 (33.7)% $247,300 $298,000 (17.0)% $269,000 $355,300 (24.3)%
PRESS RELEASE
UNIVISION COMMUNICATIONS INC. Page 3 of 17
Consolidated
Revenue
Total revenue for the third quarter 2018 decreased 17.3% to $628.2 million compared to $759.4 million for the
same prior period. Total core revenue for the third quarter 2018 decreased 8.20% to $648.9 million compared to
$706.7 million. Below is a discussion of the Company’s third quarter revenue by reporting segment.
Media Networks
Total revenue for our Media Networks segment for the third quarter 2018 decreased 19.1% to $561.8 million
compared to $694.8 million for the same prior period. Total core revenue for our Media Networks segment for
the third quarter 2018 decreased 9.3% to $585.6 million compared to $645.9 million.
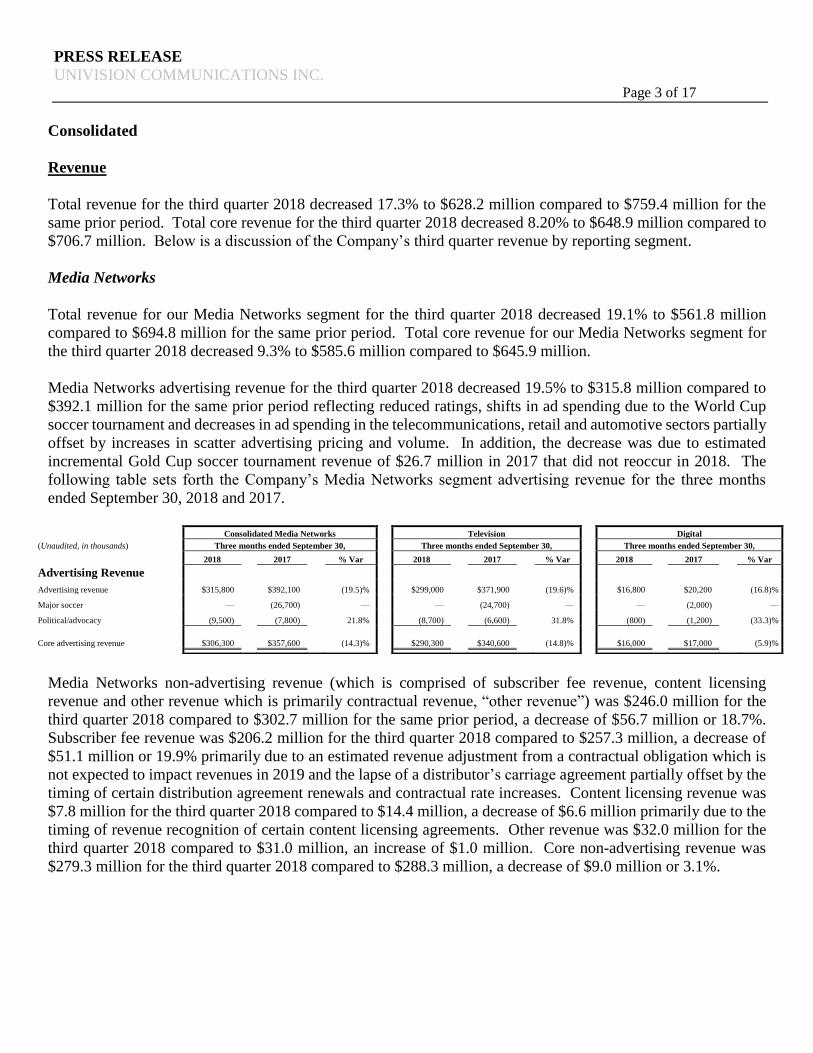
Media Networks advertising revenue for the third quarter 2018 decreased 19.5% to $315.8 million compared to
$392.1 million for the same prior period reflecting reduced ratings, shifts in ad spending due to the World Cup
soccer tournament and decreases in ad spending in the telecommunications, retail and automotive sectors partially
offset by increases in scatter advertising pricing and volume. In addition, the decrease was due to estimated
incremental Gold Cup soccer tournament revenue of $26.7 million in 2017 that did not reoccur in 2018. The
following table sets forth the Company’s Media Networks segment advertising revenue for the three months
ended September 30, 2018 and 2017.
Media Networks non-advertising revenue (which is comprised of subscriber fee revenue, content licensing
revenue and other revenue which is primarily contractual revenue, “other revenue”) was $246.0 million for the
third quarter 2018 compared to $302.7 million for the same prior period, a decrease of $56.7 million or 18.7%.
Subscriber fee revenue was $206.2 million for the third quarter 2018 compared to $257.3 million, a decrease of
$51.1 million or 19.9% primarily due to an estimated revenue adjustment from a contractual obligation which is
not expected to impact revenues in 2019 and the lapse of a distributor’s carriage agreement partially offset by the
timing of certain distribution agreement renewals and contractual rate increases. Content licensing revenue was
$7.8 million for the third quarter 2018 compared to $14.4 million, a decrease of $6.6 million primarily due to the
timing of revenue recognition of certain content licensing agreements. Other revenue was $32.0 million for the
third quarter 2018 compared to $31.0 million, an increase of $1.0 million. Core non-advertising revenue was
$279.3 million for the third quarter 2018 compared to $288.3 million, a decrease of $9.0 million or 3.1%.
Consolidated Media Networks Television Digital
(Unaudited, in thousands) Three months ended September 30, Three months ended September 30, Three months ended September 30,
2018 2017 % Var 2018 2017 % Var 2018 2017 % Var
Advertising Revenue
Advertising revenue $315,800 $392,100 (19.5)% $299,000 $371,900 (19.6)% $16,800 $20,200 (16.8)%
Major soccer — (26,700) — — (24,700) — — (2,000) —
Political/advocacy (9,500) (7,800) 21.8% (8,700) (6,600) 31.8% (800) (1,200) (33.3)%
Core advertising revenue $306,300 $357,600 (14.3)% $290,300 $340,600 (14.8)% $16,000 $17,000 (5.9)%
PRESS RELEASE
UNIVISION COMMUNICATIONS INC. Page 4 of 17
Radio
Total revenue for our Radio segment for the third quarter 2018 increased 2.8% to $66.4 million compared to $64.6
million for the same prior period primarily due to an increase in advertising revenue. Total core revenue for our
Radio segment increased 4.1% to $63.3 million from $60.8 million.
Advertising revenue for the Radio segment for the third quarter 2018 increased 1.6% to $62.9 million from $61.9
million for the same prior period. Core advertising revenue for our Radio segment increased 2.9% to $59.8 million
from $58.1 million.
Non-advertising revenue for the Radio segment for the third quarter 2018 (primarily contractual revenue)
increased to $3.5 million from $2.7 million for the same prior period.
Expenses
Below is a discussion of the Company’s third quarter expenses on a consolidated basis.
Direct operating expenses for the third quarter 2018 decreased $6.7 million or 2.7% to $244.4 million from $251.1
million for the same prior period principally as a result of decreases primarily in programming expenses offset by
the contractual increases in the PLA rate. Programming expenses, for the third quarter 2018 decreased $10.8
million or 7.1% to $142.2 million from $153.0 million primarily due to the 2017 costs of the Gold Cup soccer
tournament of $27.4 million partially offset by an increase in 2018 other sports programming of $13.8 million
and a net increase in entertainment and news programming of $2.8 million. Variable program license fees for
the third quarter 2018 increased $5.9 million or 7.7% to $82.6 million from $76.7 million due to contractual
increases in the program license fee rate. Assuming that the 2018 contractual PLA base rate was in effect for the
third quarter of 2017 on the same basis as 2018, variable program license fees would have decreased $26.2 million
or 24.1% from the prior year attributable to reduced revenue. Other direct operating expenses for the third quarter
2018 decreased $1.8 million or 8.4% to $19.6 million from $21.4 million, primarily due to a decrease in technical
costs.
Selling, general and administrative expenses for the third quarter 2018 decreased $11.8 million or 7.0% to $157.2
million from $169.0 million for the same prior period. The decrease was primarily due to lower business and
professional services as well as adjustments to share-based compensation.
Income from Continuing Operations
Income from continuing operations for the third quarter 2018 was $12.4 million compared to $109.6 million for
the same prior period. The effective tax rate decreased 12 percentage points to 24% in the third quarter of 2018
(primarily due to the Tax Cuts and Jobs Act) compared to 36%. Income from continuing operations for the third
quarter 2018 included a pretax restructuring/severance charge of $54.9 million and a non-cash pretax impairment
loss of $19.7 million primarily related to the write down of programming. Income from continuing operations for
the third quarter 2017 included a pretax restructuring/severance charge of $7.4 million, other expense of $5.6
million primarily comprised of equity method loss from the Company’s El Rey investment and a non-cash pretax
impairment loss of $2.9 million primarily related to the write down of programming.
PRESS RELEASE
UNIVISION COMMUNICATIONS INC. Page 5 of 17
Selected Cash Flow/Balance Sheet Information
For the nine months ended September 30, 2018, cash flows provided by operating activities from continuing
operations were $438.9 million compared to $388.1 million for the same prior period. For the nine months ended
September 30, 2018, investing activities included capital expenditures of $44.5 million compared to $53.3 million.
As of September 30, 2018, total indebtedness, net of cash and cash equivalents was $7.6 billion, a $336.5 million
decrease from December 31, 2017.
English Language Digital Businesses
During the third quarter of 2018, as part of an overall strategic review, the Company initiated a process to sell its
English-language digital businesses including the Gizmodo Media Group, The Onion and Fusion Digital
collectively the English-language digital assets or businesses. The Gizmodo Media Group is comprised
principally of Gizmodo, Deadspin, Lifehacker, Jezebel, Splinter, The Root, Kotaku, Earther and Jalopnik. In
accordance with the applicable accounting guidance for the disposal of long-lived assets and discontinued
operations, the results of the English-language digital businesses have been excluded from both continuing
operations and operating segments results for all periods presented. Loss from discontinued operations, net of
income taxes for the third quarter 2018 was $96.1 million compared to $8.7 million for the same prior period.
CONFERENCE CALL
Univision will conduct a conference call to discuss its third quarter financial results at 11:00 a.m. ET /
8:00 a.m. PT on Wednesday, November 14, 2018. To participate in the conference call, please dial (877) 317-
3841 (within U.S.) or (409) 202-2999 (outside U.S.) fifteen minutes prior to the start of the call and provide the
following pass code: 9049009. A playback of the conference call will be available beginning at 2:00 p.m. ET,
Wednesday, November 14, 2018, through Wednesday, November 28, 2018. To access the playback, please dial
(855) 859-2056 (within U.S.) or (404) 537-3406 (outside U.S.) and enter reservation number 9049009.
PRESS RELEASE
UNIVISION COMMUNICATIONS INC. Page 6 of 17
About Univision Communications Inc.
Univision is the leading media company serving Hispanic America. The Company includes Univision Network,
one of the top networks in the U.S. regardless of language and the most-watched Spanish-language broadcast
television network in the country, available in approximately 83% of U.S. Hispanic television households;
UniMás, among the leading Spanish-language broadcast television networks; Univision Local Media, which owns
and/or operates 63 television stations and 58 radio stations in major U.S. Hispanic markets and Puerto Rico;
Univision Cable Networks, including Univision Deportes Network (UDN), the most-watched Spanish-language
sports cable network among U.S. Hispanics in the U.S.; Galavisión, the most-watched U.S. Spanish-language
entertainment cable network among U.S. Hispanics; Univision tlnovelas, a 24-hour Spanish-language cable
network dedicated to telenovelas; ForoTV, a 24-hour Spanish-language cable network dedicated to international
news; and an additional suite of cable offerings – De Película, De Película Clásico, Bandamax, Ritmoson and
Telehit; FUSION TV, an English-language news and lifestyle cable network; an investment in El Rey Network,
a general entertainment English-language cable network; Univision Now, the Company’s direct-to-consumer, on-
demand and live streaming subscription service; Univision.com, the Company’s flagship digital property and is
the #1 most visited Spanish-language website among U.S. Hispanics; and Uforia, a music application featuring
multimedia music content. For more information, please visit corporate.univision.com.
Investor Contact: Media Contact:
Adam Shippee 646-560-4992 Bobby Amirshahi 646-560-4902
PRESS RELEASE
UNIVISION COMMUNICATIONS INC. Page 7 of 17
Safe Harbor
Certain statements contained within this press release constitute “forward-looking statements” within the meaning of
the Private Securities Litigation Reform Act of 1995. In some cases you can identify forward-looking statements by
terms such as “anticipate,” “plan,” “may,” “intend,” “will,” “expect,” “believe,” “optimistic” or the negative of these
terms, and similar expressions intended to identify forward-looking statements.
These forward-looking statements reflect the Company’s current views with respect to future events and are based on
assumptions and are subject to risks and uncertainties. Also, these forward-looking statements present our estimates
and assumptions only as of the date of this press release. The Company undertakes no obligation to modify or revise
any forward-looking statements to reflect events or circumstances occurring after the date that the forward looking
statement was made.
Factors that could cause actual results to differ materially from those expressed or implied by the forward-looking
statements include: cancellations, reductions or postponements of advertising or other changes in advertising practices
among the Company’s advertisers; any impact of adverse economic conditions on the Company’s industry, business
and financial condition, including reduced advertising revenue; changes in the size of the U.S. Hispanic population,
including the impact of federal and state immigration legislation and policies on both the U.S. Hispanic population
and persons emigrating from Latin America; lack of audience acceptance of the Company’s content; varying
popularity for programming, which the Company cannot predict at the time the Company may incur related costs; the
failure to renew existing carriage agreements or reach new carriage agreements with multichannel video programming
distributors (“MVPD”) on acceptable terms or otherwise and the impact of such failure on pricing terms of, and
contractual obligations under, carriage agreements with other MVPDs; consolidation in the cable or satellite MVPD
industry; the impact of increased competition from new technologies; changes in the Company’s strategy going
forward; competitive pressures from other broadcasters and other entertainment and news media; damage to the
Company’s brands, particularly the Univision brand, or reputation; fluctuations in the Company’s quarterly results,
making it difficult to rely on period-to-period comparisons; failure to retain the rights to sports programming to attract
advertising revenue; the loss of the Company’s ability to rely on Televisa for a significant amount of its network
programming; an increase in royalty payments pursuant to the program license agreement between the Company and
Televisa; the failure of the Company’s new or existing businesses to produce projected revenues or cash flows; failure
to monetize the Company’s content on its digital platforms; the Company’s success in acquiring, investing in and
integrating complementary businesses; the potential sale of the Company’s English-language digital businesses; failure
to further monetize the Company’s spectrum assets; the failure or destruction of satellites or transmitter facilities that
the Company depends on to distribute its programming; disruption of the Company’s business due to network and
information systems-related events, such as computer hackings, viruses, or other destructive or disruptive software or
activities; inability to realize the full value of the Company’s intangible assets; failure to utilize the Company’s net
operating loss carryforwards; the impact from the Tax Cuts and Jobs Act; the loss of key executives; possible strikes
or other union job actions; piracy of the Company’s programming and other content; environmental, health and safety
laws and regulations; Federal Communications Commission (“FCC”) media ownership rules; compliance with, and/or
changes in, the rules and regulations of the FCC; new laws or regulations concerning retransmission consent or “must
carry” rights; increased enforcement or enhancement of FCC indecency and other programming content rules; the
impact of legislation on the reallocation of broadcast spectrum which may result in additional costs and affect the
Company’s ability to provide competitive services; net losses in the future and for an extended period of time; the
Company’s substantial indebtedness; failure to service the Company’s debt or inability to comply with the agreements
contained in the Company’s senior secured credit facilities and indentures, including any financial covenants and
ratios; the Company’s dependency on lenders to execute its business strategy and its inability to secure financing on
suitable terms or at all; volatility and weakness in the capital markets; and risks relating to the Company’s ownership.
Actual results may differ materially due to these risks and uncertainties. The Company assumes no obligation to update
forward-looking information contained in this press release.
PRESS RELEASE
UNIVISION COMMUNICATIONS INC. Page 8 of 17
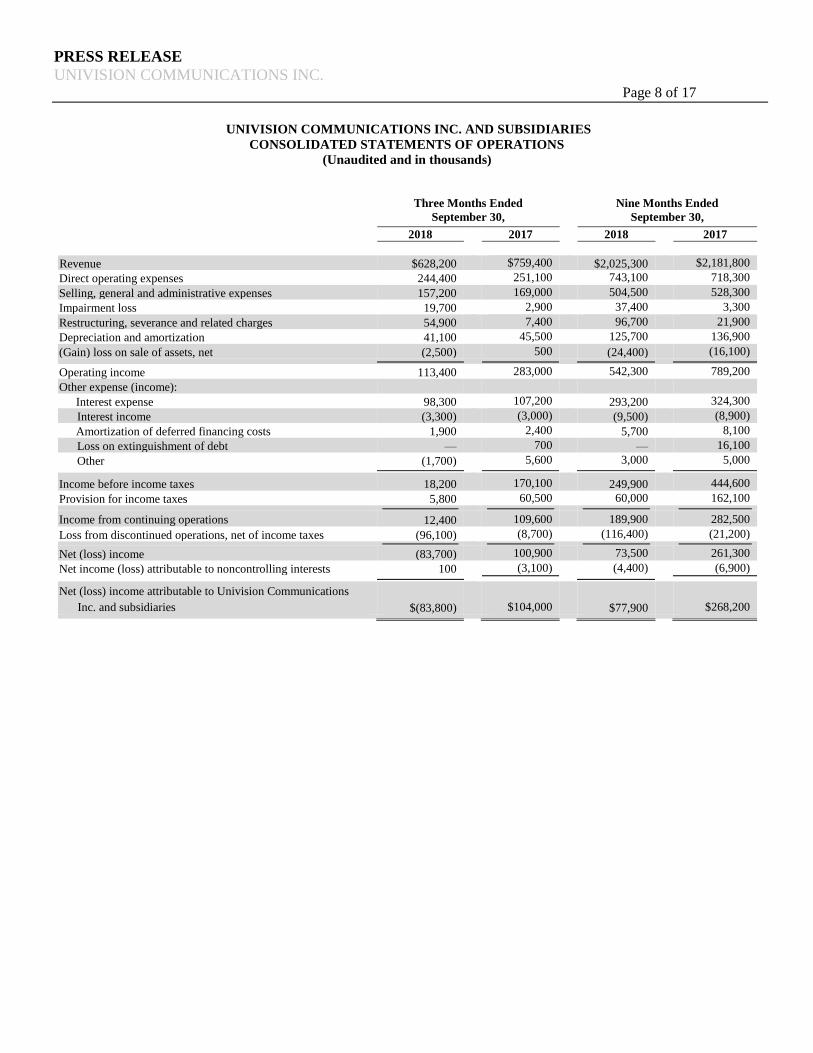
UNIVISION COMMUNICATIONS INC. AND SUBSIDIARIES
CONSOLIDATED STATEMENTS OF OPERATIONS
(Unaudited and in thousands)
Three Months Ended
September 30,
Nine Months Ended
September 30,
2018 2017 2018 2017
Revenue $628,200 $759,400 $2,025,300 $2,181,800
Direct operating expenses 244,400 251,100 743,100 718,300
Selling, general and administrative expenses 157,200 169,000 504,500 528,300
Impairment loss 19,700 2,900 37,400 3,300
Restructuring, severance and related charges 54,900 7,400 96,700 21,900
Depreciation and amortization 41,100 45,500 125,700 136,900
(Gain) loss on sale of assets, net (2,500) 500 (24,400) (16,100) Operating income 113,400 283,000 542,300 789,200
Other expense (income):
Interest expense 98,300 107,200 293,200 324,300
Interest income (3,300) (3,000) (9,500) (8,900)
Amortization of deferred financing costs 1,900 2,400 5,700 8,100
Loss on extinguishment of debt — 700 — 16,100
Other (1,700) 5,600 3,000 5,000
Income before income taxes 18,200 170,100 249,900 444,600
Provision for income taxes 5,800 60,500 60,000 162,100
Income from continuing operations 12,400 109,600 189,900 282,500
Loss from discontinued operations, net of income taxes (96,100) (8,700) (116,400) (21,200)
Net (loss) income (83,700) 100,900 73,500 261,300
Net income (loss) attributable to noncontrolling interests 100 (3,100) (4,400) (6,900)
Net (loss) income attributable to Univision Communications
Inc. and subsidiaries $(83,800)
$104,000
$77,900
$268,200
PRESS RELEASE
UNIVISION COMMUNICATIONS INC. Page 9 of 17
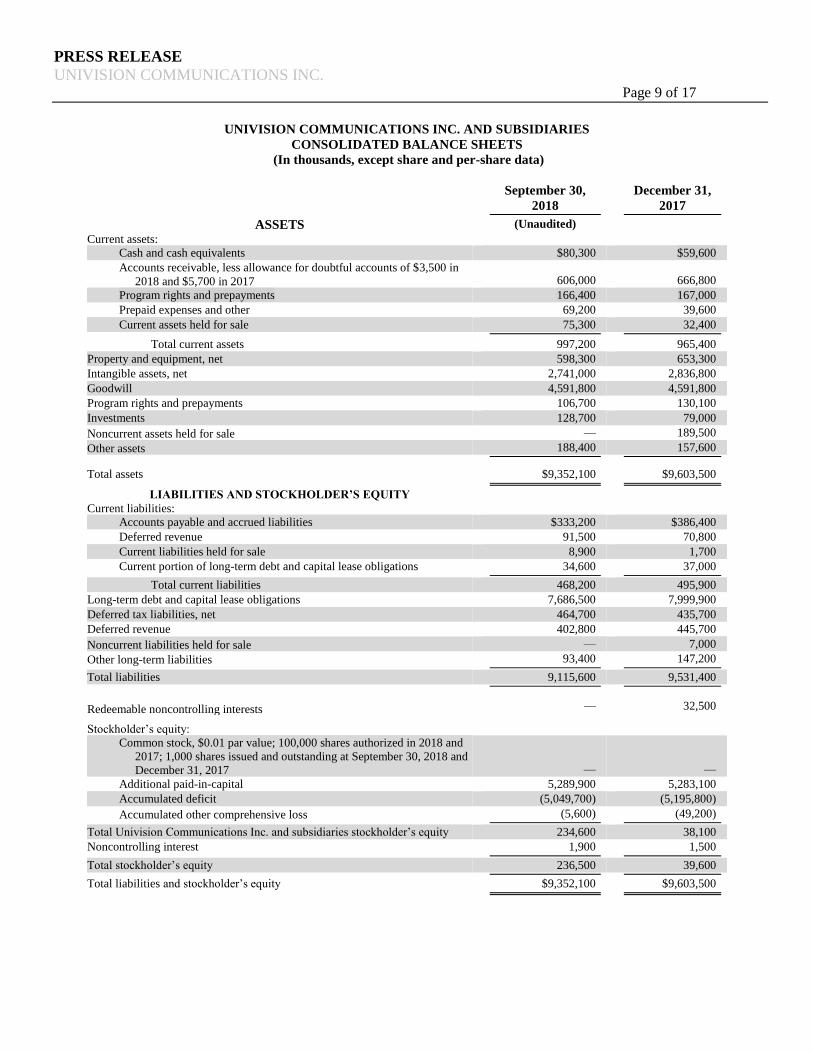
UNIVISION COMMUNICATIONS INC. AND SUBSIDIARIES
CONSOLIDATED BALANCE SHEETS
(In thousands, except share and per-share data)
September 30,
2018
December 31,
2017
ASSETS (Unaudited)
Current assets: Cash and cash equivalents $80,300 $59,600
Accounts receivable, less allowance for doubtful accounts of $3,500 in
2018 and $5,700 in 2017 606,000 666,800
Program rights and prepayments 166,400 167,000
Prepaid expenses and other 69,200 39,600
Current assets held for sale 75,300 32,400
Total current assets 997,200 965,400
Property and equipment, net 598,300 653,300
Intangible assets, net 2,741,000 2,836,800
Goodwill 4,591,800 4,591,800
Program rights and prepayments 106,700 130,100
Investments 128,700 79,000
Noncurrent assets held for sale — 189,500
Other assets 188,400 157,600
Total assets $9,352,100 $9,603,500
LIABILITIES AND STOCKHOLDER’S EQUITY
Current liabilities: Accounts payable and accrued liabilities $333,200 $386,400
Deferred revenue 91,500 70,800
Current liabilities held for sale 8,900 1,700
Current portion of long-term debt and capital lease obligations 34,600 37,000
Total current liabilities 468,200 495,900
Long-term debt and capital lease obligations 7,686,500 7,999,900
Deferred tax liabilities, net 464,700 435,700
Deferred revenue 402,800 445,700
Noncurrent liabilities held for sale — 7,000
Other long-term liabilities 93,400 147,200
Total liabilities 9,115,600 9,531,400
Redeemable noncontrolling interests
—
32,500
Stockholder’s equity:
Common stock, $0.01 par value; 100,000 shares authorized in 2018 and
2017; 1,000 shares issued and outstanding at September 30, 2018 and
December 31, 2017 — —
Additional paid-in-capital 5,289,900 5,283,100
Accumulated deficit (5,049,700) (5,195,800)
Accumulated other comprehensive loss (5,600) (49,200)
Total Univision Communications Inc. and subsidiaries stockholder’s equity 234,600 38,100
Noncontrolling interest 1,900 1,500 Total stockholder’s equity 236,500 39,600 Total liabilities and stockholder’s equity $9,352,100 $9,603,500
PRESS RELEASE
UNIVISION COMMUNICATIONS INC. Page 10 of 17
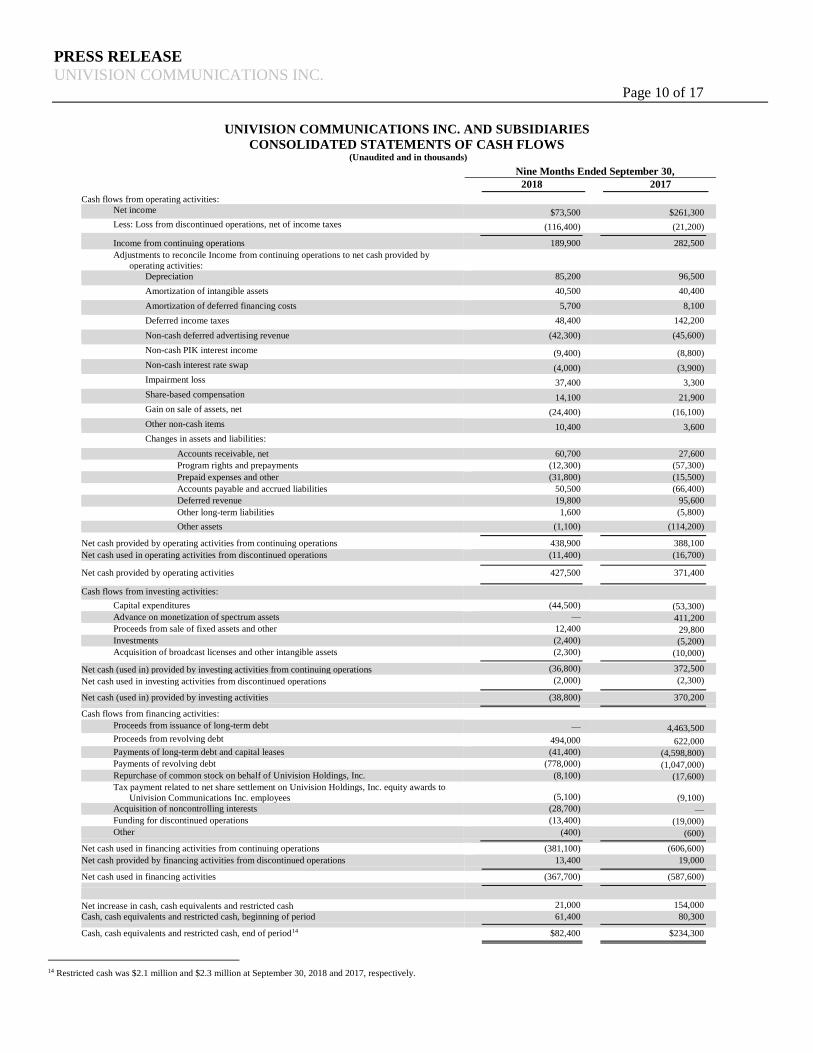
UNIVISION COMMUNICATIONS INC. AND SUBSIDIARIES
CONSOLIDATED STATEMENTS OF CASH FLOWS (Unaudited and in thousands)
14 Restricted cash was $2.1 million and $2.3 million at September 30, 2018 and 2017, respectively.
Nine Months Ended September 30,
2018
2017
Cash flows from operating activities: Net income $73,500 $261,300
Less: Loss from discontinued operations, net of income taxes (116,400) (21,200)
Income from continuing operations 189,900 282,500
Adjustments to reconcile Income from continuing operations to net cash provided by
operating activities: Depreciation 85,200 96,500
Amortization of intangible assets 40,500 40,400
Amortization of deferred financing costs 5,700 8,100
Deferred income taxes 48,400 142,200
Non-cash deferred advertising revenue (42,300) (45,600)
Non-cash PIK interest income (9,400) (8,800)
Non-cash interest rate swap (4,000) (3,900)
Impairment loss 37,400 3,300
Share-based compensation 14,100 21,900
Gain on sale of assets, net (24,400) (16,100)
Other non-cash items 10,400 3,600
Changes in assets and liabilities:
Accounts receivable, net 60,700 27,600
Program rights and prepayments (12,300) (57,300)
Prepaid expenses and other (31,800) (15,500)
Accounts payable and accrued liabilities 50,500 (66,400)
Deferred revenue 19,800 95,600
Other long-term liabilities 1,600 (5,800)
Other assets (1,100) (114,200) Net cash provided by operating activities from continuing operations 438,900 388,100
Net cash used in operating activities from discontinued operations (11,400) (16,700) Net cash provided by operating activities 427,500 371,400
Cash flows from investing activities:
Capital expenditures (44,500) (53,300)
Advance on monetization of spectrum assets — 411,200
Proceeds from sale of fixed assets and other 12,400 29,800
Investments (2,400) (5,200)
Acquisition of broadcast licenses and other intangible assets (2,300) (10,000) Net cash (used in) provided by investing activities from continuing operations (36,800) 372,500
Net cash used in investing activities from discontinued operations (2,000) (2,300)
Net cash (used in) provided by investing activities (38,800) 370,200 Cash flows from financing activities:
Proceeds from issuance of long-term debt — 4,463,500
Proceeds from revolving debt 494,000 622,000
Payments of long-term debt and capital leases (41,400) (4,598,800)
Payments of revolving debt (778,000) (1,047,000)
Repurchase of common stock on behalf of Univision Holdings, Inc. (8,100) (17,600)
Tax payment related to net share settlement on Univision Holdings, Inc. equity awards to
Univision Communications Inc. employees (5,100) (9,100)
Acquisition of noncontrolling interests (28,700) —
Funding for discontinued operations (13,400) (19,000)
Other (400) (600) Net cash used in financing activities from continuing operations (381,100) (606,600)
Net cash provided by financing activities from discontinued operations 13,400 19,000 Net cash used in financing activities (367,700) (587,600)
Net increase in cash, cash equivalents and restricted cash 21,000 154,000
Cash, cash equivalents and restricted cash, beginning of period 61,400 80,300 Cash, cash equivalents and restricted cash, end of period14 $82,400 $234,300
PRESS RELEASE
UNIVISION COMMUNICATIONS INC. Page 11 of 17
RECONCILIATION OF INCOME FROM CONTINUING OPERATIONS
Management of the Company evaluates operating performance for planning and forecasting future business
operations by considering Adjusted OIBDA (as described below), Adjusted Core OIBDA (as described below)
and Bank Credit Adjusted OIBDA (as described below). Management also uses Bank Credit Adjusted OIBDA
to assess the Company’s ability to satisfy certain financial covenants contained in the Company’s senior secured
credit facilities and the indentures governing its senior notes. Adjusted OIBDA, Adjusted Core OIBDA and Bank
Credit Adjusted OIBDA eliminate the effects of certain items that the Company does not consider indicative of
its core operating performance. Adjusted OIBDA and Adjusted Core OIBDA represent operating income before
depreciation, amortization and certain additional adjustments to operating income. Adjusted Core OIBDA also
excludes the impact of certain items that have been excluded to allow for comparability between the periods
because such items do not occur in every period. In calculating Adjusted OIBDA and Adjusted Core OIBDA the
Company’s operating income (loss) is adjusted for share-based compensation and other non-cash charges,
restructuring and severance charges, as well as other non-operating related items. Bank Credit Adjusted OIBDA
represents Adjusted OIBDA with certain additional adjustments permitted under the Company’s senior secured
credit facilities and its indentures governing the senior notes that include add-backs and/or deductions, as
applicable, for specified business optimization expenses; unusual, infrequent items; income (loss) from equity
investments in entities, the results of which are consolidated in the Company’s operating income (loss), that are
not treated as subsidiaries, and from subsidiaries designated as unrestricted subsidiaries, in each case under such
credit facilities and indentures, and certain other expenses. Bank Credit Adjusted OIBDA is further adjusted for
such purposes to give effect to the redesignation of unrestricted subsidiaries as restricted subsidiaries for the 12-
month period then ended upon such redesignation. Adjusted OIBDA, Adjusted Core OIBDA and Bank Credit
Adjusted OIBDA are not, and should not be used as, indicators of or alternatives to operating income or income
from continuing operations as reflected in the consolidated financial statements. They are not measures of
financial performance under GAAP and they should not be considered in isolation or as a substitute for measures
of performance prepared in accordance with GAAP. Since the definition of Adjusted OIBDA, Adjusted Core
OIBDA and Bank Credit Adjusted OIBDA may vary among companies and industries, neither should be used as
a measure of performance among companies. The Company is providing a reconciliation of the non-GAAP terms
Adjusted OIBDA, Adjusted Core OIBDA and Bank Credit Adjusted OIBDA to income from continuing
operations, which is the most directly comparable GAAP financial measure.
PRESS RELEASE
UNIVISION COMMUNICATIONS INC. Page 12 of 17
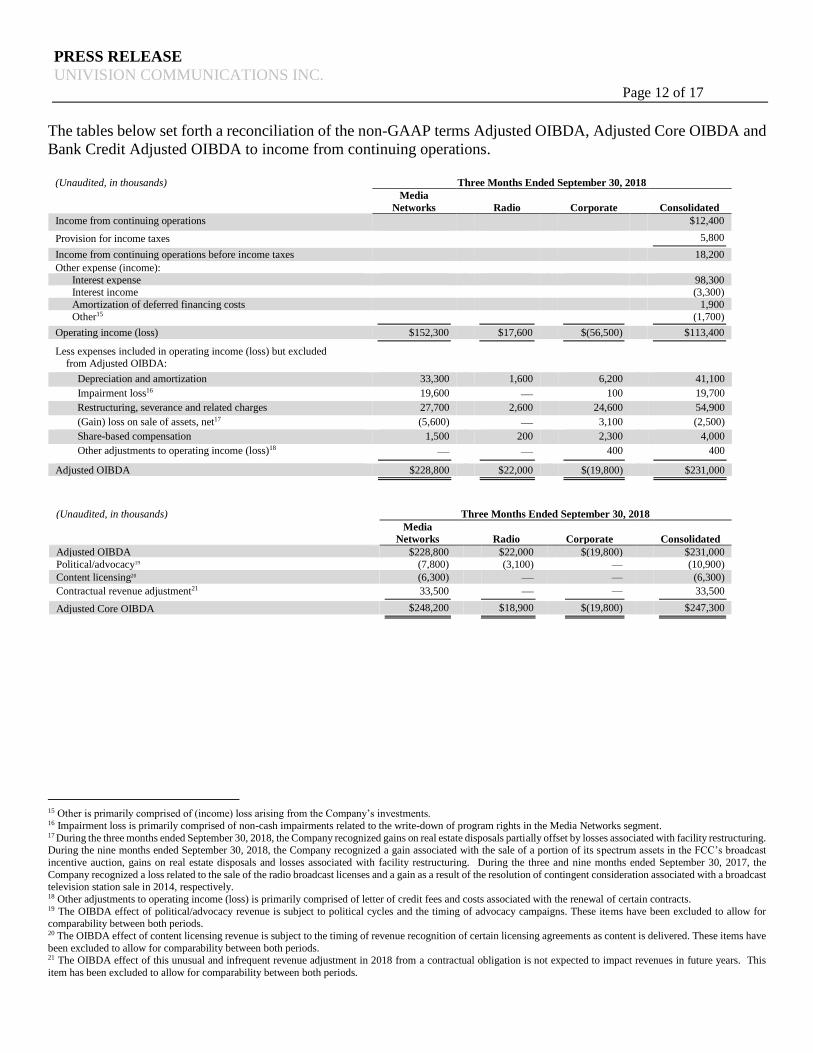
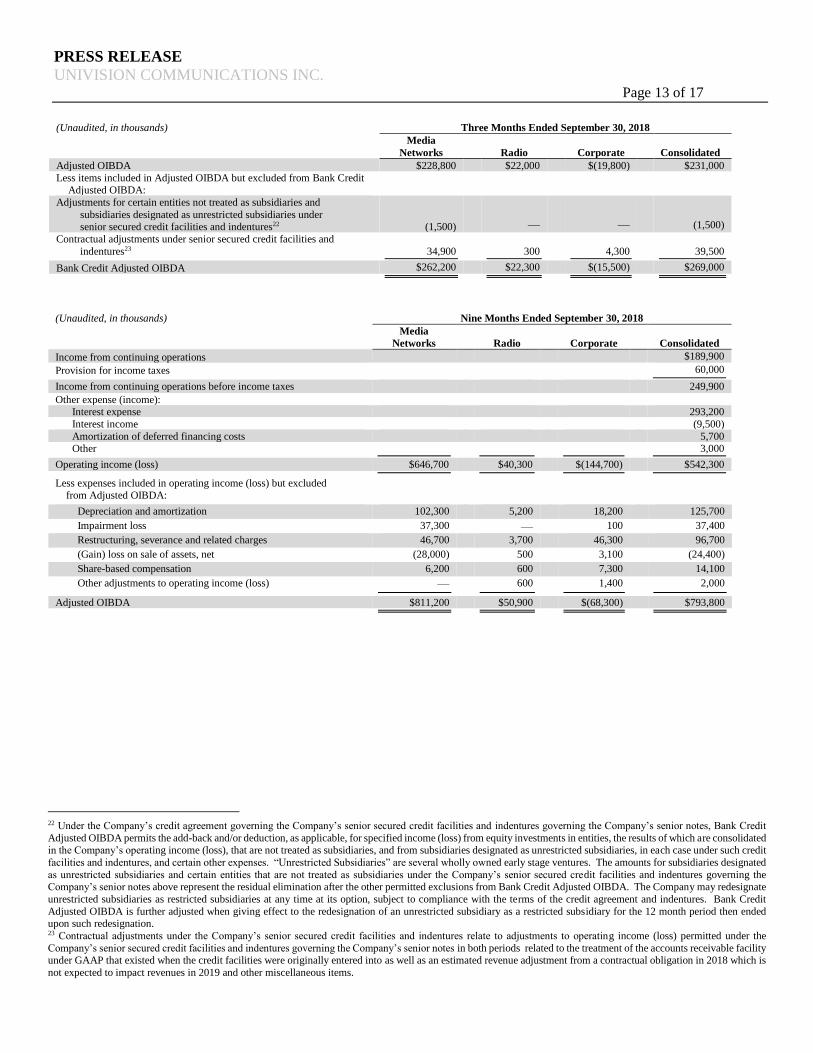
The tables below set forth a reconciliation of the non-GAAP terms Adjusted OIBDA, Adjusted Core OIBDA and
Bank Credit Adjusted OIBDA to income from continuing operations.
(Unaudited, in thousands) Three Months Ended September 30, 2018
Media
Networks
Radio Corporate Consolidated
Income from continuing operations $12,400
Provision for income taxes 5,800 Income from continuing operations before income taxes 18,200
Other expense (income):
Interest expense 98,300 Interest income
(3,300)
Amortization of deferred financing costs 1,900
Other15 (1,700) Operating income (loss) $152,300 $17,600 $(56,500) $113,400
Less expenses included in operating income (loss) but excluded from Adjusted OIBDA:
Depreciation and amortization 33,300 1,600 6,200 41,100
Impairment loss16 19,600 — 100 19,700
Restructuring, severance and related charges 27,700 2,600 24,600 54,900
(Gain) loss on sale of assets, net17 (5,600) — 3,100
32,300
(2,500)
Share-based compensation 1,500 200 2,300 4,000
Other adjustments to operating income (loss)18 — — 400 400 Adjusted OIBDA $228,800 $22,000 $(19,800) $231,000
(Unaudited, in thousands) Three Months Ended September 30, 2018
Media
Networks Radio Corporate Consolidated
Adjusted OIBDA $228,800 $22,000 $(19,800) $231,000
Political/advocacy19 (7,800) (3,100) — (10,900)
Content licensing20 (6,300) — — (6,300)
Contractual revenue adjustment21 33,500 — — 33,500 Adjusted Core OIBDA $248,200 $18,900 $(19,800) $247,300
15 Other is primarily comprised of (income) loss arising from the Company’s investments. 16 Impairment loss is primarily comprised of non-cash impairments related to the write-down of program rights in the Media Networks segment. 17 During the three months ended September 30, 2018, the Company recognized gains on real estate disposals partially offset by losses associated with facility restructuring. During the nine months ended September 30, 2018, the Company recognized a gain associated with the sale of a portion of its spectrum assets in the FCC’s broadcast
incentive auction, gains on real estate disposals and losses associated with facility restructuring. During the three and nine months ended September 30, 2017, the
Company recognized a loss related to the sale of the radio broadcast licenses and a gain as a result of the resolution of contingent consideration associated with a broadcast television station sale in 2014, respectively. 18 Other adjustments to operating income (loss) is primarily comprised of letter of credit fees and costs associated with the renewal of certain contracts. 19 The OIBDA effect of political/advocacy revenue is subject to political cycles and the timing of advocacy campaigns. These items have been excluded to allow for comparability between both periods. 20 The OIBDA effect of content licensing revenue is subject to the timing of revenue recognition of certain licensing agreements as content is delivered. These items have
been excluded to allow for comparability between both periods. 21 The OIBDA effect of this unusual and infrequent revenue adjustment in 2018 from a contractual obligation is not expected to impact revenues in future years. This
item has been excluded to allow for comparability between both periods.
PRESS RELEASE
UNIVISION COMMUNICATIONS INC. Page 13 of 17
(Unaudited, in thousands) Three Months Ended September 30, 2018
Media
Networks Radio Corporate Consolidated
Adjusted OIBDA $228,800 $22,000 $(19,800) $231,000
Less items included in Adjusted OIBDA but excluded from Bank Credit Adjusted OIBDA:
Adjustments for certain entities not treated as subsidiaries and
subsidiaries designated as unrestricted subsidiaries under senior secured credit facilities and indentures22 (1,500) — — (1,500)
Contractual adjustments under senior secured credit facilities and
indentures23 34,900 300 4,300 39,500 Bank Credit Adjusted OIBDA $262,200 $22,300 $(15,500) $269,000
(Unaudited, in thousands) Nine Months Ended September 30, 2018
Media
Networks
Radio Corporate Consolidated
Income from continuing operations $189,900
Provision for income taxes 60,000 Income from continuing operations before income taxes 249,900
Other expense (income):
Interest expense 293,200
Interest income
(9,500)
Amortization of deferred financing costs 5,700 Other 3,000
Operating income (loss) $646,700 $40,300 $(144,700) $542,300 Less expenses included in operating income (loss) but excluded
from Adjusted OIBDA:
Depreciation and amortization 102,300 5,200 18,200 125,700
Impairment loss 37,300 — 100 37,400
Restructuring, severance and related charges 46,700 3,700 46,300 96,700
(Gain) loss on sale of assets, net (28,000) 500 3,100 (24,400)
Share-based compensation 6,200 600 7,300 14,100
Other adjustments to operating income (loss) — 600 1,400 2,000 Adjusted OIBDA $811,200 $50,900 $(68,300) $793,800
22 Under the Company’s credit agreement governing the Company’s senior secured credit facilities and indentures governing the Company’s senior notes, Bank Credit
Adjusted OIBDA permits the add-back and/or deduction, as applicable, for specified income (loss) from equity investments in entities, the results of which are consolidated in the Company’s operating income (loss), that are not treated as subsidiaries, and from subsidiaries designated as unrestricted subsidiaries, in each case under such credit
facilities and indentures, and certain other expenses. “Unrestricted Subsidiaries” are several wholly owned early stage ventures. The amounts for subsidiaries designated
as unrestricted subsidiaries and certain entities that are not treated as subsidiaries under the Company’s senior secured credit facilities and indentures governing the Company’s senior notes above represent the residual elimination after the other permitted exclusions from Bank Credit Adjusted OIBDA. The Company may redesignate
unrestricted subsidiaries as restricted subsidiaries at any time at its option, subject to compliance with the terms of the credit agreement and indentures. Bank Credit
Adjusted OIBDA is further adjusted when giving effect to the redesignation of an unrestricted subsidiary as a restricted subsidiary for the 12 month period then ended upon such redesignation. 23 Contractual adjustments under the Company’s senior secured credit facilities and indentures relate to adjustments to operating income (loss) permitted under the
Company’s senior secured credit facilities and indentures governing the Company’s senior notes in both periods related to the treatment of the accounts receivable facility under GAAP that existed when the credit facilities were originally entered into as well as an estimated revenue adjustment from a contractual obligation in 2018 which is
not expected to impact revenues in 2019 and other miscellaneous items.
PRESS RELEASE
UNIVISION COMMUNICATIONS INC. Page 14 of 17
(Unaudited, in thousands) Nine Months Ended September 30, 2018
Media
Networks Radio Corporate Consolidated
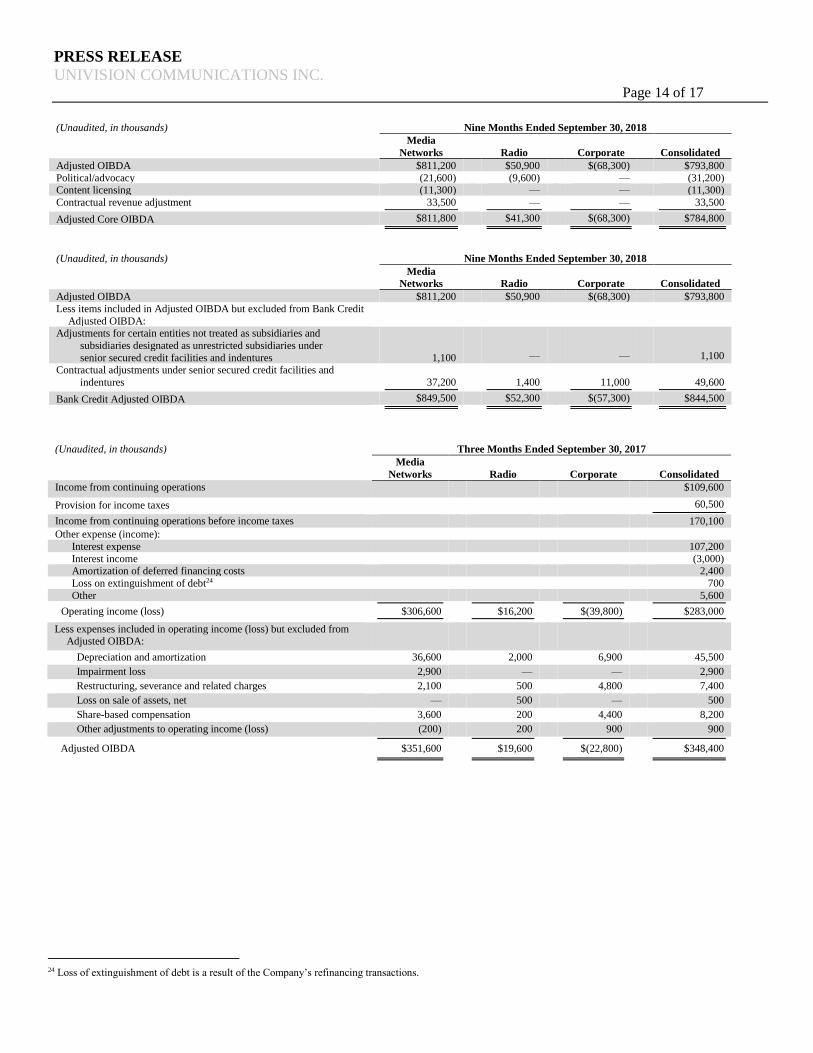
Adjusted OIBDA $811,200 $50,900 $(68,300) $793,800
Political/advocacy (21,600) (9,600) — (31,200) Content licensing (11,300) — — (11,300)
Contractual revenue adjustment 33,500 — — 33,500 Adjusted Core OIBDA $811,800 $41,300 $(68,300) $784,800
(Unaudited, in thousands) Nine Months Ended September 30, 2018
Media
Networks Radio Corporate Consolidated
Adjusted OIBDA $811,200 $50,900 $(68,300) $793,800
Less items included in Adjusted OIBDA but excluded from Bank Credit
Adjusted OIBDA:
Adjustments for certain entities not treated as subsidiaries and
subsidiaries designated as unrestricted subsidiaries under
senior secured credit facilities and indentures 1,100 — — 1,100
Contractual adjustments under senior secured credit facilities and
indentures 37,200 1,400 11,000 49,600 Bank Credit Adjusted OIBDA $849,500 $52,300 $(57,300) $844,500
(Unaudited, in thousands) Three Months Ended September 30, 2017
Media
Networks
Radio Corporate Consolidated
Income from continuing operations $109,600
Provision for income taxes 60,500 Income from continuing operations before income taxes 170,100
Other expense (income):
Interest expense 107,200
Interest income
(3,000) Amortization of deferred financing costs 2,400
Loss on extinguishment of debt24 700
Other 5,600 Operating income (loss) $306,600 $16,200 $(39,800) $283,000
Less expenses included in operating income (loss) but excluded from Adjusted OIBDA:
Depreciation and amortization 36,600 2,000 6,900 45,500
Impairment loss 2,900 — — 2,900
Restructuring, severance and related charges 2,100 500 4,800 7,400
Loss on sale of assets, net — 500 — 500
Share-based compensation 3,600 200 4,400 8,200
Other adjustments to operating income (loss) (200) 200 900 900
Adjusted OIBDA $351,600 $19,600 $(22,800) $348,400
24 Loss of extinguishment of debt is a result of the Company’s refinancing transactions.
PRESS RELEASE
UNIVISION COMMUNICATIONS INC. Page 15 of 17
(Unaudited, in thousands) Three Months Ended September 30, 2017
Media
Networks Radio Corporate Consolidated
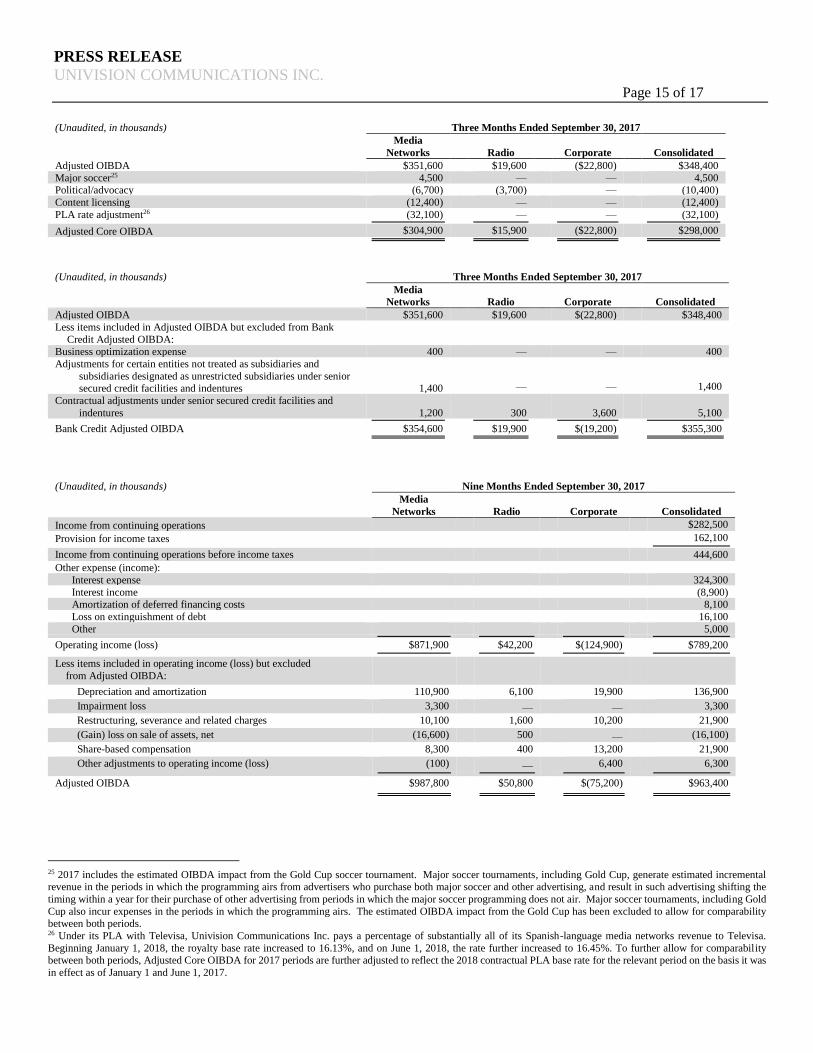
Adjusted OIBDA $351,600 $19,600 ($22,800) $348,400
Major soccer25 4,500 — — 4,500 Political/advocacy (6,700) (3,700) — (10,400)
Content licensing (12,400) — — (12,400)
PLA rate adjustment26 (32,100) — — (32,100) Adjusted Core OIBDA $304,900 $15,900 ($22,800) $298,000
(Unaudited, in thousands) Three Months Ended September 30, 2017
Media
Networks Radio Corporate Consolidated
Adjusted OIBDA $351,600 $19,600 $(22,800) $348,400
Less items included in Adjusted OIBDA but excluded from Bank
Credit Adjusted OIBDA:
Business optimization expense 400 — — 400
Adjustments for certain entities not treated as subsidiaries and
subsidiaries designated as unrestricted subsidiaries under senior secured credit facilities and indentures 1,400 — — 1,400
Contractual adjustments under senior secured credit facilities and
indentures 1,200 300 3,600 5,100 Bank Credit Adjusted OIBDA $354,600 $19,900 $(19,200) $355,300
(Unaudited, in thousands) Nine Months Ended September 30, 2017
Media
Networks
Radio Corporate Consolidated
Income from continuing operations $282,500
Provision for income taxes 162,100 Income from continuing operations before income taxes 444,600
Other expense (income):
Interest expense 324,300
Interest income
(8,900) Amortization of deferred financing costs 8,100
Loss on extinguishment of debt 16,100
Other 5,000 Operating income (loss) $871,900 $42,200 $(124,900) $789,200 Less items included in operating income (loss) but excluded
from Adjusted OIBDA:
Depreciation and amortization 110,900 6,100 19,900 136,900
Impairment loss 3,300 — — 3,300
Restructuring, severance and related charges 10,100 1,600 10,200 21,900
(Gain) loss on sale of assets, net (16,600) 500 — (16,100)
Share-based compensation 8,300 400 13,200 21,900
Other adjustments to operating income (loss) (100) — 6,400 6,300 Adjusted OIBDA $987,800 $50,800 $(75,200) $963,400
25 2017 includes the estimated OIBDA impact from the Gold Cup soccer tournament. Major soccer tournaments, including Gold Cup, generate estimated incremental revenue in the periods in which the programming airs from advertisers who purchase both major soccer and other advertising, and result in such advertising shifting the
timing within a year for their purchase of other advertising from periods in which the major soccer programming does not air. Major soccer tournaments, including Gold
Cup also incur expenses in the periods in which the programming airs. The estimated OIBDA impact from the Gold Cup has been excluded to allow for comparability between both periods. 26 Under its PLA with Televisa, Univision Communications Inc. pays a percentage of substantially all of its Spanish-language media networks revenue to Televisa.
Beginning January 1, 2018, the royalty base rate increased to 16.13%, and on June 1, 2018, the rate further increased to 16.45%. To further allow for comparability between both periods, Adjusted Core OIBDA for 2017 periods are further adjusted to reflect the 2018 contractual PLA base rate for the relevant period on the basis it was
in effect as of January 1 and June 1, 2017.
PRESS RELEASE
UNIVISION COMMUNICATIONS INC. Page 16 of 17
(Unaudited, in thousands)
Nine Months Ended September 30, 2017
Media
Networks Radio Corporate Consolidated
Adjusted OIBDA $987,800 $50,800 ($75,200) $963,400 Major soccer 4,500 — — 4,500
Political/advocacy (18,400) (7,500) — (25,900)
Content licensing (16,700) — — (16,700) PLA rate adjustment (88,400) — — (88,400) Adjusted Core OIBDA $868,800 $43,300 ($75,200) $836,900
(Unaudited, in thousands) Nine Months Ended September 30, 2017
Media
Networks Radio Corporate Consolidated
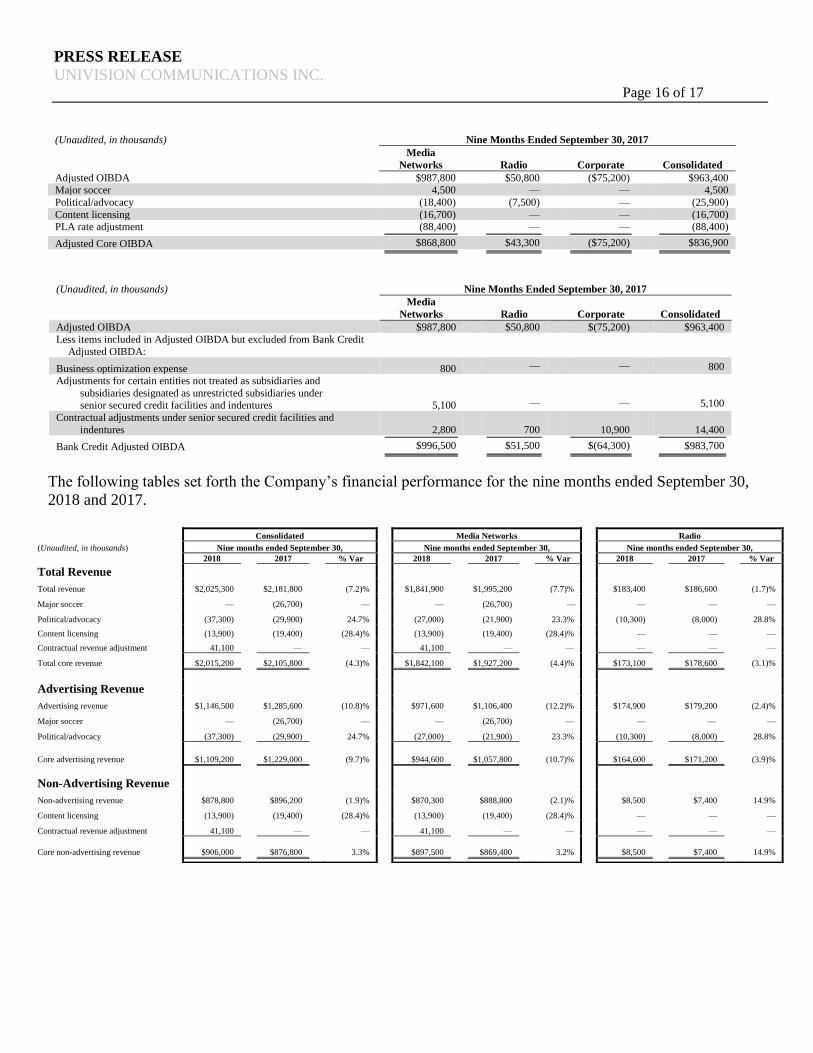
Adjusted OIBDA $987,800 $50,800 $(75,200) $963,400
Less items included in Adjusted OIBDA but excluded from Bank Credit
Adjusted OIBDA:
Business optimization expense 800 — — 800
Adjustments for certain entities not treated as subsidiaries and
subsidiaries designated as unrestricted subsidiaries under senior secured credit facilities and indentures 5,100 — — 5,100
Contractual adjustments under senior secured credit facilities and
indentures 2,800 700 10,900 14,400 Bank Credit Adjusted OIBDA $996,500 $51,500 $(64,300) $983,700
The following tables set forth the Company’s financial performance for the nine months ended September 30,
2018 and 2017.
Consolidated Media Networks Radio
(Unaudited, in thousands) Nine months ended September 30, Nine months ended September 30, Nine months ended September 30,
2018 2017 % Var 2018 2017 % Var 2018 2017 % Var
Total Revenue
Total revenue $2,025,300 $2,181,800 (7.2)% $1,841,900 $1,995,200 (7.7)% $183,400 $186,600 (1.7)%
Major soccer — (26,700) — — (26,700) — — — —
Political/advocacy (37,300) (29,900) 24.7% (27,000) (21,900) 23.3% (10,300) (8,000) 28.8%
Content licensing (13,900) (19,400) (28.4)% (13,900) (19,400) (28.4)% — — —
Contractual revenue adjustment 41,100 — — 41,100 — — — — —
Total core revenue $2,015,200 $2,105,800 (4.3)% $1,842,100 $1,927,200 (4.4)% $173,100 $178,600 (3.1)%
Advertising Revenue
Advertising revenue $1,146,500 $1,285,600 (10.8)% $971,600 $1,106,400 (12.2)% $174,900 $179,200 (2.4)%
Major soccer — (26,700) — — (26,700) — — — —
Political/advocacy (37,300) (29,900) 24.7% (27,000) (21,900) 23.3% (10,300) (8,000) 28.8%
Core advertising revenue $1,109,200 $1,229,000 (9.7)% $944,600 $1,057,800 (10.7)% $164,600 $171,200 (3.9)%
Non-Advertising Revenue
Non-advertising revenue $878,800 $896,200 (1.9)% $870,300 $888,800 (2.1)% $8,500 $7,400 14.9%
Content licensing (13,900) (19,400) (28.4)% (13,900) (19,400) (28.4)% — — —
Contractual revenue adjustment 41,100 — — 41,100 — — — — —
Core non-advertising revenue $906,000 $876,800 3.3% $897,500 $869,400 3.2% $8,500 $7,400 14.9%
PRESS RELEASE
UNIVISION COMMUNICATIONS INC. Page 17 of 17
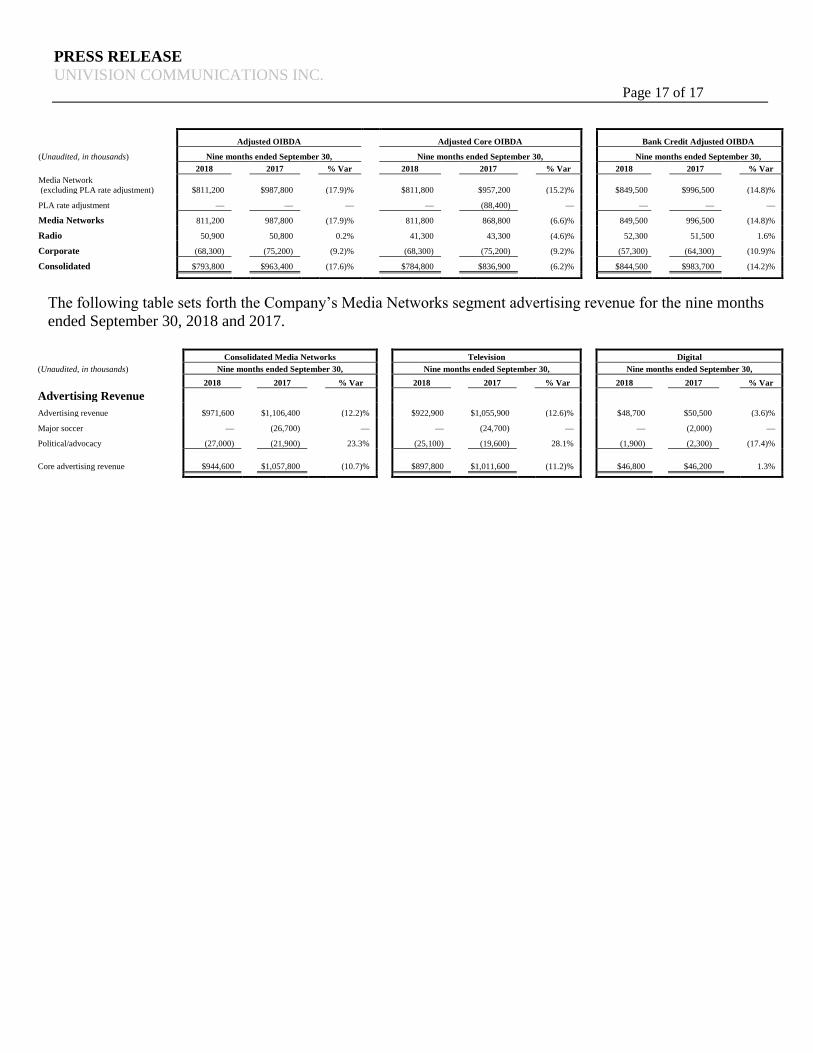
The following table sets forth the Company’s Media Networks segment advertising revenue for the nine months
ended September 30, 2018 and 2017.
Adjusted OIBDA Adjusted Core OIBDA Bank Credit Adjusted OIBDA
(Unaudited, in thousands) Nine months ended September 30, Nine months ended September 30, Nine months ended September 30,
2018 2017 % Var 2018 2017 % Var 2018 2017 % Var
Media Network
(excluding PLA rate adjustment) $811,200 $987,800 (17.9)% $811,800 $957,200 (15.2)% $849,500 $996,500 (14.8)%
PLA rate adjustment — — — — (88,400) — — — —
Media Networks 811,200 987,800 (17.9)% 811,800 868,800 (6.6)% 849,500 996,500 (14.8)%
Radio 50,900 50,800 0.2% 41,300 43,300 (4.6)% 52,300 51,500 1.6%
Corporate (68,300) (75,200) (9.2)% (68,300) (75,200) (9.2)% (57,300) (64,300) (10.9)%
Consolidated $793,800 $963,400 (17.6)% $784,800 $836,900 (6.2)% $844,500 $983,700 (14.2)%
Consolidated Media Networks Television Digital
(Unaudited, in thousands) Nine months ended September 30, Nine months ended September 30, Nine months ended September 30,
2018 2017 % Var 2018 2017 % Var 2018 2017 % Var
Advertising Revenue
Advertising revenue $971,600 $1,106,400 (12.2)% $922,900 $1,055,900 (12.6)% $48,700 $50,500 (3.6)%
Major soccer — (26,700) — — (24,700) — — (2,000) —
Political/advocacy (27,000) (21,900) 23.3% (25,100) (19,600) 28.1% (1,900) (2,300) (17.4)%
Core advertising revenue $944,600 $1,057,800 (10.7)% $897,800 $1,011,600 (11.2)% $46,800 $46,200 1.3%
Recommended