PRESTRESS LOSSES IN CONCRETE AND THE
ESTIMATION OF LONG-TERM DEFLECTIONS
AND CAMBER FOR PRESTRESSED CONCRETE
BRIDGES
By
HEMA JAYASEELAN
Bachelor of Engineering
Government College of Technology
Coimbatore, India
2000
Submitted to the Faculty of the Graduate College of the
Oklahoma State University in partial fulfillment of the requirements for
the Degree of MASTER OF SCIENCE
July, 2007
PRESTRESS LOSSES IN CONCRETE AND THE
ESTIMATION OF LONG-TERM DEFLECTIONS
AND CAMBER FOR PRESTRESSED CONCRETE
BRIDGES
Approved by
Dr. Bruce W. Russell
Thesis Adviser
Dr. Charles M. Bowen
Dr. Robert M. Emerson
Dr. A. Gordon Emslie
Dean of the Graduate College
ii

ACKNOWLEDGEMENTS
I would like to thank God first who gave me an opportunity to further my studies.
He has guided me throughout the course by guiding and blessing me with his abundant,
wisdom and happiness.
I would also like to thank my family members (especially my husband Jayaseelan
Pushparaj) who supported me during my studies and also encouraged me to cross my
hurdles in life. I do not want to also not forget to express my sincere thanks and gratitude
to my father (Pushparaj Anthonysamy) and my mother (Fatima Mary) for their support,
love and patience.
This work would not have been possible without the support and guidance of my
advisor Dr. Bruce Russell under whose supervision I did my thesis. His expertise and
knowledge has trained me to endure not only in my academic life, but also in the
development of my personal character.
I would express my sincere gratitude to my thesis committee members Dr. Robert
Emerson and Br. Charles Bowen .I am thankful for their support and guidance throughout
the graduate program.
I am thankful to my fellow graduate students Kiran Chandran, Amol Ganpatye
and Eden Tessema for their encouragement and support during the research program.
iii
TABLE OF CONTENTS
1.0 INTRODUCTION....................................................................................................... 1
1.1Overview ................................................................................................................... 1
1.2 Background ............................................................................................................. 2
1.3 Analytical Modeling................................................................................................ 3
2.0 REVIEW OF LITERATURE.................................................................................... 5
2.1 Definitions................................................................................................................ 5
2.1.1 Prestress losses ................................................................................................. 5
2.1.2 Elastic Shortening (ES).................................................................................... 6
2.1.3 Concrete Creep (CR) ....................................................................................... 6
2.1.4 Concrete Shrinkage (SH) ................................................................................ 6
2.1.5 Relaxation (RE)................................................................................................ 7
2.1.6 Camber and Deflection.................................................................................... 7
2.2 Prestress Loss Prediction Methods........................................................................ 8
2.2.1 Time-Step methods .......................................................................................... 9
2.2.2 Refined Methods .............................................................................................. 9
2.2.3 Lump-Sum methods....................................................................................... 10
2.3 Background History.............................................................................................. 10
2.3.1 Tadros, Al-Omashi, Seguirant and Gallat: NCHRP Report 496, (2003)
............................................................................................................................... 11
2.3.2 Huo, Al-Omaishi, and Tadros (2001) ....................................................... 16
2.3.3 Concrete Technology Associates Technical Bulletin, (1973).................. 18
2.3.4 Hansen and Mattock, (1966) .................................................................... 19
2.3.5 Lwin, Khaleghi and Hsieh, (1997) ............................................................ 20
2.3.6 Shenoy and Frantz (1991) ......................................................................... 22
2.3.7 Greuel, et.al, (2000).................................................................................... 24
iv
2.3.8 Pessiki et.al, (1996)..................................................................................... 25
2.3.9 Hale and Russell (2006) ............................................................................. 27
2.3.10 Waldron (2004)......................................................................................... 29
2.3.12 Sridhar et.al, (2005) ................................................................................. 31
2.3.13 Tadros , Ghali and Dilger, (1975) ........................................................... 34
2.3.14 Tadros ,Ghali and Meyer, (1985)........................................................... 35
3.0 MODELING USING EXCEL SHEET ................................................................... 38
3.1 Introduction........................................................................................................... 38
3.2 Girder Details ........................................................................................................ 39
3.3 Determination of Prestress losses using Recommended Equations ................. 43
3.3.1 PCI Method .................................................................................................... 43
3.3.2 AASHTO-LRFD Refined Losses .................................................................. 46
3.3.3 AASHTO-LRFD Approximate Lump Sum Estimates of Time Dependent
Losses. ...................................................................................................................... 49
3.3.4 NCHRP 496 Detailed Prestress Losses ........................................................ 51
3.3.5 NCHRP 496 Approximate Prestress Losses ................................................ 58
3.4 Equations Using Time Dependent Creep Effects............................................... 59
3.4.1 AASHTO LRFD Time Step method ............................................................ 59
3.4.1.1 Creep Strain and Creep Coefficient...................................................... 59
3.4.1.2 Effective modulus or Reduced Modulus of Elasticity.......................... 60
3.4.1.3 Shrinkage strain ...................................................................................... 61
3.4.1.4 Prestress Loss Equations........................................................................ 62
3.4.1.5 Concrete stresses and strains:................................................................ 64
3.4.1.6 Camber/ Deflection ................................................................................. 64
4.0 PRESENTATION OF RESULTS ........................................................................... 66
4.1 Tabulated results for Prestress loss and Camber/Deflection............................ 66
5.0 Discussion of results.................................................................................................. 73
5.1Introduction............................................................................................................ 73
v
5.2 Discussion of results for AASHTO Time Step Method ..................................... 73
5.2.1 Effects of addition of Top Prestressing Strand ........................................... 74
5.2.2 Effect of addition of Mild Steel ..................................................................... 76
5.2.3 Effect of variation in Creep Coefficient ....................................................... 77
5.2.4 Effect of variation in Elastic Modulus of Concrete..................................... 80
5.3 Comparison of prestress losses between AASHTO Time Step method and
NCHRP 496 detailed method..................................................................................... 82
5.4 Comparison of prestress losses between AASHTO Time Step method and
AASHTO LRFD refined method............................................................................... 83
5.5 Comparison of prestress losses between AASHTO Time Step method and PCI
Design Handbook method. ......................................................................................... 84
6.0 Summary Conclusion and Recommendations ....................................................... 87
6.1 Recommendations ................................................................................................. 89
REFERENCES................................................................................................................ 90
vi
LIST OF FIGURES
Figure 2-1 Stress versus time in the strands in a pretensioned concrete girder
(NCHRP 493 Tadros, 2003) ............................................................................................. 5
Figure 2-2 Measure Total Losses (Hale 2002) .............................................................. 29
Figure 2-2 Comparision of Field Measure Losses with Design Code Estimates
(Sridhar et., al) ................................................................................................................ 32
Figure 2-4 Predicted Losses from Design Code Estimates over Field Measured
Losses. (Sridhar et.al., 2005) .......................................................................................... 33
Figure 5-1 Effects of Top Prestressing strands on prestress losses at mid span using
AASHTO Time Step method. ........................................................................................ 75
Figure 5-2 Effects of Top Prestressing strands mid span Deflection using AASHTO
Time Step method. .......................................................................................................... 75
Figure 5-3 Effects of Mild Steel on prestress losses at mid span using AASHTO
Time Step method ........................................................................................................... 76
Figure 5-4 Effects of Mild Steel on mid span Deflection using AASHTO Time Step
method.............................................................................................................................. 77
Figure 5-5 Effects of variation in Creep coefficient on prestress losses at midspan
using AASHTO Time Step method ............................................................................... 78
Figure 5-6 Effects of variation in Creep coefficient on mid span Deflection using
AASHTO Time Step method ......................................................................................... 79
Figure 5-7 Effects of variation in Creep coefficient with Mild steel or top
prestressing strands on mid span Deflection using AASHTO Time Step method.... 79
Figure 5-8 Effects of variation in Elastic Modulus of concrete on prestress losses at
midspan using AASHTO Time Step method ............................................................... 81
Figure 5-9 Effects of variation in Elastic Modulus of concrete on mid span
Deflection using AASHTO Time Step method............................................................. 81
vii
Figure 5-10 Effects of variation in Elastic Modulus of concrete with Mild steel or top
prestressing strands on mid span Deflection using AASHTO Time Step method.... 82
Figure 5-11 Plot showing the comparison of Prestress losses at mid span using the
AASHTO Time Step and NCHRP 496 detailed method for two stages of loading... 83
Figure 5-12 Plot showing the comparison of long term Prestress losses at mid span
using the AASHTO Time Step and AASHTO LRFD refined method. ..................... 84
Figure 5-13 Plot showing the comparison of final Prestress losses at mid span using
the AASHTO Time Step and PCI method.................................................................... 85
Figure 5-14 Plot showing the comparison of final Deflection at mid span using the
AASHTO Time Step and PCI Design Handbook method. ......................................... 86
viii
LIST OF TABLES
Table 2-1 Measured versus estimated total prestress losses for 31 previously
reported pretensioned girders.(Tadros et.al.,NCHRP 2003) ...................................... 13
Table 2-2 Measured versus Estimated Total Prestress losses (Tadros et.al., NCHRP
2003) ................................................................................................................................. 16
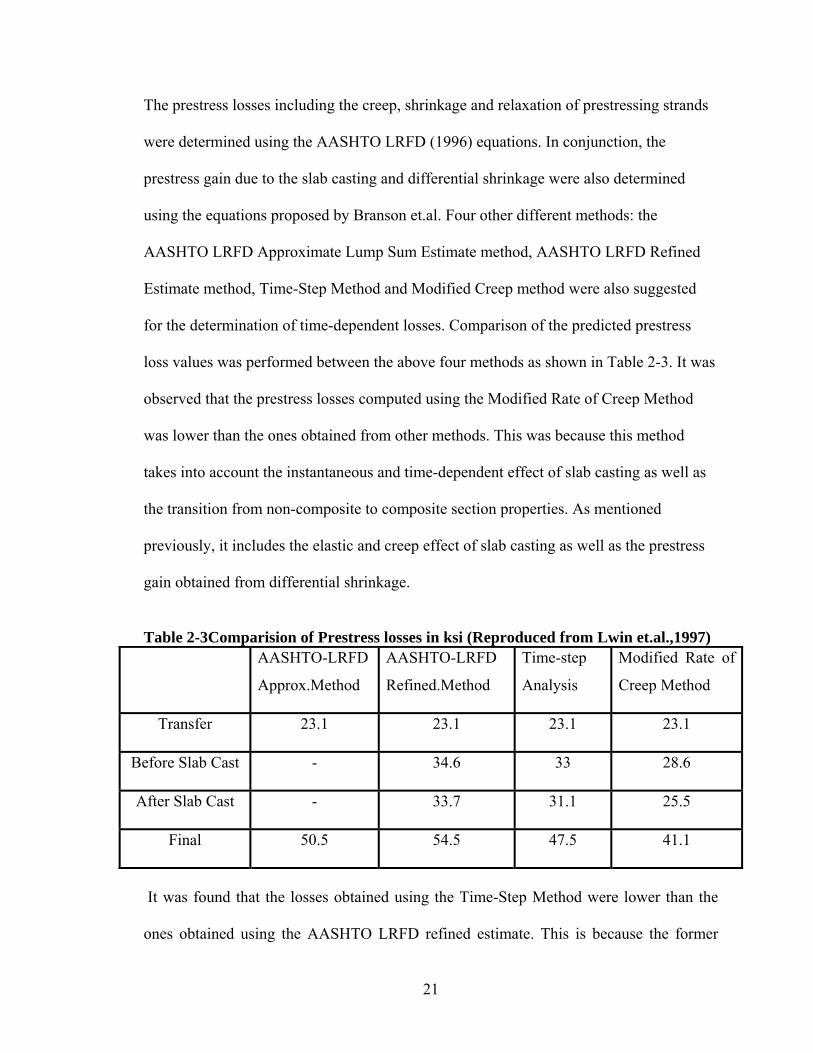
Table 2-3Comparision of Prestress losses in ksi (Reproduced from Lwin et.al.,1997)
........................................................................................................................................... 21
Table 2-4 Ratio of Measured to Predicted Losses (Hale and Russell , 2006) ............ 29
Table 2-5 Measured and Estimated Percent Age Prestress Losses for B1.(Sridhar
et.al., 2005) ....................................................................................................................... 33
Table 2-6 Influence of prestress level and reinforcement on deflection (Ghali et.al.,
1985) ................................................................................................................................. 37
Table 3-1 Load cases that represent the variations in the material properties and
design properties of the concrete bridge girder. .......................................................... 39
Table 3.1 Girder Properties and Prestressing/Non-Prestressing Steel Details ......... 40
The values of Kre and J depend on the stress level and the material characteristic of
the tendon as shown in Table 3-2. ................................................................................. 45
Table 3.2 Vales of Kre and J (Zia et.al., 1979) .............................................................. 45
Table 3-3 Maximum Prestress losses Recommended by ACI Committee................. 46
Table 3-4 AASHTO-LRFD Lump-Sum Estimate of time dependent losses, ksi....... 51
Table 3-5 PCI Design Handbook suggested simple span multipliers for the
estimation of long-term camber and deflection for typical presstressed members .. 65
Table 4-1 Prestress losses at mid span and mid span deflection after 10 years using
PCI Design Handbook method ...................................................................................... 67
Table 4-2 Prestress losses at mid span after 10 years using AASHTO LRFD refined
equations. ......................................................................................................................... 68
ix
Table 4-3 Prestress losses at mid span prior to slab casting; at 90 days using
NCHRP 496 detailed equations. .................................................................................... 69
Table 4-4 Prestress losses at mid span after 10 years using NCHRP 496 detailed
equations. ......................................................................................................................... 70
Table 4-5 Prestress losses at mid span and mid span deflection prior to slab casting,
at 90 days using AASHTO Time Step equations. ........................................................ 71
Table 4-6 Prestress losses at mid span and mid span deflection after 10 years using
AASHTO Time Step equations...................................................................................... 72
x
CHAPTER I
1.0 INTRODUCTION
1.1Overview Prestressed concrete, an ideal combination of concrete and high strength steel, has
emerged as an efficient material for modern construction. The construction of prestressed
concrete bridges as a standard practice in the United States dates back to 1949 when the
Philadelphia Walnut Ave Bridge was constructed. The technical and economical benefits
of prestressed concrete permits longer spans and increased girder spacing.
Complimenting this, higher performance concrete can feature lower water to cementious
materials ratio (w/cm) and the inclusion of supplemental cementious materials that
promote a dramatic improvement of concrete quality and durability.
Efficient design of prestress concrete bridges demands an accurate prediction of prestress
losses. The prestress losses are defined as the loss of tensile stress in the prestress steel
which acts on the concrete component of the prestressed concrete section. In
pretensioned concrete, the four major sources of prestress losses are elastic shortening
(ES), creep (CR), shrinkage (SH) and relaxation (RE). Additionally, prestress losses are
further affected by variations in material properties of the concrete. Numerous research
programs have been conducted and a variety of prestress loss prediction methods have
been proposed [NCHRP Report 496 by Tadros et al (2003), Huo, Omashi and Tadros
1

(2001),]. However, accurate determination of prestress losses has always challenged the
prestressed concrete industry. Inaccurate predictions of losses result in excessive camber
or deflection of prestressed concrete bridges. Excessive camber or deflection can, in turn,
adversely affect the service conditions such as: cracking, ride and overall performance of
the bridge. Excessive cracking can even reduce the bridge’s durability since cracking can
be a route for water borne contaminants to deteriorate the concrete and its reinforcements.
The primary objective of this research is to review the relevant literature and databases
available from prior research programs. This research will also develop design guidelines
towards the accurate estimation of prestress losses, restricted to pre-tensioned concrete.
We expect to develop equations for losses from the existing AASHTO LRFD time
dependent equations for creep, shrinkage and relaxation. A spreadsheet was developed
using the above proposed equations which can be used in design of prestressed concrete
bridges. Additionally, some recommendations for design to ODOT will also be made.
1.2 Background The ACI-ASCE Joint Committee 423 (1958) proposed the lump sum prestress loss
estimates. These losses included the effects of creep, shrinkage and relaxation, but
excluded the frictional and anchorage losses. The further refinement of losses led to the
development of the PCI Committee recommendations (1975), the AASHTO-LRFD
method (1977) and the ACI-ASCE Committee recommendations (1979). These methods
for the calculation of losses failed to acknowledge the variability of material properties of
concrete which then led to either overestimation or underestimation of losses [Shenoy
2
and Frantz (1991), Gruel, et.al,(2000), NCHRP Report 496 (2003), Hale and Russell
(2006)]
The National Cooperative Highway Research Program [NCHRP Report 496 (October
2003)] investigated the measurement of material properties (elastic modulus, concrete
strength, volume to surface ratio and creep coefficient) and their effect on measured
prestress losses and deflections. Further new equations for prestress losses were
proposed. The experimental research programs performed on prestressed concrete bridge
girders by Tadros et al (2001), Miller et al (2000), Pessiki et al (1996), Hale and Russell
(1996) verified that the PCI Design Handbook method, ACI 318 and AASHTO-LRFD
equations overestimated the prestress losses. However, the issues in camber and
deflection were not discussed in detail, but it was concluded that accurate determination
of losses was mandatory for the exact prediction of camber/deflection. The relatively new
PCI Bridge Design Manual (1997) with a section titled, “Improved Multiplier Method”
built on the previous Multiplier method, was found to predict more accurate camber and
deflection in prestressed bridge girders.
1.3 Analytical Modeling The research also developed and programmed spreadsheets which calculated the losses
using the following loss prediction methods: PCI, AASHTO-LRFD and the NCHRP-496
detailed method. The spreadsheet calculates prestress losses along with estimating
camber and deflection for different stages of the loading of the beam (e.g. at release,
storage and handling, erection, cast-in-place slab, sustained loads, live loads and time).
3

The primary data including the cross-sectional properties and the concrete strength of the
girder has to be fed into the sheet.
The spreadsheet also calculates the day to day losses and camber using the AASHTO
Time Step method. Further study will be performed by varying the material properties
(elastic modulus, creep coefficient) and the design properties (addition of top prestressed
steel and mild steel and cross section details) with the intent of minimizing excessive
camber in prestressed bridge girders. With the refinement of the model, direct
recommendations are made to ODOT and OTA including the design procedure for the
accurate estimation of prestress losses, camber and deflection of prestressed bridge
girders.
4
CHAPTER II
2.0 REVIEW OF LITERATURE
2.1 Definitions
2.1.1 Prestress losses Prestress losses are defined as the reduction in the tensile stress in prestressing tendons.
They are categorized as either instantaneous losses or long-term losses. Instantaneous
losses include frictional losses, elastic shortening (ES) and seating loss or anchorage slip.
Long term losses occur over a period of time. They include losses in prestress due to
concrete creep (CR), shrinkage (SH) and relaxation of prestressing strands (RE).
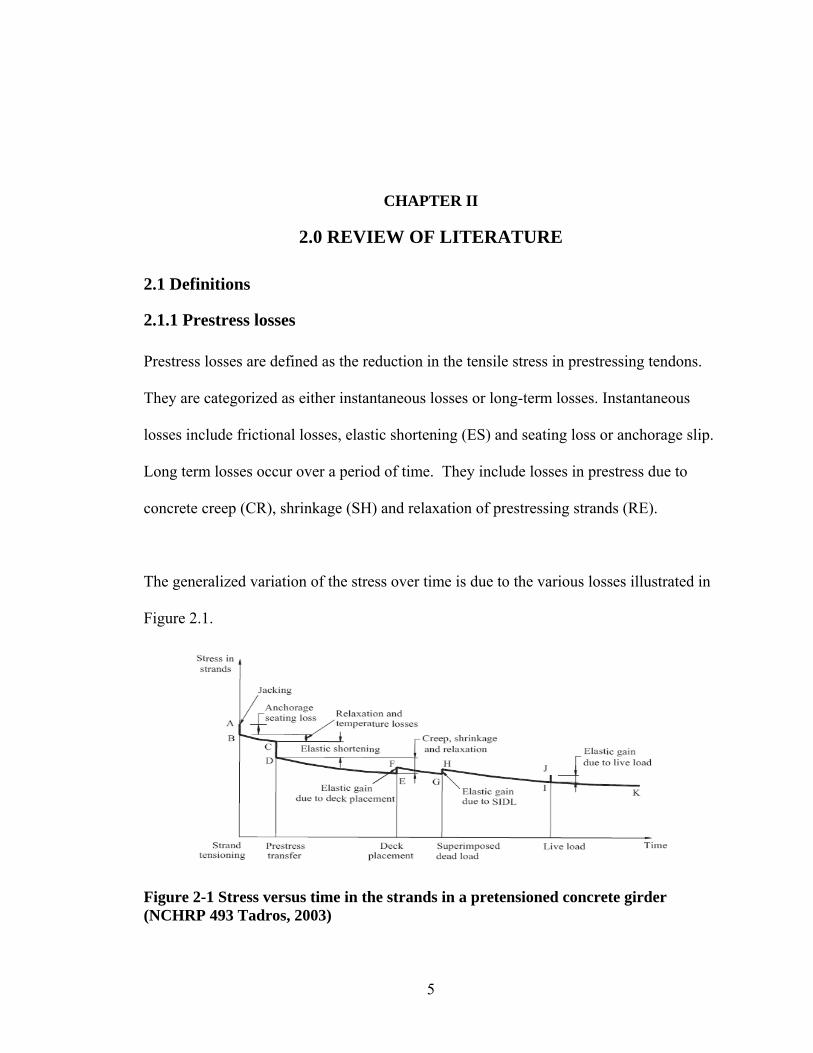
The generalized variation of the stress over time is due to the various losses illustrated in
Figure 2.1.
Figure 2-1 Stress versus time in the strands in a pretensioned concrete girder (NCHRP 493 Tadros, 2003)
5
2.1.2 Elastic Shortening (ES) Loss due to Elastic Shortening is caused by the instantaneous compression of concrete
when the prestress force is transferred to the hardened concrete member. As the concrete
shortens it allows the prestressing steel to shorten with it. It is defined as the loss of
tensile stress in prestressing steel due to the prestress combined with the stress gain due
to the self weight of the member. The Elastic Shortening depends on the modular ratio
and the average stress in the concrete at the level of prestressing steel.
2.1.3 Concrete Creep (CR) The prolonged time-dependent deformation of the concrete under sustained compressive
load or stress is called the creep. Concrete creep is subdivided into two parts, basic creep
and drying creep. Basic creep is the continual deformation occurring in a sealed specimen
subjected to a hydro-equilibrium environment. An unsealed specimen undergoes
additional creep (drying creep) due to free exchange of moisture with the environment.
This prolonged shortening of the concrete girder results in the loss of prestress. The rate
of creep depends on various factors such as: time, magnitude of stress, water-cement
ratio, amount and type of cement, ambient relative humidity, and aggregate properties.
2.1.4 Concrete Shrinkage (SH) The volumetric contraction of concrete specimen due to the loss of free water through
evaporation, carbonation or continued cement hydration, in the absence of load is called
shrinkage. It is composed of three components: drying shrinkage, autogenous shrinkage
6

and carbonation. The decrease in the volume of concrete due to the diffusion of water
into the environment is called the drying shrinkage. Autogenous shrinkage occurs when
free water is used in continued hydration of the cement paste after hardening.
Carbonation results from the chemical reaction of the carbon dioxide from the
atmosphere with hardened cement paste. Again free water is used in the carbonation
reaction.
Regardless the source of shrinkage, the change in volume of the concrete causes an
overall shortening of the strand length and thus reduces the strand stress resulting in
prestress losses.
2.1.5 Relaxation (RE) Relaxation is the gradual reduction of stress over time subjected under sustained strain. It
occurs without the changes in the length of the steel. Relaxation is a property of the
prestressing steel and is independent of concrete properties. The most common types of
prestressing strands today are Low Relaxation strands which normally have losses that do
not exceed 5 ksi.
2.1.6 Camber and Deflection Camber is the common word for the upward deflection of eccentrically prestressed bridge
girders. The amount of camber is governed by the combined action of the prestress force
which causes the camber and self weight of the girder to work against the camber. Self
weight and other sustained gravity loads can cause downward deflections to exceed the
amount of overall camber. The beams and bridges can deflect downward as a result.
7

Camber and/or deflection are also a function of time dependent concrete creep and
prestress loss. Proper estimation of camber or alternatively deflection is essential for an
efficient use of longer spans in HPC bridge girders.
The PCI Handbook (PCI 1999) provides equations for deflection and initial and long
term cambers. In addition, the new PCI Bridge Design Manual (1997) provides the
“Improved Multiplier Method” with intent to predict cambers and deflection. This
method, build upon the existing method found in the PCI Handbook, specifically
modifies the multipliers. This method also considers the Time to Erection and the creep
properties of the concrete.
2.2 Prestress Loss Prediction Methods Several loss prediction methods have been developed over the years, but simple practical
solutions for accurate estimation of prestress loss have proved difficult. The accurate
estimation of losses requires more precise knowledge of material properties as well as the
interaction between creep, shrinkage of concrete and the relaxation of steel. The current
methods for the prediction of losses can be classified according to their approach for the
calculation of losses. They are listed according to their descending order of perceived
accuracy:
(a) Time-Step methods;
(b) Refined methods;
(c) Lump-Sum methods.
8
2.2.1 Time-Step methods These methods fit in to the most detailed group of loss prediction methods based on a
step-by-step numerical procedure and they are implemented in specialized computer
programs. This method has found its appreciation in multi-stage bridge construction
especially in spliced girder and segmental box girder bridges.
The method was developed by dividing the time into intervals whose duration can be
increased as the concrete age increases. The stress in the strands at the end of each
interval represents difference between the initial conditions at the beginning of that time
interval and the calculated prestress losses during that interval. The stresses and
deformations at the beginning of each interval equal those at the end of the preceding
interval. The research programs performed by Tadros et al (1977), Abdel-Karim (1993)
and the PCI-BDM (1997) provide more information on the Time-Step methods.
2.2.2 Refined Methods In these methods each individual component of prestress losses (elastic shortening and
time-dependent losses) is calculated separately. The individual losses are then summed
up to obtain the total loss. The difficulty lies in the accurate computation of the
interdependency of these individual components. The deck slab of composite sections
creep less and shrink more than the prescast girder. This can cause more prestress gain
rather prestress loss (Tadros et.al., NCHRP 496 2003)
The accuracy of these methods also depends on the properties of materials, loading and
environmental conditions as well as the pertinent structural details. The AASHTO
9

standard Specification method (1993), the AASHTO-LRFD (Refined) method (1998),
and the PCI Bridge Design Manual method (1997) use this refined approach.
2.2.3 Lump-Sum methods Various parametric studies were conducted on the prestress losses of different kinds of
prestressed beams under average conditions. The values and trends developed from these
studies were utilized in the approximate Lump-Sum methods. Although these methods
were useful in the preliminary design, they require reassessment in the final design. The
current AASHTO-LRFD Approximate method was developed using this method.
2.3 Background History Numerous studies have shown that the current models tend to over-predict the long term
time dependent losses and hence the camber and deflection in prestress beams
(reference). The following literature gives a brief history of the relevant projects that
have measured prestress losses and compared with various theoretical models for
prestress losses , concrete creep and shrinkage.
Several investigations on concrete creep, shrinkage and prestress losses were performed
in different universities in the United States. They have compared the values of creep,
shrinkage and prestress losses measured in the laboratory and field with those of the
different existing models and methods for the estimation of prestress losses. This section
gives a summary of projects that compared the measured and predicted prestress losses.
10
2.3.1 Tadros, Al-Omashi, Seguirant and Gallat: NCHRP Report 496, (2003)
A detailed research was conducted by Tadros et al (2003) with an objective to develop
design guidelines for estimating prestress losses in high-strength pretensioned concrete
bridge girders. The NCHRP report 496 aimed in the development of new guidelines and
formulas for prestress losses due to the limitations in the current methods used in the
estimation of losses. This research encompassed both experimental and theoretical
programs. In the experimental program seven full scale bridges from four different states:
Nebraska, New Hampshire, Texas and Washington, were investigated for the effect of
material properties and other factors on the prestress losses in pretensioned concrete
bridge girders. In addition to this investigation, previously reported test results of 31
pretensioned girders in seven states were listed as shown in Table 2-1. Several variables
including the Modulus of Elasticity, creep and shrinkage of concrete were studied. The
research demonstrates that both the AASHTO-LRFD and ACI Committee 363 equations
tend to underestimate the Modulus of Elasticity of high strength concrete due to their
inability to account for the properties and the amount of coarse aggregates in the
equation. It was also found that the effects of high strength concrete and the interaction
between the precast pretensioned concrete girder and the precast or cast-in-place concrete
deck were not accounted in the AASHTO-LRFD specifications.
A thorough study was made on the Time-Step Method, Refined Method and Lump-Sum
Methods and their limitations were discussed. A complete study of the various factors
affecting the creep and shrinkage of concrete was also done. A detailed method using the
age-adjusted effective modulus and an approximate method were proposed for reasonable
11
estimates of prestress losses. Both the methods were found to have good correlation with
the experimental test results than the current AASHTO-LRFD methods. Numerical
examples were also provided to demonstrate the applicability of the proposed loss
prediction methods.
12

Table 2-1 Measured versus estimated total prestress losses for 31 previously reported pretensioned girders.(Tadros et.al.,NCHRP 2003)
The experimental program included the material testing and the measurement of material
properties of the bridge girders. In the material testing program both laboratory and on-
site material testing were performed. Similar concrete specimen cylinders were cast for
13
both the testing methods and concrete properties including: concrete strength, modulus of
elasticity, creep and shrinkage were measured. Proposed formulas for the modulus of
elasticity, creep and shrinkage of concrete were developed based on the test results. The
modulus of elasticity of concrete was determined in accordance with ASTM C469-94.
Comparison of test results with that of the prediction formula given by ACI 318, ACI 363
and AASHTO specifications demonstrated that none of them accounted for the effects of
aggregate type on the modulus of elasticity of concrete. Therefore, the proposed formula
developed based on the test results included two factors K1 and K2, where K1 represented
the difference between the national and local average. K2 represented the desired usage of
an upper-bound or lower-bound value in the calculations. These factors give the
proposed formula the ability to account for local materials and also for high strength
concrete. Similar observations were made for creep and shrinkage specimens. The
specimens had a V/S ratio of 1.0 at an ambient relative humidity of 30% to 40% and the
strains were measured using Demountable Mechanical Gauges (DEMEC). The ratio of
measured to estimated values of creep and shrinkage using the AASHTO-LRFD and ACI
209 were found to be much lower than the desired ratio. The proposed creep and
shrinkage formulas developed encompassed various correction factors such as: relative
humidity correction factor, volume to surface ratio correction factor, loading age
correction factor, concrete strength correction factor and time-development correction
factor. An approximate method was also proposed for the estimation of the Long-term
prestress losses.
14

The second part of the experimental program consisted of the testing of the seven full-
scale bridge girders of the four different states which represented a range of geographic
conditions and construction practices. Measurements of concrete strains and temperatures
were taken with the aid of vibrating strain gauges to calculate the loss in prestress force.
The measured total prestress losses averaged to 37.3 ksi. The proposed detail method was
verified by comparing its predicted results with the measured prestress losses. The
proposed modulus of elasticity formula was found to give more accurate results than
those obtained by the current AASHTO-LRFD and the ACI 363 formulae. Moreover, the
proposed shrinkage formula produced results that averaged 105% of the measured values
compared to 174% when using AASHTO-LRFD method and 155% when using the ACI-
209 method. The creep formula averaged 98% of the experimental values compared to
161% for AASHTO-LRFD and 179% for using ACI-209. The above methods appear to
perform poorly than the NCHRP 496 method which may be due to the fact the NCHRP
496 method compared the results on bridges where the material properties had been
accurately measured. Whereas the other methods were based on formulas that were
intended for general use. The substantial effect of the differences in the creep coefficients
on the long-term prestress loss estimation, previously observed by Hou et al (2001),
Mokhtarzadeh and Gross (1996) were reconfirmed through the experimental results.
Table 2-2 lists values of measured versus estimated prestress losses using the AASHTO-
LRFD refined and Lump-Sum methods, PCI-BDM and the proposed detail and
approximate methods. The measured losses from the experimental program were also
listed. The overall research and study concluded that the proposed methods were found to
have good correlation with the tests results for the estimation of the prestress losses.
15

Table 2-2 Measured versus Estimated Total Prestress losses (Tadros et.al., NCHRP 2003)
2.3.2 Huo, Al-Omaishi, and Tadros (2001)
Huo,Al-Omashi and Tadros (2001) studied the time dependent properties of concrete
such as: shrinkage, creep, modulus of elasticity of (HPC) and predicted equations and
procedures to determine the above mentioned properties. Understanding the major effects
of concrete creep and shrinkage and modulus of elasticity of concrete in the
determination of prestress losses of high strength bridge girders, this paper throws light
on analytical and experimental procedures required for the refinement of ACI 209
equations for the prediction of time dependent properties of high strength concrete. From
the research findings of the paper it has been proved that the ACI 209-92 equations tend
to over-estimate the actual shrinkage strains and creep coefficients of high strength
16

concrete. Further more the ACI equations for the modulus elasticity of normal concrete
cannot be used to predict the modulus of elasticity of high strength concrete.
The experimental procedure involves the selection of three HPC specimens (12SF,
12FAand 8FA). SF and FA denote mixes with silica fume and fly ash respectively. The
mixes were prepared and tested using the locally available materials in Nebraska. A total
of 22 (100x100x600mm) shrinkage specimens were prepared, placed and cured in the
structural laboratory of the University of Nebraska, Omaha. The shrinkage strains were
determined by DEMEC (Demountable Mechanical points) which were attached to the
surface of the specimens. In parallel to this, 30 similar creep specimens were also cast
and cured at the same time. They also had DEMEC points attached to their surface and
were monitored for creep deformation. The testing was done in accordance with ASTM C
512-87. The experimental results proved that ACI 209-92 equations for the prediction of
shrinkage strains and creep coefficient were much larger than the measured shrinkage
strains and creep coefficient. It was also found that the shrinkage strains and creep strains
of HPC tend to develop rapidly in the early age of concrete. Moreover, the ACI equations
did not account for the strength of concrete. This resulted in the prediction of new
equations for shrinkage and creep with strength correction factors.
Similar tests for modulus of elasticity of concrete were also performed on concrete
specimens at the ages of 7, 14, 28 and 56 days. The comparisons of the test results with
the various codes prove that both the ASHTO and the ACI equations underestimate the
modulus of elasticity of the three HPC mixes. Further studies from the test results showed
17
that the modulus of elasticity was affected not only by the compressive strength but also
by the type and amount of coarse aggregate present in the mixture. Therefore new
equations for modulus of elasticity for HPC mixtures were developed. However it was
finally stated that the conduction of trial tests was the preeminent way of determination of
the modulus of elasticity of a specified mixture.
2.3.3 Concrete Technology Associates Technical Bulletin, (1973)
The technical bulletin on prestress losses by Concrete Technology Associates highlights
the mechanisms involved and the significance of losses in prestressed concrete. Three
standard 60’ series Washington State pretensioned Bridge girders manufactured by the
Concrete Technology Coorporation (CTC) were selected. The test beams were subjected
to a series of flexural tests at CTC’s Tacoma plant after two years. The beams were
reloaded to determine the point of crack opening from which the prestress losses were
calculated directly from statics based on the assumption of linearity of stresses and
strains. The three bridges exhibited a measured loss of 35.3ksi where as the predicted
losses using AASHO interim specifications for prestress losses (1971) and the PCI
Design Handbook were found to be 63 ksi and 58 ksi. This paper points out that the CTC
test on the bridge girders indicate reasonable values of prestress losses for I-beams
whereas the AASHO recommendations and the PCI method tend to be over conservative.
On exploring the reasons behind the overestimation, the following short comings were
found. AASHO does not take into account the elastic recovery, role of concrete strength
and the time variant strength properties of concrete during the calculation of prestress
losses. Previous research made by Ghali et.al. (J.ACI, Dec 1967) has shown a gain of
18

prestress through creep recovery. This paper has also suggested some ways as how the
performance of prestress products can be improved. The objectives include the use of
high-strength concrete, shrinkage compensation, combined pre-and post-tensioning,
stabilized strand, membrane, preloading and initial overstressing. Various methods for
the reduction of prestress losses have also been presented in this paper. Based on the test
results and the comparison of prestress values of the different methods the CTC have
modified the equations of the PCI Design Handbook method for the calculation of
prestress losses. The results conclude that the allowance of creep recovery and the high
strength concrete in the modified equations allow the calculated prestress losses to be
very close to the measured prestress losses.
2.3.4 Hansen and Mattock, (1966)
Hansen (1966) and Mattock demonstrated the influence of the size and shape of
relatively large sections on the shrinkage and creep of concrete. A suitable parameter
known as the volume to surface ratio (V/S) was selected to relate to the size and shape of
the member. The significance of creep and shrinkage (especially in prestressed concrete)
necessitated the exact prediction of creep and shrinkage in concrete structures. In order to
accomplish this, a relationship between shrinkage and creep at any time, and a parameter
representing the size and shape of the member called the volume to surface ratio was
developed. From the theoretical background research performed by Pickett (1946), it has
been confirmed that a relationship between shrinkage and the shape and size of the
member can be recognized.
19

Test specimens were prepared with two different materials: eigen gravel concrete and
crushed sandstone. Further comparative studies were performed between two types of
specimens, I-section members (11.5 to 46in deep) and concrete cylinders (4 to 24 in dia)
with the same volume to surface ratio which were cast in the laboratory. The specimens
were stored and cured in fog rooms from the time of casting and were mounted with 10in
demountable mechanical strain gauges (DEMEC). The creep specimens were loaded to
an applied stress of 25 percent of the compressive strength at 8 days. Strain readings were
also measured from the shrinkage specimens simultaneously and the shrinkage and creep
strains were recorded. From the measured data, the amount of shrinkage and creep at a
given age was found to increase with a decrease in the size of the specimen. The research
concluded that the both shrinkage and creep of the concrete (at all ages were) affected by
the changes in the shape and size of the member.
2.3.5 Lwin, Khaleghi and Hsieh, (1997)
The main aim of Lwin and Hsieh (1997) was to illustrate the design practice of
Washington State Department of Transportation (WSDOT) and the application of the
AASHTO LRFD Bridge Design Specifications (1996) in order to predict the time-
dependent prestress losses. The added benefits of the High Performance Concrete (HPC)
including the durability characteristics and the strength parameters have also been
highlighted. To compliment this, a design example for the determination of the time-
dependent prestress losses of a WSDOT W74MG prestressed I-girder using Time-Step
method and Modified Creep method has been worked out.
20
The prestress losses including the creep, shrinkage and relaxation of prestressing strands
were determined using the AASHTO LRFD (1996) equations. In conjunction, the
prestress gain due to the slab casting and differential shrinkage were also determined
using the equations proposed by Branson et.al. Four other different methods: the
AASHTO LRFD Approximate Lump Sum Estimate method, AASHTO LRFD Refined
Estimate method, Time-Step Method and Modified Creep method were also suggested
for the determination of time-dependent losses. Comparison of the predicted prestress
loss values was performed between the above four methods as shown in Table 2-3. It was
observed that the prestress losses computed using the Modified Rate of Creep Method
was lower than the ones obtained from other methods. This was because this method
takes into account the instantaneous and time-dependent effect of slab casting as well as
the transition from non-composite to composite section properties. As mentioned
previously, it includes the elastic and creep effect of slab casting as well as the prestress
gain obtained from differential shrinkage.
Table 2-3Comparision of Prestress losses in ksi (Reproduced from Lwin et.al.,1997)
AASHTO-LRFD
Approx.Method
AASHTO-LRFD
Refined.Method
Time-step
Analysis
Modified Rate of
Creep Method
Transfer 23.1 23.1 23.1 23.1
Before Slab Cast - 34.6 33 28.6
After Slab Cast - 33.7 31.1 25.5
Final 50.5 54.5 47.5 41.1
It was found that the losses obtained using the Time-Step Method were lower than the
ones obtained using the AASHTO LRFD refined estimate. This is because the former
21
method uses the effective prestress force than the initial force at transfer. The final
deflection of the prestressed girder using the Modified Rate of Creep Method was also
found. The paper concludes that the AASHTO LRFD specifications provide a logical and
straight forward design of prestressed-I girders. It is also a reasonable method for the
prediction of prestress losses due to creep and shrinkage. However it also states that the
Modified Rate of Creep method provides more accurate prestress losses.
2.3.6 Shenoy and Frantz (1991)
Two 27-year old precast, prestressed concrete box beams were removed from a
deteriorated 54ft span multi-beam bridge (Shenoy and Frantz 1991). The beams were
subjected to structural tests and the measured ultimate flexural strength and prestress
losses were compared with the predicted values of AASHTO (1989) and ACI-318(1989)
code methods. The research program was a combined venture of Connecticut Department
of Transportation, the Precast/Prestressed Concrete Institute (PCI) and the Blakeslee
Prestress Inc. The main objectives of the study were to determine the effect of 27 years of
service on the strength of the beams, the prestress losses and the amount of chloride ion
penetration into the concrete. The two beams (beam7 and beam 4) were partially
deteriorated due to the penetration of de-icing salts and also due to removal from the
bridge.
The material properties of the concrete were determined from the eight cores which were
removed from the top flanges of the beams. It was found that the measured values of
modulus of elasticity and compressive strength concrete were less than the values
predicted using the ACI Committee 363(1984) method. The stresses in the strands were
22

determined both at the University of Connecticut using simple methods (Shenoy and
Frantz 1991) and at the Florida Wire and Cable Company using the special strand testing
method. The test results agreed very well. However, the value of initial prestress was
unknown. Therefore, the final prestress losses were predicted using the PCI general
method (PCI-1975) by using different combinations of assumed and measured material
properties. The beams were AASHTO-PCI Type BI-36 sections and were subjected to
flexural tests. The beams were simply supported on rollers and were permitted for
rotation and translation at supports. Strain gauges were attached to the several strands at
the mid span to record the strains. The beams were loaded at one third points in stages
with the aid of four hydraulic rams. The load, strains, mid span deflection and end
rotations of the beams were recorded.
The load deflection curves developed for both the beams proved that they exhibited linear
elastic behavior prior to flexural cracking. The measured capacities exceeded the flexural
strength values predicted using the AASHTO specifications. The measured rotations also
closely followed the rotations predicted by using moment-area principles with a strain
compatibility moment curvature section analysis. The prestress force in the beams was
determined by observing the reopening of the flexural cracks. The measured prestress
losses were much lower than those predicted using the PCI general method. The test
results also concluded that the strain compatibility and the moment curvature accurately
predicted the beam behavior.
23

2.3.7 Greuel, et.al, (2000)
An experimental research conducted by Miller et.al. (2000), investigated the static and
dynamic response of HPC bridge girder and explored the load transfer between the box
girders through experimental mid-depth shear keys. They also experimentally measured
the prestress losses in the high strength concrete bridge girders. The Ohio Department of
Transportation (ODOT) constructed a (HPC) box girder and similar prototype girders for
experimental testing. The prototype girders were tested for both destructive and non-
destructive testing and the HPC bridge girder was tested for nondestructive testing. The
completed new HPC bridge replaced a 70ft single span, steel stringer bridge with a
concrete deck slab located on the US Route 22. Actually, this bridge was designed as a
three-span, non-composite, adjacent box girder system using normal strength and 0.5 in
diameter prestressing strands. But later it was redesigned as single-span bridge with a
span of 115.5 ft and 0.6 in diameter strands. This was successfully performed considering
the benefits of the high strength concrete.
Prior to the casting of the girders the researchers at the University of Cincinnati (UC)
developed a mix design which produced a concrete with a minimum compressive
strength of 10ksi and with a rapid chloride permeability of less than 1000 coulombs.
Type III cement with water to cementitious ratio of 0.3 was used and micro silica was
added to the mix. Two prototype box girders were casted and tested. It was found that the
test results yielded a transfer length between 60D and 80D whereas the AASHTO
Standard (1998) and AASHTO-LRFD (1998) specifications use a transfer length of 50D
and 60D. It was also found that the AASHTO standard specifications underestimate the
24
value of cracking and ultimate moment. The reason behind this was that the AASHTO
prediction equations take into account the modulus of rupture of normal concrete (750
psi) whereas the modulus of rupture of highs strength concrete has a much higher value
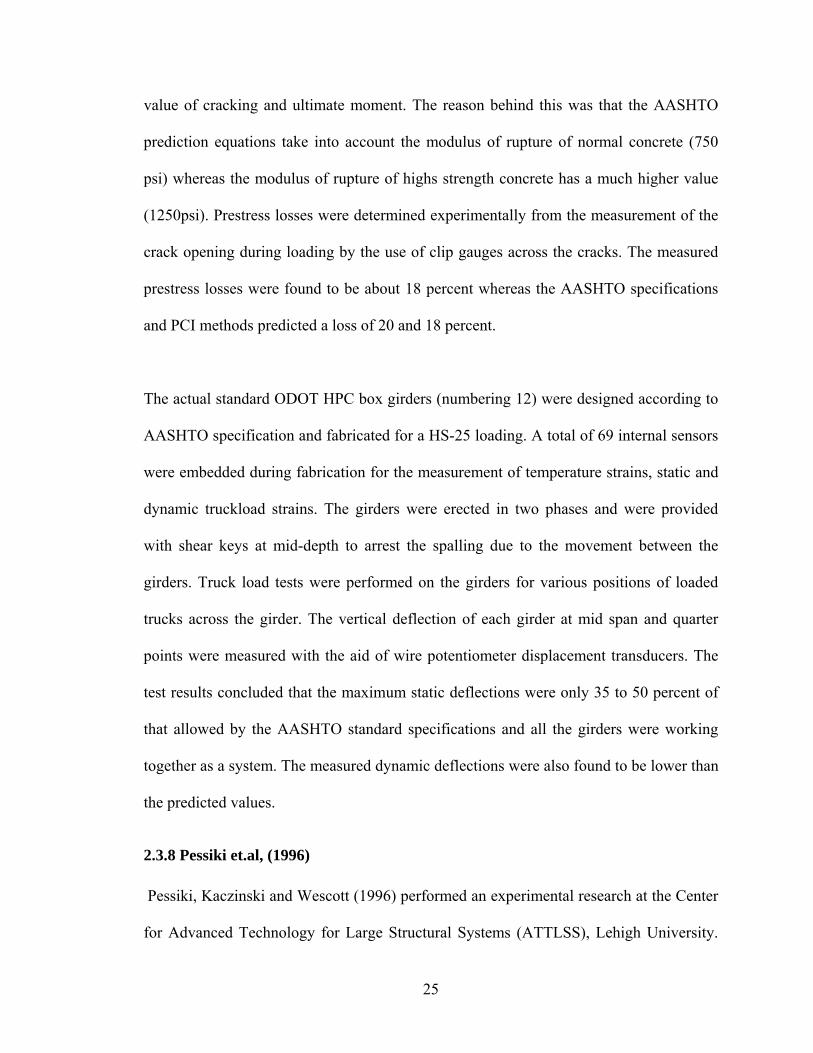
(1250psi). Prestress losses were determined experimentally from the measurement of the
crack opening during loading by the use of clip gauges across the cracks. The measured
prestress losses were found to be about 18 percent whereas the AASHTO specifications
and PCI methods predicted a loss of 20 and 18 percent.
The actual standard ODOT HPC box girders (numbering 12) were designed according to
AASHTO specification and fabricated for a HS-25 loading. A total of 69 internal sensors
were embedded during fabrication for the measurement of temperature strains, static and
dynamic truckload strains. The girders were erected in two phases and were provided
with shear keys at mid-depth to arrest the spalling due to the movement between the
girders. Truck load tests were performed on the girders for various positions of loaded
trucks across the girder. The vertical deflection of each girder at mid span and quarter
points were measured with the aid of wire potentiometer displacement transducers. The
test results concluded that the maximum static deflections were only 35 to 50 percent of
that allowed by the AASHTO standard specifications and all the girders were working
together as a system. The measured dynamic deflections were also found to be lower than
the predicted values.
2.3.8 Pessiki et.al, (1996)
Pessiki, Kaczinski and Wescott (1996) performed an experimental research at the Center
for Advanced Technology for Large Structural Systems (ATTLSS), Lehigh University.
25
The objective of the research was to determine the effective prestress force in two full
scales prestressed concrete bridge beams in order to evaluate the load rating on these
bridges. The two bridge beams were 24 x 60 in prestressed concrete I-beams with a span
of 89 ft from the Pennsylvania Department of Transportation (PennDOT). Its overall
length was 90 ft 5in with a total of 50, 7/16 in diameter prestressed strands. The beams
were removed from 28 years of service on a dual seven-span Shenango River Bridge.
They were tested on a 5000 kip capacity Universal Testing Machine at a three point load
configuration. Prior to testing the beams were surveyed for a mid span camber of 1.31in
and 1.56 in respectively.
The experimental program comprises of three phases (i) Cracking Load Test, (ii)
Decompression Load Test and (iii) Ultimate Load Test. The first phase comprised of
loading of the specimen to locate and create a series of flexural cracks. A series of strain
gauges and strain transducers were used to record the strain distribution throughout the
depth of the member. The second phase involved the determination of the decompression
load from the Load-Strain curves obtained from the strain gauge and displacement
transducer readings which were mounted across the cracks. In the third phase, the beams
were loaded to failure and the ultimate strength of the beams were observed. In addition
to this, core samples were also obtained from the beams to determine experimentally the
compressive strength, modulus of elasticity and splitting tensile strength of the beams. It
was found that the cores had an average compressive strength of 8440psi which was 65
percent greater than the design strength and the modulus of elasticity was 11 percent
greater than that predicted using the ACI 318-95(1995) equation. From the experimental
26
observation it was found that the beams had remained uncracked during their 28 years of
service. With the knowledge of the average decompression load, simple elastic analysis
was used to calculate the effective prestress force in each beam. Thus the measured
average prestress loss for both the beams were found to be approximately 60 percent of
that predicted using the AASHTO Standard (1992) and PennDOT(1993) design
specifications. The results of the study also concluded that the use of strain gauges for the
determination decompression load produced most reliable and repeatable results.
2.3.9 Hale and Russell (2006)
Hale and Russell observed the effects of increased allowable compressive stresses at
release on the performance of precast prestressed concrete bridge girders. A comparative
study was also performed between the experimental results of the measured losses and
the estimated losses. The losses were estimated using the three most widely accepted
methods such as: the AASHTO LRFD refined method(2004), PCI Design Handbook
method described by Zia et al (1979) and the detailed method proposed by the National
Cooperative Highway Research Program (NCHRP) Report 496(2003). The purpose of
their research was to examine the effect of increasing the allowable compressive stress at
release from 0.60f’c to 0.70f’c.
Four prestressed I-shaped girders were cast and tested with a compressive release stress
ranging from 0.57f’c and 0.82f’c. Two of the beams were air-entrained whereas the other
two were not air-entrained. Some strands were debonded to achieve the targeted
compressive release strengths. Concrete strains were measured with the aid of a
detachable mechanical strain gauge (DEMEC). Prestress losses were measured by
27

multiplying the measured concrete strains by the elastic modulus for the prestressing
strands. Three of the four girders exhibited a maximum compressive stress at release
greater than the allowable limit 0.6f’c. It was observed that although the measured
prestress losses were high due to the increase of the allowable compressive stress at
release none of the beams experienced adverse effects and no external signs of distress
were visible.
Examination of the losses concluded that the 2004 AASHTO (refined method) and the
Zia.et al prediction equations overestimated the measured losses by an average of 18%
and 13% respectively where as the detailed method from the NCHRP Report 496
predicted more accurate losses than the former two methods. Table 2-4 shows ratio of the
measured to predicted prestress losses using AASHTO (2004), Zia et al (1979) and the
NCHRP 496 (2003) methods. The results concluded that the data provides support for
increasing the allowable compressive release strength from 0.6f’c to 0.7f’c. It was also
concluded that the addition of entrained air had negligible effects on prestress losses.
Figure 2-2 graphically depicts the effects of air entrainment and increase in allowable
compressive stress at release in the four girders. Table 2-4 shows the comparison between
the measured prestress losses and the predicted losses using three design methods
AASHTO LRFD, Zia et., al and the NCHRP 496.
28
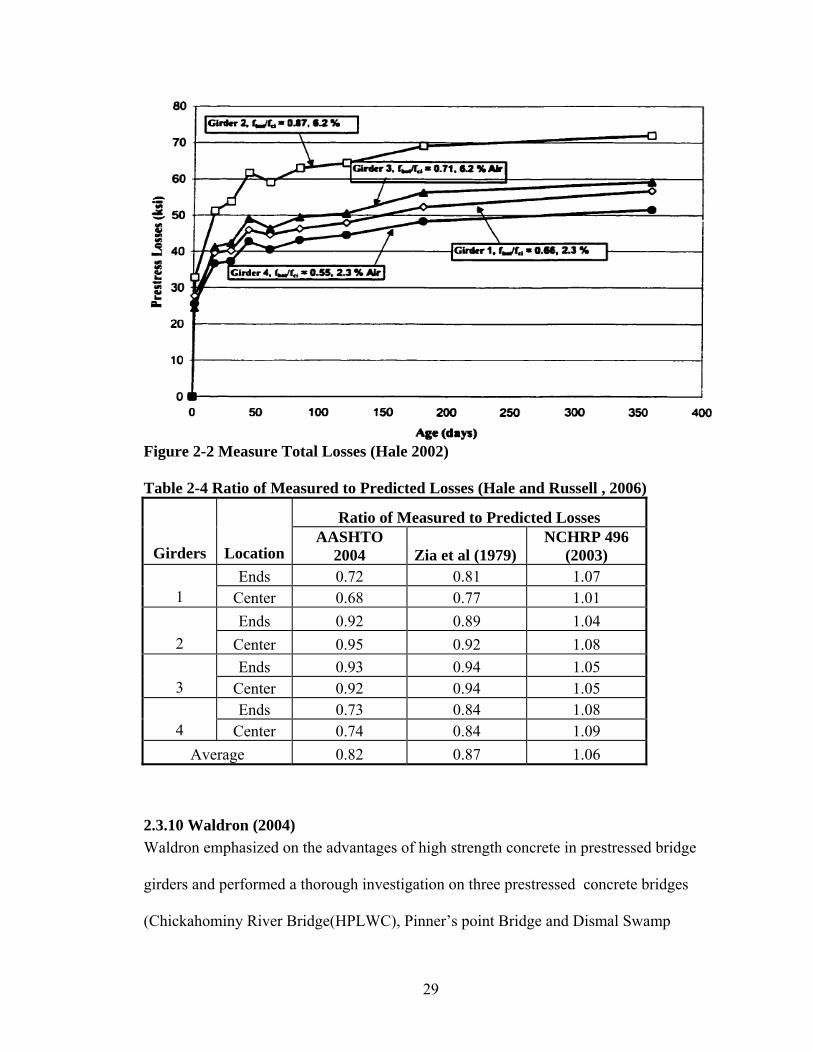
Figure 2-2 Measure Total Losses (Hale 2002) Table 2-4 Ratio of Measured to Predicted Losses (Hale and Russell , 2006)
Ratio of Measured to Predicted Losses
Girders Location AASHTO
2004 Zia et al (1979) NCHRP 496
(2003) Ends 0.72 0.81 1.07
1 Center 0.68 0.77 1.01 Ends 0.92 0.89 1.04
2 Center 0.95 0.92 1.08 Ends 0.93 0.94 1.05
3 Center 0.92 0.94 1.05 Ends 0.73 0.84 1.08
4 Center 0.74 0.84 1.09 Average 0.82 0.87 1.06
2.3.10 Waldron (2004) Waldron emphasized on the advantages of high strength concrete in prestressed bridge
girders and performed a thorough investigation on three prestressed concrete bridges
(Chickahominy River Bridge(HPLWC), Pinner’s point Bridge and Dismal Swamp
29

Bridge) constructed in Virginia. Studies on long-term prestress losses were performed
and comparisons were made between the measured and predicted prestress losses.
Several existing methods including the AASHTO Standard (1996), AASHTO LRFD
(1998), PCI Bridge Design Manual (PCI-BDM,1997) and NCHRP Report 496 (Tadros et.
al.,2003) and other creep and shrinkage models including ACI-209(1992), CEB-FIP
(1990), PCI Committee on Prestress Losses (1975), PCI-BDM, B3 (Basant and
Baweja,1995 a,b,c), GL2000 (Gardner and Lockman, 2001), AFREM (Le Roy et.
al.,1996), AASHTO LRFD, Shams and Khan (2000), and NCHRP Report 496, were used
for the comparison of measured and predicted prestress losses.
Based on the comparisons made on the above mentioned methods and specifications a
design recommendation was provided for the determination of prestress losses for
Virginia’s prestressed concrete. In conjunction, creep and shrinkage studies were
conducted on three prestressed concrete bridges in Virginia Tech. The girders were
instrumented to measure the long-term creep and shrinkage strains associated with the
prestress losses. The results of the experimental studies proved that the AASTO Standard
and LRFD specifications over predicted the total losses of the three bridges by18% to
98% whereas the NCHRP 496 Refined method under predicted the total losses for the
three bridges between 82% and 98%. Finally, it was stated that the PCI-1975 method was
the best predictor of prestress losses for the HPLWC girder with an overestimation of
measured losses by 17%. The PCI-BDM was the most consistent method for the
prediction of total losses, overestimating the measured prestress losses of HPLWC by
18%.
30

2.3.12 Sridhar et.al, (2005)
Measured prestress losses were compared with those obtained using the
recommendations given in the different code practices such as: ACI Committee 209
(2002), PCI General Method for the Computing of Prestress Losses (1975) and the CEB-
FIP Modal code(1978). In conjunction, estimated prestress losses of the field data
collected on a prestressed concrete highway bridge were also compared with the design
codes. Although other different codes of practices (i.e, AASHTO Standard Specifications
(1996) and IS-1343code) were recommended for the estimation of prestress losses. The
above three methods were used since they predict the prestress losses at a particular time
within the lifespan of the structure.
The prestress losses were measured from laboratory tests on two prestressed beams using
vibrating strain gauges. Vibrating strain gauges were chosen to measure the strain in the
prestressed beams due to their stability and reliability over periods exceeding 15 years as
previously stated by Window and Holister (1982). Two embedment type and two surface
mounting type vibrating strain gauges were used in the measurement of strains in the two
prestressed beams. The measured strains were also corrected for the temperature induced
apparent strains in the gauges. The initial prestress was computed from the measured
strain values. The beams were monitored under laboratory conditions for a period of
400days. Since no external loads were applied the time dependent strains were calculated
based on the creep, shrinkage and relaxation of the prestressing steel. A comparative
study of the measured prestress losses with the design codes was done. It was found that
the prestress losses predicted using the ACI 209 method matched with the measured
losses at the early ages (up to 50 days). However this method was found to underestimate
31
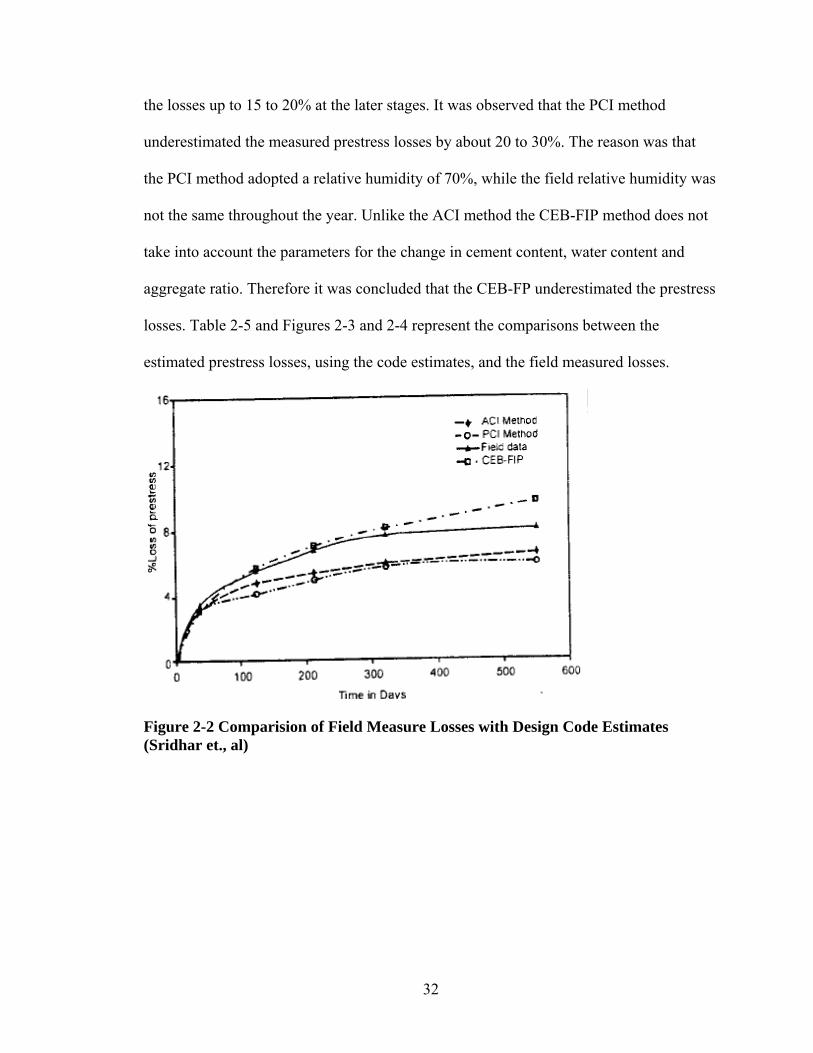
the losses up to 15 to 20% at the later stages. It was observed that the PCI method
underestimated the measured prestress losses by about 20 to 30%. The reason was that
the PCI method adopted a relative humidity of 70%, while the field relative humidity was
not the same throughout the year. Unlike the ACI method the CEB-FIP method does not
take into account the parameters for the change in cement content, water content and
aggregate ratio. Therefore it was concluded that the CEB-FP underestimated the prestress
losses. Table 2-5 and Figures 2-3 and 2-4 represent the comparisons between the
estimated prestress losses, using the code estimates, and the field measured losses.
Figure 2-2 Comparision of Field Measure Losses with Design Code Estimates (Sridhar et., al)
32
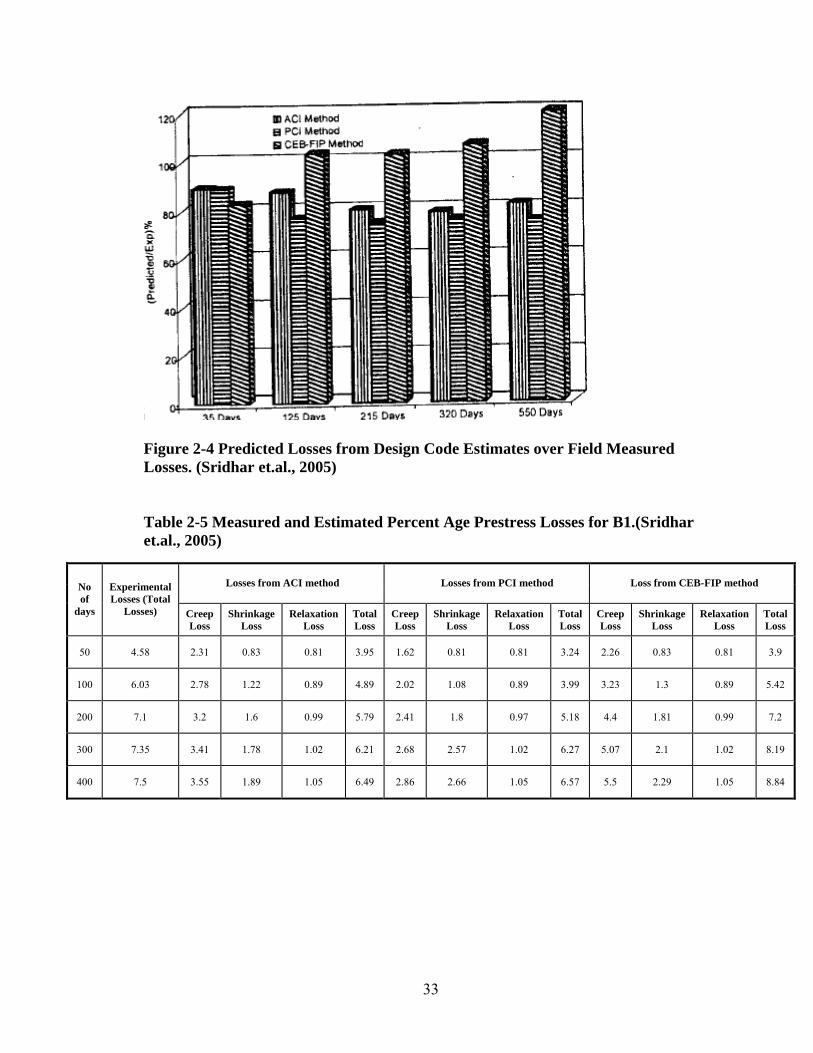
Figure 2-4 Predicted Losses from Design Code Estimates over Field Measured Losses. (Sridhar et.al., 2005) Table 2-5 Measured and Estimated Percent Age Prestress Losses for B1.(Sridhar et.al., 2005)
Losses from ACI method Losses from PCI method Loss from CEB-FIP method No of
days
Experimental Losses (Total
Losses) Creep Loss
Shrinkage Loss
Relaxation Loss
Total Loss
Creep Loss
Shrinkage Loss
Relaxation Loss
Total Loss
Creep Loss
Shrinkage Loss
Relaxation Loss
Total Loss
50 4.58 2.31 0.83 0.81 3.95 1.62 0.81 0.81 3.24 2.26 0.83 0.81 3.9
100 6.03 2.78 1.22 0.89 4.89 2.02 1.08 0.89 3.99 3.23 1.3 0.89 5.42
200 7.1 3.2 1.6 0.99 5.79 2.41 1.8 0.97 5.18 4.4 1.81 0.99 7.2
300 7.35 3.41 1.78 1.02 6.21 2.68 2.57 1.02 6.27 5.07 2.1 1.02 8.19
400 7.5 3.55 1.89 1.05 6.49 2.86 2.66 1.05 6.57 5.5 2.29 1.05 8.84
33
2.3.13 Tadros , Ghali and Dilger, (1975)
Tadros, Ghali and Dilger (1975) proposed a numerical procedure for accurate
determination of time dependent losses (creep, shrinkage, and relaxation) which further
resulted in the precise determination of deflection. This paper emphasizes more on
practical applications without the derivation of equations. Moreover, it takes into account
the creep recovery factor and the relaxation reduction factor for the proper estimation of
final losses. The three basic factors required for this technique, free shrinkage, creep
coefficient and intrinsic relaxation of the prestressing tendon were assumed to be known.
These were obtained from the equations derived by Branson et.al.,(1971). The two
reduction parameters, µ creep recovery and Ψ relaxation reduction factor, used in the
paper were obtained from a step by step numerical method proposed by Tadros et.al.,
(1974).
It was found that the general equation widely used for the prediction of prestress losses
during that period overestimated the losses. Therefore, a new refined formula for the
calculation of prestress losses was developed in a step by step design procedure taking
into account the reduction parameters µ and Ψ resulting due to creep recovery and
reduction in steel relaxation. Furthermore, the axial strain and the curvature of the
concrete section were also found based on the time dependent strain at the prestress steel
level. Although axial strain and curvature were not used in the calculation of losses, they
were significant in the calculation of deflection and camber. The results from the
proposed method were found to have good correlation with the existing experimental
34
data. In addition, this paper also gives a procedure to determine the loss or gain in
prestress and the deflection caused by superimposed sustained loads.
2.3.14 Tadros ,Ghali and Meyer, (1985)
Tadros, Ghali and Meyer (1985) proposed a simple method to determine time dependent
prestress losses and eventually the time dependent deflection and camber in prestressed
beams. They discussed more about the influence of creep, shrinkage of concrete,
relaxation of prestressed steel and the presence of non-prestressed steel on time
dependent deflection behavior of concrete. Empirical formulae and multipliers were
developed for the prediction of time dependent deflections. The proposed method was a
simple modification of the existing methods, it rationally accounted for the effects of the
cross-sectional area and the location of the non-prestressed steel in the member section
and the effects of cracking. The precision of the projected method was verified
comparing its values with those of experimental results and other methods including the
PCI Design method.
The proposed method included a five step calculation of deflection in prestressed
concrete members. Multiplier formula tables were developed for the calculation of
immediate and long-term defection of cracked and uncracked prestressed concrete
members. The results of this formula were comparable with the results obtained using the
PCI Design Hand book (1978) design. A new empirical formula suggested by
Naaman(1982), shown in equation was used to calculate the moment of inertia and the
curvature of the cracked section.
( )( )sps2sss
2pspspscr 1dAndAnI ρρ−+= in4 Eq 2-1
Where,
35
n = modular ratio
Aps = area of prestressed steel, in2
As = area of non-prestressed reinforcement, in2
dps = distance from the extreme compression fibre to the centroid of
Prestressing steel
ds = distance from the extreme compression fibre to the centroid of
non-prestressed steel
ρps = reinforcing ratio of prestressed steel.
ρps = reinforcing ratio of non- prestressed steel.
This formula accounts for both prestressed and non-prestressed steel. It also takes into
account the increase in the eccentricity due to cracking which when ignored causes
overestimation of defection in cracked members. In addition to this, empirical equation
for “tension stiffening” was also formulated where the uncracked concrete existing
between the cracks contributed of the additional stiffness. Table 2-6 shows the
comparison of the influence of prestress level and reinforcement on deflection between
the proposed average time-dependent multipliers and PCI Design Hand Book multipliers.
From the results it was concluded that the implication of empirical multipliers tend to the
increase the time dependent deflection as opposed to the decrease in deflection predicted
by the PCI Design Handbook method. It points out that although the presence of
additional non-prestressed steel poses to increase the stiffness of the member, they
actually tend to reduce the compression force developed in the concrete resulting in large
prestress losses and high time-dependent defection. The experimental test data was found
36
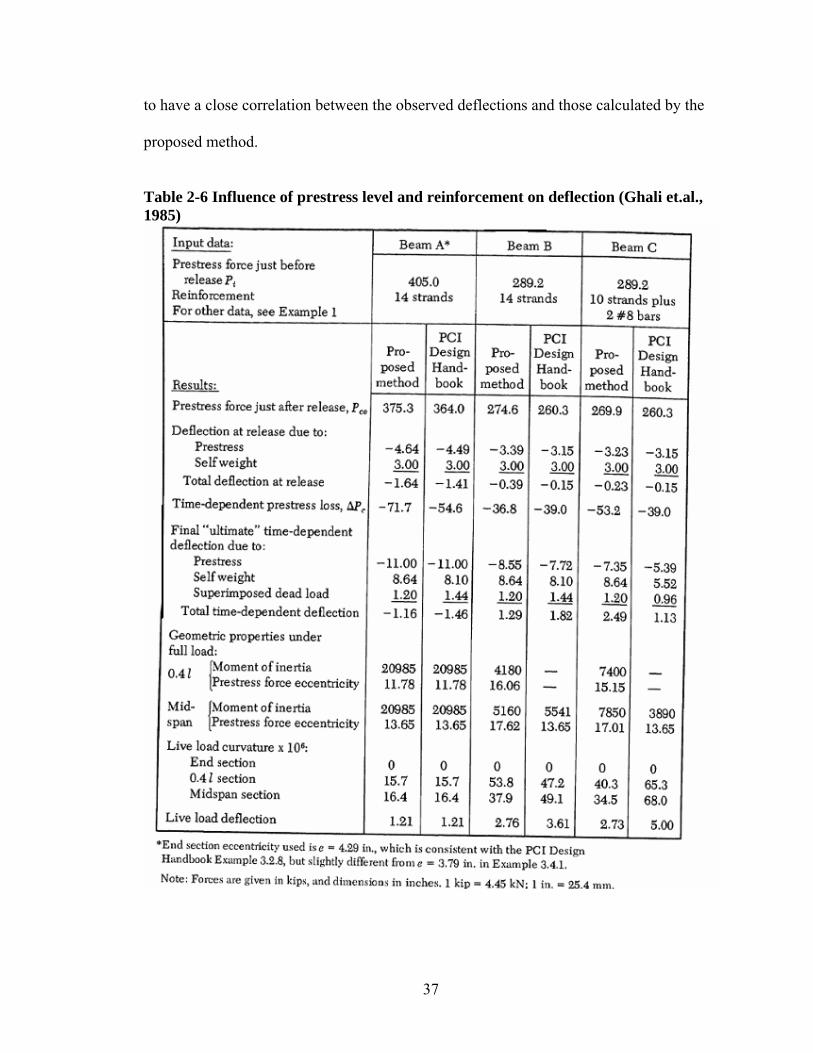
to have a close correlation between the observed deflections and those calculated by the
proposed method.
Table 2-6 Influence of prestress level and reinforcement on deflection (Ghali et.al., 1985)
37
CHAPTER III
3.0 MODELING USING EXCEL SHEET
3.1 Introduction Individual excel spread sheets were developed and modeled to determine prestress
losses and camber using the prevailing equations in AASHTO LRFD , ACI -209, PCI,
NCHRP496. Specifically, the AASHTO LRFD prestress loss equations were
incorporated with time dependent creep effects to determine the prestress losses, camber
and defection. The sheets were developed on a Time Step basis with time varying day to
day. The prestress losses and hence camber and deflection were computed daily from the
Time Step approach. The sheets were also modulated for the various changes in the
design criteria including the addition of fully tensioned prestressing strands at the top of
the cross section and non-prestressed mild steel toward the bottom of the cross section (at
midspan). Additionally, the modulus of elasticity (Ec) and creep coefficient (Cr) of
concrete were varied between 80% 120% of the nominal values.
Table 3-1 displays the different cases for which the sheets have been modulated for the
calculation of losses.
38
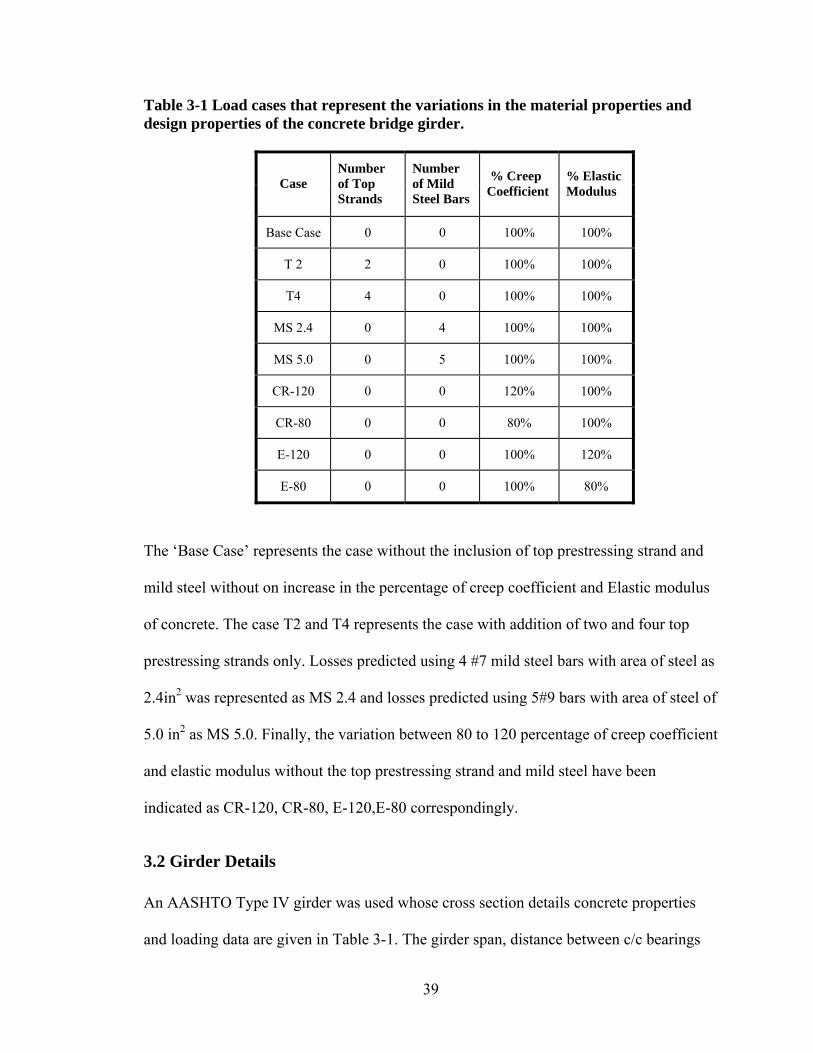
Table 3-1 Load cases that represent the variations in the material properties and design properties of the concrete bridge girder.
Case Number of Top Strands
Number of Mild Steel Bars
% Creep Coefficient
% Elastic Modulus
Base Case 0 0 100% 100%
T 2 2 0 100% 100%
T4 4 0 100% 100%
MS 2.4 0 4 100% 100%
MS 5.0 0 5 100% 100%
CR-120 0 0 120% 100%
CR-80 0 0 80% 100%
E-120 0 0 100% 120%
E-80 0 0 100% 80%
The ‘Base Case’ represents the case without the inclusion of top prestressing strand and
mild steel without on increase in the percentage of creep coefficient and Elastic modulus
of concrete. The case T2 and T4 represents the case with addition of two and four top
prestressing strands only. Losses predicted using 4 #7 mild steel bars with area of steel as
2.4in2 was represented as MS 2.4 and losses predicted using 5#9 bars with area of steel of
5.0 in2 as MS 5.0. Finally, the variation between 80 to 120 percentage of creep coefficient
and elastic modulus without the top prestressing strand and mild steel have been
indicated as CR-120, CR-80, E-120,E-80 correspondingly.
3.2 Girder Details An AASHTO Type IV girder was used whose cross section details concrete properties
and loading data are given in Table 3-1. The girder span, distance between c/c bearings
39

and the spacing between the girders have been specified in the sheet. The transformed
and composite cross section properties of the girder were calculated based on the
specified concrete strength, gross section properties, prestressing strand details and the
concrete deck details.
Table 3.1 Girder Properties and Prestressing/Non-Prestressing Steel Details
Girder Properties Strand Details
Girder Type AASHTO Type IV
Beam Span, ft 105
Girder Spacing ,in 96 Girder details
Girder Height h ,in 54 Gross Cross Section Area Ag,in2 789
yb,in. 24.73 Gross Moment of Inertia Ig,in4 260,730
Girder unit weight,k/ft3 0.15 Prestressing strands
Number of bottom strands, N 34 Diameter of strands db, in. 0.5
Area of Prestressing strands Ap, in2 5.2 Eccentricity at mid-span ep, in. 20.85
Strands initial stress fpi, ksi 202.5 Strands modulus of elasticity Es, ksi 28,500
Deck details Thickness of deck hf, in 8
Area of Deck Ad, in.2 768 Deck unit weight, k/ft3 0.15
Non-Prestressing Steel Number of bars, n 4#7 or 5#9
Modulus of Elasticity, Em, ksi 29,000
Concrete Properties
The one day and 28 day compressive strengths of concrete were specified as f’ci = 6 ksi
and f’c=10 ksi respectively. The above strengths can be varied accordingly. The
40
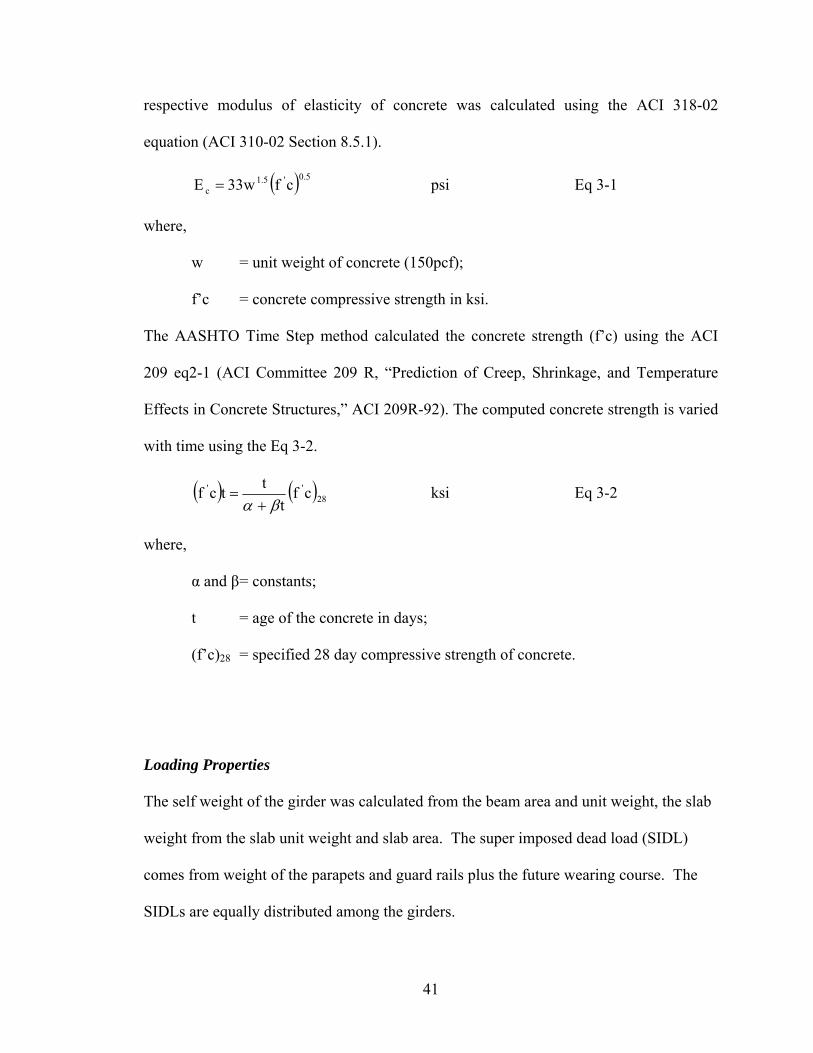
respective modulus of elasticity of concrete was calculated using the ACI 318-02
equation (ACI 310-02 Section 8.5.1).
psi Eq 3-1 ( ) 5.0'1.5c cfw33E =
where,
w = unit weight of concrete (150pcf);
f’c = concrete compressive strength in ksi.
The AASHTO Time Step method calculated the concrete strength (f’c) using the ACI
209 eq2-1 (ACI Committee 209 R, “Prediction of Creep, Shrinkage, and Temperature
Effects in Concrete Structures,” ACI 209R-92). The computed concrete strength is varied
with time using the Eq 3-2.
( ) ( )28'' cf
tttcfβα +
= ksi Eq 3-2
where,
α and β = constants;
t = age of the concrete in days;
(f’c)28 = specified 28 day compressive strength of concrete.
Loading Properties
The self weight of the girder was calculated from the beam area and unit weight, the slab
weight from the slab unit weight and slab area. The super imposed dead load (SIDL)
comes from weight of the parapets and guard rails plus the future wearing course. The
SIDLs are equally distributed among the girders.
41

Prestressing and Non-Prestressing Steel
The prestressing strands are commonly concentrated at the tension flange of the bridge
girder cross section. Under certain circumstances the prestressing strands are placed both
in tension and compression flanges. Although this arrangement causes the center of
gravity of steel (c.g.s) to move near the center of gravity of concrete (c.g.c) resulting in
the decrease of lever arm, fully tensioned top strands can help mitigate the tensile
stresses, potential tensile cracking, at the top fibers near the ends of the beams. [ Linn and
Burns (2004)]. The analyses with the addition of two and four top prestressing strands
have been represented as cases T2 and T4 respectively. The spreadsheet is constructed to
accommodate different strand patterns of varying diameter and number of strands. 270
Grade Low relaxation strands with an elastic modulus (Es) of 28,500ksi have been used
in the girder for the prediction of prestress losses and mid span deflection.
Non-prestressed mild steel is not usually placed longitudinally through a prestressed
beam. Where employed, the mild steel usually serves to boost moment capacity for the
strength limit state.( Linn and Burns 2004) However, mild steel also provides benefit to
prestressed sections by reducing losses due to elastic shortening and creep, it can also be
useful for helping to control long-term camber and/or deflections. Mild steel bars of
yield strength 50ksi and modulus of elasticity of 29000ksi was used. The excel sheet was
modeled to accommodate or different arrangement of non-prestressing steel represented
as cases MS 2.4 and MS 5.0 respectively.
42
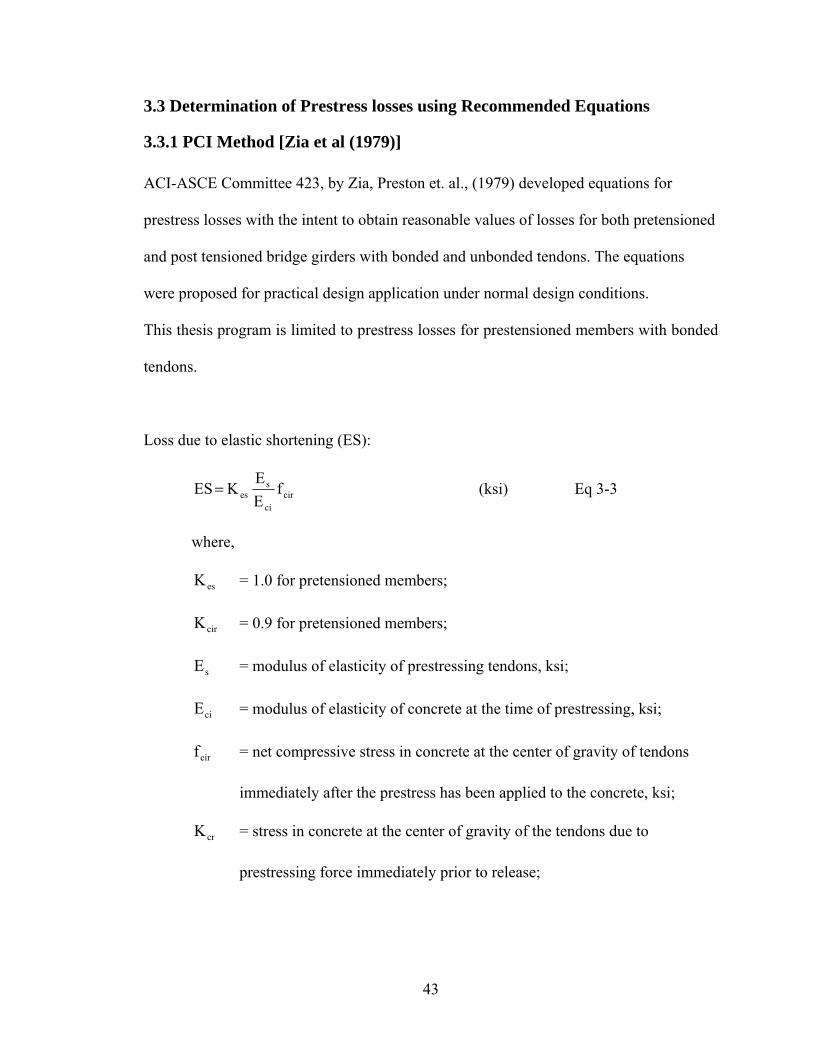
3.3 Determination of Prestress losses using Recommended Equations
3.3.1 PCI Method [Zia et al (1979)] ACI-ASCE Committee 423, by Zia, Preston et. al., (1979) developed equations for
prestress losses with the intent to obtain reasonable values of losses for both pretensioned
and post tensioned bridge girders with bonded and unbonded tendons. The equations
were proposed for practical design application under normal design conditions.
This thesis program is limited to prestress losses for prestensioned members with bonded
tendons.
Loss due to elastic shortening (ES):
circi
ses f
EE
K ES= (ksi) Eq 3-3
where,
esK = 1.0 for pretensioned members;
cirK = 0.9 for pretensioned members;
sE = modulus of elasticity of prestressing tendons, ksi;
ciE = modulus of elasticity of concrete at the time of prestressing, ksi;
cirf = net compressive stress in concrete at the center of gravity of tendons
immediately after the prestress has been applied to the concrete, ksi;
crK = stress in concrete at the center of gravity of the tendons due to
prestressing force immediately prior to release;
43

gf = stress in concrete at the center of gravity of tendons due to weight of
structure at time prestress is applied.
Loss due to creep of concrete (CR):
( cdscirci
scr f-f
EE
KCR = ) (ksi) Eq 3-4
where,
= 2.0 for pretensioned members; crK
Eci = modulus of elasticity of concrete at 28 days;
fcds = stress in concrete at the center of gravity of tendons due to all
superimposed permanent dead loads that are applied to the member after it
has been prestressed, ksi.
In this equation, the creep loss of concrete is directly proportional to the net compressive
strain in the concrete. This equation essentially adopts a creep coefficient of 2.0.
Loss due to shrinkage of concrete (SH):
( RH-100SV 0.06-1E10 x 8.2 SH s
6- ⎟⎠⎞
⎜⎝⎛= ) (ksi) Eq 3-5
Where,
= 1.0 for prestensioned members; shK
V = Volume to Surface ratio of the member, in; S
= ambient relative humidity, %. RH
44
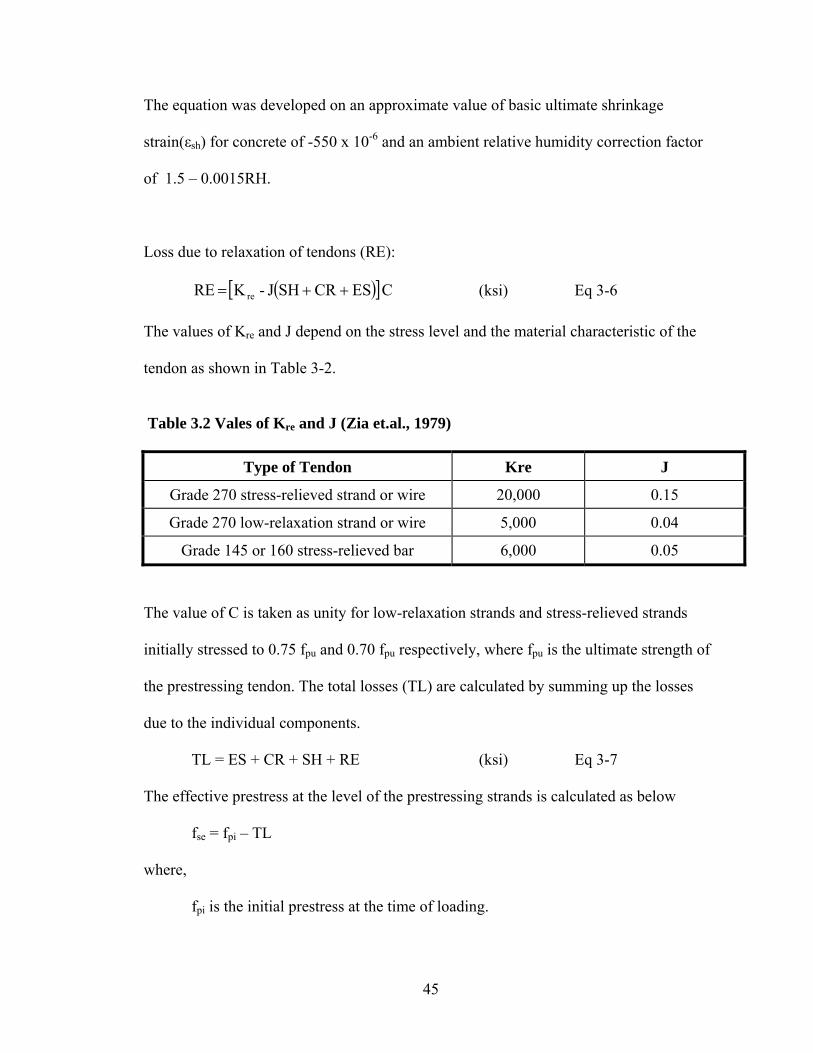
The equation was developed on an approximate value of basic ultimate shrinkage
strain(εsh) for concrete of -550 x 10-6 and an ambient relative humidity correction factor
of 1.5 – 0.0015RH.
Loss due to relaxation of tendons (RE):
([ C ESCRSHJ-K RE re )]++= (ksi) Eq 3-6
The values of Kre and J depend on the stress level and the material characteristic of the
tendon as shown in Table 3-2.
Table 3.2 Vales of Kre and J (Zia et.al., 1979)
Type of Tendon Kre J
Grade 270 stress-relieved strand or wire 20,000 0.15
Grade 270 low-relaxation strand or wire 5,000 0.04
Grade 145 or 160 stress-relieved bar 6,000 0.05
The value of C is taken as unity for low-relaxation strands and stress-relieved strands
initially stressed to 0.75 fpu and 0.70 fpu respectively, where fpu is the ultimate strength of
the prestressing tendon. The total losses (TL) are calculated by summing up the losses
due to the individual components.
TL = ES + CR + SH + RE (ksi) Eq 3-7
The effective prestress at the level of the prestressing strands is calculated as below
fse = fpi – TL
where,
fpi is the initial prestress at the time of loading.
45
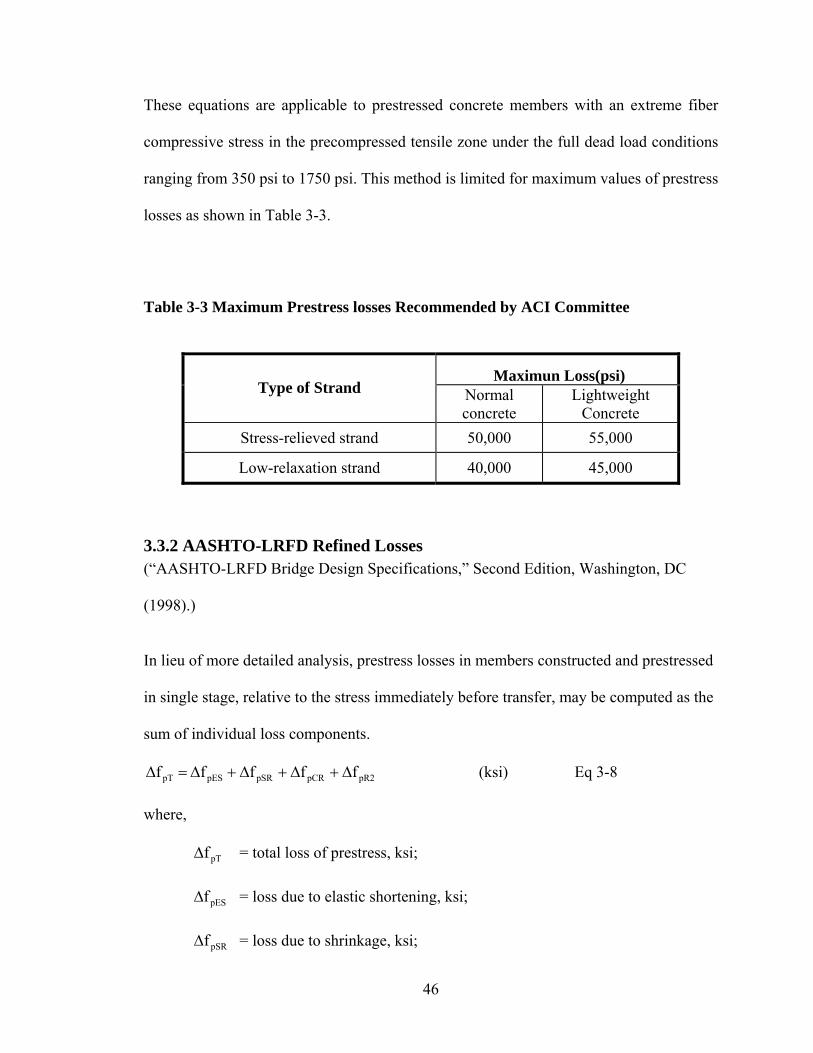
These equations are applicable to prestressed concrete members with an extreme fiber
compressive stress in the precompressed tensile zone under the full dead load conditions
ranging from 350 psi to 1750 psi. This method is limited for maximum values of prestress
losses as shown in Table 3-3.
Table 3-3 Maximum Prestress losses Recommended by ACI Committee
Maximun Loss(psi) Type of Strand Normal
concrete Lightweight
Concrete Stress-relieved strand 50,000 55,000
Low-relaxation strand 40,000 45,000
3.3.2 AASHTO-LRFD Refined Losses (“AASHTO-LRFD Bridge Design Specifications,” Second Edition, Washington, DC
(1998).)
In lieu of more detailed analysis, prestress losses in members constructed and prestressed
in single stage, relative to the stress immediately before transfer, may be computed as the
sum of individual loss components.
pR2pCRpSRpESpT ffff f Δ+Δ+Δ+Δ=Δ (ksi) Eq 3-8
where,
= total loss of prestress, ksi; pTfΔ
= loss due to elastic shortening, ksi; pESfΔ
= loss due to shrinkage, ksi; pSRfΔ
46
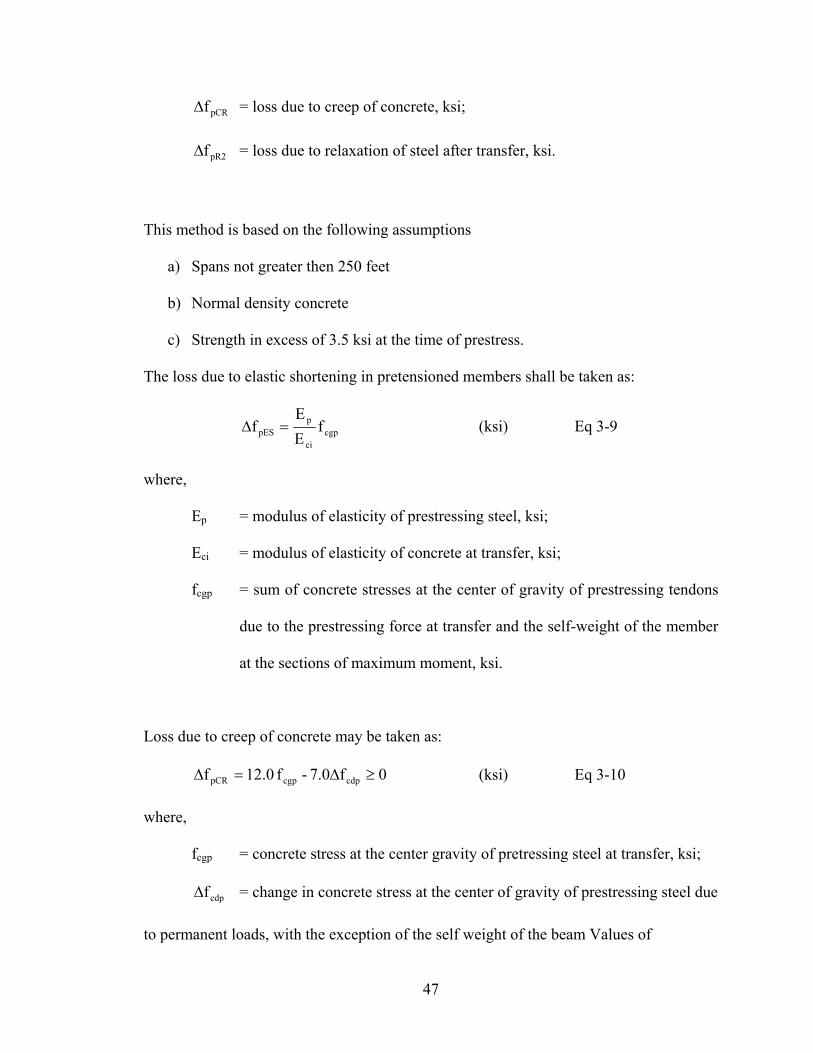
= loss due to creep of concrete, ksi; pCRfΔ
= loss due to relaxation of steel after transfer, ksi. pR2fΔ
This method is based on the following assumptions
a) Spans not greater then 250 feet
b) Normal density concrete
c) Strength in excess of 3.5 ksi at the time of prestress.
The loss due to elastic shortening in pretensioned members shall be taken as:
cgpci
ppES f
EE
f =Δ (ksi) Eq 3-9
where,
Ep = modulus of elasticity of prestressing steel, ksi;
Eci = modulus of elasticity of concrete at transfer, ksi;
fcgp = sum of concrete stresses at the center of gravity of prestressing tendons
due to the prestressing force at transfer and the self-weight of the member
at the sections of maximum moment, ksi.
Loss due to creep of concrete may be taken as:
0f7.0-f 12.0f cdpcgppCR ≥Δ=Δ (ksi) Eq 3-10
where,
fcgp = concrete stress at the center gravity of pretressing steel at transfer, ksi;
cdpfΔ = change in concrete stress at the center of gravity of prestressing steel due
to permanent loads, with the exception of the self weight of the beam Values of
47
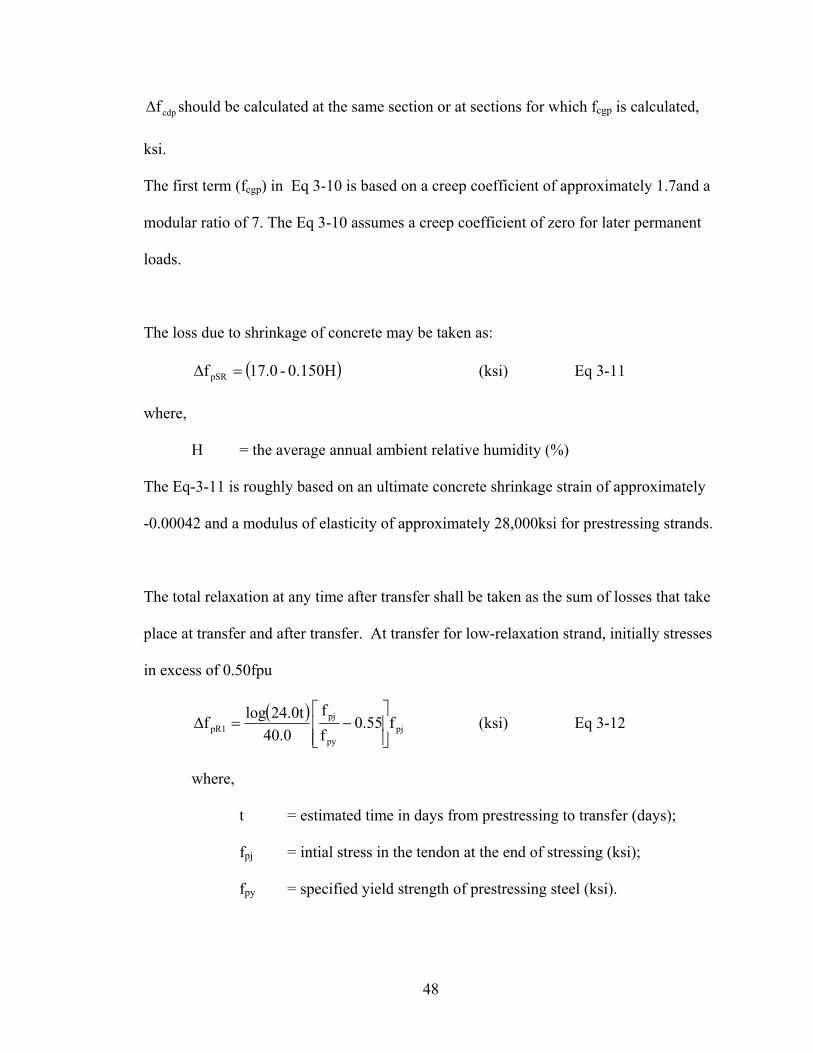
cdpfΔ should be calculated at the same section or at sections for which fcgp is calculated,
ksi.
The first term (fcgp) in Eq 3-10 is based on a creep coefficient of approximately 1.7and a
modular ratio of 7. The Eq 3-10 assumes a creep coefficient of zero for later permanent
loads.
The loss due to shrinkage of concrete may be taken as:
(ksi) Eq 3-11 ( 0.150H-17.0fpSR =Δ )
where,
H = the average annual ambient relative humidity (%)
The Eq-3-11 is roughly based on an ultimate concrete shrinkage strain of approximately
-0.00042 and a modulus of elasticity of approximately 28,000ksi for prestressing strands.
The total relaxation at any time after transfer shall be taken as the sum of losses that take
place at transfer and after transfer. At transfer for low-relaxation strand, initially stresses
in excess of 0.50fpu
( )pj
py
pjpR1 f55.0
ff
40.024.0tlogf
⎥⎥⎦
⎤
⎢⎢⎣
⎡−=Δ (ksi) Eq 3-12
where,
t = estimated time in days from prestressing to transfer (days);
fpj = intial stress in the tendon at the end of stressing (ksi);
fpy = specified yield strength of prestressing steel (ksi).
48
After transfer for low-relaxation strands may be taken as:
( )pCRpSRpESpR2 ff0.05-f0.12-6.0 f Δ+ΔΔ=Δ (ksi) Eq 3-13
3.3.3 AASHTO-LRFD Approximate Lump Sum Estimates of Time Dependent Losses. (“AASHTO-LRFD Bridge Design Specifications,” Second Edition, Washington, DC
(1998).)
Table 3-4 specifies the approximate lump sum estimates of time-dependent losses
resulting from creep, shrinkage of concrete, relaxation of steel in prestressed, partially
pretressed members. The losses due to elastic shortening should be added to the time-
dependent losses to obtain the total losses.
The satisfaction of the following conditions is required:
a) pretensioned members are stressed after attaining a compressive strength
of 3.5 fci,
b) members are made from normal weight concrete,
c) the concrete is either steam or moist-cured,
d) prestressing is by bars or strands with normal and low relaxation
properties, and
e) the exposure and temperature conditions are average. More accurate
estimates shall be used for unusual exposure.
49

This method reflects the values and trends obtained from a computerized time-step
analysis of a large number of bridges and building members designed for a common
range of variables a specified below:
a) ultimate concrete creep coefficient ranging from 1.6 to 2.4;
b) ultimate concrete shrinkage coefficient ranging from 0.0004 to
0.0006(in/in);
c) ambient relative humidity ranging from 40 to 100 percent;
d) moist-curing or steam curing of concrete, and
e) a partial prestressing ratio ranging from 0.2 to 1.0.
where,
( )yspypspyps fAfAfAPPR += ksi Eq 3-13
PPR = partial prestressing ratio;
As = area of non-prestressed tension reinforcement,in2;
Aps = area of prestressed steel, in2;
fy = specified yield strength of reinforcing bars, ksi;
fpy = yield strength of prestressing steel, ksi.
50

Table 3-4 AASHTO-LRFD Lump-Sum Estimate of time dependent losses, ksi. (“AASHTO-LRFD Bridge Design Specifications,” Second Edition, Washington, DC
(1998).)
Type of Beam Section Level For wire and strands with
fpu=235,250 or 270 ksi For Bars with fpu=145 or
160ksi
Upper 29+4 PPR
Bound Rectangular Beams, Solid Slab
Average 26+4 PPR
19+6 PPR
Upper 21+4 PPR
Bound Box Girder
Average 19+4 PPR
15
I-Grirder Average 33[1-0.15(fc-6)/6]+6PPR 19+6 PPR
Upper 39[1-0.15(fc-6)/6]+6PPR
Bound Single T,Double T, Hollow Core and Voided Slab Average 33[1-0.15(fc-6)/6]+6PPR
31[1-0.15(fc-6)/6]+6PPR
3.3.4 NCHRP 496 Detailed Prestress Losses [Tadros et al (2003)] The detailed losses procedure proposed by the National Cooperative Highway Research
Program (NCHRP) Report 496, by Tadros, et al(2003) make use of the aging coefficient
approach for the computation of losses between the transfer and casting of the decks.
The method covers the composite action between the precast concrete girders and cast-in-
place deck slab. The prestress losses are computed in four stages:
a) Instantaneous prestress loss due to elastic shortening at transfer, ΔfpES
b) Long-term prestress losses due to shrinkage of concrete, (ΔpSR)id, and
creep of concrete, (ΔfpCR)id and relaxation of prestressing strands, (ΔfpR2)id,
between the time of transfer and jus t before deck placement.
51

c) Instantaneous prestress gain due to the placement of deck weight and
SIDL, ΔfpED.
d) Long-term prestress losses between the time of deck placement and the
final service life of the structure, due to shrinkage of the girder, (ΔfpSD)df
creep of the girder, (ΔfpCD1 + ΔfpCD2 )df, relaxation of prestressing strands,
(ΔfpR3)df, and shrinkage of deck concrete, (ΔfpSS)df.
The total prestress losses in the prestensioned bridge girder is given by:
( ) ( )dfpSSpR3pCD2pCD1pSDpEDidpR2pCRpSRpESpT fffffffffff Δ−Δ+Δ+Δ+Δ+Δ−Δ+Δ+Δ+Δ=Δ
ksi Eq 3-14
The loss due to elastic shortening is given by:
cgpipES fnf =Δ ksi Eq 3-15
where,
ni = Ep/Eci;
fcgp = concrete stress at the center of gravity of the prestressing force;
= ti
ptig
ti
2pti
tii I
eMIe
A1P −⎟
⎟⎠
⎞⎜⎜⎝
⎛+ ksi Eq 3-16
Pi = initial prestressing force just before release, kips;
Ati = initial transformed area of cross section at release, in2;
Iti = initial transformed moment of inertia, in4;
epti = initial eccentricity of strands with respect to the transformed
cross section, in;
Mg = maximum moment due to self weight of the girder, kip-in.
52
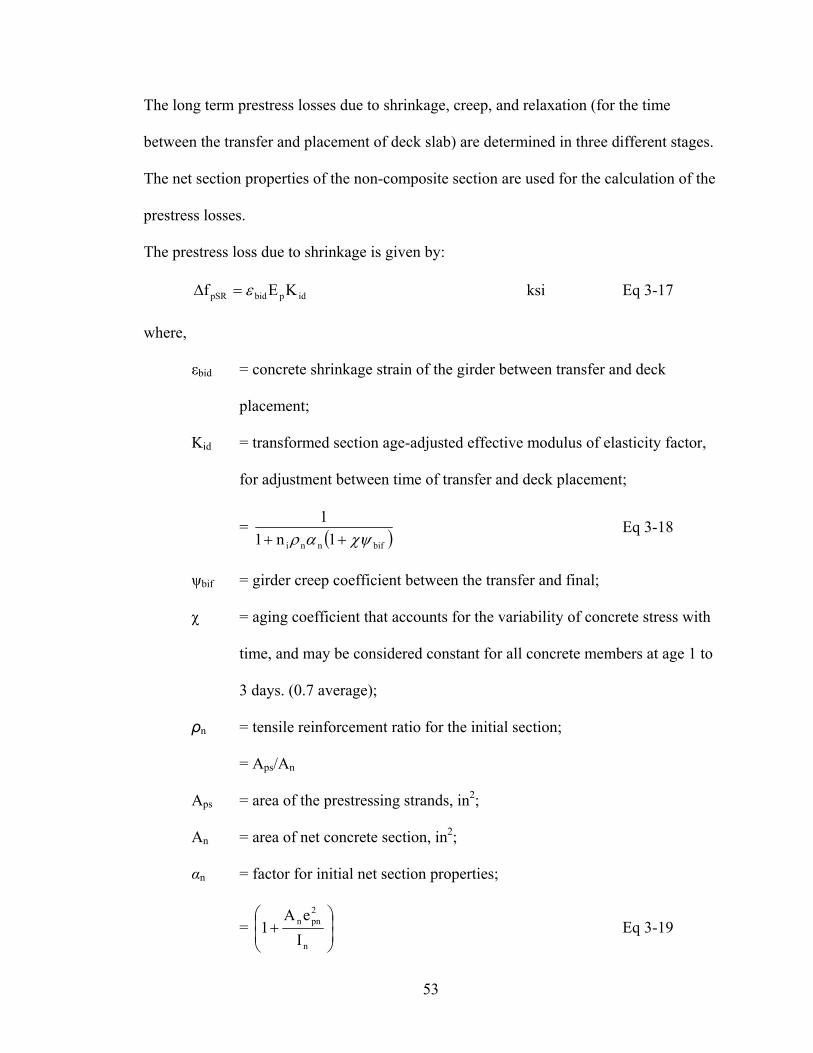
The long term prestress losses due to shrinkage, creep, and relaxation (for the time
between the transfer and placement of deck slab) are determined in three different stages.
The net section properties of the non-composite section are used for the calculation of the
prestress losses.
The prestress loss due to shrinkage is given by:
idpbidpSR KEf ε=Δ ksi Eq 3-17
where,
εbid = concrete shrinkage strain of the girder between transfer and deck
placement;
Kid = transformed section age-adjusted effective modulus of elasticity factor,
for adjustment between time of transfer and deck placement;
= ( )bifnni 1n11
χψαρ ++ Eq 3-18
ψbif = girder creep coefficient between the transfer and final;
χ = aging coefficient that accounts for the variability of concrete stress with
time, and may be considered constant for all concrete members at age 1 to
3 days. (0.7 average);
ρn = tensile reinforcement ratio for the initial section;
= Aps/An
Aps = area of the prestressing strands, in2;
An = area of net concrete section, in2;
αn = factor for initial net section properties;
= ⎟⎟⎠
⎞⎜⎜⎝
⎛+
n
2pnn
IeA
1 Eq 3-19
53
epn = eccentricity of the prestressing strands with respect to net concrete
section, in;
In = moment of inertia of the net concrete section, in4.
The loss due to concrete creep is given by:
idbidcgpipCR Kfnf ψ=Δ (ksi) Eq 3-20
where,
ψbid = girder creep coefficient between the transfer and deck placement.
Prestress loss due to relaxation of prestressing strands is given by:
idiipR2 KLf φ=Δ (ksi) Eq 3-21
where,
øi = reduction factor that reflects he steady decrease in strand prestressing
due to creep and shrinkage of concrete;
= ( )
po
pCRpSR
fff3
-1Δ+Δ
(ksi) Eq 3-22
Li = [ popypoi
d f55.0ff45124t124t
log −⎥⎦
⎤⎢⎣
⎡⎟⎟⎠
⎞⎜⎜⎝
⎛++ ] (ksi) Eq 3-23
= intrinsic relaxation loss between transfer and placement of deck slab;
fpo = stress in the prestressing strands just after release, ksi;
td = age of the concrete after the placement of deck, days;
ti = age of the concrete at the time of transfer, days.
Since the relaxation loss of the low-relaxation strands is very small ranging from 1.5 ksi
to 4.0 ksi, a constant value of 2.4ksi is assumed. This value is equally split between the
54
two time stages, transfer to the deck placement and deck placement to final. The deck
weight on the non-composite section and the superimposed dead loads on the composite
section cause instantaneous elastic prestress gain. The method states that proper
accounting of elastic losses produces more refined results regardless of the use of
transformed or gross section properties. Separate calculations of elastic losses at transfer
and gain increments at the different loading stages are required when gross section
properties are used. The explicit calculation of this prestress gain is not necessary
provided the stress analysis using the transformed cross section properties is
automatically takes into account for the change in stress in the steel component.
The long term prestress losses between the time of the deck placement and the final stage
are determined in five stages: the shrinkage, creep of concrete, relaxation of prestressing
strands, concrete deck shrinkage between the time of deck placement and the final service
life of the structure. These long term losses are calculated using composite cross section
properties of the girder.
The loss due to shrinkage of the concrete is given by:
dfpbdfpSD KEf ε=Δ (ksi) Eq 3-24
where,
εbdf = concrete shrinkage strain of the girder between deck placement and
final;
Kdf = the transformed cross section factor based on the age-adjusted effective
55
modulus of elasticity of concrete. It is used to adjust the small gain in steel
stress stress resulting from the continuous interaction between concrete
and
steel components of the member, between the time of deck placement and
the final time;
= ( )bifncnci 1n11
χψαρ ++ Eq 3-25
ρnc = tensile reinforcement ratio for the net composite section;
= Aps/Anc
Anc = net area of the composite cross section, in2;
αnc = factor for the net composite section properties;
= ⎟⎟⎠
⎞⎜⎜⎝
⎛+
nc
2pncnc
IeA
1 Eq 3-26
epnc = eccentricity of the prestressing strands with respect to net composite
concrete section at service, in;
Inc = moment of inertia of the net composite concrete section, in4.
The prestress loss due to the creep of the composite girder cross section caused by
initial prestressing and self-weight is given by:
( dfbidbifcgpipCD1 K-fnf )ψψ=Δ (ksi) Eq 3-27
The prestress loss due to creep of the composite section caused by deck weight and
superimposed dead loads is given by:
56
dfbdfcdppCD2 Kfnf ψΔ=Δ (ksi) Eq 3-28
n = Ep/Ec;
Ec = modulus of elasticity of concrete at the time of the placement of the deck
superimposed dead loads, ksi;
Δfcdp = change in concrete stress at the center of prestressing strands due to
long-term losses between transfer and deck placement caused by the deck
weight on non-composite section and superimposed dead load on
composite section;
Ψbdf = ultimate creep coefficient at the time of the placement of deck.
The relaxation loss due to prestressing steel between the time of deck placement and final
time can either be calculated in a similar manner or a constant value of 2.4ksi may be
assumed for the total loss due to steel relaxation.
The prestress gain due to shrinkage of deck in the composite section is given by:
( bdfdfcdfpSS 1Kfnf )χψ+Δ=Δ (ksi) Eq 3-29
where,
Δfcdf = change in concrete stress at the centroid of prestressing strands due the
shrinkage of deck concrete, ksi;
= ( ) ( ) ⎥⎦
⎤⎢⎣
⎡+
−⎥⎦
⎤⎢⎣
⎡+ ddfnc
pncdccddddf
ddfnc
cddddf
1IeeEA
1AEA
χψε
χψε (ksi) Eq 3-30
εddf = shrinkage strain of the deck concrete between placement and the final
time, in/in;
57

edc = deck eccentricity with respect to transformed composite section at the
time of application of superimposed dead loads, in (always taken as
negative);
ψddf = deck creep coefficient at the time of deck loading.
3.3.5 NCHRP 496 Approximate Prestress Losses [Tadros et al (2003)] The approximate method was proposed based on a parametric study of prestressed
concrete bridges. The total long term prestress losses is given by:
2.512AAf
10.0f sthsthg
pspipLT ++⎟
⎟⎠
⎞⎜⎜⎝
⎛=Δ γγγγ (ksi) Eq 3-31
where,
γh = humidity correction factor;
= 0.01H Eq 3-32 7.1 −
γst = concrete strength correction factor;
= 'cif1
5+
Eq 3-33
fpi = initial prestressing stress in steel, ksi;
Aps = area of prestressing steel, in2;
Ag = gross cross sectional area of girder cross section, in2.
58

3.4 Equations Using Time Dependent Creep Effects This method initially follows a similar procedure as the Time Step prestress loss method.
The time was divided into intervals where the duration of each time interval is made
larger as the age of concrete increases. The prestress losses and the stresses in the
concrete at the end of each interval were calculated. The calculated stresses include the
elastic stresses due to prestress, gravity loads and sustained loads along with the time
dependent effects due to creep of concrete. After slab casting, the whole composite
section of concrete is treated as an elastic material. The elastic stresses and the stresses
due to creep strain in concrete were individually calculated. The proposed AASHTO
LRFD Time Step method was developed based on the prevailing AASHTO LRFD time
dependent coefficients for the determination of prestress losses and deflection in
prestressed concrete bridges.
3.4.1 AASHTO LRFD Time Step method This method makes use of the AASHTO LRFD time dependent correction factors and the
equations for the prediction of losses. Prestress losses and the camber and deflection of
the girder have been determined on a day to day basis from a time period of t = 1 day to t
= 10,000 days.
3.4.1.1 Creep Strain and Creep Coefficient
The sustained and the gravity loads at the initial stages of loading result in the elastic
strain. Creep strain is the additional strain that has developed with time due to creep of
59
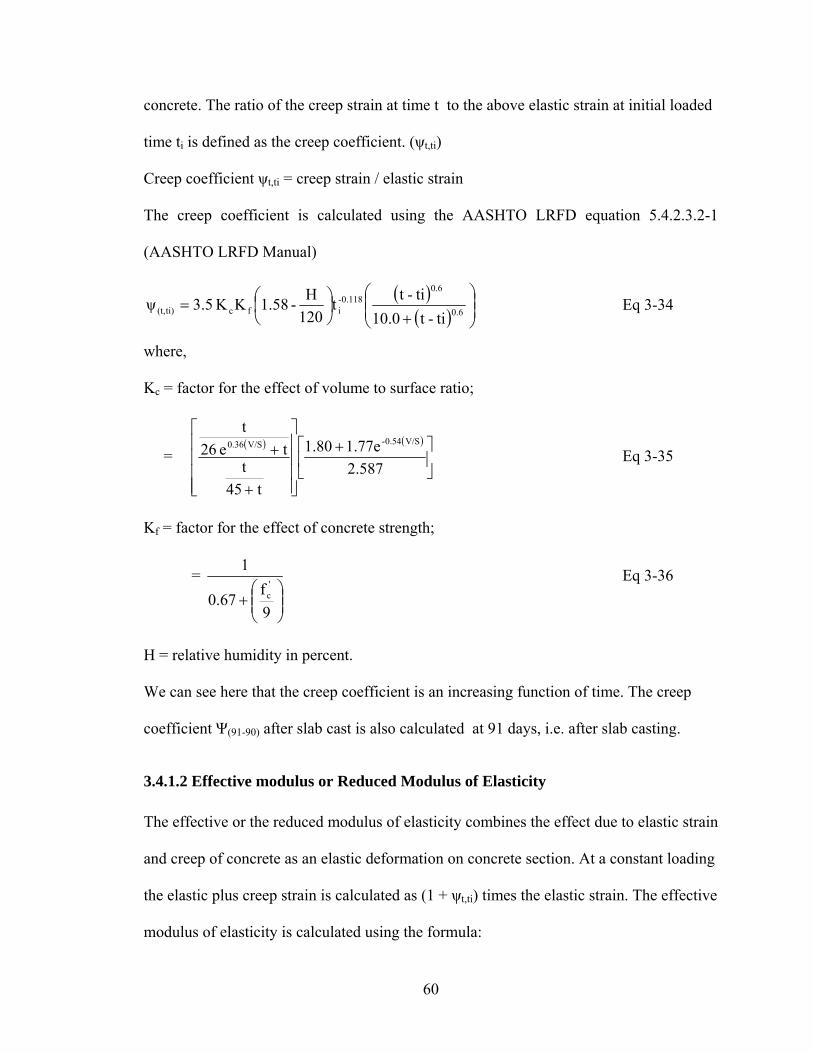
concrete. The ratio of the creep strain at time t to the above elastic strain at initial loaded
time ti is defined as the creep coefficient. (ψt,ti)
Creep coefficient ψt,ti = creep strain / elastic strain
The creep coefficient is calculated using the AASHTO LRFD equation 5.4.2.3.2-1
(AASHTO LRFD Manual)
( )( ) ⎟⎟
⎠
⎞⎜⎜⎝
⎛
+⎟⎠⎞
⎜⎝⎛= 6.0
6.00.118-
ifcti)(t, ti-t10.0ti-tt
120H-1.58KK 3.5ψ Eq 3-34
where,
Kc = factor for the effect of volume to surface ratio;
= ( ) ( )
⎥⎦
⎤⎢⎣
⎡ +
⎥⎥⎥⎥
⎦
⎤
⎢⎢⎢⎢
⎣
⎡
+
+2.5871.77e1.80
t45t
te 26t
V/S0.54-V/S0.36 Eq 3-35
Kf = factor for the effect of concrete strength;
=
⎟⎟⎠
⎞⎜⎜⎝
⎛+
9f
67.0
1'c
Eq 3-36
H = relative humidity in percent.
We can see here that the creep coefficient is an increasing function of time. The creep
coefficient Ψ(91-90) after slab cast is also calculated at 91 days, i.e. after slab casting.
3.4.1.2 Effective modulus or Reduced Modulus of Elasticity
The effective or the reduced modulus of elasticity combines the effect due to elastic strain
and creep of concrete as an elastic deformation on concrete section. At a constant loading
the elastic plus creep strain is calculated as (1 + ψt,ti) times the elastic strain. The effective
modulus of elasticity is calculated using the formula:
60
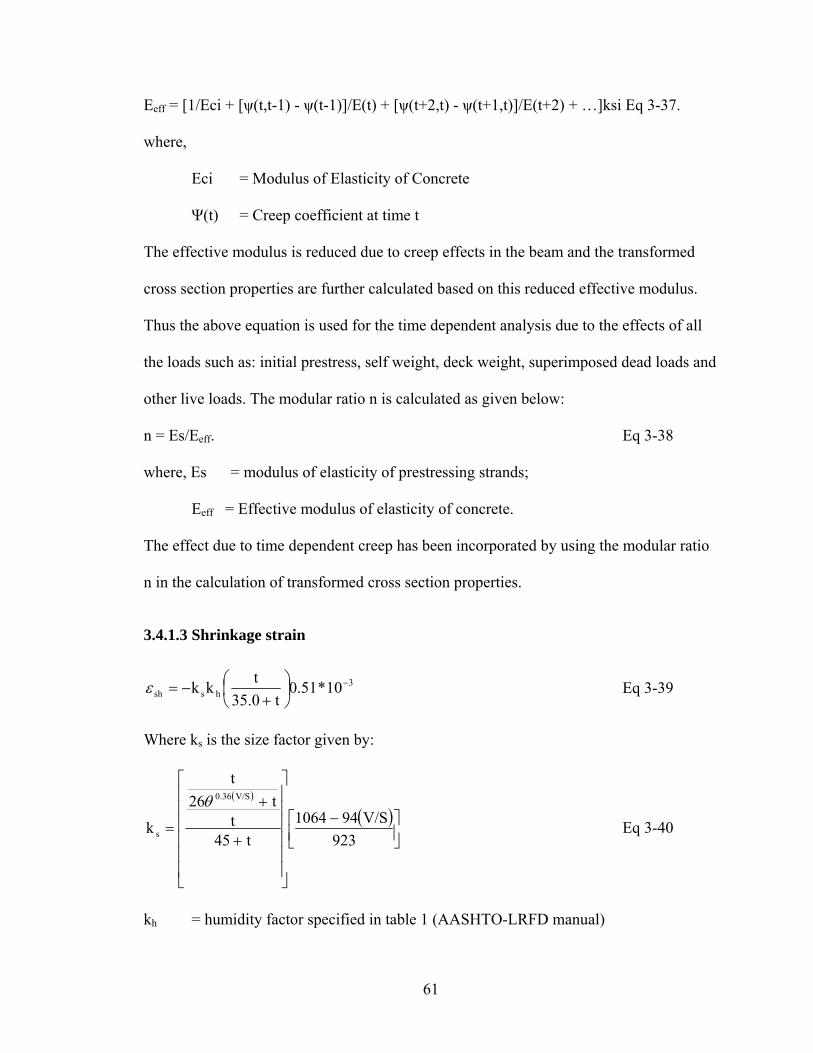
Eeff = [1/Eci + [ψ(t,t-1) - ψ(t-1)]/E(t) + [ψ(t+2,t) - ψ(t+1,t)]/E(t+2) + …]ksi Eq 3-37.
where,
Eci = Modulus of Elasticity of Concrete
Ψ(t) = Creep coefficient at time t
The effective modulus is reduced due to creep effects in the beam and the transformed
cross section properties are further calculated based on this reduced effective modulus.
Thus the above equation is used for the time dependent analysis due to the effects of all
the loads such as: initial prestress, self weight, deck weight, superimposed dead loads and
other live loads. The modular ratio n is calculated as given below:
n = Es/Eeff. Eq 3-38
where, Es = modulus of elasticity of prestressing strands;
Eeff = Effective modulus of elasticity of concrete.
The effect due to time dependent creep has been incorporated by using the modular ratio
n in the calculation of transformed cross section properties.
3.4.1.3 Shrinkage strain
3hssh 10*51.0
t35.0tkk −⎟
⎠⎞
⎜⎝⎛
+−=ε Eq 3-39
Where ks is the size factor given by:
( )
( )⎥⎦⎤
⎢⎣⎡ −
⎥⎥⎥⎥⎥⎥
⎦
⎤
⎢⎢⎢⎢⎢⎢
⎣
⎡
+
+
=923
V/S941064t45
tt26
t
k
V/S0.36
s
θ
Eq 3-40
kh = humidity factor specified in table 1 (AASHTO-LRFD manual)
61
The relative humidy (RH) , volume to surface ratio(V/S) of the girder and are specified
in the Spread sheet.
3.4.1.4 Prestress Loss Equations
The prestress losses were found using the creep and shrinkage strains for AASHTO
LRFD given in section 3.4.1.2.
Elastic Shortening
The Elastic Shortening ES is calculated as given below:
ES = n * fcir Eq 3-41
where,
n = modulus of elasticity of concrete;
cirf = net compressive stress in concrete at the center of gravity of tendons
immediately after the prestress has been applied to the concrete, ksi.
The fcir is calculated in two stages, from initial to slab casting and after slab casting. The
calculation of fcir for the loading stage after slab casting, utilizes the composite
transformed cross section properties of concrete calculated with the use of effective
modulus. The Elastic shortering loss at the day of slab cast, (ie at 90 days) is reduced due
to the creep effect in the beam.
Creep loss
The creep loss is a function of various time dependent factors including the volume to
surface ratio, relative humidity and age of concrete at the time of loading. Incremental
creep strains are computed daily using the formula:
( ) ( )[ ] ( )[ ] ( )[ ]1,1-tt,11-tft circr ψψε −=Δ Eq 3-42
where,
62

Δεcr(t) = incremental ceep strain at time t;
Ψ(t,ti) = creep coefficient calculated using Eq 3-34.
The creep loss is calculated as given below:
CR(t) = CR(t-1) + Δεcr(t) * 0.0285 Eq 3-43
Shrinkage Loss
The shrinkage of concrete also depends on the volume to surface ratio and relative
humidity, but is independent of the of the loading and is caused primarily due to
shrinkage of cement paste. The shrinkage loss is calculated as given below:
SH = Es*Єsh Eq 3-44
Where Es = modulus of elasticity of prestressing steel;
Єsh = shrinkage strain is calculated as given by Eq 3-39.
Relaxation Loss
Low relaxation strands are most widely used in prestressed girders. The relaxation loss is
based of the formula in the AASHTO LRFD equation:
RE = ( )pj
py
pi f 55.0ff
40t*0.24log
⎭⎬⎫
⎩⎨⎧ − Eq 3-44
Where, fpi = initial prestress at transfer
fpy = specified yield strength of prestressing steel
Total Loss TL = ES +CR + SH + CR +RE.
The total loss is calculated by summing up the losses for each day and the prestress, fse
and the corresponding prestress force Fse is calculated for each stage of loading.
63
3.4.1.5 Concrete stresses and strains:
The top fiber stress, (ft) and bottom fiber stresses (fb) have been calculated for each day
of loading. The corresponding strains Єt = ft/Eeff, Єb = fb/Eeff are also calculated for the
respective stresses. The models presume that the slab is cast after 90 days and after 90
days the slab is assumed to be cast on a beam transformed to an elastic concrete. The
composite transformed cross section properties of concrete are calculated after 90 days of
slab cast.
After slab cast the additional strain due to creep is calculated by applying a resultant
force on the composite cross section of the beam. The resultant force is calculated from
the change in stress at time (t) due to creep in the beam. The final concrete strains at t=
10,000 days includes: the strain due to the prestressing force, gravity loads, slab wt ,
super imposed live load (S.D.L) , live loads and the additional strain due to time
dependent creep.
3.4.1.6 Camber/ Deflection
The camber and deflection of the beam due to prestress and gravity loads were directly
computed from the curvature due to concrete strains using moment area method. After
slab cast the camber due to the additional creep strain is also included in the final
deflection.
The camber was also calculated using the PCI Design Handbook method (as shown in
Table 3-5) in which simple span multipliers were used for the calculation of long term
64
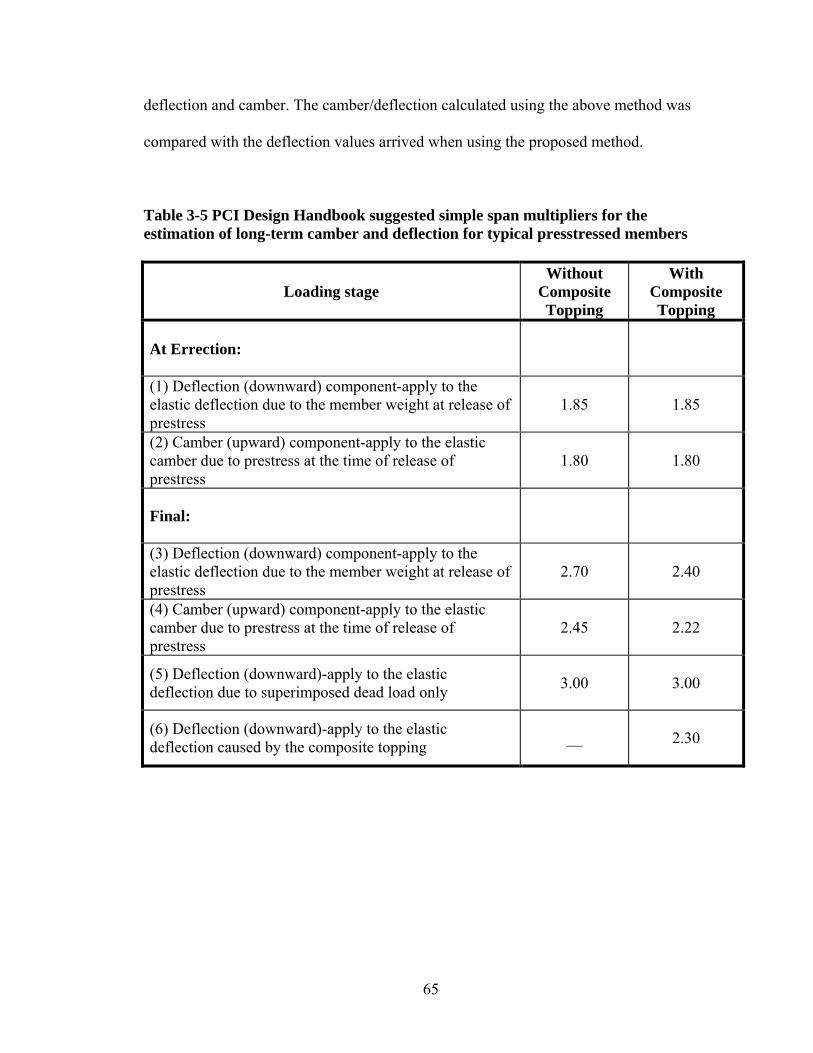
deflection and camber. The camber/deflection calculated using the above method was
compared with the deflection values arrived when using the proposed method.
Table 3-5 PCI Design Handbook suggested simple span multipliers for the estimation of long-term camber and deflection for typical presstressed members
Loading stage Without
Composite Topping
With Composite Topping
At Errection:
(1) Deflection (downward) component-apply to the elastic deflection due to the member weight at release of prestress
1.85 1.85
(2) Camber (upward) component-apply to the elastic camber due to prestress at the time of release of prestress
1.80 1.80
Final:
(3) Deflection (downward) component-apply to the elastic deflection due to the member weight at release of prestress
2.70 2.40
(4) Camber (upward) component-apply to the elastic camber due to prestress at the time of release of prestress
2.45 2.22
(5) Deflection (downward)-apply to the elastic deflection due to superimposed dead load only 3.00 3.00
(6) Deflection (downward)-apply to the elastic deflection caused by the composite topping __ 2.30
65
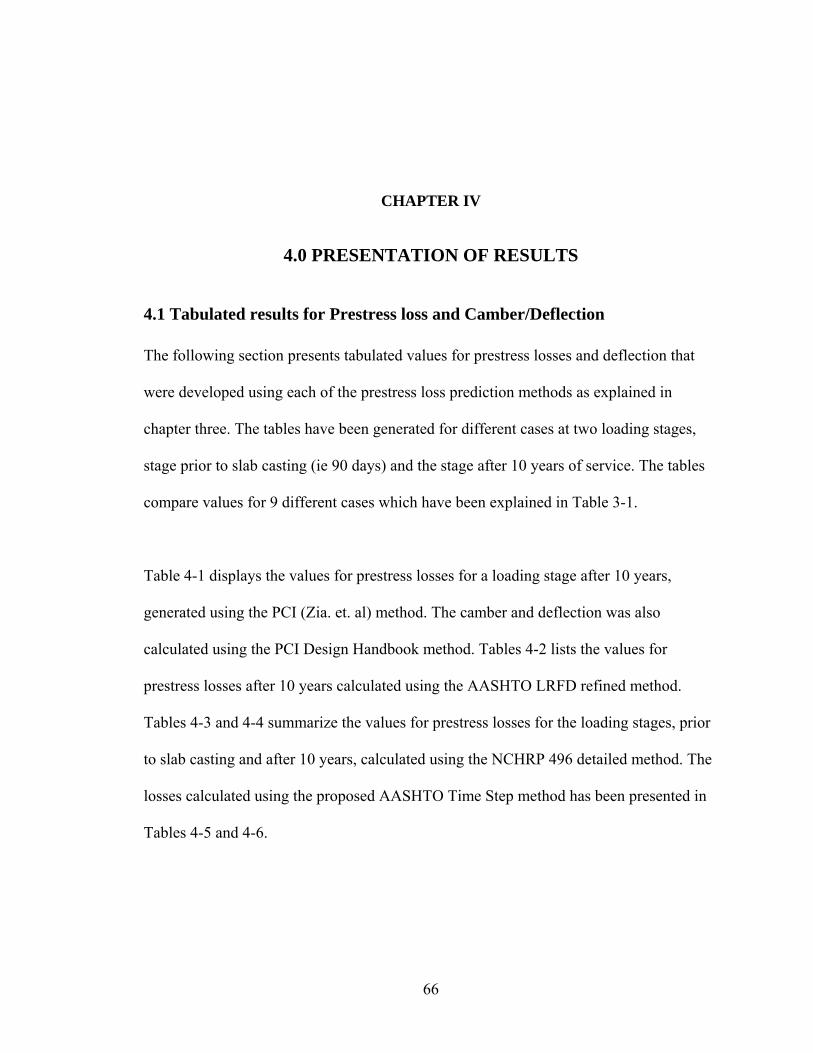
66
CHAPTER IV
4.0 PRESENTATION OF RESULTS
4.1 Tabulated results for Prestress loss and Camber/Deflection The following section presents tabulated values for prestress losses and deflection that
were developed using each of the prestress loss prediction methods as explained in
chapter three. The tables have been generated for different cases at two loading stages,
stage prior to slab casting (ie 90 days) and the stage after 10 years of service. The tables
compare values for 9 different cases which have been explained in Table 3-1.
Table 4-1 displays the values for prestress losses for a loading stage after 10 years,
generated using the PCI (Zia. et. al) method. The camber and deflection was also
calculated using the PCI Design Handbook method. Tables 4-2 lists the values for
prestress losses after 10 years calculated using the AASHTO LRFD refined method.
Tables 4-3 and 4-4 summarize the values for prestress losses for the loading stages, prior
to slab casting and after 10 years, calculated using the NCHRP 496 detailed method. The
losses calculated using the proposed AASHTO Time Step method has been presented in
Tables 4-5 and 4-6.
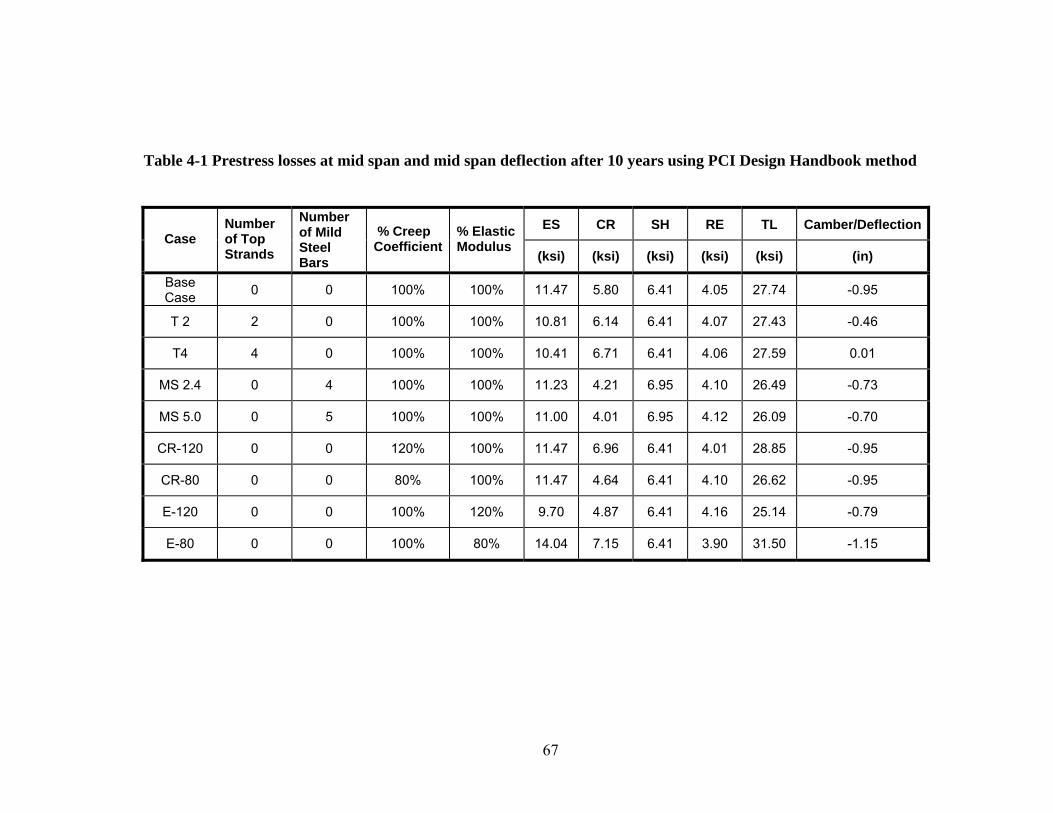
Table 4-1 Prestress losses at mid span and mid span deflection after 10 years using PCI Design Handbook method
ES CR SH RE TL Camber/DeflectionCase
Number of Top Strands
Number of Mild Steel Bars
% Creep Coefficient
% Elastic Modulus
(ksi) (ksi) (ksi) (ksi) (ksi) (in)
Base Case 0 0 100% 100% 11.47 5.80 6.41 4.05 27.74 -0.95
T 2 2 0 100% 100% 10.81 6.14 6.41 4.07 27.43 -0.46
T4 4 0 100% 100% 10.41 6.71 6.41 4.06 27.59 0.01
MS 2.4 0 4 100% 100% 11.23 4.21 6.95 4.10 26.49 -0.73
MS 5.0 0 5 100% 100% 11.00 4.01 6.95 4.12 26.09 -0.70
CR-120 0 0 120% 100% 11.47 6.96 6.41 4.01 28.85 -0.95
CR-80 0 0 80% 100% 11.47 4.64 6.41 4.10 26.62 -0.95
E-120 0 0 100% 120% 9.70 4.87 6.41 4.16 25.14 -0.79
E-80 0 0 100% 80% 14.04 7.15 6.41 3.90 31.50 -1.15
67
Table 4-2 Prestress losses at mid span after 10 years using AASHTO LRFD (1998) refined equations.
ES CR SH RE TL Case
Number of Top Strands
Number of Mild Steel Bars
% Creep Coefficient
% Elastic Modulus
ksi ksi ksi ksi ksi
Base Case 0 0 100% 100% 11.47 13.77 7.25 3.57 36.06
T 2 2 0 100% 100% 10.81 13.48 7.25 3.67 35.21
T4 4 0 100% 100% 10.41 13.57 7.25 3.71 34.94
MS 2.4 0 4 100% 100% 11.23 13.41 7.25 3.62 35.51
MS 5.0 0 5 100% 100% 11.00 13.07 7.25 3.66 34.98
CR-120 0 0 120% 100% 11.47 18.31 7.25 3.35 40.37
CR-80 0 0 80% 100% 11.47 9.23 7.25 3.80 31.75
E-120 0 0 100% 120% 9.70 13.94 7.25 3.78 34.66
E-80 0 0 100% 80% 14.04 13.51 7.25 3.28 38.08
68
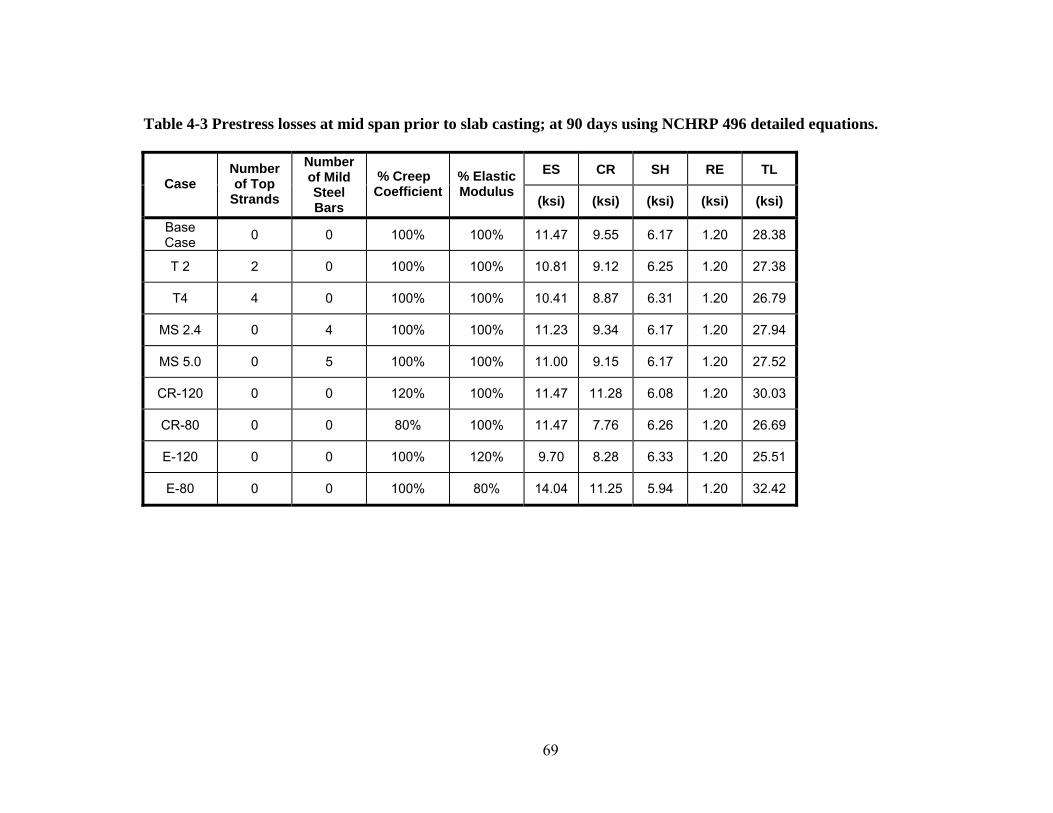
Table 4-3 Prestress losses at mid span prior to slab casting; at 90 days using NCHRP 496 detailed equations.
ES CR SH RE TL Case
Number of Top
Strands
Number of Mild Steel Bars
% Creep Coefficient
% Elastic Modulus
(ksi) (ksi) (ksi) (ksi) (ksi)
Base Case 0 0 100% 100% 11.47 9.55 6.17 1.20 28.38
T 2 2 0 100% 100% 10.81 9.12 6.25 1.20 27.38
T4 4 0 100% 100% 10.41 8.87 6.31 1.20 26.79
MS 2.4 0 4 100% 100% 11.23 9.34 6.17 1.20 27.94
MS 5.0 0 5 100% 100% 11.00 9.15 6.17 1.20 27.52
CR-120 0 0 120% 100% 11.47 11.28 6.08 1.20 30.03
CR-80 0 0 80% 100% 11.47 7.76 6.26 1.20 26.69
E-120 0 0 100% 120% 9.70 8.28 6.33 1.20 25.51
E-80 0 0 100% 80% 14.04 11.25 5.94 1.20 32.42
69
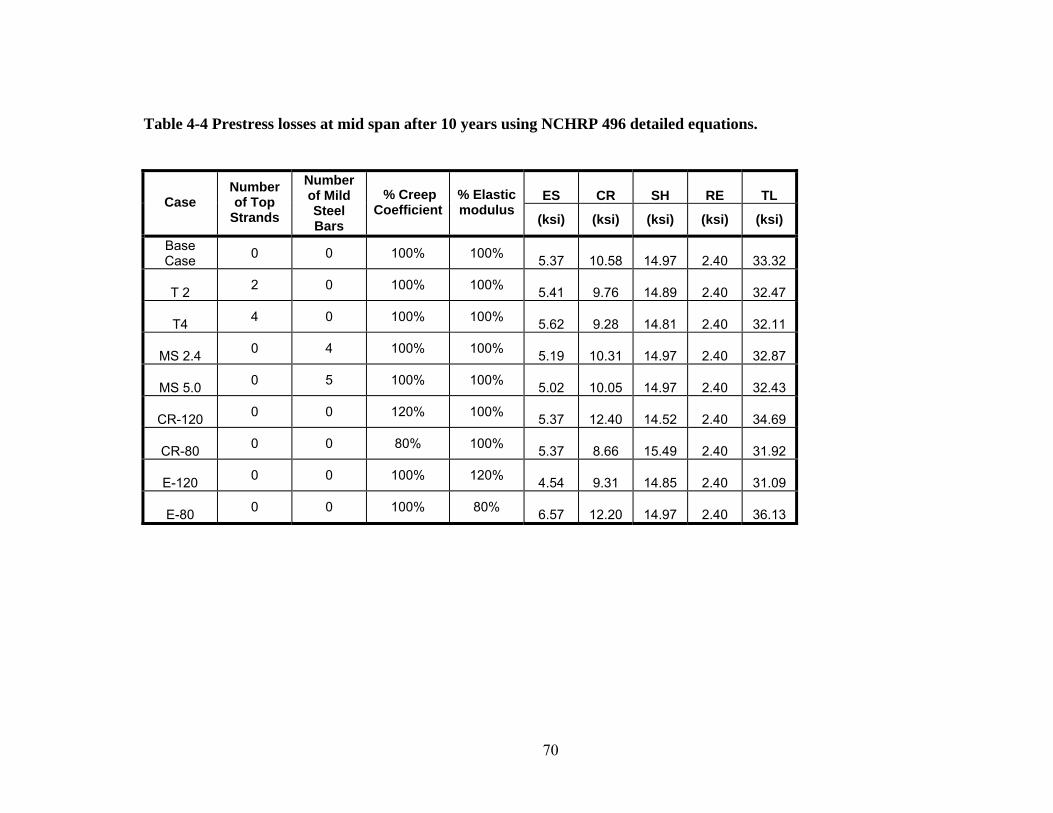
Table 4-4 Prestress losses at mid span after 10 years using NCHRP 496 detailed equations.
ES CR SH RE TL Case Number of Top
Strands
Number of Mild Steel Bars
% Creep Coefficient
% Elastic modulus
(ksi) (ksi) (ksi) (ksi) (ksi)
Base Case 0 0 100% 100% 5.37 10.58 14.97 2.40 33.32
T 2 2 0 100% 100% 5.41 9.76 14.89 2.40 32.47
T4 4 0 100% 100% 5.62 9.28 14.81 2.40 32.11
MS 2.4 0 4 100% 100% 5.19 10.31 14.97 2.40 32.87
MS 5.0 0 5 100% 100% 5.02 10.05 14.97 2.40 32.43
CR-120 0 0 120% 100% 5.37 12.40 14.52 2.40 34.69
CR-80 0 0 80% 100% 5.37 8.66 15.49 2.40 31.92
E-120 0 0 100% 120% 4.54 9.31 14.85 2.40 31.09
E-80 0 0 100% 80% 6.57 12.20 14.97 2.40 36.13
70
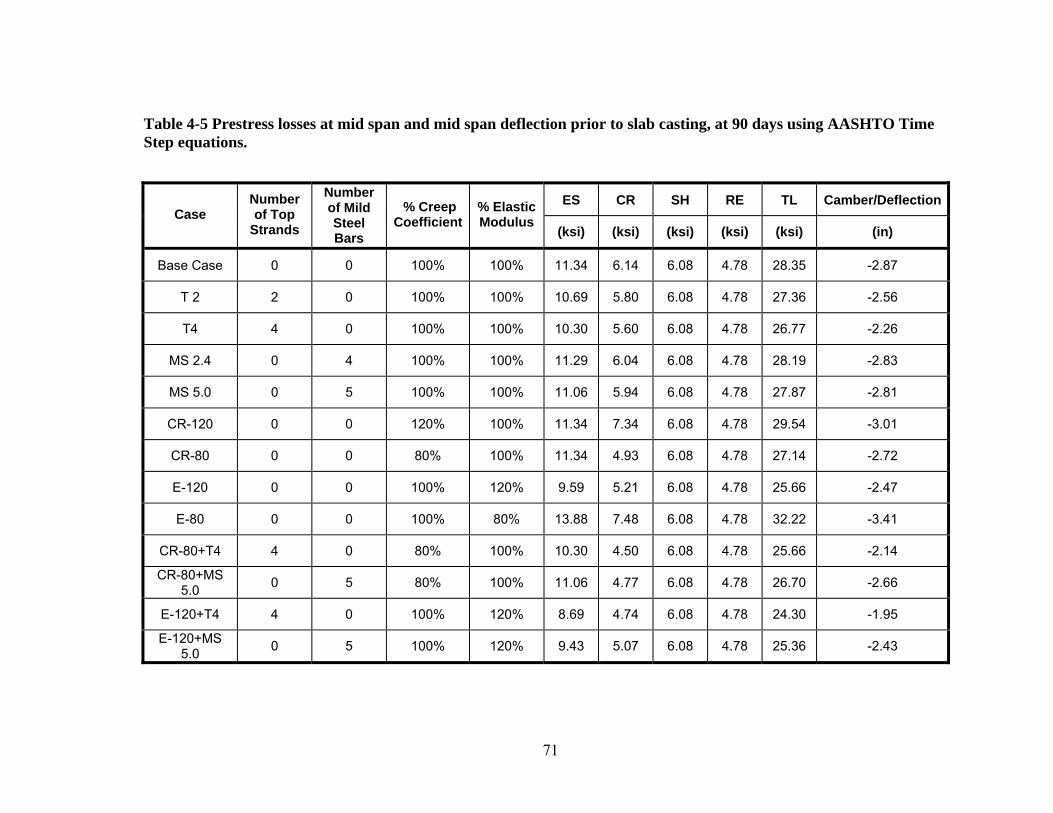
Table 4-5 Prestress losses at mid span and mid span deflection prior to slab casting, at 90 days using AASHTO Time Step equations.
ES CR SH RE TL Camber/DeflectionCase
Number of Top
Strands
Number of Mild Steel Bars
% Creep Coefficient
% Elastic Modulus
(ksi) (ksi) (ksi) (ksi) (ksi) (in)
Base Case 0 0 100% 100% 11.34 6.14 6.08 4.78 28.35 -2.87
T 2 2 0 100% 100% 10.69 5.80 6.08 4.78 27.36 -2.56
T4 4 0 100% 100% 10.30 5.60 6.08 4.78 26.77 -2.26
MS 2.4 0 4 100% 100% 11.29 6.04 6.08 4.78 28.19 -2.83
MS 5.0 0 5 100% 100% 11.06 5.94 6.08 4.78 27.87 -2.81
CR-120 0 0 120% 100% 11.34 7.34 6.08 4.78 29.54 -3.01
CR-80 0 0 80% 100% 11.34 4.93 6.08 4.78 27.14 -2.72
E-120 0 0 100% 120% 9.59 5.21 6.08 4.78 25.66 -2.47
E-80 0 0 100% 80% 13.88 7.48 6.08 4.78 32.22 -3.41
CR-80+T4 4 0 80% 100% 10.30 4.50 6.08 4.78 25.66 -2.14
CR-80+MS 5.0 0 5 80% 100% 11.06 4.77 6.08 4.78 26.70 -2.66
E-120+T4 4 0 100% 120% 8.69 4.74 6.08 4.78 24.30 -1.95
E-120+MS 5.0 0 5 100% 120% 9.43 5.07 6.08 4.78 25.36 -2.43
71
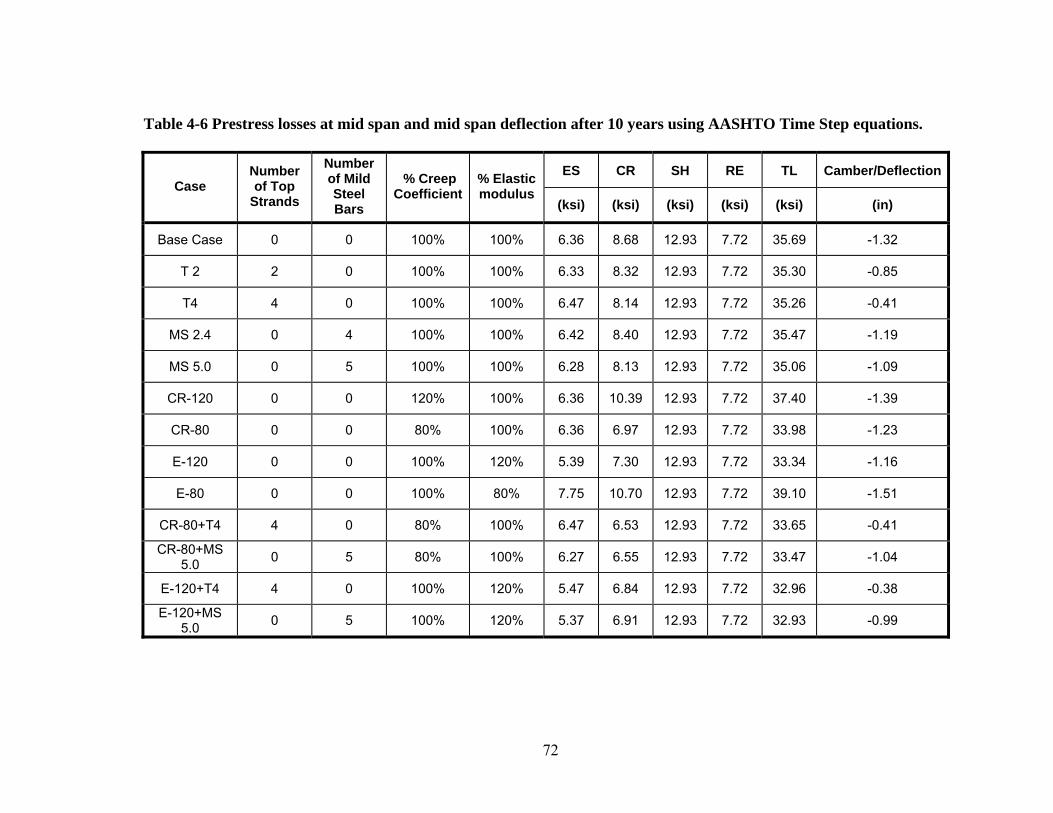
72
Table 4-6 Prestress losses at mid span and mid span deflection after 10 years using AASHTO Time Step equations.
ES CR SH RE TL Camber/DeflectionCase
Number of Top
Strands
Number of Mild Steel Bars
% Creep Coefficient
% Elastic modulus
(ksi) (ksi) (ksi) (ksi) (ksi) (in)
Base Case 0 0 100% 100% 6.36 8.68 12.93 7.72 35.69 -1.32
T 2 2 0 100% 100% 6.33 8.32 12.93 7.72 35.30 -0.85
T4 4 0 100% 100% 6.47 8.14 12.93 7.72 35.26 -0.41
MS 2.4 0 4 100% 100% 6.42 8.40 12.93 7.72 35.47 -1.19
MS 5.0 0 5 100% 100% 6.28 8.13 12.93 7.72 35.06 -1.09
CR-120 0 0 120% 100% 6.36 10.39 12.93 7.72 37.40 -1.39
CR-80 0 0 80% 100% 6.36 6.97 12.93 7.72 33.98 -1.23
E-120 0 0 100% 120% 5.39 7.30 12.93 7.72 33.34 -1.16
E-80 0 0 100% 80% 7.75 10.70 12.93 7.72 39.10 -1.51
CR-80+T4 4 0 80% 100% 6.47 6.53 12.93 7.72 33.65 -0.41
CR-80+MS 5.0 0 5 80% 100% 6.27 6.55 12.93 7.72 33.47 -1.04
E-120+T4 4 0 100% 120% 5.47 6.84 12.93 7.72 32.96 -0.38
E-120+MS 5.0 0 5 100% 120% 5.37 6.91 12.93 7.72 32.93 -0.99
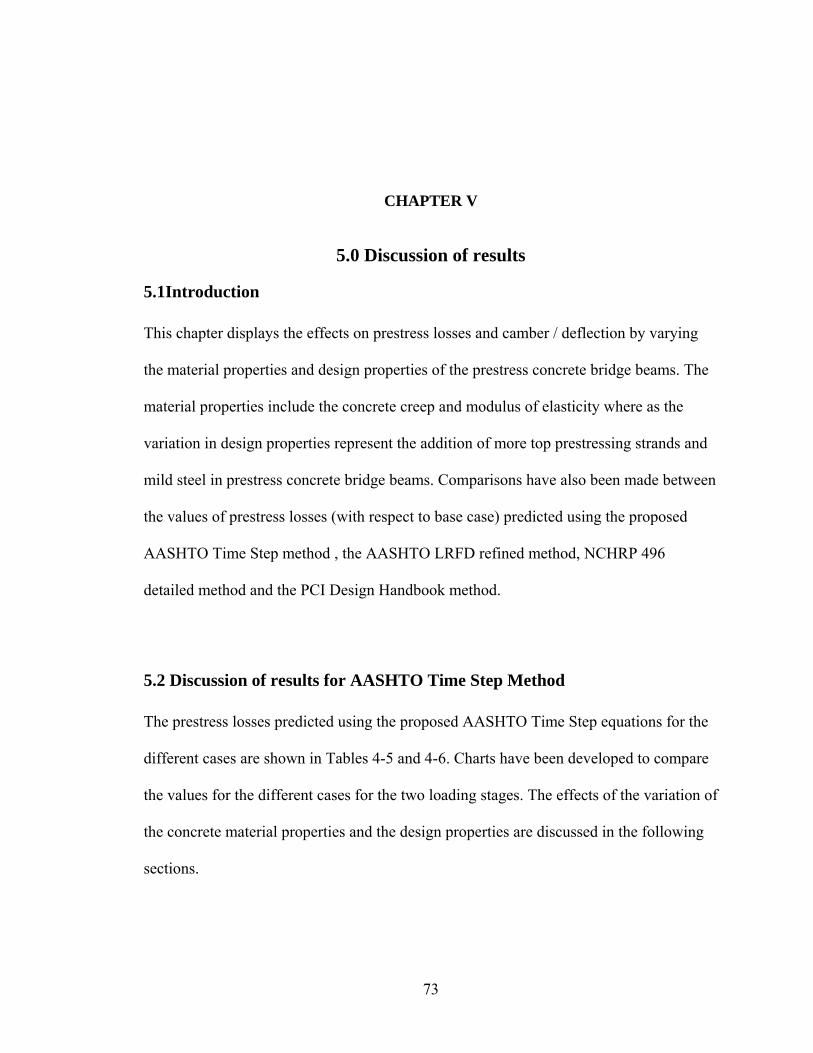
CHAPTER V
5.0 Discussion of results
5.1Introduction This chapter displays the effects on prestress losses and camber / deflection by varying
the material properties and design properties of the prestress concrete bridge beams. The
material properties include the concrete creep and modulus of elasticity where as the
variation in design properties represent the addition of more top prestressing strands and
mild steel in prestress concrete bridge beams. Comparisons have also been made between
the values of prestress losses (with respect to base case) predicted using the proposed
AASHTO Time Step method , the AASHTO LRFD refined method, NCHRP 496
detailed method and the PCI Design Handbook method.
5.2 Discussion of results for AASHTO Time Step Method The prestress losses predicted using the proposed AASHTO Time Step equations for the
different cases are shown in Tables 4-5 and 4-6. Charts have been developed to compare
the values for the different cases for the two loading stages. The effects of the variation of
the concrete material properties and the design properties are discussed in the following
sections.
73
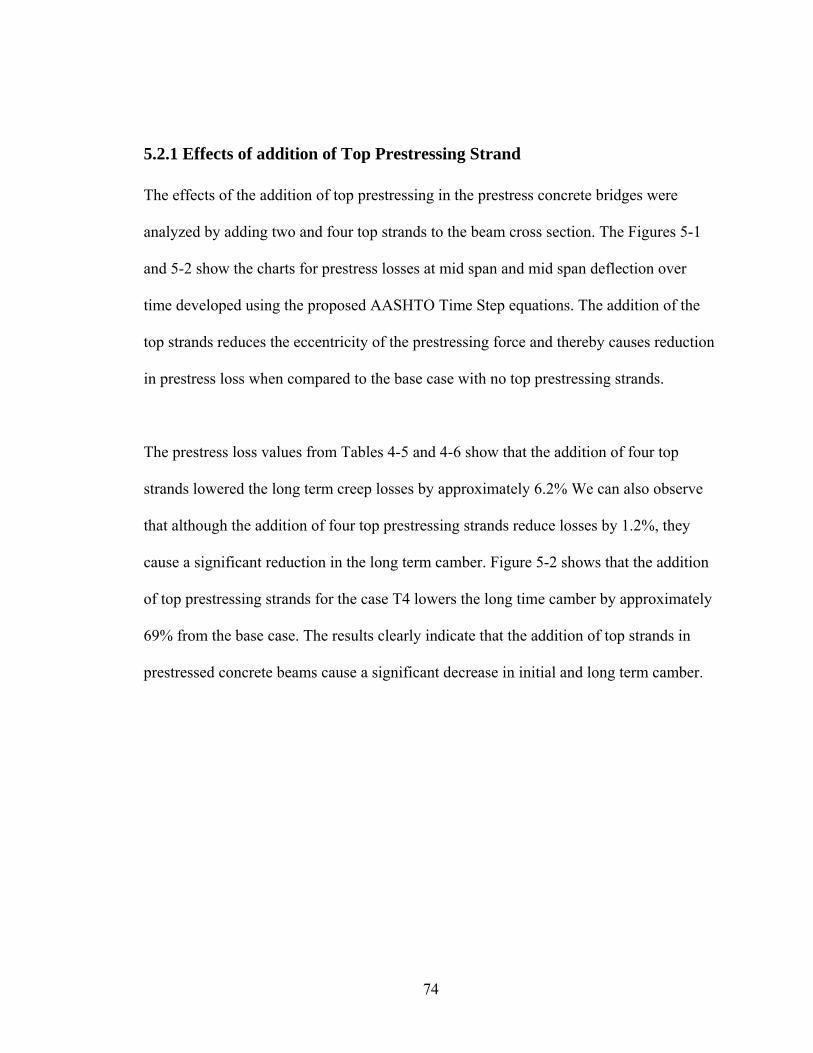
5.2.1 Effects of addition of Top Prestressing Strand The effects of the addition of top prestressing in the prestress concrete bridges were
analyzed by adding two and four top strands to the beam cross section. The Figures 5-1
and 5-2 show the charts for prestress losses at mid span and mid span deflection over
time developed using the proposed AASHTO Time Step equations. The addition of the
top strands reduces the eccentricity of the prestressing force and thereby causes reduction
in prestress loss when compared to the base case with no top prestressing strands.
The prestress loss values from Tables 4-5 and 4-6 show that the addition of four top
strands lowered the long term creep losses by approximately 6.2% We can also observe
that although the addition of four top prestressing strands reduce losses by 1.2%, they
cause a significant reduction in the long term camber. Figure 5-2 shows that the addition
of top prestressing strands for the case T4 lowers the long time camber by approximately
69% from the base case. The results clearly indicate that the addition of top strands in
prestressed concrete beams cause a significant decrease in initial and long term camber.
74
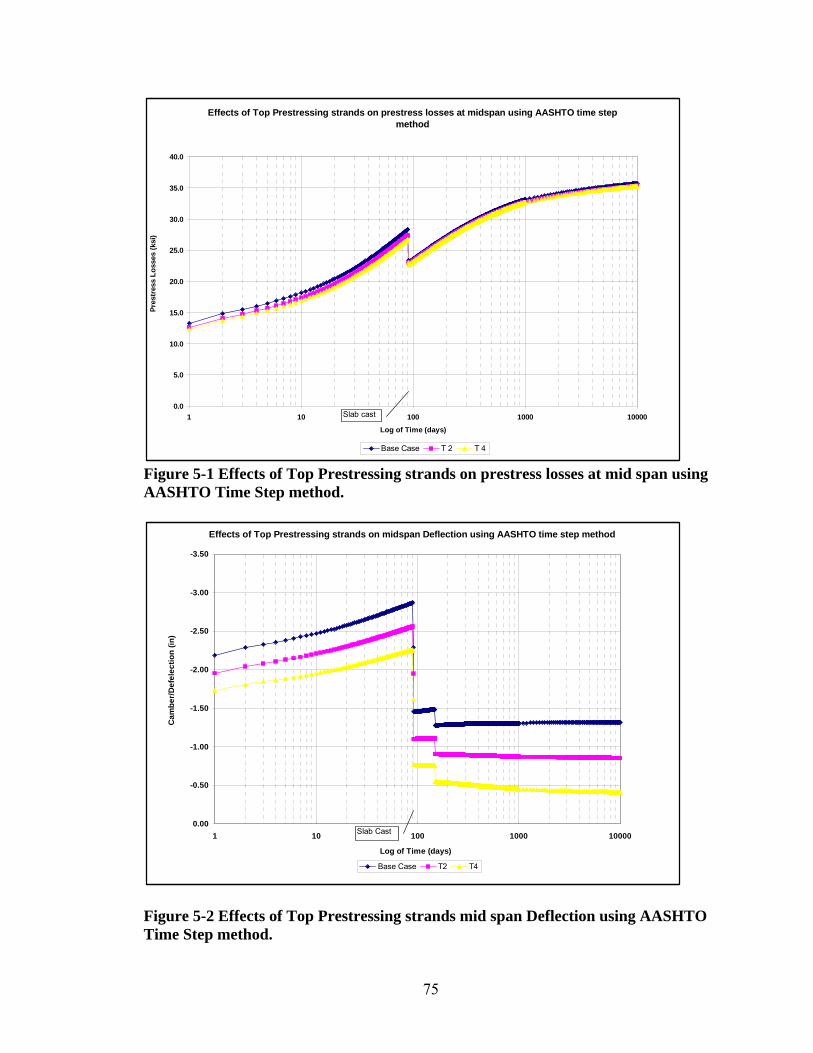
Effects of Top Prestressing strands on prestress losses at midspan using AASHTO time step method
0.0
5.0
10.0
15.0
20.0
25.0
30.0
35.0
40.0
1 10 100 1000 10000Log of Time (days)
Pres
tres
s Lo
sses
(ksi
)
Base Case T 2 T 4
Slab cast
Figure 5-1 Effects of Top Prestressing strands on prestress losses at mid span using AASHTO Time Step method.
Effects of Top Prestressing strands on midspan Deflection using AASHTO time step method
-3.50
-3.00
-2.50
-2.00
-1.50
-1.00
-0.50
0.001 10 100 1000 10000
Log of Time (days)
Cam
ber/D
efel
ectio
n (in
)
Base Case T2 T4
Slab Cast
Figure 5-2 Effects of Top Prestressing strands mid span Deflection using AASHTO Time Step method.
75
5.2.2 Effect of addition of Mild Steel The Figures 5-3 and 5-4 clearly show that the effects of the addition of mild steel on
prestress losses at mid span and mid span deflection. The addition of mild steel of area
2.4in2 and 5.0in2 reduces the long term camber by 3% and 5% respectively. Prior
experimental research programs [Tadros, Ghali and Meyer (1985)] and studies have
proved that although the addition of non-prestressing steel poses to increase the stiffness
of the concrete member, they actually tend to increase the losses and result in larger time
–dependent deflection. The results confirm the statements above statements. The addition
of mild steel of area 2.4in2 and 5.0in2 reduces the long term camber by approximately
10% and 17.4% respectively.
Effects of Mild Steel on prestress losses at midspan using AASHTO Time Step method
0.0
5.0
10.0
15.0
20.0
25.0
30.0
35.0
40.0
1 10 100 1000 10000
Log of Time (days)
Pres
tres
s Lo
sses
(ksi
)
Base Case MS 2.4 MS 5.0
Slab Cast
Figure 5-3 Effects of Mild Steel on prestress losses at mid span using AASHTO Time Step method
76
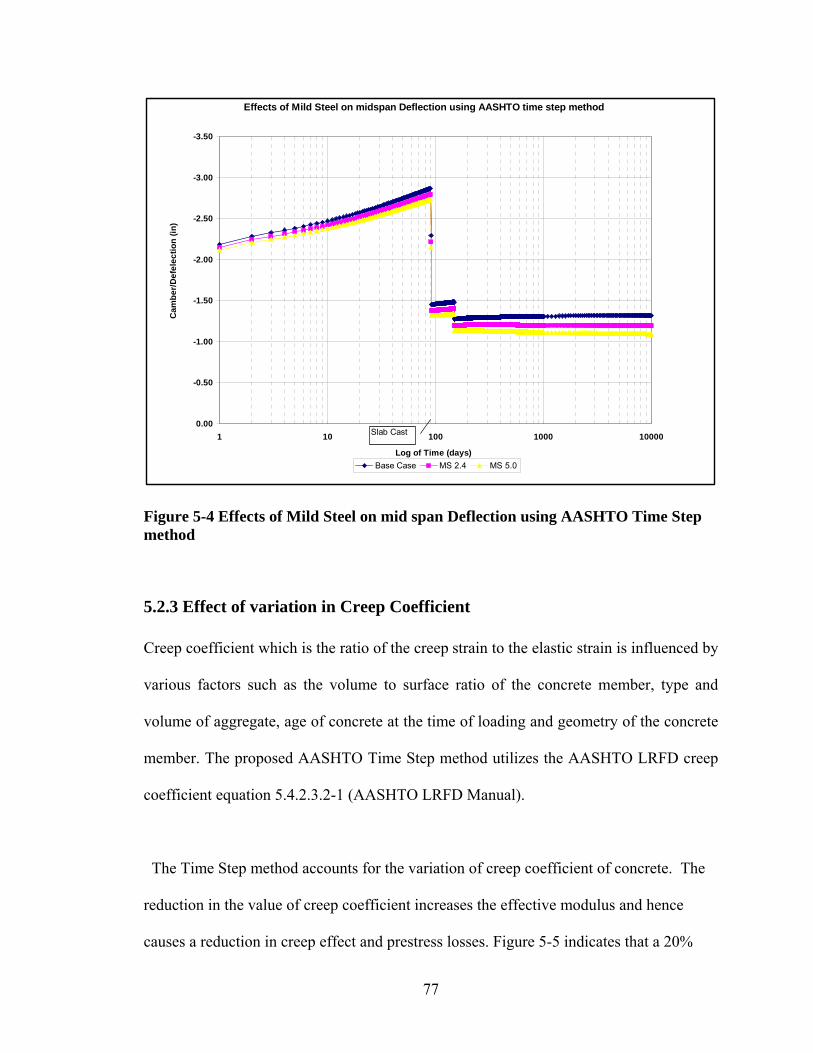
Effects of Mild Steel on midspan Deflection using AASHTO time step method
-3.50
-3.00
-2.50
-2.00
-1.50
-1.00
-0.50
0.001 10 100 1000 10000
Log of Time (days)
Cam
ber/D
efel
ectio
n (in
)
Base Case MS 2.4 MS 5.0
Slab Cast
Figure 5-4 Effects of Mild Steel on mid span Deflection using AASHTO Time Step method
5.2.3 Effect of variation in Creep Coefficient Creep coefficient which is the ratio of the creep strain to the elastic strain is influenced by
various factors such as the volume to surface ratio of the concrete member, type and
volume of aggregate, age of concrete at the time of loading and geometry of the concrete
member. The proposed AASHTO Time Step method utilizes the AASHTO LRFD creep
coefficient equation 5.4.2.3.2-1 (AASHTO LRFD Manual).
The Time Step method accounts for the variation of creep coefficient of concrete. The
reduction in the value of creep coefficient increases the effective modulus and hence
causes a reduction in creep effect and prestress losses. Figure 5-5 indicates that a 20%
77
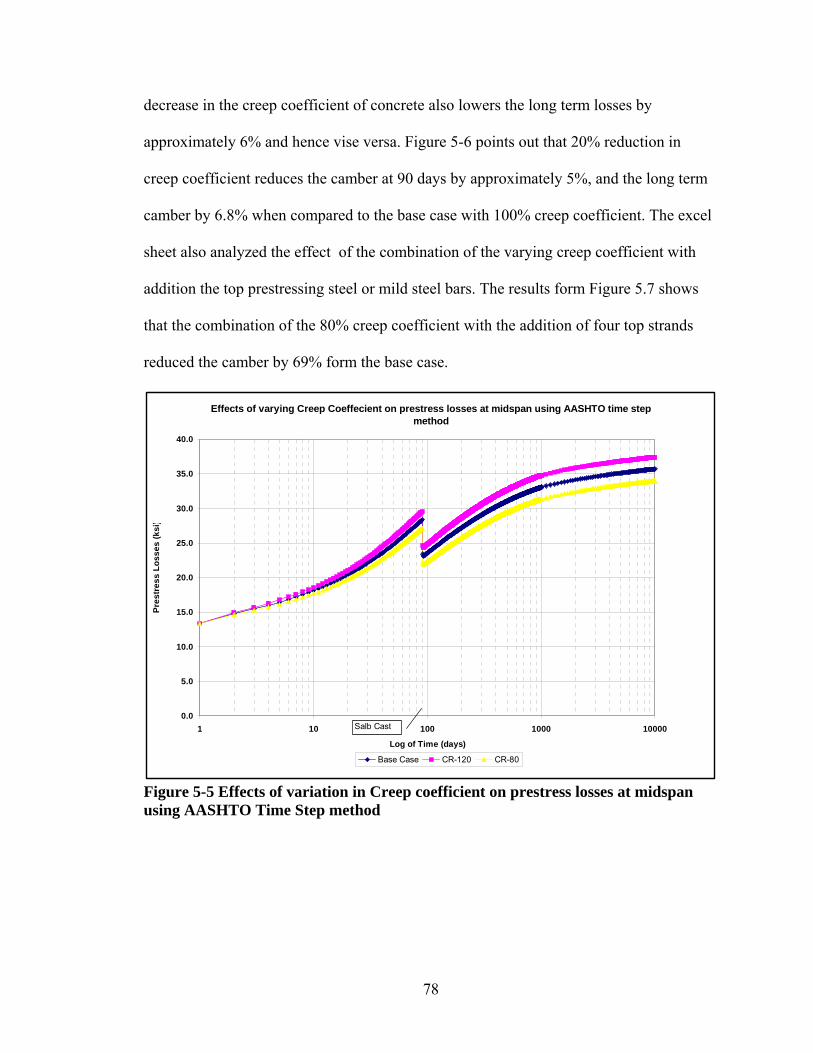
decrease in the creep coefficient of concrete also lowers the long term losses by
approximately 6% and hence vise versa. Figure 5-6 points out that 20% reduction in
creep coefficient reduces the camber at 90 days by approximately 5%, and the long term
camber by 6.8% when compared to the base case with 100% creep coefficient. The excel
sheet also analyzed the effect of the combination of the varying creep coefficient with
addition the top prestressing steel or mild steel bars. The results form Figure 5.7 shows
that the combination of the 80% creep coefficient with the addition of four top strands
reduced the camber by 69% form the base case.
Effects of varying Creep Coeffecient on prestress losses at midspan using AASHTO time step method
0.0
5.0
10.0
15.0
20.0
25.0
30.0
35.0
40.0
1 10 100 1000 10000
Log of Time (days)
Pres
tres
s Lo
sses
(ksi
)
Base Case CR-120 CR-80
Salb Cast
Figure 5-5 Effects of variation in Creep coefficient on prestress losses at midspan using AASHTO Time Step method
78

Effects of varying Creep Coefficient on midspan Deflection using AASHTO time step method
-3.50
-3.00
-2.50
-2.00
-1.50
-1.00
-0.50
0.001 10 100 1000 10000
Log of Time (days)
Cam
ber/D
efel
ectio
n (in
)
Base Case CR-120 CR-80
Slab Cast
Figure 5-6 Effects of variation in Creep coefficient on mid span Deflection using AASHTO Time Step method
Effects of varying Creep Coefficient , Mild Steel and Top Prestressing strands on midspan Deflection using AASHTO Time Step method
-3.50
-3.00
-2.50
-2.00
-1.50
-1.00
-0.50
0.001 10 100 1000 10000
Log of Time (days)
Cam
ber/D
efel
ectio
n (in
)
Base Case CR80+T4 CR80+MS 5.0
Slab Cast
Figure 5-7 Effects of variation in Creep coefficient with Mild steel or top prestressing strands on mid span Deflection using AASHTO Time Step method
79
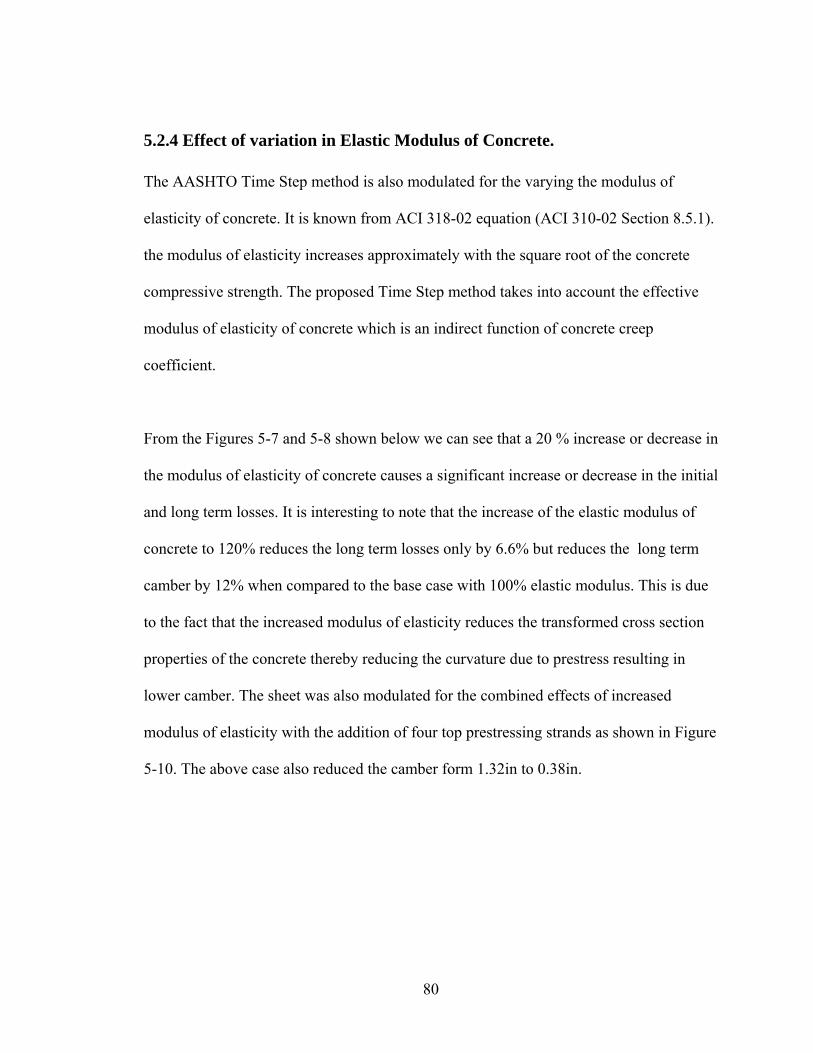
5.2.4 Effect of variation in Elastic Modulus of Concrete. The AASHTO Time Step method is also modulated for the varying the modulus of
elasticity of concrete. It is known from ACI 318-02 equation (ACI 310-02 Section 8.5.1).
the modulus of elasticity increases approximately with the square root of the concrete
compressive strength. The proposed Time Step method takes into account the effective
modulus of elasticity of concrete which is an indirect function of concrete creep
coefficient.
From the Figures 5-7 and 5-8 shown below we can see that a 20 % increase or decrease in
the modulus of elasticity of concrete causes a significant increase or decrease in the initial
and long term losses. It is interesting to note that the increase of the elastic modulus of
concrete to 120% reduces the long term losses only by 6.6% but reduces the long term
camber by 12% when compared to the base case with 100% elastic modulus. This is due
to the fact that the increased modulus of elasticity reduces the transformed cross section
properties of the concrete thereby reducing the curvature due to prestress resulting in
lower camber. The sheet was also modulated for the combined effects of increased
modulus of elasticity with the addition of four top prestressing strands as shown in Figure
5-10. The above case also reduced the camber form 1.32in to 0.38in.
80
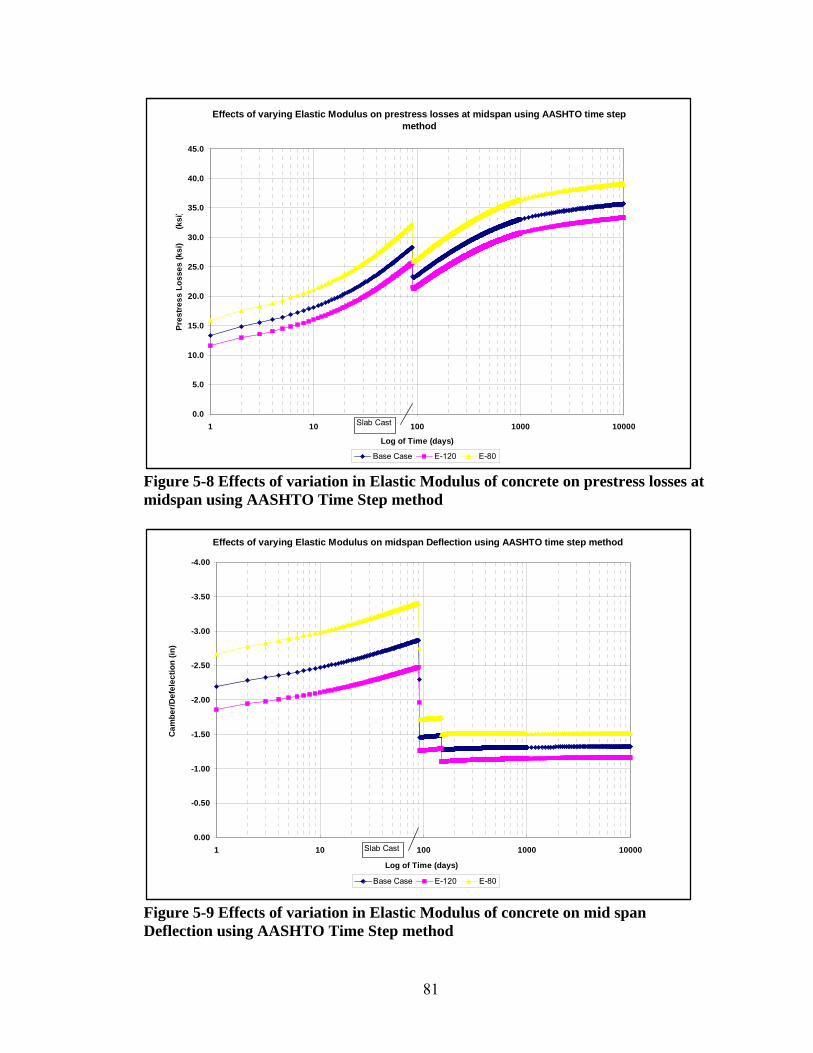
Effects of varying Elastic Modulus on prestress losses at midspan using AASHTO time step method
0.0
5.0
10.0
15.0
20.0
25.0
30.0
35.0
40.0
45.0
1 10 100 1000 10000
Log of Time (days)
Pres
tres
s Lo
sses
(ksi
)
(ksi
)
Base Case E-120 E-80
Slab Cast
Figure 5-8 Effects of variation in Elastic Modulus of concrete on prestress losses at midspan using AASHTO Time Step method
Effects of varying Elastic Modulus on midspan Deflection using AASHTO time step method
-4.00
-3.50
-3.00
-2.50
-2.00
-1.50
-1.00
-0.50
0.001 10 100 1000 10000
Log of Time (days)
Cam
ber/D
efel
ectio
n (in
)
Base Case E-120 E-80
Slab Cast
Figure 5-9 Effects of variation in Elastic Modulus of concrete on mid span Deflection using AASHTO Time Step method
81
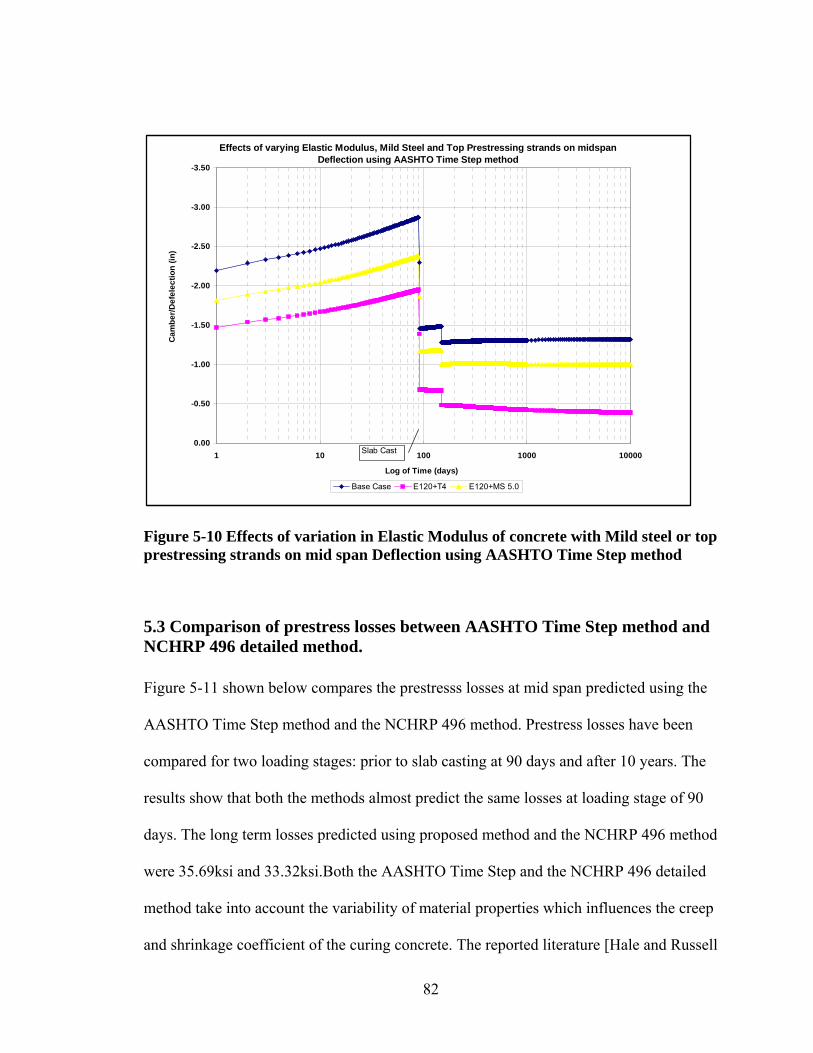
Effects of varying Elastic Modulus, Mild Steel and Top Prestressing strands on midspan Deflection using AASHTO Time Step method
-3.50
-3.00
-2.50
-2.00
-1.50
-1.00
-0.50
0.001 10 100 1000 10000
Log of Time (days)
Cam
ber/D
efel
ectio
n (in
)
Base Case E120+T4 E120+MS 5.0
Slab Cast
Figure 5-10 Effects of variation in Elastic Modulus of concrete with Mild steel or top prestressing strands on mid span Deflection using AASHTO Time Step method
5.3 Comparison of prestress losses between AASHTO Time Step method and NCHRP 496 detailed method. Figure 5-11 shown below compares the prestresss losses at mid span predicted using the
AASHTO Time Step method and the NCHRP 496 method. Prestress losses have been
compared for two loading stages: prior to slab casting at 90 days and after 10 years. The
results show that both the methods almost predict the same losses at loading stage of 90
days. The long term losses predicted using proposed method and the NCHRP 496 method
were 35.69ksi and 33.32ksi.Both the AASHTO Time Step and the NCHRP 496 detailed
method take into account the variability of material properties which influences the creep
and shrinkage coefficient of the curing concrete. The reported literature [Hale and Russell
82

(2006)] showed that the NCHRP 496 method predicted losses within 18% of the
measured losses. From the results it is concluded that the computation of losses using the
proposed AASHTO Time Step method and predicted losses that were comparable to the
losses predicted using the NCHRP Report 496 method.
Comparision of prestress losses for AASHTO time step method Vs NCHRP 496 detailed method
33.32
35.69
28.35 28.38
0
5
10
15
20
25
30
35
40
prior to slab casting, at 90 days after 10 years
Loading Stage
Pres
tres
s Lo
sses
(ksi
)
AASHTO time step method NCHRP 496 detailed losses
Figure 5-11 Plot showing the comparison of Prestress losses at mid span using the AASHTO Time Step and NCHRP 496 detailed method for two stages of loading.
5.4 Comparison of prestress losses between AASHTO Time Step method and AASHTO LRFD refined method. Figure 5-12 shows that the AASHTO Time Step method predicts long term losses of
about 1% lower than that predicted using the AASHTO LRFD method. The AASHTO
LRFD refined method however estimates long term losses and is formulated using the
normal concrete strength. The ultimate value of creep coefficients and shrinkage
83
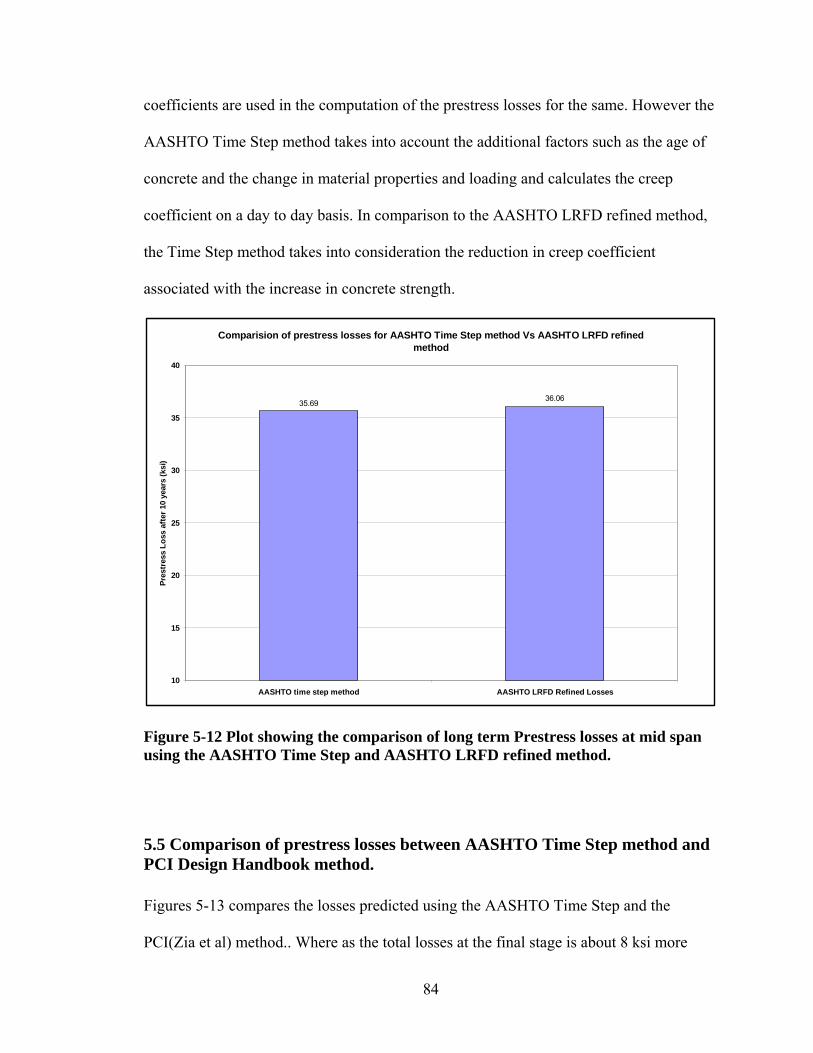
coefficients are used in the computation of the prestress losses for the same. However the
AASHTO Time Step method takes into account the additional factors such as the age of
concrete and the change in material properties and loading and calculates the creep
coefficient on a day to day basis. In comparison to the AASHTO LRFD refined method,
the Time Step method takes into consideration the reduction in creep coefficient
associated with the increase in concrete strength.
Comparision of prestress losses for AASHTO Time Step method Vs AASHTO LRFD refined method
36.0635.69
10
15
20
25
30
35
40
AASHTO time step method AASHTO LRFD Refined Losses
Pres
tres
s Lo
ss a
fter 1
0 ye
ars
(ksi
)
Figure 5-12 Plot showing the comparison of long term Prestress losses at mid span using the AASHTO Time Step and AASHTO LRFD refined method.
5.5 Comparison of prestress losses between AASHTO Time Step method and PCI Design Handbook method. Figures 5-13 compares the losses predicted using the AASHTO Time Step and the
PCI(Zia et al) method.. Where as the total losses at the final stage is about 8 ksi more
84
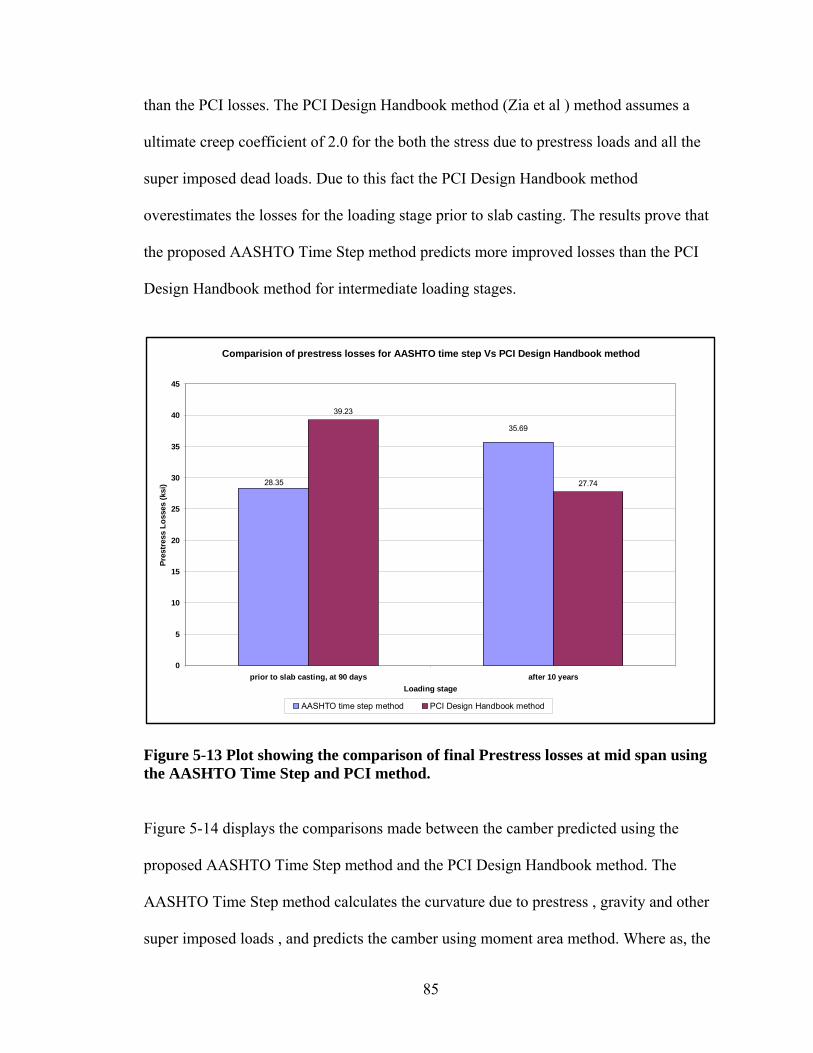
than the PCI losses. The PCI Design Handbook method (Zia et al ) method assumes a
ultimate creep coefficient of 2.0 for the both the stress due to prestress loads and all the
super imposed dead loads. Due to this fact the PCI Design Handbook method
overestimates the losses for the loading stage prior to slab casting. The results prove that
the proposed AASHTO Time Step method predicts more improved losses than the PCI
Design Handbook method for intermediate loading stages.
Comparision of prestress losses for AASHTO time step Vs PCI Design Handbook method
39.23
27.74
35.69
28.35
0
5
10
15
20
25
30
35
40
45
prior to slab casting, at 90 days after 10 yearsLoading stage
Pres
tres
s Lo
sses
(ksi
)
AASHTO time step method PCI Design Handbook method
Figure 5-13 Plot showing the comparison of final Prestress losses at mid span using the AASHTO Time Step and PCI method. Figure 5-14 displays the comparisons made between the camber predicted using the
proposed AASHTO Time Step method and the PCI Design Handbook method. The
AASHTO Time Step method calculates the curvature due to prestress , gravity and other
super imposed loads , and predicts the camber using moment area method. Where as, the
85
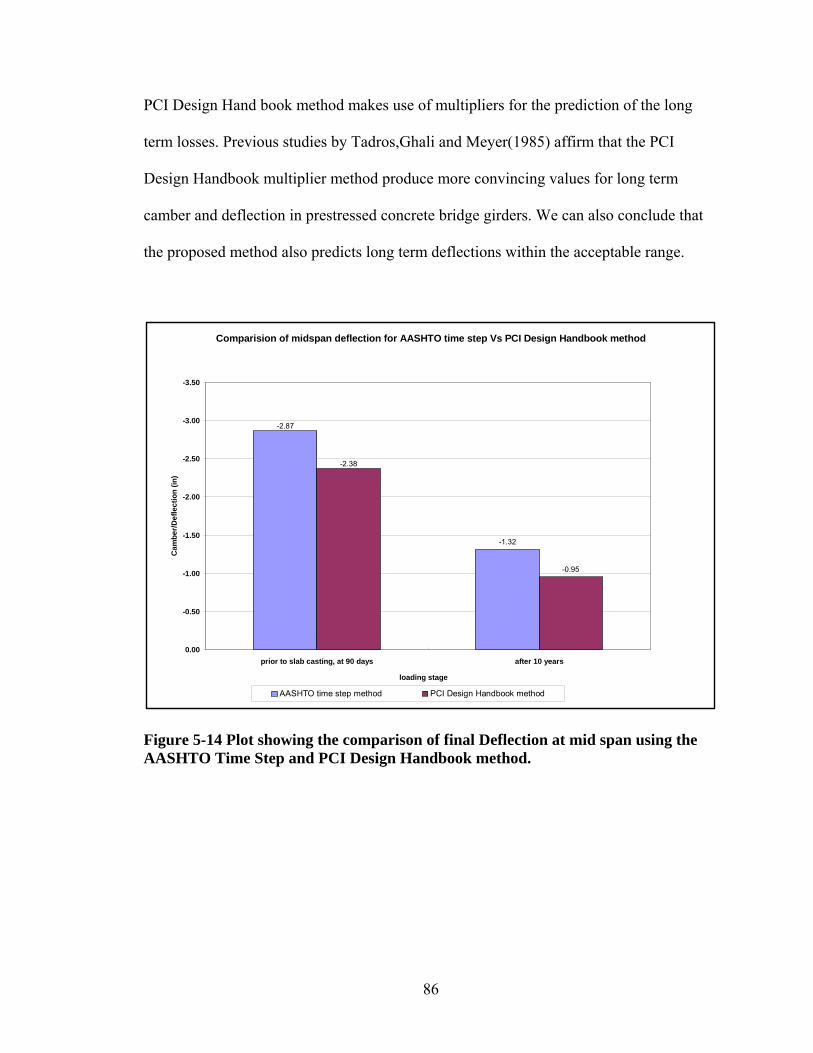
PCI Design Hand book method makes use of multipliers for the prediction of the long
term losses. Previous studies by Tadros,Ghali and Meyer(1985) affirm that the PCI
Design Handbook multiplier method produce more convincing values for long term
camber and deflection in prestressed concrete bridge girders. We can also conclude that
the proposed method also predicts long term deflections within the acceptable range.
Comparision of midspan deflection for AASHTO time step Vs PCI Design Handbook method
-1.32
-0.95
-2.87
-2.38
-3.50
-3.00
-2.50
-2.00
-1.50
-1.00
-0.50
0.00prior to slab casting, at 90 days after 10 years
loading stage
Cam
ber/D
efle
ctio
n (in
)
AASHTO time step method PCI Design Handbook method
Figure 5-14 Plot showing the comparison of final Deflection at mid span using the AASHTO Time Step and PCI Design Handbook method.
86
CHAPTER VI
6.0 Summary, Conclusions and Recommendations
The foremost objective of the research program was to investigate the relevant literature
pertaining to the prediction of prestress losses. Prestress losses were predicted using the
available loss prediction methods. The proposed AASHTO Time Step method was
developed by modulating the AASHTO LRFD refined equations to accommodate time
dependent creep effects. Prestress losses and camber and deflection were predicted using
the proposed method as well as the PCI Design Hand book method. The AASHTO type
IV girder properties were selected to perform the analysis for each of the methods.
The research further investigates the varying concrete material properties. Material
properties of the concrete were varied by changing the creep coefficient and the modulus
of elasticity of concrete ±20 percent. The design properties accommodate the addition of
top prestressing strands and the mild steel. The findings of the research are summarized
below:
• The AASHTO Time Step method takes into account the incremental increase in
creep and calculates the losses and camber on a day to day basis.
• The AASHTO Time Step method takes into account the variability in the material
properties and is formulated for HPC when compared to the AASHTO LRFD
refined method.
87
• The AASHTO Time Step method accommodates the use of effective modulus
which combines the effect due to elastic strain and the creep of concrete as an
elastic deformation on the concrete section.
• Addition of two and four top prestressing strands reduces the camber by 35% and
69% respectively.
• The addition of four (4) #7 and five (5) # 9 mild steel bars do not alter appreciably
the values of long term losses; however, their inclusion decreases the long term
camber by approximately 10% and 17.4% for inclusion of mild steel, Ams =
46%Aps and Ams = 96%Aps respectively.
• The decrease in creep coefficient to 80% decreases the long term camber by 6.8%
from the base case of 100% creep.
• 20% increase in Elastic modulus of concrete lowers the long term prestress losses
by 6% and long term camber by 12%.
• The AASHTO Time Step method predicts long term losses equivalent to losses
predicted using the NCHRP 496.
• The camber predicted using the proposed AASHTO Time Step method is
comparable to the camber predicted using the PCI Design Handbook method.
88

6.1 Recommendations The following are the design guidelines and the recommendations made to ODOT and
OTA for the more refined prediction of prestress losses, camber and deflection.
• Add top prestressing strands in prestressed concrete beams to lower the long term
losses and camber by approximately 69%.
• Add mild steel which increases stiffness to the concrete beam as well as reduces
the long term camber by approximately 17.4%.
• Use of the proposed AASHTO Time Step method to determine the losses for the
prediction of intermediate and long term prestress losses and camber/deflection in
prestressed concrete bridge girder
89
REFERENCES
AASHTO 2004,AASHTO LRFD Bridge Design Specifications Third Edition,
American Association of State Highway and Transportation Offcials,Washington,DC
AASHTO 1994,AASHTO LRFD Bridge Design Specifications Third Edition,
American Association of State Highway and Transportation Offcials,Washington,DC
ACI Committee 318,2005,Building Code Requirements for Structural Concrete (ACI
318-05) and Commentary (ACI 318R-05),American Concrete Institute, Farmington
Hills, MI
ACI Committee 363, “State of the Art of Report on High- Strength Concrete,”
American Concrete Institute, Detroit, MI (1992) p.3.
ACI Committee 363, “State of the Art of Report on High- Strength Concrete,” ACI
Structural Journal, V.81, No.4, July-August 1984, pp. 363-411.
ACI Committee 318, “Building Code Requirements for Reinforced Concrete,” ACI
318-89, American Concrete Institute, Detroit, MI (1989).
90
ACI Committee 318, “Building Code Requirements for Reinforced Concrete,” ACI
318-98/318R-99, American Concrete Institute, Detroit, MI (1999).
ACI Committee 318, “Building Code Requirements for Structural Concrete, (ACI
318-95)”, American Concrete Institute, Farmington Hills, MI, (1995).
ACI Committee 209, “Prediction of creep, (ACI 209R-45)”, ACI Manual of
Concrete Practice, part-1, 2002.
ACI 209R-92, “ Prediction of Creep Shrinkage and Temperature Effects in Concrete
Structures”, Reported by ACI Committee 209.(1992)
Abdel Karim, A. and Tadros, M.K., “Computer Analysis of Spliced Girder Bridges,”
ACI Structural Journal, Vol.90,No.1, Detroit, MI(January-February 1993),pp.21-31.
A Ghali, AM Neville, “Effect of Elastic and Creep Recoveries of Concrete on Loss
of Prestress”, PC Jha - ACI Journal Proceedings, Volume: 64. Issue: 12. December 1,
1967.
American Association of State Highway and Transportation Officials, “AASHTO-
LRFD Bridge Design Specifications,” First Edition, 1994 and Interim Specifications
through 1996.
91

American Association of State Highway and Transportation Officials, “AASHTO-
LRFD Bridge Design Specifications,” Second Edition,
Washington, DC (1998).
American Association of State Highway and Transportation Officials , Standard
Specification for Highway Bridges, 14th Edition.Washington,D.C,(1989),420pp.
American Association of State Highway and Transportation Officials (AASHTO),
Standard Specification for Highway Bridges: Fifteenth
Edition.Washington,D.C,(1992).
American Association of State Highway and Transportation Officials (AASHTO),
Standard Specification for Highway Bridges: Fifteenth
Edition.Washington,D.C,(1993).
American Association of State Highway and Transportation Officials (AASHTO),
Standard Specification for Highway Bridges: Sixteenth
Edition.Washington,D.C(1996).
American Association of State Highway and Transportation Officials (AASHTO),
(1998).Standard Specification for Highway Bridges: Sixteenth
Edition.Washington,D.C(1998).
92
American Concrete Institute (ACI),(2002). “Building code requirement for structural
concrete and commentary.” Manual Concrete Practice,ACI 318-02,Farmington Hills,
MI.
American Concrete Institute (ACI),(1992). “Prediction of creep, shrinkage, and
temperature effects in concrete structures.” Manual of Concrete Practice, ACI 209R-
92, Farmtington Hills, MI.
American Concrete Institute (ACI),(1992). “State-of-the-art report on high strength
concrete” Manual of Concrete Practice,ACI 363R-92,Farmington Hills,MI
American Concrete Institute (ACI),(2002). “Evaluation of strength test results of
concrete.” Manual of Concrete Practice, ACI 214R-02, Farmington Hills,MI.
Al-Omashi,N., “Prestress losses in Pretensioned High-Strength Concrete Bridge
Girders,” Ph.D. Dissertation, Department of Civil Engineering, University of
Nebraska, Lincoln, NE(2001).
ASTM C469-94, “Standard Test Method for Static Modulus of Elasticity and
Poission’s Ratio of Concrete in Compression,” American Society of Testing and
Materials, Annual Book, Philadelphia, PA (1994) pp.238-241.
93

Bruce W. Russell and W.Micah Hale., “Effects of Allowable Compressive Stress at
Release on Prestress Losses and on the Performance of Precast, Prestressed Concrete
Bridge Girders”, PCI Journal, Precast/Prestressed Concrete Institute,vol51,no.2,
(March-April, 2006).
Bazant, Z.P. and Baweja, S.,(1995a). “Creep and shrinkage prediction model for
analysis and design of concrete structures-model B3, RILEM recommendations.”
Materials and Structures, 28,357-365.
Bazant, Z.P. and Baweja, S., (1995b). “Justification and refinements of model B3 for
concrete creep and shrinkage 1.Statistics and sensitivity.” Materials and Structures,
28,415-430.
Bazant, Z.P. and Baweja, S., (1995c). “Justification and refinements of model B3 for
concrete creep and shrinkage 2.Updating and theoretical basis.” Materials and
Structures, 28,488-495.
Branson,D.E., and Christaison, M. L., “Time-Dependent Concrete Properties Related
to Design-Strength and Elastic Properties, Creep and Shrinkage,” SP-27, American
Concrete Institute, Detroit, 1971, pp.257-277.
Branson D.E and Panarayanan K.M, “Loss of Prestress of Non-Composite and
Composite Prestressed Concrete Structures,” PCI Journal, September-October 1971.
94

CEB-FIP, ‘Model Code for Concrete Structures’, English Translation. Paris: Comite
Euro-international due Beton-Federation International de la precontrainte,1978.
Comite Euro-International du Beton (CEB),(1990). “CEB-FIP model code 1990.”
Buletin D’Information No.213/214, Lausanne, Switzerland.
Concrete Technology Associates, “Prestress Losses,” Technical Bulletin 73-B7,
Concrete Technology Associates, Tacoma, WA (July 1973).
Gross, S.P and Burns, N.H., “Field Performance of Prestressed High Performance
Concrete Bridges in Texas,” Research Report 580/589-2, Center for Transportation
Research, University of Texas at Austin, Austin, TX (1999).
Ghali, A., Tadros, M. K., and Dilger, W. H., “Accurate Evaluation of Time
Dependent Deflection of Prestressed Concrete Frames,” Deflection of Concrete
Structures, SP-43, American Concete Institute, Detroit, 1974, pp. 357-375.
Gardener, N.J. and Lockman, M.J., (2001). “Design provisions fordrying shrinkage
and creep of normal-strength concrete.” ACI Materials Journal,98(2),159-167
Gruel, A., Rogers, B.T., Miller, R.A., Shahrooz, B.M., and Baseheart, T.M.,
“Evaluation of a High Performance Concrete Box Girder Bridge, “Evaluation of a
95

High Performance Concrete Box Girder Bridge,” Research Report, University of
Cincinnati, Cincinnati, OH (2000).
Micah Hale, “Investigating the need for and effect of air entrainment in high
performance concrete,” Ph.D. Dissertation, Department of Civil Engineering and
Environmental Science, University of Oklahoma, Oklahoma, OK(2002).
Hansen, T.C. and Mattock, A.H., “Influence of Size and Shape of Member on the
Shrinkage and Creep of concrete.” ACI Materials Journal, vol.63, No.2, Detroit, MI
(1966) pp.267-289.
Hou, X.S., Al-Omashi, N., and Tadros, M.K., “Creep, Shrinkage and Modulus of
Elasticity of High Performance Concrete,” ACI Materials Journal, Vol.98, No.6,
Detroit, MI (2001) pp.440-449.
Le Roy, R., De Larrard, F., and Pons,G.(1996). “The AFREM code type model for
creep and shrinkage of high-performance concrete.” Proceedings of the 4th
International Symposium on Utilization of High-Strength/High-Performance
Concrete, Paris.
IS-1343, ‘Code of practice for prestressed concrete’, Bureau of Indian Standards,
New Delhi,1980.
96

Lwin, M.M., Khaleghi, B., and Hsieh, J, C., “Prestressed I-Girder Design Using High
Perfomance Concrete and the New AASHTO LRFD Specifications,” PCI/FHWA
International Symposium on High Performance Concrete New Orleans, LA (October
1997) pp.406-418.
Mokhtarzadeh, a., “Mechanical Properties of High Strength concrete,” Ph.D
Dissertation, Department of Civil Engineering, University of Minnesota,
Minneapolis, MN (1996).
Naaman, A.E., and Siriaksorn, A., Prestressed Concrete Analysis and Design –
Fundamentals, First Edition, MacGraw Hill Book Co., New York,N.Y.,1982,670pp.
PennDOT, “Design Manual Part 4- Structures,” Pennsylvania Department of
Transportation, Harrisburg, PA, August 1993.
Pickett, G., “Shrinkage stresses in concrete,” ACI Journal, Proceedings V.42, No.3,
Jan-Feb. 1946, pp. 165-204, 361-400.
Precast/Prestressed Concrete Institute (PCI), (1997).Bridge Design Manual, Chicago,
IL.
Precast/Prestressed Concrete Institute (PCI) Committee on Prestress Losses, (1975).
“Recommendation for estimating prestree losses.”PCI Journal, 20(4), 43-75.
97

PCI Design Handbook Precast Prestressed Concrete, Second Edition, Prestressed
Concrete Institute, Chicago, Illinois, 1978.
PCI Design Handbook, Precast/Prestressed Concrete Institute, Chicago, IL, 1999.
PCI Design Handbook, Precast/Prestressed Concrete Institute, Chicago, IL, 2005.
Pessiki, S., Kaczinski, M., and Wescott, H,.H., “Evaluation of Effective Prestress
Forces in 28-Year-Old Prestressed Concrete Bridge Beams,” PCI Journal, Vol.41,
No.5, Chicago,IL (November-December 1996) pp.78-89.
P.Shreeshylam, K.Ravishankar,S.Parivallal,K.Kesavan and S.Sridhar., “Measured
long-term prestress losses versus design code estimates”,Journal of Structural
Engineering (Madras), v32, n1, April/May, 2005, Full-Scale Testing and Evaluation
of Structures,p37-44.
PCI Committee on Prestress Losses, “Recommendations for Estimating Prestress
Losses”, PCI JOURNAL, V.20, No.4, July-August 1975, pp,45-70.
Shenoy, C.V., and Frantz, G.C., “A Simple Method of Gripping Prestressing Strands
for Tension Tests, “PCI JOURNAL, V. 36, No. 4, July-August 1991, pp. 58-65.
98
Shams M.K and Kahn, L.F.,(2000). “Time-dependent behavior of high-strength
concrete task 3, use of high strength/high performance concrete for precast
prestressed concrete bridge in Georgia.” Structural Engineering, Mechanics, and
Materials Research Report No.00-1, Georgia Institute of Technology, and Atlanta
GA.
Shenoy, C.V., and Frantz, G.C., “Structural test of 27-Year-Old Prestressed Concrete
Bridge Beams,“PCI Journal, September-October, Chicago, IL(1991) pp80-90.
Tadros, M.K., Ghali, A. and Dilger, W.H., “Time- Dependent Prestress Loss and
Deflection in Prestressed Concrete Members,” PCI Journal, Vol.20, No.3, Chicago,
IL (May-June 1975) pp.86-98.
Tadros, M.K., Ghali, A. and Dilger, W.H., “Time- Dependent Analysis of Composite
frames,” ASCE Journal of Structural Engineering, New York, NY (April 1977) pp.
871-884.
Tadros, M.K., Ghali, A., and Meyer, A.W., “Prestress Loss and Deflection of Precast
Concrete Members,” PCI Journal, Vol.30, No.1, Chicago, IL (January-February
1985) pp.114-141.
Maher K. Tadros, Nabil AL-Omashi, Stephen J.Seguirant and James G. Gallt,
“NCHRP Report 496”, Washington D.C., 2003.
99
T.Y Linn and Ned H. Burns. “Design of Prestressed Concrete Structures”, Third
Edition , John Wiley & Sons, 2004.
Waldron, Christopher J., “Investigation of long-term prestress losses in prestensioned
high performance concrete girders,” Ph.D.Dessertation, Department of Civil
Engineering, Virginia Polytechnic Institute and State University, Blacksburg, A
(November 16, 2004) p.220.
Window,A.L.,and Holister, G.S., “Strain gauge technology”, 1st Edition, Applied
Science Publishers, England,1982
Zia, P., Preston, H., Scott, N., and Workman, E., June 1979, “Estimating Prestress
Losses,” Concrete International, V.1, No.6, pp.32-38.
.
100
VITA
Hema Jayaseelan
Candidate for the Degree of
Master of Science
Thesis: PRESTRESS LOSSES IN CONCRETE AND THE ESTIMATION OF LONG-TERM
DEFLECTIONS AND CAMBER FOR PRESTRESSED CONCRETE BRIDGES
Major Field: Civil Engineering
Biographical:
Personal Data: Born in Coimbatore, Tamilnadu, India On March 18, 1979 the daughter of Dr.Kaliannan and Sarawathi Kaliannan
Education: Graduated from Stanes Higher Secondary School, Coimbatore, India in May 1996; received Bachelor of Engineering in Civil Engineering from Government Collage of Technology, Coimbatore, India in 2000. Completed the requirements for the Master of Science degree with a major in Civil Engineering with Structural Engineering as specialty at Oklahoma State University in July 2007.
Experience: Employed by Oklahoma State University, Department of Civil &
Environmental Engineering as graduate research assistant and
graduate teaching assistant fall 2004 to summer 2006, employed
by Black & Veatch as Structural Engineer from Sep 2006 to
Present
Professional Memberships: American Concrete Institute.
The National Scholars Honor Society

Name: Hema Jayaseelan Date of Degree: July 2007
Institution: Oklahoma State University Location: Stillwater, Oklahoma
Title of Study: PRESTRESS LOSSES IN CONCRETE AND THE ESTIMATION OF LONG-TERM DEFLECTIONS AND CAMBER FOR PRESTRESSED CONCRETE BRIDGES
Pages in Study: 110 Candidate for the Degree of Master of Science
Major Field: Civil Engineering
Scope and Method of Study:
The accurate estimation of losses results in a reliable calculation of both camber and
deflection .This research program models prestressed losses and bridge cambers using the
proposed AASHTO time step method that incorporates the results and the
recommendations from other research programs. Through further refinement of the
model and variations in design details, the results provide recommendations to ODOT
and OTA that will more accurately determine prestress losses and long term
camber/deflection in prestressed bridge girders and suggested design changes to control
deflections and/or cambers.
Findings and Conclusions:
The results from the research showed that the proposed method shows strong correlation
with the losses predicted using the NCHRP 496 method. The method also computed the
long term deflection and camber that were comparable with the results obtained using the
PCI Design Handbook multipliers. The results proved that the reduction in long term
losses can be achieved by varying the material and design properties of prestressed
concrete.
ADVISER’S APPROVAL:
Recommended