Productivity growthin Australian Broadacre and Dairy
industries
Peter Gooday
Branch ManagerProductivity, water and fisheries
ABARE

Overview…
• Trends in broadacre and dairy productivity growth
• When did productivity growth begin to slow?
• Where has productivity growth slowed?
• Why did productivity slow down?
• What is next?

Broadacre productivity growth
1.4%

Productivity growth has offset declining terms of trade in Australian agriculture…
1.4%
Long term growth rate
Broadacre productivity and terms of trade indices
-1.6%
0
50
100
150
200
1977
-78
1987
-88
1997
-98
2007
-08
ind
ex
Total factorproductivity
Terms oftrade

Broadacre productivity growth has enabled more output to be produced using fewer
inputs…
1.4%
0.8%
- 0.6%
Long term growth rate
Broadacre input, output and productivity indices
0
50
100
150
200
1977
-78
1987
-88
1997
-98
2007
-08
ind
ex
Total factorproductivity
TotalOutputs
TotalInputs

0
50
100
150
200
1977
-78
1987
-88
1997
-98
2007
-08
ind
ex
Total factorproductivity
TotalOutputs
TotalInputs
Broadacre productivity growth was stronger during the 1980s and 1990s…
1.4%
0.8%
- 0.6%
Long term growth rate
Broadacre input, output and productivity indices
1.8% -1.3%

Broadacre input use intensity
0
40
80
120
160
1977-78 1987-88 1997-98 2007-08
inp
ut
use
inte
nsi
ty in
dex
materials andservices
capital
land
labour
Long term growth rate
0.9%
-0.7%
-1.1%
-1.7%

Increased dairy production has been driven by growth in inputs rather than productivity…
0
50
100
150
200
250
19
88
-89
19
94
-95
20
00
-01
20
06
-07
ind
ex
Totaloutput
Totalinputs
Total factorproductivity 0.8%
3.9%
4.7%
Long term growth rate
Dairy input, output and productivity indices
2007
-08
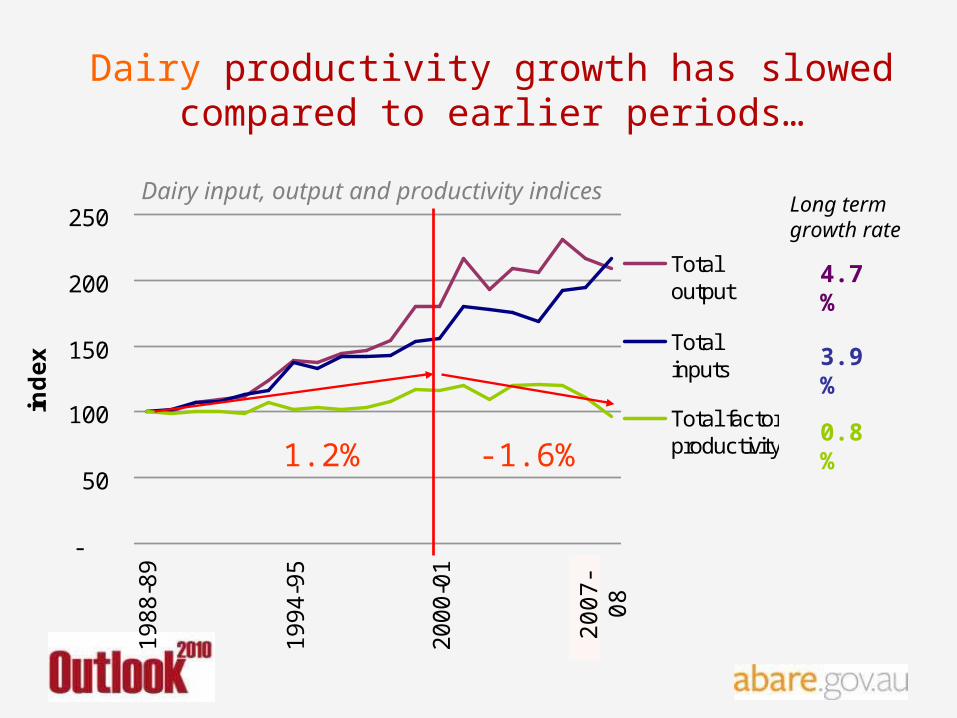
Dairy productivity growth has slowed compared to earlier periods…
-
50
100
150
200
250
19
88
-89
19
94
-95
20
00
-01
20
06
-07
ind
ex
Totaloutput
Totalinputs
Total factorproductivity 0.8%
3.9%
4.7%
Long term growth rate
Dairy input, output and productivity indices
2007
-08
1.2% -1.6%

Change in broadacre productivity,by state
0.0
0.5
1.0
1.5
2.0
2.5
3.0
3.5
WA SA NSW VIC QLD TAS NT Australia
TF
P G
row
th (
%)
1978 to 2002
1978 to 2008

The slowdown has been mostly restricted to cropping and dairy farms…
Long term trends in TFP growth
Note: Dairy trends begin from 1988-89 onwards
-1
0
1
2
3
4
Totalbroadacre
Cropping Mixed Crop-livestock
Beef Sheep Dairy*
TF
P g
row
th (
%)
1978 to 1996
1978 to 2002
1978 to 2008

Do we need to worry?
0
50
100
150
200
250
3001
95
3
19
58
19
63
19
68
19
73
19
78
19
83
19
88
19
93
19
98
20
03
20
08
pro
du
cti
vit
y in
de
x
– Broadacre productivity index
– 5 year moving average

Why might productivity growth be slowing?
Slashed output
Drought? R&D investment?
Higher use of
purchased inputs
Reduced confidence
Slowing growth in
public R&D expenditure
DRIVERS

Growth in public agricultural R&D expenditure has slowed….
Source: Mullen (2009)
0
200
400
600
800
100019
53
1962
1971
1980
1989
1998
2007
A$2
008
0
1
2
3
4
5
6
%
Public R&D expenditure
Research intensity

Why might productivity growth be slowing?
Drought? R&D investment?
DRIVERS
Other factors?
Fewer‘big gain’
technologies
Ageing farm population
Fewer expansion
opportunities
Changing research priorities
Knowledge constraints

Challenges for productivity growth in Australian agriculture…
How much R&D should be public/private funded?
Where should public R&D be allocated?
How much basic/applied research?
How do we better communicate research to users?
What policies are impeding structural adjustment?
How could these policies be improved?

thankyou
Recommended