Proficiency Testing of (Gamma) Non-Destructive Assay Laboratories by NPL
Julian Dean
National Physical Laboratory, Hampton Road, Teddington, Middlesex, UK TW11 0LW
The National Physical Laboratory (NPL), as the UK’s National Measurement Institute, is a multidisciplinary
research laboratory which develops and disseminates primary standards of measurement and provides
measurement services and technology transfer across a wide range of technical areas. NPL’s Radioactivity Group
carries out these functions for the radioactivity measurement community; amongst its many areas of expertise, the
group has built up many years’ experience of running Proficiency Test Exercises (PTEs) in fields such as
environmental radioactivity monitoring. In 2007, in response to feedback from the nuclear site decommissioning
sector, NPL began running PTEs for laboratories who need to measure low levels of gamma-emitters in large
waste containers, such as 200 litre drums.
To date, NPL has run four PTEs for waste measurement laboratories. In each exercise, (i) a 200 litre drum
containing ‘simulated’ waste spiked with gamma-emitting radionuclides (with activity concentrations traceable to
primary standards) was prepared and certificated by NPL, (ii) the drum was sent to each participating laboratory in
turn as a 'blind sample’ for assay, (iii) the participants reported their results to NPL, and (iv) all the results were
summarised by NPL in a single report. Each participant’s results were assigned a code number in the report for
confidentiality. The PTEs to date have highlighted possible needs for training in the use of mathematical modelling
software. Also, there is some evidence that results obtained using Segmented Gamma Scanners are biased low
(compared with 'open' measurement geometries) when layers or hotspots are present. The PTEs are proving
valuable to the waste measurement sector by providing them with confidence in waste assay at low activity levels
and enabling laboratories to demonstrate measurement proficiency to third parties.
1. INTRODUCTION
The National Physical Laboratory (NPL) is the UK’s National Measurement Institute (NMI) and a
multidisciplinary research laboratory serving some 20 generic areas of science and engineering. NPL develops
and maintains primary standards of measurement, disseminates them to the user base and helps users improve
measurement accuracy (for example, via training courses, workshops and Measurement Good Practice Guides).
The laboratory works in collaboration with NMIs in other countries (e.g. NIST in the USA and PTB in
Germany) to ensure that primary standards of measurement are harmonised across the globe.
In the field of radioactivity measurement, NPL’s Radioactivity Group addresses users’ needs in a variety of
sectors (e.g. environmental analysis, nuclear medicine and academia). There are needs not only for standards
and reference materials but also for some independent verification that users’ measurement techniques are
accurate. NPL began running Proficiency Test Exercises (PTEs) for radioactivity in the late 1980s, in particular
for the environmental analysis sector where the laboratory has run 19 such exercises over the last 24 years; in so
doing, NPL has acquired considerable experience in areas such as low-level radioactive source preparation and
validation, data analysis methods and the transport of radioactive sources. This expertise is now being applied to
address the needs of a growing sector in the UK – nuclear site decommissioning.
In the early 2000s, many of the older nuclear facilities and sites in the UK moved into the decommissioning
phase of the nuclear cycle. Very large volumes of potential radioactive waste such as lightly-contaminated
building materials, soils and general laboratory wastes were being generated, and this continues to be a problem
to this day. Such materials must be measured for their radioactive content so they can be consigned to the
correct waste streams. Unfortunately, many wastes are poorly defined (e.g. the material is heterogeneous, or
contains ‘hotspots’, or there are no site records available to indicate which radionuclides may be present). This
can lead to conservative overestimates of activity, leading in turn to unnecessary disposal costs and usage of
valuable LLW repository space. These problems led many laboratories to turn to NPL for reference materials
and for advice on how to carry out the measurements more accurately.
In response, NPL ran a user forum in 2005 to identify the specific needs. The highest priority at that time was
for large-volume standards for -emitters in concrete and ‘soft wastes’ with activity concentrations of
approximately 0.4 Bq g-1
(the upper limit for ‘Exempt waste’ in UK legislation at that time [1, 2]). In response,
NPL prepared a prototype 200 litre ‘standard drum’ spiked at this activity concentration level, and ran a PTE [3]
by circulating the drum to laboratories, on a voluntary basis, as a blind sample. Three further PTEs [4, 5, 6]
followed. This paper reviews the PTEs so far, including how the standard drums were prepared and circulated,
how the participants measured them, how the data were analysed, and the conclusions drawn.
2. PREPARATION OF THE DRUMS
The preparation of the drum for the first PTE (2007) has been described previously [7]. A mixed radionuclide
standard solution of 241
Am, 60
Co and 137
Cs was prepared from stock solutions of the individual radionuclides
previously measured in a secondary standard ionisation chamber. The chamber itself had been calibrated using
primary standards of radioactivity defined by absolute counting techniques [8]. High-resolution -spectrometry
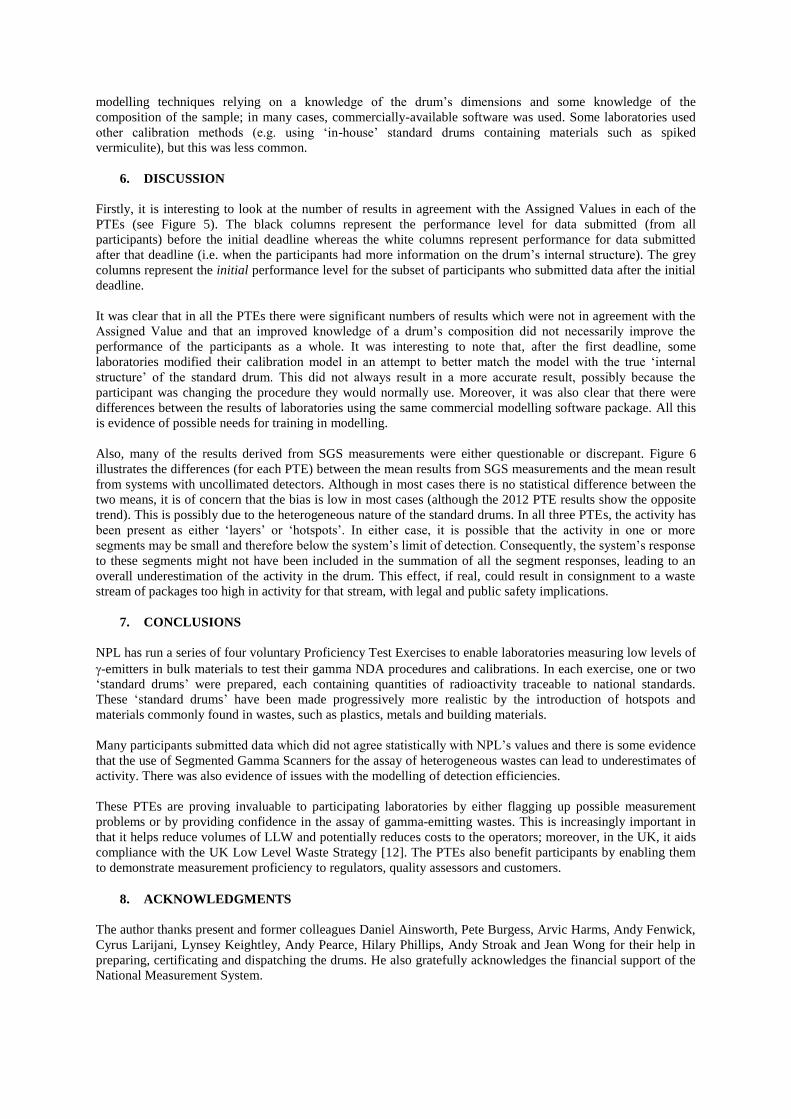
was used to check for -emitting impurities. To form the matrix, 240 plastic bottles (500 ml volume each) were
each part-loaded with dried ion-exchange resin; each bottle was then spiked with the mixed standard solution
before being sealed and homogenised. The bottles were then loaded into a 200 L drum in 5 layers of 48 (see
Figure 1), and an overall contents density of approximately 300 kg m-3
(typical of ‘soft waste’) was achieved.
The activity concentration of each radionuclide was calculated and was designated the ‘Assigned Value’ for that
radionuclide.
A second PTE was run in 2009. In response to feedback from the participants, two drums (Drum A and Drum B,
both containing the same radionuclides as the 2007 drum) were prepared. Again, layers of bottles were used, but
each drum contained only one bottle of ion-exchange resin (containing all the activity present); all other bottles
and voids were filled with vermiculite as a low-density inactive filling matrix. Drum A was similar in activity to
the 2007 drum but Drum B was an order of magnitude higher (approximately 10 Bq g-1
).
A problem with preparing PTE sources of this type is that they should ideally resemble closely a ‘real’ waste
form and at the same time be dimensionally stable so that all participants are measuring the same artefact. With
this in mind, the standard drum for the third PTE (2011) contained sheets of steel and plastic designed to fit
inside the drum as a rigid box-like structure (see Figure 2). Again, 241
Am, 60
Co and 137
Cs were included, but this
time stock solutions of the individual nuclides were dispensed to filter paper samples which were then taped to
the steel sheets to mimic surface contamination. The steel sheets were loaded into a pre-weighed drum along
with (inactive) sheets of Nylon 6-6 and ‘Air Cap’ (Sealed Air Limited, Kettering, UK).
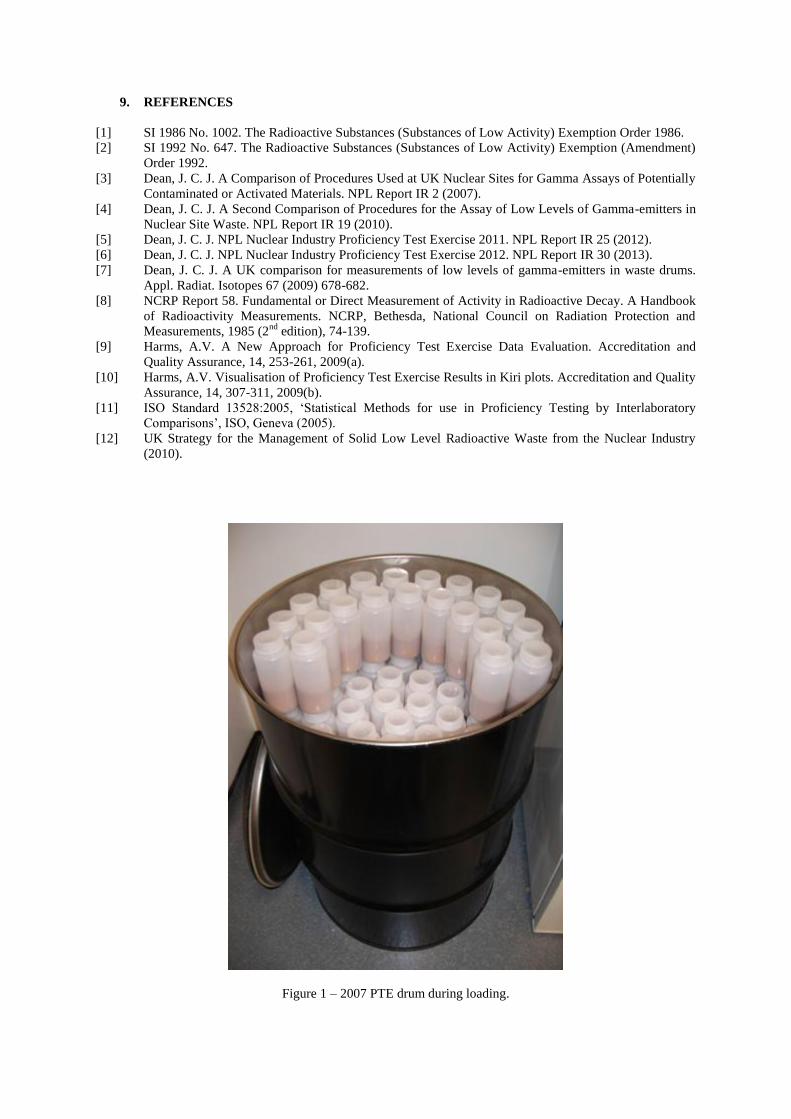
In the most recent PTE (2012), the 2011 drum was modified by adding bottles of inactive coarse aggregate into
the base of the drum and also a bottle of ion-exchange resin containing all three of the radionuclides (see Figure
3). ‘Air Cap’ was excluded from this drum.
Table 1 summarises the specifications of the standard drums used in all four PTEs run so far.
3. TRANSPORT AND DATA REPORTING
Prior to each PTE, a timetable for the transport of the drum between the various sites was agreed well in
advance with all the participants, and it was ensured that all associated documentation (e.g. export licenses and
local site documentation) was in place prior to transport. The timetable also provided sufficient time for each
laboratory to measure the drum and included contingency transport time to accommodate unforeseen delays.
Table 1 includes a breakdown of participant numbers.
Prior to delivery of the drum to each participant, NPL provided forms for measurement results and any related
information (e.g. detector types, calibration methods and measurement uncertainties). The radionuclides present
and the approximate overall activity concentrations were also declared, along with other details (see Table 1).
In the 2009, 2011 and 2012 PTEs, to make the test more realistic, certain details (e.g. the location of the activity
within the drum and details of the matrices present) were initially withheld by NPL but were disclosed after an
‘initial’ results deadline had passed. Participants were then invited to submit additional results (before a second
deadline) using this additional information. Not all participants chose to do this. Results submitted before and
after the initial deadline were treated as separate data sets (designated ‘pre-disclosure’ and ‘post-disclosure’). In
the 2007 PTE, a single deadline was imposed; revisions to data were accepted after this deadline, but any such
revisions were made clear in the PTE report.
4. DATA ANALYSIS
All data submitted were analysed using the method described by Harms [9, 10]. Analysis was carried out as
follows:
(i) The deviation ‘D’ of a participant’s result ‘L’ from the Assigned Value ‘N’ was calculated from:
[1]
and the standard uncertainty ‘uD’ of the deviation was calculated from:
[2]
where ‘uL’ and ‘uN’ are the standard uncertainties of the participant’s result and the Assigned Value,
respectively.
(ii) Three parameters (the zeta score ‘ζ’, the relative uncertainty ‘RL’ and the z-score ‘z’) were calculated for
each result, these being defined as:
[3]
[4]
pmed
NL
NR
NLz
[5]
where Rmed is the median value of RL and p is the standard deviation for proficiency assessment.
n.b. In the 2012 PTE, due to a revision of the NPL data analysis procedure, p was defined as 0.05823N, which
corresponds to a deviation ‘D’ of 15% at the 99% confidence level. This value was chosen ‘by perception’ (as
per ISO 13528:2005 [11]); it corresponds to a level of performance that NPL would wish laboratories to be able
to achieve.
In cases where ζ and z were both ≤ 2.58 and RL was not significantly larger than the other values in the data set,
the result was designated as ‘in agreement’ with the Assigned Value. When RL was significantly larger than the
other values, or either ζ or z (but not both) was > 2.58, the result was designated ‘questionable’. If both ζ and z
were > 2.58, the result was designated ‘discrepant’.
All reported results, the results of the above analyses and any supplementary information submitted by the
participants were summarised in a report issued to the participants. All results were coded for confidentiality.
Figure 4 gives an example of a ‘deviation plot’ (for 137
Cs in the 2007 PTE [3]).
The 2007, 2009 and 2011 PTEs included post-exercise workshops to which all participants were invited. The
results were formally presented and discussed, and many participants took the opportunity to present details of
their NDA methods and to provide NPL with feedback.
5. GAMMA NDA METHODS USED BY PARTICIPANTS
The participants between them used a variety of gamma NDA instruments to measure the drums. Most were
high-resolution gamma spectrometers based one or more hyperpure Ge detector crystals with ancillary signal
processing and data analysis systems, often with a sample loading platforms adjacent to the detector(s). Several
participants used Segmented Gamma Scanners (SGSs). A few participants used low-resolution gamma detectors
(e.g. plastic scintillators and NaI(Tl) crystals). In most cases, detection efficiencies were derived using computer
1100100
N
L
N
NLD
2
N
2
LD 100
N
u
L
u
N
Lu
2
N
2
L uu
NL
L
uR L
L
modelling techniques relying on a knowledge of the drum’s dimensions and some knowledge of the
composition of the sample; in many cases, commercially-available software was used. Some laboratories used
other calibration methods (e.g. using ‘in-house’ standard drums containing materials such as spiked
vermiculite), but this was less common.
6. DISCUSSION
Firstly, it is interesting to look at the number of results in agreement with the Assigned Values in each of the
PTEs (see Figure 5). The black columns represent the performance level for data submitted (from all
participants) before the initial deadline whereas the white columns represent performance for data submitted
after that deadline (i.e. when the participants had more information on the drum’s internal structure). The grey
columns represent the initial performance level for the subset of participants who submitted data after the initial
deadline.
It was clear that in all the PTEs there were significant numbers of results which were not in agreement with the
Assigned Value and that an improved knowledge of a drum’s composition did not necessarily improve the
performance of the participants as a whole. It was interesting to note that, after the first deadline, some
laboratories modified their calibration model in an attempt to better match the model with the true ‘internal
structure’ of the standard drum. This did not always result in a more accurate result, possibly because the
participant was changing the procedure they would normally use. Moreover, it was also clear that there were
differences between the results of laboratories using the same commercial modelling software package. All this
is evidence of possible needs for training in modelling.
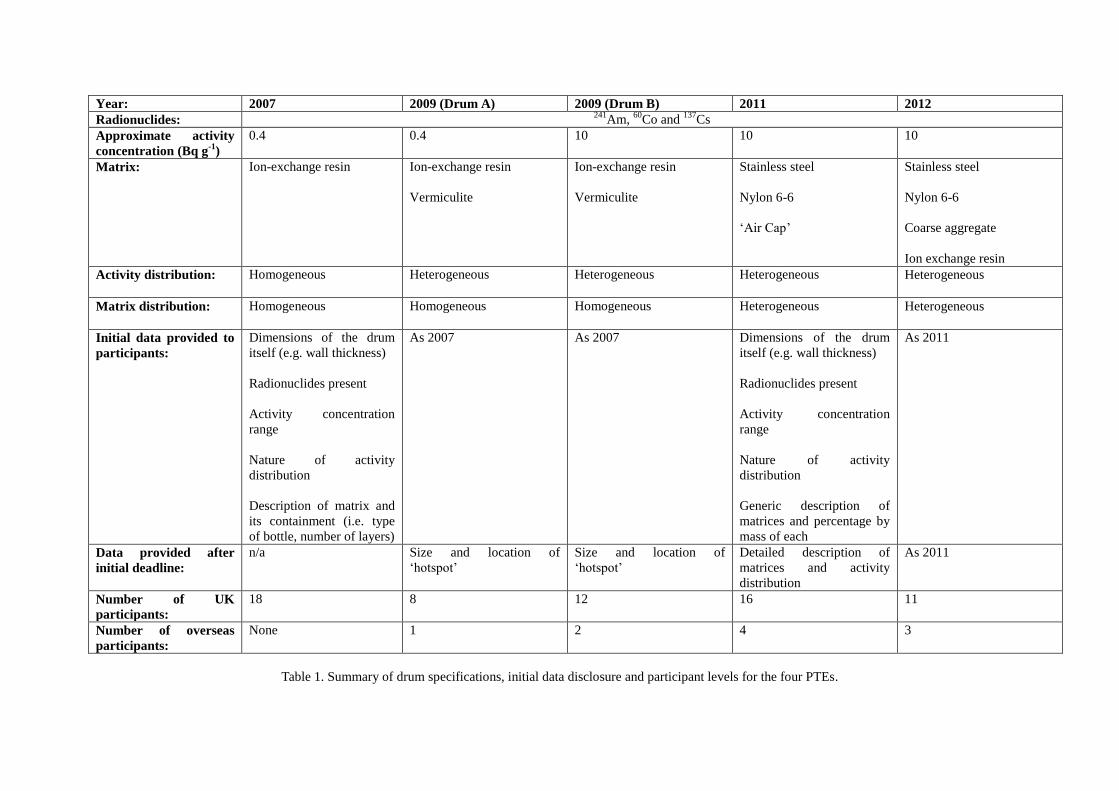
Also, many of the results derived from SGS measurements were either questionable or discrepant. Figure 6
illustrates the differences (for each PTE) between the mean results from SGS measurements and the mean result
from systems with uncollimated detectors. Although in most cases there is no statistical difference between the
two means, it is of concern that the bias is low in most cases (although the 2012 PTE results show the opposite
trend). This is possibly due to the heterogeneous nature of the standard drums. In all three PTEs, the activity has
been present as either ‘layers’ or ‘hotspots’. In either case, it is possible that the activity in one or more
segments may be small and therefore below the system’s limit of detection. Consequently, the system’s response
to these segments might not have been included in the summation of all the segment responses, leading to an
overall underestimation of the activity in the drum. This effect, if real, could result in consignment to a waste
stream of packages too high in activity for that stream, with legal and public safety implications.
7. CONCLUSIONS
NPL has run a series of four voluntary Proficiency Test Exercises to enable laboratories measuring low levels of
-emitters in bulk materials to test their gamma NDA procedures and calibrations. In each exercise, one or two
‘standard drums’ were prepared, each containing quantities of radioactivity traceable to national standards.
These ‘standard drums’ have been made progressively more realistic by the introduction of hotspots and
materials commonly found in wastes, such as plastics, metals and building materials.
Many participants submitted data which did not agree statistically with NPL’s values and there is some evidence
that the use of Segmented Gamma Scanners for the assay of heterogeneous wastes can lead to underestimates of
activity. There was also evidence of issues with the modelling of detection efficiencies.
These PTEs are proving invaluable to participating laboratories by either flagging up possible measurement
problems or by providing confidence in the assay of gamma-emitting wastes. This is increasingly important in
that it helps reduce volumes of LLW and potentially reduces costs to the operators; moreover, in the UK, it aids
compliance with the UK Low Level Waste Strategy [12]. The PTEs also benefit participants by enabling them
to demonstrate measurement proficiency to regulators, quality assessors and customers.
8. ACKNOWLEDGMENTS
The author thanks present and former colleagues Daniel Ainsworth, Pete Burgess, Arvic Harms, Andy Fenwick,
Cyrus Larijani, Lynsey Keightley, Andy Pearce, Hilary Phillips, Andy Stroak and Jean Wong for their help in
preparing, certificating and dispatching the drums. He also gratefully acknowledges the financial support of the
National Measurement System.
9. REFERENCES
[1] SI 1986 No. 1002. The Radioactive Substances (Substances of Low Activity) Exemption Order 1986.
[2] SI 1992 No. 647. The Radioactive Substances (Substances of Low Activity) Exemption (Amendment)
Order 1992.
[3] Dean, J. C. J. A Comparison of Procedures Used at UK Nuclear Sites for Gamma Assays of Potentially
Contaminated or Activated Materials. NPL Report IR 2 (2007).
[4] Dean, J. C. J. A Second Comparison of Procedures for the Assay of Low Levels of Gamma-emitters in
Nuclear Site Waste. NPL Report IR 19 (2010).
[5] Dean, J. C. J. NPL Nuclear Industry Proficiency Test Exercise 2011. NPL Report IR 25 (2012).
[6] Dean, J. C. J. NPL Nuclear Industry Proficiency Test Exercise 2012. NPL Report IR 30 (2013).
[7] Dean, J. C. J. A UK comparison for measurements of low levels of gamma-emitters in waste drums.
Appl. Radiat. Isotopes 67 (2009) 678-682.
[8] NCRP Report 58. Fundamental or Direct Measurement of Activity in Radioactive Decay. A Handbook
of Radioactivity Measurements. NCRP, Bethesda, National Council on Radiation Protection and
Measurements, 1985 (2nd
edition), 74-139.
[9] Harms, A.V. A New Approach for Proficiency Test Exercise Data Evaluation. Accreditation and
Quality Assurance, 14, 253-261, 2009(a).
[10] Harms, A.V. Visualisation of Proficiency Test Exercise Results in Kiri plots. Accreditation and Quality
Assurance, 14, 307-311, 2009(b).
[11] ISO Standard 13528:2005, ‘Statistical Methods for use in Proficiency Testing by Interlaboratory
Comparisons’, ISO, Geneva (2005).
[12] UK Strategy for the Management of Solid Low Level Radioactive Waste from the Nuclear Industry
(2010).
Figure 1 – 2007 PTE drum during loading.

Figure 2. Schematic of steel and plastic ‘insert’ for 2011 PTE drum.
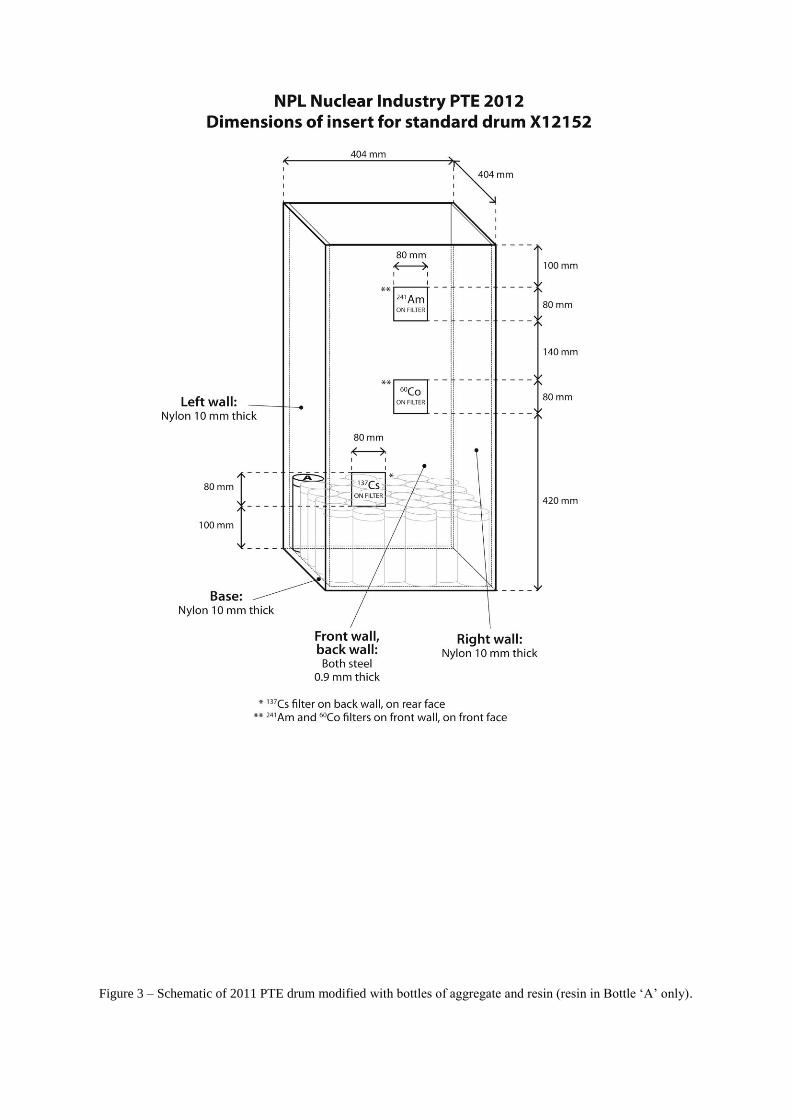
Figure 3 – Schematic of 2011 PTE drum modified with bottles of aggregate and resin (resin in Bottle ‘A’ only).
Figure 4 – Deviation plot for 137
Cs in 2007 PTE [3]. Black squares denote results ‘in agreement’, white squares are ‘questionable’ and black triangles are ‘discrepant’. The
smaller dotted line represents the percentage relative uncertainty on the Assigned Value multiplied by 2.58. The larger dotted line represents the pass/fail limits of the z-score.
-100
0
100
De
via
tio
n (
%)
Participant code
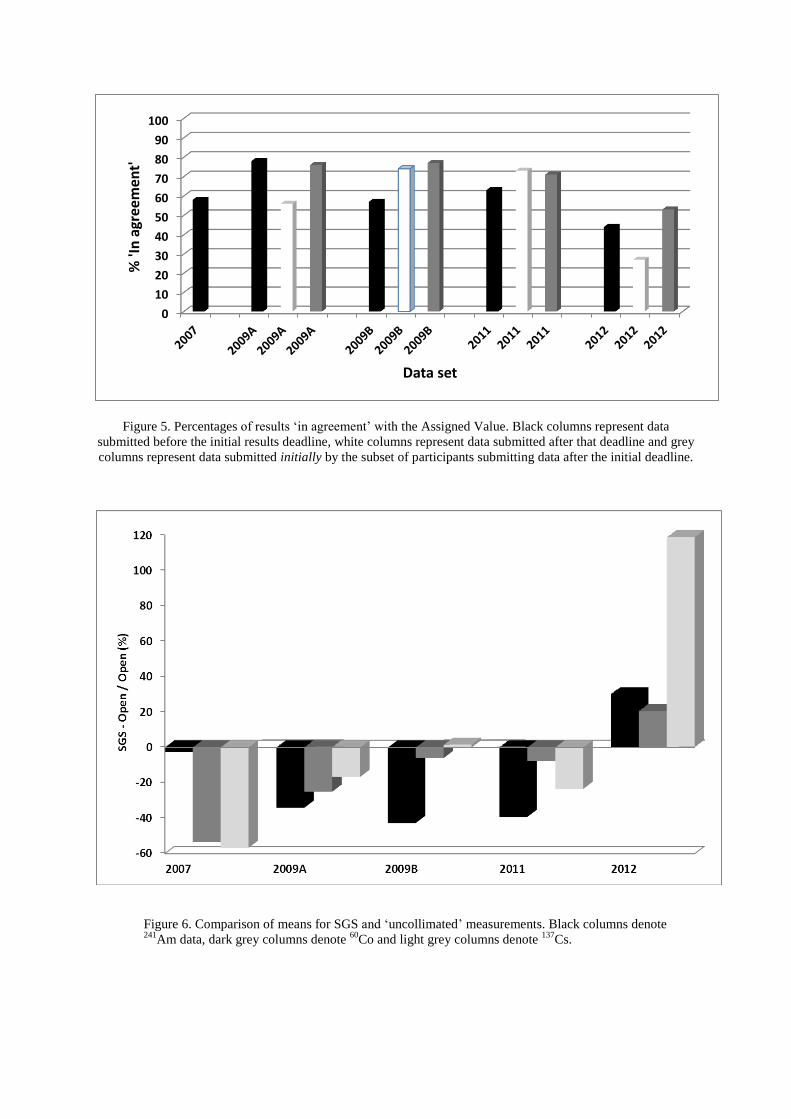
Figure 5. Percentages of results ‘in agreement’ with the Assigned Value. Black columns represent data
submitted before the initial results deadline, white columns represent data submitted after that deadline and grey
columns represent data submitted initially by the subset of participants submitting data after the initial deadline.
Figure 6. Comparison of means for SGS and ‘uncollimated’ measurements. Black columns denote 241
Am data, dark grey columns denote 60
Co and light grey columns denote 137
Cs.
0
10
20
30
40
50
60
70
80
90
100%
'In
agr
eem
ent'
Data set
Year: 2007 2009 (Drum A) 2009 (Drum B) 2011 2012
Radionuclides: 241
Am, 60
Co and 137
Cs
Approximate activity
concentration (Bq g-1
)
0.4 0.4 10 10 10
Matrix: Ion-exchange resin Ion-exchange resin
Vermiculite
Ion-exchange resin
Vermiculite
Stainless steel
Nylon 6-6
‘Air Cap’
Stainless steel
Nylon 6-6
Coarse aggregate
Ion exchange resin
Activity distribution: Homogeneous Heterogeneous Heterogeneous Heterogeneous Heterogeneous
Matrix distribution: Homogeneous Homogeneous Homogeneous Heterogeneous Heterogeneous
Initial data provided to
participants:
Dimensions of the drum
itself (e.g. wall thickness)
Radionuclides present
Activity concentration
range
Nature of activity
distribution
Description of matrix and
its containment (i.e. type
of bottle, number of layers)
As 2007
As 2007
Dimensions of the drum
itself (e.g. wall thickness)
Radionuclides present
Activity concentration
range
Nature of activity
distribution
Generic description of
matrices and percentage by
mass of each
As 2011
Data provided after
initial deadline:
n/a Size and location of
‘hotspot’
Size and location of
‘hotspot’
Detailed description of
matrices and activity
distribution
As 2011
Number of UK
participants:
18 8 12 16 11
Number of overseas
participants:
None 1 2 4 3
Table 1. Summary of drum specifications, initial data disclosure and participant levels for the four PTEs.
Recommended