Project Management Professional (PMP)®
Exam Prep
Course 6 - Project Schedule Management
Slide 1
Looking Glass Development, LLC
(303) 663-5402 / (888) 338-7447
4610 S. Ulster St. #150 Denver, CO 80237
Schedule Management
_____________________________________________________________________________________
_____________________________________________________________________________________
_____________________________________________________________________________________
_____________________________________________________________________________________
_____________________________________________________________________________________
_____________________________________________________________________________________
_____________________________________________________________________________________
_____________________________________________________________________________________
_____________________________________________________________________________________
_____________________________________________________________________________________
Slide 2
Schedule Management
All the processes required to ensure timely completion of the project.
The major output of these processes is the project schedule.
© Copyright and all rights reserved -Looking Glass Development, LLC.
Planning Process Group
_____________________________________________________________________________________
_____________________________________________________________________________________
_____________________________________________________________________________________
_____________________________________________________________________________________
_____________________________________________________________________________________
_____________________________________________________________________________________
_____________________________________________________________________________________
_____________________________________________________________________________________
_____________________________________________________________________________________
_____________________________________________________________________________________
Slide 3
Schedule Management6.1 Plan Schedule Management
Defines the “rules” for developing & managing the schedule.
The benefit of this process is that it provides guidance & direction
on how the schedule will be
managed.
© Copyright and all rights reserved -Looking Glass Development, LLC.
Planning Process Group
_____________________________________________________________________________________
_____________________________________________________________________________________
_____________________________________________________________________________________
_____________________________________________________________________________________
_____________________________________________________________________________________
_____________________________________________________________________________________
_____________________________________________________________________________________
_____________________________________________________________________________________
_____________________________________________________________________________________
_____________________________________________________________________________________
Slide 4
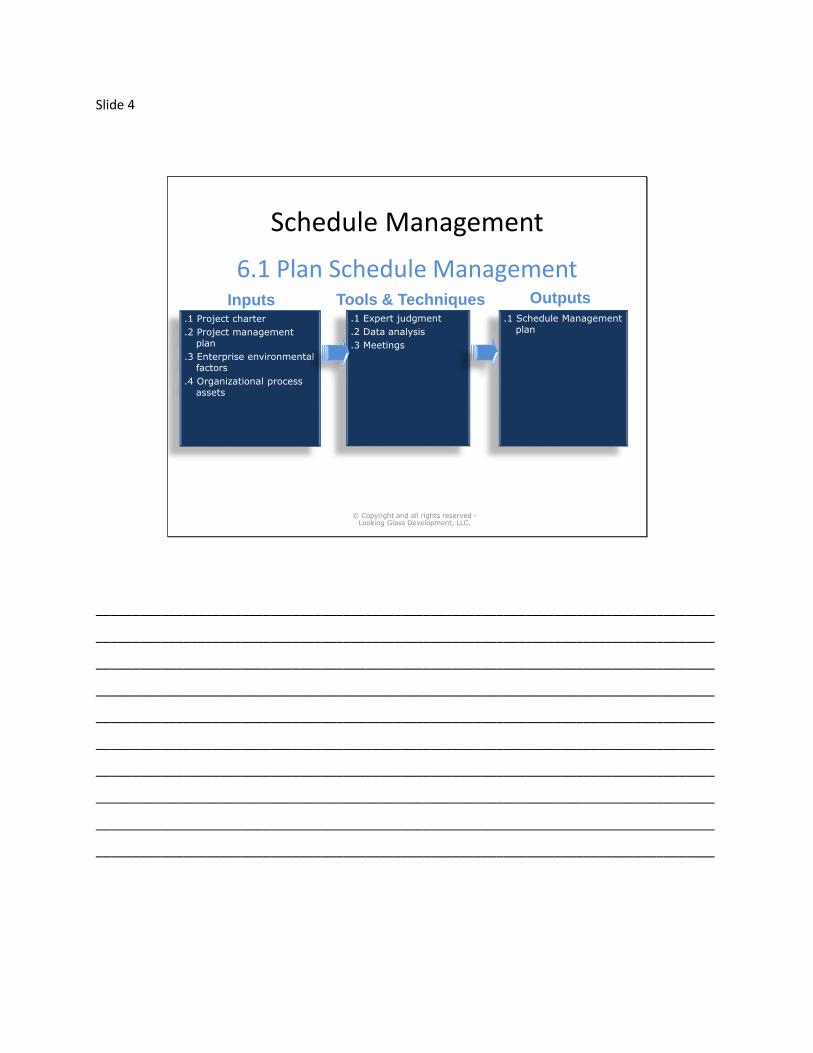
Schedule Management
6.1 Plan Schedule Management
© Copyright and all rights reserved -Looking Glass Development, LLC.
Inputs.1 Project charter
.2 Project management plan
.3 Enterprise environmental factors
.4 Organizational process assets
Tools & Techniques.1 Expert judgment
.2 Data analysis
.3 Meetings
Outputs.1 Schedule Management
plan
_____________________________________________________________________________________
_____________________________________________________________________________________
_____________________________________________________________________________________
_____________________________________________________________________________________
_____________________________________________________________________________________
_____________________________________________________________________________________
_____________________________________________________________________________________
_____________________________________________________________________________________
_____________________________________________________________________________________
_____________________________________________________________________________________
Slide 5
Schedule Management6.2 Define Activities
Creating a “list” of all the work that needs to be done to produce the project deliverables.
Work packages are decomposed into schedule activities.
These schedule activities provide a
basis for estimating, scheduling,
executing, and monitoring and
controlling.
© Copyright and all rights reserved -Looking Glass Development, LLC.
Planning Process Group
_____________________________________________________________________________________
_____________________________________________________________________________________
_____________________________________________________________________________________
_____________________________________________________________________________________
_____________________________________________________________________________________
_____________________________________________________________________________________
_____________________________________________________________________________________
_____________________________________________________________________________________
_____________________________________________________________________________________
_____________________________________________________________________________________
Slide 6
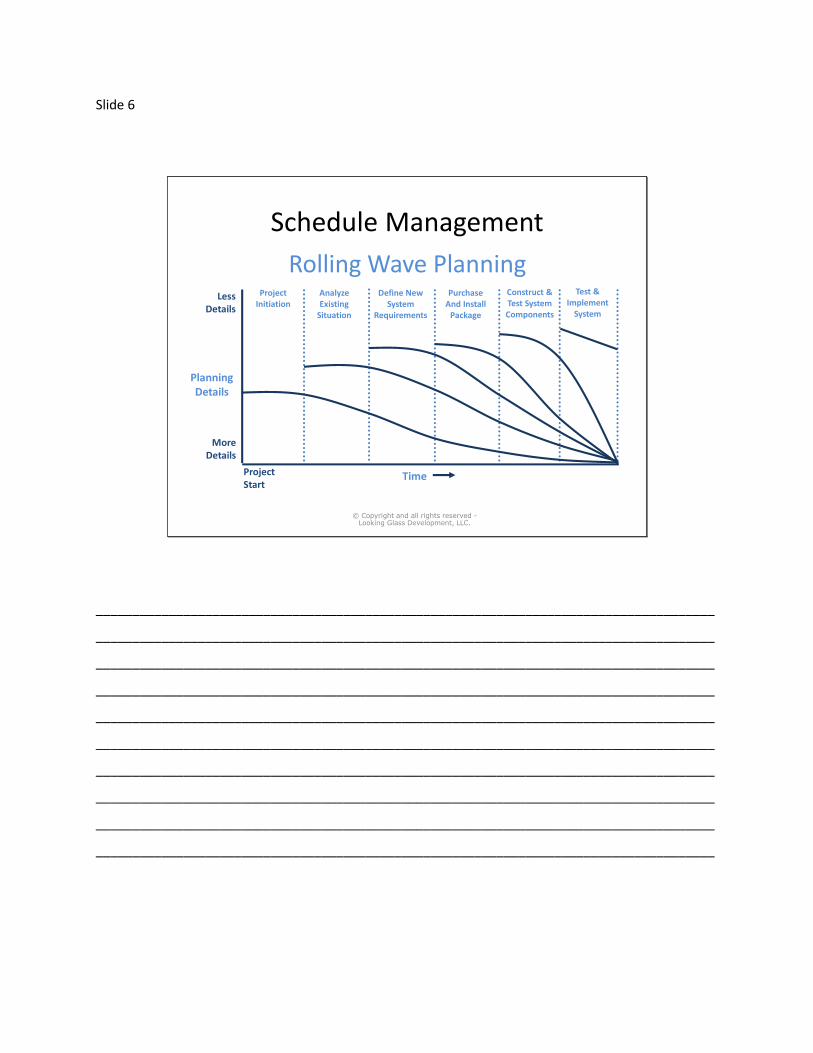
Schedule Management
Rolling Wave Planning
© Copyright and all rights reserved -Looking Glass Development, LLC.
ProjectInitiation
AnalyzeExisting
Situation
Define NewSystem
Requirements
PurchaseAnd Install
Package
Construct &Test SystemComponents
Test &Implement
System
PlanningDetails
MoreDetails
TimeProjectStart
LessDetails
_____________________________________________________________________________________
_____________________________________________________________________________________
_____________________________________________________________________________________
_____________________________________________________________________________________
_____________________________________________________________________________________
_____________________________________________________________________________________
_____________________________________________________________________________________
_____________________________________________________________________________________
_____________________________________________________________________________________
_____________________________________________________________________________________
Slide 7
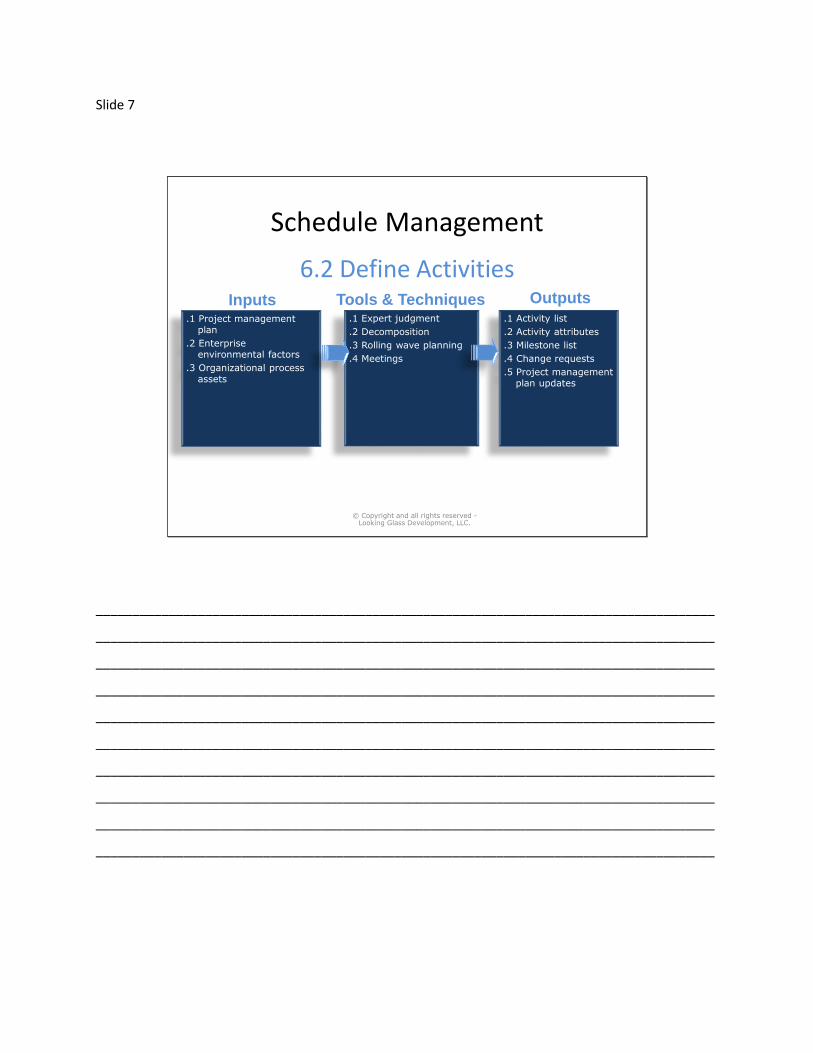
Schedule Management
6.2 Define Activities
© Copyright and all rights reserved -Looking Glass Development, LLC.
Inputs.1 Project management
plan
.2 Enterprise environmental factors
.3 Organizational process assets
Tools & Techniques.1 Expert judgment
.2 Decomposition
.3 Rolling wave planning
.4 Meetings
Outputs.1 Activity list
.2 Activity attributes
.3 Milestone list
.4 Change requests
.5 Project management plan updates
_____________________________________________________________________________________
_____________________________________________________________________________________
_____________________________________________________________________________________
_____________________________________________________________________________________
_____________________________________________________________________________________
_____________________________________________________________________________________
_____________________________________________________________________________________
_____________________________________________________________________________________
_____________________________________________________________________________________
_____________________________________________________________________________________
Slide 8
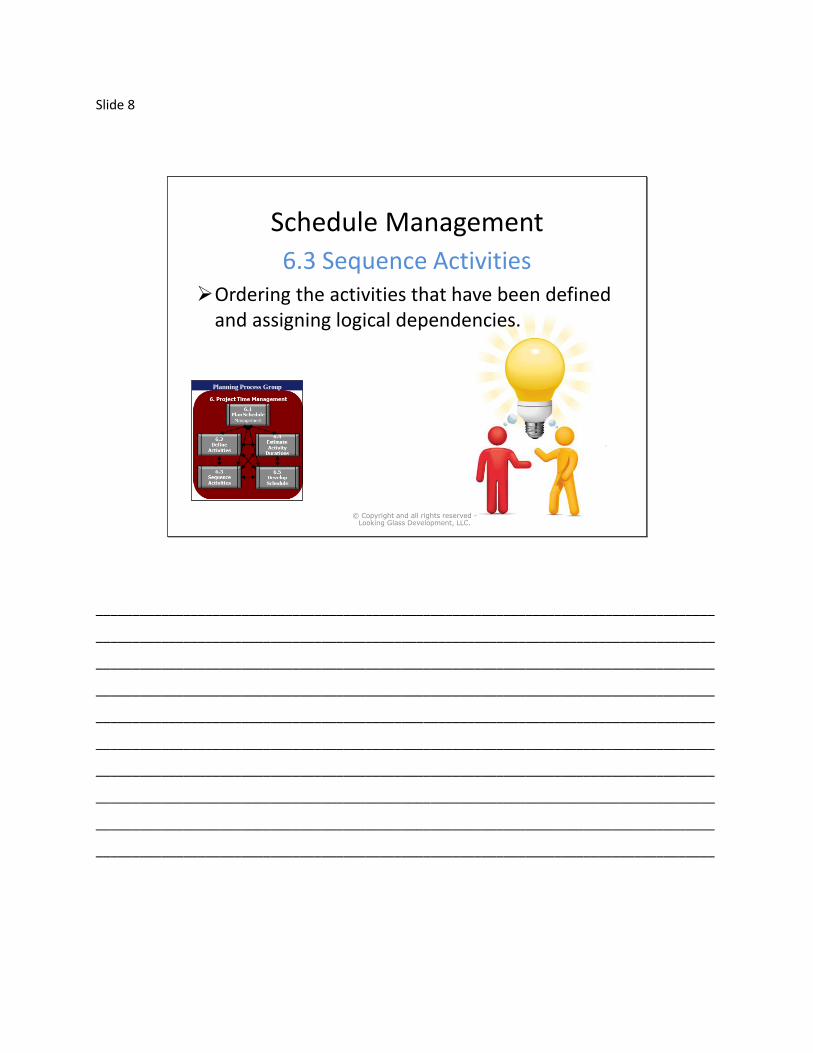
Schedule Management
6.3 Sequence ActivitiesOrdering the activities that have been defined
and assigning logical dependencies.
© Copyright and all rights reserved -Looking Glass Development, LLC.
Planning Process Group
_____________________________________________________________________________________
_____________________________________________________________________________________
_____________________________________________________________________________________
_____________________________________________________________________________________
_____________________________________________________________________________________
_____________________________________________________________________________________
_____________________________________________________________________________________
_____________________________________________________________________________________
_____________________________________________________________________________________
_____________________________________________________________________________________
Slide 9
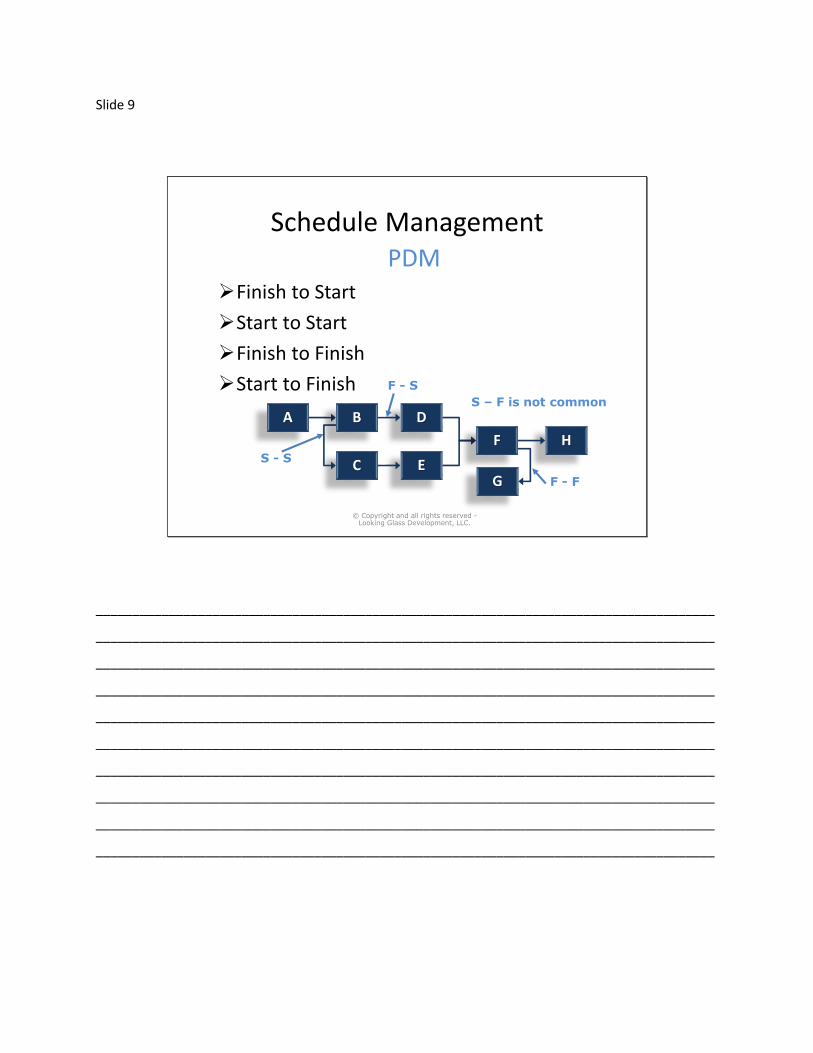
Schedule ManagementPDM
Finish to Start
Start to Start
Finish to Finish
Start to Finish
© Copyright and all rights reserved -Looking Glass Development, LLC.
F - F
S – F is not common
S - S
F - S
A
C
B D
EG
F H
_____________________________________________________________________________________
_____________________________________________________________________________________
_____________________________________________________________________________________
_____________________________________________________________________________________
_____________________________________________________________________________________
_____________________________________________________________________________________
_____________________________________________________________________________________
_____________________________________________________________________________________
_____________________________________________________________________________________
_____________________________________________________________________________________
Slide 10
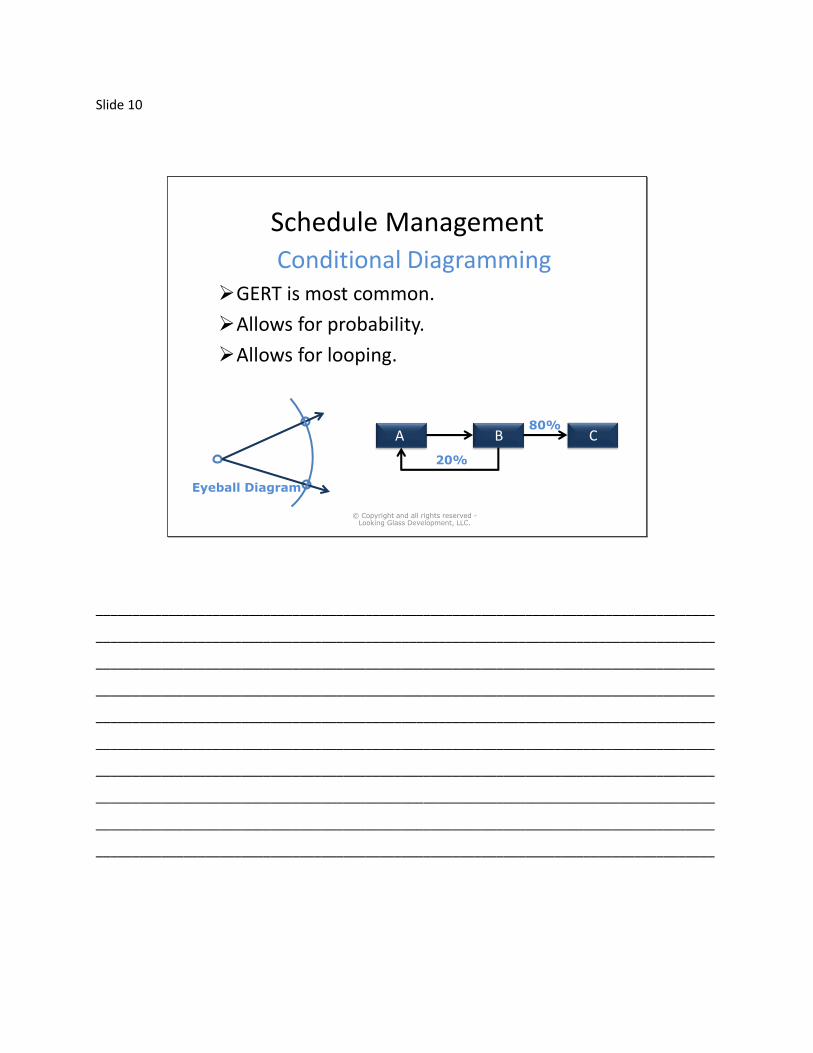
Schedule Management
Conditional DiagrammingGERT is most common.
Allows for probability.
Allows for looping.
© Copyright and all rights reserved -Looking Glass Development, LLC.
Eyeball Diagram
A B C
20%
80%
_____________________________________________________________________________________
_____________________________________________________________________________________
_____________________________________________________________________________________
_____________________________________________________________________________________
_____________________________________________________________________________________
_____________________________________________________________________________________
_____________________________________________________________________________________
_____________________________________________________________________________________
_____________________________________________________________________________________
_____________________________________________________________________________________
Slide 11
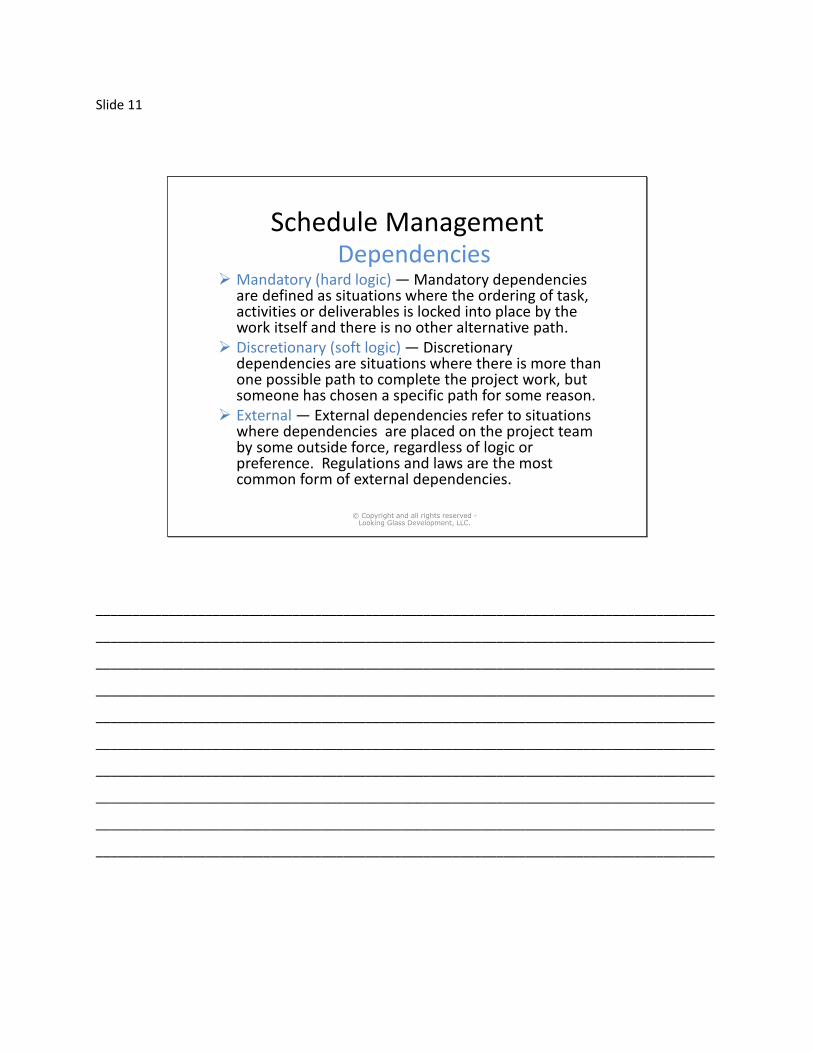
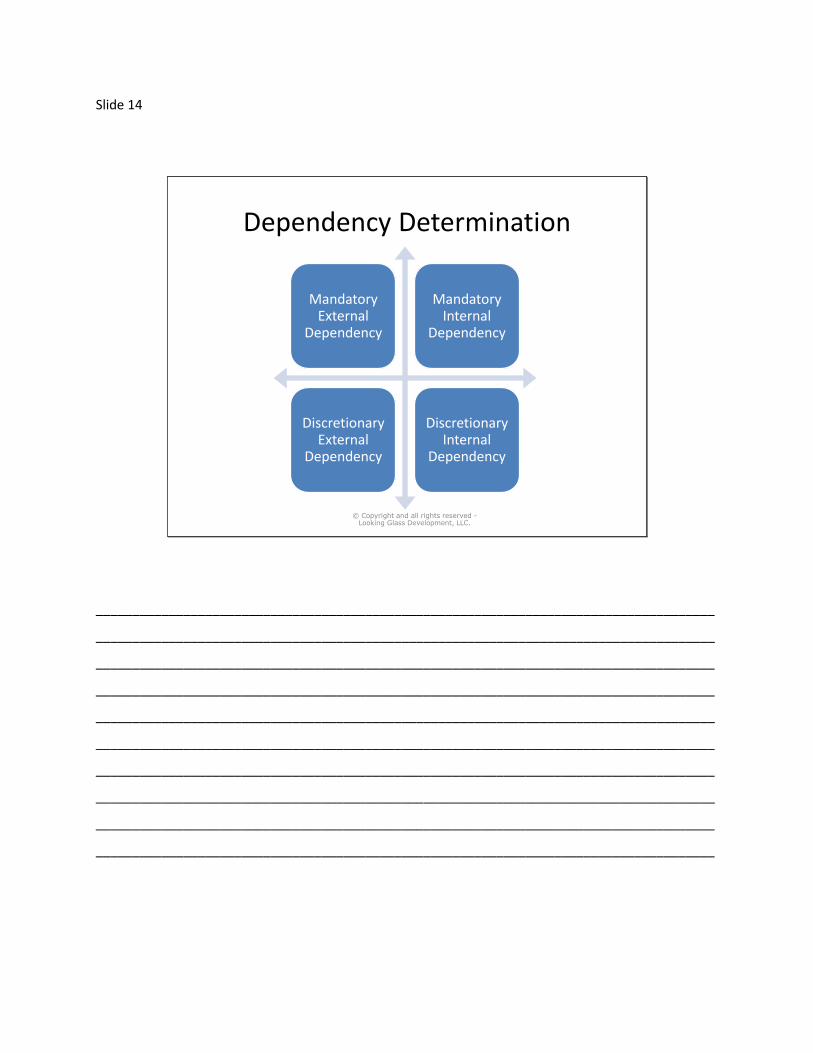
Schedule ManagementDependencies
Mandatory (hard logic) — Mandatory dependencies are defined as situations where the ordering of task, activities or deliverables is locked into place by the work itself and there is no other alternative path.
Discretionary (soft logic) — Discretionary dependencies are situations where there is more than one possible path to complete the project work, but someone has chosen a specific path for some reason.
External — External dependencies refer to situations where dependencies are placed on the project team by some outside force, regardless of logic or preference. Regulations and laws are the most common form of external dependencies.
© Copyright and all rights reserved -Looking Glass Development, LLC.
_____________________________________________________________________________________
_____________________________________________________________________________________
_____________________________________________________________________________________
_____________________________________________________________________________________
_____________________________________________________________________________________
_____________________________________________________________________________________
_____________________________________________________________________________________
_____________________________________________________________________________________
_____________________________________________________________________________________
_____________________________________________________________________________________
Slide 12
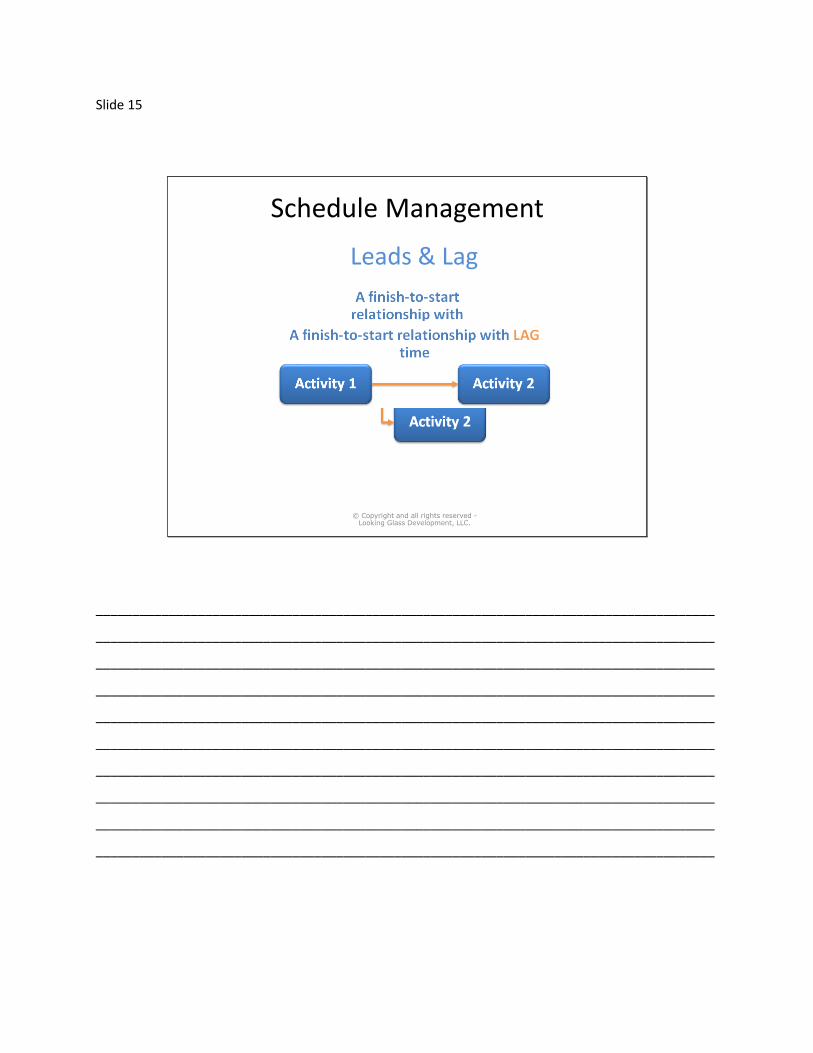
Schedule ManagementLeads & Lag
Lead time occurs whenever a finish-to-start relationship allows the successor task to start prior to the completion of the predecessor.
Lag time represents a relationship that requires a delay between the two tasks.
© Copyright and all rights reserved -Looking Glass Development, LLC.
_____________________________________________________________________________________
_____________________________________________________________________________________
_____________________________________________________________________________________
_____________________________________________________________________________________
_____________________________________________________________________________________
_____________________________________________________________________________________
_____________________________________________________________________________________
_____________________________________________________________________________________
_____________________________________________________________________________________
_____________________________________________________________________________________
Slide 13
Schedule Management
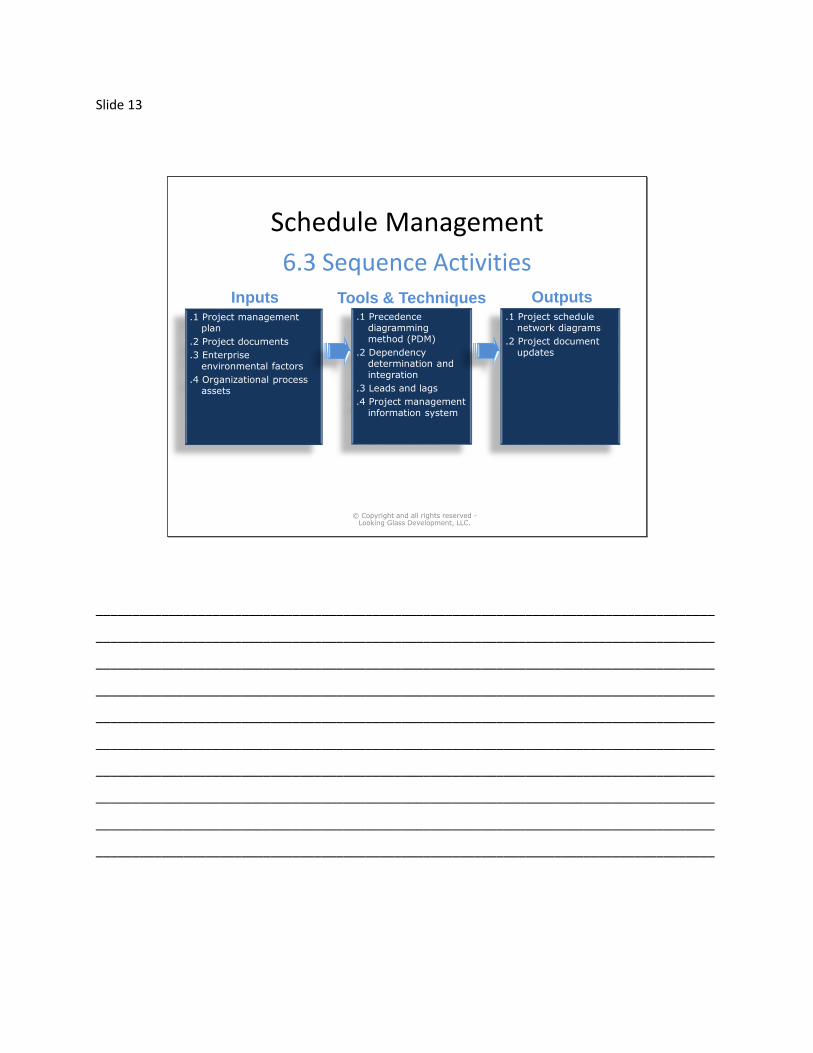
6.3 Sequence Activities
© Copyright and all rights reserved -Looking Glass Development, LLC.
Inputs.1 Project management
plan
.2 Project documents
.3 Enterprise environmental factors
.4 Organizational process assets
Tools & Techniques.1 Precedence
diagramming method (PDM)
.2 Dependency determination and integration
.3 Leads and lags
.4 Project management information system
Outputs.1 Project schedule
network diagrams
.2 Project document updates
_____________________________________________________________________________________
_____________________________________________________________________________________
_____________________________________________________________________________________
_____________________________________________________________________________________
_____________________________________________________________________________________
_____________________________________________________________________________________
_____________________________________________________________________________________
_____________________________________________________________________________________
_____________________________________________________________________________________
_____________________________________________________________________________________
Slide 14
Dependency Determination
Mandatory External
Dependency
Mandatory Internal
Dependency
Discretionary External
Dependency
Discretionary Internal
Dependency
© Copyright and all rights reserved -Looking Glass Development, LLC.
_____________________________________________________________________________________
_____________________________________________________________________________________
_____________________________________________________________________________________
_____________________________________________________________________________________
_____________________________________________________________________________________
_____________________________________________________________________________________
_____________________________________________________________________________________
_____________________________________________________________________________________
_____________________________________________________________________________________
_____________________________________________________________________________________
Slide 15
Schedule Management
Leads & Lag
© Copyright and all rights reserved -Looking Glass Development, LLC.
_____________________________________________________________________________________
_____________________________________________________________________________________
_____________________________________________________________________________________
_____________________________________________________________________________________
_____________________________________________________________________________________
_____________________________________________________________________________________
_____________________________________________________________________________________
_____________________________________________________________________________________
_____________________________________________________________________________________
_____________________________________________________________________________________
Slide 16
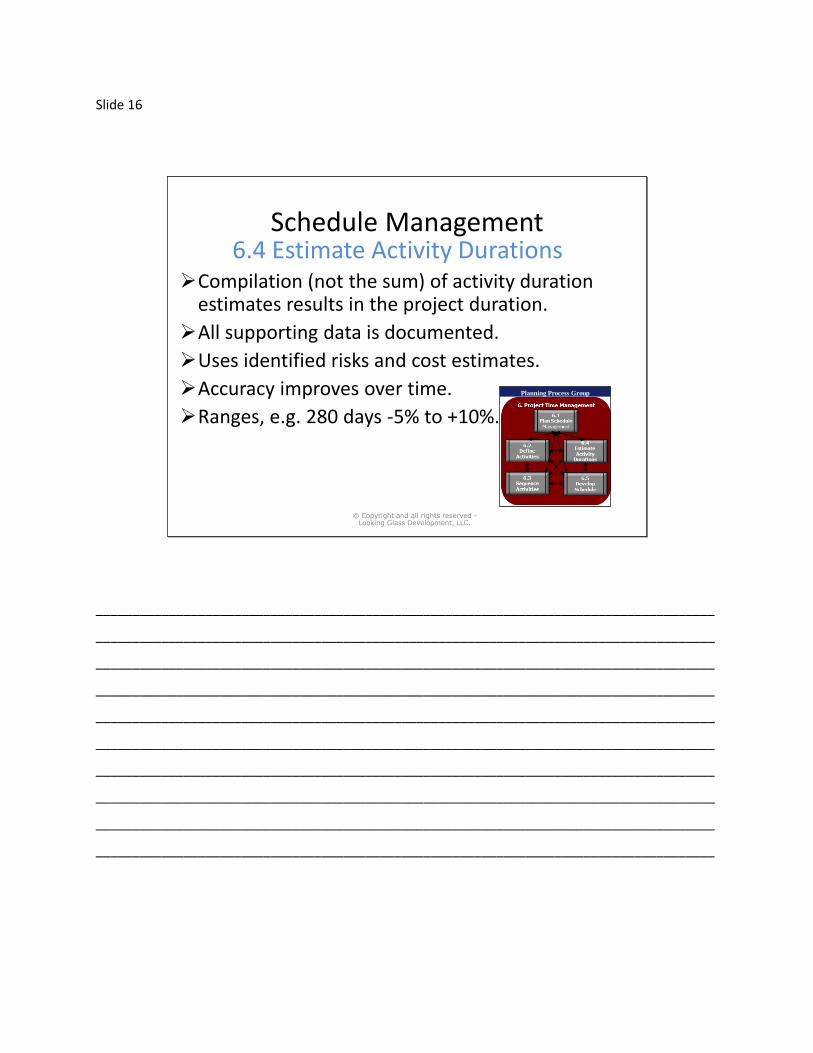
Schedule Management6.4 Estimate Activity Durations
Compilation (not the sum) of activity duration estimates results in the project duration.
All supporting data is documented.
Uses identified risks and cost estimates.
Accuracy improves over time.
Ranges, e.g. 280 days -5% to +10%.
© Copyright and all rights reserved -Looking Glass Development, LLC.
Planning Process Group
_____________________________________________________________________________________
_____________________________________________________________________________________
_____________________________________________________________________________________
_____________________________________________________________________________________
_____________________________________________________________________________________
_____________________________________________________________________________________
_____________________________________________________________________________________
_____________________________________________________________________________________
_____________________________________________________________________________________
_____________________________________________________________________________________
Slide 17
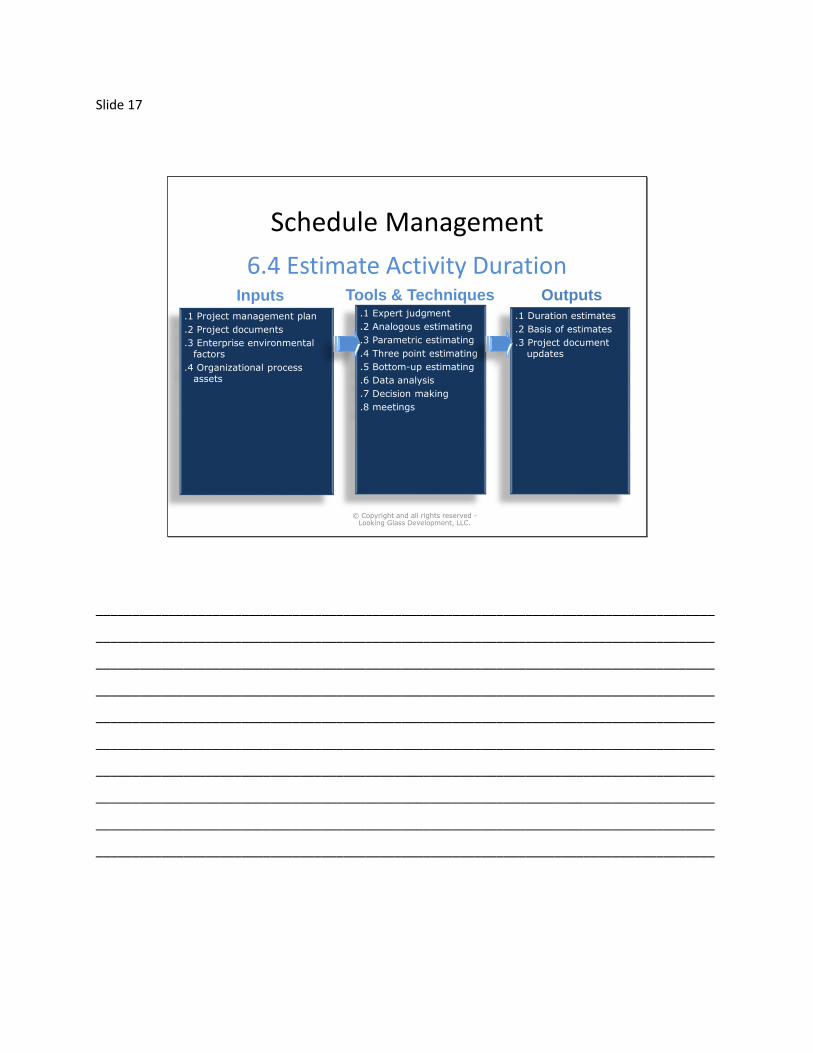
Schedule Management
6.4 Estimate Activity Duration
© Copyright and all rights reserved -Looking Glass Development, LLC.
Inputs
.1 Project management plan
.2 Project documents
.3 Enterprise environmental factors
.4 Organizational process assets
Tools & Techniques.1 Expert judgment
.2 Analogous estimating
.3 Parametric estimating
.4 Three point estimating
.5 Bottom-up estimating
.6 Data analysis
.7 Decision making
.8 meetings
Outputs.1 Duration estimates
.2 Basis of estimates
.3 Project document updates
_____________________________________________________________________________________
_____________________________________________________________________________________
_____________________________________________________________________________________
_____________________________________________________________________________________
_____________________________________________________________________________________
_____________________________________________________________________________________
_____________________________________________________________________________________
_____________________________________________________________________________________
_____________________________________________________________________________________
_____________________________________________________________________________________
Slide 18
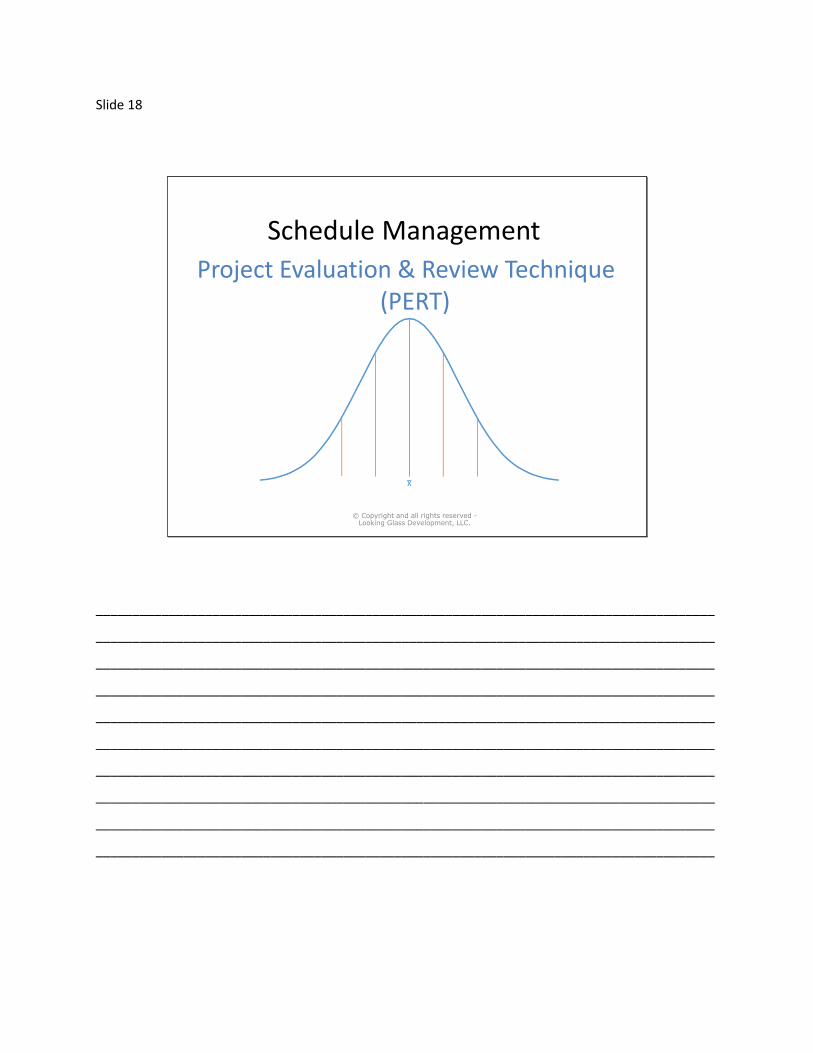
Project Evaluation & Review Technique (PERT)
Schedule Management
© Copyright and all rights reserved -Looking Glass Development, LLC.
_____________________________________________________________________________________
_____________________________________________________________________________________
_____________________________________________________________________________________
_____________________________________________________________________________________
_____________________________________________________________________________________
_____________________________________________________________________________________
_____________________________________________________________________________________
_____________________________________________________________________________________
_____________________________________________________________________________________
_____________________________________________________________________________________
Slide 19
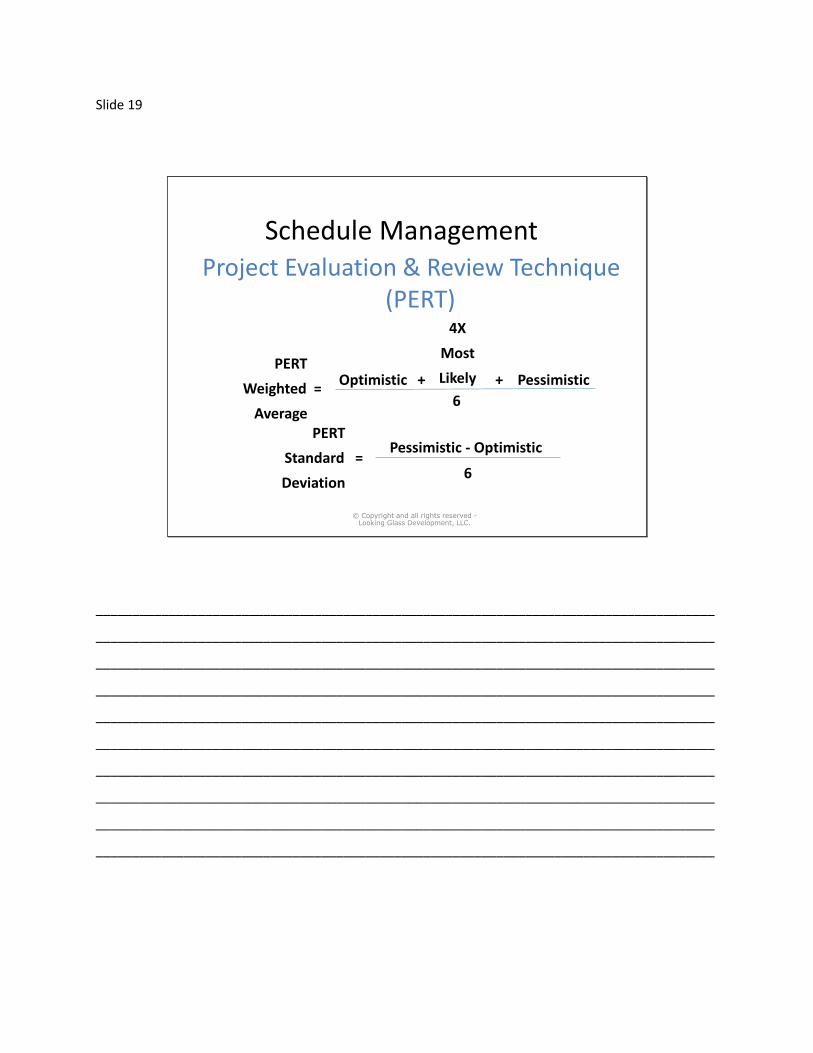
Project Evaluation & Review Technique (PERT)
Schedule Management
PERT
Weighted =
Average
Optimistic +
4X
Most
Likely + Pessimistic
6
PERT
Standard =
Deviation
Pessimistic - Optimistic
6
© Copyright and all rights reserved -Looking Glass Development, LLC.
_____________________________________________________________________________________
_____________________________________________________________________________________
_____________________________________________________________________________________
_____________________________________________________________________________________
_____________________________________________________________________________________
_____________________________________________________________________________________
_____________________________________________________________________________________
_____________________________________________________________________________________
_____________________________________________________________________________________
_____________________________________________________________________________________
Slide 20
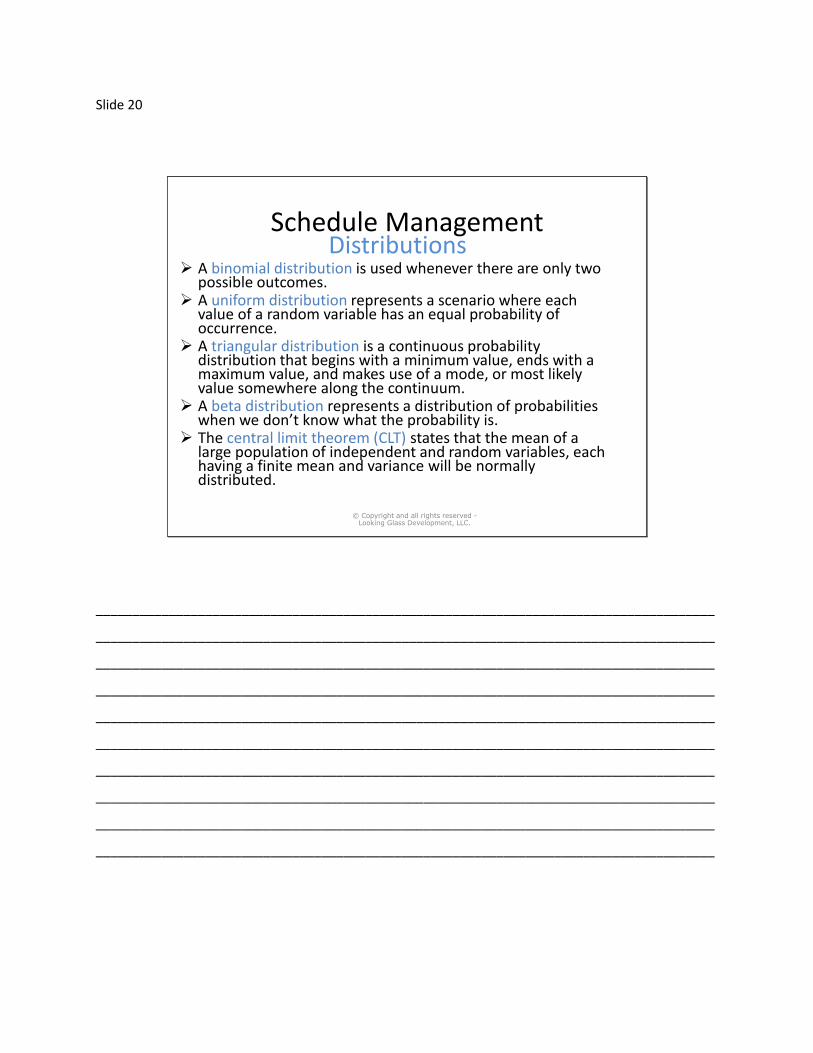
Schedule ManagementDistributions
A binomial distribution is used whenever there are only two possible outcomes.
A uniform distribution represents a scenario where each value of a random variable has an equal probability of occurrence.
A triangular distribution is a continuous probability distribution that begins with a minimum value, ends with a maximum value, and makes use of a mode, or most likely value somewhere along the continuum.
A beta distribution represents a distribution of probabilities when we don’t know what the probability is.
The central limit theorem (CLT) states that the mean of a large population of independent and random variables, each having a finite mean and variance will be normally distributed.
© Copyright and all rights reserved -Looking Glass Development, LLC.
_____________________________________________________________________________________
_____________________________________________________________________________________
_____________________________________________________________________________________
_____________________________________________________________________________________
_____________________________________________________________________________________
_____________________________________________________________________________________
_____________________________________________________________________________________
_____________________________________________________________________________________
_____________________________________________________________________________________
_____________________________________________________________________________________
Slide 21
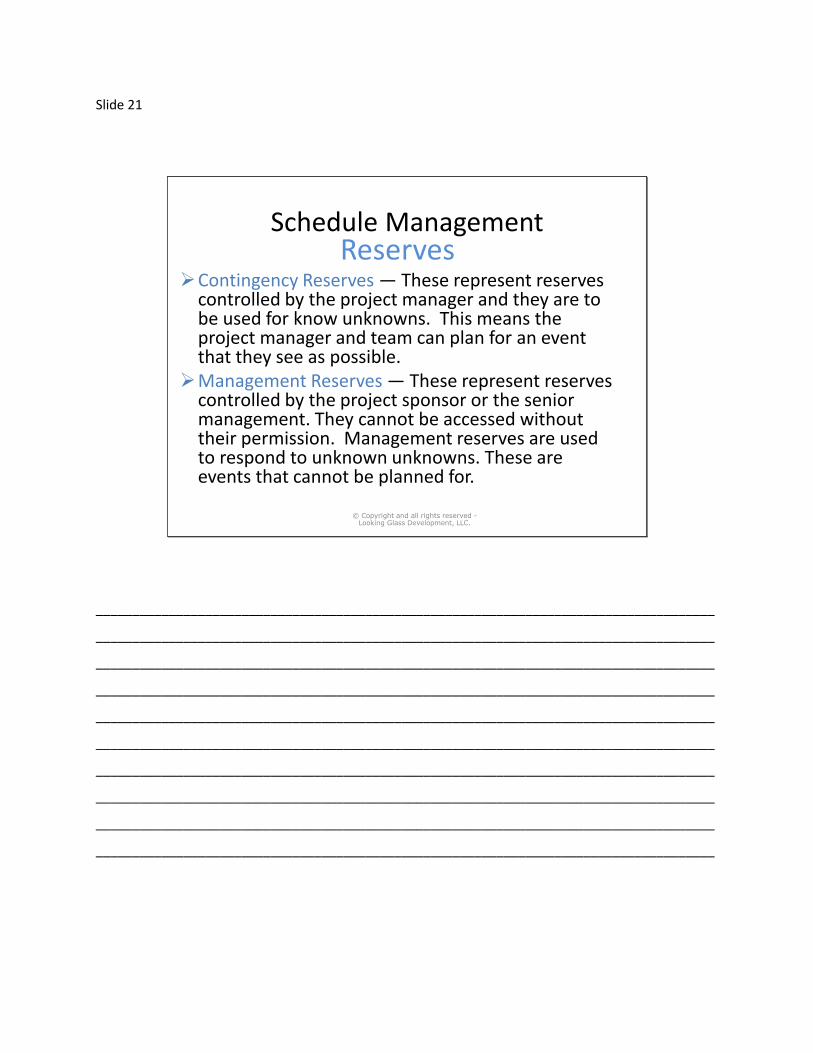
Schedule ManagementReserves
Contingency Reserves — These represent reserves controlled by the project manager and they are to be used for know unknowns. This means the project manager and team can plan for an event that they see as possible.
Management Reserves — These represent reserves controlled by the project sponsor or the senior management. They cannot be accessed without their permission. Management reserves are used to respond to unknown unknowns. These are events that cannot be planned for.
© Copyright and all rights reserved -Looking Glass Development, LLC.
_____________________________________________________________________________________
_____________________________________________________________________________________
_____________________________________________________________________________________
_____________________________________________________________________________________
_____________________________________________________________________________________
_____________________________________________________________________________________
_____________________________________________________________________________________
_____________________________________________________________________________________
_____________________________________________________________________________________
_____________________________________________________________________________________
Slide 22
Schedule Management
Agile Estimation• Ideal Time - Assumes resources 100% dedicated
• Relative Sizing – Often called T-Shirt sizing.
• Story Points – Aggregates complexity & time.
• Fibonacci Sequence – Another comparison technique.
• Affinity Estimating – Process of grouping requirements into categories or collections. Used to group similarly sized user stories together.
© Copyright and all rights reserved -Looking Glass Development, LLC.
_____________________________________________________________________________________
_____________________________________________________________________________________
_____________________________________________________________________________________
_____________________________________________________________________________________
_____________________________________________________________________________________
_____________________________________________________________________________________
_____________________________________________________________________________________
_____________________________________________________________________________________
_____________________________________________________________________________________
_____________________________________________________________________________________
Slide 23
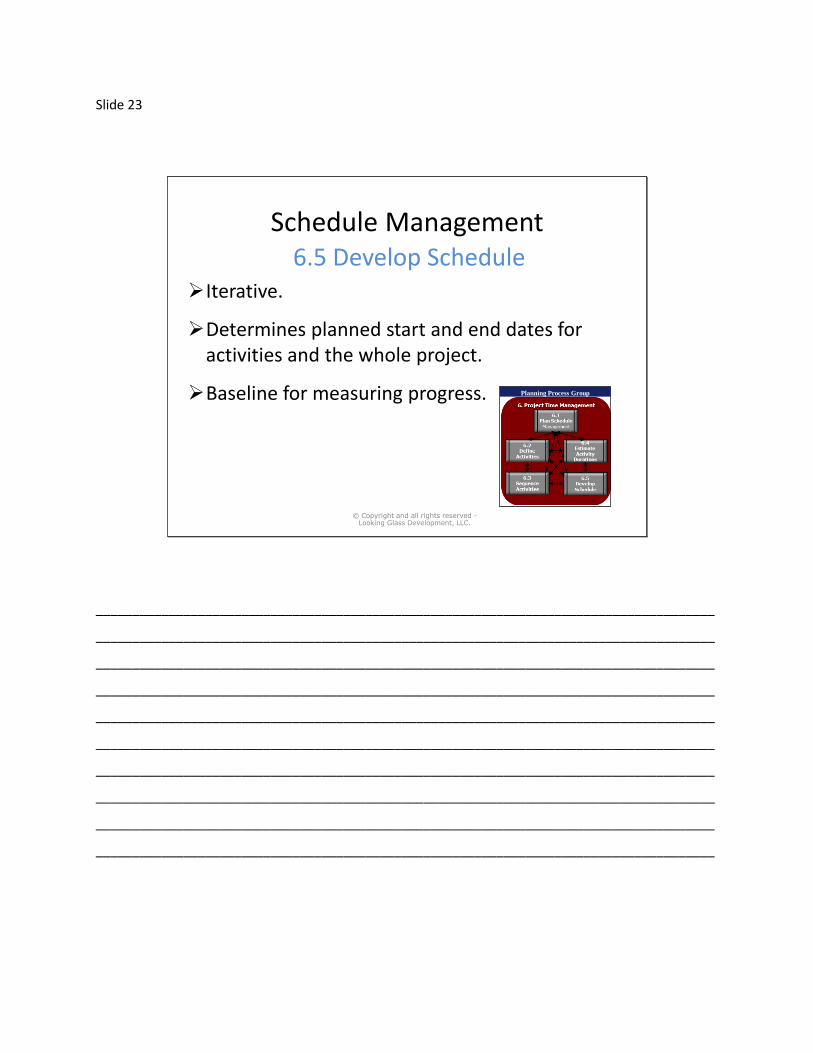
Schedule Management6.5 Develop Schedule
Iterative.
Determines planned start and end dates for activities and the whole project.
Baseline for measuring progress.
© Copyright and all rights reserved -Looking Glass Development, LLC.
Planning Process Group
_____________________________________________________________________________________
_____________________________________________________________________________________
_____________________________________________________________________________________
_____________________________________________________________________________________
_____________________________________________________________________________________
_____________________________________________________________________________________
_____________________________________________________________________________________
_____________________________________________________________________________________
_____________________________________________________________________________________
_____________________________________________________________________________________
Slide 24
Schedule ManagementCPM
The Critical Path is the project path which will be the longest duration or where all activities have zero float.
The Critical Path does not necessarily have the greatest risk.
The Critical Path determines the earliest completion of the project.
© Copyright and all rights reserved -Looking Glass Development, LLC.
_____________________________________________________________________________________
_____________________________________________________________________________________
_____________________________________________________________________________________
_____________________________________________________________________________________
_____________________________________________________________________________________
_____________________________________________________________________________________
_____________________________________________________________________________________
_____________________________________________________________________________________
_____________________________________________________________________________________
_____________________________________________________________________________________
Slide 25
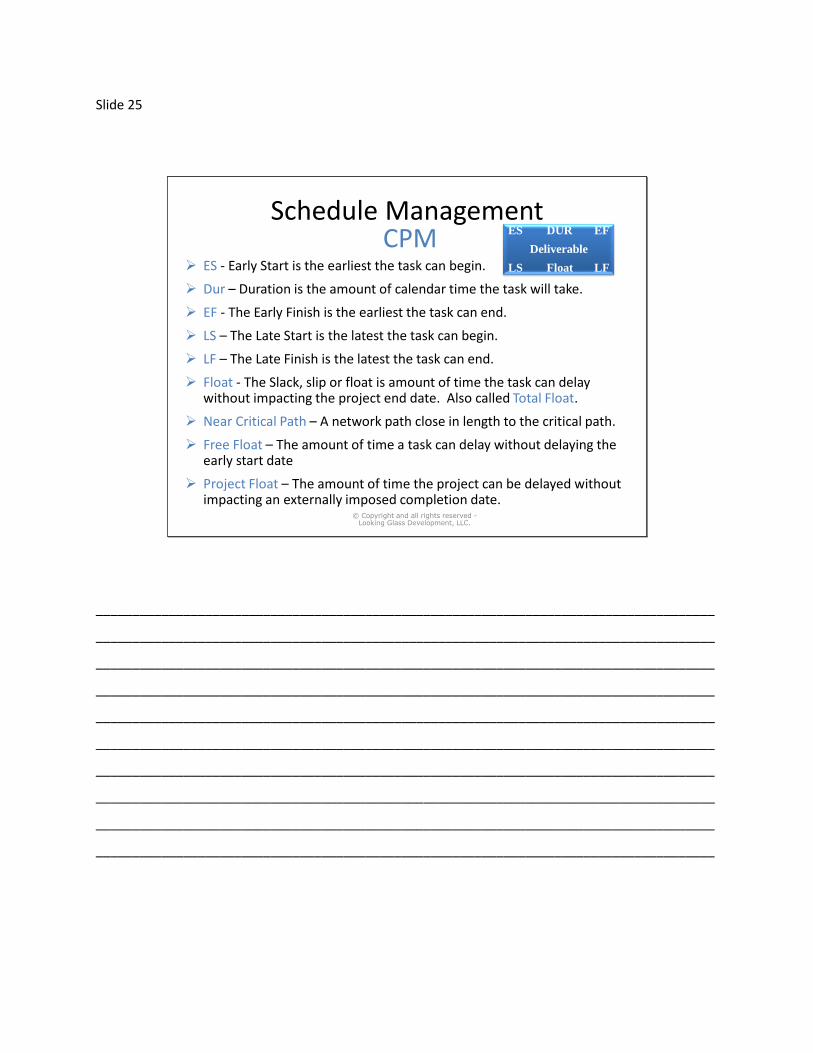
CPM ES - Early Start is the earliest the task can begin.
Dur – Duration is the amount of calendar time the task will take.
EF - The Early Finish is the earliest the task can end.
LS – The Late Start is the latest the task can begin.
LF – The Late Finish is the latest the task can end.
Float - The Slack, slip or float is amount of time the task can delay without impacting the project end date. Also called Total Float.
Near Critical Path – A network path close in length to the critical path.
Free Float – The amount of time a task can delay without delaying the early start date
Project Float – The amount of time the project can be delayed without impacting an externally imposed completion date.
Schedule Management
© Copyright and all rights reserved -Looking Glass Development, LLC.
ES DUR EF
Deliverable
LS Float LF
_____________________________________________________________________________________
_____________________________________________________________________________________
_____________________________________________________________________________________
_____________________________________________________________________________________
_____________________________________________________________________________________
_____________________________________________________________________________________
_____________________________________________________________________________________
_____________________________________________________________________________________
_____________________________________________________________________________________
_____________________________________________________________________________________
Slide 26
Deliverable F
2
Deliverable E
2
Deliverable B
4
2
Deliverable C
Deliverable A
20
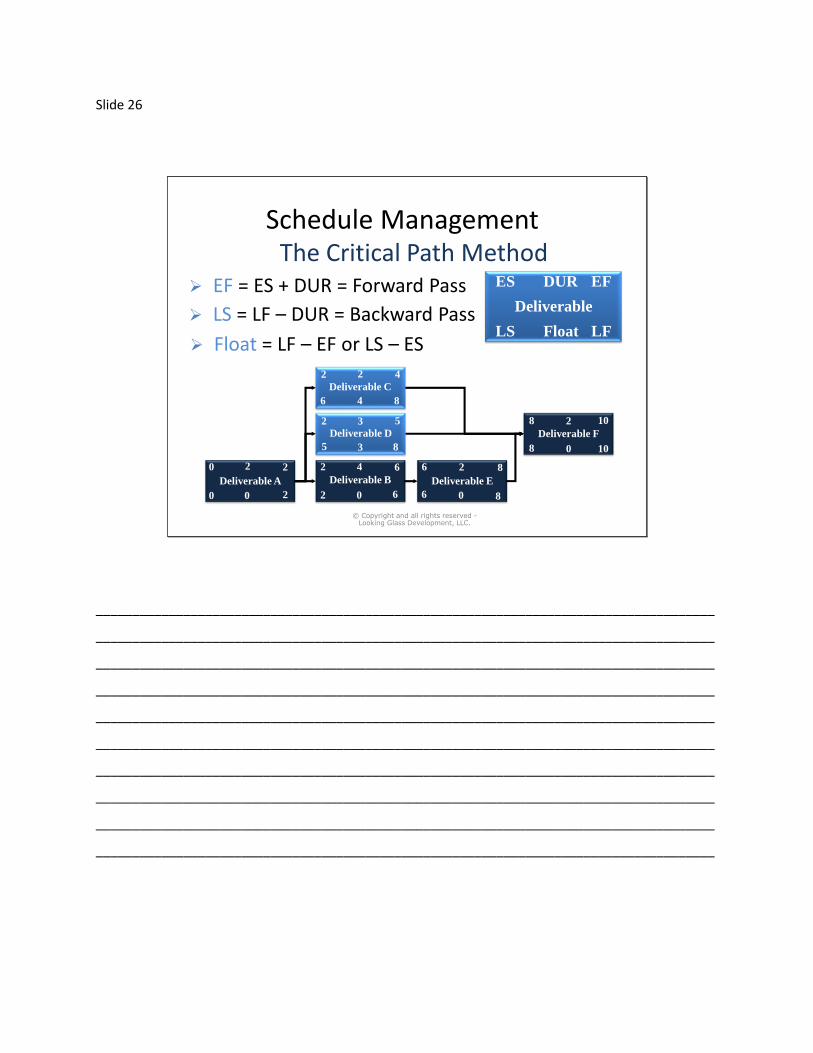
Schedule ManagementThe Critical Path Method
ES DUR EF
Deliverable
LS Float LF
© Copyright and all rights reserved -Looking Glass Development, LLC.
LS = LF – DUR = Backward Pass
EF = ES + DUR = Forward Pass
Float = LF – EF or LS – ES
2 4
3
Deliverable D
2 5
2 2 6 6 8
8 10
200
5 3 8
02 6 06 8
8 0 10
46 8
_____________________________________________________________________________________
_____________________________________________________________________________________
_____________________________________________________________________________________
_____________________________________________________________________________________
_____________________________________________________________________________________
_____________________________________________________________________________________
_____________________________________________________________________________________
_____________________________________________________________________________________
_____________________________________________________________________________________
_____________________________________________________________________________________
Slide 27
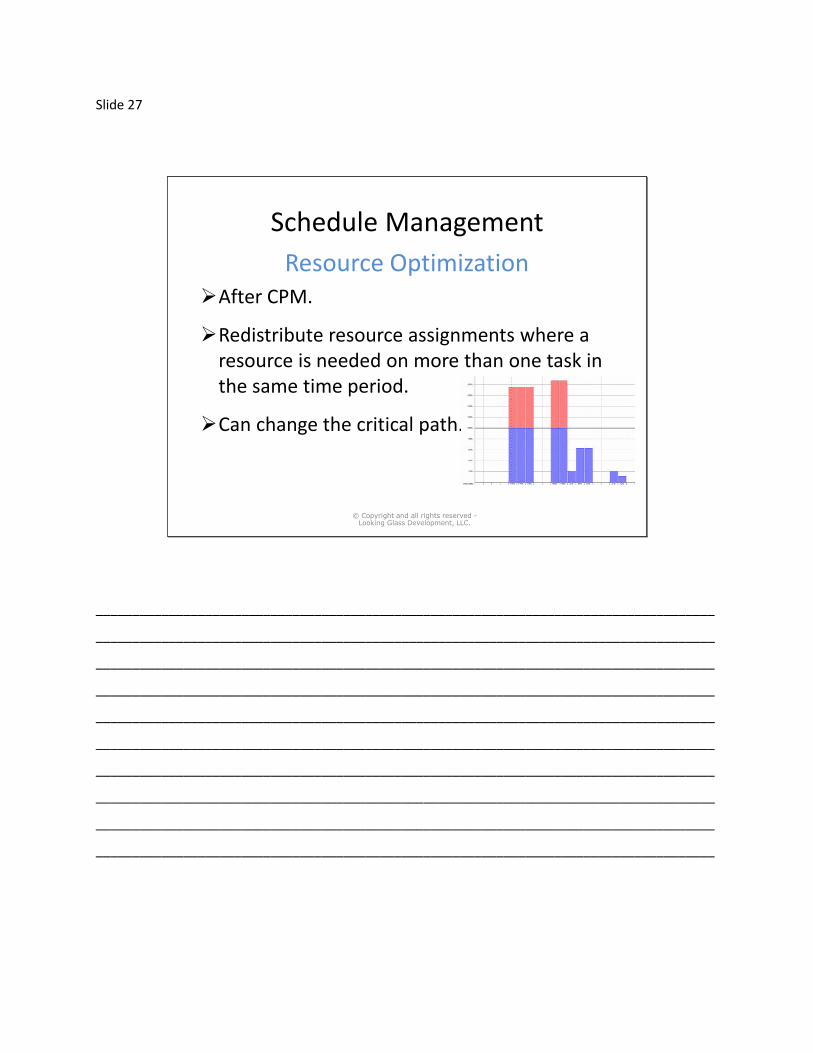
Schedule Management
Resource OptimizationAfter CPM.
Redistribute resource assignments where a resource is needed on more than one task in the same time period.
Can change the critical path.
© Copyright and all rights reserved -Looking Glass Development, LLC.
_____________________________________________________________________________________
_____________________________________________________________________________________
_____________________________________________________________________________________
_____________________________________________________________________________________
_____________________________________________________________________________________
_____________________________________________________________________________________
_____________________________________________________________________________________
_____________________________________________________________________________________
_____________________________________________________________________________________
_____________________________________________________________________________________
Slide 28
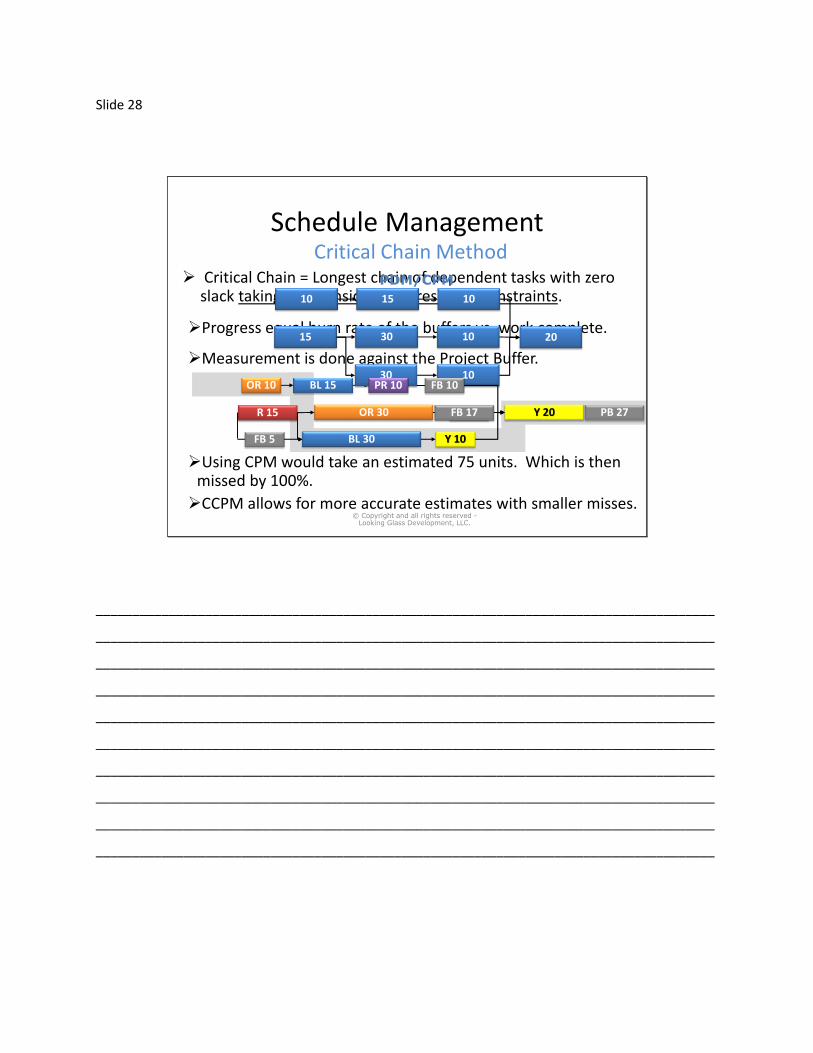
Schedule ManagementCritical Chain Method
Critical Chain = Longest chain of dependent tasks with zero slack taking into consideration resource constraints.
Progress equal burn rate of the buffers vs. work complete.
Measurement is done against the Project Buffer.
Using CPM would take an estimated 75 units. Which is then missed by 100%.
CCPM allows for more accurate estimates with smaller misses.© Copyright and all rights reserved -
Looking Glass Development, LLC.
10 15 10
15 30 10
30 10
20
PDM/CPM
PR 10OR 10 BL 15
BL 30 Y 10
Y 20OR 30R 15 GR 10
FB 10
FB 17
FB 5
PB 27
_____________________________________________________________________________________
_____________________________________________________________________________________
_____________________________________________________________________________________
_____________________________________________________________________________________
_____________________________________________________________________________________
_____________________________________________________________________________________
_____________________________________________________________________________________
_____________________________________________________________________________________
_____________________________________________________________________________________
_____________________________________________________________________________________
Slide 29
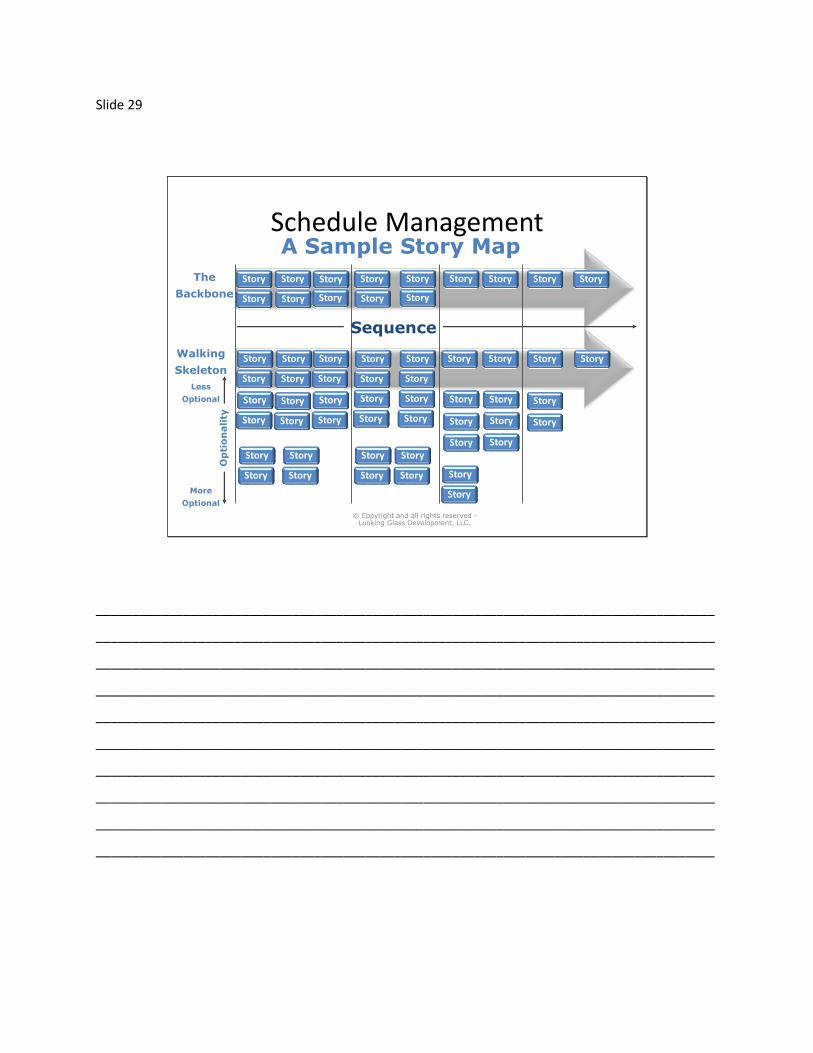
Schedule Management
Story
Sequence
The
Backbone
Walking
Skeleton
Less
Optional
More
Optional
Op
tio
nali
ty
Story
Story StoryStory
StoryStory
StoryStory
StoryStory
StoryStory
Story
Story
Story
Story
StoryStory
Story
Story
Story Story
Story Story
Story Story
Story
Story
Story
Story Story
Story Story
Story Story
Story Story
Story Story
Story Story
Story
Story
Story
Story
Story
Story
Story
Story
Story
Story
Story
Story
Story
Story
A Sample Story Map
© Copyright and all rights reserved -Looking Glass Development, LLC.
_____________________________________________________________________________________
_____________________________________________________________________________________
_____________________________________________________________________________________
_____________________________________________________________________________________
_____________________________________________________________________________________
_____________________________________________________________________________________
_____________________________________________________________________________________
_____________________________________________________________________________________
_____________________________________________________________________________________
_____________________________________________________________________________________
Slide 30
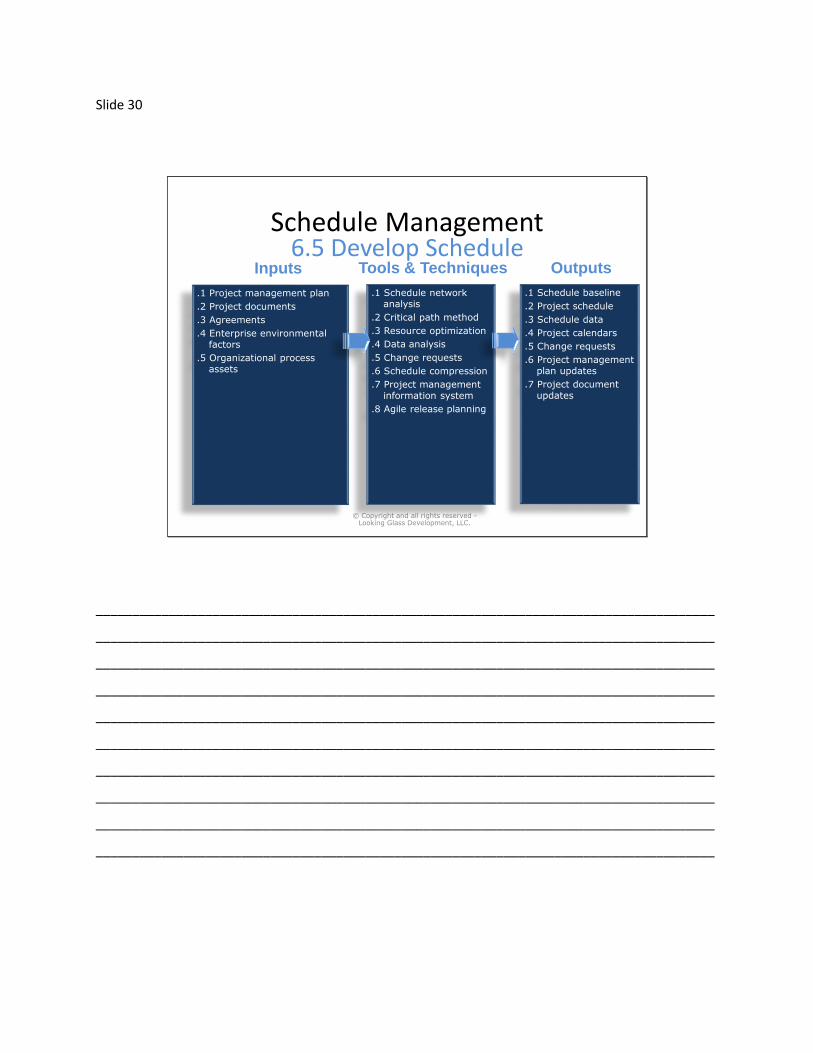
Schedule Management6.5 Develop Schedule
© Copyright and all rights reserved -Looking Glass Development, LLC.
Inputs
.1 Project management plan
.2 Project documents
.3 Agreements
.4 Enterprise environmental factors
.5 Organizational process assets
Tools & Techniques
.1 Schedule network analysis
.2 Critical path method
.3 Resource optimization
.4 Data analysis
.5 Change requests
.6 Schedule compression
.7 Project management information system
.8 Agile release planning
Outputs
.1 Schedule baseline
.2 Project schedule
.3 Schedule data
.4 Project calendars
.5 Change requests
.6 Project management plan updates
.7 Project document updates
_____________________________________________________________________________________
_____________________________________________________________________________________
_____________________________________________________________________________________
_____________________________________________________________________________________
_____________________________________________________________________________________
_____________________________________________________________________________________
_____________________________________________________________________________________
_____________________________________________________________________________________
_____________________________________________________________________________________
_____________________________________________________________________________________
Slide 31
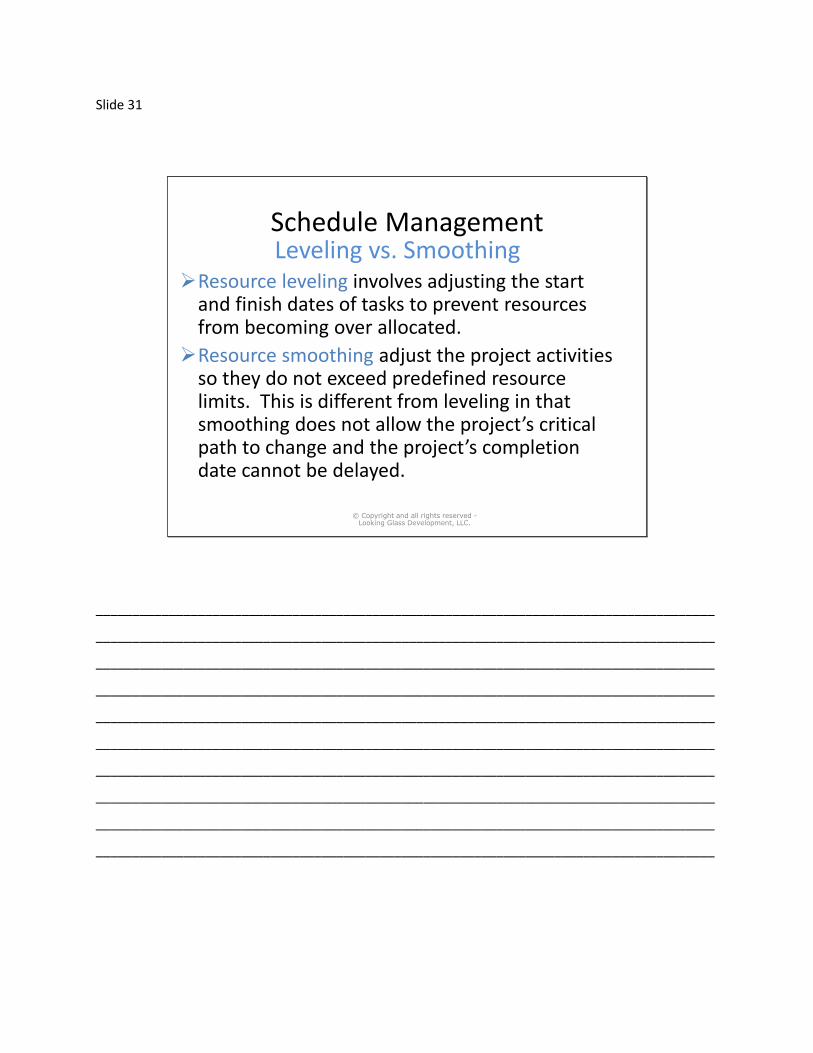
Schedule ManagementLeveling vs. Smoothing
Resource leveling involves adjusting the start and finish dates of tasks to prevent resources from becoming over allocated.
Resource smoothing adjust the project activities so they do not exceed predefined resource limits. This is different from leveling in that smoothing does not allow the project’s critical path to change and the project’s completion date cannot be delayed.
© Copyright and all rights reserved -Looking Glass Development, LLC.
_____________________________________________________________________________________
_____________________________________________________________________________________
_____________________________________________________________________________________
_____________________________________________________________________________________
_____________________________________________________________________________________
_____________________________________________________________________________________
_____________________________________________________________________________________
_____________________________________________________________________________________
_____________________________________________________________________________________
_____________________________________________________________________________________
Slide 32
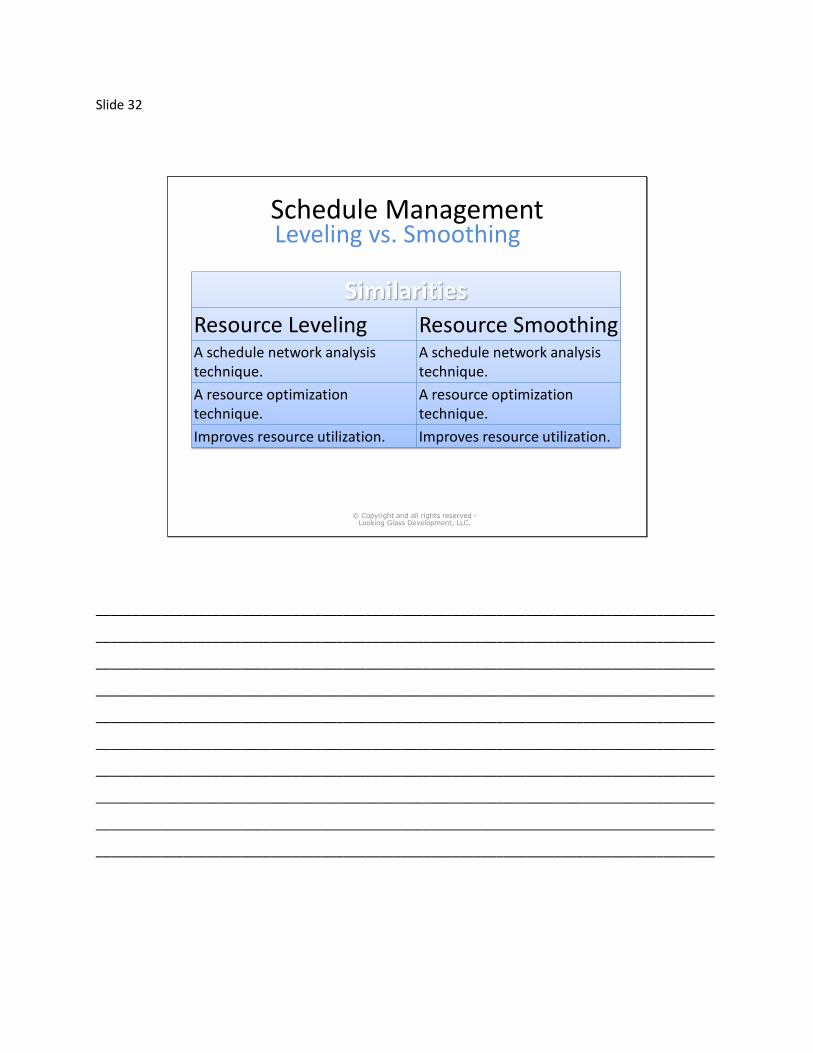
Schedule ManagementLeveling vs. Smoothing
© Copyright and all rights reserved -Looking Glass Development, LLC.
SimilaritiesResource Leveling Resource SmoothingA schedule network analysis technique.
A schedule network analysis technique.
A resource optimization technique.
A resource optimization technique.
Improves resource utilization. Improves resource utilization.
_____________________________________________________________________________________
_____________________________________________________________________________________
_____________________________________________________________________________________
_____________________________________________________________________________________
_____________________________________________________________________________________
_____________________________________________________________________________________
_____________________________________________________________________________________
_____________________________________________________________________________________
_____________________________________________________________________________________
_____________________________________________________________________________________
Slide 33
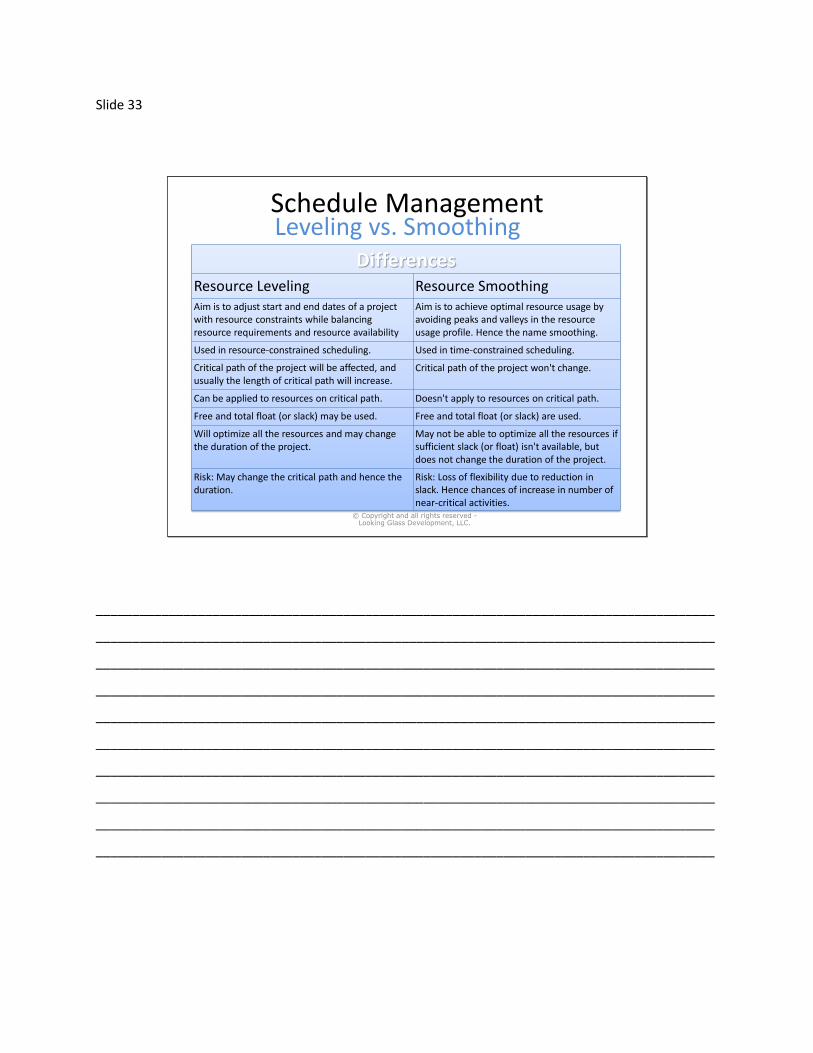
Schedule ManagementLeveling vs. Smoothing
© Copyright and all rights reserved -Looking Glass Development, LLC.
Differences Resource Leveling Resource SmoothingAim is to adjust start and end dates of a project with resource constraints while balancing resource requirements and resource availability
Aim is to achieve optimal resource usage by avoiding peaks and valleys in the resource usage profile. Hence the name smoothing.
Used in resource-constrained scheduling. Used in time-constrained scheduling.
Critical path of the project will be affected, and usually the length of critical path will increase.
Critical path of the project won't change.
Can be applied to resources on critical path. Doesn't apply to resources on critical path.
Free and total float (or slack) may be used. Free and total float (or slack) are used.
Will optimize all the resources and may change the duration of the project.
May not be able to optimize all the resources if sufficient slack (or float) isn't available, but does not change the duration of the project.
Risk: May change the critical path and hence the duration.
Risk: Loss of flexibility due to reduction in slack. Hence chances of increase in number of near-critical activities.
_____________________________________________________________________________________
_____________________________________________________________________________________
_____________________________________________________________________________________
_____________________________________________________________________________________
_____________________________________________________________________________________
_____________________________________________________________________________________
_____________________________________________________________________________________
_____________________________________________________________________________________
_____________________________________________________________________________________
_____________________________________________________________________________________
Slide 34
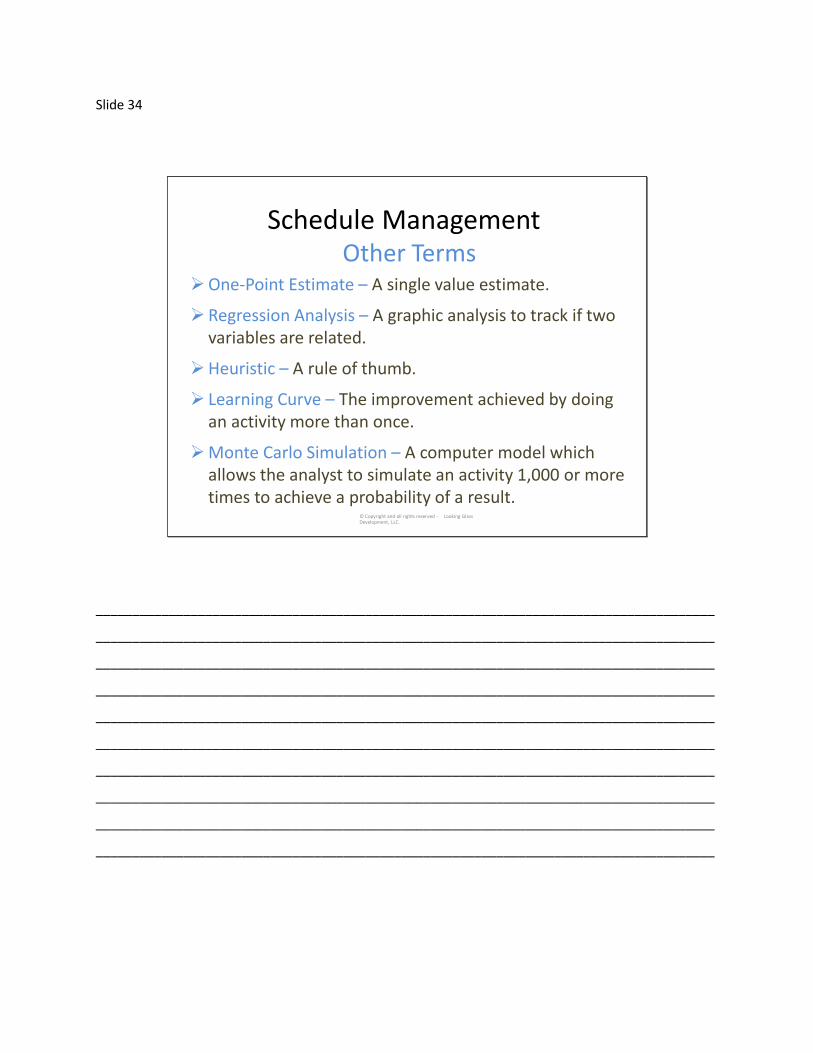
Schedule ManagementOther Terms
One-Point Estimate – A single value estimate.
Regression Analysis – A graphic analysis to track if two variables are related.
Heuristic – A rule of thumb.
Learning Curve – The improvement achieved by doing an activity more than once.
Monte Carlo Simulation – A computer model which allows the analyst to simulate an activity 1,000 or more times to achieve a probability of a result.
© Copyright and all rights reserved - Looking Glass Development, LLC.
_____________________________________________________________________________________
_____________________________________________________________________________________
_____________________________________________________________________________________
_____________________________________________________________________________________
_____________________________________________________________________________________
_____________________________________________________________________________________
_____________________________________________________________________________________
_____________________________________________________________________________________
_____________________________________________________________________________________
_____________________________________________________________________________________
Slide 35
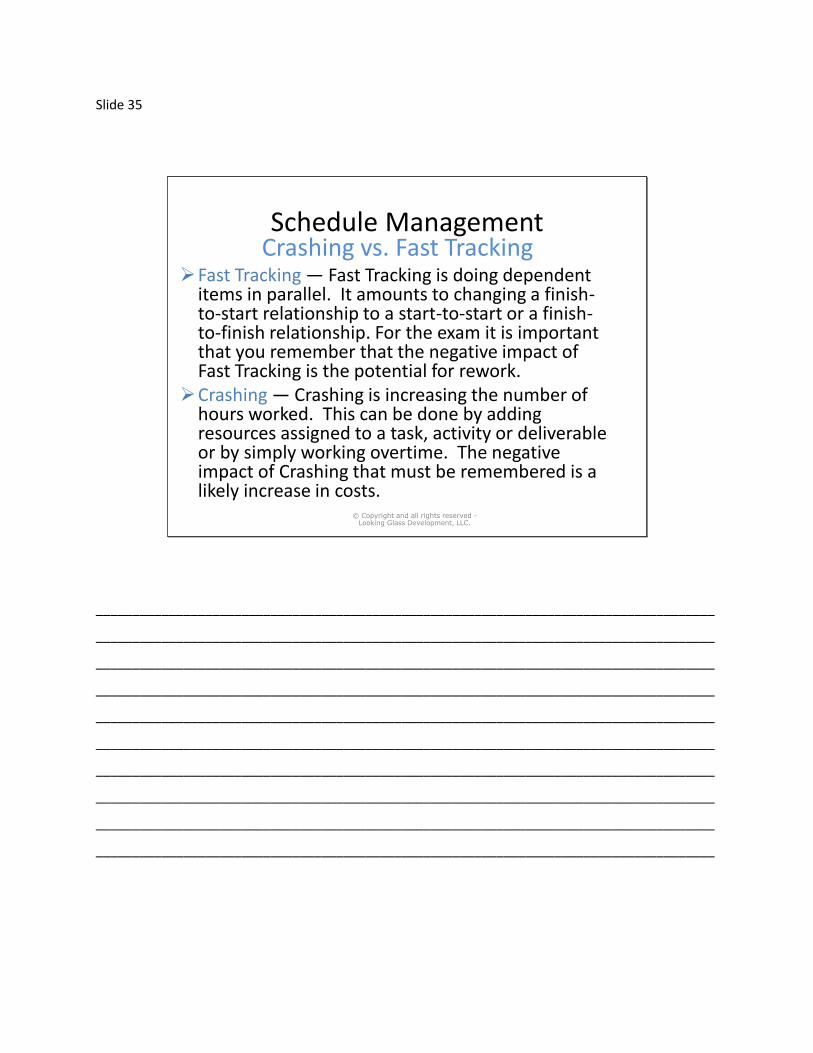
Schedule ManagementCrashing vs. Fast Tracking
Fast Tracking — Fast Tracking is doing dependent items in parallel. It amounts to changing a finish-to-start relationship to a start-to-start or a finish-to-finish relationship. For the exam it is important that you remember that the negative impact of Fast Tracking is the potential for rework.
Crashing — Crashing is increasing the number of hours worked. This can be done by adding resources assigned to a task, activity or deliverable or by simply working overtime. The negative impact of Crashing that must be remembered is a likely increase in costs.
© Copyright and all rights reserved -Looking Glass Development, LLC.
_____________________________________________________________________________________
_____________________________________________________________________________________
_____________________________________________________________________________________
_____________________________________________________________________________________
_____________________________________________________________________________________
_____________________________________________________________________________________
_____________________________________________________________________________________
_____________________________________________________________________________________
_____________________________________________________________________________________
_____________________________________________________________________________________
Slide 36
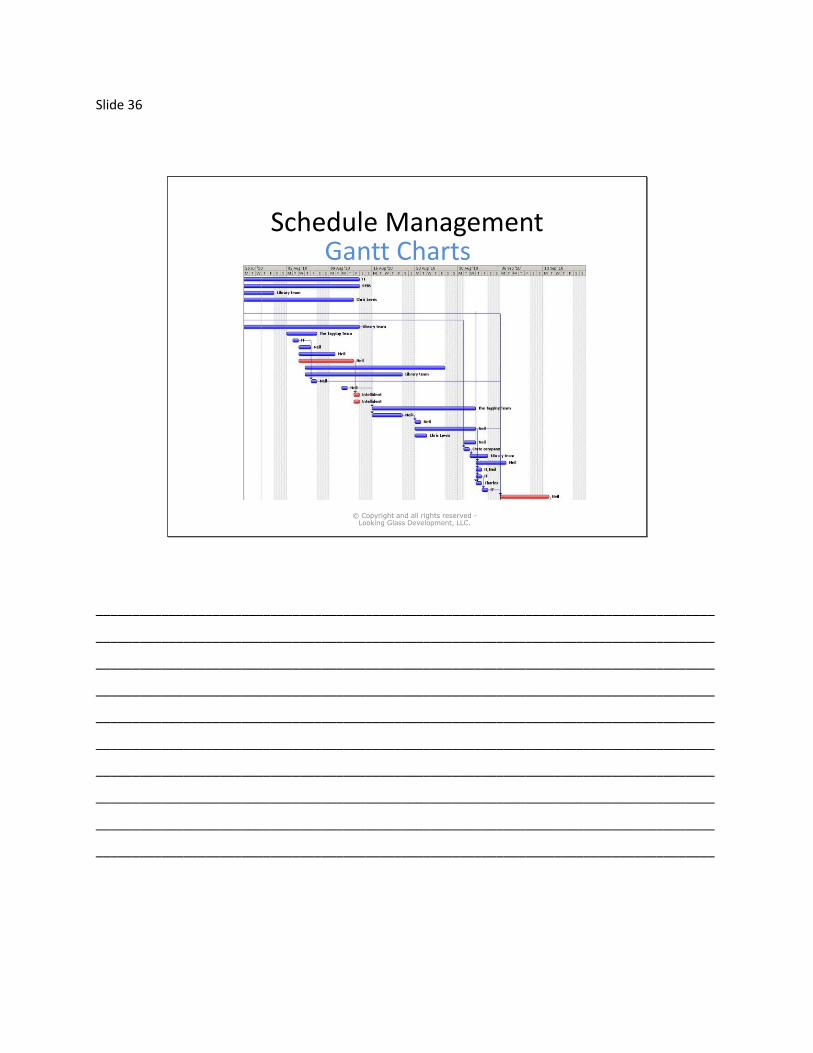
Schedule ManagementGantt Charts
© Copyright and all rights reserved -Looking Glass Development, LLC.
_____________________________________________________________________________________
_____________________________________________________________________________________
_____________________________________________________________________________________
_____________________________________________________________________________________
_____________________________________________________________________________________
_____________________________________________________________________________________
_____________________________________________________________________________________
_____________________________________________________________________________________
_____________________________________________________________________________________
_____________________________________________________________________________________
Slide 37
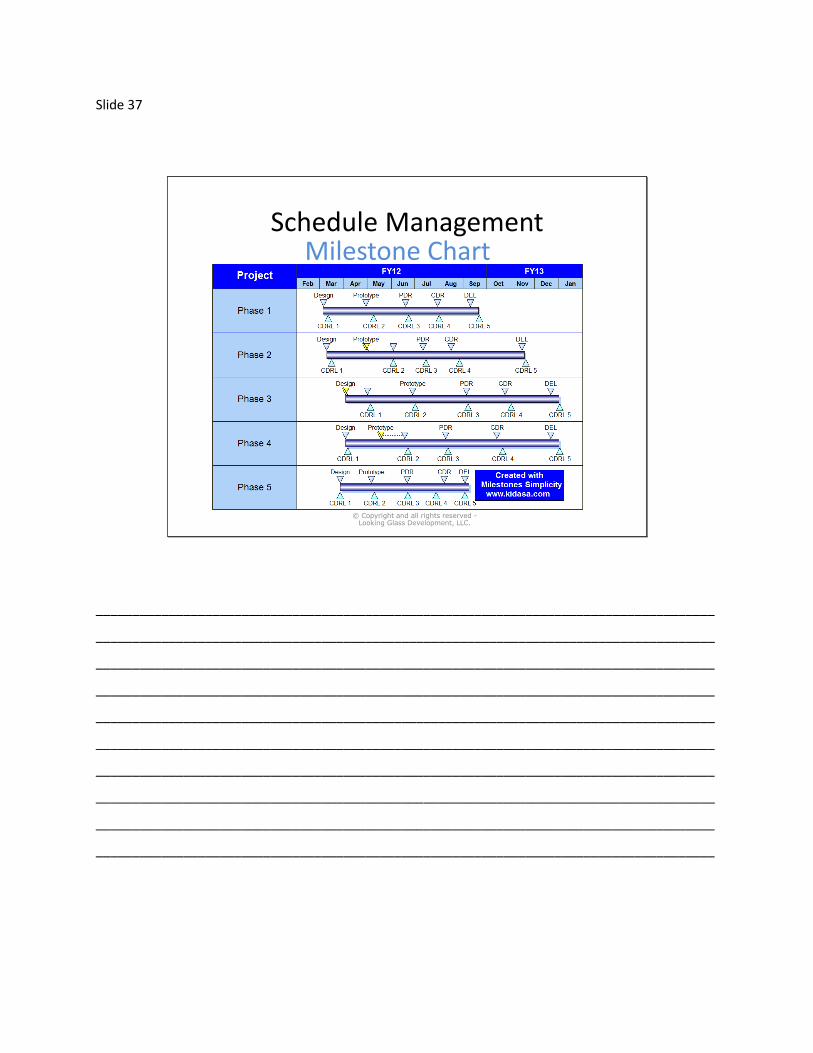
Schedule ManagementMilestone Chart
© Copyright and all rights reserved -Looking Glass Development, LLC.
_____________________________________________________________________________________
_____________________________________________________________________________________
_____________________________________________________________________________________
_____________________________________________________________________________________
_____________________________________________________________________________________
_____________________________________________________________________________________
_____________________________________________________________________________________
_____________________________________________________________________________________
_____________________________________________________________________________________
_____________________________________________________________________________________
Slide 38
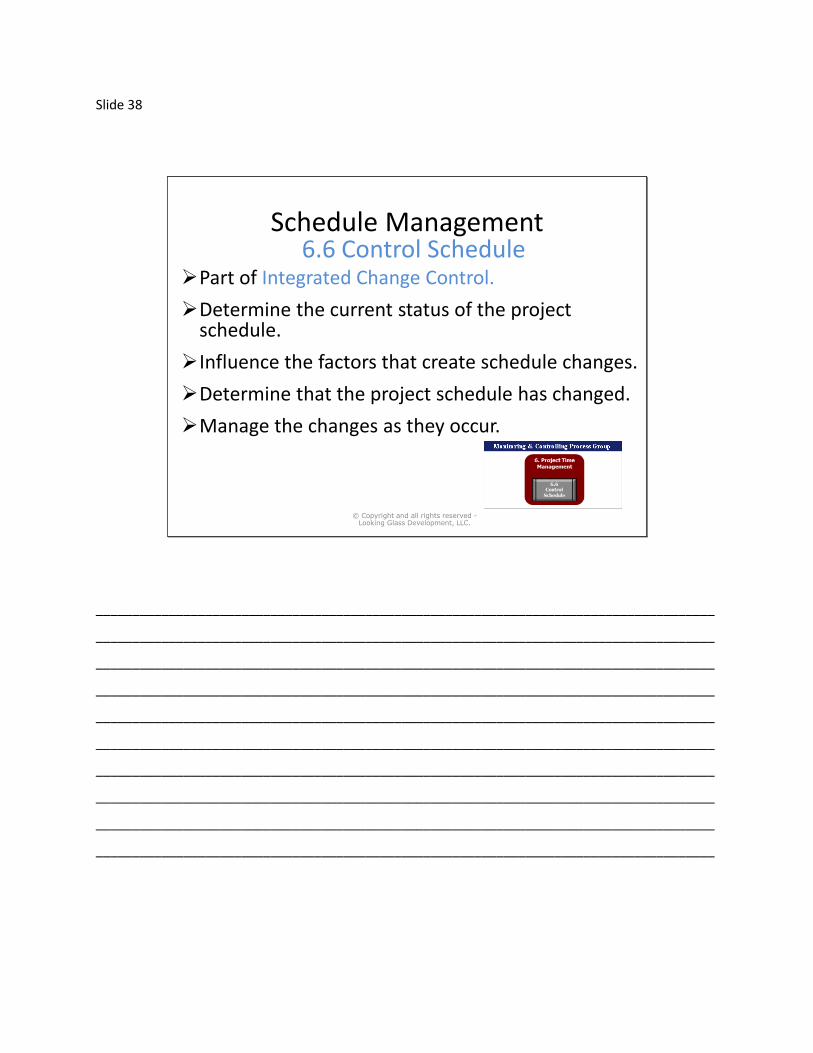
Schedule Management6.6 Control Schedule
Part of Integrated Change Control.
Determine the current status of the project schedule.
Influence the factors that create schedule changes.
Determine that the project schedule has changed.
Manage the changes as they occur.
© Copyright and all rights reserved -Looking Glass Development, LLC.
_____________________________________________________________________________________
_____________________________________________________________________________________
_____________________________________________________________________________________
_____________________________________________________________________________________
_____________________________________________________________________________________
_____________________________________________________________________________________
_____________________________________________________________________________________
_____________________________________________________________________________________
_____________________________________________________________________________________
_____________________________________________________________________________________
Slide 39
Schedule Management
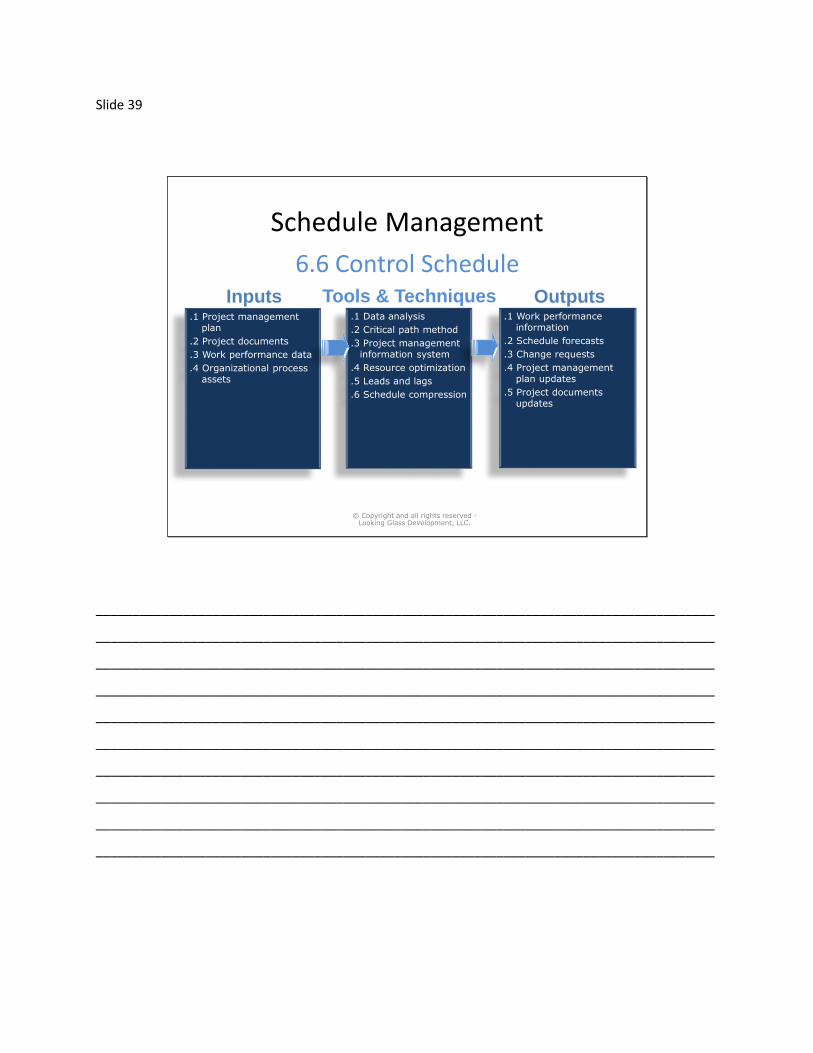
6.6 Control Schedule
© Copyright and all rights reserved -Looking Glass Development, LLC.
Inputs.1 Project management
plan
.2 Project documents
.3 Work performance data
.4 Organizational process assets
Tools & Techniques.1 Data analysis
.2 Critical path method
.3 Project management information system
.4 Resource optimization
.5 Leads and lags
.6 Schedule compression
Outputs.1 Work performance
information
.2 Schedule forecasts
.3 Change requests
.4 Project management plan updates
.5 Project documents updates
_____________________________________________________________________________________
_____________________________________________________________________________________
_____________________________________________________________________________________
_____________________________________________________________________________________
_____________________________________________________________________________________
_____________________________________________________________________________________
_____________________________________________________________________________________
_____________________________________________________________________________________
_____________________________________________________________________________________
_____________________________________________________________________________________
Slide 40
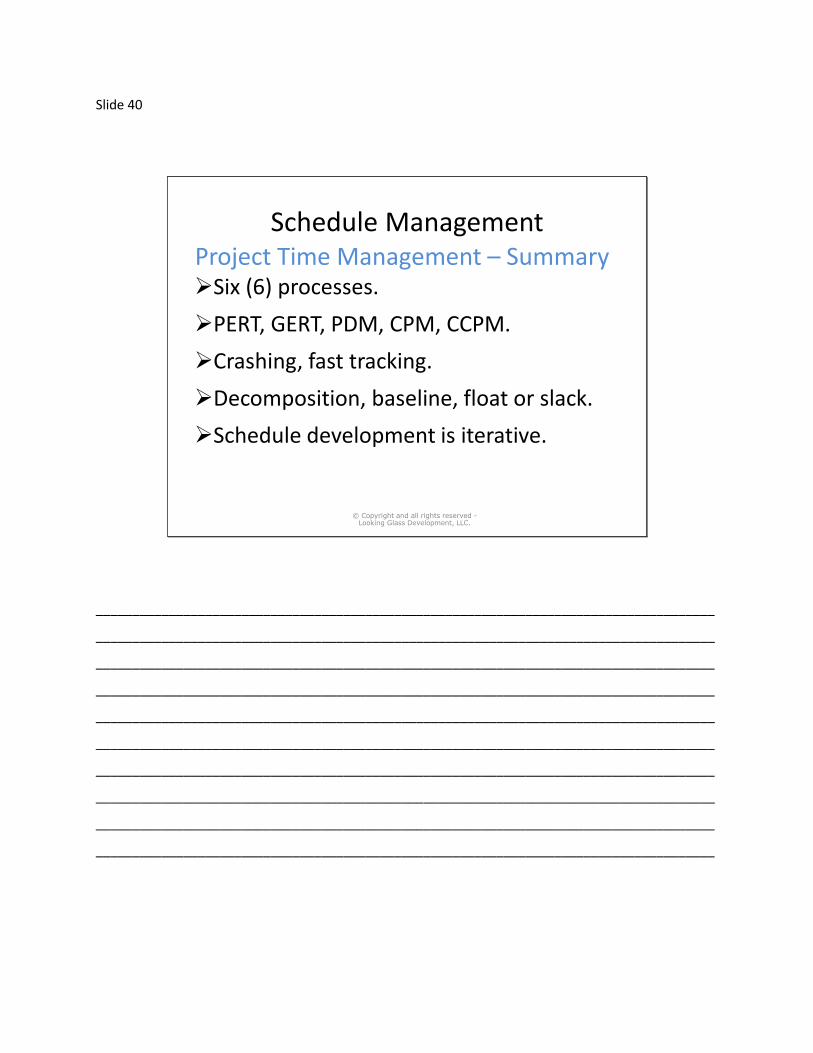
Schedule Management Project Time Management – SummarySix (6) processes.
PERT, GERT, PDM, CPM, CCPM.
Crashing, fast tracking.
Decomposition, baseline, float or slack.
Schedule development is iterative.
© Copyright and all rights reserved -Looking Glass Development, LLC.
_____________________________________________________________________________________
_____________________________________________________________________________________
_____________________________________________________________________________________
_____________________________________________________________________________________
_____________________________________________________________________________________
_____________________________________________________________________________________
_____________________________________________________________________________________
_____________________________________________________________________________________
_____________________________________________________________________________________
_____________________________________________________________________________________

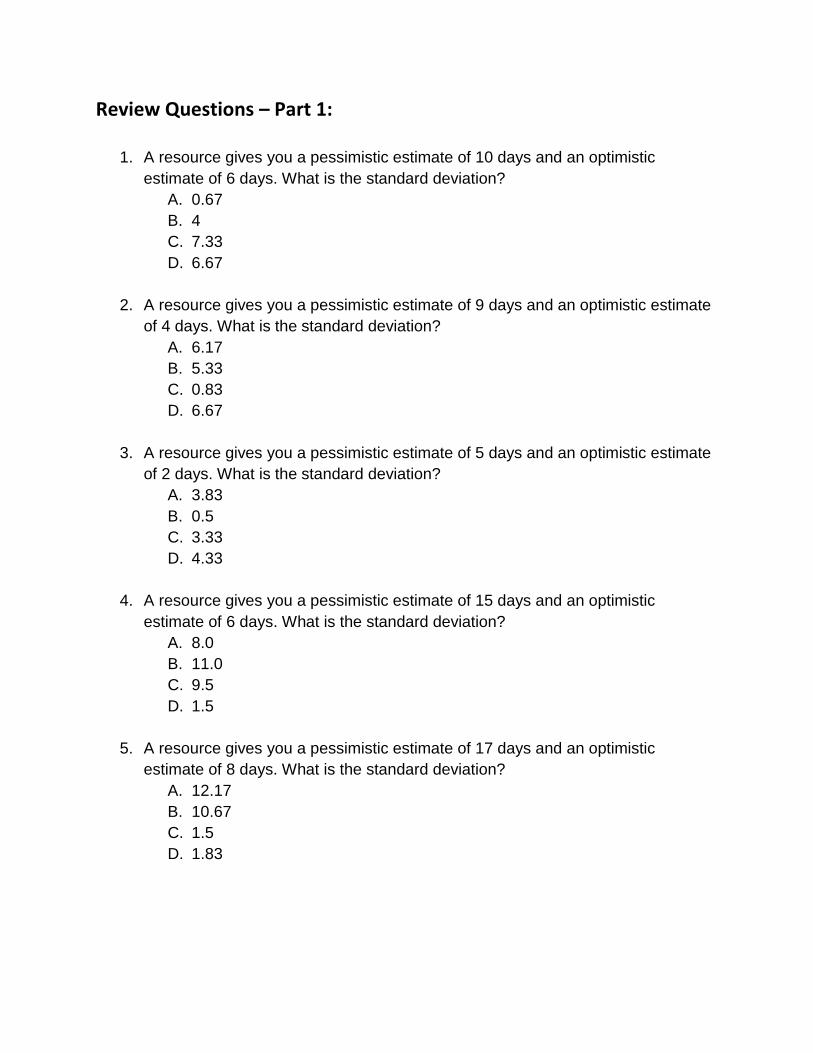
Review Questions – Part 1:
1. A resource gives you a pessimistic estimate of 10 days and an optimistic
estimate of 6 days. What is the standard deviation?
A. 0.67
B. 4
C. 7.33
D. 6.67
2. A resource gives you a pessimistic estimate of 9 days and an optimistic estimate
of 4 days. What is the standard deviation?
A. 6.17
B. 5.33
C. 0.83
D. 6.67
3. A resource gives you a pessimistic estimate of 5 days and an optimistic estimate
of 2 days. What is the standard deviation?
A. 3.83
B. 0.5
C. 3.33
D. 4.33
4. A resource gives you a pessimistic estimate of 15 days and an optimistic
estimate of 6 days. What is the standard deviation?
A. 8.0
B. 11.0
C. 9.5
D. 1.5
5. A resource gives you a pessimistic estimate of 17 days and an optimistic
estimate of 8 days. What is the standard deviation?
A. 12.17
B. 10.67
C. 1.5
D. 1.83
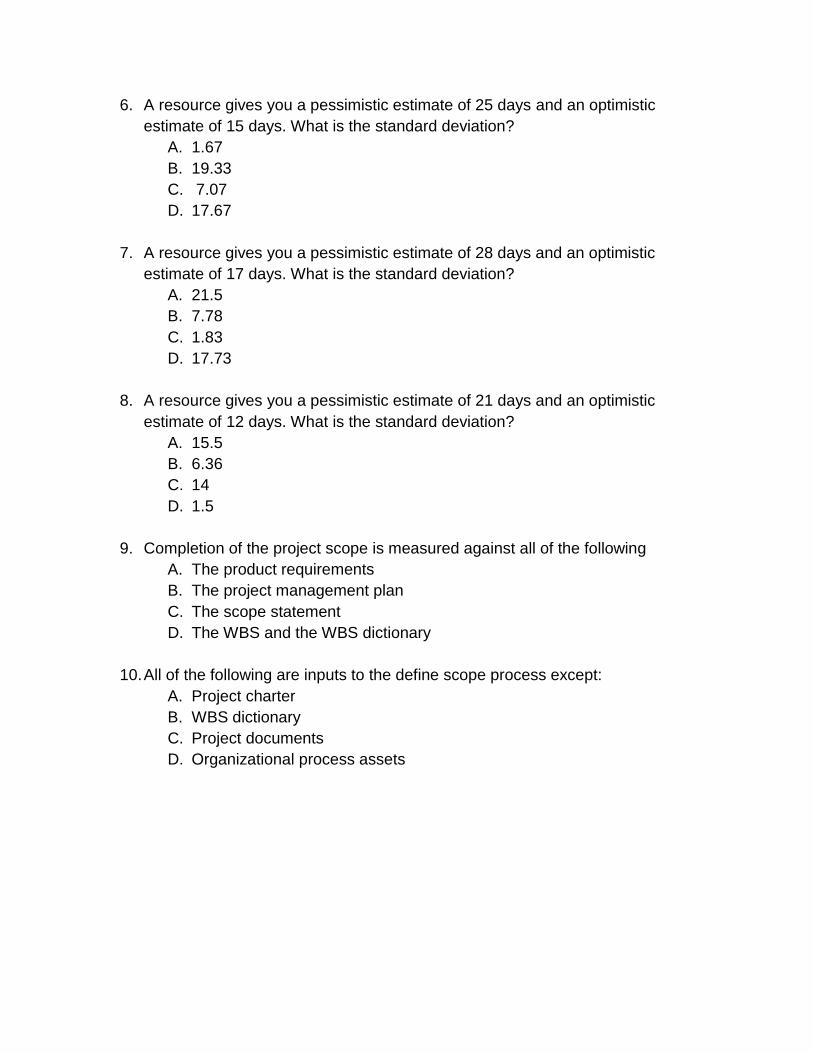
6. A resource gives you a pessimistic estimate of 25 days and an optimistic
estimate of 15 days. What is the standard deviation?
A. 1.67
B. 19.33
C. 7.07
D. 17.67
7. A resource gives you a pessimistic estimate of 28 days and an optimistic
estimate of 17 days. What is the standard deviation?
A. 21.5
B. 7.78
C. 1.83
D. 17.73
8. A resource gives you a pessimistic estimate of 21 days and an optimistic
estimate of 12 days. What is the standard deviation?
A. 15.5
B. 6.36
C. 14
D. 1.5
9. Completion of the project scope is measured against all of the following
A. The product requirements
B. The project management plan
C. The scope statement
D. The WBS and the WBS dictionary
10. All of the following are inputs to the define scope process except:
A. Project charter
B. WBS dictionary
C. Project documents
D. Organizational process assets
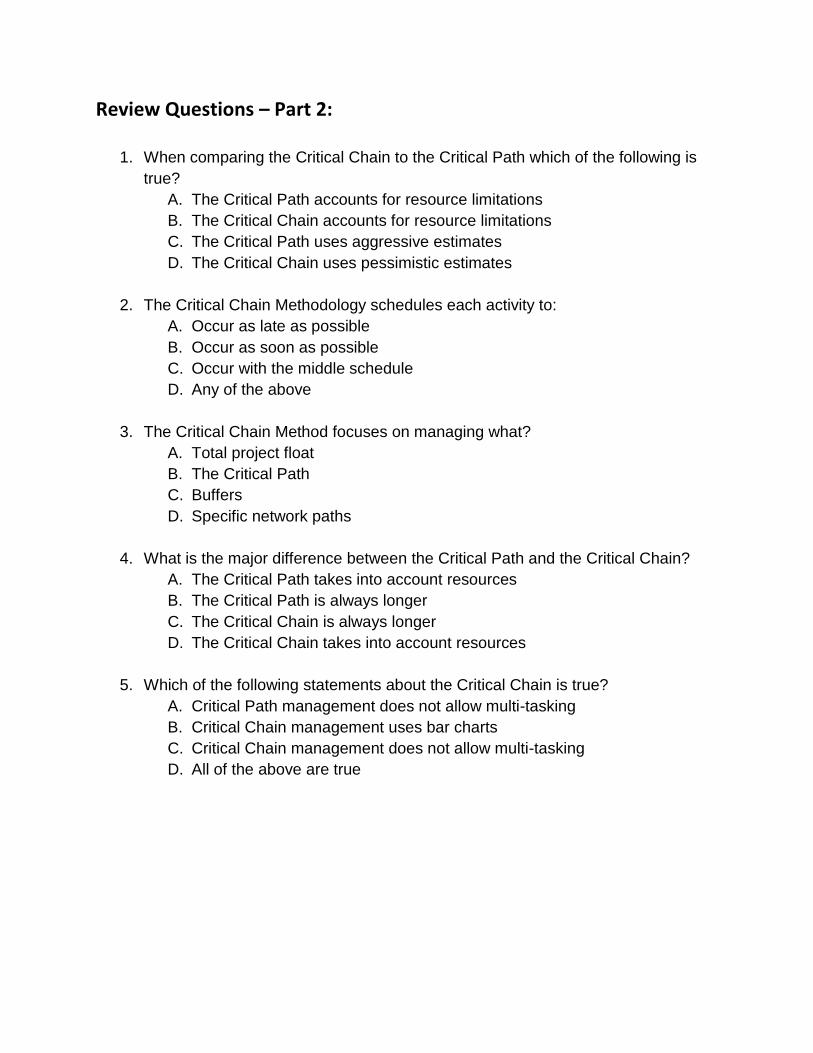
Review Questions – Part 2:
1. When comparing the Critical Chain to the Critical Path which of the following is
true?
A. The Critical Path accounts for resource limitations
B. The Critical Chain accounts for resource limitations
C. The Critical Path uses aggressive estimates
D. The Critical Chain uses pessimistic estimates
2. The Critical Chain Methodology schedules each activity to:
A. Occur as late as possible
B. Occur as soon as possible
C. Occur with the middle schedule
D. Any of the above
3. The Critical Chain Method focuses on managing what?
A. Total project float
B. The Critical Path
C. Buffers
D. Specific network paths
4. What is the major difference between the Critical Path and the Critical Chain?
A. The Critical Path takes into account resources
B. The Critical Path is always longer
C. The Critical Chain is always longer
D. The Critical Chain takes into account resources
5. Which of the following statements about the Critical Chain is true?
A. Critical Path management does not allow multi-tasking
B. Critical Chain management uses bar charts
C. Critical Chain management does not allow multi-tasking
D. All of the above are true
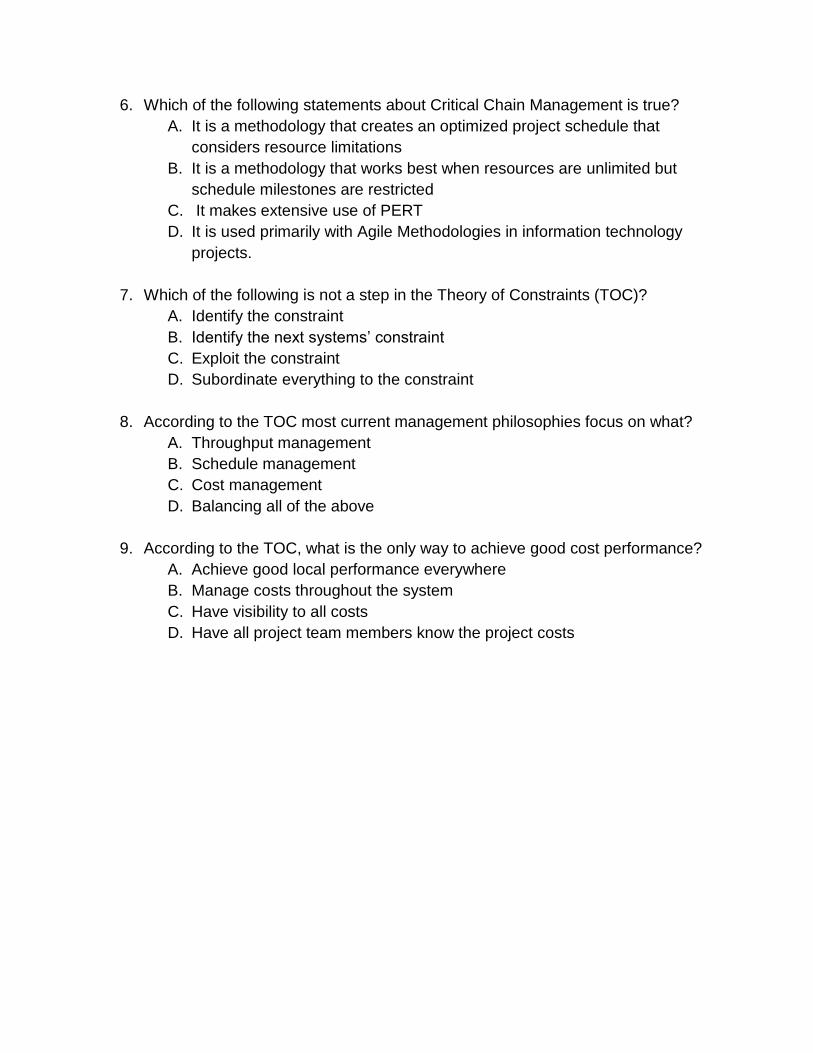
6. Which of the following statements about Critical Chain Management is true?
A. It is a methodology that creates an optimized project schedule that
considers resource limitations
B. It is a methodology that works best when resources are unlimited but
schedule milestones are restricted
C. It makes extensive use of PERT
D. It is used primarily with Agile Methodologies in information technology
projects.
7. Which of the following is not a step in the Theory of Constraints (TOC)?
A. Identify the constraint
B. Identify the next systems’ constraint
C. Exploit the constraint
D. Subordinate everything to the constraint
8. According to the TOC most current management philosophies focus on what?
A. Throughput management
B. Schedule management
C. Cost management
D. Balancing all of the above
9. According to the TOC, what is the only way to achieve good cost performance?
A. Achieve good local performance everywhere
B. Manage costs throughout the system
C. Have visibility to all costs
D. Have all project team members know the project costs
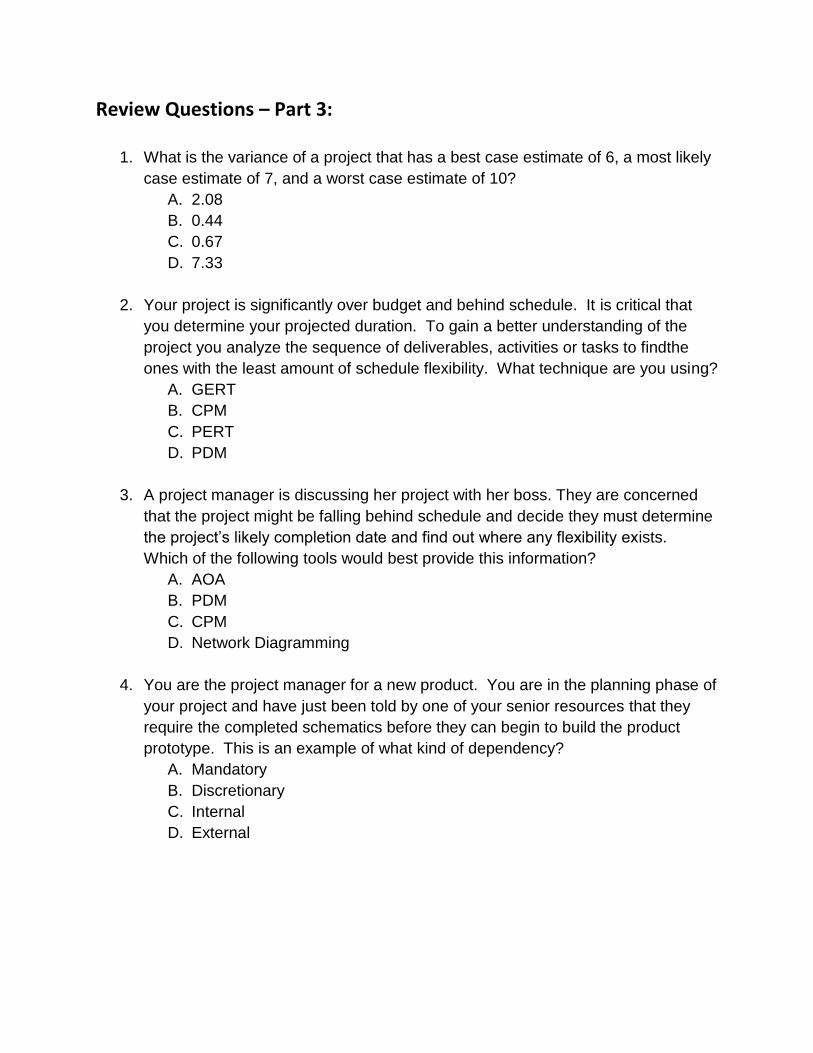
Review Questions – Part 3:
1. What is the variance of a project that has a best case estimate of 6, a most likely
case estimate of 7, and a worst case estimate of 10?
A. 2.08
B. 0.44
C. 0.67
D. 7.33
2. Your project is significantly over budget and behind schedule. It is critical that
you determine your projected duration. To gain a better understanding of the
project you analyze the sequence of deliverables, activities or tasks to findthe
ones with the least amount of schedule flexibility. What technique are you using?
A. GERT
B. CPM
C. PERT
D. PDM
3. A project manager is discussing her project with her boss. They are concerned
that the project might be falling behind schedule and decide they must determine
the project’s likely completion date and find out where any flexibility exists.
Which of the following tools would best provide this information?
A. AOA
B. PDM
C. CPM
D. Network Diagramming
4. You are the project manager for a new product. You are in the planning phase of
your project and have just been told by one of your senior resources that they
require the completed schematics before they can begin to build the product
prototype. This is an example of what kind of dependency?
A. Mandatory
B. Discretionary
C. Internal
D. External
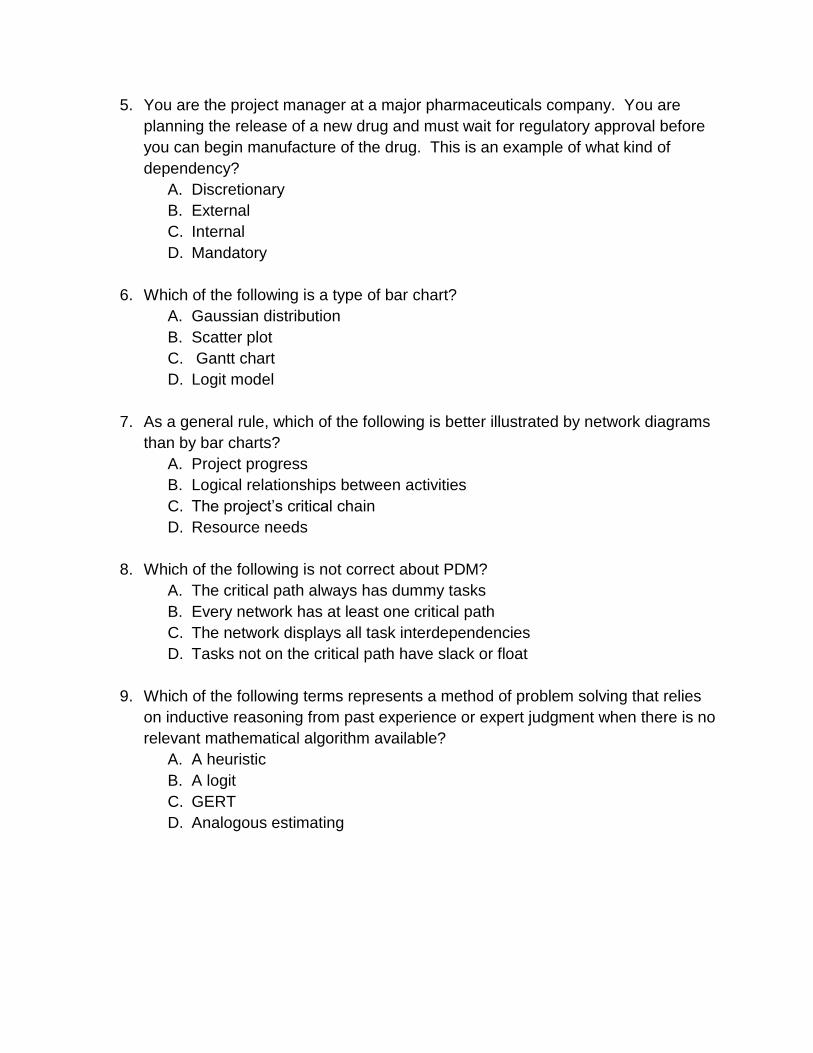
5. You are the project manager at a major pharmaceuticals company. You are
planning the release of a new drug and must wait for regulatory approval before
you can begin manufacture of the drug. This is an example of what kind of
dependency?
A. Discretionary
B. External
C. Internal
D. Mandatory
6. Which of the following is a type of bar chart?
A. Gaussian distribution
B. Scatter plot
C. Gantt chart
D. Logit model
7. As a general rule, which of the following is better illustrated by network diagrams
than by bar charts?
A. Project progress
B. Logical relationships between activities
C. The project’s critical chain
D. Resource needs
8. Which of the following is not correct about PDM?
A. The critical path always has dummy tasks
B. Every network has at least one critical path
C. The network displays all task interdependencies
D. Tasks not on the critical path have slack or float
9. Which of the following terms represents a method of problem solving that relies
on inductive reasoning from past experience or expert judgment when there is no
relevant mathematical algorithm available?
A. A heuristic
B. A logit
C. GERT
D. Analogous estimating
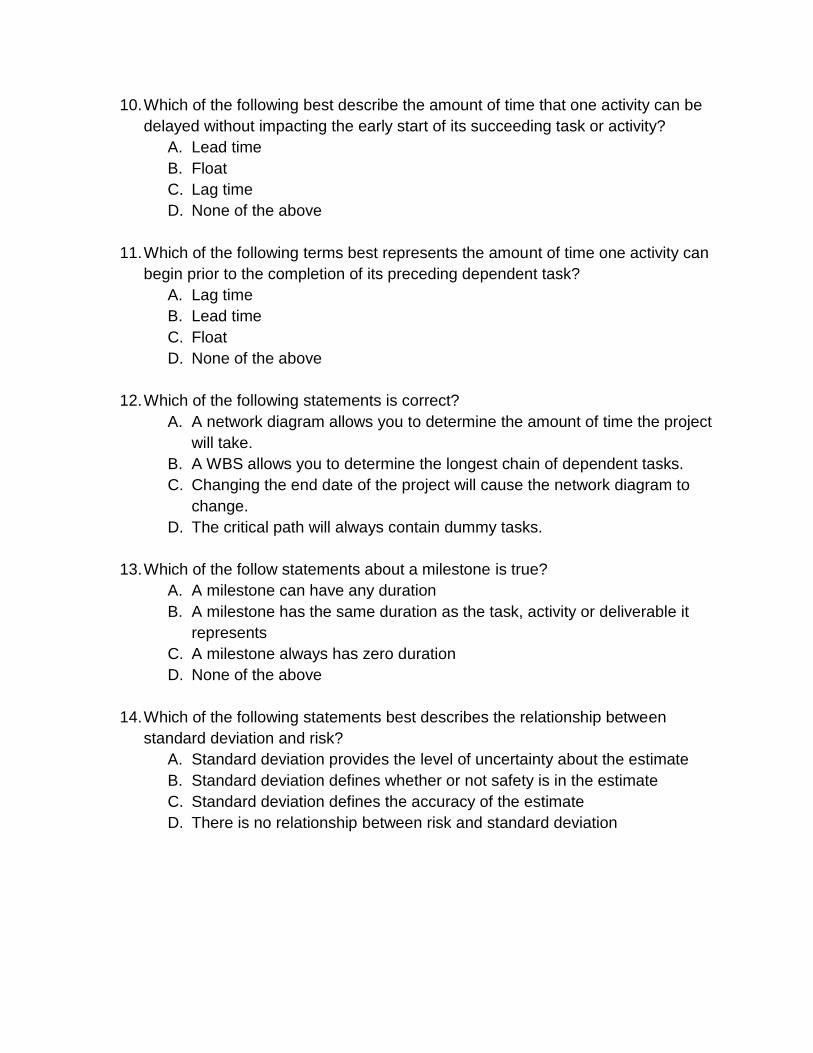
10. Which of the following best describe the amount of time that one activity can be
delayed without impacting the early start of its succeeding task or activity?
A. Lead time
B. Float
C. Lag time
D. None of the above
11. Which of the following terms best represents the amount of time one activity can
begin prior to the completion of its preceding dependent task?
A. Lag time
B. Lead time
C. Float
D. None of the above
12. Which of the following statements is correct?
A. A network diagram allows you to determine the amount of time the project
will take.
B. A WBS allows you to determine the longest chain of dependent tasks.
C. Changing the end date of the project will cause the network diagram to
change.
D. The critical path will always contain dummy tasks.
13. Which of the follow statements about a milestone is true?
A. A milestone can have any duration
B. A milestone has the same duration as the task, activity or deliverable it
represents
C. A milestone always has zero duration
D. None of the above
14. Which of the following statements best describes the relationship between
standard deviation and risk?
A. Standard deviation provides the level of uncertainty about the estimate
B. Standard deviation defines whether or not safety is in the estimate
C. Standard deviation defines the accuracy of the estimate
D. There is no relationship between risk and standard deviation
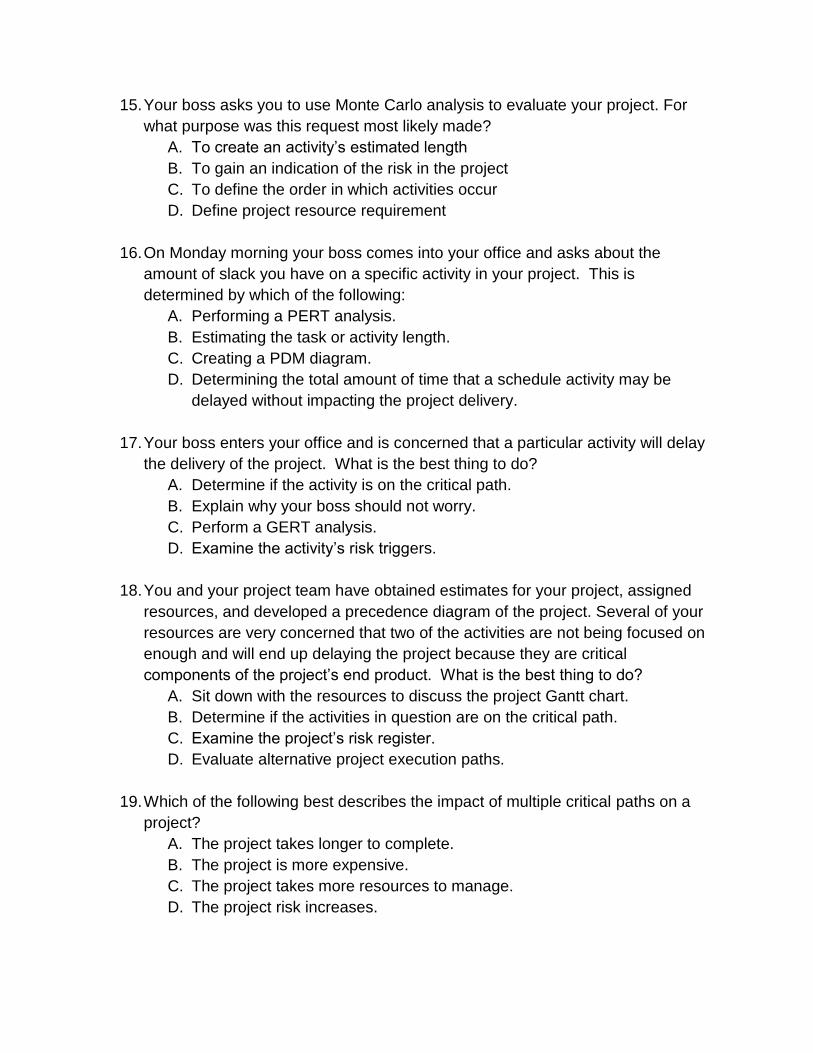
15. Your boss asks you to use Monte Carlo analysis to evaluate your project. For
what purpose was this request most likely made?
A. To create an activity’s estimated length
B. To gain an indication of the risk in the project
C. To define the order in which activities occur
D. Define project resource requirement
16. On Monday morning your boss comes into your office and asks about the
amount of slack you have on a specific activity in your project. This is
determined by which of the following:
A. Performing a PERT analysis.
B. Estimating the task or activity length.
C. Creating a PDM diagram.
D. Determining the total amount of time that a schedule activity may be
delayed without impacting the project delivery.
17. Your boss enters your office and is concerned that a particular activity will delay
the delivery of the project. What is the best thing to do?
A. Determine if the activity is on the critical path.
B. Explain why your boss should not worry.
C. Perform a GERT analysis.
D. Examine the activity’s risk triggers.
18. You and your project team have obtained estimates for your project, assigned
resources, and developed a precedence diagram of the project. Several of your
resources are very concerned that two of the activities are not being focused on
enough and will end up delaying the project because they are critical
components of the project’s end product. What is the best thing to do?
A. Sit down with the resources to discuss the project Gantt chart.
B. Determine if the activities in question are on the critical path.
C. Examine the project’s risk register.
D. Evaluate alternative project execution paths.
19. Which of the following best describes the impact of multiple critical paths on a
project?
A. The project takes longer to complete.
B. The project is more expensive.
C. The project takes more resources to manage.
D. The project risk increases.
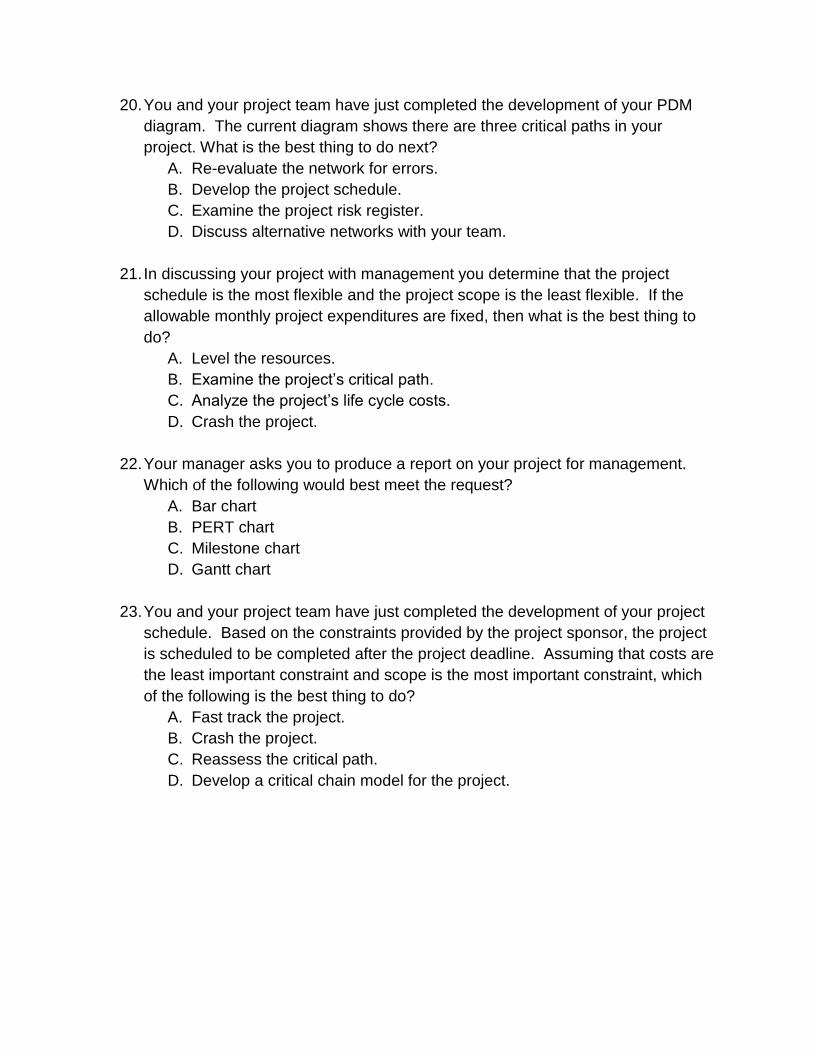
20. You and your project team have just completed the development of your PDM
diagram. The current diagram shows there are three critical paths in your
project. What is the best thing to do next?
A. Re-evaluate the network for errors.
B. Develop the project schedule.
C. Examine the project risk register.
D. Discuss alternative networks with your team.
21. In discussing your project with management you determine that the project
schedule is the most flexible and the project scope is the least flexible. If the
allowable monthly project expenditures are fixed, then what is the best thing to
do?
A. Level the resources.
B. Examine the project’s critical path.
C. Analyze the project’s life cycle costs.
D. Crash the project.
22. Your manager asks you to produce a report on your project for management.
Which of the following would best meet the request?
A. Bar chart
B. PERT chart
C. Milestone chart
D. Gantt chart
23. You and your project team have just completed the development of your project
schedule. Based on the constraints provided by the project sponsor, the project
is scheduled to be completed after the project deadline. Assuming that costs are
the least important constraint and scope is the most important constraint, which
of the following is the best thing to do?
A. Fast track the project.
B. Crash the project.
C. Reassess the critical path.
D. Develop a critical chain model for the project.
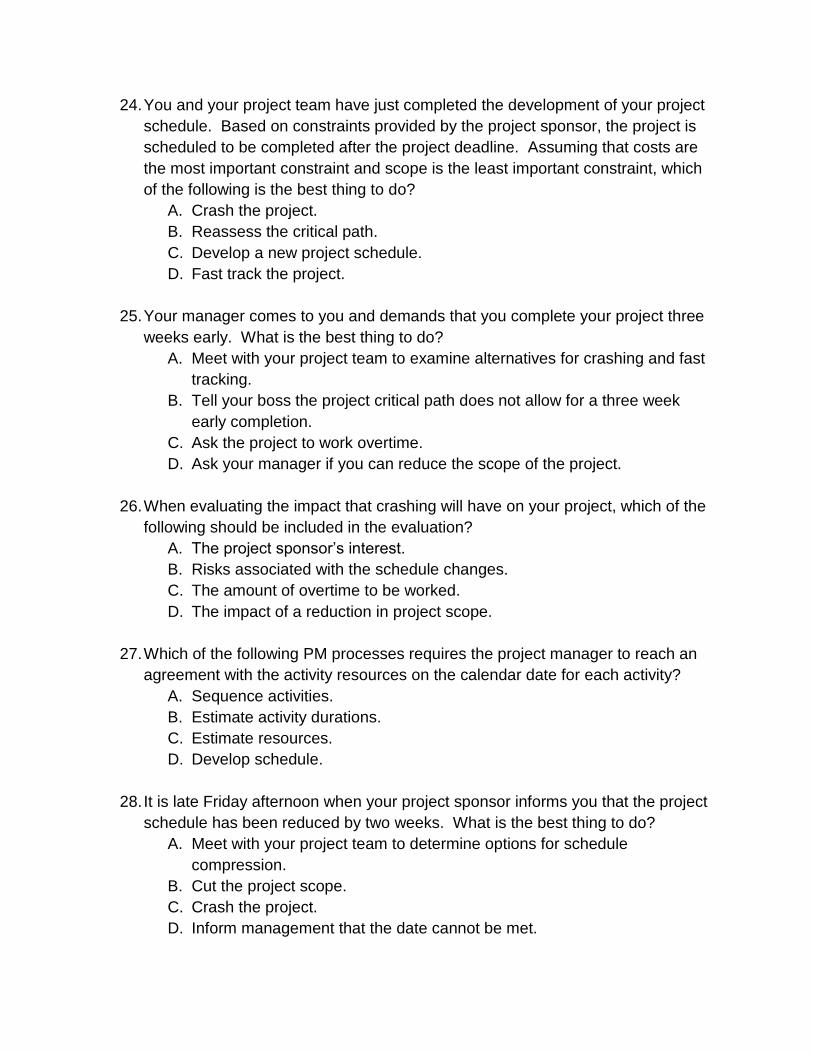
24. You and your project team have just completed the development of your project
schedule. Based on constraints provided by the project sponsor, the project is
scheduled to be completed after the project deadline. Assuming that costs are
the most important constraint and scope is the least important constraint, which
of the following is the best thing to do?
A. Crash the project.
B. Reassess the critical path.
C. Develop a new project schedule.
D. Fast track the project.
25. Your manager comes to you and demands that you complete your project three
weeks early. What is the best thing to do?
A. Meet with your project team to examine alternatives for crashing and fast
tracking.
B. Tell your boss the project critical path does not allow for a three week
early completion.
C. Ask the project to work overtime.
D. Ask your manager if you can reduce the scope of the project.
26. When evaluating the impact that crashing will have on your project, which of the
following should be included in the evaluation?
A. The project sponsor’s interest.
B. Risks associated with the schedule changes.
C. The amount of overtime to be worked.
D. The impact of a reduction in project scope.
27. Which of the following PM processes requires the project manager to reach an
agreement with the activity resources on the calendar date for each activity?
A. Sequence activities.
B. Estimate activity durations.
C. Estimate resources.
D. Develop schedule.
28. It is late Friday afternoon when your project sponsor informs you that the project
schedule has been reduced by two weeks. What is the best thing to do?
A. Meet with your project team to determine options for schedule
compression.
B. Cut the project scope.
C. Crash the project.
D. Inform management that the date cannot be met.
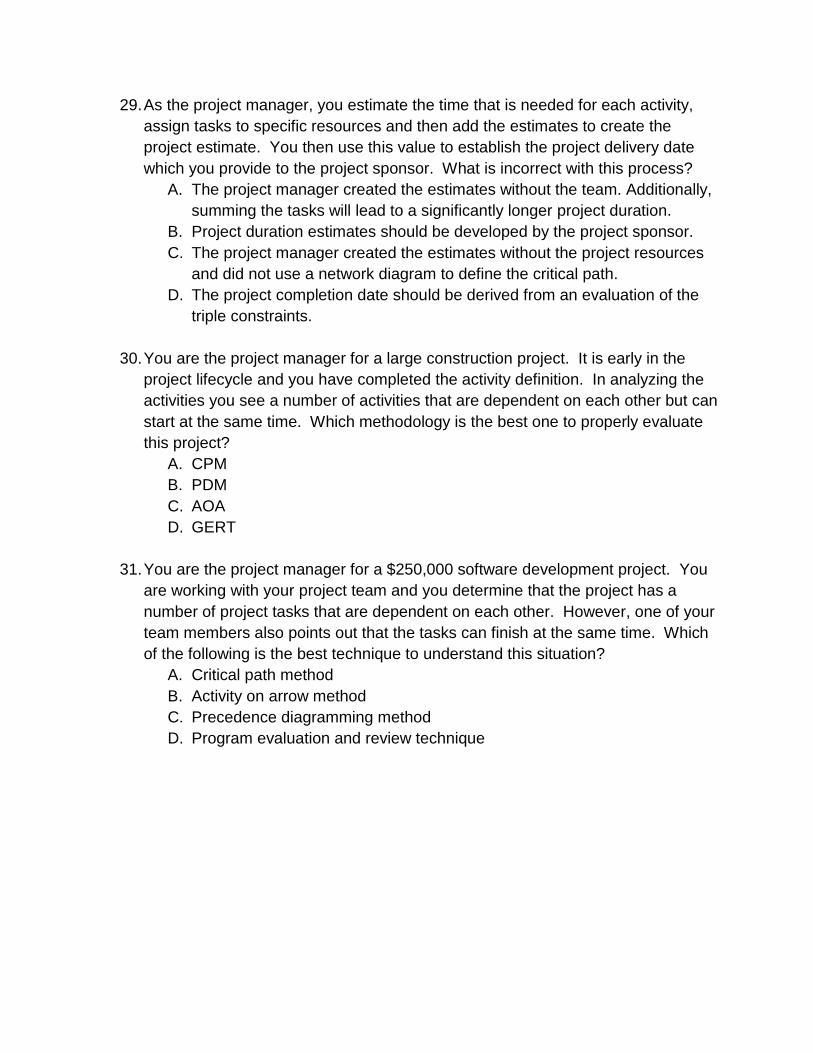
29. As the project manager, you estimate the time that is needed for each activity,
assign tasks to specific resources and then add the estimates to create the
project estimate. You then use this value to establish the project delivery date
which you provide to the project sponsor. What is incorrect with this process?
A. The project manager created the estimates without the team. Additionally,
summing the tasks will lead to a significantly longer project duration.
B. Project duration estimates should be developed by the project sponsor.
C. The project manager created the estimates without the project resources
and did not use a network diagram to define the critical path.
D. The project completion date should be derived from an evaluation of the
triple constraints.
30. You are the project manager for a large construction project. It is early in the
project lifecycle and you have completed the activity definition. In analyzing the
activities you see a number of activities that are dependent on each other but can
start at the same time. Which methodology is the best one to properly evaluate
this project?
A. CPM
B. PDM
C. AOA
D. GERT
31. You are the project manager for a $250,000 software development project. You
are working with your project team and you determine that the project has a
number of project tasks that are dependent on each other. However, one of your
team members also points out that the tasks can finish at the same time. Which
of the following is the best technique to understand this situation?
A. Critical path method
B. Activity on arrow method
C. Precedence diagramming method
D. Program evaluation and review technique
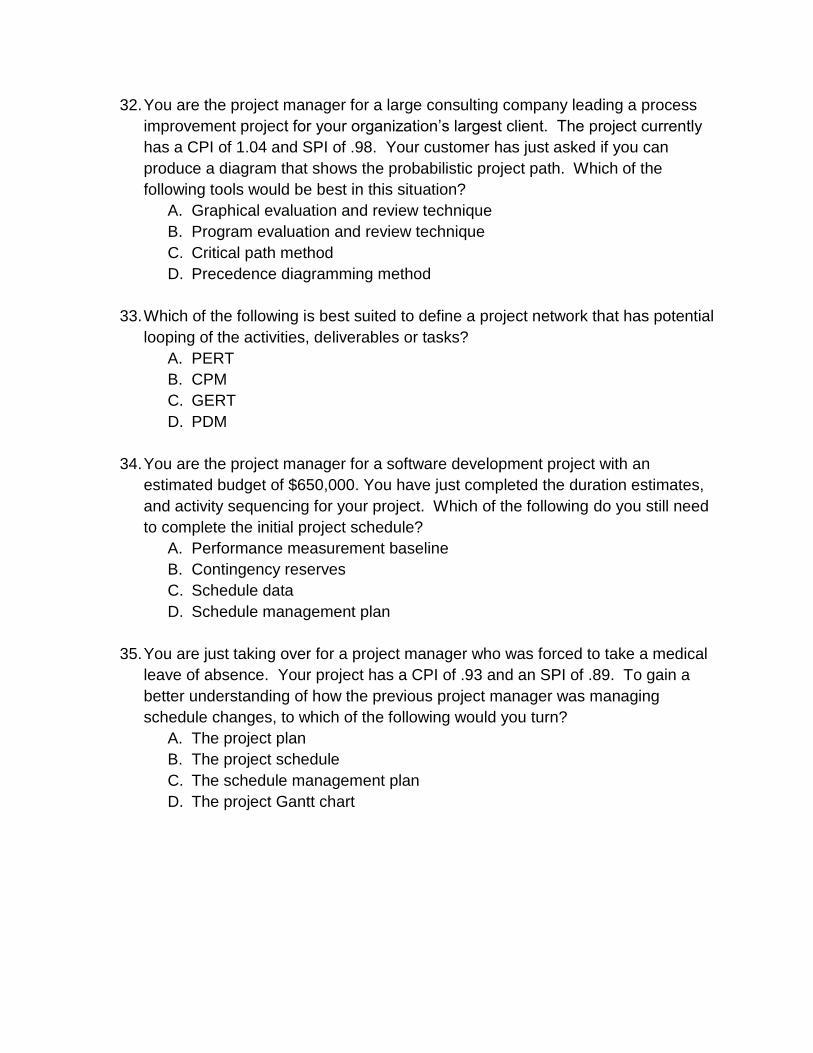
32. You are the project manager for a large consulting company leading a process
improvement project for your organization’s largest client. The project currently
has a CPI of 1.04 and SPI of .98. Your customer has just asked if you can
produce a diagram that shows the probabilistic project path. Which of the
following tools would be best in this situation?
A. Graphical evaluation and review technique
B. Program evaluation and review technique
C. Critical path method
D. Precedence diagramming method
33. Which of the following is best suited to define a project network that has potential
looping of the activities, deliverables or tasks?
A. PERT
B. CPM
C. GERT
D. PDM
34. You are the project manager for a software development project with an
estimated budget of $650,000. You have just completed the duration estimates,
and activity sequencing for your project. Which of the following do you still need
to complete the initial project schedule?
A. Performance measurement baseline
B. Contingency reserves
C. Schedule data
D. Schedule management plan
35. You are just taking over for a project manager who was forced to take a medical
leave of absence. Your project has a CPI of .93 and an SPI of .89. To gain a
better understanding of how the previous project manager was managing
schedule changes, to which of the following would you turn?
A. The project plan
B. The project schedule
C. The schedule management plan
D. The project Gantt chart
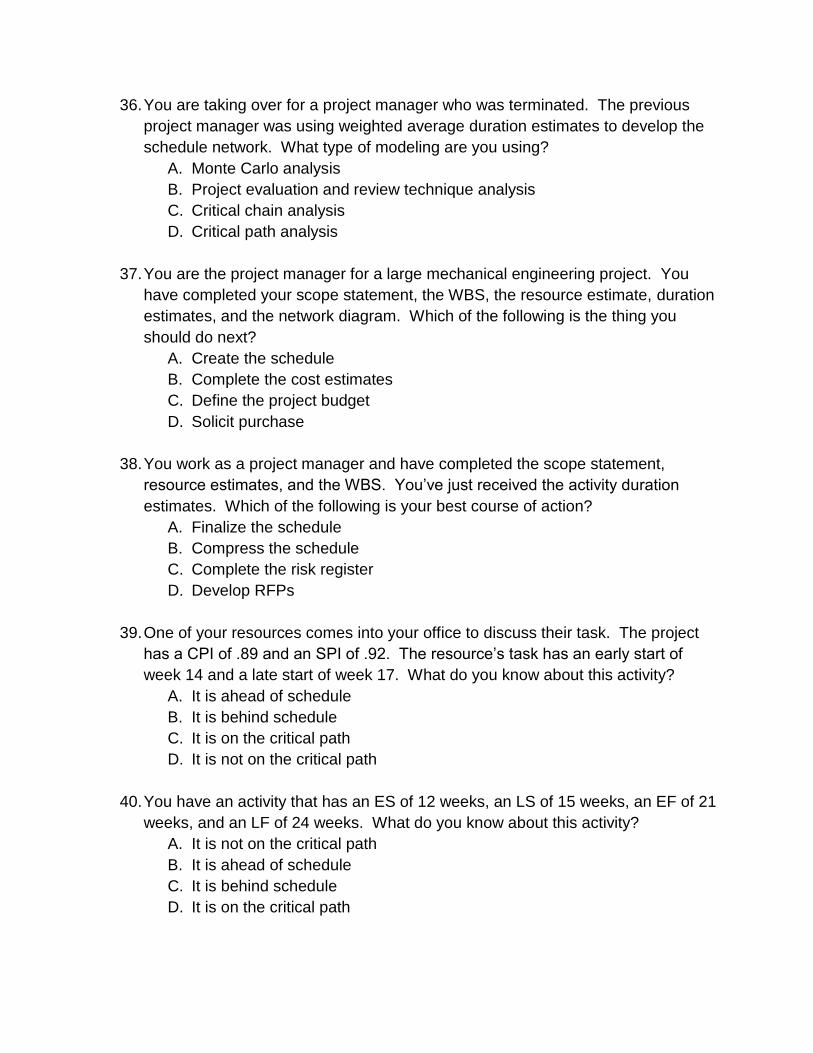
36. You are taking over for a project manager who was terminated. The previous
project manager was using weighted average duration estimates to develop the
schedule network. What type of modeling are you using?
A. Monte Carlo analysis
B. Project evaluation and review technique analysis
C. Critical chain analysis
D. Critical path analysis
37. You are the project manager for a large mechanical engineering project. You
have completed your scope statement, the WBS, the resource estimate, duration
estimates, and the network diagram. Which of the following is the thing you
should do next?
A. Create the schedule
B. Complete the cost estimates
C. Define the project budget
D. Solicit purchase
38. You work as a project manager and have completed the scope statement,
resource estimates, and the WBS. You’ve just received the activity duration
estimates. Which of the following is your best course of action?
A. Finalize the schedule
B. Compress the schedule
C. Complete the risk register
D. Develop RFPs
39. One of your resources comes into your office to discuss their task. The project
has a CPI of .89 and an SPI of .92. The resource’s task has an early start of
week 14 and a late start of week 17. What do you know about this activity?
A. It is ahead of schedule
B. It is behind schedule
C. It is on the critical path
D. It is not on the critical path
40. You have an activity that has an ES of 12 weeks, an LS of 15 weeks, an EF of 21
weeks, and an LF of 24 weeks. What do you know about this activity?
A. It is not on the critical path
B. It is ahead of schedule
C. It is behind schedule
D. It is on the critical path
41. You are leading a project that you have just learned is 3 weeks behind schedule.
The dependencies are discretionary. The project has an SPI of .81 and a CPI of
.83. Due to cost overruns you cannot add more resources. What is the best thing
to do?
A. Move resources from tasks with discretionary dependencies
B. Complete activities in parallel where possible
C. Reduce resources
D. Reduce project scope
42. You’ve been brought into the organization because senior management is
struggling to get a strong understanding of the state of their projects. You only
have a week to prepare a 30 minute presentation on the status of all the projects.
Which of the following would best help senior management understand the
current portfolio status?
A. Project management plan executive summaries
B. Detailed cost and schedule analysis
C. Milestone charts
D. Gantt charts
43. Sally is a brand new project manager within a company that manufactures
household products. She’s just taken over a project that is seriously over budget
and behind schedule. Originally, the project was slated to have spent $135,000
and they have already spent $170,000. It appears that most of the overage is
because of flawed original estimates. This project is critical to the organization’s
success. Who has primary responsibility to solve these issues?
A. The project sponsor
B. The project manager
C. The project team
D. Senior management
44. You are the project manager for a project that you have just learned is 30 days
behind schedule. You do not have any additional resources that may be
engaged. The project has a CPI of .84 and an SPI of .79. The BCR is 1.45 and
only a few of the project tasks have mandatory dependencies. What is the best
thing to do?
A. Meet with the project sponsor to inform them of the delay.
B. Reduce the project scope to meet the deadline.
C. Crash the project.
D. Make more activities concurrent.
45. Rearranging dependent tasks or activities so they are done in parallel is called
what?
A. Fast tracking
B. Leveling
C. Paralleling
D. Crashing
46. Rearranging resources and resource workloads so that the amount of work done
in each month or specified time period is constant is called what?
A. Fast tracking
B. Paralleling
C. Leveling
D. Crashing
47. Adding additional resources to reduce the schedule time of a task or activity is
called what?
A. Fast tracking
B. Crashing
C. Paralleling
D. Leveling
48. Which of the following is a benefit of a three point project estimate?
A. It shows a better understanding of the task.
B. It allows the project manager to better manage stakeholder expectations.
C. It helps determine if the project will meet the schedule.
D. It provides a probabilistic estimate.
49. Which of the following is a benefit of analogous project estimates?
A. It helps to raise questions about expectations.
B. The estimates will more accurately reflect actuals
C. It helps the project resources understand their obligations.
D. It helps senior management feel better about the estimates.
50. Which of the following is an advantage of parametric estimating?
A. It accounts for estimating uncertainty.
B. It provides for improved communication.
C. It provides a quantifiable deterministic estimate.
D. It provides estimates at the lowest possible level.
51. You are the project manager for a very large and important project within your
organization. Your project has been progressing very well until the last couple of
weeks when you began to experience a large number of scope changes. Your
current CPI is 1.02 and your SPI is .98. As the project manager, what should you
do?
A. Maintain the baseline and make approved changes.
B. Maintain the baseline and resist all changes.
C. Make only the changes approved by the project sponsor.
D. Initiate a discussion with management about the level of changes.
52. Your boss asks you to change a presentation slide showing a network diagram to
one showing a bar chart. Which of the following best explain this request?
A. Bar charts show logical relationships more effectively than network
diagrams.
B. Bar charts better display resource trade-offs than network diagrams.
C. Bar charts better show the critical path than network diagrams.
D. Bar charts better display progress or status.
53. You are leading a large project for your organization. Early in the project the
sponsor informs you that neither time nor costs are as important as the number
of resources used each month. Which of the following is the best thing for you to
do?
A. Level the project resources
B. Crash the project
C. Fast track the project
D. Apply a heuristic
54. Upon presenting your plan to your sponsor you are informed that the schedule
exceeds the target completion date the sponsor desired. If the project network
diagram cannot change, but the sponsor offers extra resources what is the best
thing to do?
A. Crash the project
B. Fast track the project
C. Level the resources
D. Perform a Monte Carlo analysis
55. You’ve determined that crashing your project is the best option for reducing your
project schedule. The best approach to crashing would also include looking at
the:
A. Sponsor’s opinion of which activities to crash.
B. Risk impacts of crashing each activity.
C. Customer or end user’s opinion of which activities to crash.
D. When in the project timeline the activities occur.
56. You are assigned as the project manager for a manufacturing project within your
organization. During the planning phase of the project, you estimate the time
needed for each activity and then add the estimates to create the project
estimate. You then commit to delivering the project by the defined date. What is
wrong with this scenario?
A. The team did not create the estimate, and compilation was not used.
B. The estimate is too short and should be created by management.
C. The team did not create the estimate and a network diagram was not
used.
D. The estimate should be matched to the customer’s required completion
date.
57. You have a project with the following activities: Activity A takes 40 hours and is
the first task. Activity B takes 25 hours and should happen after the project
starts. Activity C must happen after activity A and takes 35 hours. Activity D
must happen after activities B and C and takes 30 hours. Activity E must take
place after activity C and takes 10 hours. Activity F takes place after activity E
and takes 22 hours. Activities F and D are the last activities of the project.
Which of the following is true if activity B actually takes 37 hours?
A. The critical path is 67 hours.
B. The critical path changes to Start, B, D, End.
C. The critical path is Start, A, C, E, F, End.
D. The critical path increases by 12 hours.
58. The WBS, activity duration estimates, and the precedence diagram are
completed. Which of the following should you do next?
A. Validate project scope.
B. Identify project risks.
C. Sequence the activities.
D. Create a preliminary schedule and get the team’s approval.
59. You are leading an engineering project for your organization and have developed
a six level WBS that has been sequenced using PDM. The activity duration
estimates have been received. What should you do next?
A. Create an activity list.
B. Begin the work breakdown structure.
C. Finalize the schedule.
D. Compress the schedule.
60. You are the project manager for an information technology project within your
organization. A five-level work breakdown structure has been developed for the
project. The network diagram and duration estimates have been created and the
schedule has been developed and compressed. Which of the following time
management activities should you do next?
A. Gain approval.
B. Estimate activity resources.
C. Use parametric estimating.
D. Control the schedule.
61. The project is calculated to be completed two weeks after your sponsor’s
deadline. You have been told there are no additional resources. The project is
low risk, the benefit cost ratio is expected to be 1.71, and the project
dependencies are preferential. What is the best thing to do?
A. Remove non-critical activities from the project.
B. Make more activities concurrent.
C. Cut resources from non-critical activities.
D. Move resources from preferential dependencies to external dependencies.
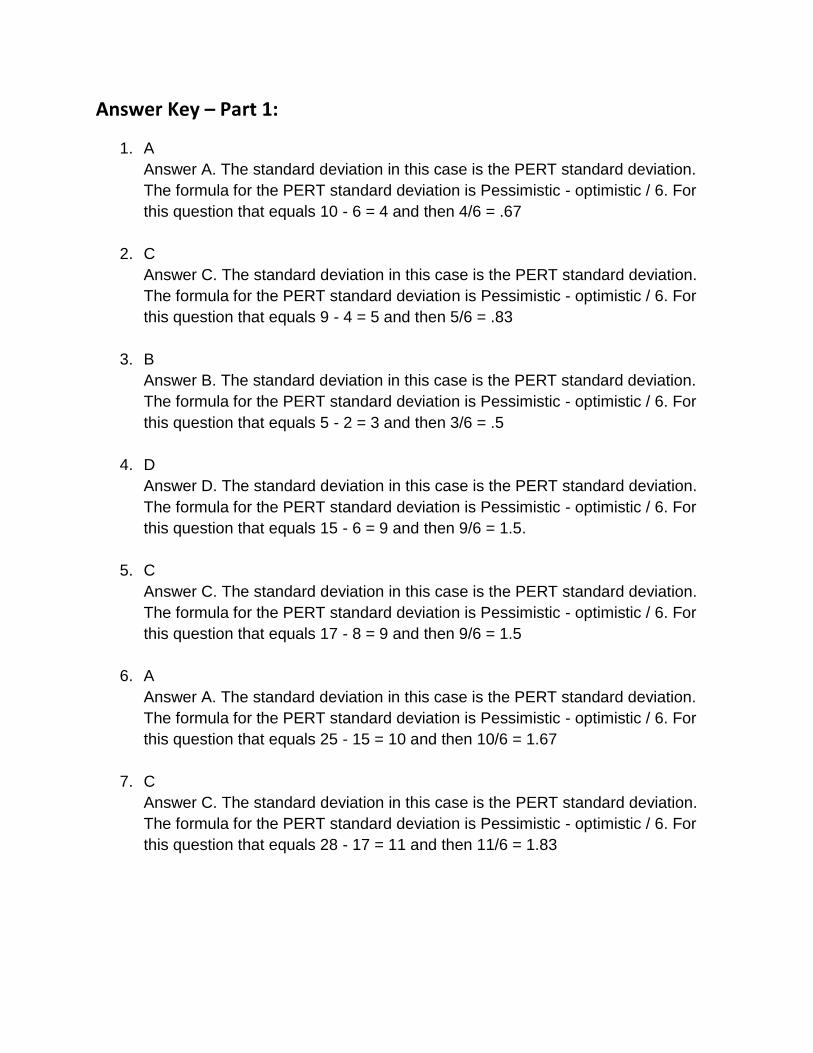
Answer Key – Part 1:
1. A
Answer A. The standard deviation in this case is the PERT standard deviation.
The formula for the PERT standard deviation is Pessimistic - optimistic / 6. For
this question that equals 10 - 6 = 4 and then 4/6 = .67
2. C
Answer C. The standard deviation in this case is the PERT standard deviation.
The formula for the PERT standard deviation is Pessimistic - optimistic / 6. For
this question that equals 9 - 4 = 5 and then 5/6 = .83
3. B
Answer B. The standard deviation in this case is the PERT standard deviation.
The formula for the PERT standard deviation is Pessimistic - optimistic / 6. For
this question that equals 5 - 2 = 3 and then 3/6 = .5
4. D
Answer D. The standard deviation in this case is the PERT standard deviation.
The formula for the PERT standard deviation is Pessimistic - optimistic / 6. For
this question that equals 15 - 6 = 9 and then 9/6 = 1.5.
5. C
Answer C. The standard deviation in this case is the PERT standard deviation.
The formula for the PERT standard deviation is Pessimistic - optimistic / 6. For
this question that equals 17 - 8 = 9 and then 9/6 = 1.5
6. A
Answer A. The standard deviation in this case is the PERT standard deviation.
The formula for the PERT standard deviation is Pessimistic - optimistic / 6. For
this question that equals 25 - 15 = 10 and then 10/6 = 1.67
7. C
Answer C. The standard deviation in this case is the PERT standard deviation.
The formula for the PERT standard deviation is Pessimistic - optimistic / 6. For
this question that equals 28 - 17 = 11 and then 11/6 = 1.83
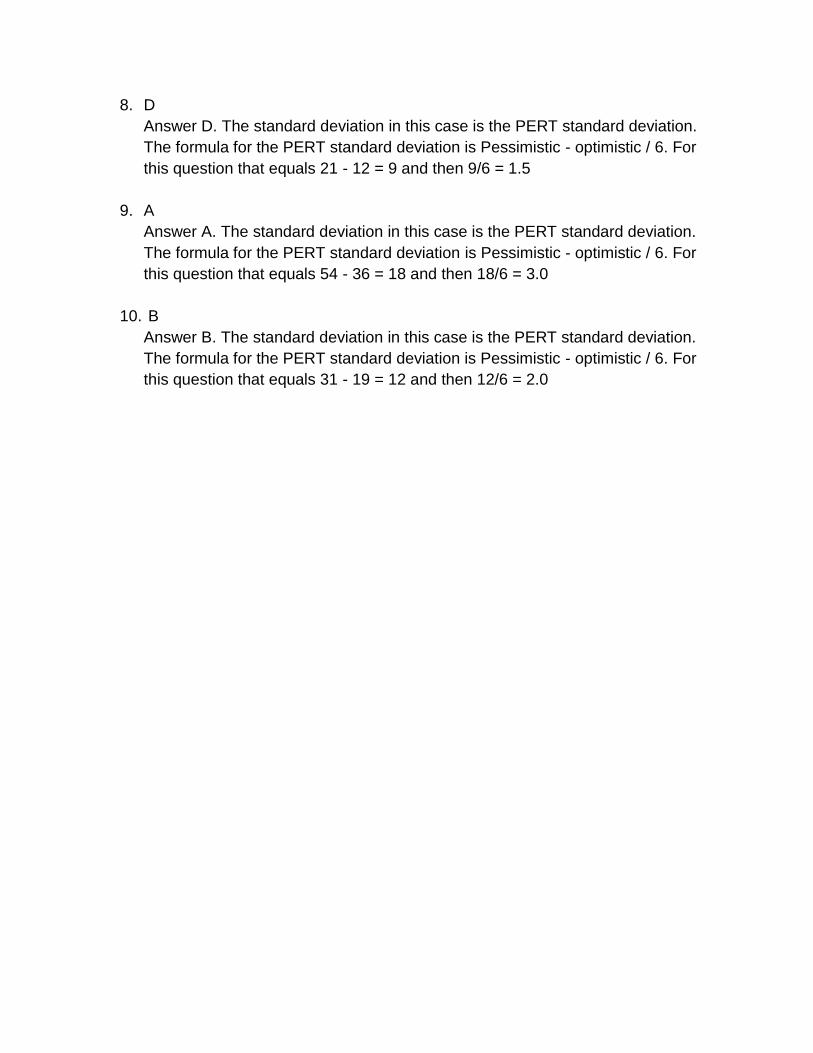
8. D
Answer D. The standard deviation in this case is the PERT standard deviation.
The formula for the PERT standard deviation is Pessimistic - optimistic / 6. For
this question that equals 21 - 12 = 9 and then 9/6 = 1.5
9. A
Answer A. The standard deviation in this case is the PERT standard deviation.
The formula for the PERT standard deviation is Pessimistic - optimistic / 6. For
this question that equals 54 - 36 = 18 and then 18/6 = 3.0
10. B
Answer B. The standard deviation in this case is the PERT standard deviation.
The formula for the PERT standard deviation is Pessimistic - optimistic / 6. For
this question that equals 31 - 19 = 12 and then 12/6 = 2.0
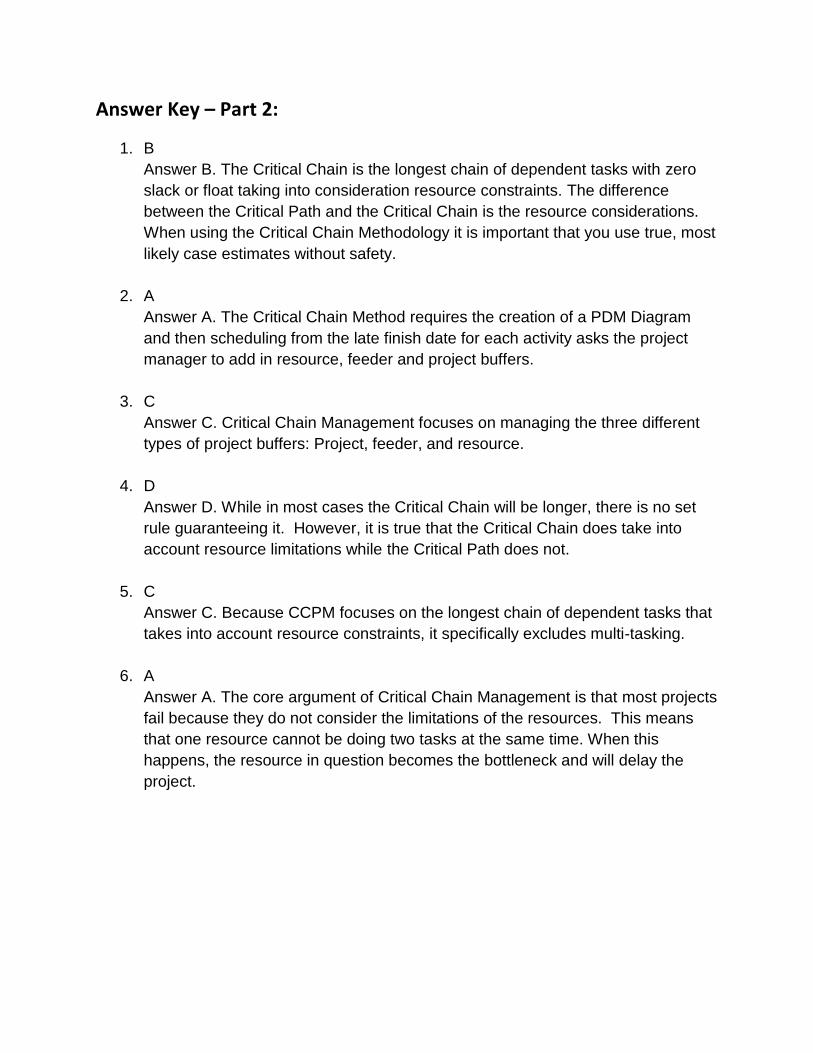
Answer Key – Part 2:
1. B
Answer B. The Critical Chain is the longest chain of dependent tasks with zero
slack or float taking into consideration resource constraints. The difference
between the Critical Path and the Critical Chain is the resource considerations.
When using the Critical Chain Methodology it is important that you use true, most
likely case estimates without safety.
2. A
Answer A. The Critical Chain Method requires the creation of a PDM Diagram
and then scheduling from the late finish date for each activity asks the project
manager to add in resource, feeder and project buffers.
3. C
Answer C. Critical Chain Management focuses on managing the three different
types of project buffers: Project, feeder, and resource.
4. D
Answer D. While in most cases the Critical Chain will be longer, there is no set
rule guaranteeing it. However, it is true that the Critical Chain does take into
account resource limitations while the Critical Path does not.
5. C
Answer C. Because CCPM focuses on the longest chain of dependent tasks that
takes into account resource constraints, it specifically excludes multi-tasking.
6. A
Answer A. The core argument of Critical Chain Management is that most projects
fail because they do not consider the limitations of the resources. This means
that one resource cannot be doing two tasks at the same time. When this
happens, the resource in question becomes the bottleneck and will delay the
project.
7. B
Answer B. The Theory of Constraints has five major steps:
A - Identify the system constraint
B - Exploit the constraint
C - Subordinate everything to the constraint
D - Elevate the systems’ constraints
E - Repeat the process
8. C
Answer C. According to the Theory of Constraints, most current management
philosophies focus on either cost or throughput management. In reality, most are
simply focused on cost management.
9. A
Answer A. According to the Theory of Constraints, the only way to achieve good
cost performance is to achieve it at each local or independent stage of the
process. This localizing factor becomes a major problem for overall project
performance because this can be very different from good overall project cost
performance. Sometimes a local step needs to be sacrificed to ensure good
overall performance.
Answer Key – Part 3:
1. B
Answer B. PMBOK® Guide p. 201. The correct answer is 0.44. The PERT
variance is calculated by first calculating the PERT standard deviation for the
case using the formula of (pessimistic – optimistic) / 6. Once you have the PERT
standard deviation you must square that result to obtain the PERT variance.
2. B
Answer B. Each of these methods provides an evaluation of the project in some
way. However, only the critical path method or CPM, focuses in on the amount
of slack or float contained by a task.
3. C
Answer C. Each of these methods provides an evaluation of the project in some
way. However, only the critical path method or CPM, focuses in on the amount
of slack or float contained by a task.
4. B
Answer B. PMBOK® Guide p. 191. Internal dependencies are not a type defined
by PMI®. This is an example of a discretionary dependency because the
question clearly states that the schematics are required to go the next step.
5. D
Answer D. PMBOK® Guide p. 191. Internal dependencies are not a type defined
by PMI®. This is an example of a mandatory dependency. Neither the
manufacturing nor the project management processes require the regulatory
approval. However, governmental approval is required in order to sell the
completed product.
6. C
Answer C. PMBOK® Guide p. 217. A Gantt chart is a type of bar chart laid on its
side that also shows a project calendar. The lengths of the bars reflect the length
of time the task, deliverable, or activity take.
7. B
Answer B. PMBOK® Guide p. 209-212. Network diagrams are modeling
methods that display the relationships between task, deliverable and activities.
Since the bars in a bar chart are independent of each other, they cannot provide
this information.
8. A
Answer A. PMBOK® Guide p. 189-190. PDM or the precedence diagramming
method is a method of network diagram designed to display task dependencies
and relationships. One of its most valuable outputs is the critical path which is
the longest chain of dependent tasks where there is no slack or float.
9. A
Answer A. A heuristic – is a method of problem solving that relies on inductive
reasoning from past (expert) judgment when there is no relevant mathematical
algorithm. It is also sometimes referred to as a “rule of thumb”.
10. C
Answer C. PMBOK® Guide p. 193. Lag time represents the amount of time a
task or activity can be delayed without impacting the early start of the next task or
activity. Often lag is added to a chain to produce a gap between tasks or
activities.
11. B
Answer B. PMBOK® Guide p. 192. Lead time represents the amount of time one
activity can begin prior to the completion of its preceding dependent task. Lead
time is used to compress a schedule and can run the risk of rework.
12. A
Answer A. PMBOK® Guide p. 189-190. The network diagram is specifically
designed to allow you to determine all the potential project paths and the longest
time the project can take. A work breakdown structure is used to show the
project deliverables. Changing the end date of a project does not necessarily
change a network diagram and the critical path never contains dummy tasks.
13. C
Answer C. PMBOK® Guide p.157. A milestone is a marker representing the
completion of a task, activity or deliverable. It never has duration of any length.
14. A
Answer A. Standard deviation allows you to determine the amount of dispersion
from the mean that your estimates have. The more dispersed the estimates, the
more variance exists between the estimates — and therefore the greater the risk
is.
15. B
Answer B. PMBOK® Guide p. 213. Several of these answers are close, but the
correct answer is to gain an indication of the risk in the project. Monte Carlo
simulations will not tell you about specific risk. They reveal the probabilistic
nature of risk. A Monte Carlo simulation enables the user to determine the
probability that a result will occur within a given range. The wider the range, the
greater the uncertainty or risk.
16. D
Answer D. PMBOK® Guide p.210. Slack or float represents the amount of time a
specified activity may be delayed without impacting the project’s critical path.
Only items not on the Critical Path have slack or float. It is the difference
between the early finish and late finish or the early and late start.
17. A
Answer A. PMBOK® Guide p.210. Slack or float represents the amount of time a
specified activity may be delayed without impacting the project’s Critical Path.
Only items not on the Critical Path have slack or float. It is the difference
between the early finish and late finish or the early and late start. In this case the
best answer is to first determine if the task is on the Critical Path and find out
how much slack or float it has.
18. B
Answer B. PMBOK® Guide p.210. Slack or float represents the amount of time a
specified activity may be delayed without impacting the project’s Critical Path.
Only items not on the critical path have slack or float. It is the difference between
the early finish and late finish or the early and late start. In this case the best
answer is to first determine if the tasks are on the Critical Path and find out how
much slack or float it has.
19. D
Answer D. PMBOK® Guide p.210. Multiple critical paths are not unusual in the
real world. This simply means that if any of the activities on any of the Critical
Paths are delayed, the entire project will be delayed. This sometimes causes an
increase in project resources or cost and it might cause the project to take
longer. However, it is a guarantee that the project has an increase in risk
because the project now has more chance for an activity delay to impact the
delivery of the project.
20. B
Answer B. PMBOK® Guide p.210. Multiple critical paths are not unusual in the
real world. This simply means that if any of the activities on any of the critical
paths are delayed the entire project will be delayed. Therefore, the existence of
multiple critical paths does not represent an error in your process. The
development of the PDM Diagram is part of activity sequencing. The next step in
the process is developing the project schedule.
21. A
Answer A. PMBOK® Guide p.211. This is a triple constraints question. If the
project schedule is the most flexible, this means the project could continue for
several months past the original forecast. This is especially true because the
project has an inflexible scope. Because the project cost is fixed on a monthly
basis — but not on a total basis — the best thing to do is level the resources to
ensure the monthly project costs do not exceed the allowable amount.
22. C
Answer C. PMBOK® Guide p.218. The best tool for reporting to management is
a milestone chart. This provides the correct level of information for management.
23. B
Answer B. PMBOK® Guide p.215. The best thing to do in this case is crash the
project. This usually entails adding resources to the project to get project work
done more quickly. This will cause a likely increase in project costs. Fast
tracking is doing tasks in parallel which decreases the schedule, but this often
causes rework which in this case is unacceptable.
24. D
Answer D. PMBOK® Guide p.215. The best thing to do in this case is fast track
the project. This is because you do not have the ability to increase the cost by
adding resources (crashing). Reassessing the critical path and developing a new
schedule are not preferred alternatives.
25. A
Answer A. PMBOK® Guide p.215. Whenever your due date is reduced, the first
thing to do evaluate the two alternatives you have. You can either crash or fast
track the project.
26. B
Answer B. PMBOK® Guide p.213. Whenever doing any type of evaluation of a
project it is always critical that you analyze the risks associated.
27. D
Answer D. PMBOK® Guide p. 205. Develop schedule is the process where the
basic schedule is applied to a calendar.
28. A
Answer A. This is a PMIism. The best option is always to determine alternatives
before you do anything else.
29. A
Answer A. PMBOK® Guide p. 195-204, 210. Project estimates should always be
developed by the project team and not just the project manager. Additionally, the
project duration is never generated by simply summing the activity estimates as
many activities are completed concurrently. Simply summing these values will
cause an inflation of the estimate.
30. B
Answer B. PMBOK® Guide p. 189-190. Only the precedence diagramming
method or PDM allows for relationships other than finish to start. In this case a
start to start relationship is indicated by the fact that the tasks can begin at the
same time. Therefore PDM is the correct answer.
31. C
Answer C. PMBOK® Guide p. 189-190. Only the precedence diagramming
method or PDM allows for relationships other than finish to start. In this case a
finish to finish relationship is indicated by the fact that the tasks can begin at the
same time. Therefore PDM is the correct answer.
32. A
Answer A. GERT or graphical evaluation and review technique allows for looping,
alternative flows and probabilistic networks and is the only diagramming
technique that does so.
33. C
Answer C. GERT or graphical evaluation and review technique allows for
looping, alternative flows and probabilistic networks and is the only diagramming
technique that does so.
34. B
Answer B. PMBOK® Guide p. 222. To complete the project schedule you also
need to include your safety or contingency reserves. All the other alternatives
are used in schedule control as inputs or are not applicable.
35. C
Answer C. PMBOK® Guide p. 181-182. To understand how a project is
managing schedule change you first look at the schedule management plan.
PMI® is consistent on this point. You always examine the topic area’s
management plan first.
36. B
Answer B. PMBOK® Guide p. 201. A weighted average is created when PERT
or project evaluation and review technique is used.
37. A
Answer A. PMBOK® Guide p. 189-190. Once you have completed the network
diagram you need to create a schedule and get it approved by your team.
38. B
Answer B. PMBOK® Guide p. 215. The only two answers that are close include:
compress the schedule and finalize the schedule. Compressing the schedule is
done before the schedule is finalized.
39. D
Answer D. PMBOK® Guide p. 210. The information concerning earned value has
nothing to do with this question. The only thing you can tell for sure is that there
are three weeks of slack or float because the early and late start times are not
the same. This means the task must not be on the Critical Path.
40. A
Answer A. PMBOK® Guide p. 210. The only thing you can tell for sure is that
there are three weeks of slack or float because the early and late start times are
not the same. This means the task must not be on the critical path. In addition,
this question tests whether or not you know that ES stands for early start, LS
stands for late start, EF stands for early finish and LS stands for late finish.
41. B
Answer B. PMBOK® Guide p. 191-192; 215. Two pieces of knowledge are
important to this question. First, you must understand the different types of
dependencies (mandatory, discretionary, internal and external). Secondly, you
must know that whenever a schedule needs to be shortened you can either crash
the schedule or fast track it. Fast tracking is the correct answer because you
cannot add resources.
42. C
Answer C. PMBOK® Guide p. 218. Whenever it is a question about the type of
reporting for senior management the answer is always Milestone Reports. You
may provide a lot of other information, but the Milestone Report always comes
first.
43. B
Answer B. PMBOK® Guide p. 218. Whenever it is a question about the type of
reporting for senior management the answer is always Milestone Reports. You
may provide a lot of other information, but the Milestone Report always comes
first.
44. D
Answer D. PMBOK® Guide p. 215. Making more activities concurrent is another
way of saying fast track the project. It is one of only two ways to reduce a project
schedule without reducing project scope. The other is crashing — which is
adding resources to the project. Crashing is not an option in this case. Reducing
the scope is not an option until you have first tried the other alternatives.
45. A
Answer A. PMBOK® Guide p. 215. Fast tracking is the technique where you
change the scheduling of dependent tasks so they are done in parallel.
46. C
Answer C. PMBOK® Guide p. 211. The process of changing work assignments
or resourcing so that the amount of work done in each month or specified time
period is called resource leveling.
47. B
Answer B. PMBOK® Guide p. 215. Crashing is the schedule compression
technique that reduces the amount of time that specific activities take by adding
resources to those tasks. It runs the risk of increasing project costs.
48. D
Answer D. PMBOK® Guide p. 201. A three point estimate forces a normal
distribution when used with the PERT analysis technique. This is a probabilistic
technique. When using a PERT Standard Deviation you get the probability that
the real duration comes within a range.
49. A
Answer A. PMBOK® Guide p. 200. Analogous estimating is an inexact
estimating technique because it is a top down technique. It is best used early in
the project when inexact estimates are expected to raise concerns or questions
about expectations.
50. C
Answer C. PMBOK® Guide p. 200. Parametric estimating provides project
estimates based upon some form of mathematical model. It is quantitative and
deterministic.
51. A
Answer A. PMBOK® Guide p. 189-190. Changes are a fact of life for a project
manager. The key is that you use your change control process, only implement
those changes approved by management, and always maintain the project
baseline. If you do not maintain the baseline you have nothing with which to
compare.
52. D
Answer D. PMBOK® Guide p. 209-210. Progress or status is not effectively
displayed with a network diagram. Network diagrams are very good at displaying
logical relationships and the critical path. Bar charts can be used to display
progress.
53. A
Answer A. PMBOK® Guide p. 215. Both fast tracking and crashing will get the
project done faster, but neither control the number of resources used in a month.
In fact, crashing will increase the number of hours worked. The only answer that
manages the hours worked by a resource is leveling
54. A
Answer A. PMBOK® Guide p. 215. The definition of crashing is increasing the
number of hours worked. This is done by working overtime or by adding people
to the project.
55. B
Answer B. PMBOK® Guide p. 215. Project risks must always be considered. It
is said that risk management is simply project management for adults. None of
the other alternatives are common requirements for proper crashing.
56. C
Answer C. PMBOK® Guide p. 189-190. In terms of process, this question
highlights the concept of compilation and summing. Just adding all the totals
together is summing. To correctly compile the schedule, a network diagram must
be built first.
57. C
Answer C. PMBOK® Guide p. 210-211. To correctly answer this question you
must weed through the long wording and build a precedence diagram. The
described network has three possible paths. If the duration of activity B changes
from 25 to 37, the activity will take 12 additional hours which changes the
duration of that path from 55 to 67 hours. Since the critical path has a duration of
107 hours the delay of activity B has no impact on the critical path.
58. D
Answer D. PMBOK® Guide p. 187-190; 205-221. Sequencing the activities is the
same as creating a network diagram, so that has already been done. The verify
scope process is done during the monitoring and controlling process group and
not during the planning process. Since a schedule is a critical input to risk
management you cannot do that yet. This leaves creating the preliminary
schedule and getting the team’s approval.
59. D
Answer D. PMBOK® Guide p. 195-204. If you read carefully, you will notice that
this question is really asking what you should do after the activity duration
estimating process. The WBS and activity list are created before the estimate
activity durations. The schedule is not finalized until after schedule compression.
Therefore compressing the schedule is done next.
60. A
Answer A. PMBOK® Guide p. 205. This question is a bit tricky for two reasons.
First, it looks like the question above, and control the schedule is the next step in
the process. However, you have not yet completed the develop schedule
process because you still need to gain approval from the stakeholders before
proceeding.

61. B
Answer B. PMBOK® Guide p. 215. In this question you are being asked for the
best way to deliver the project when you are exceeding the deadline. The first
choice is to always maintain the scope and either fast track or crash the project.
Making more activities concurrent is a fancy way of saying fast track and it is the
only viable option.
Recommended