Volume 02, No.03, March 2016
Pa
ge4
8
Propensity of Consumer Behaviour towards Shampoo Brands
(A Case Study of Sagar City, Madhya Pradesh)
Ms Manjari Pandey* & Prof. G.L. Puntambekar**
*Research Scholar, Dr. Hari Singh Gour University Sagar(M.P)
**Professor, Dr. Hari Singh Gour University Sagar(M.P
ABSTRACT:
In this competitive era, people are obsessed with their appearance and look. To improve their
appearance & look people especially the youths they used so many products. Traditionally, only
females are conscious toward their look & appearance but today, both male & female consumers
are conscious towards their appearance. This trend has provided tremendous opportunity for the
manufacturers to produce and sell of such products. Shampoo is one of the products, which has
popularized from last two decades. Through advertisement, these products popularized even in
remote areas of the country. Sagar city of Madhya Pradesh is a small city and almost all the
modern products like shampoo is widely used by the residents irrespective of their age and other
demographic factors. This paper is an effort to analyse the propensity of consumer of consumer
behaviour towards shampoo in Sagar city through survey data. The survey data reveals both
male & female are attuned towards shampoo and majority of consumers preferred price discount
during the selection of shampoo brand. This paper has also tried to explore the level of
consumer satisfaction and conclude that most of the customers are satisfied with their brand but
they are looking for more satisfaction.
Keywords: FMCG, GDP, MNCs, Consumer Behaviour
INTRODUCTION:
Today consumer behaviour is changing very fast. Indian consumers have also been responding
towards new and modern products introduced in this globalised era. The behaviour of consumers
changed with the advent of new psyche, changing lifestyle, income and education level. Apart
from new economic policy, globalization, modernization of society & hallow effect have also
casted their shadow on behaviour of consumers. In fact, “Consumer is real deciding factor for all
economic activities.”( Jaswal,2014).With the changing behaviour of the consumers , market is
also changing rapidly & is showing unprecedented boom in the market of several products.
Companies monitor the change in buying pattern of consumers and change their production and
marketing strategy accordingly. They used many sales promotion schemes, effective
advertisement, inventing new products to attract consumers. However many companies fails to
monitor fast changing consumer behaviour as a result, their products get away from the
market.“When any organization loses a customer they are not losing future earnings but also
incurring the cost of finding new customers” (Thapa 2012).Due to stiff competition, he consumer
behaviour plays a very important role in the success of any company or manufacturing firm.
Shampoo market is one of the competitive & congested market, various brands are available. In
Volume 02, No.03, March 2016
Pa
ge4
9
the fast changing market condition and its reaction on consumer behaviour, it is important to
know that how consumers are behaving during the purchase of a particular segment.To know the
changing behaviour towards shampoo product, a FMCG product, Sagar city of Madhya Pradesh
has been selected for case study.this paper is an effort to know the propensity of consumer
behaviour towards shampoo product.“FMCG stands for Fast moving consumer goods are also
known as consumer packaged goods sector is an important part of consumption” ( Sharma &
Mehta 2012 ).
About the Shampoo Product
Shampoo is an important FMCG product and it is widely used by the majority of the consumers
as a hair care.FMCG sector is the corner stone because it is an important contributor in India‟s
GDP.FMCG products are also important as it touches every aspect of consumer‟s life. India‟s
FMCG sector is the fourth largest sector in the economy. Main components of Indian FMCG
industry are Household care, Personal care, Food & Beverages .Today FMCG market is very
competitive, several consumer products have been introduced & popularized by passing time.
Shampoo is a product which belongs to personal care component. “In the early days a shampoo
could be defined as an effective cleansing agent for hair and scalp, but today the shampoo must
do much more it must leave the hair easy to comb, lustrous and controllable whilst being
convenient and easy to use.”( Kazi 2013).The global shampoo market is expected to reach an
estimated value of $ 25.73 billion by 2019.The shampoo market today is very competitive &
recorded constantly surge in sale .“Shampoo Market in India is in excess to Rs 4000 cr & has
shown more than 15% year on year growth last few years” (Singh & Mishra 2012).Now-a-days
shampoo is one of the significant product for both men & women. Many companies launched
sachet & small packs of shampoo to target attract more and more consumers especially low level
income groups & middle class.
“Today the shampoo marketplace is very jam-packed and ready for action and so numerous
companies are trying to capture the market with their contemporary expertise”(Gopalamy, et al.
2013).Few years ago, the soap which used for bath was also used for washing hair. Consumers
also used to wash hair with Lassi, Multani, Curd & other home made products, but now shampoo
has taken the place of these traditional items . According to the study conducted by AC Nielsen
62 of the top 100 brands are owned by MNCs .Fifteen companies own these 62 brands and 27 of
these brands are owned by HUL. The personal care category has the largest number of brands i.e,
21. There are 11 HUL brands in the 21, aggregating Rs 37999 crore or 54% of the personal
category. In this modern era, the growth of hair care segment was taken place through shampoos,
conditioners, hair gel, hair dyes etc.Shampoo was introduced for the first time in the market
during the 1950s. It came to Indian market as an innovation by sunsilk in 1964.Right now so
many brands are available in market .Hair care or shampoo, has been HUL‟s mainstay in
personal products. The HUL‟s brands clinic plus, sunsilk , dove, tresemme, the consumers
product giant has over 47% of the market worth more than Rs 5200 crore. Nearest rival P & G
with a 21% share, has seen its market share shrinking.HUL have been consistently innovating in
terms of price & product.HUL is leading overall shampoo market in the country. According to
India Brand Equity Foundation report 2013, HUL has 46% share, P& G has 24% , Cavincare &
Dabur 10% & 6% share respectively.“The market share of any product is highly determined by
the purchasing behaviour of consumers” ( Akarte & Arora 2012 ).
Volume 02, No.03, March 2016
Pa
ge5
0
The above mentioned facts reveal the propensity among consumers towards shampoos. Today,
consumers are more prudent in choosing product as they want more & more satisfaction. Their
taste & preferences are changing & it leads radical transformation in lifestyles, exposure &
spending patterns. Their avidity increasing day by day and they also aware about full return of
their money. Due to these changing awareness and behaviour, only strong brand sustain in the
market & differentiated from rivals. Now, the consumers pay attention only those brands which
are relevant to their needs or interest & fitter out irrelevant ones. So it is important to analyse the
consumer behaviour in general and regarding a selected brand in particular. With this objective,
Shampoo brand of selected companies have been selected for examining the propensity of
consumer behaviour.
OBJECTIVES OF THE STUDY:
Following objectives were set for the topic selected for the study:
1. To study brand preference among male & female consumers in Sagar City.
2. To study the buying behaviour of consumers.
3. To study level of satisfication among male & female consumers.
4. To study factors that influence consumer behaviour.
REVIEW OF LITERATURE:
Several studies were conducted on consumer behaviour and other related issue of brand image in
the country and also on the international brands. The research papers, books, articles, surveys
also available which represented different aspects of consumer behaviour as well as the purchase
in different parts of the country. Following relevant literature has been referred for conducted
this case study:
Dr Sharma, Mehta ( 2012 ) in given study revealed that consumers are more conscious towards
their appearance. They found most of the consumers preferred sachet as compared to bottles.
Anju Thapa ( 2013 ) She pointed out increasing usage rate of shampoo & frequent buying
behaviour. She also pointed out various factors that influence switching behaviour of consumers
such as packaging, price rise of current brand, impact of advertisement, to try new options
influence by others etc. Rao, Karnam, Reddy ( 2014 ) They stated that frequency of using
shampoo among consumers is very low, it is only once in a week & most of the respondents are
satisfied with current brand.(Gopalsamy, et al 2010) they stated the importance of knowing
consumer behaviour, what is in the mind of consumer is very essential to capture market.(Sigh &
Mishra, 2013) They studied about the awareness, attitude, & behaviour of consumers towards
major brands. They also stated about tough competition in FMCG sector.(Akarte & Arora 2012),
They have focused on satisfication of consumers. They have also stated that, for satisfying
consumers it is essential companies should know about consumer behaviour & analyse all these
factors & find out best suitable tools for promoting their shampoo.
Volume 02, No.03, March 2016
Pa
ge5
1
RESEARCH METHODOLOGY:
This study is descriptive in nature and mainly based on primary data. The total 60 samples
selected for the study from Sagar city through Random Sampling Method. The data collected on
the basis of purposive sampling in which 30 males and 30 females selected for the study to
maintain the equal representation of male and female. A questionnaire was framed to collect the
primary data and the data so collected was analysed with the help of simple statistical tools. The
results were presented and interpreted as per the data obtained from survey.
ANALYSIS AND INTERPRETATION OF PRIMARY DATA
To know the propensity of consumer behaviour towards shampoo in Sagar city of Madhya
Pradesh 60 samples were selected on random basis. The data collected on the issue selected for
survey has been tabulated and classified under following tables:
1. Age of the respondents:
Age of the consumer is very significant factor in consumer‟s interest, preferences, needs, choice
and their decision making criteria.Generally youth tend towards appearance & look, and
therefore, they prefer the products which helps to look better whereas old people show their
scrimp behaviour while choosing product to buy.Following table indicates the age wise
distribution of the respondents:
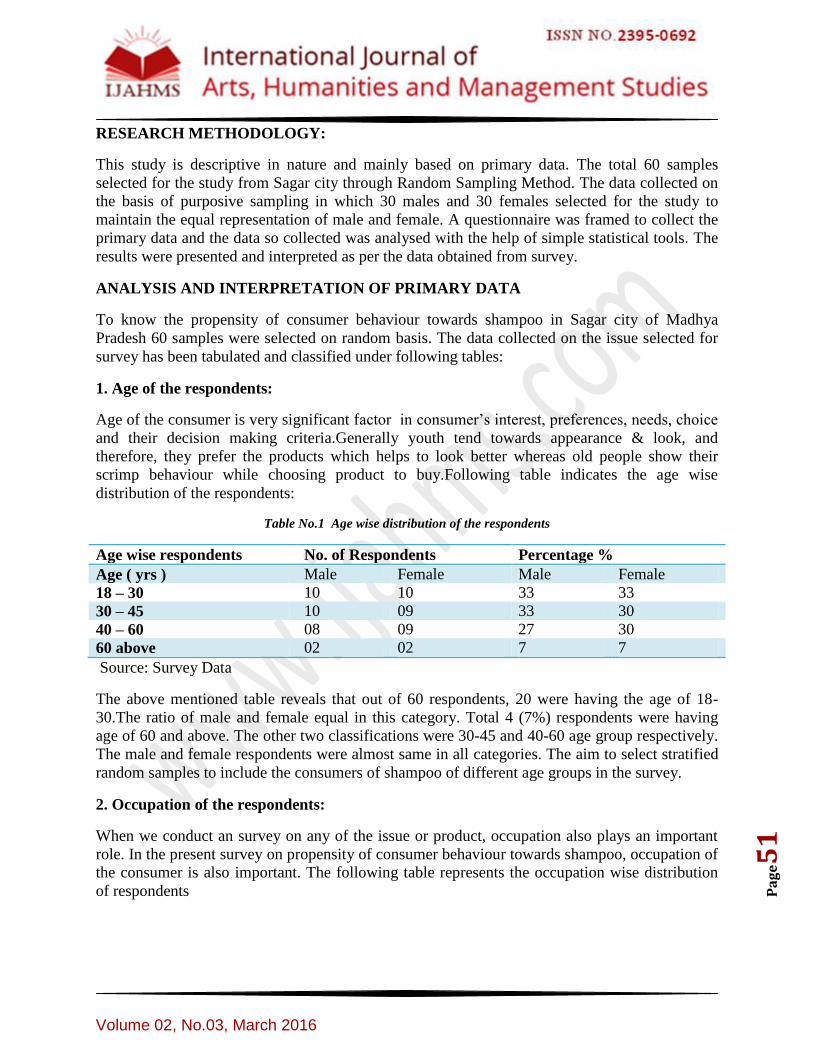
Table No.1 Age wise distribution of the respondents
Age wise respondents No. of Respondents Percentage %
Age ( yrs ) Male Female Male Female
18 – 30 10 10 33 33
30 – 45 10 09 33 30
40 – 60 08 09 27 30
60 above 02 02 7 7
Source: Survey Data
The above mentioned table reveals that out of 60 respondents, 20 were having the age of 18-
30.The ratio of male and female equal in this category. Total 4 (7%) respondents were having
age of 60 and above. The other two classifications were 30-45 and 40-60 age group respectively.
The male and female respondents were almost same in all categories. The aim to select stratified
random samples to include the consumers of shampoo of different age groups in the survey.
2. Occupation of the respondents:
When we conduct an survey on any of the issue or product, occupation also plays an important
role. In the present survey on propensity of consumer behaviour towards shampoo, occupation of
the consumer is also important. The following table represents the occupation wise distribution
of respondents
Volume 02, No.03, March 2016
Pa
ge5
2
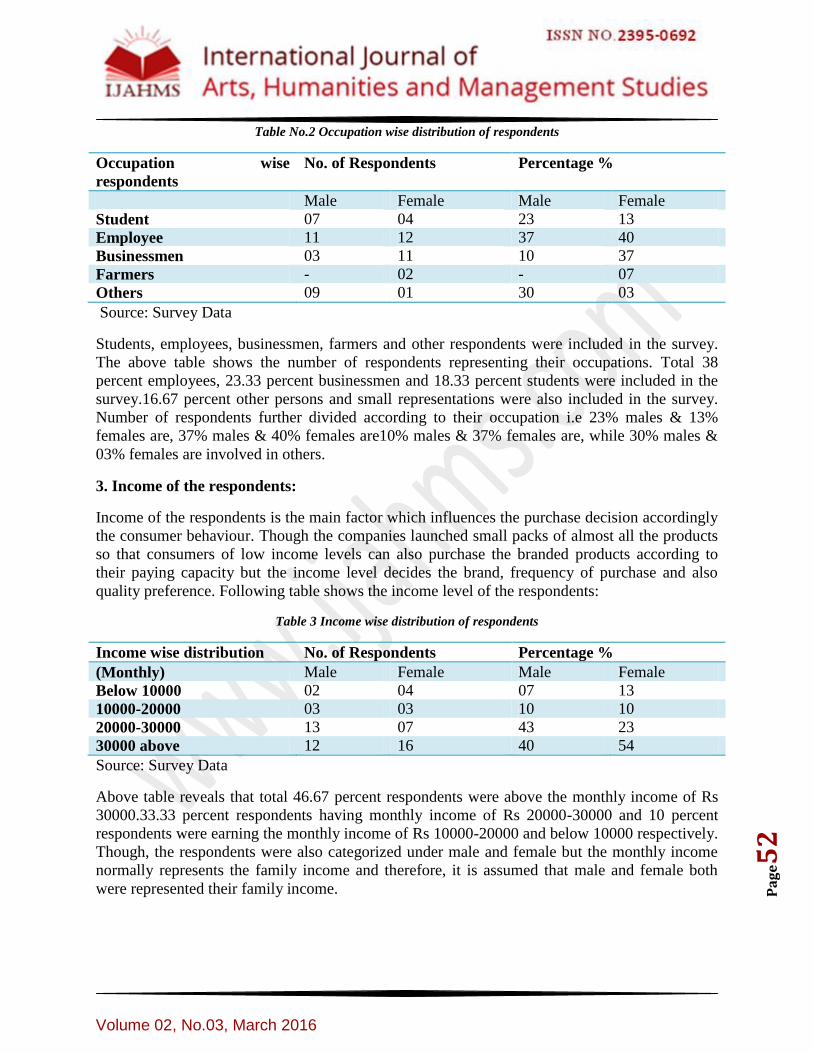
Table No.2 Occupation wise distribution of respondents
Occupation wise
respondents
No. of Respondents Percentage %
Male Female Male Female
Student 07 04 23 13
Employee 11 12 37 40
Businessmen 03 11 10 37
Farmers - 02 - 07
Others 09 01 30 03
Source: Survey Data
Students, employees, businessmen, farmers and other respondents were included in the survey.
The above table shows the number of respondents representing their occupations. Total 38
percent employees, 23.33 percent businessmen and 18.33 percent students were included in the
survey.16.67 percent other persons and small representations were also included in the survey.
Number of respondents further divided according to their occupation i.e 23% males & 13%
females are, 37% males & 40% females are10% males & 37% females are, while 30% males &
03% females are involved in others.
3. Income of the respondents:
Income of the respondents is the main factor which influences the purchase decision accordingly
the consumer behaviour. Though the companies launched small packs of almost all the products
so that consumers of low income levels can also purchase the branded products according to
their paying capacity but the income level decides the brand, frequency of purchase and also
quality preference. Following table shows the income level of the respondents:
Table 3 Income wise distribution of respondents
Income wise distribution No. of Respondents Percentage %
(Monthly) Male Female Male Female
Below 10000 02 04 07 13
10000-20000 03 03 10 10
20000-30000 13 07 43 23
30000 above 12 16 40 54
Source: Survey Data
Above table reveals that total 46.67 percent respondents were above the monthly income of Rs
30000.33.33 percent respondents having monthly income of Rs 20000-30000 and 10 percent
respondents were earning the monthly income of Rs 10000-20000 and below 10000 respectively.
Though, the respondents were also categorized under male and female but the monthly income
normally represents the family income and therefore, it is assumed that male and female both
were represented their family income.
Volume 02, No.03, March 2016
Pa
ge5
3
4. Use of Shampoo product:
In this modern era, usage rate of modern products has been constantly increasing. Today, many
products have become necessity. Shampoo is one of the products which usage rate is increasing
.The following table reveals the usage rate of shampoo product in Sagar city:
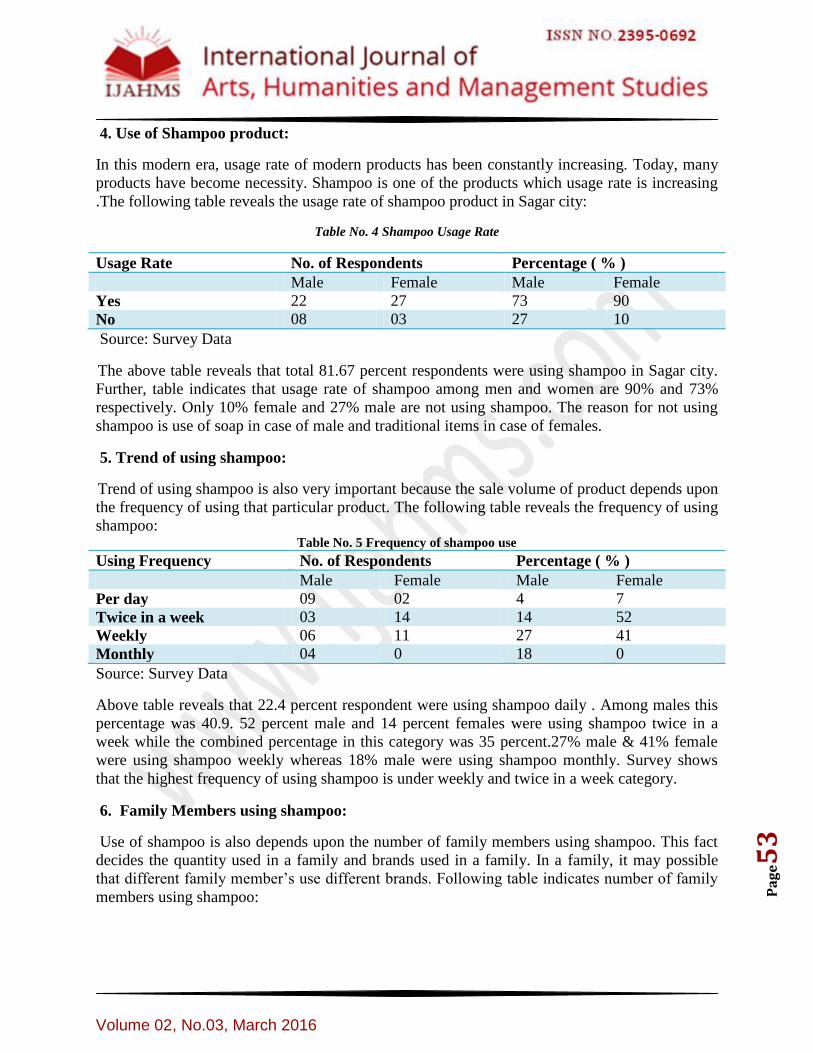
Table No. 4 Shampoo Usage Rate
Usage Rate No. of Respondents Percentage ( % )
Male Female Male Female
Yes 22 27 73 90
No 08 03 27 10
Source: Survey Data
The above table reveals that total 81.67 percent respondents were using shampoo in Sagar city.
Further, table indicates that usage rate of shampoo among men and women are 90% and 73%
respectively. Only 10% female and 27% male are not using shampoo. The reason for not using
shampoo is use of soap in case of male and traditional items in case of females.
5. Trend of using shampoo:
Trend of using shampoo is also very important because the sale volume of product depends upon
the frequency of using that particular product. The following table reveals the frequency of using
shampoo: Table No. 5 Frequency of shampoo use
Using Frequency No. of Respondents Percentage ( % )
Male Female Male Female
Per day 09 02 4 7
Twice in a week 03 14 14 52
Weekly 06 11 27 41
Monthly 04 0 18 0
Source: Survey Data
Above table reveals that 22.4 percent respondent were using shampoo daily . Among males this
percentage was 40.9. 52 percent male and 14 percent females were using shampoo twice in a
week while the combined percentage in this category was 35 percent.27% male & 41% female
were using shampoo weekly whereas 18% male were using shampoo monthly. Survey shows
that the highest frequency of using shampoo is under weekly and twice in a week category.
6. Family Members using shampoo:
Use of shampoo is also depends upon the number of family members using shampoo. This fact
decides the quantity used in a family and brands used in a family. In a family, it may possible
that different family member‟s use different brands. Following table indicates number of family
members using shampoo:
Volume 02, No.03, March 2016
Pa
ge5
4
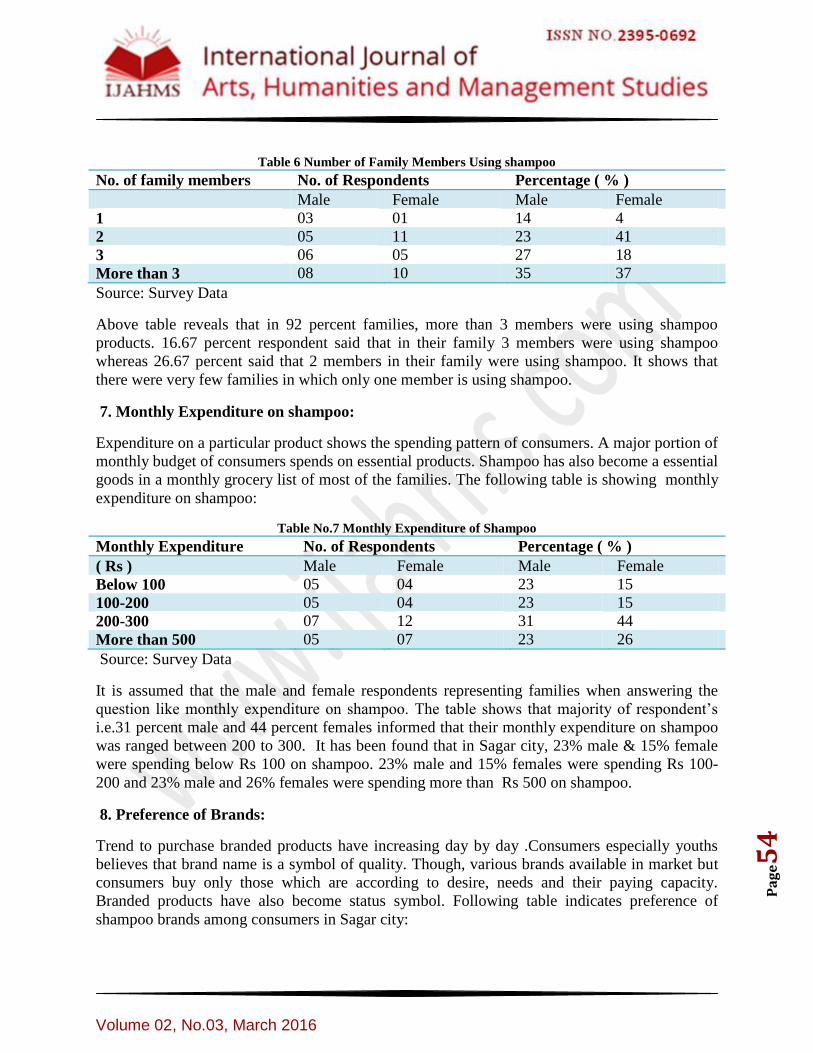
Table 6 Number of Family Members Using shampoo
No. of family members No. of Respondents Percentage ( % )
Male Female Male Female
1 03 01 14 4
2 05 11 23 41
3 06 05 27 18
More than 3 08 10 35 37
Source: Survey Data
Above table reveals that in 92 percent families, more than 3 members were using shampoo
products. 16.67 percent respondent said that in their family 3 members were using shampoo
whereas 26.67 percent said that 2 members in their family were using shampoo. It shows that
there were very few families in which only one member is using shampoo.
7. Monthly Expenditure on shampoo:
Expenditure on a particular product shows the spending pattern of consumers. A major portion of
monthly budget of consumers spends on essential products. Shampoo has also become a essential
goods in a monthly grocery list of most of the families. The following table is showing monthly
expenditure on shampoo:
Table No.7 Monthly Expenditure of Shampoo
Monthly Expenditure No. of Respondents Percentage ( % )
( Rs ) Male Female Male Female
Below 100 05 04 23 15
100-200 05 04 23 15
200-300 07 12 31 44
More than 500 05 07 23 26
Source: Survey Data
It is assumed that the male and female respondents representing families when answering the
question like monthly expenditure on shampoo. The table shows that majority of respondent‟s
i.e.31 percent male and 44 percent females informed that their monthly expenditure on shampoo
was ranged between 200 to 300. It has been found that in Sagar city, 23% male & 15% female
were spending below Rs 100 on shampoo. 23% male and 15% females were spending Rs 100-
200 and 23% male and 26% females were spending more than Rs 500 on shampoo.
8. Preference of Brands:
Trend to purchase branded products have increasing day by day .Consumers especially youths
believes that brand name is a symbol of quality. Though, various brands available in market but
consumers buy only those which are according to desire, needs and their paying capacity.
Branded products have also become status symbol. Following table indicates preference of
shampoo brands among consumers in Sagar city:
Volume 02, No.03, March 2016
Pa
ge5
5
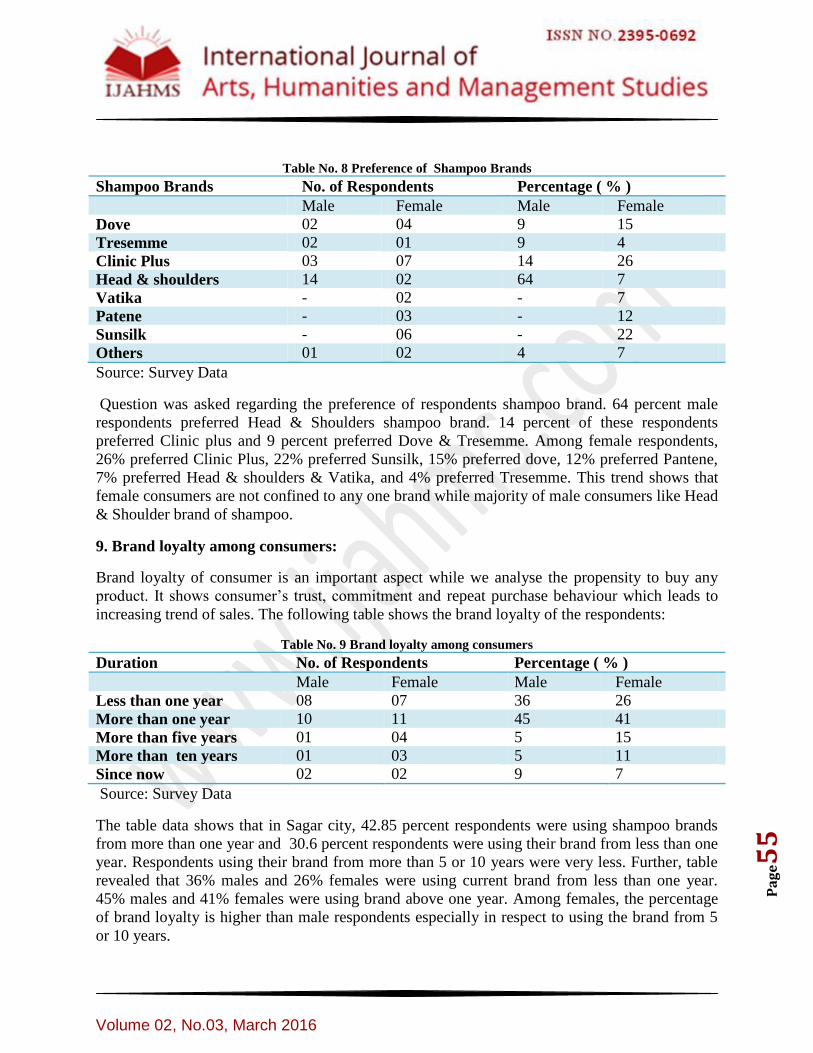
Table No. 8 Preference of Shampoo Brands
Shampoo Brands No. of Respondents Percentage ( % )
Male Female Male Female
Dove 02 04 9 15
Tresemme 02 01 9 4
Clinic Plus 03 07 14 26
Head & shoulders 14 02 64 7
Vatika - 02 - 7
Patene - 03 - 12
Sunsilk - 06 - 22
Others 01 02 4 7
Source: Survey Data
Question was asked regarding the preference of respondents shampoo brand. 64 percent male
respondents preferred Head & Shoulders shampoo brand. 14 percent of these respondents
preferred Clinic plus and 9 percent preferred Dove & Tresemme. Among female respondents,
26% preferred Clinic Plus, 22% preferred Sunsilk, 15% preferred dove, 12% preferred Pantene,
7% preferred Head & shoulders & Vatika, and 4% preferred Tresemme. This trend shows that
female consumers are not confined to any one brand while majority of male consumers like Head
& Shoulder brand of shampoo.
9. Brand loyalty among consumers:
Brand loyalty of consumer is an important aspect while we analyse the propensity to buy any
product. It shows consumer‟s trust, commitment and repeat purchase behaviour which leads to
increasing trend of sales. The following table shows the brand loyalty of the respondents:
Table No. 9 Brand loyalty among consumers
Duration No. of Respondents Percentage ( % )
Male Female Male Female
Less than one year 08 07 36 26
More than one year 10 11 45 41
More than five years 01 04 5 15
More than ten years 01 03 5 11
Since now 02 02 9 7
Source: Survey Data
The table data shows that in Sagar city, 42.85 percent respondents were using shampoo brands
from more than one year and 30.6 percent respondents were using their brand from less than one
year. Respondents using their brand from more than 5 or 10 years were very less. Further, table
revealed that 36% males and 26% females were using current brand from less than one year.
45% males and 41% females were using brand above one year. Among females, the percentage
of brand loyalty is higher than male respondents especially in respect to using the brand from 5
or 10 years.
Volume 02, No.03, March 2016
Pa
ge5
6
10. Various Sources of Information:
Sources of information are also important for buying behavior of a consumer. Consumers‟
gathers information of the products from different sources such as advertisement, magazines,
radio and friends. The following table shows various sources of information from which the
respondent of Sagar city has gathered information of shampoo brands:
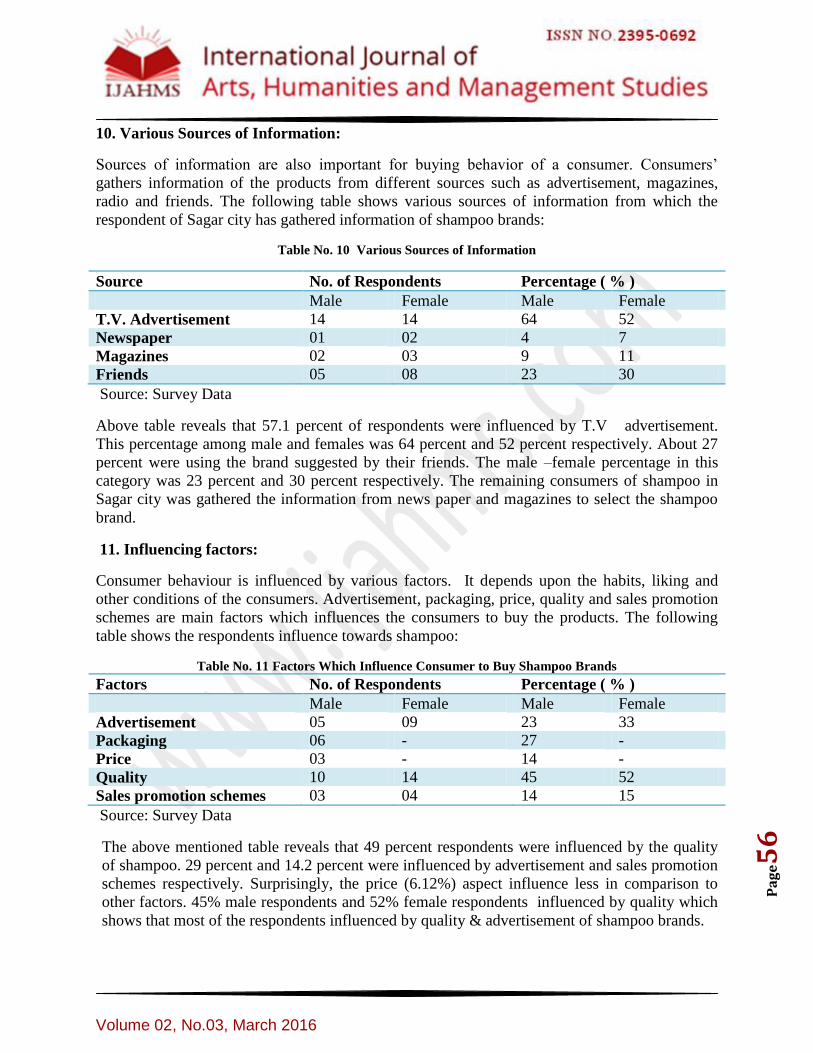
Table No. 10 Various Sources of Information
Source No. of Respondents Percentage ( % )
Male Female Male Female
T.V. Advertisement 14 14 64 52
Newspaper 01 02 4 7
Magazines 02 03 9 11
Friends 05 08 23 30
Source: Survey Data
Above table reveals that 57.1 percent of respondents were influenced by T.V advertisement.
This percentage among male and females was 64 percent and 52 percent respectively. About 27
percent were using the brand suggested by their friends. The male –female percentage in this
category was 23 percent and 30 percent respectively. The remaining consumers of shampoo in
Sagar city was gathered the information from news paper and magazines to select the shampoo
brand.
11. Influencing factors:
Consumer behaviour is influenced by various factors. It depends upon the habits, liking and
other conditions of the consumers. Advertisement, packaging, price, quality and sales promotion
schemes are main factors which influences the consumers to buy the products. The following
table shows the respondents influence towards shampoo:
Table No. 11 Factors Which Influence Consumer to Buy Shampoo Brands
Factors No. of Respondents Percentage ( % )
Male Female Male Female
Advertisement 05 09 23 33
Packaging 06 - 27 -
Price 03 - 14 -
Quality 10 14 45 52
Sales promotion schemes 03 04 14 15
Source: Survey Data
The above mentioned table reveals that 49 percent respondents were influenced by the quality
of shampoo. 29 percent and 14.2 percent were influenced by advertisement and sales promotion
schemes respectively. Surprisingly, the price (6.12%) aspect influence less in comparison to
other factors. 45% male respondents and 52% female respondents influenced by quality which
shows that most of the respondents influenced by quality & advertisement of shampoo brands.
Volume 02, No.03, March 2016
Pa
ge5
7
12. Satisfaction level of consumers:
Satisfaction level of consumers plays key role behind success of any brand whereas consumer‟s
discontent lead to failure of brand. Today consumers are more concerned regarding satisfaction
because they want full value of their money. The following table reveals the satisfaction level:
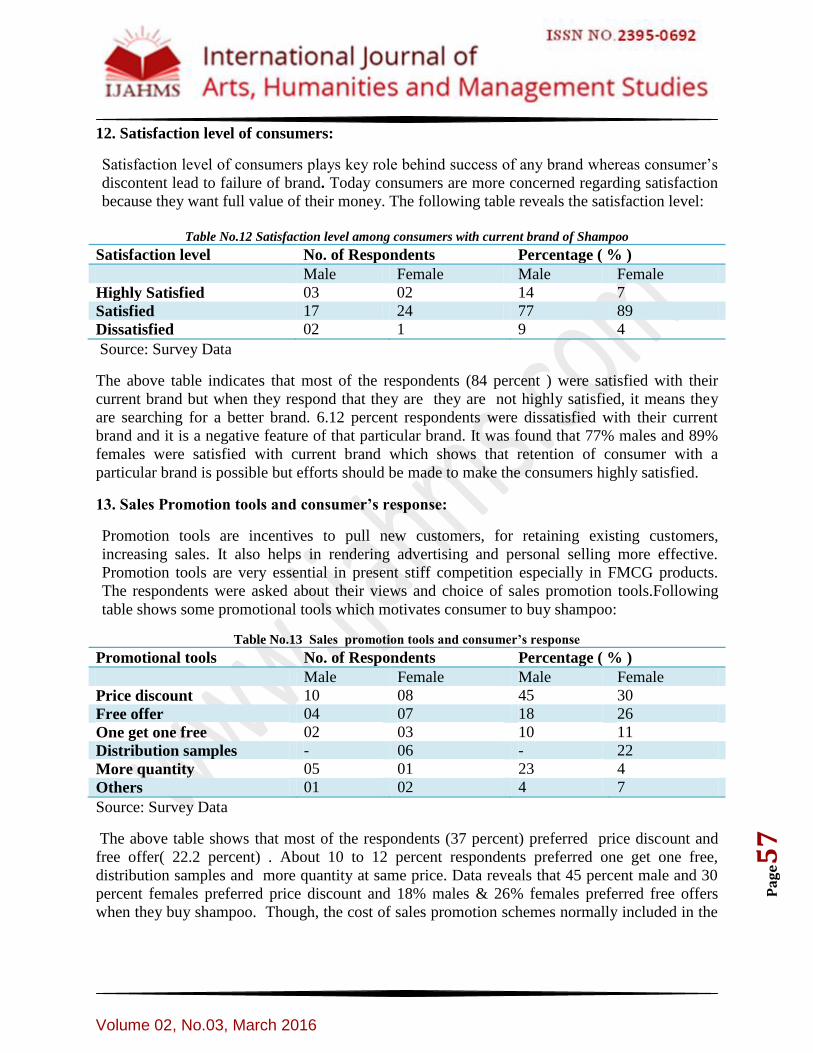
Table No.12 Satisfaction level among consumers with current brand of Shampoo
Satisfaction level No. of Respondents Percentage ( % )
Male Female Male Female
Highly Satisfied 03 02 14 7
Satisfied 17 24 77 89
Dissatisfied 02 1 9 4
Source: Survey Data
The above table indicates that most of the respondents (84 percent ) were satisfied with their
current brand but when they respond that they are they are not highly satisfied, it means they
are searching for a better brand. 6.12 percent respondents were dissatisfied with their current
brand and it is a negative feature of that particular brand. It was found that 77% males and 89%
females were satisfied with current brand which shows that retention of consumer with a
particular brand is possible but efforts should be made to make the consumers highly satisfied.
13. Sales Promotion tools and consumer’s response:
Promotion tools are incentives to pull new customers, for retaining existing customers,
increasing sales. It also helps in rendering advertising and personal selling more effective.
Promotion tools are very essential in present stiff competition especially in FMCG products.
The respondents were asked about their views and choice of sales promotion tools.Following
table shows some promotional tools which motivates consumer to buy shampoo:
Table No.13 Sales promotion tools and consumer’s response
Promotional tools No. of Respondents Percentage ( % )
Male Female Male Female
Price discount 10 08 45 30
Free offer 04 07 18 26
One get one free 02 03 10 11
Distribution samples - 06 - 22
More quantity 05 01 23 4
Others 01 02 4 7
Source: Survey Data
The above table shows that most of the respondents (37 percent) preferred price discount and
free offer( 22.2 percent) . About 10 to 12 percent respondents preferred one get one free,
distribution samples and more quantity at same price. Data reveals that 45 percent male and 30
percent females preferred price discount and 18% males & 26% females preferred free offers
when they buy shampoo. Though, the cost of sales promotion schemes normally included in the
Volume 02, No.03, March 2016
Pa
ge5
8
price of the product itself but it influences the consumers psychologically to buy the shampoo
and therefore, the companies introduces such schemes in a certain time interval.
CONCLUSION:
This study revealed that usage rate of shampoo among males & females has been high, most of
the males (64%) prefer Head & Shoulders brand whereas most of the females (26%) are
preferring Clinic Plus. Though, the other brands of the shampoo are also selling in the city but
the liking rate is lower i.e. 22% for Sunsilk, 15% for Dove, 12% for Pantene. Females
consumers of Sagar city are more scattered towards various brands as compared to the males
consumers. It has been found that majority of female respondents not focused towards a
particular brand. Most of the respondents are not very brand loyal. This indicates the switching,
alluring and swinish behaviour of consumers in the city. It has been seen that T.V advertisement
has played a significant role in purchasing shampoo. Most of the respondents are eager towards
price, quality and sales promotion schemes. This study also depicts some influencing factors
such as price discount, free offers, one get one free, distribution of samples which motivated
consumers towards brands but majority of consumers preferred price discount. It is also found
that majority of respondents are satisfied with current brand but not highly satisfied and they are
looking for more satisfaction. In this stiff competitive era, it is imperative that the manufacturers
should keep constant watch on the consumer behavior for not only retaining existing customers
but also to alluring new customers for the products.
REFERENCES:
i. Akarte Aniruddha , Dr. Arora Amishi, ( 2012),“ A study of Consumer Behaviour With
Respect to Various Brands of Shampoo In Nagpur City” International Journal of Social
Science & Research Vol 4
ii. Gopalswami S. & Sannasi S. (2012),Consumer Preference Towards Various Brands Of
Shampoo In Tirupur Town Journal of Marketing
iii. Jaswal Singh Sultan (2013) Features and Importance of Consumer Awareness
Programme “Jago Grahak Jago” In Indian Society International Journal of Social Science
and Humanities Research Vol. 2, Issue 4
iv. Kazi, Rahman (2013),“ Reasons & Expectations of Customers Towards Shampoo
Brands” International Journal of Research in Commerce & Management Vol 4, Issue 12
v. Majumdar Ramanuj ( 2011),„„ Insights from Indian Market‟ PHI Learning Pvt. Limited.
vi. Malcalm Robert East Malcalm, Wright & Marck Vanhucle (2011), „Applications in
Marketing‟ Sage Publication.
vii. Reddy Praneeth Karnam, Dr. Lokananda, App Rao (2014).“Consumer Behaviour of
Urban Women Towards Shampoos: A Study of Chittor Town” International Journal of
Advance Research in Computer Science & Management Studies, Vol 2 Issue No.2
Volume 02, No.03, March 2016
Pa
ge5
9
viii. Sharma Himani, Mehta Shallu (2012), „Customer attitude towards the use of shampoos:
A case study of Sirsa city‟, International Journal of Research in Finance & Marketing,
Volume No. 2, Issue No. 2
ix. Singh Sandeep, Mishra Sunit ,(2013) „A Consumer‟s Awareness, Attitude, and
Behaviour Towards Major Brands of Shampoo‟ Journal of Management Vol 2, Issue
x. Thapa Anju, (2012), „Consumer switching behaviour: A study of shampoo brands‟,
Abhinav National Monthly Journal of research in Commerce and Management, Volume
No. 1, Issue No. 9.
xi. Vani, G., Ganesh Babu M. and Panchanatham, N. (2010).“Shampoo Brands –A Study of
consumer behavior in Bangalore city”. Journal of Economics and Behavioral Studies,
Vol. 1, No. 1
Recommended