1
WORKING PAPER NO: 315
Public Value Creation through Private Partnership:Lessons from Public Service Delivery in Karnataka, India
BY
Gopal NaikProfessor
Economics & Social ScienceIndian Institute of Management BangaloreBannerghatta Road, Bangalore – 5600 76
K. P. BasavarajResearch Fellow
Indian Institute of Management BangaloreBannerghatta Road, Bangalore – 560076
Mob: [email protected]
Nageena SultanaResearch Associate
&
Prasanna Rashmi K. KResearch Associate
2
Public Value Creation through Private Partnership:
Lessons from Public Service Delivery in Karnataka, IndiaGopal Naik1, K .P. Basavarajappa2, Nageena Sultana3 and Prasanna Rashmi K K4
Introduction
The process of globalization coupled with continuous innovatrions in information and
communication technology (ICT) has led to governments across the world experiencing
increasing challenges to maintain a competitive economy, achieve technology convergence and
effectively deliver public services (Burd and Currie, 2004). Having realized the benefits of the
use of ICT through private sector offerings, citizens are demanding similar improvement in
services provided by the government as well. There is recognition that improvements in
efficiency and effectiveness in public service delivery could release limited public resources that
could achieve Pareto efficient allocation and maximize social welfare (Burd and Currie, 2004).
These pressures coupled with rising fiscal constraints are forcing governments to seek
cooperation from private players to partner in delivering public services. Public-Private
Partnerships (PPPs) is one form of cooperation between the private sector and governments
created to design and deliver public services operating under constraints such as weakness in
enabling policy and regulatory framework or lack of capacity in public institutions (CII, 2007).
Private sector investments, knowledge and experience in the use of technology and customer
interface capabilities are key attributes in countries like India. Thus PPPs have the potential of
creating public value5 that neither of the two parties would be able to achieve alone (Kelly and
Muers, 2003).
Recognizing the need for a systematic process to ensure delivery of intended services, the
first systematic private initiative, viz., Private Finance Initiative (PFI) was introduced in the UK
1 Corresponding Author: Professor, Indian Institute of Management, Bangalore ; [email protected] Research Fellow, Indian Institute of Management, Bangalore3 4Research Associates, Center for Public Policy, Indian Institute of Management, Bangalore
5 Defined as "value created by government through provision of services, the passing of laws and regulations andother actions"
3
in 1992 (House of Commons, 2001). In the last two decades, governments in many countries
have successfully employed this form6 of partnership to provide several public services such as
transport, energy, water, waste management, schools and hospitals, defense establishments and
telecommunications (NCPPP, 2002). For example, Singapore’s e-Citizen portal is a success
story of Government to Citizen (G2C) initiative under e-Governance, where people can access
1300 government services. In India, e-Seva (meaning electronic service), implemented in Andhra
Pradesh provides more than one hundred services, ranging from the payment of utility bills to the
registration of motor vehicles. An impact assessment study indicates that citizens reported
significant improvements in services compared to the manual system of payments and resulted in
reduction of travel costs and waiting times (IIMA, 2007).
India embraced Public Private Partnerships in the early 90’s first with the power sector,
followed by other sectors such as telecom, roads, ports and airports, with wider scope for
expansion consistently foraying into other sectors such as water, sanitation, tourism and
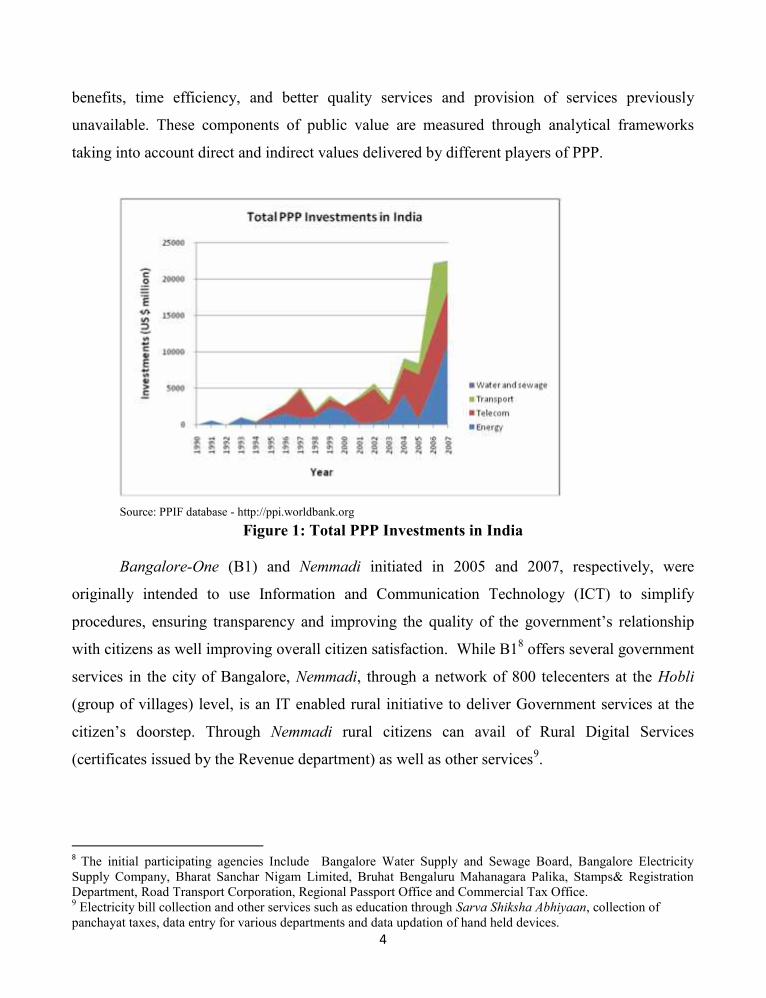
hospitality. Though the initial growth in investments in PPP was low due to the slow pace of
policy reforms, in the recent years India has witnessed significant growth in sectors such as
telecom and transport (Figure 1). At present, the private sector investment in PPP accounts for
1% of the GDP, which is low compared to several other developing countries
(www.pppindia.com). According to the planning commission, if the Indian economy has to reach
a growth rate of 8.5-9%, investments in infrastructure need to be in the range of 7-8% of GDP,
and private investments would have to account for a minimum of 2% (GOI, 2007). Many State
governments in India are therefore, adopting PPP path to facilitate development. Karnataka, one
of the early adopters of the PPP model has more recently chosen this route to provide citizens a
One-Stop-Shop for G2C and Government to Business (G2B) services. Bangalore-one and
Nemmadi7 are two major e-Governance initiatives to cater to the needs of Bangalore and rural
areas of Karnataka, respectively, through which various government services are made available
to citizens.
This paper examines the extent of public value delivery through citizen service centers or
One-Stop-Shops in Karnataka. The main public values listed in past studies include financial
6 Including contract and concession, build-operate and transfer (BOTs) arrangements, public-private joint ventures(United Nations, 2005).7 Meaning ‘hassle free’ in the local language Kannada.
4
benefits, time efficiency, and better quality services and provision of services previously
unavailable. These components of public value are measured through analytical frameworks
taking into account direct and indirect values delivered by different players of PPP.
Source: PPIF database - http://ppi.worldbank.org
Figure 1: Total PPP Investments in India
Bangalore-One (B1) and Nemmadi initiated in 2005 and 2007, respectively, were
originally intended to use Information and Communication Technology (ICT) to simplify
procedures, ensuring transparency and improving the quality of the government’s relationship
with citizens as well improving overall citizen satisfaction. While B18 offers several government
services in the city of Bangalore, Nemmadi, through a network of 800 telecenters at the Hobli
(group of villages) level, is an IT enabled rural initiative to deliver Government services at the
citizen’s doorstep. Through Nemmadi rural citizens can avail of Rural Digital Services
(certificates issued by the Revenue department) as well as other services9.
8 The initial participating agencies Include Bangalore Water Supply and Sewage Board, Bangalore ElectricitySupply Company, Bharat Sanchar Nigam Limited, Bruhat Bengaluru Mahanagara Palika, Stamps& RegistrationDepartment, Road Transport Corporation, Regional Passport Office and Commercial Tax Office.9 Electricity bill collection and other services such as education through Sarva Shiksha Abhiyaan, collection ofpanchayat taxes, data entry for various departments and data updation of hand held devices.
5
Stakeholders and Their Roles
Public-private partnerships are intended to satisfy the interests of all stakeholders. The key
interests of the main stakeholders are:
1. Government - ensure the delivery of government services in effective and efficientmanner;
2. Private partner - growth opportunities through expansion of the domain andprofitability;
3. Citizens - quality delivery of public service.
The State Government
PPP helps Governments to overcome constraints such as weakness in enabling policy or
regulatory framework, lack of capacity in public institutions and focus on those activities
fundamental to the role of government, and enhance public value of services (Kelly and Muers,
2003). Better quality of services and provision of services previously unavailable, time efficiency
and financial benefits are the major components of public value.
In the case of B1 project, the state government ensures the participation of all the relevant
departments in the project, identifies and selects sites, provides working facilities such as desks,
waiting area, parking facilities, provides manpower to manage respective departments, provides
services through electronic service centers, accepts payments and brings in changes in operations
in the respective departments such as discontinuing manual collection of bills. It also coordinates
with central government departments such as the Regional Passport Office and BSNL to ensure
their participation in project. It is responsible for creating an administrative setup to manage B1
centers and ensuring dispute resolution. The state also makes payments to the private players
taking into account performance parameters, rewards and penalties as defined in the agreement.
In turn the state expects to be able to focus on core businesses of state departments, reduce costs
of providing public services, increase revenue collection, release of personnel from routine tasks
such as revenue collection, as well as reduce the need to employ a large manpower.
Unlike in the case of B1, the government does not take the initiative to get various
departments to participate in the Nemmadi project, leaving it to the private partners to sign
separate agreements with individual departments. As of now the revenue department is the only
6
state department to participate in the Nemmadi project. As in the case of B1, the government
specifies the facilities to be provided by the private partners and is responsible for ensuring the
functioning of the services and payments to the private partner based on performance parameters.
Private partners
Private players were identified through an open tender process, based on financial
credibility, technical know-how and previous experience in e-Governance initiatives. The B1
project was bagged by M/s CMS Computers and was initiated in April, 2005. The business
model for B1 is a transaction based service charges payable to the private partner. The private
partner is responsible for designing, developing, testing and installing the software required for
the project, supply of hardware (other than computers), training operators and paying salaries to
personnel, setting up a data center at Bangalore that could eventually be scaled up to other cities,
and ensuring disaster recovery. The private partner also has to design and print stationery,
including receipts, forms, certificates, on paper or other means as required by different
applications, depending on the departments participating in the project. Private players get a slab
based share in the transaction fee. The project started with 14 centers and by June 2009 it had 53
centers (23 main and 30 mini centers) with an average visit of 25,000 and revenue collection of
Rs.15 million a day.
Nemmadi project was bagged by a consortium of IT firms - M/s COMAT Technologies,
3i Infotech and n-Longue technologies. The consortium entered into a Master Service Agreement
(MSA) with the Government of Karnataka (GoK) in April 2007 which granted rights to the
consortium to undertake and implement the project through 800 telecenters at Hobli (sub-tehsil)
level and RDS Back Offices at taluka level. Developing, financing, designing, building, rolling
out, commissioning, and operation and maintenance of the project are the responsibility of the
private player. The project operated on the Build-Own-Operate-Transfer (BOOT) model,
wherein the private player had to transfer and hand over all the Transferred Assets to GoK in five
years. The consortium has so far implemented 763 telecenters and 80 RDS Back Offices. The
private players expect to earn profit from the PPP through revenues generated for services
rendered. A fixed transaction charge is levied for each service and the private partner is paid a
part of the transaction charges.
7
Organization
Citizens
B-O
ne a
ndNem
mad
i
Govt. agencies
Private partner
Society
Partners Investments Beneficiary Outcomes
G2C & B2C qualityservices at door step
Reduced investmentsand manpower, focus
on core functions,increased revenues
Profit, NewBusiness
opportunities
Overalldevelopment
Government
PrivatePartner
Land and Others
Connectivity
Software
IT Investment
Personnel
CitizensB1 and Nemmadi are expected to deliver services to the citizen anytime, anywhere with
speed and certainty. Expectations from the PPP model include better delivery of government
services, in terms of time and location, on demand delivery of services, efficiency and accuracy
of transactions as well as reduction in transaction costs.
Partnership Framework
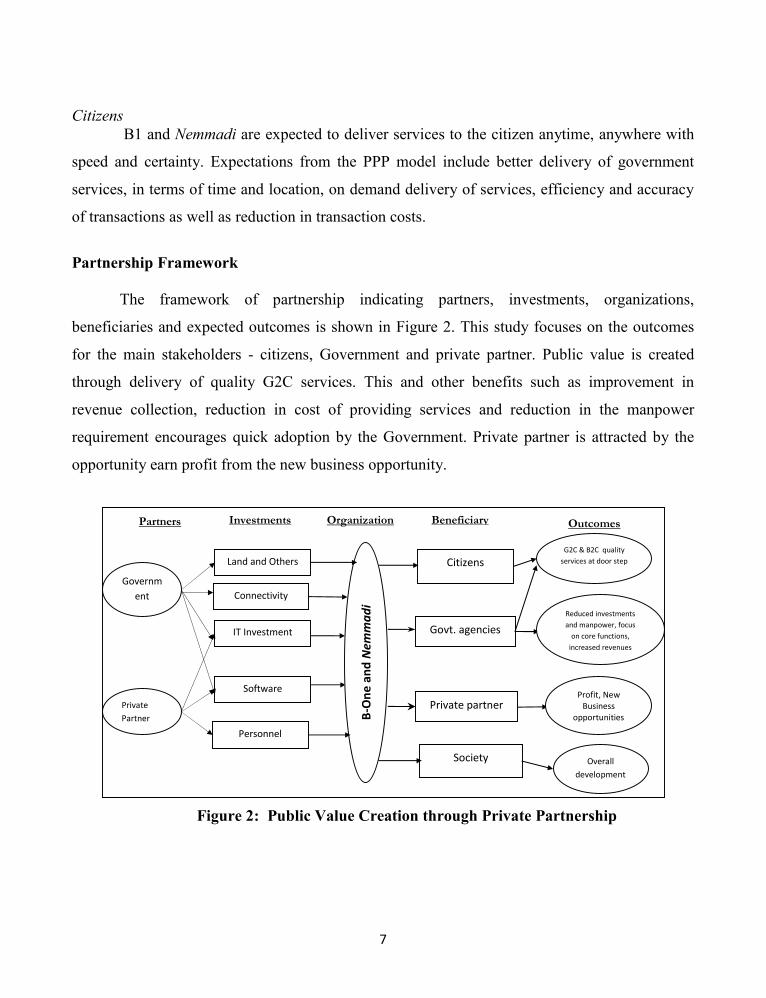
The framework of partnership indicating partners, investments, organizations,
beneficiaries and expected outcomes is shown in Figure 2. This study focuses on the outcomes
for the main stakeholders - citizens, Government and private partner. Public value is created
through delivery of quality G2C services. This and other benefits such as improvement in
revenue collection, reduction in cost of providing services and reduction in the manpower
requirement encourages quick adoption by the Government. Private partner is attracted by the
opportunity earn profit from the new business opportunity.
Figure 2: Public Value Creation through Private Partnership
8
Structure and Working: Bangalore one and Nemmadi
Bangalore OneB1 service centers are the point of contact for the citizens accessing a bouquet of G2C
and B2C services. It is required that all centers have identical looks, with 3 counters for mini and
16 counters for main centers. Location of the centers is based on population in the area,
availability of building and accessibility. While the private players are responsible for the
functioning of all facilities and services at the centers, the government ensures the participation
of the state departments besides providing the space with furniture and fixtures. Initially, the
centers were set up in government-owned premises, and as the number of centers increased,
buildings were rented in. The requests for G2C received at the service centers are processed at
either B1 itself or the respective departments (e.g., passports) and certificates are issued to the
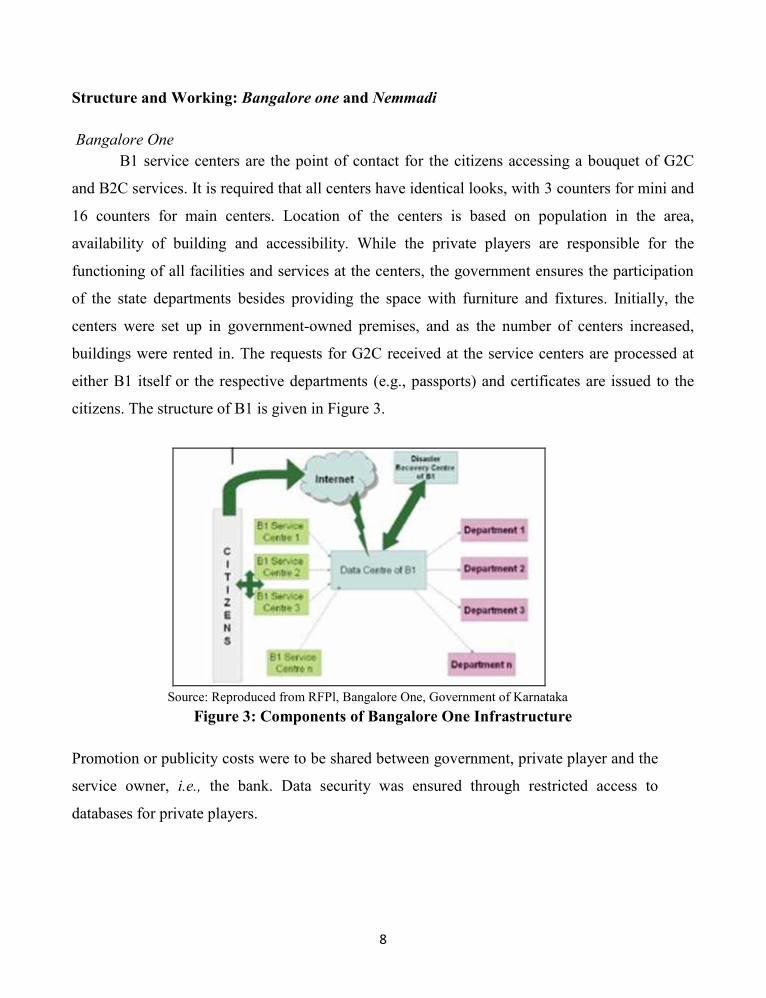
citizens. The structure of B1 is given in Figure 3.
Source: Reproduced from RFPl, Bangalore One, Government of KarnatakaFigure 3: Components of Bangalore One Infrastructure
Promotion or publicity costs were to be shared between government, private player and the
service owner, i.e., the bank. Data security was ensured through restricted access to
databases for private players.
9
Nemmadi
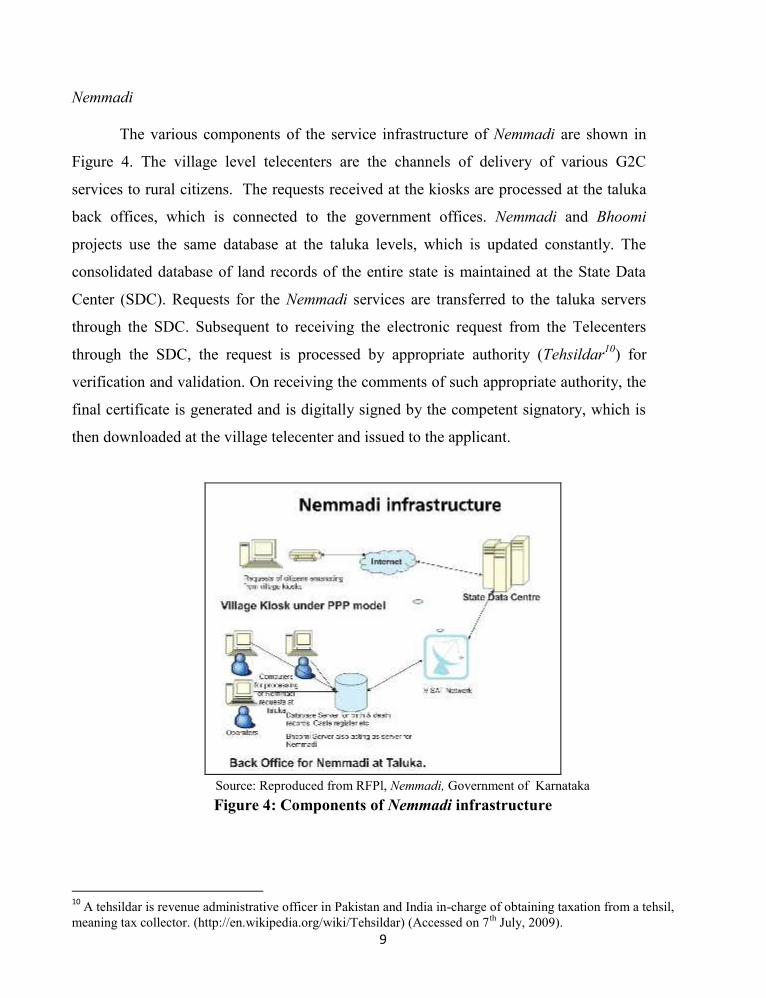
The various components of the service infrastructure of Nemmadi are shown in
Figure 4. The village level telecenters are the channels of delivery of various G2C
services to rural citizens. The requests received at the kiosks are processed at the taluka
back offices, which is connected to the government offices. Nemmadi and Bhoomi
projects use the same database at the taluka levels, which is updated constantly. The
consolidated database of land records of the entire state is maintained at the State Data
Center (SDC). Requests for the Nemmadi services are transferred to the taluka servers
through the SDC. Subsequent to receiving the electronic request from the Telecenters
through the SDC, the request is processed by appropriate authority (Tehsildar10) for
verification and validation. On receiving the comments of such appropriate authority, the
final certificate is generated and is digitally signed by the competent signatory, which is
then downloaded at the village telecenter and issued to the applicant.
Source: Reproduced from RFPl, Nemmadi, Government of KarnatakaFigure 4: Components of Nemmadi infrastructure
10 A tehsildar is revenue administrative officer in Pakistan and India in-charge of obtaining taxation from a tehsil,meaning tax collector. (http://en.wikipedia.org/wiki/Tehsildar) (Accessed on 7th July, 2009).
10
The private player was to provide a single-window system for all government services at
the village level, eliminating the need for the manual system of processing at state departments.
The services are provided to citizens at a uniform service charge of Rs. 15 for every transaction.
At present, only the Revenue Department has partnered with Nemmadi, which offers Rural
Digital Services (RDS) to citizens at the village level.
Conceptual Framework, Methodology and Data Collection
Bangalore-One and Nemmadi being innovations in public service delivery, we examined
the rate of its adoption on the basis of the Diffusion of Innovation theory framework developed
by Rogers (2003). The theory suggests that the rate of adoption of an innovation depends on the
following attributes:
i. Relative advantage - degree to which an innovation is subjectively perceived as better;ii. Compatibility - degree to which an innovation is perceived as being consistent with the
existing values, past experiences, and needs of potential adopters;iii. Simplicity and ease of use - degree to which an innovation is perceived as easy to
understand and use;iv. Trialability - degree to which an innovation may be experimented with, with lesser
uncertainty ;v. Observable results - easily observable results of an innovation enhance adoption.
We use the extent of use as a measure of overall acceptability of the initiatives and extent
of public value creation. We then draw on user perspectives to examine whether citizens see the
positive relative advantage or not. This also captures ‘ease of use’ and observable results. For
this we used parameters such as time efficiency, convenience and reliability of the availed
services. The trialability attribute is high in the case of these PPPs as they are used frequently by
citizens, with low risk. Compatibility is assessed in terms of the quality of the service and the
extent to which it is similar or better compared to the one it supersedes.
Data Collection and Analysis
Data for this study have been collected through survey of citizens and discussions with
government and private players. Citizen survey regarding awareness and opinions about
Bangalore-One (B1) was conducted during June- July, 2008. A total of 200 citizens spread over
four zones in Bangalore city were contacted as they were leaving the centers after availing a
11
service, out of which 160 responses were complete. For the study on Nemmadi, 300 service users
from 4 villages each in two districts of Karnataka viz., Ramanagara and Chamarajanagara were
interviewed. Selection of villages was based on the distance of the village from the centers and
on the number of transactions at the centers. A pre-tested questionnaire was administered to the
respondents chosen while they were exiting the centers11. The questionnaire included questions
on their profile, purposes of visiting the centers, opinion on quality of service delivery (pre and
post project) and factors that influenced them into using the services and levels of satisfaction in
using the services. Suggestions were also sought for improving delivery of service. Time taken
for availing various services were also documented from computer generated reports at the
centers.
Data sought from the private player include a description of the services offered at their
centers, details of investments, and costs in providing the services and benefits expected and
realized. The BESCOM (Bangalore Electricity Supply Company) has been selected to examine
the impact of PPP on the government as it accounted for a large percentage of B1 transactions.
Though the core business of BESCOM is power distribution, prior to setting up B1, a lot of
attention was paid on revenue collection. The value created for the government has been
estimated through the reduction in costs of providing services, increase in revenue collection and
ability to allocate personnel for activities other than routine bill collection. Details regarding
number of installations, meter readers and cash counters were obtained from the JP Nagar
division of BESCOM. The cost of operating a cash counter was used to assess costs and benefits
accrued to the government from the partnership.
Impact on the Stakeholders
The impact of these initiatives on main stakeholders, viz, citizen, private partner and
Government in terms of creating public value has been assessed and reported here.
11 Every 10th consumer leaving the B1 centers was selected for the survey.
12
Impact on the Citizen
Profile of the respondents of B1 centers
Citizens using services of Bangalore-One had an average of 13 years of education. Most
of those who used the B1 centers were male, mainly due to the fact that paying of utility bills and
visiting government offices for paperwork were tasks conventionally performed by men. A
majority of the users worked in private enterprises or were owners of businesses and most used
either two-wheelers or public transport to reach the centers, which were at an average distance of
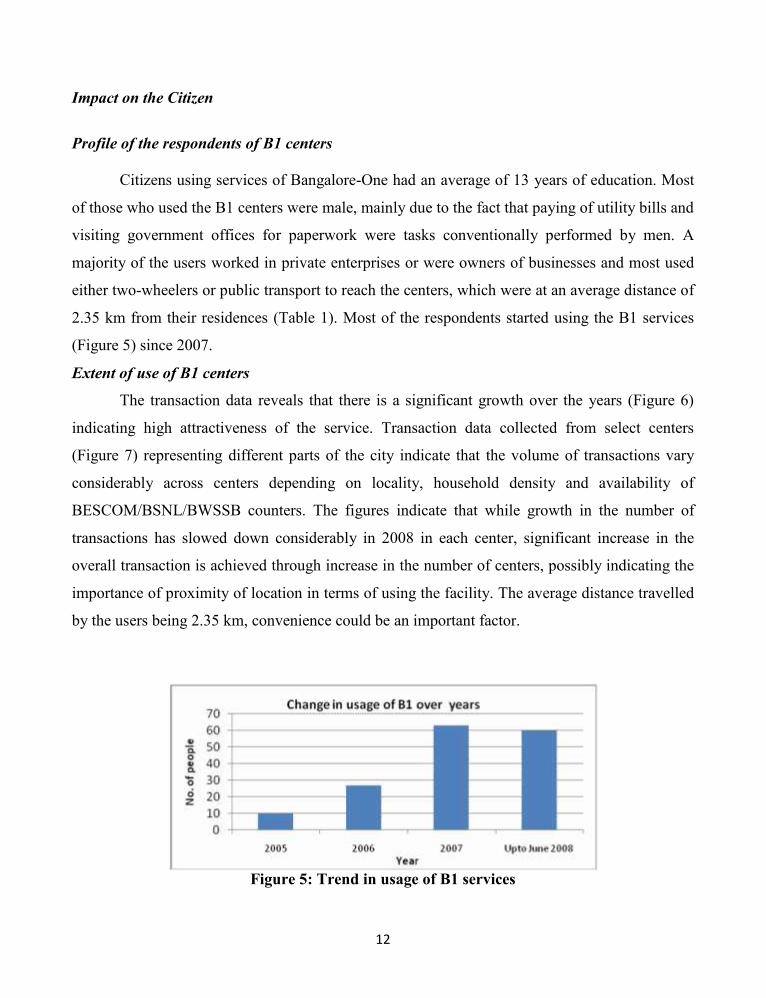
2.35 km from their residences (Table 1). Most of the respondents started using the B1 services
(Figure 5) since 2007.
Extent of use of B1 centers
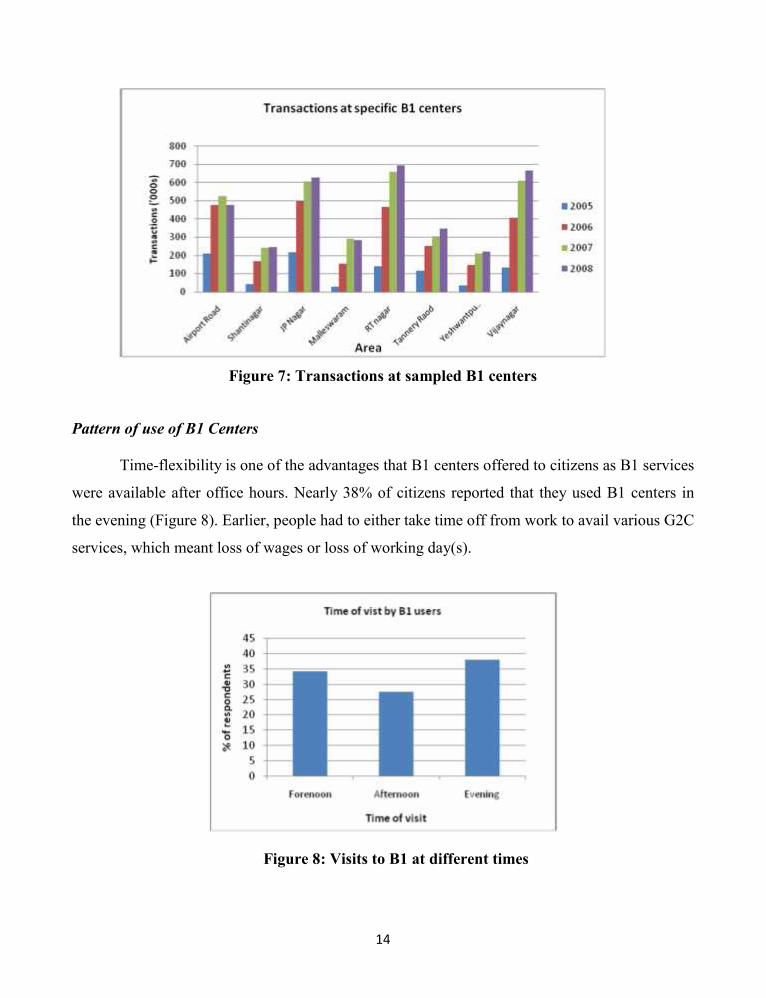
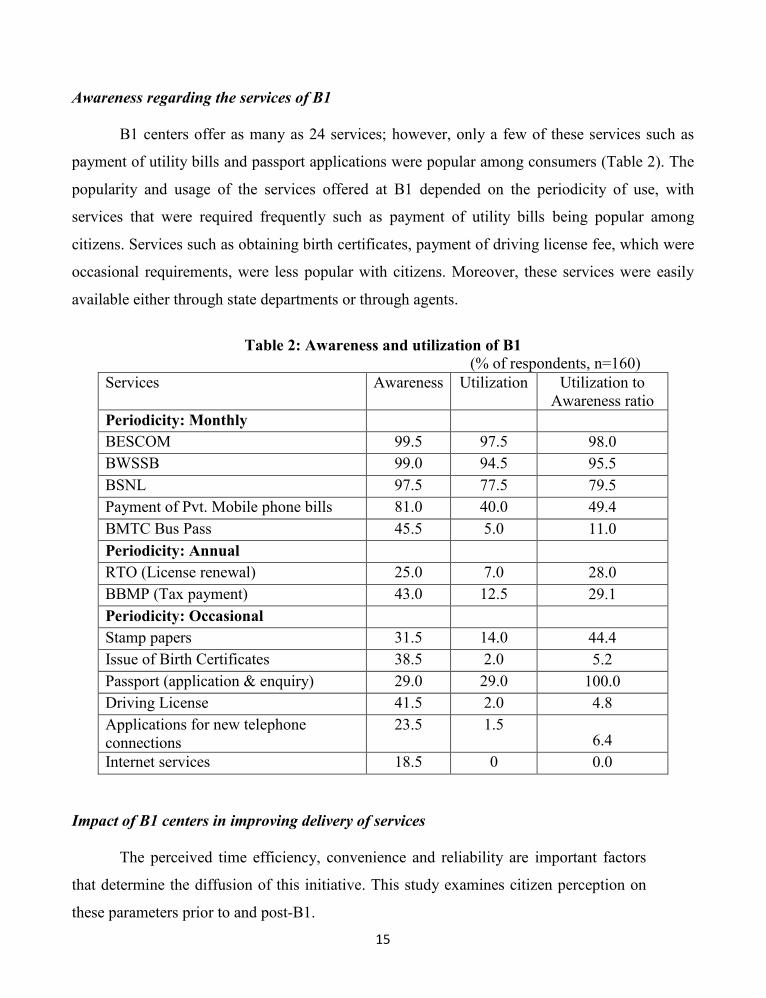
The transaction data reveals that there is a significant growth over the years (Figure 6)
indicating high attractiveness of the service. Transaction data collected from select centers
(Figure 7) representing different parts of the city indicate that the volume of transactions vary
considerably across centers depending on locality, household density and availability of
BESCOM/BSNL/BWSSB counters. The figures indicate that while growth in the number of
transactions has slowed down considerably in 2008 in each center, significant increase in the
overall transaction is achieved through increase in the number of centers, possibly indicating the
importance of proximity of location in terms of using the facility. The average distance travelled
by the users being 2.35 km, convenience could be an important factor.
Figure 5: Trend in usage of B1 services
13
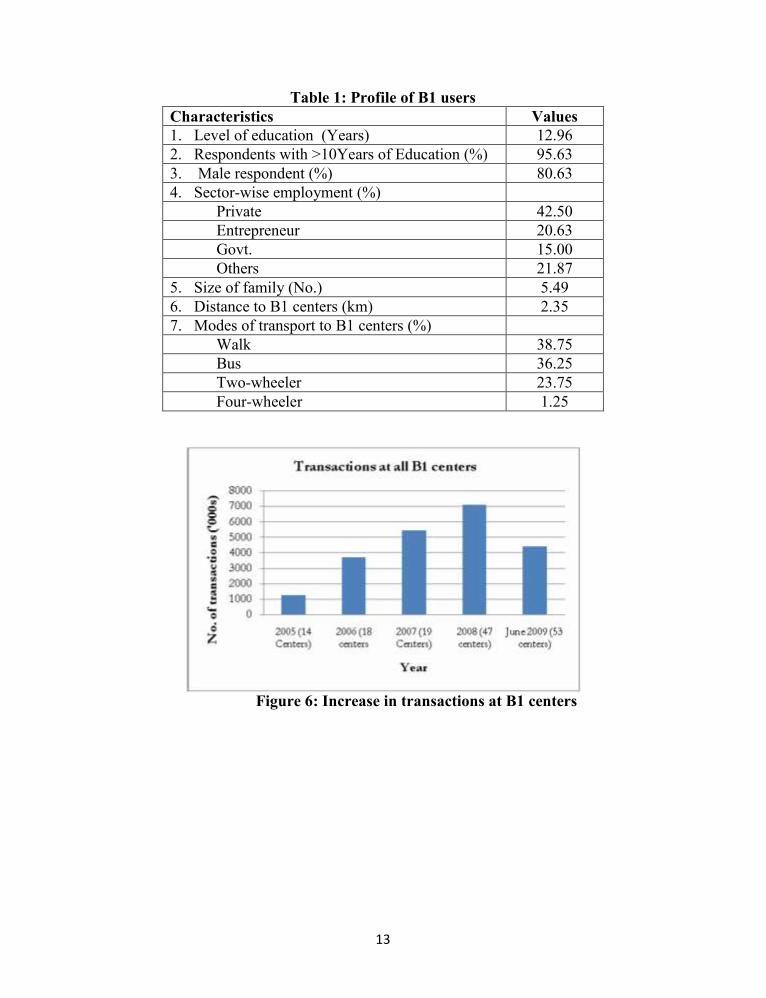
Table 1: Profile of B1 usersCharacteristics Values1. Level of education (Years) 12.962. Respondents with >10Years of Education (%) 95.633. Male respondent (%) 80.634. Sector-wise employment (%)
Private 42.50Entrepreneur 20.63Govt. 15.00Others 21.87
5. Size of family (No.) 5.496. Distance to B1 centers (km) 2.357. Modes of transport to B1 centers (%)
Walk 38.75Bus 36.25Two-wheeler 23.75Four-wheeler 1.25
Figure 6: Increase in transactions at B1 centers
14
Figure 7: Transactions at sampled B1 centers
Pattern of use of B1 Centers
Time-flexibility is one of the advantages that B1 centers offered to citizens as B1 services
were available after office hours. Nearly 38% of citizens reported that they used B1 centers in
the evening (Figure 8). Earlier, people had to either take time off from work to avail various G2C
services, which meant loss of wages or loss of working day(s).
Figure 8: Visits to B1 at different times
15
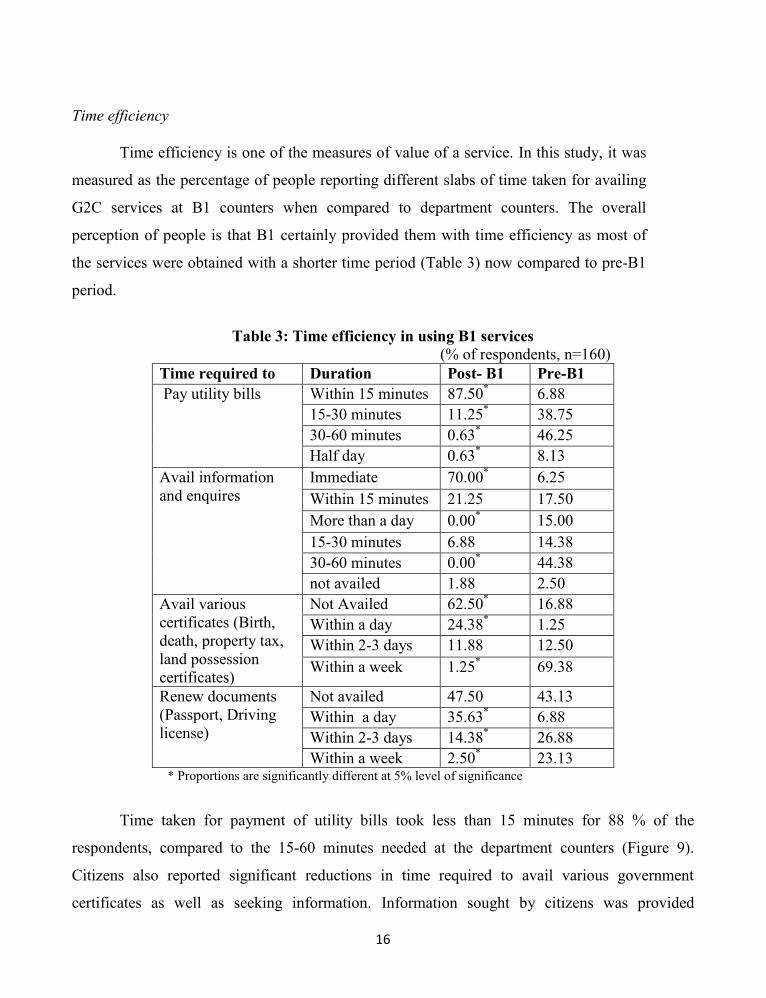
Awareness regarding the services of B1
B1 centers offer as many as 24 services; however, only a few of these services such as
payment of utility bills and passport applications were popular among consumers (Table 2). The
popularity and usage of the services offered at B1 depended on the periodicity of use, with
services that were required frequently such as payment of utility bills being popular among
citizens. Services such as obtaining birth certificates, payment of driving license fee, which were
occasional requirements, were less popular with citizens. Moreover, these services were easily
available either through state departments or through agents.
Table 2: Awareness and utilization of B1(% of respondents, n=160)
Services Awareness Utilization Utilization toAwareness ratio
Periodicity: MonthlyBESCOM 99.5 97.5 98.0BWSSB 99.0 94.5 95.5BSNL 97.5 77.5 79.5Payment of Pvt. Mobile phone bills 81.0 40.0 49.4BMTC Bus Pass 45.5 5.0 11.0Periodicity: AnnualRTO (License renewal) 25.0 7.0 28.0BBMP (Tax payment) 43.0 12.5 29.1Periodicity: OccasionalStamp papers 31.5 14.0 44.4Issue of Birth Certificates 38.5 2.0 5.2Passport (application & enquiry) 29.0 29.0 100.0Driving License 41.5 2.0 4.8Applications for new telephoneconnections
23.5 1.56.4
Internet services 18.5 0 0.0
Impact of B1 centers in improving delivery of services
The perceived time efficiency, convenience and reliability are important factors
that determine the diffusion of this initiative. This study examines citizen perception on
these parameters prior to and post-B1.
16
Time efficiency
Time efficiency is one of the measures of value of a service. In this study, it was
measured as the percentage of people reporting different slabs of time taken for availing
G2C services at B1 counters when compared to department counters. The overall
perception of people is that B1 certainly provided them with time efficiency as most of
the services were obtained with a shorter time period (Table 3) now compared to pre-B1
period.
Table 3: Time efficiency in using B1 services(% of respondents, n=160)
Time required to Duration Post- B1 Pre-B1Pay utility bills Within 15 minutes 87.50* 6.88
15-30 minutes 11.25* 38.7530-60 minutes 0.63* 46.25Half day 0.63* 8.13
Avail informationand enquires
Immediate 70.00* 6.25Within 15 minutes 21.25 17.50More than a day 0.00* 15.0015-30 minutes 6.88 14.3830-60 minutes 0.00* 44.38not availed 1.88 2.50
Avail variouscertificates (Birth,death, property tax,land possessioncertificates)
Not Availed 62.50* 16.88Within a day 24.38* 1.25Within 2-3 days 11.88 12.50Within a week 1.25* 69.38
Renew documents(Passport, Drivinglicense)
Not availed 47.50 43.13Within a day 35.63* 6.88Within 2-3 days 14.38* 26.88Within a week 2.50* 23.13
* Proportions are significantly different at 5% level of significance
Time taken for payment of utility bills took less than 15 minutes for 88 % of the
respondents, compared to the 15-60 minutes needed at the department counters (Figure 9).
Citizens also reported significant reductions in time required to avail various government
certificates as well as seeking information. Information sought by citizens was provided
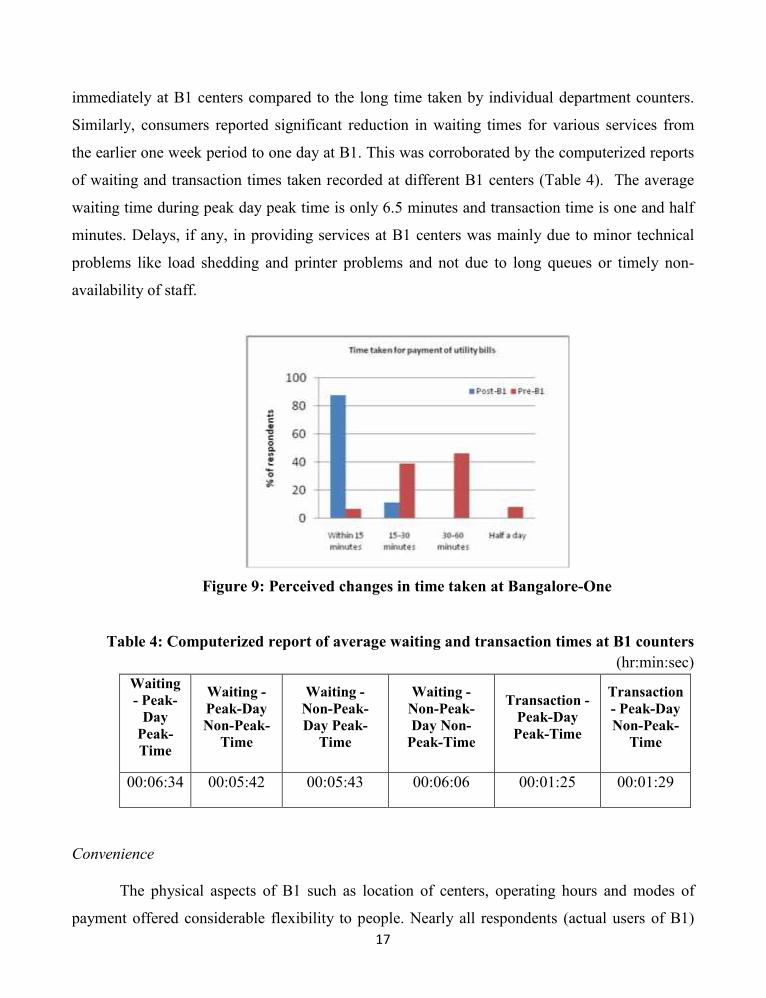
17
immediately at B1 centers compared to the long time taken by individual department counters.
Similarly, consumers reported significant reduction in waiting times for various services from
the earlier one week period to one day at B1. This was corroborated by the computerized reports
of waiting and transaction times taken recorded at different B1 centers (Table 4). The average
waiting time during peak day peak time is only 6.5 minutes and transaction time is one and half
minutes. Delays, if any, in providing services at B1 centers was mainly due to minor technical
problems like load shedding and printer problems and not due to long queues or timely non-
availability of staff.
Figure 9: Perceived changes in time taken at Bangalore-One
Table 4: Computerized report of average waiting and transaction times at B1 counters(hr:min:sec)
Waiting- Peak-
DayPeak-Time
Waiting -Peak-DayNon-Peak-
Time
Waiting -Non-Peak-Day Peak-
Time
Waiting -Non-Peak-Day Non-
Peak-Time
Transaction -Peak-DayPeak-Time
Transaction- Peak-DayNon-Peak-
Time
00:06:34 00:05:42 00:05:43 00:06:06 00:01:25 00:01:29
Convenience
The physical aspects of B1 such as location of centers, operating hours and modes of
payment offered considerable flexibility to people. Nearly all respondents (actual users of B1)

18
indicated that the location of the B1 centers were convenient to them (Table 5). Costs of visits to
avail the services had reduced for most people, with 35 % of them incurring no costs at all, and
55 % of them having to spend less than Rs. 25 a month to avail services (Figure 11). The
location of B1 centers also reduced consumers’ dependence on vehicles, with 39 % of them
reporting that the centers were at walkable distances. B1 centers also offered flexibility in terms
of operating hours, with all respondents finding that the centers offered non-stop services. This
enabled people to make payments, enquiries even after working hours, a facility that was not
available prior to B1. Through quick delivery system process (Figure 12) for all G2C services,
B1 centers have created a considerable convenience to the citizens of Bangalore.
Table 5: Convenience and Cost-effectiveness of B1 centers(% of respondents, n=160)
Characteristics Category Post – B1 Pre-B1Location of thecentre
Convenient 98.75* 30.63Not convenient 1.25* 69.38
Cost to visitcenter/avail services(Rs.)
No cost 35.00* 15.6310-25 55.00 51.8825-50 8.75* 31.88Above 100 1.25 0.63
Operating Hours 24X7 (Maincenters)
100* 0
Limited hours 0* 100
Mode of Transport WalkBMTCTwo wheelerFour wheeler
38.75*36.2523.751.25
16.2547.5034.381.88
Service Delivery Very Fast 64.38* 0.63process Fast 33.13* 16.25
Moderate 2.50* 32.50Slow 0.00* 21.88Very Slow 0.00* 28.75
* indicates proportions are significantly different at 5% level of significance

19
Figure 11: Cost Savings to citizens due to Bangalore-One
Figure 12: Perception of citizens about speed of service delivery at Bangalore-One
Reliability
Reliability is one of the critical service quality factors, wherein the service related
problems are solved to user’s satisfaction, error-free records and safety in transaction is
maintained. B1 centers has been able to ensure reliability of service as can be gauged by the level
of accuracy in documents, solving problems to customer satisfaction and quick delivery process.
B1 centers also helped consumers through easy availability of information about various
governments departments under one roof (Table 6). Earlier, citizens had to visit several
government offices, all of which were located at different places, even to seek information about
20
different government services. Reduction in corruption was found to be another important
consequence of this PPP initiative. Table 7 indicates that 97.5 percent did not have to pay any
extra charges for availing the services.
Table 7: Reliability in service delivery in the post-B1 scenario(% of respondents, n=160)
Service factor Category Post –B1
Pre-B1
Availability ofInformation
Easily available 88.75* 16.25Not So Easilyavailable
9.38* 52.50
Difficult to get 1.88* 31.25Service problem notsolved to CustomersSatisfaction
No 93.75* 76.25Yes 6.25* 23.75
Errors in thedocuments
No 71.88* 30.63Some times 28.13* 65.63Always* 0.00* 3.75
Hidden Cost( Cost paidother than Govt. fee)
No 97.50* 85.00Yes 2.50* 15.00
* indicates proportions are significantly different at 5% level of significance
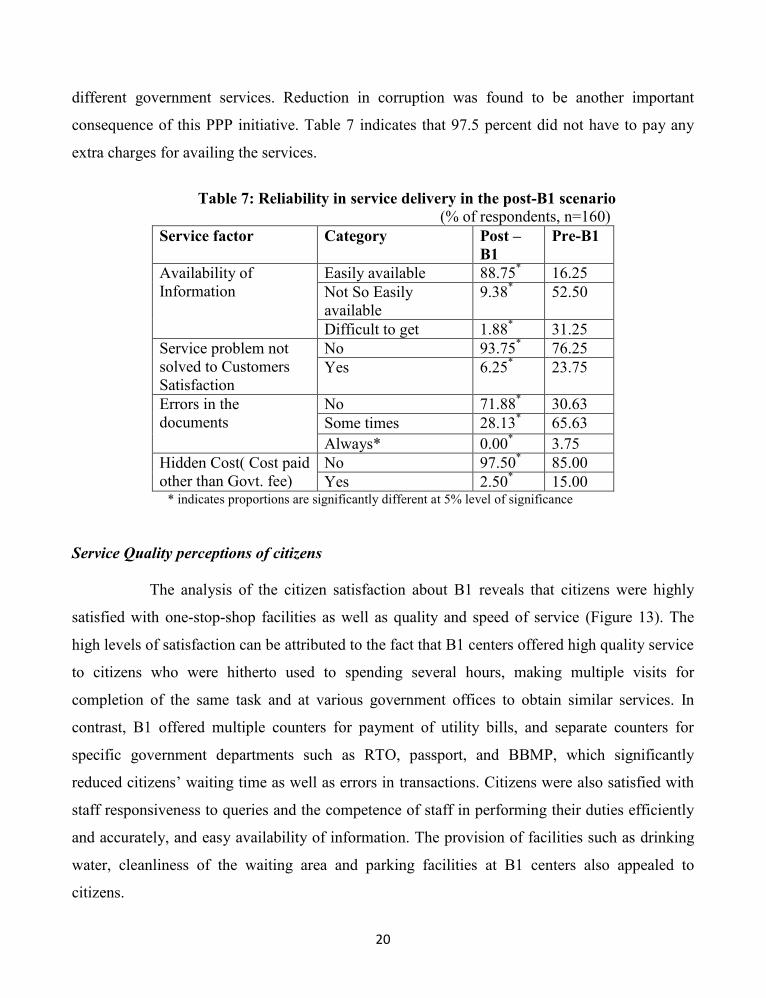
Service Quality perceptions of citizens
The analysis of the citizen satisfaction about B1 reveals that citizens were highly
satisfied with one-stop-shop facilities as well as quality and speed of service (Figure 13). The
high levels of satisfaction can be attributed to the fact that B1 centers offered high quality service
to citizens who were hitherto used to spending several hours, making multiple visits for
completion of the same task and at various government offices to obtain similar services. In
contrast, B1 offered multiple counters for payment of utility bills, and separate counters for
specific government departments such as RTO, passport, and BBMP, which significantly
reduced citizens’ waiting time as well as errors in transactions. Citizens were also satisfied with
staff responsiveness to queries and the competence of staff in performing their duties efficiently
and accurately, and easy availability of information. The provision of facilities such as drinking
water, cleanliness of the waiting area and parking facilities at B1 centers also appealed to
citizens.
21
Figure 13: Citizen satisfaction regarding Bangalore One
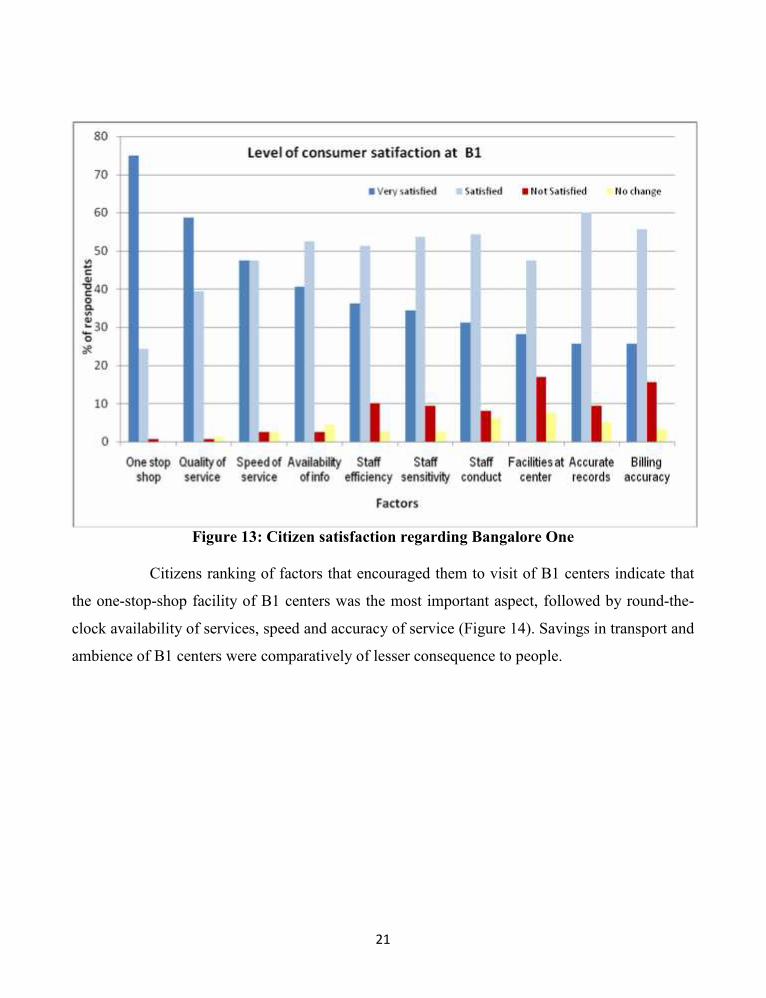
Citizens ranking of factors that encouraged them to visit of B1 centers indicate that
the one-stop-shop facility of B1 centers was the most important aspect, followed by round-the-
clock availability of services, speed and accuracy of service (Figure 14). Savings in transport and
ambience of B1 centers were comparatively of lesser consequence to people.
22
Figure 14: Importance of factors influencing use of B1 centers
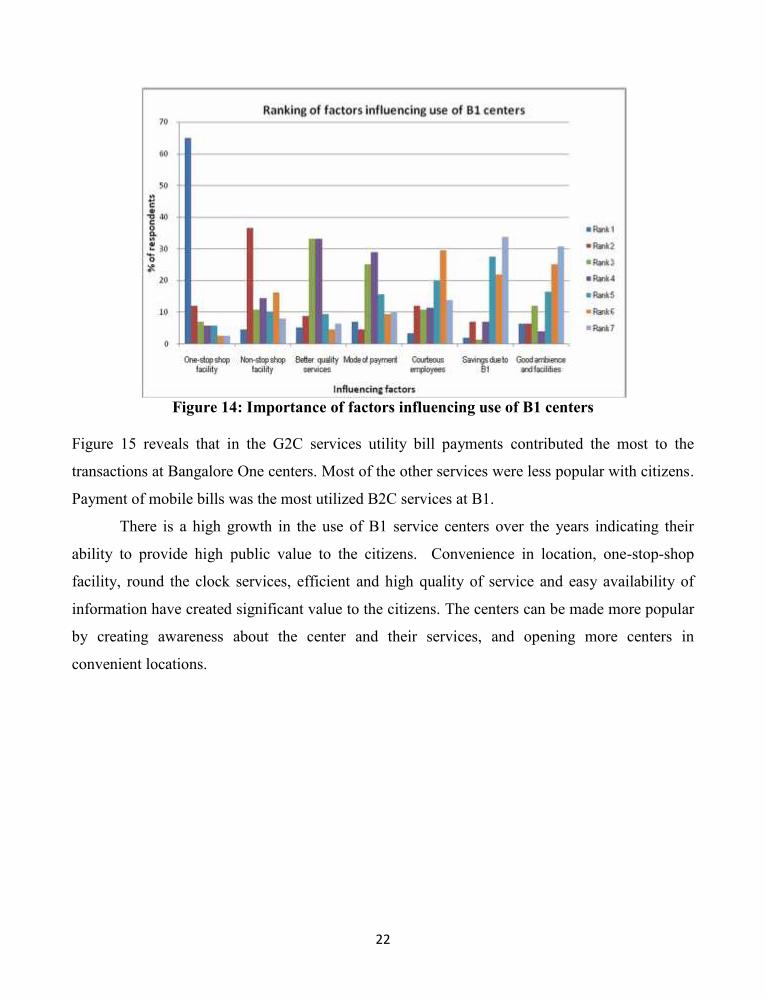
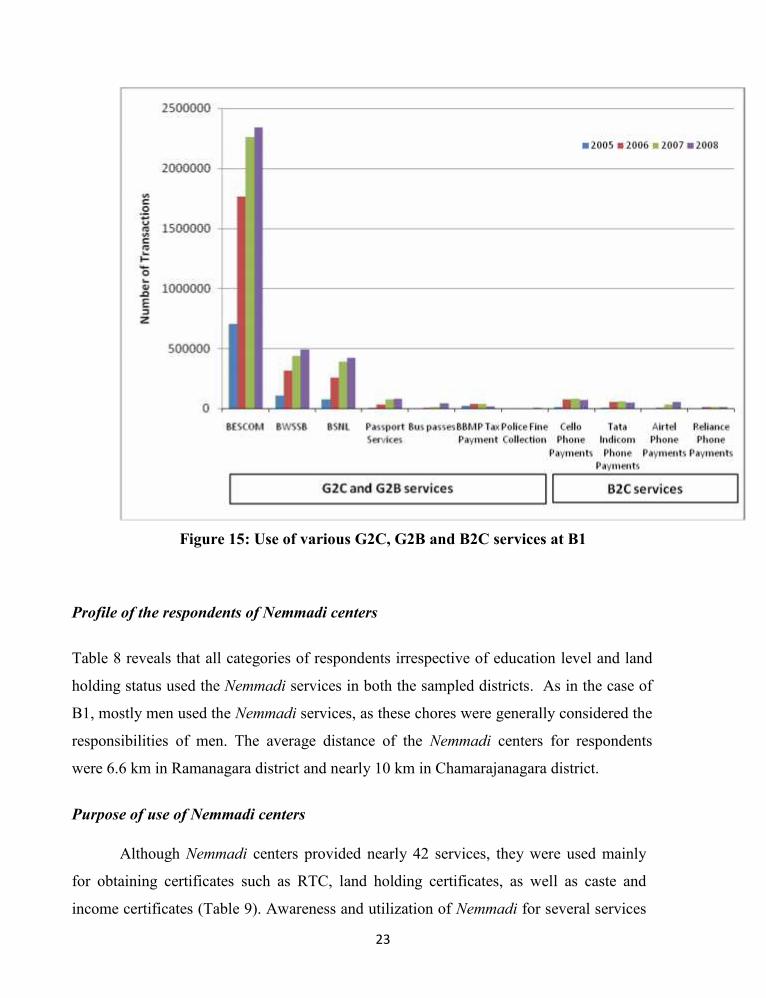
Figure 15 reveals that in the G2C services utility bill payments contributed the most to the
transactions at Bangalore One centers. Most of the other services were less popular with citizens.
Payment of mobile bills was the most utilized B2C services at B1.
There is a high growth in the use of B1 service centers over the years indicating their
ability to provide high public value to the citizens. Convenience in location, one-stop-shop
facility, round the clock services, efficient and high quality of service and easy availability of
information have created significant value to the citizens. The centers can be made more popular
by creating awareness about the center and their services, and opening more centers in
convenient locations.
23
Figure 15: Use of various G2C, G2B and B2C services at B1
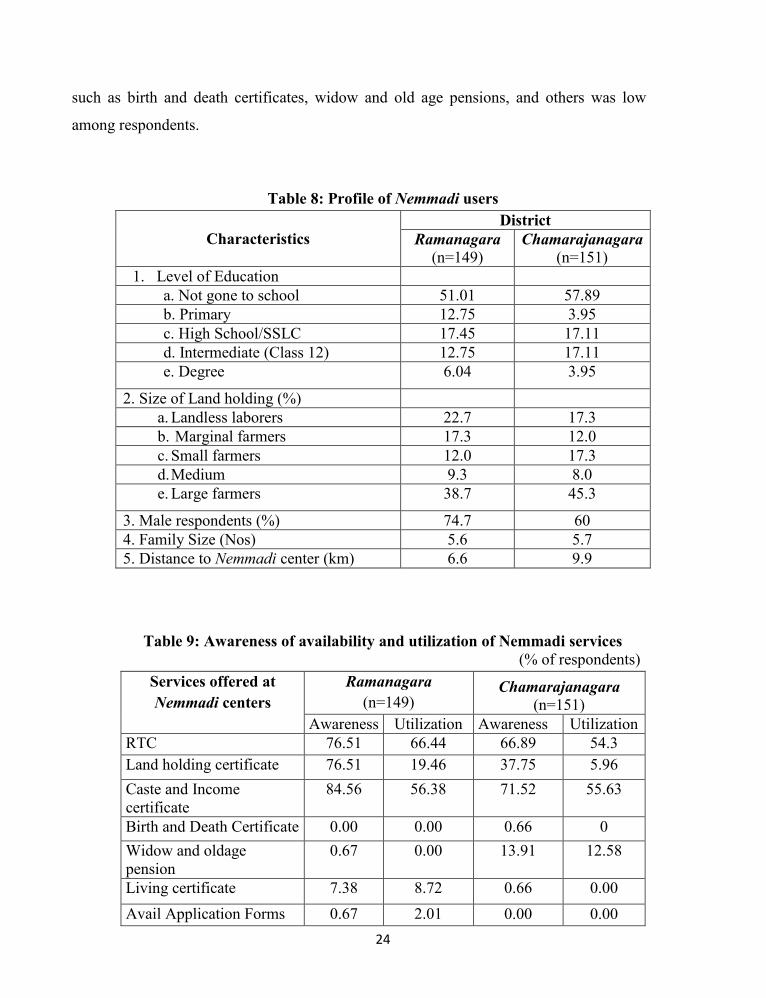
Profile of the respondents of Nemmadi centers
Table 8 reveals that all categories of respondents irrespective of education level and land
holding status used the Nemmadi services in both the sampled districts. As in the case of
B1, mostly men used the Nemmadi services, as these chores were generally considered the
responsibilities of men. The average distance of the Nemmadi centers for respondents
were 6.6 km in Ramanagara district and nearly 10 km in Chamarajanagara district.
Purpose of use of Nemmadi centers
Although Nemmadi centers provided nearly 42 services, they were used mainly
for obtaining certificates such as RTC, land holding certificates, as well as caste and
income certificates (Table 9). Awareness and utilization of Nemmadi for several services
24
such as birth and death certificates, widow and old age pensions, and others was low
among respondents.
Table 8: Profile of Nemmadi users
CharacteristicsDistrict
Ramanagara(n=149)
Chamarajanagara(n=151)
1. Level of Educationa. Not gone to school 51.01 57.89b. Primary 12.75 3.95c. High School/SSLC 17.45 17.11d. Intermediate (Class 12) 12.75 17.11e. Degree 6.04 3.95
2. Size of Land holding (%)a. Landless laborers 22.7 17.3b. Marginal farmers 17.3 12.0c. Small farmers 12.0 17.3d.Medium 9.3 8.0e. Large farmers 38.7 45.3
3. Male respondents (%) 74.7 604. Family Size (Nos) 5.6 5.75. Distance to Nemmadi center (km) 6.6 9.9
Table 9: Awareness of availability and utilization of Nemmadi services(% of respondents)
Services offered atNemmadi centers
Ramanagara(n=149)
Chamarajanagara(n=151)
Awareness Utilization Awareness UtilizationRTC 76.51 66.44 66.89 54.3Land holding certificate 76.51 19.46 37.75 5.96Caste and Incomecertificate
84.56 56.38 71.52 55.63
Birth and Death Certificate 0.00 0.00 0.66 0Widow and oldagepension
0.67 0.00 13.91 12.58
Living certificate 7.38 8.72 0.66 0.00Avail Application Forms 0.67 2.01 0.00 0.00
25
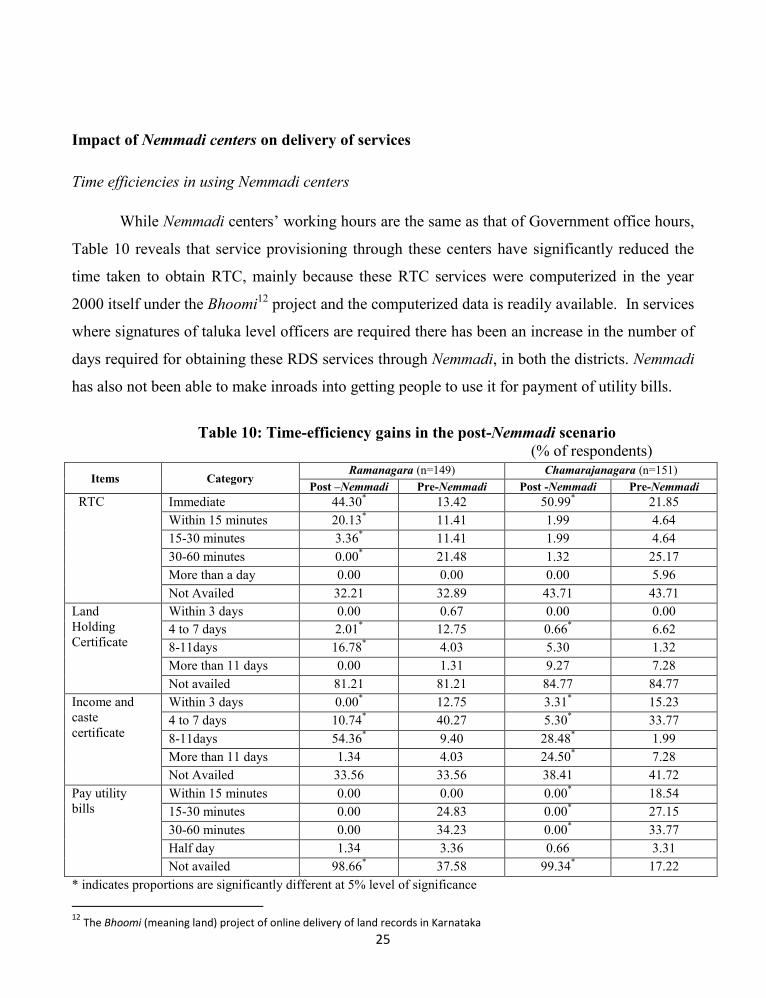
Impact of Nemmadi centers on delivery of services
Time efficiencies in using Nemmadi centers
While Nemmadi centers’ working hours are the same as that of Government office hours,
Table 10 reveals that service provisioning through these centers have significantly reduced the
time taken to obtain RTC, mainly because these RTC services were computerized in the year
2000 itself under the Bhoomi12 project and the computerized data is readily available. In services
where signatures of taluka level officers are required there has been an increase in the number of
days required for obtaining these RDS services through Nemmadi, in both the districts. Nemmadi
has also not been able to make inroads into getting people to use it for payment of utility bills.
Table 10: Time-efficiency gains in the post-Nemmadi scenario(% of respondents)
Items CategoryRamanagara (n=149) Chamarajanagara (n=151)
Post –Nemmadi Pre-Nemmadi Post -Nemmadi Pre-NemmadiRTC Immediate 44.30* 13.42 50.99* 21.85
Within 15 minutes 20.13* 11.41 1.99 4.6415-30 minutes 3.36* 11.41 1.99 4.6430-60 minutes 0.00* 21.48 1.32 25.17More than a day 0.00 0.00 0.00 5.96Not Availed 32.21 32.89 43.71 43.71
LandHoldingCertificate
Within 3 days 0.00 0.67 0.00 0.004 to 7 days 2.01* 12.75 0.66* 6.628-11days 16.78* 4.03 5.30 1.32More than 11 days 0.00 1.31 9.27 7.28Not availed 81.21 81.21 84.77 84.77
Income andcastecertificate
Within 3 days 0.00* 12.75 3.31* 15.234 to 7 days 10.74* 40.27 5.30* 33.778-11days 54.36* 9.40 28.48* 1.99More than 11 days 1.34 4.03 24.50* 7.28Not Availed 33.56 33.56 38.41 41.72
Pay utilitybills
Within 15 minutes 0.00 0.00 0.00* 18.5415-30 minutes 0.00 24.83 0.00* 27.1530-60 minutes 0.00 34.23 0.00* 33.77Half day 1.34 3.36 0.66 3.31Not availed 98.66* 37.58 99.34* 17.22
* indicates proportions are significantly different at 5% level of significance
12 The Bhoomi (meaning land) project of online delivery of land records in Karnataka
26
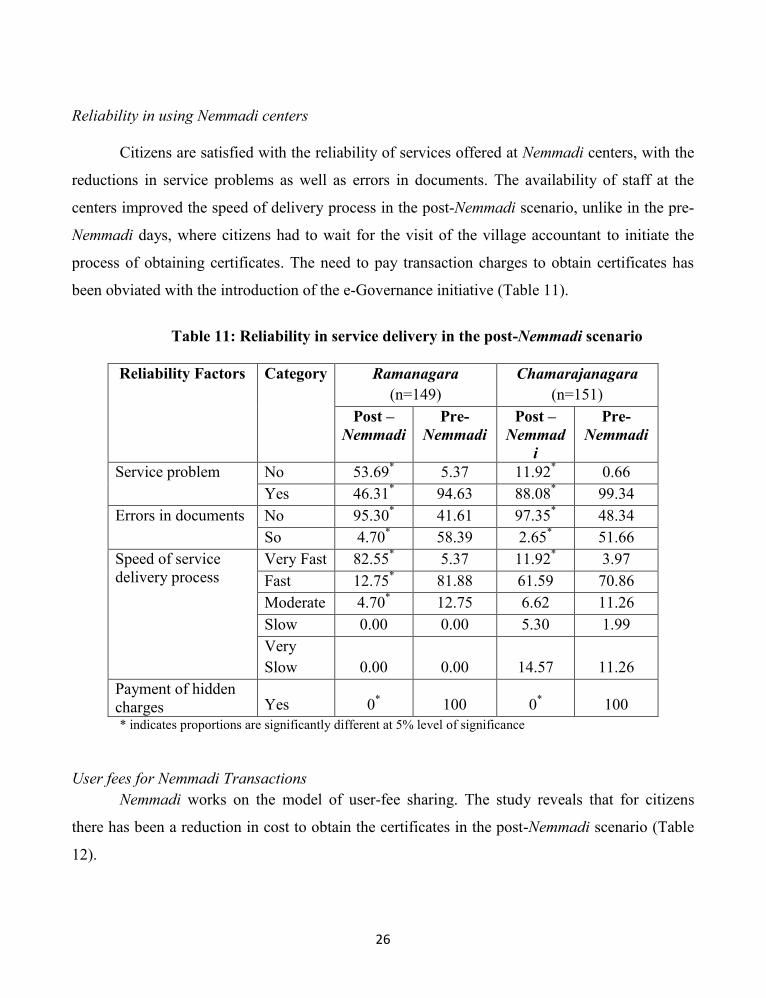
Reliability in using Nemmadi centers
Citizens are satisfied with the reliability of services offered at Nemmadi centers, with the
reductions in service problems as well as errors in documents. The availability of staff at the
centers improved the speed of delivery process in the post-Nemmadi scenario, unlike in the pre-
Nemmadi days, where citizens had to wait for the visit of the village accountant to initiate the
process of obtaining certificates. The need to pay transaction charges to obtain certificates has
been obviated with the introduction of the e-Governance initiative (Table 11).
Table 11: Reliability in service delivery in the post-Nemmadi scenario
Reliability Factors Category Ramanagara(n=149)
Chamarajanagara(n=151)
Post –Nemmadi
Pre-Nemmadi
Post –Nemmad
i
Pre-Nemmadi
Service problem No 53.69* 5.37 11.92* 0.66Yes 46.31* 94.63 88.08* 99.34
Errors in documents No 95.30* 41.61 97.35* 48.34So 4.70* 58.39 2.65* 51.66
Speed of servicedelivery process
Very Fast 82.55* 5.37 11.92* 3.97Fast 12.75* 81.88 61.59 70.86Moderate 4.70* 12.75 6.62 11.26Slow 0.00 0.00 5.30 1.99VerySlow 0.00 0.00 14.57 11.26
Payment of hiddencharges Yes 0* 100 0* 100* indicates proportions are significantly different at 5% level of significance
User fees for Nemmadi TransactionsNemmadi works on the model of user-fee sharing. The study reveals that for citizens
there has been a reduction in cost to obtain the certificates in the post-Nemmadi scenario (Table
12).

27
Table 12: User cost to obtain RD services(Rupees)
CertificatesRamanagara Chamarajanagara
Post –Nemmadi
Pre-Nemmadi
Post -Nemmadi
Pre-Nemmadi
RTC 12.01* 21.44 8.25* 11.06LandHolding
3.15* 6.41 1.62** 2.85Income andcaste
11.31* 20.34 8.28* 13.28* indicates t-tests are significant at 1% level of significance** indicates t-tests are significant at 5% level of significance
Factors influencing usage of Nemmadi centers
Motivations for most citizens to use Nemmadi centers include lower cost and better time
efficiency through reduction in number of visits and time taken to obtain the certificates (which
meant loss of wages or income) as well as simplicity of procedure. The other reasons that
encouraged people to use the centers were speed of service and accuracy of documents. People
were relieved about the avoidance of middlemen and the reduction in the need to pay bribes for
obtaining government services (Figures 16 and 17).
Figure 16: Ranking of factors influencing the use of Nemmadi centers at Ramanagara

28
Figure 17: Ranking of factors influencing the use of Nemmadi centers atChamarajanagara
The data reveals that citizens are highly satisfied with the new delivery process,
speed and responsiveness of staff, while accuracy of services and records as well as
facilities at the centers were satisfactory in both the districts (Table 13).
Table 13: Level of citizens’ satisfaction of various attributes of services at Nemmadi centers(% of respondents)
AttributesRamanagara
(n=149)Chamarajanagara
(n=151)Very
satisfiedSatisfied Not
SatisfiedVery
satisfiedSatisfied Not
SatisfiedNo
change
Delivery Process and Qualityof service 77.18 22.82 0.00 29.8 39.07 21.19 9.93
Speed of the service 75.17 23.49 1.34 19.21 45.7 24.5 10.6Responsiveness and empathyof staff 53.69 43.62 2.68 15.89 46.36 33.11 4.64
Staff efficiency in handlingproblems 40.94 55.7 3.36 58.28 29.14 12.58 0.00
Accuracy in billing andquality of the stationery used 38.26 60.4 1.34 25.83 59.6 14.57 0.00
Record maintenance accuracy 38.93 57.72 3.36 28.48 54.97 16.56 0.00Ambience and facilities 32.21 60.4 7.38 18.54 59.6 21.85 0.00
29
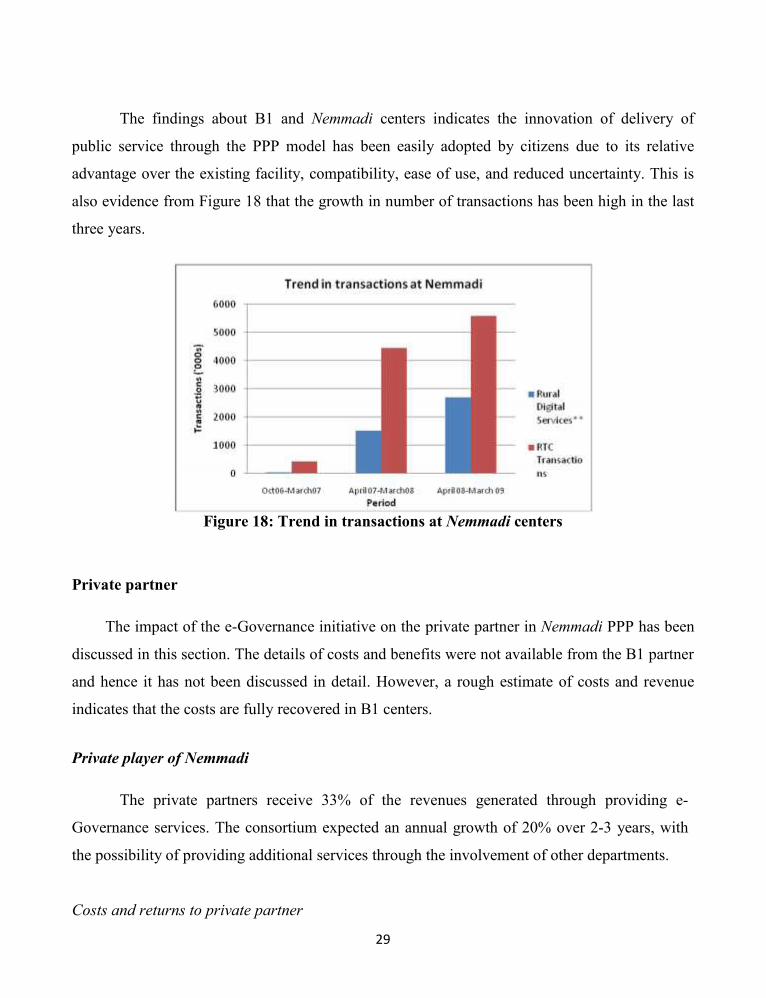
The findings about B1 and Nemmadi centers indicates the innovation of delivery of
public service through the PPP model has been easily adopted by citizens due to its relative
advantage over the existing facility, compatibility, ease of use, and reduced uncertainty. This is
also evidence from Figure 18 that the growth in number of transactions has been high in the last
three years.
Figure 18: Trend in transactions at Nemmadi centers
Private partner
The impact of the e-Governance initiative on the private partner in Nemmadi PPP has been
discussed in this section. The details of costs and benefits were not available from the B1 partner
and hence it has not been discussed in detail. However, a rough estimate of costs and revenue
indicates that the costs are fully recovered in B1 centers.
Private player of Nemmadi
The private partners receive 33% of the revenues generated through providing e-
Governance services. The consortium expected an annual growth of 20% over 2-3 years, with
the possibility of providing additional services through the involvement of other departments.
Costs and returns to private partner
30
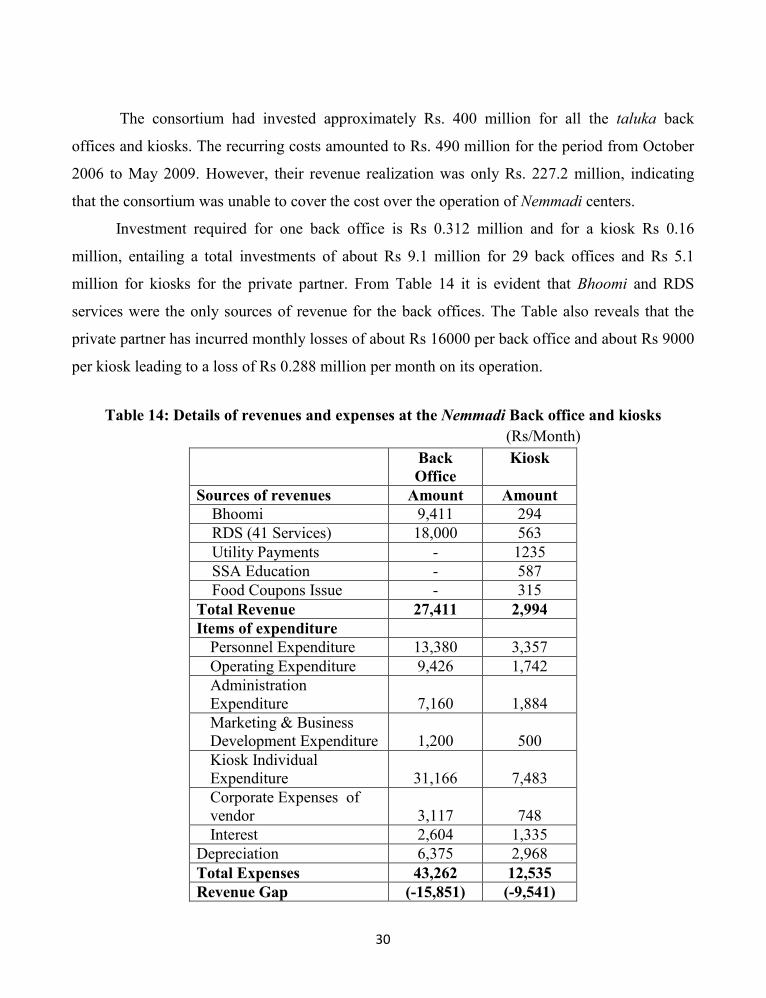
The consortium had invested approximately Rs. 400 million for all the taluka back
offices and kiosks. The recurring costs amounted to Rs. 490 million for the period from October
2006 to May 2009. However, their revenue realization was only Rs. 227.2 million, indicating
that the consortium was unable to cover the cost over the operation of Nemmadi centers.
Investment required for one back office is Rs 0.312 million and for a kiosk Rs 0.16
million, entailing a total investments of about Rs 9.1 million for 29 back offices and Rs 5.1
million for kiosks for the private partner. From Table 14 it is evident that Bhoomi and RDS
services were the only sources of revenue for the back offices. The Table also reveals that the
private partner has incurred monthly losses of about Rs 16000 per back office and about Rs 9000
per kiosk leading to a loss of Rs 0.288 million per month on its operation.
Table 14: Details of revenues and expenses at the Nemmadi Back office and kiosks(Rs/Month)
BackOffice
Kiosk
Sources of revenues Amount AmountBhoomi 9,411 294RDS (41 Services) 18,000 563Utility Payments - 1235SSA Education - 587Food Coupons Issue - 315
Total Revenue 27,411 2,994Items of expenditure
Personnel Expenditure 13,380 3,357Operating Expenditure 9,426 1,742AdministrationExpenditure 7,160 1,884Marketing & BusinessDevelopment Expenditure 1,200 500Kiosk IndividualExpenditure 31,166 7,483Corporate Expenses ofvendor 3,117 748Interest 2,604 1,335
Depreciation 6,375 2,968Total Expenses 43,262 12,535Revenue Gap (-15,851) (-9,541)
31
Parallel operation of government departments for the same services and non-
participation of other government departments are considered to be the main reasons for the
losses. To overcome this problem, the private partners have suggested a subsidy mechanism to
the government for each of the kiosks and back offices, and in return would provide free
information and grievance management services.
Challenges for the private partner in the working of the PPP
Like all other innovations, these initiatives too had several teething problems such as low
publicity, low public confidence, stability, data transfer, and maintenance of central database.
Over the years, the private players have been able to learn from their experience and improve
their services. The existence of parallel government centers for the services provided by B1 and
Nemmadi is one of the biggest challenges to the PPP. Measures such as increasing the number of
counters and creating awareness of centers and services are important in enhancing the use of
B1.
Nemmadi project faced several challenges such as delays in establishment and
commencement of RDS Back offices operations due to non-availability space, technical
challenges and issues in change management on the part of the government. These delays led to
considerable financial losses to the private partner as well as loss of credibility. Unresolved
technical issues continue to add to the losses. Creating computerized databases along the lines of
bhoomi can enormously facilitate their operations. Inclusion of the services of the other
departments will not only improve the financial viability but also help create a one-stop-shop
facility to citizen. Based on the BOOT model, it is unlikely that the consortium will be able to
recoup their investments within the timeframe of transferring resources to the government.
Some of the suggestions for improving the revenue flow, particularly for the Nemmadi
project are:
a. Ensuring participation of various other government departments;
b. Rationalizing parallel operation by the government departments;
c. Creating digital databases for various services like in the case of land records;
d. Providing wide publicity about the centers;
32
e. Training and orientation of government officials regarding Nemmadi to ensuretheir participation;
f. Modification of revenue sharing policy as well as period for transfer of project, inview of non-participation of departments such as education, health, andagriculture;
g. Inclusion of several B2C services such as insurance, banking, vocational training,IT training as well as linking Nemmadi centers to KVK (Krishi Vigyan Kendra-agriculture knowledge centers).
The government player
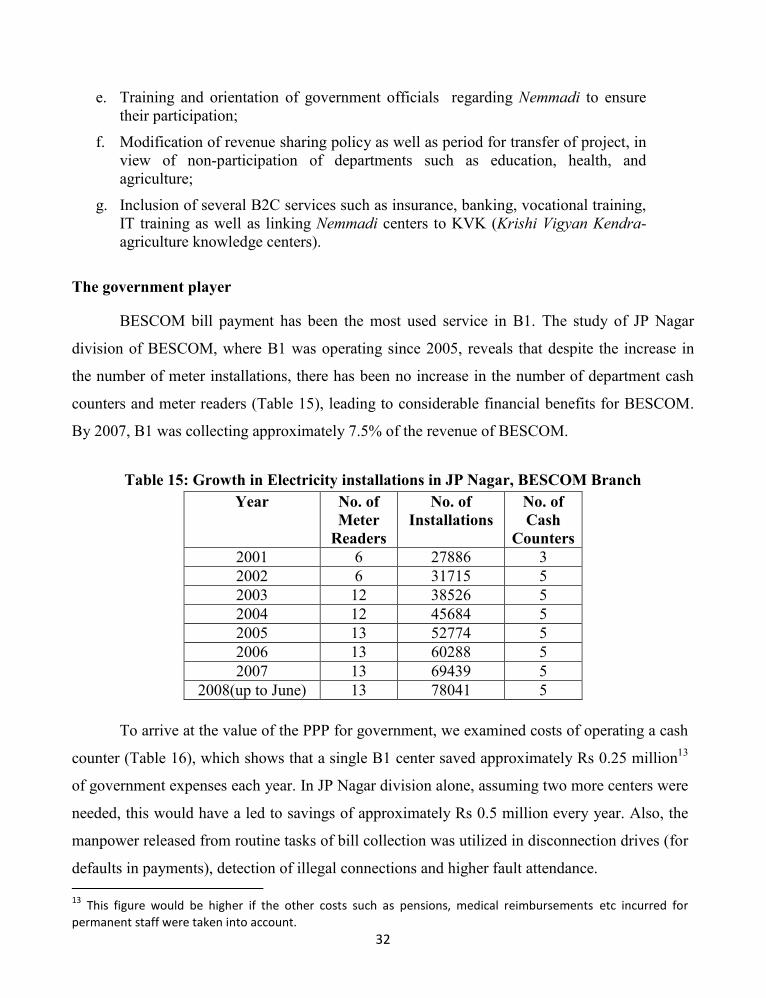
BESCOM bill payment has been the most used service in B1. The study of JP Nagar
division of BESCOM, where B1 was operating since 2005, reveals that despite the increase in
the number of meter installations, there has been no increase in the number of department cash
counters and meter readers (Table 15), leading to considerable financial benefits for BESCOM.
By 2007, B1 was collecting approximately 7.5% of the revenue of BESCOM.
Table 15: Growth in Electricity installations in JP Nagar, BESCOM BranchYear No. of
MeterReaders
No. ofInstallations
No. ofCash
Counters2001 6 27886 32002 6 31715 52003 12 38526 52004 12 45684 52005 13 52774 52006 13 60288 52007 13 69439 5
2008(up to June) 13 78041 5
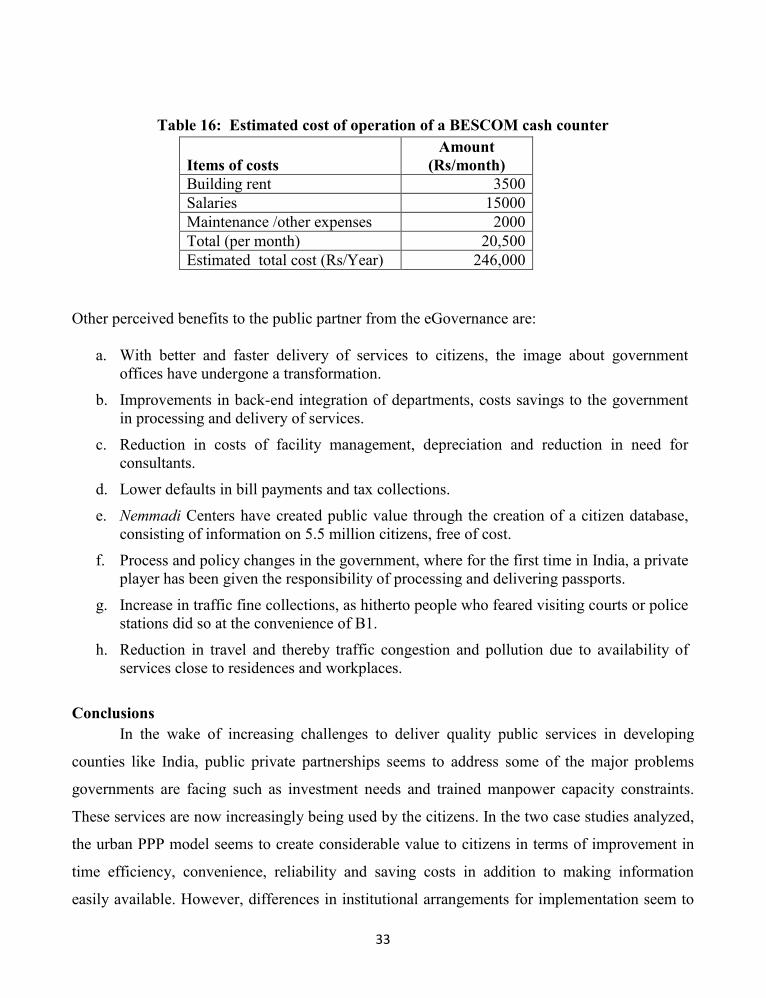
To arrive at the value of the PPP for government, we examined costs of operating a cash
counter (Table 16), which shows that a single B1 center saved approximately Rs 0.25 million13
of government expenses each year. In JP Nagar division alone, assuming two more centers were
needed, this would have a led to savings of approximately Rs 0.5 million every year. Also, the
manpower released from routine tasks of bill collection was utilized in disconnection drives (for
defaults in payments), detection of illegal connections and higher fault attendance.
13 This figure would be higher if the other costs such as pensions, medical reimbursements etc incurred forpermanent staff were taken into account.
33
Table 16: Estimated cost of operation of a BESCOM cash counter
Items of costsAmount
(Rs/month)Building rent 3500Salaries 15000Maintenance /other expenses 2000Total (per month) 20,500Estimated total cost (Rs/Year) 246,000
Other perceived benefits to the public partner from the eGovernance are:
a. With better and faster delivery of services to citizens, the image about governmentoffices have undergone a transformation.
b. Improvements in back-end integration of departments, costs savings to the governmentin processing and delivery of services.
c. Reduction in costs of facility management, depreciation and reduction in need forconsultants.
d. Lower defaults in bill payments and tax collections.
e. Nemmadi Centers have created public value through the creation of a citizen database,consisting of information on 5.5 million citizens, free of cost.
f. Process and policy changes in the government, where for the first time in India, a privateplayer has been given the responsibility of processing and delivering passports.
g. Increase in traffic fine collections, as hitherto people who feared visiting courts or policestations did so at the convenience of B1.
h. Reduction in travel and thereby traffic congestion and pollution due to availability ofservices close to residences and workplaces.
ConclusionsIn the wake of increasing challenges to deliver quality public services in developing
counties like India, public private partnerships seems to address some of the major problems
governments are facing such as investment needs and trained manpower capacity constraints.
These services are now increasingly being used by the citizens. In the two case studies analyzed,
the urban PPP model seems to create considerable value to citizens in terms of improvement in
time efficiency, convenience, reliability and saving costs in addition to making information
easily available. However, differences in institutional arrangements for implementation seem to
34
have considerable impact on the performance of these initiatives. In the case of B1, clarity in the
role of partners, government taking major role in coordinating with various government
agencies, providing back end support coupled with private partners’ initiative to keep the B1
centers open for longer hours have helped iron out problems in implementation as well as attract
citizens to avail services. However, in the case of Nemmadi, the contract signed puts
considerable burden on the private partner to make the government department use their services,
which has not been easy for the private partner to convince. The current timing of operation and
location also does not give any advantage of the Nemmadi centers over the existing services.
While citizens are happy with the public value creation with time and cost savings in availing
services and improvement in the reliability of services, further improvements to enhance this
public value are needed in terms of providing additional services, reducing time taken for service
delivery through creating digital databases and creating awareness of these services. These
changes would help in increasing the number of transactions, improve public value creation and
in turn would help improve financial viability for private partner. The share of revenue for
private partner also requires a re-examination to make it viable in the case of Nemmadi. As
observed in the case of B1, Nemmadi also has an enormous potential to create large public value
if these centers are made to provide all G2C services in an integrated manner to the citizens.
References
Burd, S. and Currie, C., Partnering with the private sector to introduce new physical, human andsocial capital- Isolating criteria for success, Working paper No. 133, Social ScienceElectronic Publishing, Inc. 2004. http://www.business.uts.edu.au/finance (Accessed on19th May, 2009).
Confederation of Indian Industry and Ministry of Finance, Government of India, Public PrivatePartnerships: Creating an Enabling Environment for State Projects, Proceeding of aWorkshop, July 2007.
Government of India, Meeting India’s Infrastructure Needs with Public Private Partnership- theInternational Experience and Perspective. 2007. http://www. pppinindia.com/pdf/conference_meeting_indias infrastructure needs_with_public private_ patnerships.pdf(Accessed on May 18, 2009).
House of Commons, The Private Finance Initiative (PFI), Research Paper No. 01/117. 2001.http://www. parliament.uk /commons/lib/research/rp2001/rp01-117.pdf (Accessed on 29th
May, 2009).
35
Indian Institute of Management, Ahmedabad, Impact assessment of eGovernance Projects inIndia, Center for e-Governance.2007.
Kelly, Gavin and Muers, Stephen, World Public Sector Report 2003: e-Government at the Cross-Roads, United Nations. 2003
National Council for Public-Private Partnerships, For the Good of the People: Using Public-Private Partnerships to Meet America’s Essential Needs, www.ncppp.org/presskit/ncpppwhitepaper.pdf, 2002. (Accessed on May 29, 2009).
Rogers, E., Diffusion of innovations, (5th ed). Free Press, New York. 2003.
United Nations, 2005, UN Global E-government Readiness Report 2005: From E-government toE-inclusion. Department of Economic and Social Affairs, United Nations. 2005.
Recommended