Newark Charter School
2016-2017 Financial Framework Report
Page 1
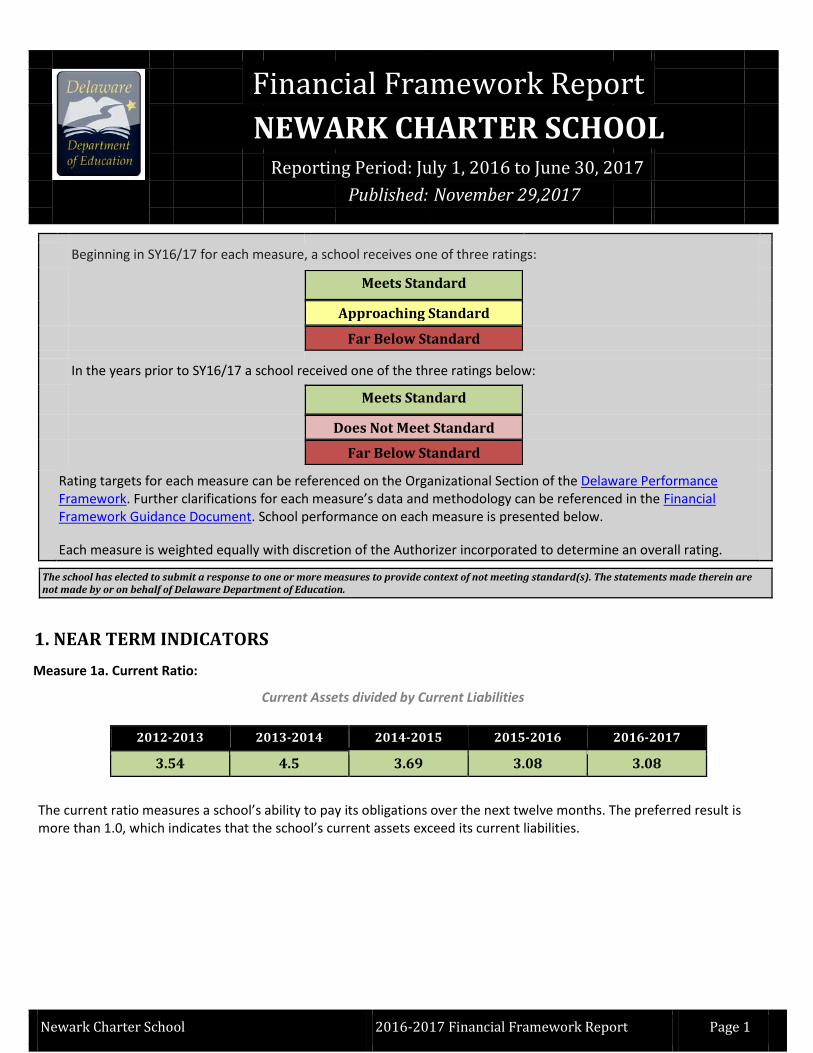
Financial Framework Report
NEWARK CHARTER SCHOOL
Reporting Period: July 1, 2016 to June 30, 2017
Published:
November 29,2017
Beginning in SY16/17 for each measure, a school receives one of three ratings:
Meets Standard
Approaching Standard
Far Below Standard
In the years prior to SY16/17 a school received one of the three ratings below:
Meets Standard
Does Not Meet Standard
Far Below Standard
Rating targets for each measure can be referenced on the Organizational Section of the Delaware Performance Framework. Further clarifications for each measure’s data and methodology can be referenced in the Financial Framework Guidance Document. School performance on each measure is presented below.
Each measure is weighted equally with discretion of the Authorizer incorporated to determine an overall rating.
The school has elected to submit a response to one or more measures to provide context of not meeting standard(s). The statements made therein are not made by or on behalf of Delaware Department of Education.
1. NEAR TERM INDICATORS
Measure 1a. Current Ratio:
Current Assets divided by Current Liabilities
2012-2013
2013-2014
2014-2015
2015-2016
2016-2017
3.54
4.5
3.69
3.08
3.08
The current ratio measures a school’s ability to pay its obligations over the next twelve months. The preferred result is more than 1.0, which indicates that the school’s current assets exceed its current liabilities.

Newark Charter School
2016-2017 Financial Framework Report
Page 2
Measure 1b. Days Cash:
Cash divided by (Total Expenses / 365)
2012-2013
2013-2014
2014-2015
2015-2016
2016-2017
187
169
181
168
174
The days cash on hand ratio indicates how many days a school can pay its expenses without another inflow of cash. The preferred result is more than 60 days cash.
School Response To Rating:
There is $600,000 of pension expense imbedded in current expenses on the Statement of Net Position and the Statement of Activities which should be excluded which impact the calculations of Cash On Hand, Total Margin and Debt Service Coverage ratio. Adjusted rate is 180 days.
Measure 1c. Enrollment Variance:
Actual Enrollment as of September 30 divided by Authorized Enrollment
2012-2013
2013-2014
2014-2015
2015-2016
2016-2017
101%
100%
100%
100%
100%
The enrollment variance depicts actual versus authorized enrollment. A school budgets based on projected enrollment but is funded based on actual enrollment; therefore , a school that fails to meet its enrollment targets may not be able to meet its budgeted expenses. The preferred result is more than 95%.
Measure 1d. Default, Loan Covenants, & Debt Service Payments
2012-2013
2013-2014
2014-2015
2015-2016
2016-2017
No
No
No
No
No
This metric addresses whether or not a school is meeting its loan covenants and / or is delinquent with its debt service payment, as noted in the notes accompanying the audited financial statements. A school which cannot meet the terms of its loan may be in financial distress.

Newark Charter School
2016-2017 Financial Framework Report
Page 3
2. SUSTAINABILITY INDICATORS
Measure 2a. Total Margin:
Net Income divided by Total Revenue
2012-2013
2013-2014
2014-2015
2015-2016
2016-2017
1 YR: 10.63%
1 YR: 3.2%
1 YR: 6.9%
1 YR: 0.81%
1 YR: 0.33%
3 YR: 6.67% 3 YR: 5.99% 3 YR: 6.67% 3 YR: 3.54% 3 YR: 2.46%
Total margin measures the deficit or surplus a school yields out of its total revenues; in other words, whether or not the school is living within its available resources. The preferred result is a positive margin for the past year and the past 3 years.
School Response To Rating:
There is $600,000 of pension expense imbedded in current expenses on the Statement of Net Position and the Statement of Activities which should be excluded which impact the calculations of Cash On Hand, Total Margin and Debt Service Coverage ratio. Adjusted 1 year margin 3.2%.
Measure 2b. Debt to Asset Ratio:
Total Liabilities divided by Total Assets
2012-2013
2013-2014
2014-2015
2015-2016
2016-2017
0.81
0.79
0.78
0.79
0.78
The debt to asset ratio compares the school’s liabilities to its assets, or what a school owes against what it owns. The preferred result is less than 0.90.
Measure 2c. Cash Flow
2012-2013
2013-2014
2014-2015
2015-2016
2016-2017
1 YR: $1780268
1 YR: $1647386
1 YR: $1630163
1 YR: $1172598
1 YR: $1517170
3 YR: $955562 3 YR: $3427654 3 YR: $3277549 3 YR: $2802761 3 YR: $2689768
Cash flow indicates the trend in the school’s cash balance over a period of time. This measure is similar to days cash on hand, but indicates long-term stability versus near-term. Since cash flow fluctuations from year-to-year can have a long-term impact on a school’s financial health, this metric assesses both three-year cumulative cash flow and annual cash flow. The preferred result is greater than zero.

Newark Charter School
2016-2017 Financial Framework Report
Page 4
Measure 2d. Debt Service Coverage Ratio:
(Net Income + Depreciation + Interest Expense) / (Principal and Interest Payments)
2012-2013
2013-2014
2014-2015
2015-2016
2016-2017
2.31
1.74
2.3
1.3
1.24
The debt service coverage ratio indicates a school’s ability to cover its debt obligations in the current year.
School Response To Rating:
There is $600,000 of pension expense imbedded in current expenses on the Statement of Net Position and the Statement of Activities which should be excluded which impact the calculations of Cash On Hand, Total Margin and Debt Service Coverage ratio. Adjusted debt service coverage ratio is 1.67.

Newark Charter School
2016-2017 Financial Framework Report
Page 5
3. FINANCIAL MANAGEMENT AND OVERSIGHT
2012-2013
2013-2014
2014-2015
2015-2016
2016-2017
M
M
M
M
M
This measures assesses the timeliness of reporting, the implementation of the Citizen Budget Oversight Committee, and the adherence to the policies and procedures of the First State Financial Management System.
SUMMARY AND OVERALL RATING
Newark Charter School
Year
1a
1b 1c 1d 2a 2b 2c 2d 3 OVERALL
RATING
2012-2013
M M M M M M M M M Meets
Standard
2013-2014
M M M M M M M M M Meets
Standard
2014-2015
M M M M M M M M M Meets
Standard
2015-2016
M M M M M M M M M Meets
Standard
2016-2017 M M M M M M M M M Meets
Standard
Recommended