CONFIDENTIAL
Q4 and FY 2015 Earnings Conference Call
March 8, 2016
Cautionary Note Regarding Forward-looking Statements
2
To the extent any statements made in this presentation contain information that is not historical, these statements are forward-looking statements or forward-looking information, as applicable, within the meaning of
Section 27A of the U.S. Securities Act of 1933, as amended, and Section 21E of the U.S. Securities Exchange Act of 1934, as amended, and under Canadian securities law (collectively “forward-looking statements”).
Forward-looking statements can generally be identified by the use of words such as “should,” “intend,” “may,” “expect,” “believe,” “anticipate,” “estimate,” “continue,” “plan,” “project,” “will,” “could,” “would,” “target,”
“potential” and other similar expressions. In addition, any statements that refer to expectations, projections or other characterizations of future events or circumstances are forward-looking statements. Although
Atlantic Power Corporation (“AT”, “Atlantic Power” or the “Company”) believes that the expectations reflected in such forward-looking statements are reasonable, such statements involve risks and uncertainties and
should not be read as guarantees of future performance or results, and undue reliance should not be placed on such statements. Please refer to the factors discussed under “Risk Factors” and “Forward-Looking
Information” in the Company’s periodic reports as filed with the Securities and Exchange Commission from time to time for a detailed discussion of the risks and uncertainties affecting the Company, including, without
limitation, the outcome or impact of the Company’s business plan, including the objective of enhancing the value of its existing assets through optimization investments and commercial activities, delevering its balance
sheet to improve its cost of capital and ability to compete for new investments, and utilizing its core competencies to create proprietary investment opportunities, and the Company’s ability to raise additional capital for
growth and/or debt reduction, and the outcome or impact on the Company’s business of any such actions. Although the forward-looking statements contained in this presentation are based upon what are believed to
be reasonable assumptions, investors cannot be assured that actual results will be consistent with these forward-looking statements, and the differences may be material. These forward-looking statements are made
as of the date of this presentation and, except as expressly required by applicable law, the Company assumes no obligation to update or revise them to reflect new events or circumstances. The Company’s ability to
achieve its longer-term goals, including those described in this presentation, is based on significant assumptions relating to and including, among other things, the general conditions of the markets in which it
operates, revenues, internal and external growth opportunities, its ability to sell assets at favorable prices or at all and general financial market and interest rate conditions. The Company’s actual results may differ,
possibly materially and adversely, from these goals.
Project Adjusted EBITDA is not a measure recognized under GAAP and does not have a standardized meaning prescribed by GAAP, and is therefore unlikely to be comparable to similar measures presented by other
companies. Project Adjusted EBITDA is defined as project income (loss) plus interest, taxes, depreciation and amortization (including non-cash impairment charges) and changes in the fair value of derivative
instruments. Management uses Project Adjusted EBITDA at the project level to provide comparative information about project performance and believes such information is helpful to investors. A reconciliation of
Project Adjusted EBITDA to project income (loss) is provided on slide 35. Investors are cautioned that the Company may calculate this measure in a manner that is different from other companies.
Cash Distributions from Projects, Adjusted Cash Flows from Operating Activities, Free Cash Flow and Adjusted Free Cash Flow are not measures recognized under GAAP and do not have standardized meanings
prescribed by GAAP, and are therefore unlikely to be comparable to similar measures presented by other companies. Adjusted Cash Flows from Operating Activities is used to evaluate cash flows from operating
activities without the effects of changes in working capital balances, acquisition expenses, litigation expenses, severance and restructuring charges, debt prepayment and redemption costs and cash provided by or
used in discontinued operations. The intent is to reflect normal operations and remove items that are not reflective of the long-term operations of the business. Free Cash Flow is defined as cash flows from operating
activities less capex; project-level debt repayments, including amortization of the new term loan; and distributions to noncontrolling interests, including preferred share dividends. Adjusted Free Cash Flow is defined as
Free Cash Flow excluding changes in working capital balances, acquisition expenses, litigation expense, severance and restructuring charges, and cash provided by or used in discontinued operations. Management
believes that these non-GAAP cash flow measures are relevant supplemental measures of the Company's ability to generate cash. A reconciliation of Free Cash Flow to cash flows from operating activities is provided
on slide 39. Reconciliations of Adjusted Free Cash Flow and Adjusted Cash Flows from Operating Activities to cash flows from operating activities are provided on slides 28 and 29. A bridge of Project Adjusted
EBITDA to Cash Distributions from Projects is provided on slide 39. Investors are cautioned that the Company may calculate these measures in a manner that is different from other companies.
The Company has not reconciled non-GAAP financial measures relating to individual projects, to the projects in discontinued operations or to the APLP projects to the directly comparable GAAP measures due to the
difficulty in making the relevant adjustments on an individual project basis. The Company has not provided a reconciliation of forward-looking non-GAAP measures, because not all of the information necessary for a
quantitative reconciliation is available to the Company without unreasonable efforts primarily as a result of the variability and difficulty in making accurate forecasts and projections.
All amounts in this presentation are in US$ and approximate unless otherwise stated.
Disclaimer – Non-GAAP Measures

3
• CEO: Progress Report
• Operations Update
• 2015 Financial Review
• 2016 Guidance
• CEO: Capital Allocation Strategy
• Q&A
Agenda
2015: Continued Progress
4
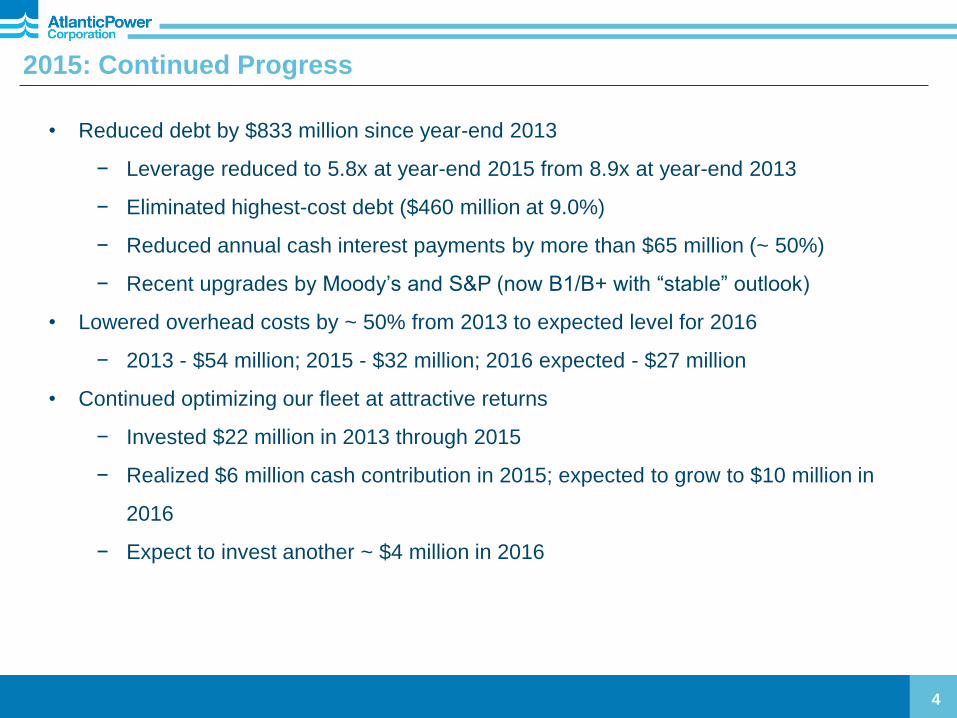
• Reduced debt by $833 million since year-end 2013
− Leverage reduced to 5.8x at year-end 2015 from 8.9x at year-end 2013
− Eliminated highest-cost debt ($460 million at 9.0%)
− Reduced annual cash interest payments by more than $65 million (~ 50%)
− Recent upgrades by Moody’s and S&P (now B1/B+ with “stable” outlook)
• Lowered overhead costs by ~ 50% from 2013 to expected level for 2016
− 2013 - $54 million; 2015 - $32 million; 2016 expected - $27 million
• Continued optimizing our fleet at attractive returns
− Invested $22 million in 2013 through 2015
− Realized $6 million cash contribution in 2015; expected to grow to $10 million in
2016
− Expect to invest another ~ $4 million in 2016
2015: Continued Progress (cont.)
5
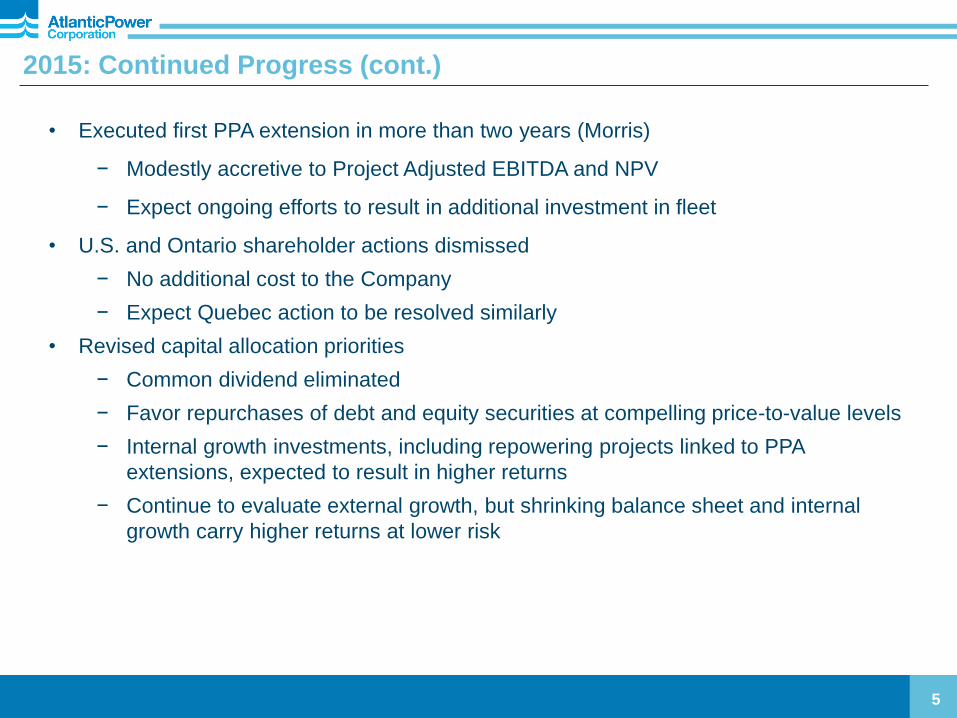
• Executed first PPA extension in more than two years (Morris)
− Modestly accretive to Project Adjusted EBITDA and NPV
− Expect ongoing efforts to result in additional investment in fleet
• U.S. and Ontario shareholder actions dismissed
− No additional cost to the Company
− Expect Quebec action to be resolved similarly
• Revised capital allocation priorities
− Common dividend eliminated
− Favor repurchases of debt and equity securities at compelling price-to-value levels
− Internal growth investments, including repowering projects linked to PPA
extensions, expected to result in higher returns
− Continue to evaluate external growth, but shrinking balance sheet and internal
growth carry higher returns at lower risk

Q4 2014 Q4 2015 Q4 2014 Q4 2015 Q4 2014 Q4 2015 Q4 2014 Q4 2015
Q4 2015 Operational Performance: Improved availability; generation up moderately
6
Weighted Average Availability
Q4 2015 Q4 2014
East U.S. 98.0% 93.7%
West U.S. 94.1% 88.0%
Canada 93.5% 99.0%
Total 96.0% 93.6%
Aggregate Power Generation Q4 2015 vs. Q4 2014 (thousands, Net MWh)
East U.S. West U.S. Canada Total
601 666
1,646 1,592
495 615 485
377
10.9% 28.7% (19.4)%
3.4%
Availability factor up Generation up 3.4% year-on-year:
+ Increased dispatch at Frederickson as a result of stronger
demand and lower fuel gas pricing
+ Selkirk one-month hedge agreement with offtaker in Nov. 2015
+ Morris higher PJM and customer demand
+ Naval Station forced outage in Oct./Nov. 2014
Expiration of Tunis PPA in Dec. 2014; mothballed
Reduced dispatch at Manchief
Mamquam, due to low water flows and a maintenance outage
+ Koma Kulshan (scheduled
outage in 2014)
+ Selkirk (scheduled outage in
2014)
Mamquam (scheduled
outage in 2015)
See slide 7 for review of year-to-date operational performance.
YTD Dec2014
YTD Dec2015
YTD Dec2014
YTD Dec2015
YTD Dec2014
YTD Dec2015
YTD Dec2014
YTD Dec2015
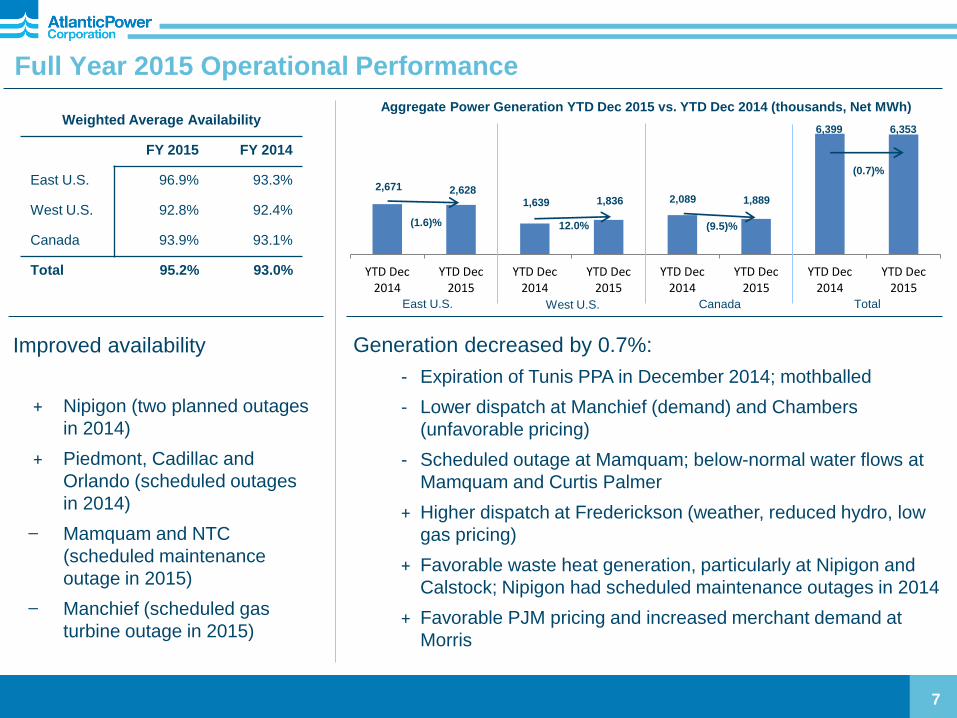
Full Year 2015 Operational Performance
7
Weighted Average Availability
FY 2015 FY 2014
East U.S. 96.9% 93.3%
West U.S. 92.8% 92.4%
Canada 93.9% 93.1%
Total 95.2% 93.0%
Aggregate Power Generation YTD Dec 2015 vs. YTD Dec 2014 (thousands, Net MWh)
East U.S. West U.S. Canada Total
2,671 2,628
6,353 6,399
1,889 2,089 1,836 1,639
(1.6)% 12.0% (9.5)%
(0.7)%
Generation decreased by 0.7%:
- Expiration of Tunis PPA in December 2014; mothballed
- Lower dispatch at Manchief (demand) and Chambers
(unfavorable pricing)
- Scheduled outage at Mamquam; below-normal water flows at
Mamquam and Curtis Palmer
+ Higher dispatch at Frederickson (weather, reduced hydro, low
gas pricing)
+ Favorable waste heat generation, particularly at Nipigon and
Calstock; Nipigon had scheduled maintenance outages in 2014
+ Favorable PJM pricing and increased merchant demand at
Morris
+ Nipigon (two planned outages
in 2014)
+ Piedmont, Cadillac and
Orlando (scheduled outages
in 2014)
Mamquam and NTC
(scheduled maintenance
outage in 2015)
Manchief (scheduled gas
turbine outage in 2015)
Improved availability

Review of Optimization Initiatives
8
Investments 2013 - 2015:
• Curtis Palmer turbine upgrades (2013-2014) – $2M
• Nipigon OTSG upgrade and feedwater booster pump installation (2014-2015) – $10M
• Morris
Gas turbine air augmentation (Oct. 2015)
Replacement of purified water production system (Jan. 2016) – on behalf of customer
Boiler upgrade (fast start capability) (to be completed in Q3 2016)
Upgrade of certain gas turbine components (to be completed in 2016-2017)
Total ≈ $10M to date
• Mamquam efficiency project to ensure smoother water flow (Nov. 2015) – $1M
• All Other – $4M
$27M Total to date
$(5)M Less reimbursement for customer-owned project
$22M Net Investment
2015 Cash Return – $6M (~26%) • Lower than initial expectation due to low water flows at Curtis Palmer and high waste heat at Nipigon
(less need for duct burners)
• Expect to generate $10 million cash return in 2016 assuming more typical water and waste heat levels
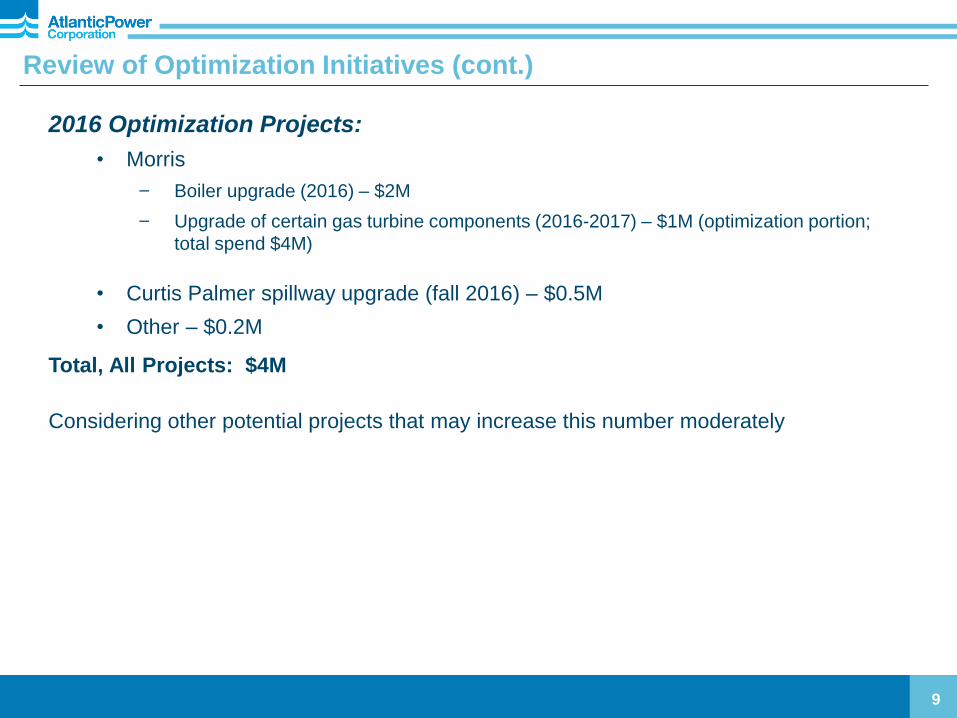
Review of Optimization Initiatives (cont.)
9
2016 Optimization Projects:
• Morris
Boiler upgrade (2016) – $2M
Upgrade of certain gas turbine components (2016-2017) – $1M (optimization portion;
total spend $4M)
• Curtis Palmer spillway upgrade (fall 2016) – $0.5M
• Other – $0.2M
Total, All Projects: $4M
Considering other potential projects that may increase this number moderately
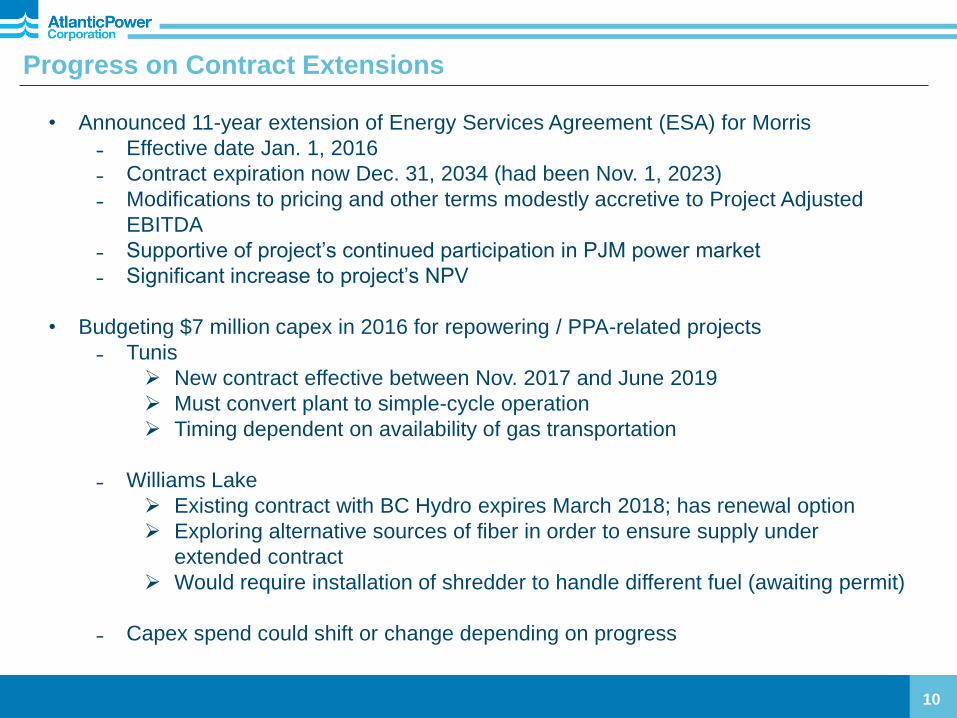
Progress on Contract Extensions
10
• Announced 11-year extension of Energy Services Agreement (ESA) for Morris
˗ Effective date Jan. 1, 2016
˗ Contract expiration now Dec. 31, 2034 (had been Nov. 1, 2023)
˗ Modifications to pricing and other terms modestly accretive to Project Adjusted
EBITDA
˗ Supportive of project’s continued participation in PJM power market
˗ Significant increase to project’s NPV
• Budgeting $7 million capex in 2016 for repowering / PPA-related projects
˗ Tunis
New contract effective between Nov. 2017 and June 2019
Must convert plant to simple-cycle operation
Timing dependent on availability of gas transportation
˗ Williams Lake
Existing contract with BC Hydro expires March 2018; has renewal option
Exploring alternative sources of fiber in order to ensure supply under
extended contract
Would require installation of shredder to handle different fuel (awaiting permit)
˗ Capex spend could shift or change depending on progress

2015 Impairment and Finding of Material Weakness
11
• Conducted annual goodwill impairment test in Q4 2015
− Significant reduction in forward power price curves, which reduced the level of
expected cash flows post-PPA expiration for certain projects (used in fair market
value models for impairment analysis)
− Determined that impairments of long-lived assets and goodwill at Williams Lake
($109.7 million), Curtis Palmer ($13.7 million), and Calstock ($4.4 million) were
appropriate (total $127.8 million)
• No effect on Project Adjusted EBITDA or cash flow metrics
− Non-cash charge
− Impairment expense not included in Project Adjusted EBITDA
• Material weakness in internal control over financial reporting
− Initial impairment testing was ineffective
− Taking steps to remediate weakness; expect to be addressed over the next year
• The Company believes its consolidated financial statements on Form 10-K fairly
present, in all material respects, its financial condition, results of operations and cash
flows for the periods presented in conformity with U.S. GAAP

2015 Financial Highlights
12
• Reported Project Adjusted EBITDA and Adjusted Cash Flows from Operating Activities
in top half of guidance range
− Project Adjusted EBITDA $208.9 million (guidance $200 to $215 million)
− Adjusted Cash Flows from Operating Activities $105.3 million (guidance $95 to
$105 million)
• Adjusted Free Cash Flow in lower end of range due to timing issue
− Adjusted Free Cash Flow $1.8 million (guidance $0 to $10 million)
− Received $6 million construction cost reimbursement in February 2016
• Achieved significant reduction in debt
− Repaid $68 million of term loan and $15 million of project-level debt from cash flow
− Redeemed or deconsolidated $560 million of debt as a result of the Wind sale
• Year-end 2015 liquidity of $178 million, including $72 million of unrestricted cash
• Received credit rating upgrades from Moody’s and Standard & Poor’s to B1/B+
• Implemented new NCIB in December for up to 10% convertible debentures and
common shares and up to 5% of Atlantic Power Preferred Equity Ltd. preferred shares
− Have repurchased ~ 575,000 common shares since late December
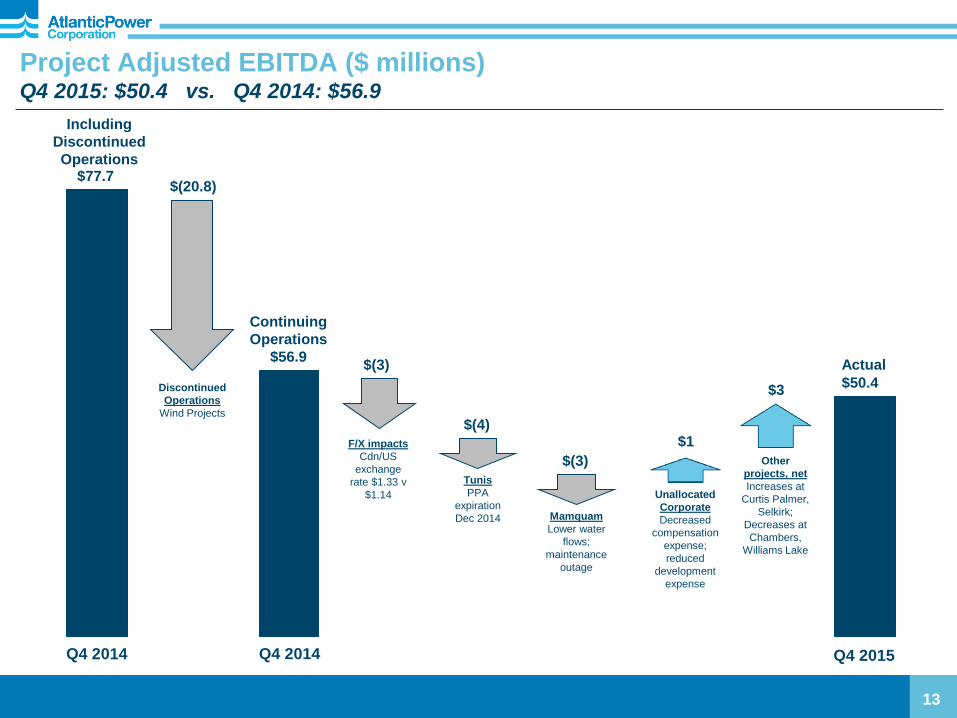
Project Adjusted EBITDA ($ millions) Q4 2015: $50.4 vs. Q4 2014: $56.9
13
Continuing
Operations
$56.9 Actual
$50.4
Q4 2014 Q4 2015
Including
Discontinued
Operations $77.7
Q4 2014
Discontinued
Operations
Wind Projects
$(20.8)
$(4)
Unallocated
Corporate
Decreased
compensation
expense;
reduced
development
expense
Tunis
PPA
expiration
Dec 2014
$1 F/X impacts
Cdn/US
exchange
rate $1.33 v
$1.14
$(3)
Other
projects, net
Increases at
Curtis Palmer,
Selkirk;
Decreases at
Chambers,
Williams Lake
$3
$(3)
Mamquam
Lower water
flows;
maintenance
outage
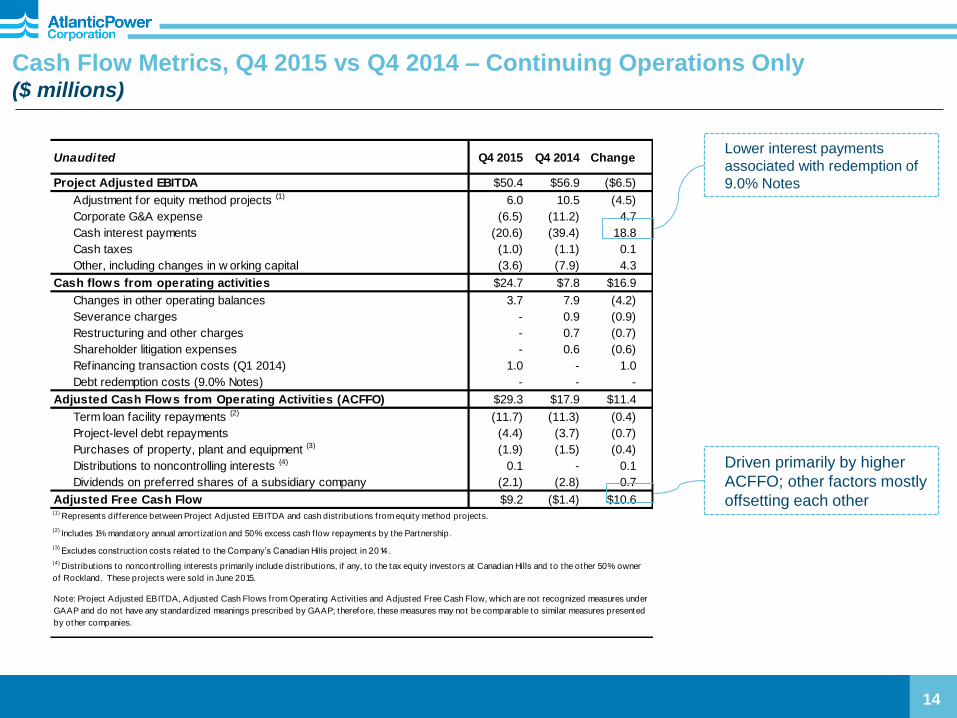
Unaudited Q4 2015 Q4 2014 Change
Project Adjusted EBITDA $50.4 $56.9 ($6.5)
Adjustment for equity method projects (1) 6.0 10.5 (4.5)
Corporate G&A expense (6.5) (11.2) 4.7
Cash interest payments (20.6) (39.4) 18.8
Cash taxes (1.0) (1.1) 0.1
Other, including changes in w orking capital (3.6) (7.9) 4.3
Cash flows from operating activities $24.7 $7.8 $16.9
Changes in other operating balances 3.7 7.9 (4.2)
Severance charges - 0.9 (0.9)
Restructuring and other charges - 0.7 (0.7)
Shareholder litigation expenses - 0.6 (0.6)
Refinancing transaction costs (Q1 2014) 1.0 - 1.0
Debt redemption costs (9.0% Notes) - - -
Adjusted Cash Flows from Operating Activities (ACFFO) $29.3 $17.9 $11.4
Term loan facility repayments (2) (11.7) (11.3) (0.4)
Project-level debt repayments (4.4) (3.7) (0.7)
Purchases of property, plant and equipment (3) (1.9) (1.5) (0.4)
Distributions to noncontrolling interests (4) 0.1 - 0.1
Dividends on preferred shares of a subsidiary company (2.1) (2.8) 0.7
Adjusted Free Cash Flow $9.2 ($1.4) $10.6(1)
Represents dif ference between Project Adjusted EBITDA and cash distribut ions from equity method projects.
(2) Includes 1% mandatory annual amort izat ion and 50% excess cash f low repayments by the Partnership.
(3) Excludes construct ion costs related to the Company’s Canadian Hills project in 2014.
(4) Distribut ions to noncontrolling interests primarily include distribut ions, if any, to the tax equity investors at Canadian Hills and to the other 50% owner
of Rockland. These projects were sold in June 2015.
Note: Project Adjusted EBITDA, Adjusted Cash Flows from Operat ing Act ivit ies and Adjusted Free Cash Flow, which are not recognized measures under
GAAP and do not have any standardized meanings prescribed by GAAP; therefore, these measures may not be comparable to similar measures presented
by other companies.
Cash Flow Metrics, Q4 2015 vs Q4 2014 – Continuing Operations Only ($ millions)
14
Lower interest payments
associated with redemption of
9.0% Notes
Driven primarily by higher
ACFFO; other factors mostly
offsetting each other
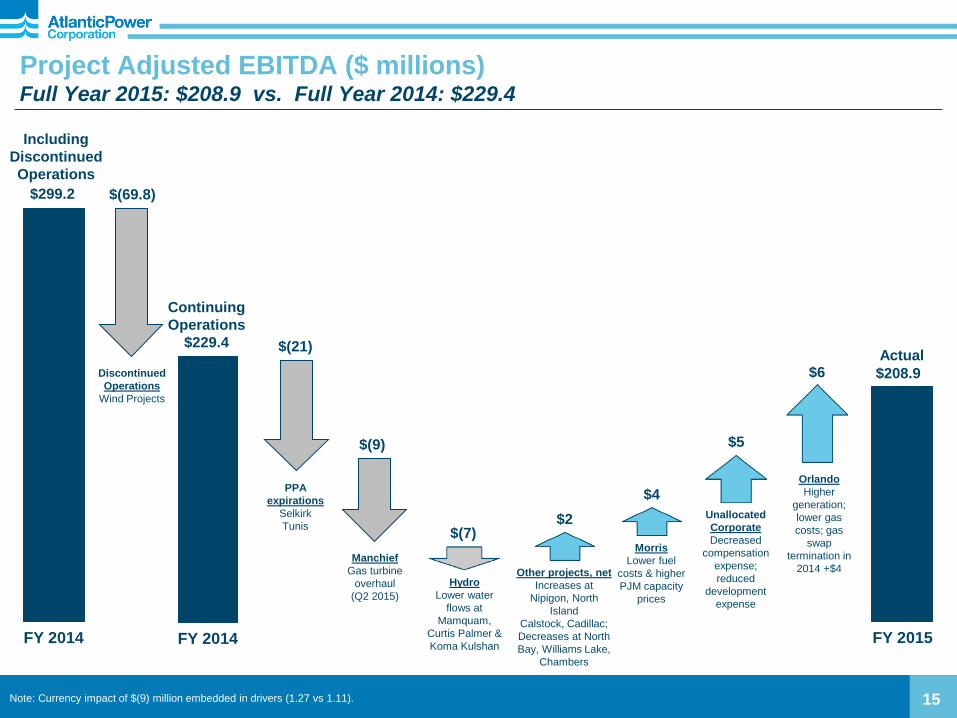
Project Adjusted EBITDA ($ millions) Full Year 2015: $208.9 vs. Full Year 2014: $229.4
15
Continuing
Operations
$229.4 Actual
$208.9
FY 2014
Hydro
Lower water
flows at
Mamquam,
Curtis Palmer &
Koma Kulshan
Other projects, net
Increases at
Nipigon, North
Island
Calstock, Cadillac;
Decreases at North
Bay, Williams Lake,
Chambers
$5
PPA
expirations
Selkirk
Tunis
$(21)
$(7)
$6
FY 2015
Including
Discontinued
Operations
$299.2
FY 2014
Discontinued
Operations
Wind Projects
$(69.8)
Manchief
Gas turbine
overhaul
(Q2 2015)
$(9)
Orlando
Higher
generation;
lower gas
costs; gas
swap
termination in
2014 +$4
$2
Morris
Lower fuel
costs & higher
PJM capacity
prices
$4
Note: Currency impact of $(9) million embedded in drivers (1.27 vs 1.11).
Unallocated
Corporate
Decreased
compensation
expense;
reduced
development
expense
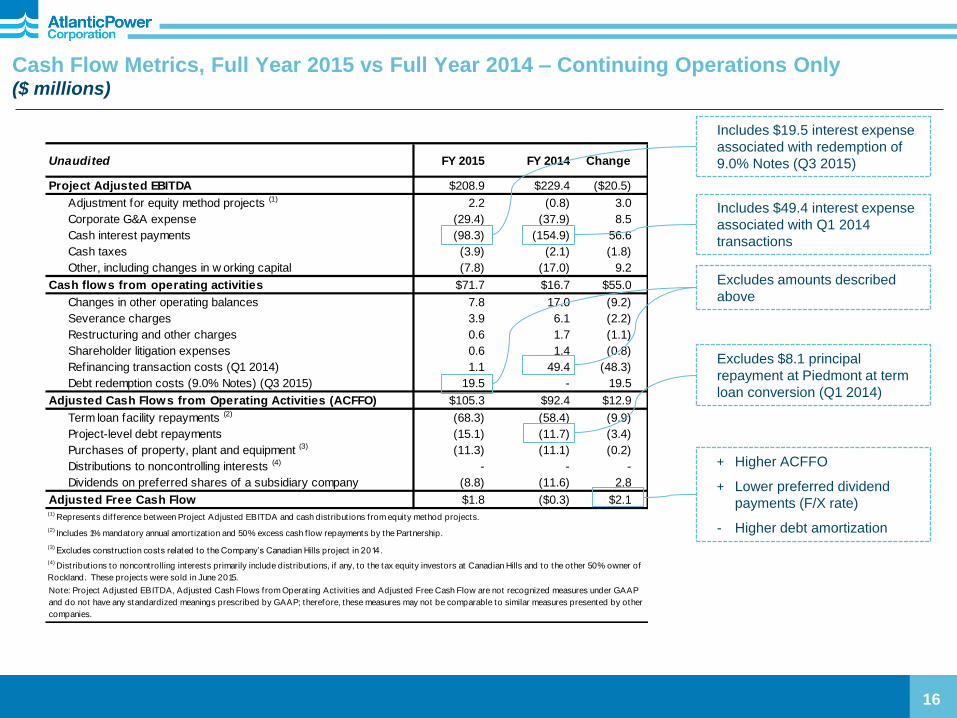
Unaudited FY 2015 FY 2014 Change
Project Adjusted EBITDA $208.9 $229.4 ($20.5)
Adjustment for equity method projects (1) 2.2 (0.8) 3.0
Corporate G&A expense (29.4) (37.9) 8.5
Cash interest payments (98.3) (154.9) 56.6
Cash taxes (3.9) (2.1) (1.8)
Other, including changes in w orking capital (7.8) (17.0) 9.2
Cash flows from operating activities $71.7 $16.7 $55.0
Changes in other operating balances 7.8 17.0 (9.2)
Severance charges 3.9 6.1 (2.2)
Restructuring and other charges 0.6 1.7 (1.1)
Shareholder litigation expenses 0.6 1.4 (0.8)
Refinancing transaction costs (Q1 2014) 1.1 49.4 (48.3)
Debt redemption costs (9.0% Notes) (Q3 2015) 19.5 - 19.5
Adjusted Cash Flows from Operating Activities (ACFFO) $105.3 $92.4 $12.9
Term loan facility repayments (2) (68.3) (58.4) (9.9)
Project-level debt repayments (15.1) (11.7) (3.4)
Purchases of property, plant and equipment (3) (11.3) (11.1) (0.2)
Distributions to noncontrolling interests (4) - - -
Dividends on preferred shares of a subsidiary company (8.8) (11.6) 2.8
Adjusted Free Cash Flow $1.8 ($0.3) $2.1(1)
Represents dif ference between Project Adjusted EBITDA and cash distribut ions from equity method projects.
(2) Includes 1% mandatory annual amort izat ion and 50% excess cash f low repayments by the Partnership.
(3) Excludes construct ion costs related to the Company’s Canadian Hills project in 2014.
(4) Distribut ions to noncontrolling interests primarily include distribut ions, if any, to the tax equity investors at Canadian Hills and to the other 50% owner of
Rockland. These projects were sold in June 2015.
Note: Project Adjusted EBITDA, Adjusted Cash Flows from Operat ing Activit ies and Adjusted Free Cash Flow are not recognized measures under GAAP
and do not have any standardized meanings prescribed by GAAP; therefore, these measures may not be comparable to similar measures presented by other
companies.
Cash Flow Metrics, Full Year 2015 vs Full Year 2014 – Continuing Operations Only ($ millions)
16
+ Higher ACFFO
+ Lower preferred dividend
payments (F/X rate)
- Higher debt amortization
Includes $19.5 interest expense
associated with redemption of
9.0% Notes (Q3 2015)
Includes $49.4 interest expense
associated with Q1 2014
transactions
Excludes $8.1 principal
repayment at Piedmont at term
loan conversion (Q1 2014)
Excludes amounts described
above
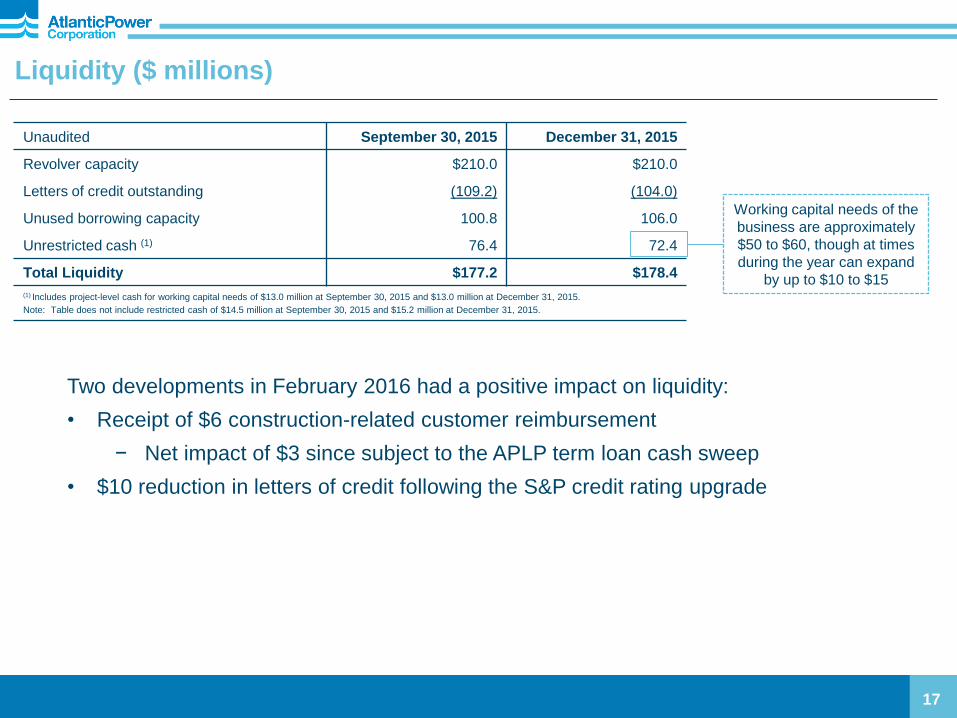
Liquidity ($ millions)
17
Unaudited September 30, 2015 December 31, 2015
Revolver capacity $210.0 $210.0
Letters of credit outstanding (109.2) (104.0)
Unused borrowing capacity 100.8 106.0
Unrestricted cash (1) 76.4 72.4
Total Liquidity $177.2 $178.4
(1) Includes project-level cash for working capital needs of $13.0 million at September 30, 2015 and $13.0 million at December 31, 2015.
Note: Table does not include restricted cash of $14.5 million at September 30, 2015 and $15.2 million at December 31, 2015.
Working capital needs of the
business are approximately
$50 to $60, though at times
during the year can expand
by up to $10 to $15
Two developments in February 2016 had a positive impact on liquidity:
• Receipt of $6 construction-related customer reimbursement
− Net impact of $3 since subject to the APLP term loan cash sweep
• $10 reduction in letters of credit following the S&P credit rating upgrade

Unaudited Consolidated
Total
December 31, 2013 $1,876
Refinancing, net (Q1 2014) 45
Repayment of convertible debenture (ATP.DB) at
maturity
Amortization:
(41)
Term loan (127)
Project-level debt (41)
Discretionary debt repurchases:
9.0% Senior Unsecured Notes (9)
Convertible debentures (NCIB) (25)
Sale of Wind assets – consolidated project debt (249)
Redemption of 9.0% Senior Unsecured Notes (311)
F/X impact (unrealized) (100)
December 31, 2015 $1,018
Progress on Debt Reduction ($ millions)
18
• Consolidated debt has been reduced a total of
$757 million since year end 2013
- Amortization of project-level debt and term
loan: $168 million
- Discretionary debt repurchases: $34
million
- Debt associated with Wind assets (sold):
$249 million
- Redemption of 9.0% Notes: $311 million
- Excludes F/X impact of $100 million
• Project-level debt at equity-owned projects
reduced by $76 million since year end 2013
(mostly for Wind)
• Total debt reduction of ~ $833 million ($757
consolidated + $76 equity method) (1)
- Cash interest savings of ~ $65 million
annualized
• Expect to amortize another $65 to $70 million
of term loan and project-level debt annually
over the next two years
Since YE 2013, total reduction in debt of ~ $833 million;
annual interest savings of more than $65 million
(1) Excludes unrealized impact of foreign currency changes on the Company’s debt (positive $100 million at December 31, 2015).
0
20
40
60
80
100
120
140
160
180
200
2016 2017 2018 2019 2020
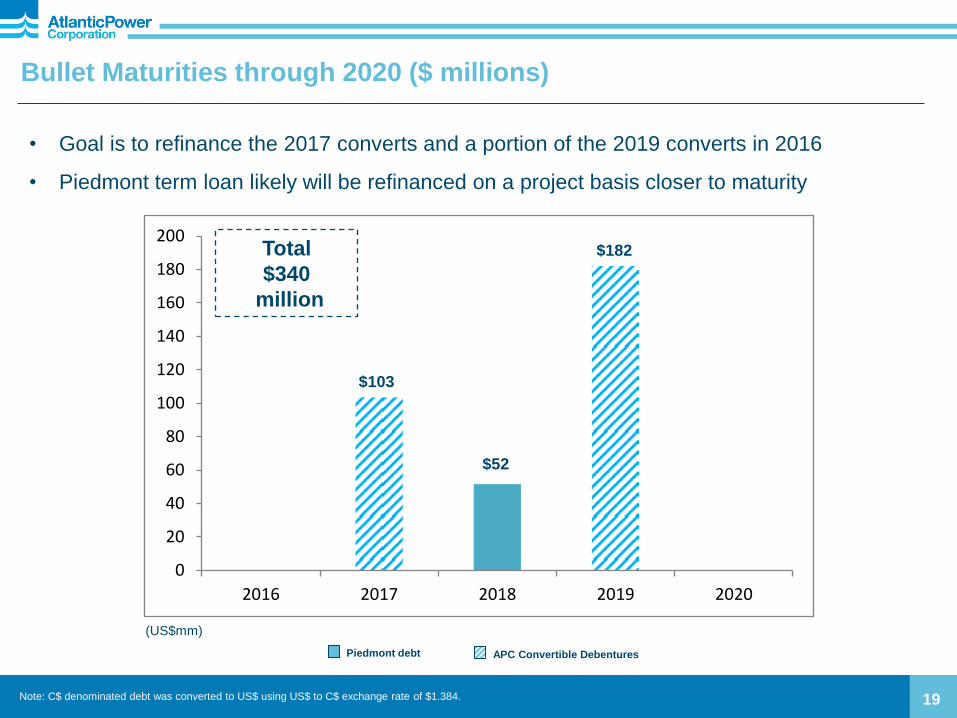
Bullet Maturities through 2020 ($ millions)
19 Note: C$ denominated debt was converted to US$ using US$ to C$ exchange rate of $1.384.
• Goal is to refinance the 2017 converts and a portion of the 2019 converts in 2016
• Piedmont term loan likely will be refinanced on a project basis closer to maturity
Total
$340
million
$52
Piedmont debt
(US$mm)
APC Convertible Debentures
$103
$182
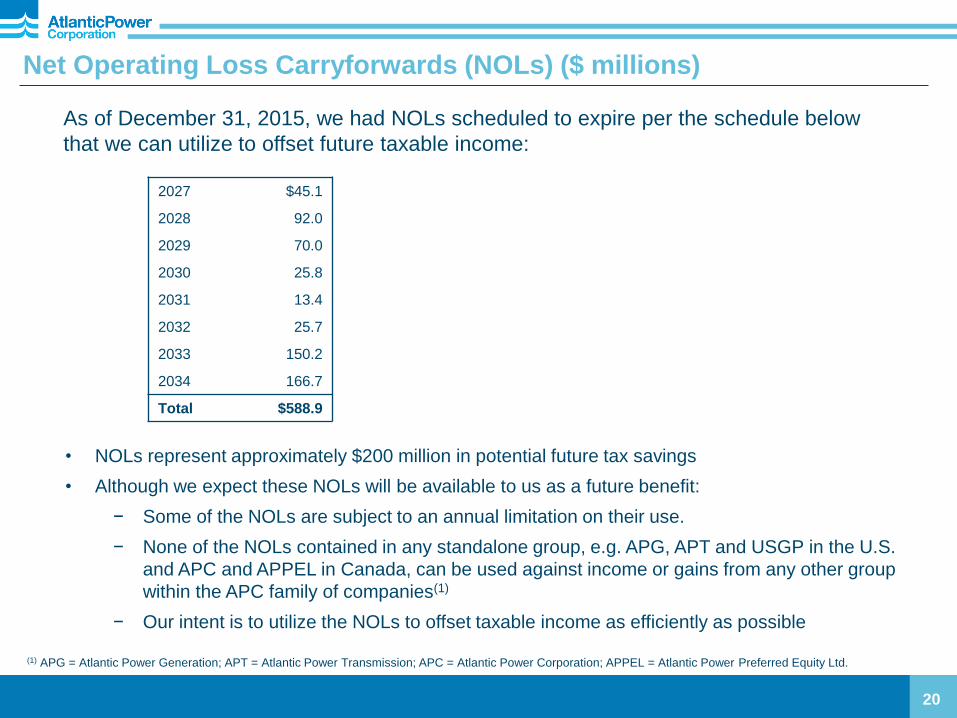
Net Operating Loss Carryforwards (NOLs) ($ millions)
20
2027 $45.1
2028 92.0
2029 70.0
2030 25.8
2031 13.4
2032 25.7
2033 150.2
2034 166.7
Total $588.9
• NOLs represent approximately $200 million in potential future tax savings
• Although we expect these NOLs will be available to us as a future benefit:
− Some of the NOLs are subject to an annual limitation on their use.
− None of the NOLs contained in any standalone group, e.g. APG, APT and USGP in the U.S.
and APC and APPEL in Canada, can be used against income or gains from any other group
within the APC family of companies(1)
− Our intent is to utilize the NOLs to offset taxable income as efficiently as possible
As of December 31, 2015, we had NOLs scheduled to expire per the schedule below
that we can utilize to offset future taxable income:
(1) APG = Atlantic Power Generation; APT = Atlantic Power Transmission; APC = Atlantic Power Corporation; APPEL = Atlantic Power Preferred Equity Ltd.
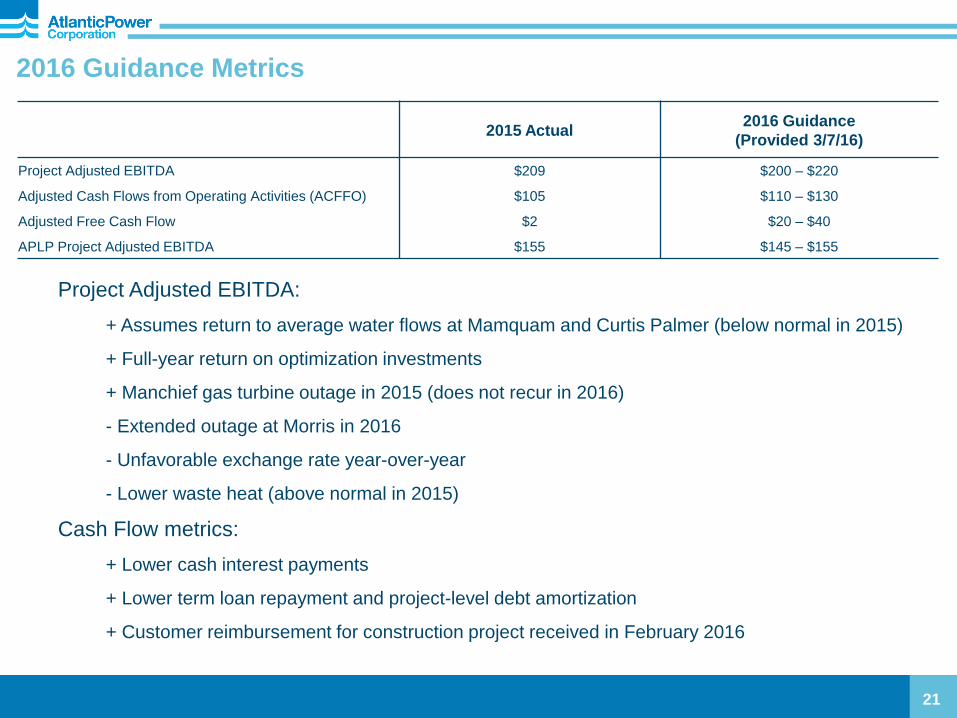
Project Adjusted EBITDA:
+ Assumes return to average water flows at Mamquam and Curtis Palmer (below normal in 2015)
+ Full-year return on optimization investments
+ Manchief gas turbine outage in 2015 (does not recur in 2016)
- Extended outage at Morris in 2016
- Unfavorable exchange rate year-over-year
- Lower waste heat (above normal in 2015)
Cash Flow metrics:
+ Lower cash interest payments
+ Lower term loan repayment and project-level debt amortization
+ Customer reimbursement for construction project received in February 2016
2016 Guidance Metrics
21
2015 Actual 2016 Guidance
(Provided 3/7/16)
Project Adjusted EBITDA $209 $200 – $220
Adjusted Cash Flows from Operating Activities (ACFFO) $105 $110 – $130
Adjusted Free Cash Flow $2 $20 – $40
APLP Project Adjusted EBITDA $155 $145 – $155

2016 Project Adjusted EBITDA Guidance – by Key Drivers ($ millions) 2015 Actual $209; 2016 Guidance $200 to $220
22 22
Continuing
Operations
$209
Optimization
Incremental
return vs.
2015
Guidance
$200 - $220
Water
Assumes
return to
average flows
for Mamquam,
Curtis Palmer
$7
$2
$(8)
FX Impact
$(5)
Waste Heat
High levels in
2015 Other
Reduced expenses at
Un-allocated Corp;
contractual increases in
capacity payments;
lower maintenance
expenses at Manchief,
partially offset by higher
maintenance associated
with Morris extended
outage
$4
Unfavorable FX rates, lower waste heat and Morris’ extended shutdown mostly offset by lower
maintenance at other projects, higher water flows and a full-year optimization benefit
FY 2016 FY 2015
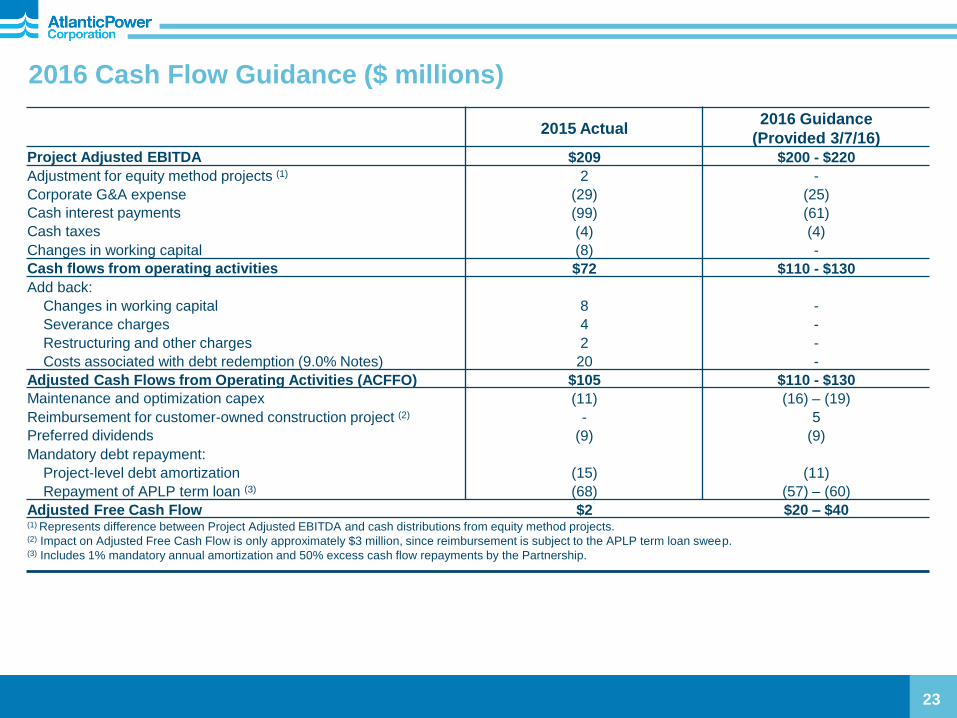
2015 Actual 2016 Guidance
(Provided 3/7/16) Project Adjusted EBITDA $209 $200 - $220
Adjustment for equity method projects (1) 2 -
Corporate G&A expense (29) (25)
Cash interest payments (99) (61)
Cash taxes (4) (4)
Changes in working capital (8) -
Cash flows from operating activities $72 $110 - $130
Add back:
Changes in working capital 8 -
Severance charges 4 -
Restructuring and other charges 2 -
Costs associated with debt redemption (9.0% Notes) 20 -
Adjusted Cash Flows from Operating Activities (ACFFO) $105 $110 - $130
Maintenance and optimization capex (11) (16) – (19)
Reimbursement for customer-owned construction project (2) - 5
Preferred dividends (9) (9)
Mandatory debt repayment:
Project-level debt amortization (15) (11)
Repayment of APLP term loan (3) (68) (57) – (60)
Adjusted Free Cash Flow $2 $20 – $40 (1) Represents difference between Project Adjusted EBITDA and cash distributions from equity method projects. (2) Impact on Adjusted Free Cash Flow is only approximately $3 million, since reimbursement is subject to the APLP term loan sweep. (3) Includes 1% mandatory annual amortization and 50% excess cash flow repayments by the Partnership.
2016 Cash Flow Guidance ($ millions)
23
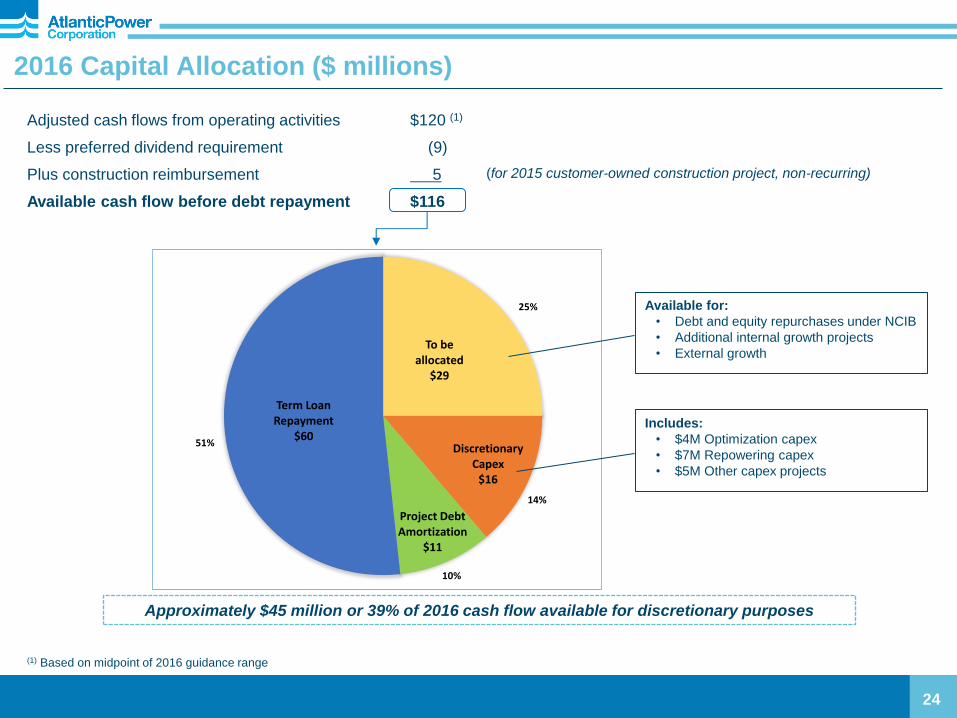
To be allocated
$29
Discretionary Capex
$16
Project Debt Amortization
$11
Term Loan Repayment
$60
25%
51%
14%
10%
2016 Capital Allocation ($ millions)
24
Adjusted cash flows from operating activities $120 (1)
Less preferred dividend requirement (9)
Plus construction reimbursement 5
Available cash flow before debt repayment $116
(1) Based on midpoint of 2016 guidance range
Approximately $45 million or 39% of 2016 cash flow available for discretionary purposes
Available for:
• Debt and equity repurchases under NCIB
• Additional internal growth projects
• External growth
Includes:
• $4M Optimization capex
• $7M Repowering capex
• $5M Other capex projects
(for 2015 customer-owned construction project, non-recurring)
Appendix
25
• Financial Results, Q4 and Full Year 2015 v. Q4 and Full Year 2014 (Slide 26)
• Segment Results, Q4 and Full Year 2015 v. Q4 and Full Year 2014 (Slide 27)
• Cash Flow, Q4 2015 to Q4 2014 (Slide 28)
• Cash Flow, Full Year 2015 to Full Year 2014 (Slide 29)
• G&A and Development Expenses (Slide 30)
• 2016 Project Adjusted EBITDA Guidance – by Projects (Slide 31)
• Organizational Structure (Slide 32)
• Capital Summary at December 31, 2015 (Slide 33)
• Capitalization (Slide 34)
• Debt Schedule at December 31, 2015 (Slide 35)
• Calculation of APLP Cash Sweep (Slide 36)
• Portfolio Diversity (Slide 37)
• PPA Length and Offtaker Credit Rating (Slide 38)
• Regulation G Disclosure (Slide 39)
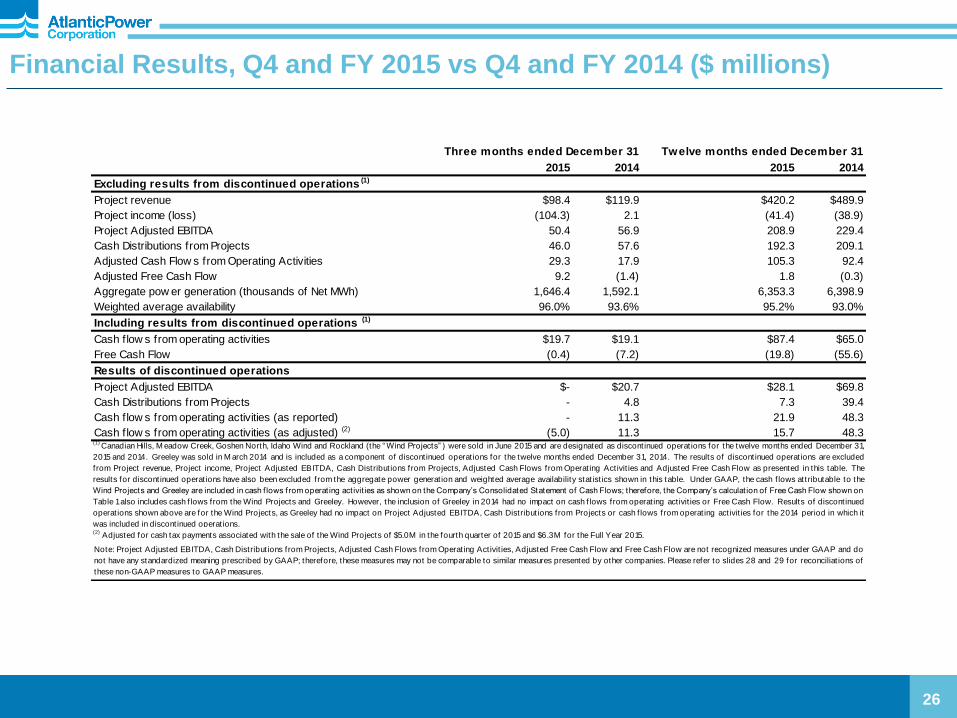
Financial Results, Q4 and FY 2015 vs Q4 and FY 2014 ($ millions)
26
2015 2014 2015 2014
Excluding results from discontinued operations (1)
Project revenue $98.4 $119.9 $420.2 $489.9
Project income (loss) (104.3) 2.1 (41.4) (38.9)
Project Adjusted EBITDA 50.4 56.9 208.9 229.4
Cash Distributions from Projects 46.0 57.6 192.3 209.1
Adjusted Cash Flow s from Operating Activities 29.3 17.9 105.3 92.4
Adjusted Free Cash Flow 9.2 (1.4) 1.8 (0.3)
Aggregate pow er generation (thousands of Net MWh) 1,646.4 1,592.1 6,353.3 6,398.9
Weighted average availability 96.0% 93.6% 95.2% 93.0%
Including results from discontinued operations (1)
Cash flow s from operating activities $19.7 $19.1 $87.4 $65.0
Free Cash Flow (0.4) (7.2) (19.8) (55.6)
Results of discontinued operations
Project Adjusted EBITDA $- $20.7 $28.1 $69.8
Cash Distributions from Projects - 4.8 7.3 39.4
Cash flow s from operating activities (as reported) - 11.3 21.9 48.3
Cash flow s from operating activities (as adjusted) (2) (5.0) 11.3 15.7 48.3(1)
Canadian Hills, M eadow Creek, Goshen North, Idaho Wind and Rockland (the “ Wind Projects” ) were sold in June 2015 and are designated as discontinued operat ions for the twelve months ended December 31,
2015 and 2014. Greeley was sold in M arch 2014 and is included as a component of discontinued operat ions for the twelve months ended December 31, 2014. The results of discontinued operat ions are excluded
from Project revenue, Project income, Project Adjusted EBITDA, Cash Distribut ions from Projects, Adjusted Cash Flows from Operat ing Activit ies and Adjusted Free Cash Flow as presented in this table. The
results for discontinued operat ions have also been excluded from the aggregate power generat ion and weighted average availability stat ist ics shown in this table. Under GAAP, the cash flows attributable to the
Wind Projects and Greeley are included in cash f lows from operat ing act ivit ies as shown on the Company’s Consolidated Statement of Cash Flows; therefore, the Company’s calculat ion of Free Cash Flow shown on
Table 1also includes cash flows from the Wind Projects and Greeley. However, the inclusion of Greeley in 2014 had no impact on cash flows from operat ing activit ies or Free Cash Flow. Results of discontinued
operat ions shown above are for the Wind Projects, as Greeley had no impact on Project Adjusted EBITDA, Cash Distribut ions from Projects or cash f lows from operat ing activit ies for the 2014 period in which it
was included in discontinued operat ions.
Note: Project Adjusted EBITDA, Cash Distribut ions from Projects, Adjusted Cash Flows from Operat ing Activit ies, Adjusted Free Cash Flow and Free Cash Flow are not recognized measures under GAAP and do
not have any standardized meaning prescribed by GAAP; therefore, these measures may not be comparable to similar measures presented by other companies. Please refer to slides 28 and 29 for reconciliat ions of
these non-GAAP measures to GAAP measures.
Three months ended December 31 Twelve months ended December 31
(2) Adjusted for cash tax payments associated with the sale of the Wind Projects of $5.0M in the fourth quarter of 2015 and $6.3M for the Full Year 2015.
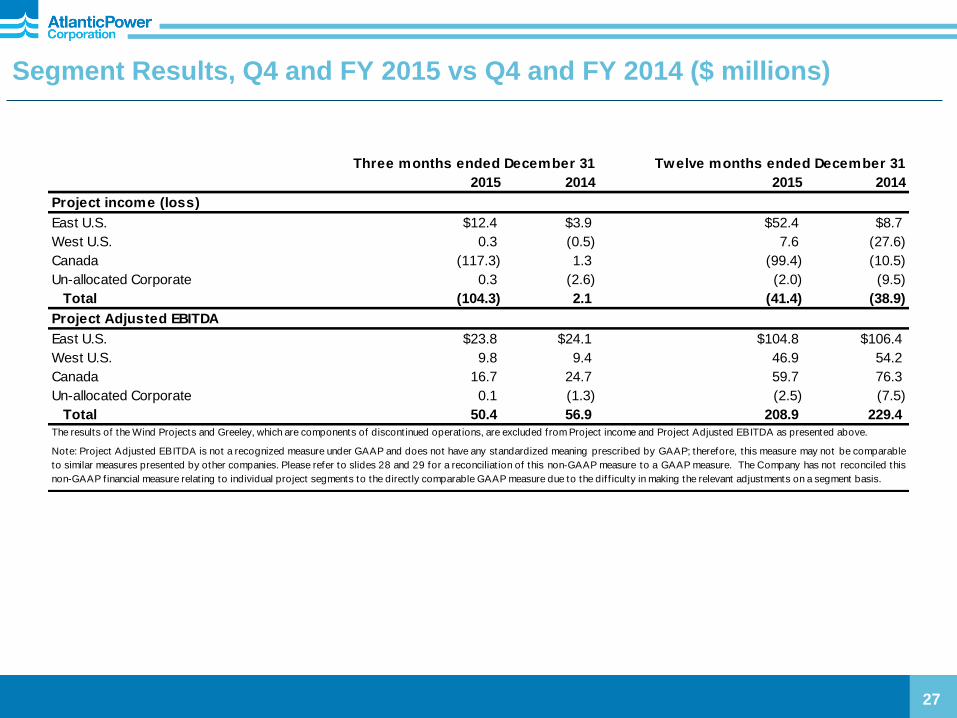
27
Segment Results, Q4 and FY 2015 vs Q4 and FY 2014 ($ millions)
2015 2014 2015 2014
Project income (loss)
East U.S. $12.4 $3.9 $52.4 $8.7
West U.S. 0.3 (0.5) 7.6 (27.6)
Canada (117.3) 1.3 (99.4) (10.5)
Un-allocated Corporate 0.3 (2.6) (2.0) (9.5)
Total (104.3) 2.1 (41.4) (38.9)
Project Adjusted EBITDA
East U.S. $23.8 $24.1 $104.8 $106.4
West U.S. 9.8 9.4 46.9 54.2
Canada 16.7 24.7 59.7 76.3
Un-allocated Corporate 0.1 (1.3) (2.5) (7.5)
Total 50.4 56.9 208.9 229.4
The results of the Wind Projects and Greeley, which are components of discontinued operat ions, are excluded from Project income and Project Adjusted EBITDA as presented above.
Note: Project Adjusted EBITDA is not a recognized measure under GAAP and does not have any standardized meaning prescribed by GAAP; therefore, this measure may not be comparable
to similar measures presented by other companies. Please refer to slides 28 and 29 for a reconciliat ion of this non-GAAP measure to a GAAP measure. The Company has not reconciled this
non-GAAP f inancial measure relat ing to individual project segments to the direct ly comparable GAAP measure due to the dif f iculty in making the relevant adjustments on a segment basis.
Three months ended December 31 Twelve months ended December 31
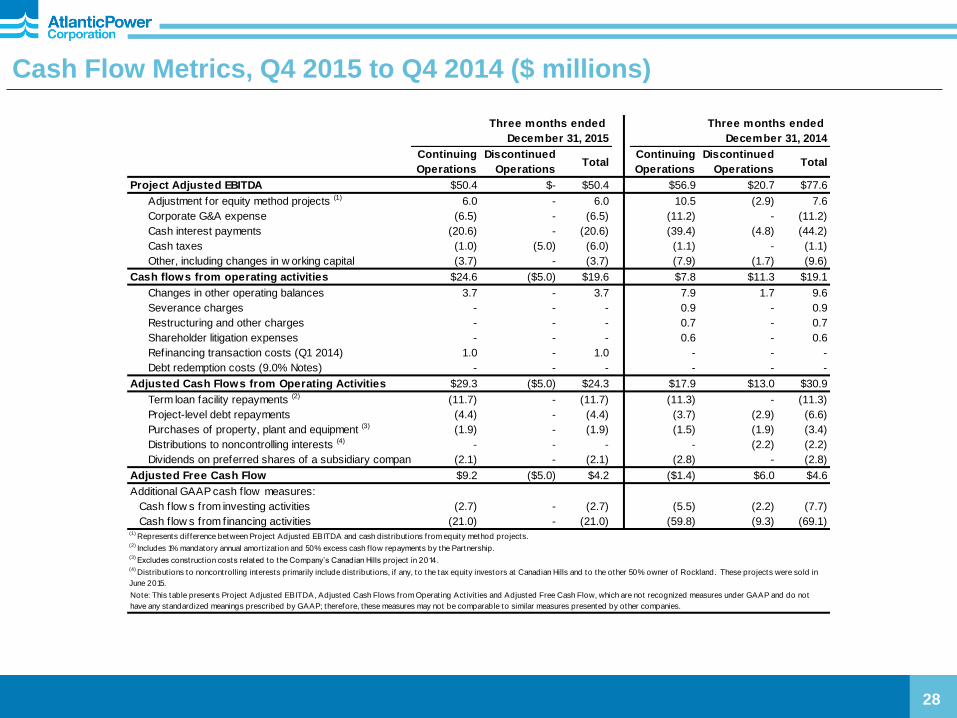
Cash Flow Metrics, Q4 2015 to Q4 2014 ($ millions)
28
Three months ended Three months ended
December 31, 2015 December 31, 2014
Continuing
Operations
Discontinued
OperationsTotal
Continuing
Operations
Discontinued
OperationsTotal
Project Adjusted EBITDA $50.4 $- $50.4 $56.9 $20.7 $77.6
Adjustment for equity method projects (1) 6.0 - 6.0 10.5 (2.9) 7.6
Corporate G&A expense (6.5) - (6.5) (11.2) - (11.2)
Cash interest payments (20.6) - (20.6) (39.4) (4.8) (44.2)
Cash taxes (1.0) (5.0) (6.0) (1.1) - (1.1)
Other, including changes in w orking capital (3.7) - (3.7) (7.9) (1.7) (9.6)
Cash flows from operating activities $24.6 ($5.0) $19.6 $7.8 $11.3 $19.1
Changes in other operating balances 3.7 - 3.7 7.9 1.7 9.6
Severance charges - - - 0.9 - 0.9
Restructuring and other charges - - - 0.7 - 0.7
Shareholder litigation expenses - - - 0.6 - 0.6
Refinancing transaction costs (Q1 2014) 1.0 - 1.0 - - -
Debt redemption costs (9.0% Notes) - - - - - -
Adjusted Cash Flows from Operating Activities $29.3 ($5.0) $24.3 $17.9 $13.0 $30.9
Term loan facility repayments (2) (11.7) - (11.7) (11.3) - (11.3)
Project-level debt repayments (4.4) - (4.4) (3.7) (2.9) (6.6)
Purchases of property, plant and equipment (3) (1.9) - (1.9) (1.5) (1.9) (3.4)
Distributions to noncontrolling interests (4) - - - - (2.2) (2.2)
Dividends on preferred shares of a subsidiary company (2.1) - (2.1) (2.8) - (2.8)
Adjusted Free Cash Flow $9.2 ($5.0) $4.2 ($1.4) $6.0 $4.6
Additional GAAP cash flow measures:
Cash flow s from investing activities (2.7) - (2.7) (5.5) (2.2) (7.7)
Cash flow s from financing activities (21.0) - (21.0) (59.8) (9.3) (69.1)
(3) Excludes construct ion costs related to the Company’s Canadian Hills project in 2014.
(4) Distribut ions to noncontrolling interests primarily include distribut ions, if any, to the tax equity investors at Canadian Hills and to the other 50% owner of Rockland. These projects were sold in
June 2015.
Note: This table presents Project Adjusted EBITDA, Adjusted Cash Flows from Operat ing Act ivit ies and Adjusted Free Cash Flow, which are not recognized measures under GAAP and do not
have any standardized meanings prescribed by GAAP; therefore, these measures may not be comparable to similar measures presented by other companies.
(1) Represents dif ference between Project Adjusted EBITDA and cash distribut ions from equity method projects.
(2) Includes 1% mandatory annual amort izat ion and 50% excess cash f low repayments by the Partnership.
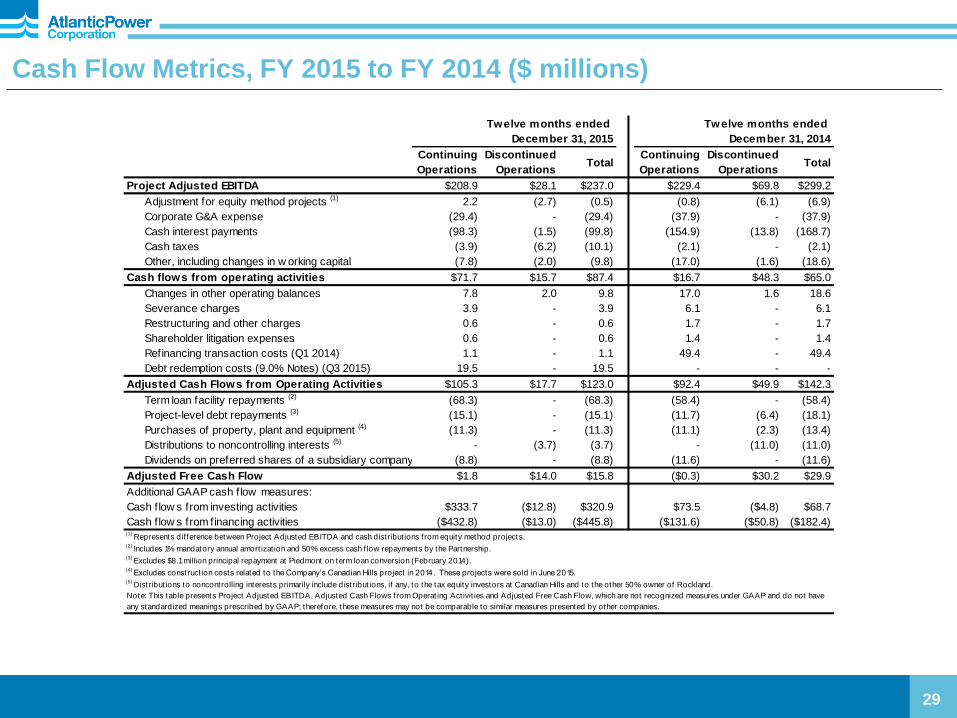
Cash Flow Metrics, FY 2015 to FY 2014 ($ millions)
29
Twelve months ended Twelve months ended
December 31, 2015 December 31, 2014
Continuing
Operations
Discontinued
OperationsTotal
Continuing
Operations
Discontinued
OperationsTotal
Project Adjusted EBITDA $208.9 $28.1 $237.0 $229.4 $69.8 $299.2
Adjustment for equity method projects (1) 2.2 (2.7) (0.5) (0.8) (6.1) (6.9)
Corporate G&A expense (29.4) - (29.4) (37.9) - (37.9)
Cash interest payments (98.3) (1.5) (99.8) (154.9) (13.8) (168.7)
Cash taxes (3.9) (6.2) (10.1) (2.1) - (2.1)
Other, including changes in w orking capital (7.8) (2.0) (9.8) (17.0) (1.6) (18.6)
Cash flows from operating activities $71.7 $15.7 $87.4 $16.7 $48.3 $65.0
Changes in other operating balances 7.8 2.0 9.8 17.0 1.6 18.6
Severance charges 3.9 - 3.9 6.1 - 6.1
Restructuring and other charges 0.6 - 0.6 1.7 - 1.7
Shareholder litigation expenses 0.6 - 0.6 1.4 - 1.4
Refinancing transaction costs (Q1 2014) 1.1 - 1.1 49.4 - 49.4
Debt redemption costs (9.0% Notes) (Q3 2015) 19.5 - 19.5 - - -
Adjusted Cash Flows from Operating Activities $105.3 $17.7 $123.0 $92.4 $49.9 $142.3
Term loan facility repayments (2) (68.3) - (68.3) (58.4) - (58.4)
Project-level debt repayments (3) (15.1) - (15.1) (11.7) (6.4) (18.1)
Purchases of property, plant and equipment (4) (11.3) - (11.3) (11.1) (2.3) (13.4)
Distributions to noncontrolling interests (5) - (3.7) (3.7) - (11.0) (11.0)
Dividends on preferred shares of a subsidiary company (8.8) - (8.8) (11.6) - (11.6)
Adjusted Free Cash Flow $1.8 $14.0 $15.8 ($0.3) $30.2 $29.9
Additional GAAP cash flow measures:
Cash flow s from investing activities $333.7 ($12.8) $320.9 $73.5 ($4.8) $68.7
Cash flow s from financing activities ($432.8) ($13.0) ($445.8) ($131.6) ($50.8) ($182.4)
Note: This table presents Project Adjusted EBITDA, Adjusted Cash Flows from Operat ing Act ivit ies and Adjusted Free Cash Flow, which are not recognized measures under GAAP and do not have
any standardized meanings prescribed by GAAP; therefore, these measures may not be comparable to similar measures presented by other companies.
(1) Represents dif ference between Project Adjusted EBITDA and cash distribut ions from equity method projects.
(2) Includes 1% mandatory annual amort izat ion and 50% excess cash f low repayments by the Partnership.
(4) Excludes construct ion costs related to the Company’s Canadian Hills project in 2014. These projects were sold in June 2015.
(5) Distribut ions to noncontrolling interests primarily include distribut ions, if any, to the tax equity investors at Canadian Hills and to the other 50% owner of Rockland.
(3) Excludes $8.1 million principal repayment at Piedmont on term loan conversion (February 2014).
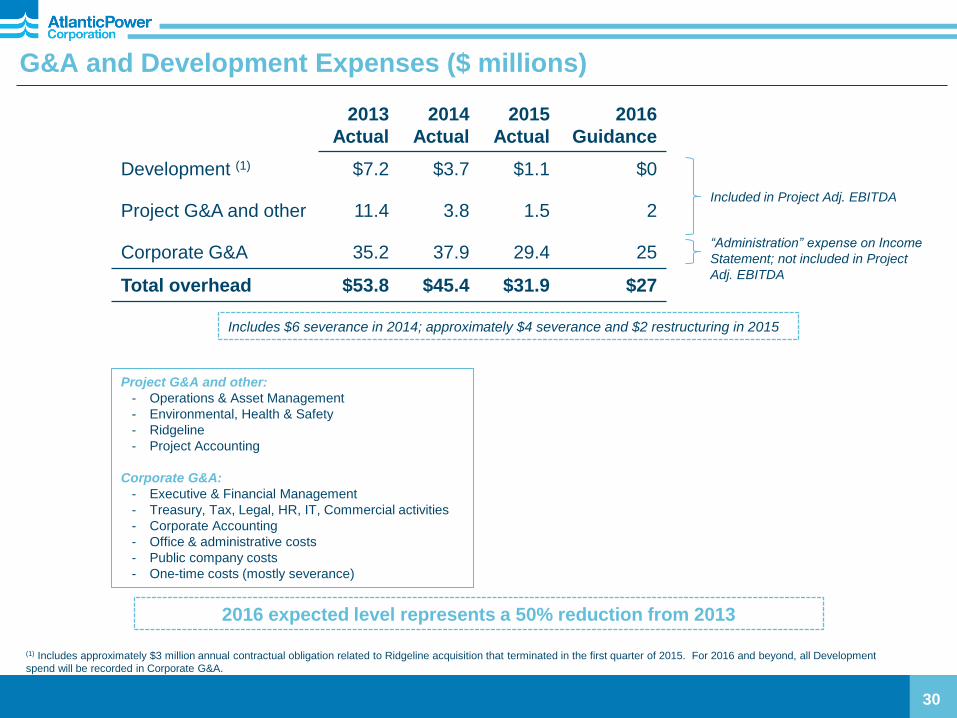
G&A and Development Expenses ($ millions)
30
2013
Actual
2014
Actual
2015
Actual
2016
Guidance
Development (1) $7.2 $3.7 $1.1 $0
Project G&A and other 11.4 3.8 1.5 2
Corporate G&A 35.2 37.9 29.4 25
Total overhead $53.8 $45.4 $31.9 $27
2016 expected level represents a 50% reduction from 2013
(1) Includes approximately $3 million annual contractual obligation related to Ridgeline acquisition that terminated in the first quarter of 2015. For 2016 and beyond, all Development
spend will be recorded in Corporate G&A.
Project G&A and other:
- Operations & Asset Management
- Environmental, Health & Safety
- Ridgeline
- Project Accounting
Corporate G&A:
- Executive & Financial Management
- Treasury, Tax, Legal, HR, IT, Commercial activities
- Corporate Accounting
- Office & administrative costs
- Public company costs
- One-time costs (mostly severance)
Includes $6 severance in 2014; approximately $4 severance and $2 restructuring in 2015
Included in Project Adj. EBITDA
“Administration” expense on Income
Statement; not included in Project
Adj. EBITDA
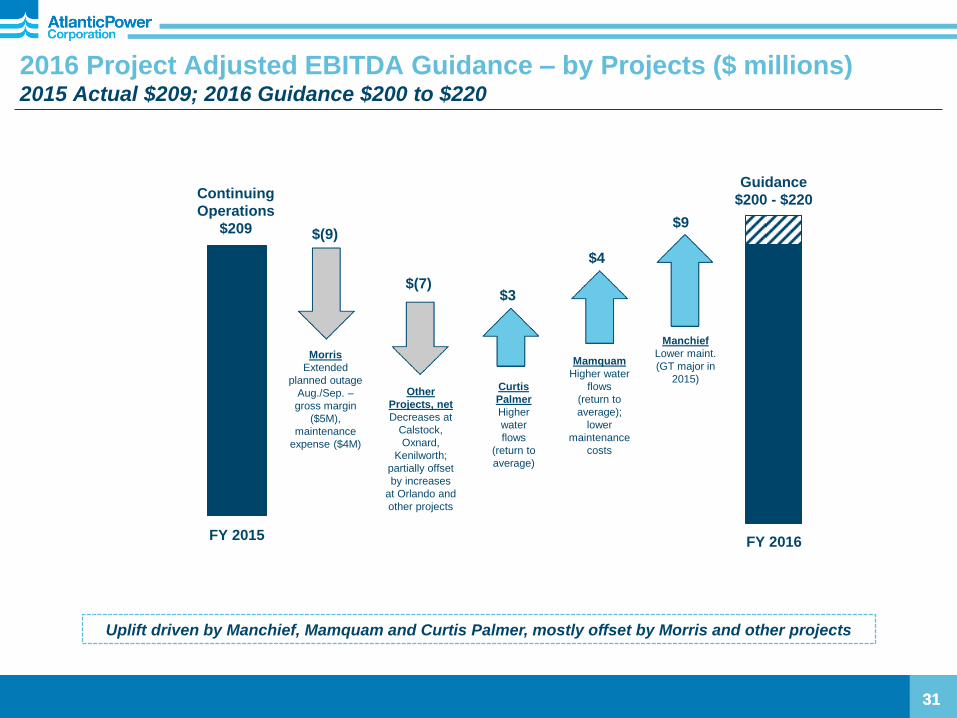
2016 Project Adjusted EBITDA Guidance – by Projects ($ millions) 2015 Actual $209; 2016 Guidance $200 to $220
31 31
Continuing
Operations
$209
Guidance
$200 - $220
Manchief
Lower maint.
(GT major in
2015)
$9
$(7)
$(9)
Other
Projects, net
Decreases at
Calstock,
Oxnard,
Kenilworth;
partially offset
by increases
at Orlando and
other projects
$4
Mamquam
Higher water
flows
(return to
average);
lower
maintenance
costs
Curtis
Palmer
Higher
water
flows
(return to
average)
$3
Morris
Extended
planned outage
Aug./Sep. –
gross margin
($5M),
maintenance
expense ($4M)
Uplift driven by Manchief, Mamquam and Curtis Palmer, mostly offset by Morris and other projects
FY 2016 FY 2015
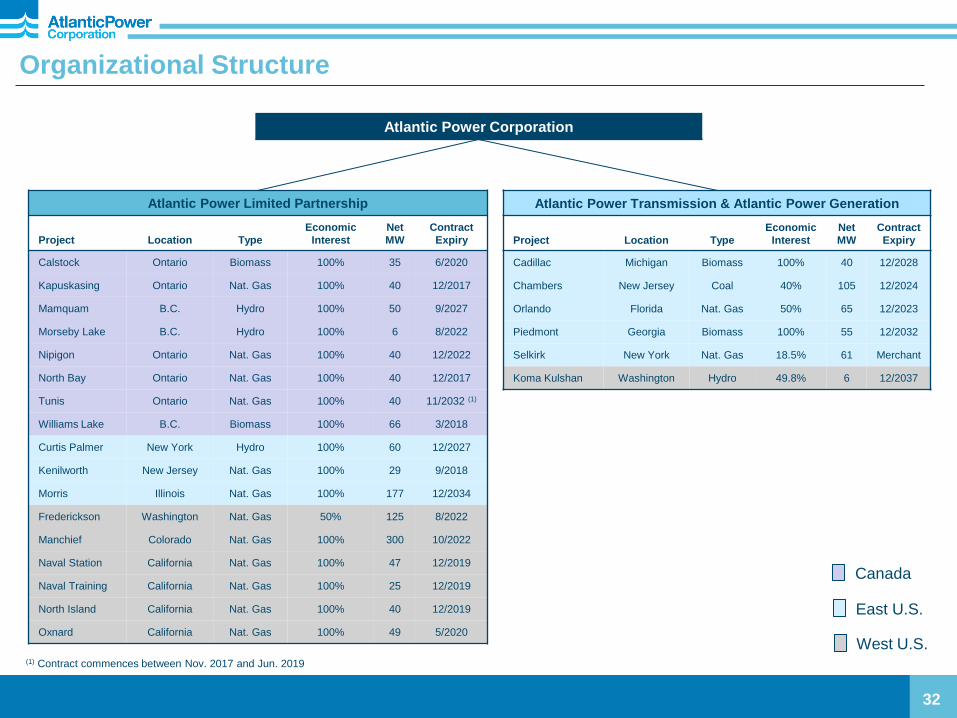
Atlantic Power Corporation
Atlantic Power Transmission & Atlantic Power Generation
Project Location Type
Economic
Interest
Net
MW
Contract
Expiry
Cadillac Michigan Biomass 100% 40 12/2028
Chambers New Jersey Coal 40% 105 12/2024
Orlando Florida Nat. Gas 50% 65 12/2023
Piedmont Georgia Biomass 100% 55 12/2032
Selkirk New York Nat. Gas 18.5% 61 Merchant
Koma Kulshan Washington Hydro 49.8% 6 12/2037
Atlantic Power Limited Partnership
Project Location Type
Economic
Interest
Net
MW
Contract
Expiry
Calstock Ontario Biomass 100% 35 6/2020
Kapuskasing Ontario Nat. Gas 100% 40 12/2017
Mamquam B.C. Hydro 100% 50 9/2027
Morseby Lake B.C. Hydro 100% 6 8/2022
Nipigon Ontario Nat. Gas 100% 40 12/2022
North Bay Ontario Nat. Gas 100% 40 12/2017
Tunis Ontario Nat. Gas 100% 40 11/2032 (1)
Williams Lake B.C. Biomass 100% 66 3/2018
Curtis Palmer New York Hydro 100% 60 12/2027
Kenilworth New Jersey Nat. Gas 100% 29 9/2018
Morris Illinois Nat. Gas 100% 177 12/2034
Frederickson Washington Nat. Gas 50% 125 8/2022
Manchief Colorado Nat. Gas 100% 300 10/2022
Naval Station California Nat. Gas 100% 47 12/2019
Naval Training California Nat. Gas 100% 25 12/2019
North Island California Nat. Gas 100% 40 12/2019
Oxnard California Nat. Gas 100% 49 5/2020
Organizational Structure
32
Canada
East U.S.
West U.S. (1) Contract commences between Nov. 2017 and Jun. 2019
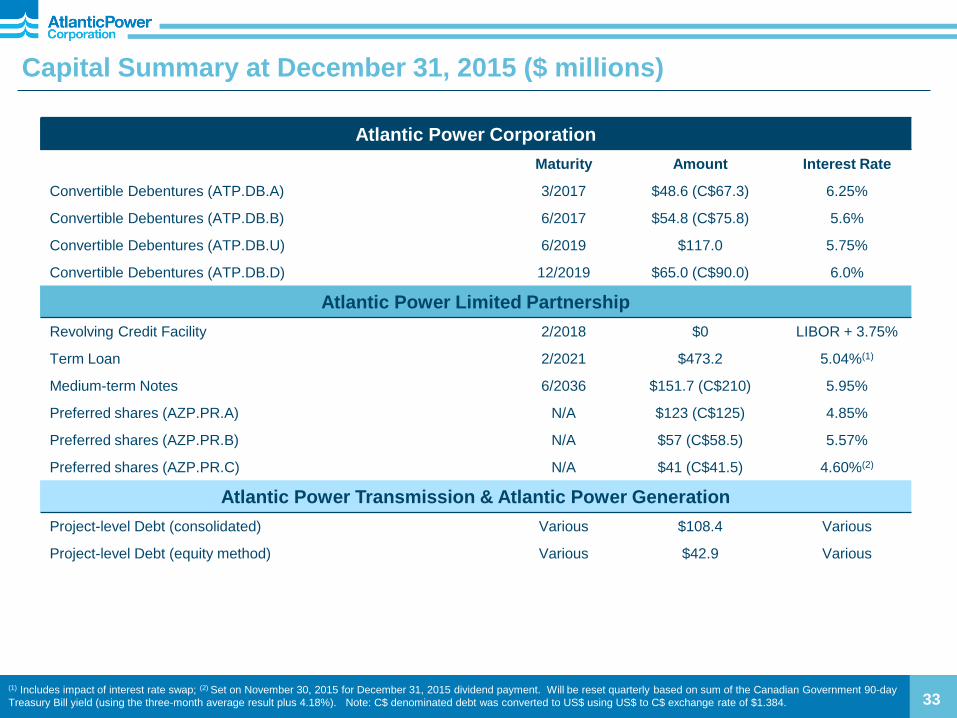
Capital Summary at December 31, 2015 ($ millions)
(1) Includes impact of interest rate swap; (2) Set on November 30, 2015 for December 31, 2015 dividend payment. Will be reset quarterly based on sum of the Canadian Government 90-day
Treasury Bill yield (using the three-month average result plus 4.18%). Note: C$ denominated debt was converted to US$ using US$ to C$ exchange rate of $1.384. 33
Atlantic Power Corporation
Maturity Amount Interest Rate
Convertible Debentures (ATP.DB.A) 3/2017 $48.6 (C$67.3) 6.25%
Convertible Debentures (ATP.DB.B) 6/2017 $54.8 (C$75.8) 5.6%
Convertible Debentures (ATP.DB.U) 6/2019 $117.0 5.75%
Convertible Debentures (ATP.DB.D) 12/2019 $65.0 (C$90.0) 6.0%
Atlantic Power Limited Partnership
Revolving Credit Facility 2/2018 $0 LIBOR + 3.75%
Term Loan 2/2021 $473.2 5.04%(1)
Medium-term Notes 6/2036 $151.7 (C$210) 5.95%
Preferred shares (AZP.PR.A) N/A $123 (C$125) 4.85%
Preferred shares (AZP.PR.B) N/A $57 (C$58.5) 5.57%
Preferred shares (AZP.PR.C) N/A $41 (C$41.5) 4.60%(2)
Atlantic Power Transmission & Atlantic Power Generation
Project-level Debt (consolidated) Various $108.4 Various
Project-level Debt (equity method) Various $42.9 Various

Capitalization ($ millions) Debt-to-capitalization ratio has improved to 70% at December 31, 2015 from 75% at YE 2014 (1)
34
December 31, 2014 (pre-Wind
sale) December 31, 2015
Long-term debt, incl. current portion
APC Senior Unsecured Notes (2) $320 -
APLP Medium-Term Notes (3) 181 $152
APLP revolving credit facility - -
APLP Term Loan 541 473
Project-level debt (non-recourse) 372 108
Convertible debentures (4) 341 285
Total long-term debt, incl. current portion $1,755 75% $1,018 70%
Preferred shares 221 10% 221 15%
Common equity (5) 356 15% 214 15%
Total shareholders equity 577 25% 435 30%
Total capitalization $2,332 100% $1,453 100%
(1) Improved ratio is due to sale of the Wind Projects, other debt reduction and F/X impacts, partially offset by the impairment charge recorded in 2015 (reduction to retained earnings and common equity).
(2) Redeemed July 2015
(3) Period-over-period change due to F/X impacts
(4) Period-over-period change due to F/X impacts and repurchases of convertible debentures under the NCIB of $21.8 million
(5) Common equity includes other comprehensive income and retained deficit
Note: Table is presented on a consolidated basis and excludes equity method projects
0
50
100
150
200
250
300
350
400
2016 2017 2018 2019 2020 Thereafter
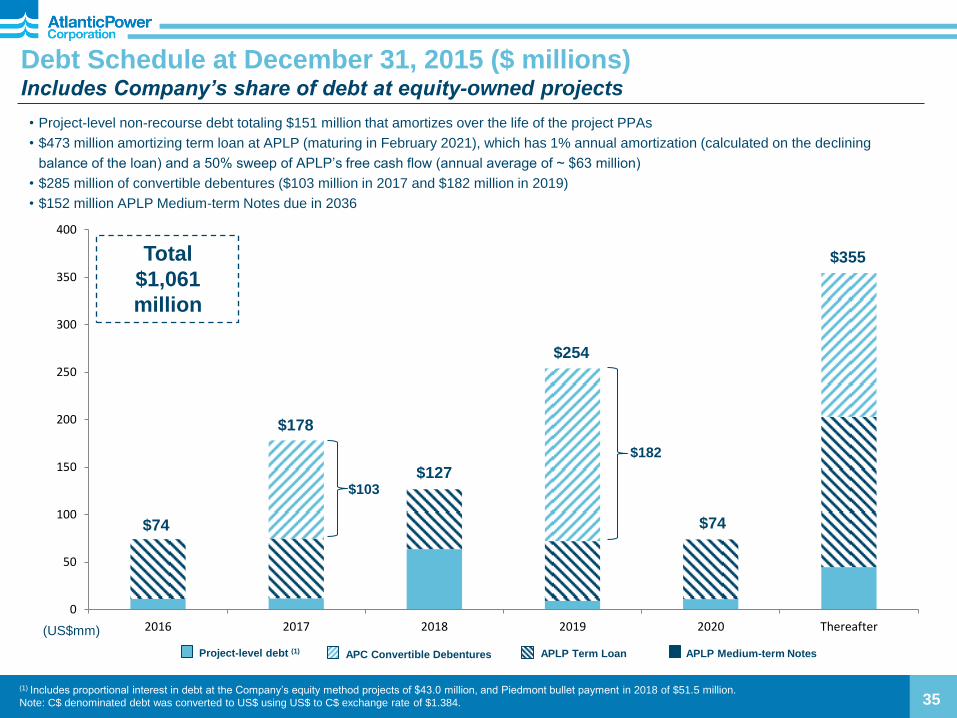
Debt Schedule at December 31, 2015 ($ millions) Includes Company’s share of debt at equity-owned projects
35 (1) Includes proportional interest in debt at the Company’s equity method projects of $43.0 million, and Piedmont bullet payment in 2018 of $51.5 million.
Note: C$ denominated debt was converted to US$ using US$ to C$ exchange rate of $1.384.
• Project-level non-recourse debt totaling $151 million that amortizes over the life of the project PPAs
• $473 million amortizing term loan at APLP (maturing in February 2021), which has 1% annual amortization (calculated on the declining
balance of the loan) and a 50% sweep of APLP’s free cash flow (annual average of ~ $63 million)
• $285 million of convertible debentures ($103 million in 2017 and $182 million in 2019)
• $152 million APLP Medium-term Notes due in 2036
Total
$1,061
million
$74
$178
$127
$254
$355
$74
APLP Term Loan Project-level debt (1)
(US$mm)
APLP Medium-term Notes APC Convertible Debentures
$103
$182
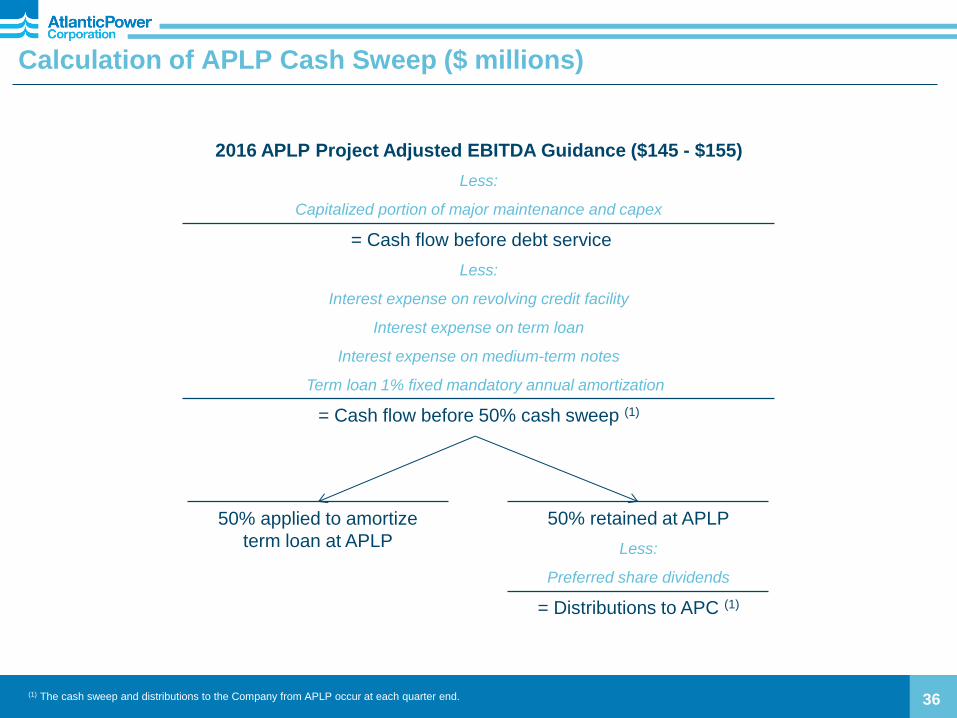
Calculation of APLP Cash Sweep ($ millions)
36
2016 APLP Project Adjusted EBITDA Guidance ($145 - $155)
Less:
Capitalized portion of major maintenance and capex
= Cash flow before debt service
Less:
Interest expense on revolving credit facility
Interest expense on term loan
Interest expense on medium-term notes
Term loan 1% fixed mandatory annual amortization
= Cash flow before 50% cash sweep (1)
(1) The cash sweep and distributions to the Company from APLP occur at each quarter end.
50% retained at APLP
Less:
Preferred share dividends
= Distributions to APC (1)
50% applied to amortize
term loan at APLP

East U.S.41%
West U.S.26%
Canada33%
Other6%
Curtis Palmer14%
Orlando11%
Chambers8%
Morris8%Nipigon
9%
Williams Lake7%
Frederickson6%
Naval Station5%
Piedmont4%
Calstock5%
North Island4%
Cadillac4%
Kapuskasing4%
North Bay3%
Manchief3%
East U.S.50%
West U.S.22%
Canada28%
No single project contributed more than 14% to Project Adjusted
EBITDA for the twelve months ended December 31, 2015 (1)
37
Earnings and Cash Flow Diversification by Project
(1) Based on $208.9 million in Project Adjusted EBITDA for the twelve months ended December 31, 2015; does not include Project Adjusted EBITDA from discontinued operations. Unallocated corporate segment
is included in “Other” category for project percentage allocation and allocated equally among segments for the Full Year 2015 Project Adjusted EBITDA by Segment. (2) Based on $192.2 million in Cash
Distributions from Projects for the twelve months ended December 31, 2015.
FY 2015 Cash Distributions from Projects by
Segment (2)
FY 2015 Project Adjusted EBITDA by Segment (1)
Capacity (MW) by
Segment
East U.S.: 39%
West U.S.: 40%
Canada: 21%
(8 projects)
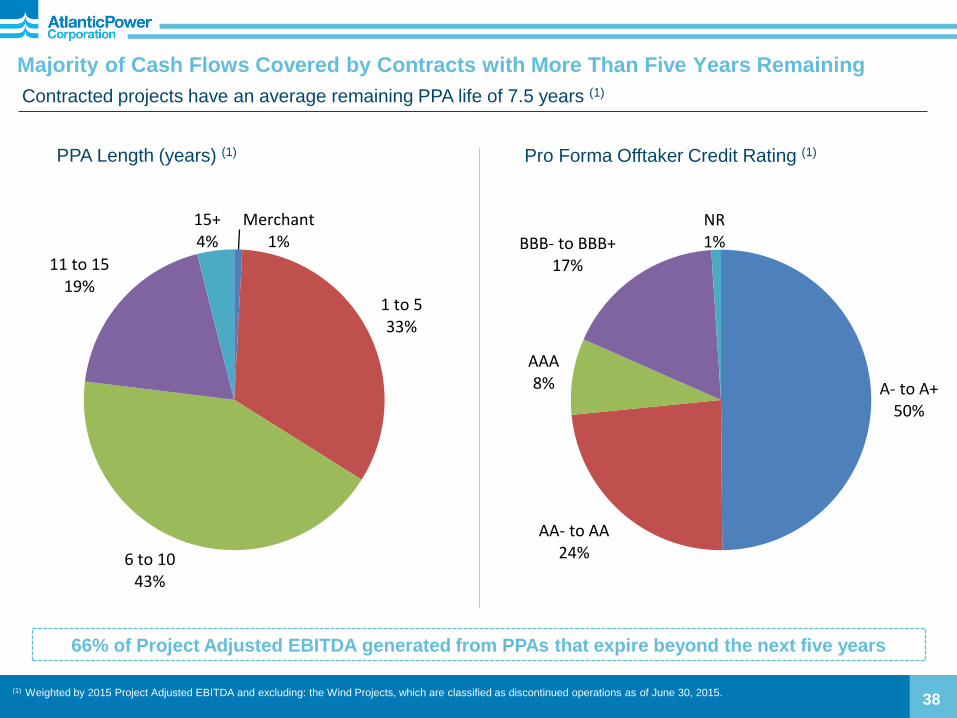
PPA Length (years) (1)
38
Majority of Cash Flows Covered by Contracts with More Than Five Years Remaining
Contracted projects have an average remaining PPA life of 7.5 years (1)
(1) Weighted by 2015 Project Adjusted EBITDA and excluding: the Wind Projects, which are classified as discontinued operations as of June 30, 2015.
Pro Forma Offtaker Credit Rating (1)
66% of Project Adjusted EBITDA generated from PPAs that expire beyond the next five years
A- to A+50%
AA- to AA24%
AAA8%
BBB- to BBB+17%
NR1%
Merchant1%
1 to 533%
6 to 1043%
11 to 1519%
15+4%
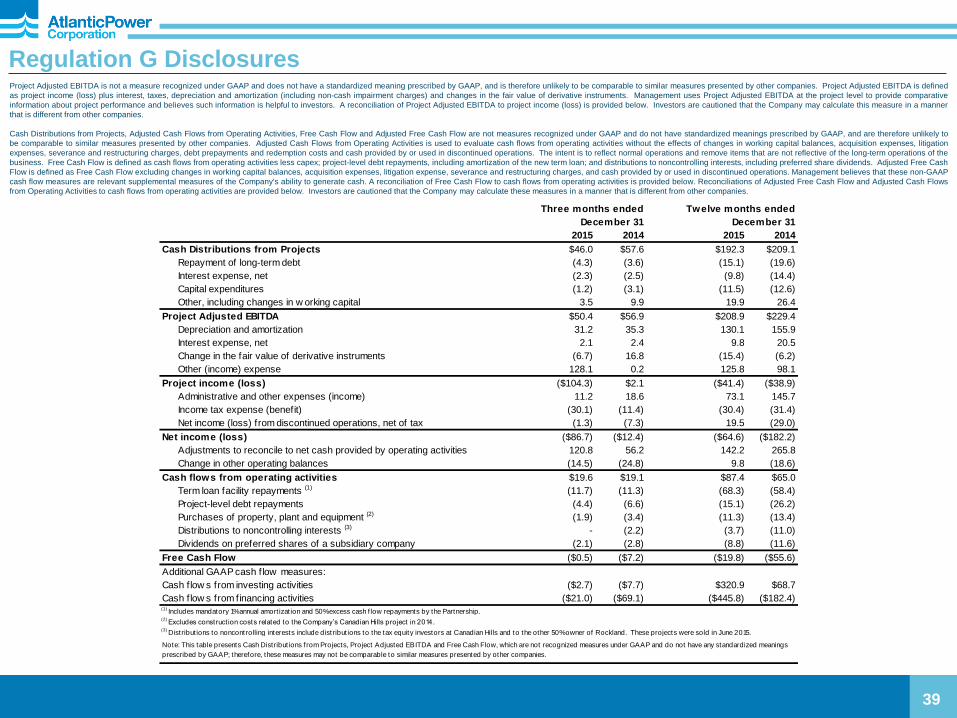
Regulation G Disclosures Project Adjusted EBITDA is not a measure recognized under GAAP and does not have a standardized meaning prescribed by GAAP, and is therefore unlikely to be comparable to similar measures presented by other companies. Project Adjusted EBITDA is defined
as project income (loss) plus interest, taxes, depreciation and amortization (including non-cash impairment charges) and changes in the fair value of derivative instruments. Management uses Project Adjusted EBITDA at the project level to provide comparative
information about project performance and believes such information is helpful to investors. A reconciliation of Project Adjusted EBITDA to project income (loss) is provided below. Investors are cautioned that the Company may calculate this measure in a manner
that is different from other companies.
Cash Distributions from Projects, Adjusted Cash Flows from Operating Activities, Free Cash Flow and Adjusted Free Cash Flow are not measures recognized under GAAP and do not have standardized meanings prescribed by GAAP, and are therefore unlikely to
be comparable to similar measures presented by other companies. Adjusted Cash Flows from Operating Activities is used to evaluate cash flows from operating activities without the effects of changes in working capital balances, acquisition expenses, litigation
expenses, severance and restructuring charges, debt prepayments and redemption costs and cash provided by or used in discontinued operations. The intent is to reflect normal operations and remove items that are not reflective of the long-term operations of the
business. Free Cash Flow is defined as cash flows from operating activities less capex; project-level debt repayments, including amortization of the new term loan; and distributions to noncontrolling interests, including preferred share dividends. Adjusted Free Cash
Flow is defined as Free Cash Flow excluding changes in working capital balances, acquisition expenses, litigation expense, severance and restructuring charges, and cash provided by or used in discontinued operations. Management believes that these non-GAAP
cash flow measures are relevant supplemental measures of the Company's ability to generate cash. A reconciliation of Free Cash Flow to cash flows from operating activities is provided below. Reconciliations of Adjusted Free Cash Flow and Adjusted Cash Flows
from Operating Activities to cash flows from operating activities are provided below. Investors are cautioned that the Company may calculate these measures in a manner that is different from other companies.
39
Three months ended Twelve months ended
December 31 December 31
2015 2014 2015 2014
Cash Distributions from Projects $46.0 $57.6 $192.3 $209.1
Repayment of long-term debt (4.3) (3.6) (15.1) (19.6)
Interest expense, net (2.3) (2.5) (9.8) (14.4)
Capital expenditures (1.2) (3.1) (11.5) (12.6)
Other, including changes in w orking capital 3.5 9.9 19.9 26.4
Project Adjusted EBITDA $50.4 $56.9 $208.9 $229.4
Depreciation and amortization 31.2 35.3 130.1 155.9
Interest expense, net 2.1 2.4 9.8 20.5
Change in the fair value of derivative instruments (6.7) 16.8 (15.4) (6.2)
Other (income) expense 128.1 0.2 125.8 98.1
Project income (loss) ($104.3) $2.1 ($41.4) ($38.9)
Administrative and other expenses (income) 11.2 18.6 73.1 145.7
Income tax expense (benefit) (30.1) (11.4) (30.4) (31.4)
Net income (loss) from discontinued operations, net of tax (1.3) (7.3) 19.5 (29.0)
Net income (loss) ($86.7) ($12.4) ($64.6) ($182.2)
Adjustments to reconcile to net cash provided by operating activities 120.8 56.2 142.2 265.8
Change in other operating balances (14.5) (24.8) 9.8 (18.6)
Cash flows from operating activities $19.6 $19.1 $87.4 $65.0
Term loan facility repayments (1) (11.7) (11.3) (68.3) (58.4)
Project-level debt repayments (4.4) (6.6) (15.1) (26.2)
Purchases of property, plant and equipment (2) (1.9) (3.4) (11.3) (13.4)
Distributions to noncontrolling interests (3) - (2.2) (3.7) (11.0)
Dividends on preferred shares of a subsidiary company (2.1) (2.8) (8.8) (11.6)
Free Cash Flow ($0.5) ($7.2) ($19.8) ($55.6)
Additional GAAP cash flow measures:
Cash flow s from investing activities ($2.7) ($7.7) $320.9 $68.7
Cash flow s from financing activities ($21.0) ($69.1) ($445.8) ($182.4)
Note: This table presents Cash Distribut ions from Projects, Project Adjusted EBITDA and Free Cash Flow, which are not recognized measures under GAAP and do not have any standardized meanings
prescribed by GAAP; therefore, these measures may not be comparable to similar measures presented by other companies.
(1) Includes mandatory 1% annual amort izat ion and 50% excess cash f low repayments by the Partnership.
(2) Excludes construct ion costs related to the Company’s Canadian Hills project in 2014.
(3) Distribut ions to noncontrolling interests include distribut ions to the tax equity investors at Canadian Hills and to the other 50% owner of Rockland. These projects were sold in June 2015.
Recommended


![Q4 FY 2016 Earnings Conference Call [Company Update]](https://img.pdfslide.net/doc/110x75/577c7a6b1a28abe054951e7e/q4-fy-2016-earnings-conference-call-company-update.jpg)