qPCR in forensic DNA analysis
Johannes HedmanResearcher, Applied Microbiology, Lund University
Specialist, Swedish National Laboratory of Forensic Science
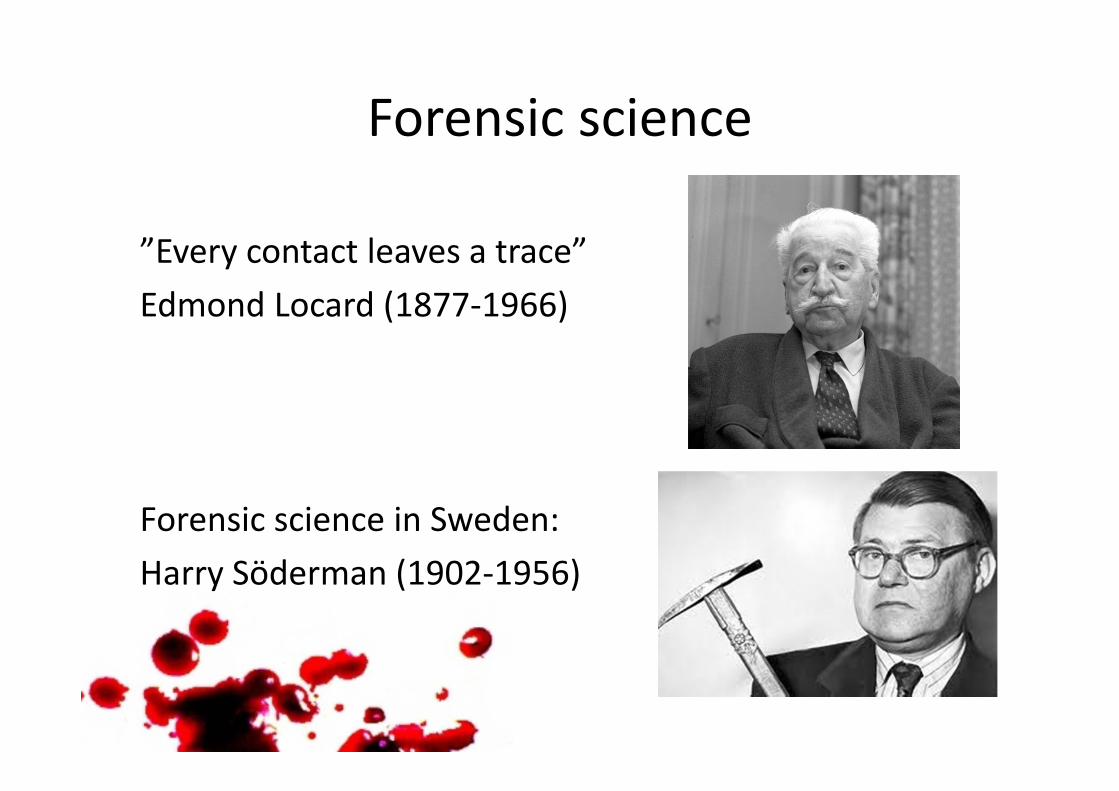
Forensic science
”Every contact leaves a trace”Edmond Locard (1877‐1966)
Forensic science in Sweden:Harry Söderman (1902‐1956)
What could serve as biological evidencefrom a crime scene?
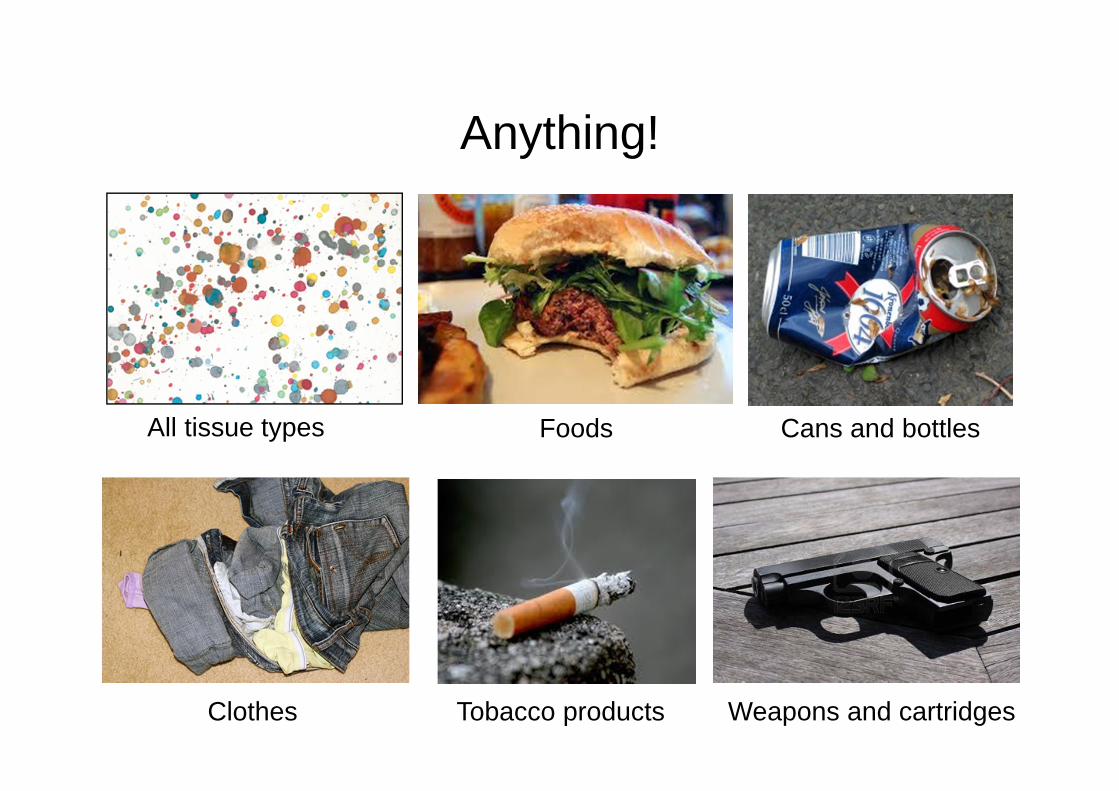
Anything!
Weapons and cartridges
Cans and bottlesFoods
Tobacco productsClothes
All tissue types
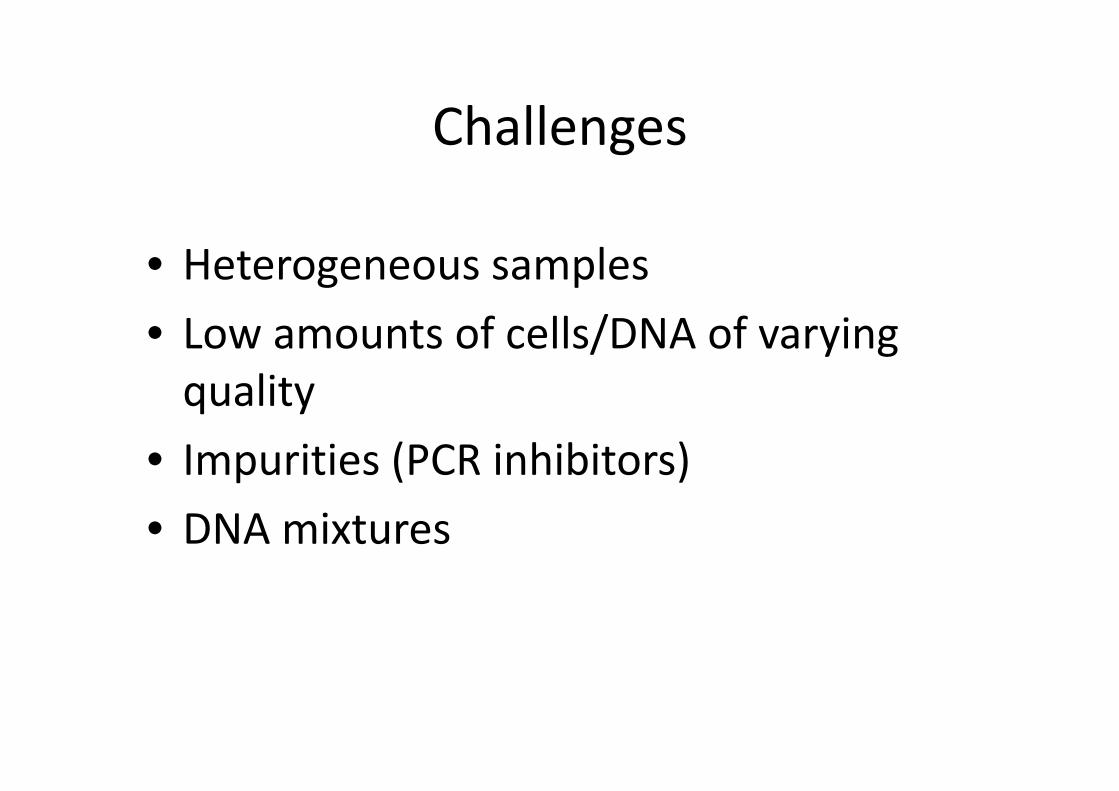
Challenges
• Heterogeneous samples• Low amounts of cells/DNA of varyingquality
• Impurities (PCR inhibitors)• DNA mixtures
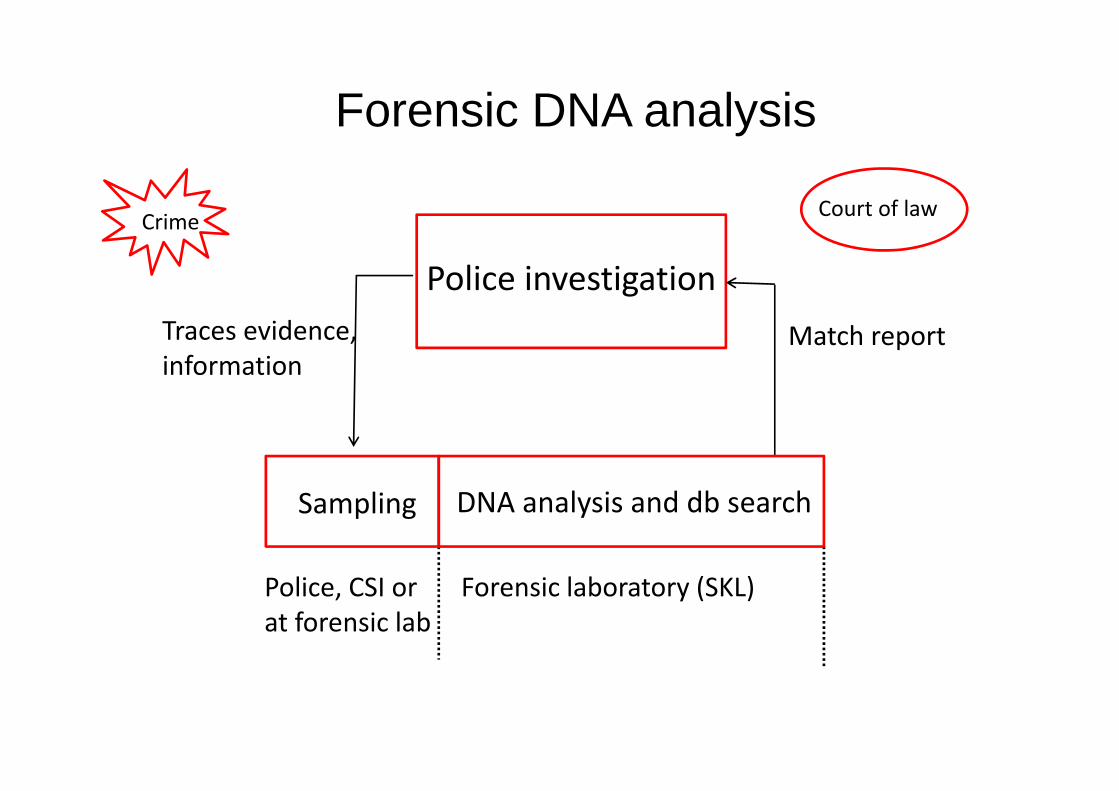
Forensic DNA analysis
Police, CSI or at forensic lab
Forensic laboratory (SKL)
Crime
Police investigationTraces evidence, information
Match report
Court of law
Sampling DNA analysis and db search
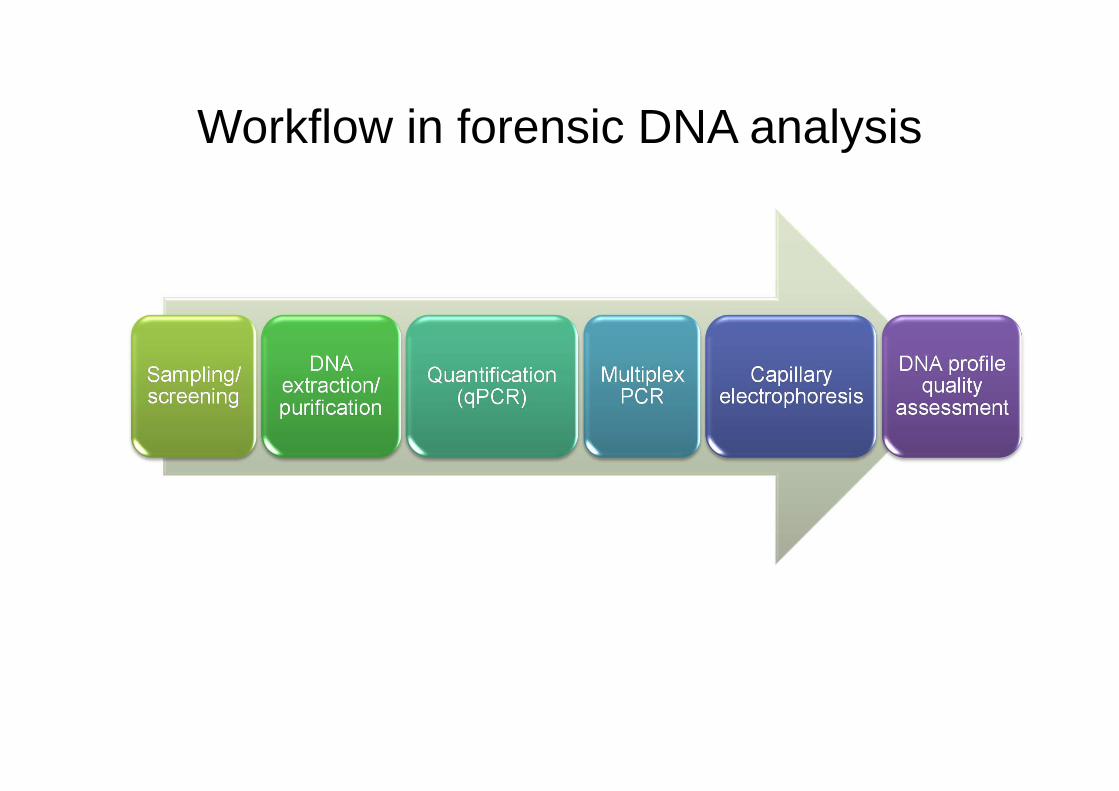
Workflow in forensic DNA analysis
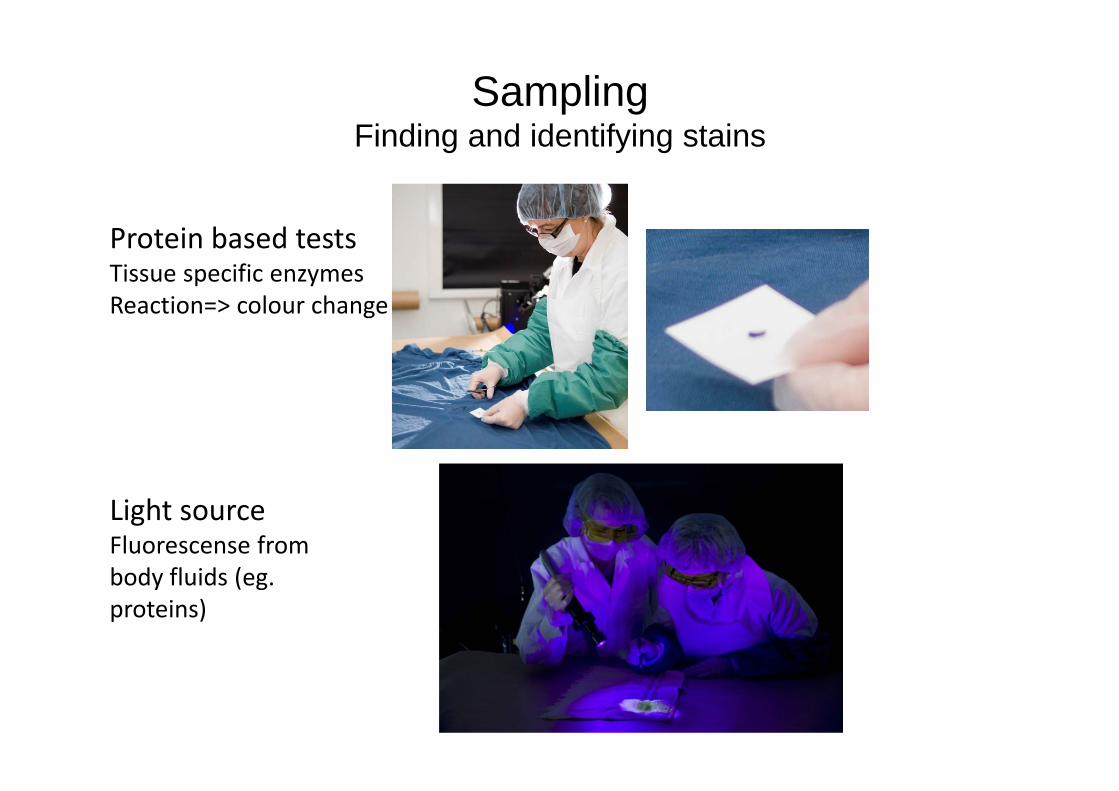
SamplingFinding and identifying stains
Protein based testsTissue specific enzymesReaction=> colour change
Light sourceFluorescense from body fluids (eg. proteins)
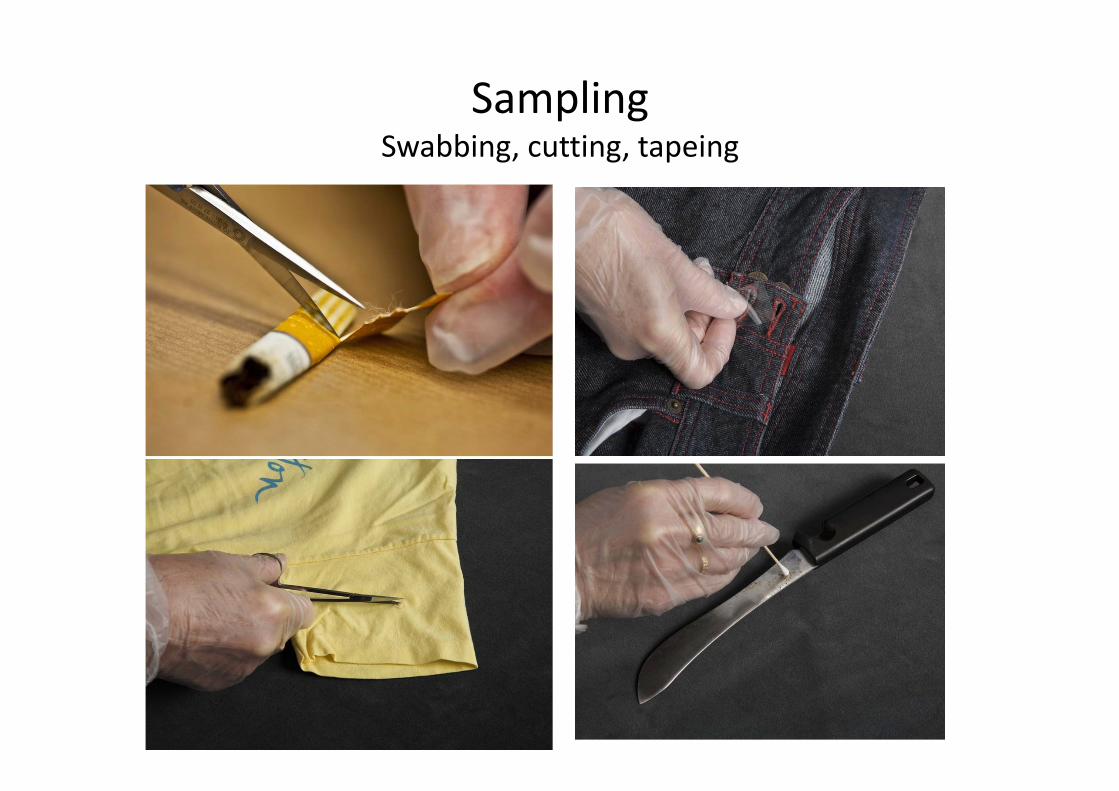
SamplingSwabbing, cutting, tapeing
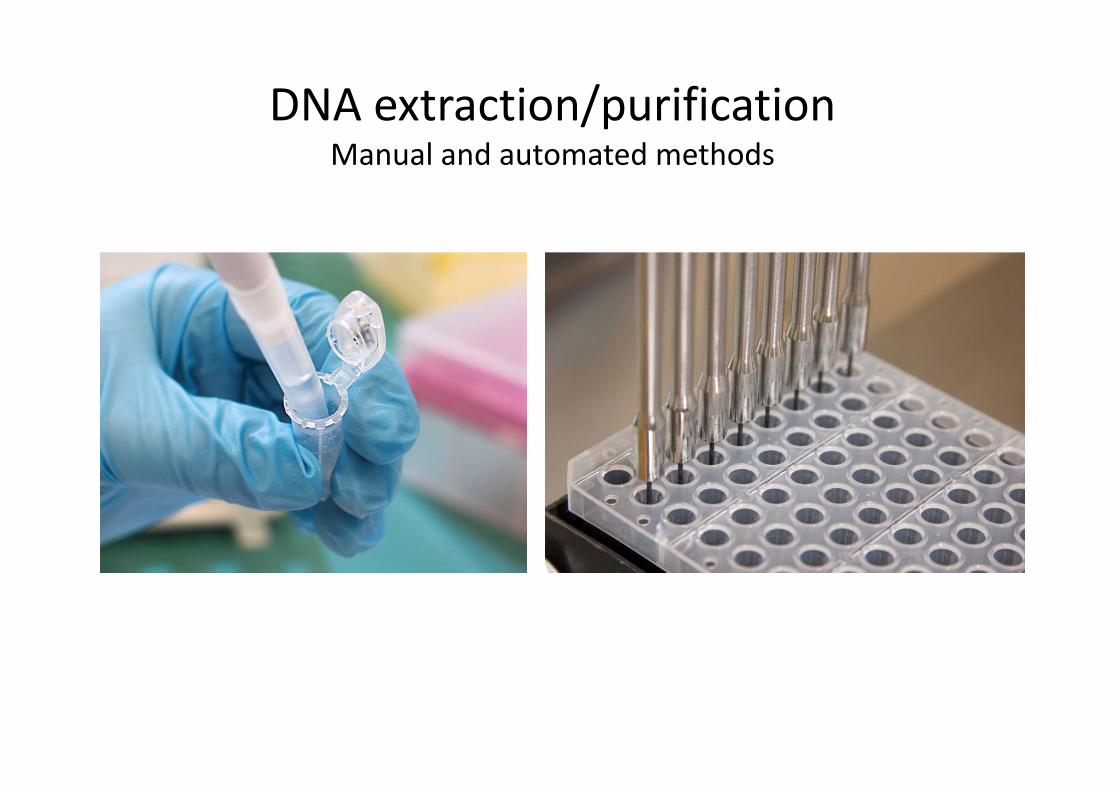
DNA extraction/purificationManual and automated methods
qPCR in forensic DNA analysis
• Quantification used for normalisation of DNA profiling PCR (Short tandem repeats, STR)
• Control of amplifiability (IAC)• Indication of DNA degradation• Commercial kits using hydrolysis probes(TaqMan)
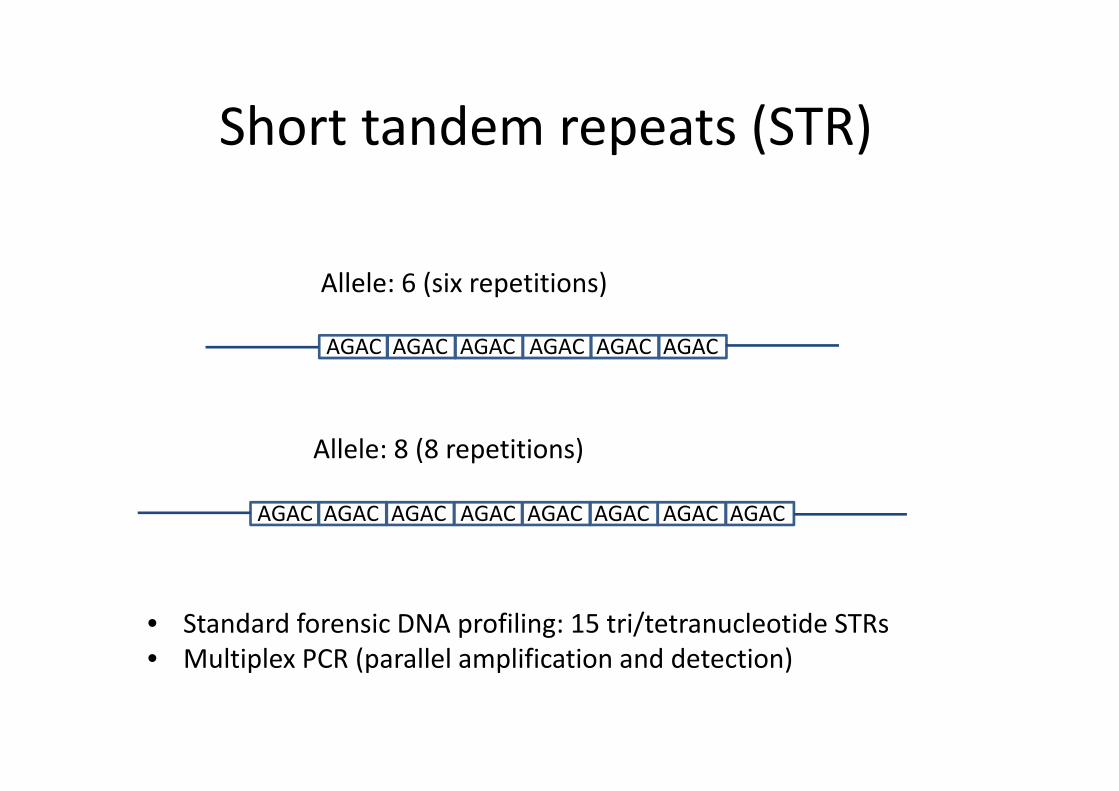
Short tandem repeats (STR)
• Standard forensic DNA profiling: 15 tri/tetranucleotide STRs• Multiplex PCR (parallel amplification and detection)
AGAC AGAC AGAC AGAC AGAC AGAC
AGAC AGAC AGAC AGAC AGAC AGAC AGAC AGAC
Allele: 6 (six repetitions)
Allele: 8 (8 repetitions)
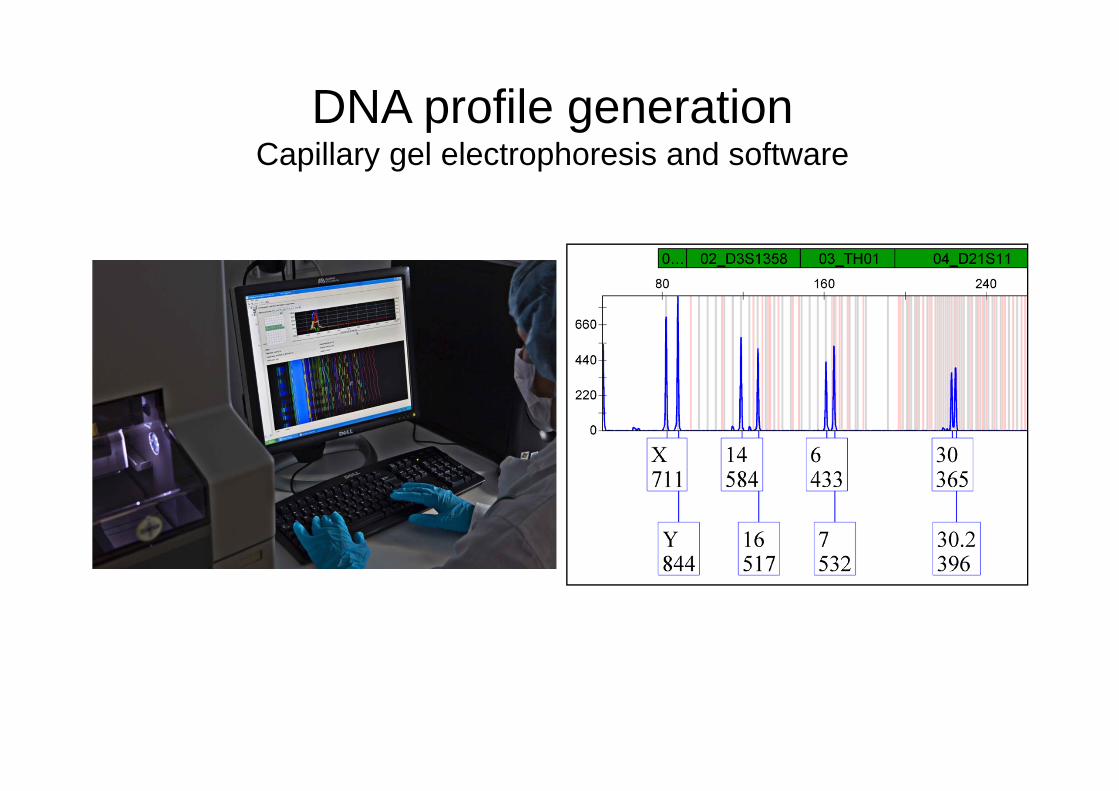
DNA profile generationCapillary gel electrophoresis and software
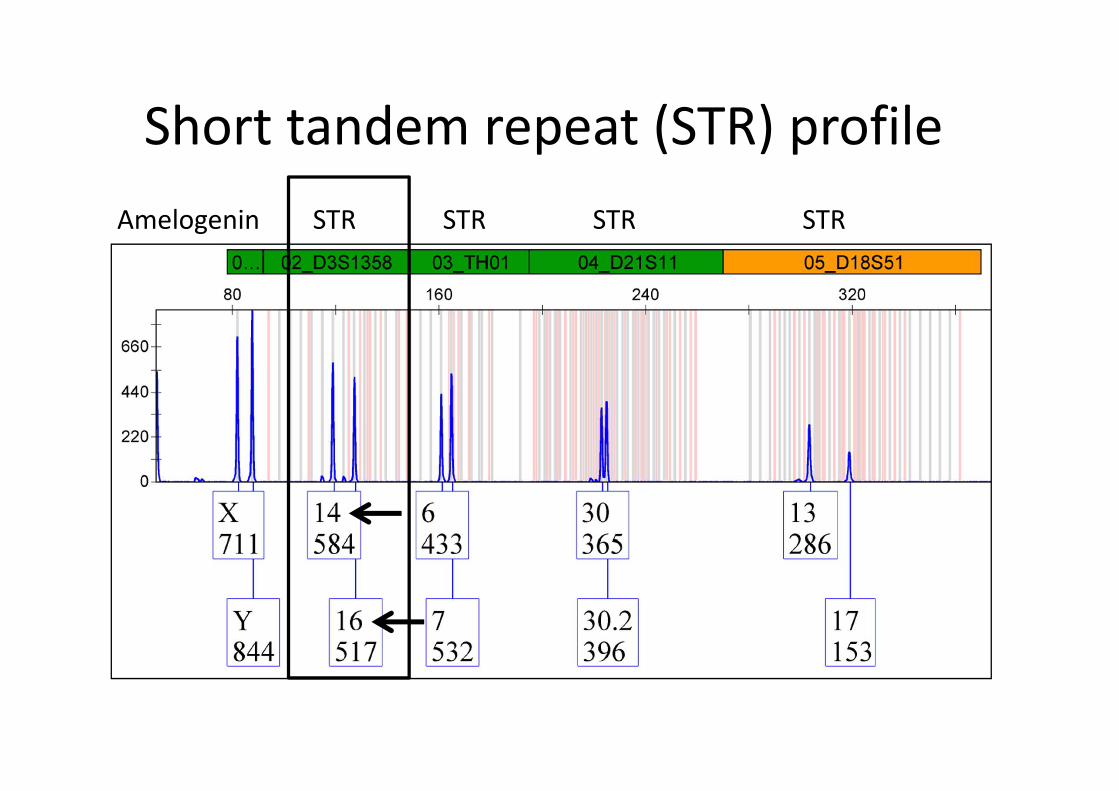
Short tandem repeat (STR) profileAmelogenin STR STR STR STR
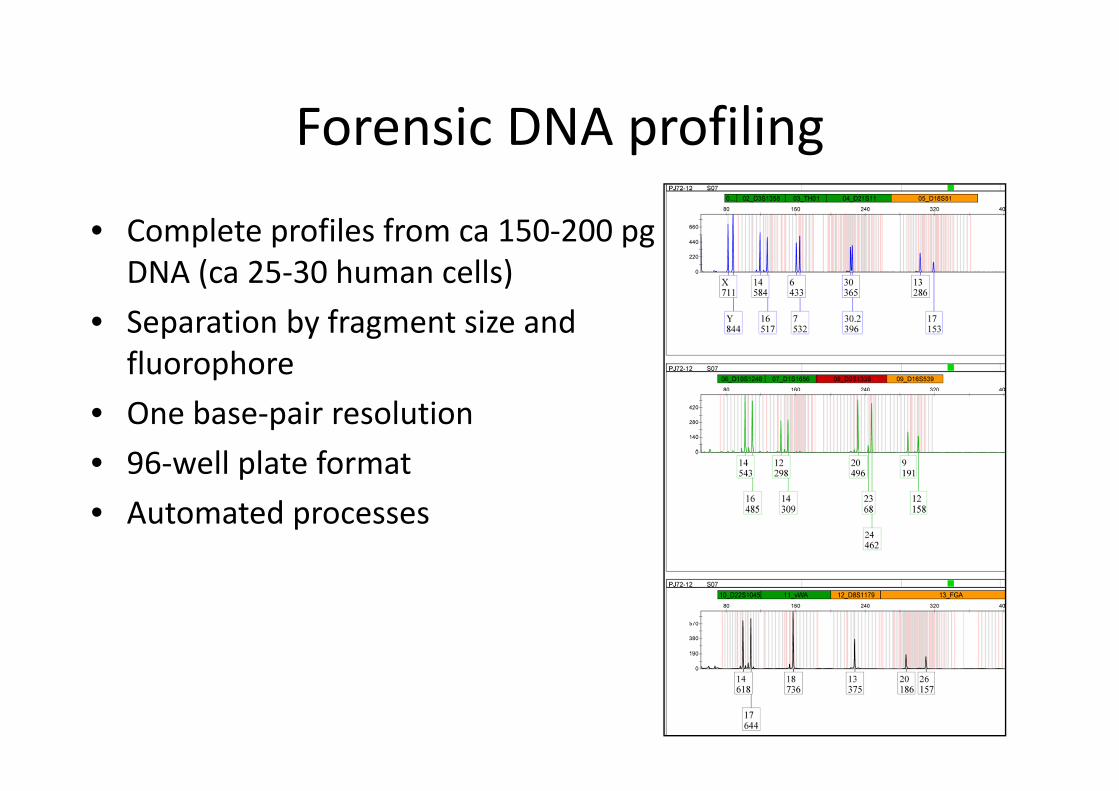
Forensic DNA profiling
• Complete profiles from ca 150‐200 pg DNA (ca 25‐30 human cells)
• Separation by fragment size and fluorophore
• One base‐pair resolution• 96‐well plate format• Automated processes
16
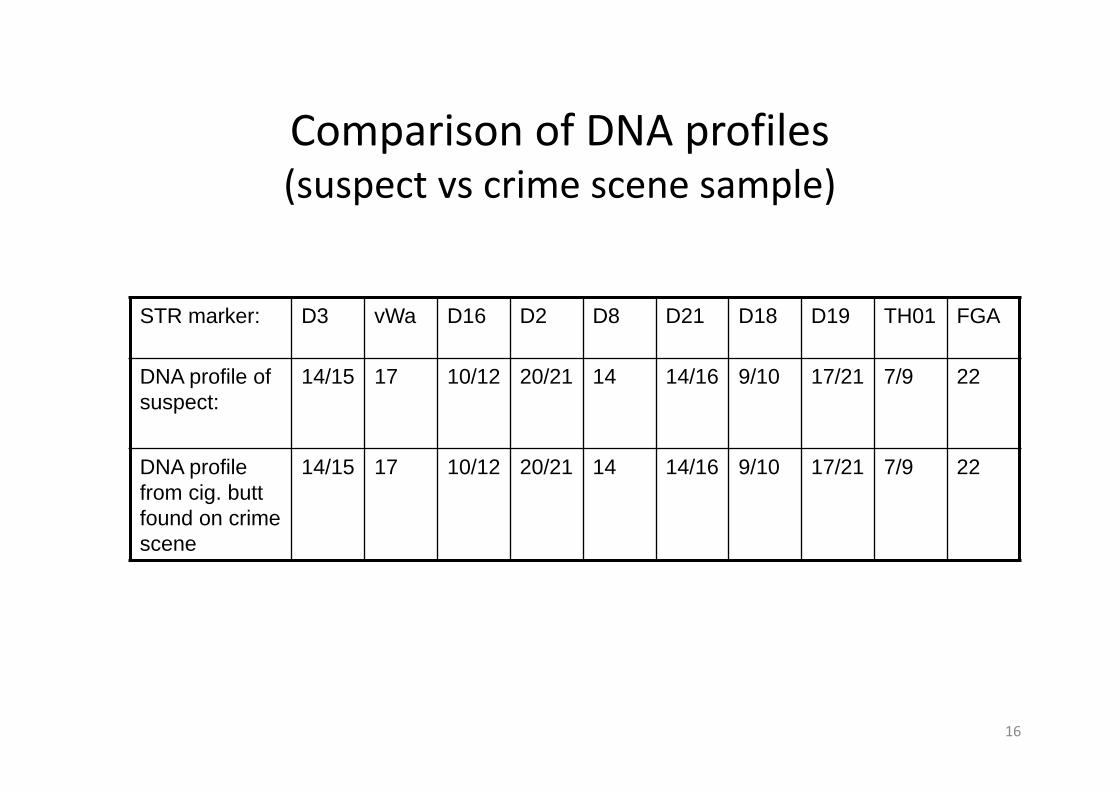
Comparison of DNA profiles(suspect vs crime scene sample)
STR marker: D3 vWa D16 D2 D8 D21 D18 D19 TH01 FGA
DNA profile of suspect:
14/15 17 10/12 20/21 14 14/16 9/10 17/21 7/9 22
DNA profile from cig. butt found on crime scene
14/15 17 10/12 20/21 14 14/16 9/10 17/21 7/9 22
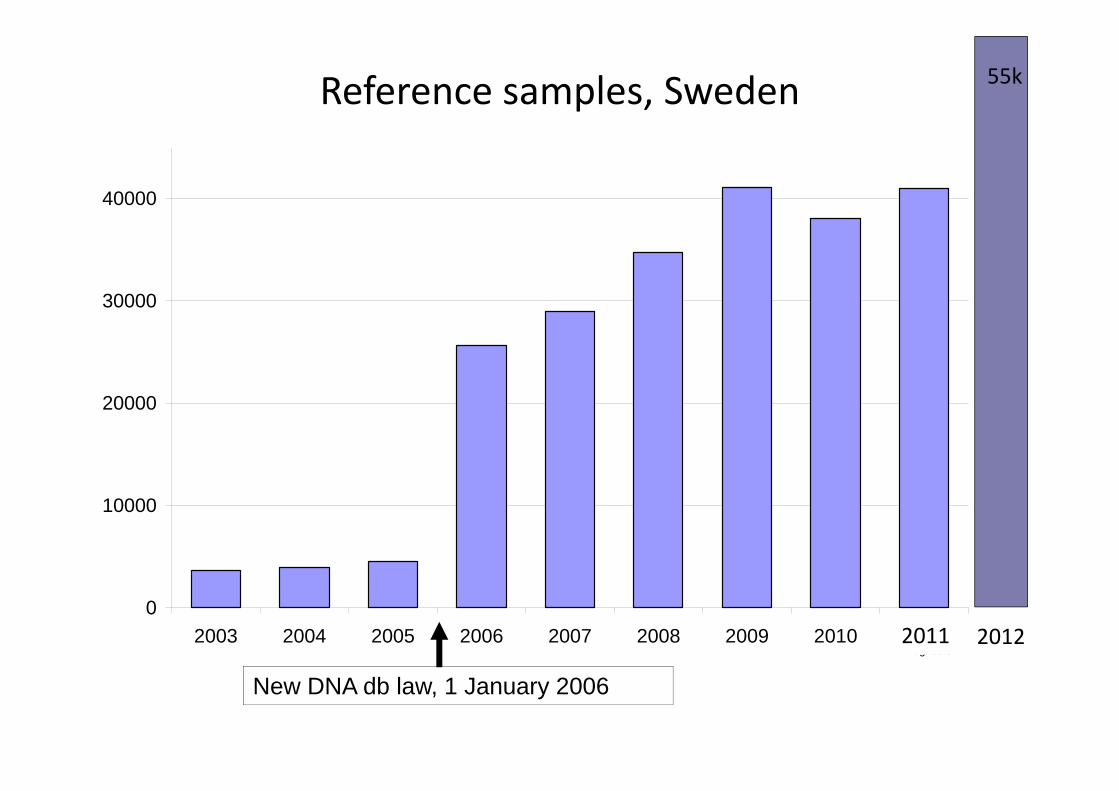
Reference samples, Sweden
New DNA db law, 1 January 2006
0
10000
20000
30000
40000
2003 2004 2005 2006 2007 2008 2009 2010 2011** Prognosis
20122011
55k
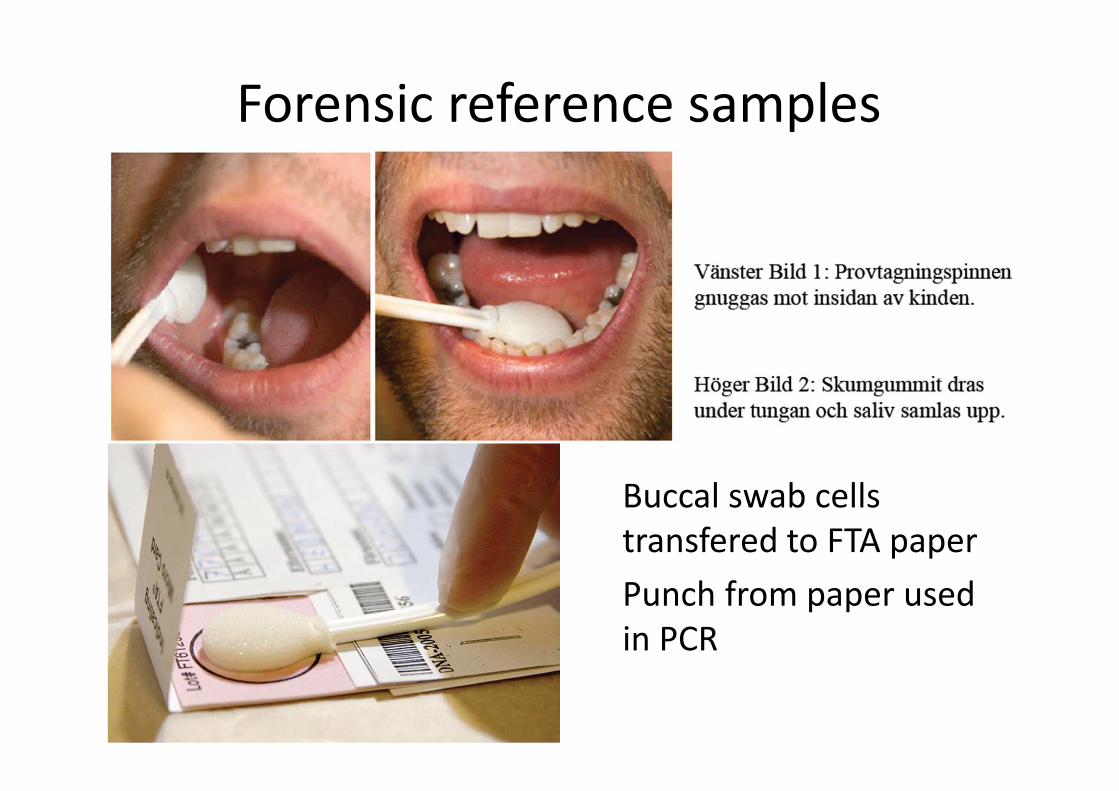
Forensic reference samples
Buccal swab cells transfered to FTA paperPunch from paper usedin PCR
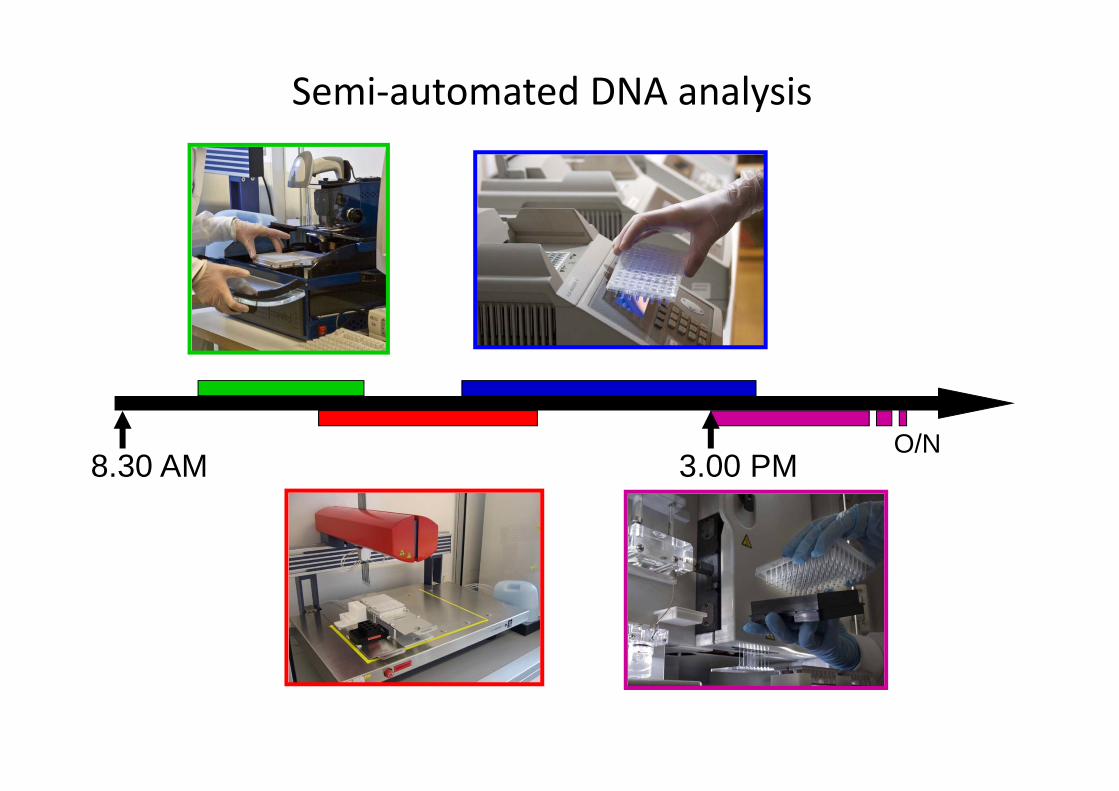
Semi‐automated DNA analysis
8.30 AM 3.00 PMO/N
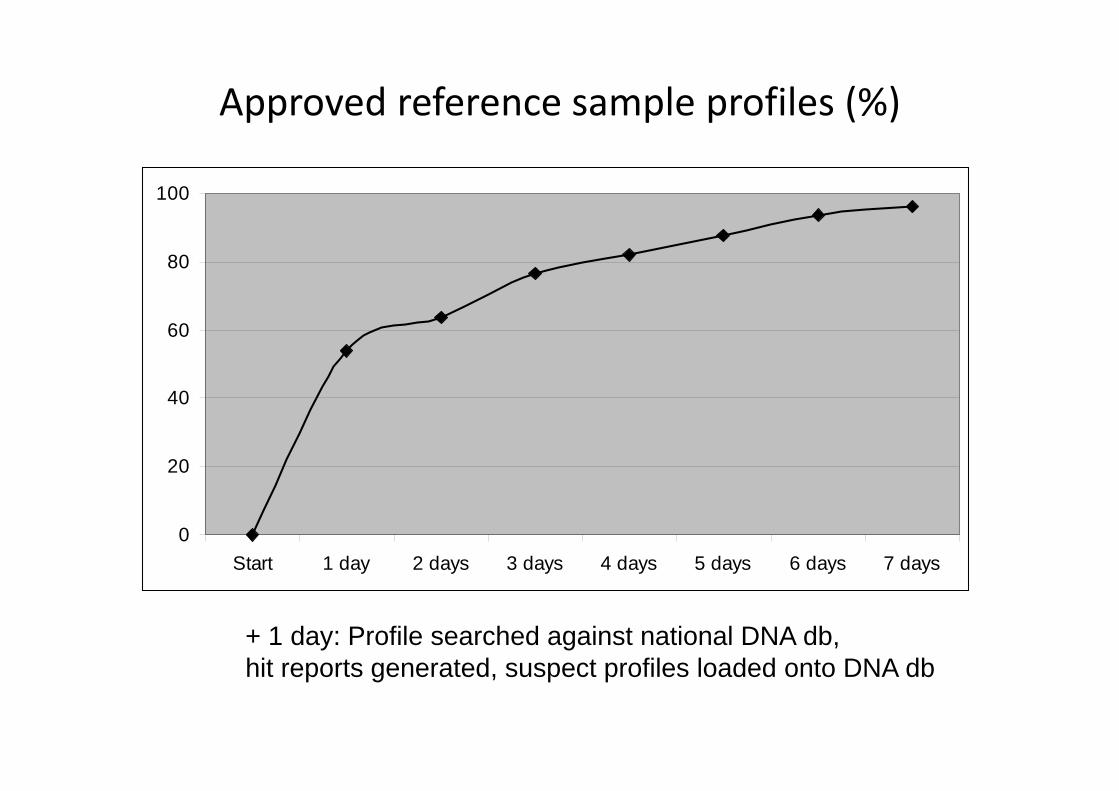
Approved reference sample profiles (%)
0
20
40
60
80
100
Start 1 day 2 days 3 days 4 days 5 days 6 days 7 days
+ 1 day: Profile searched against national DNA db, hit reports generated, suspect profiles loaded onto DNA db
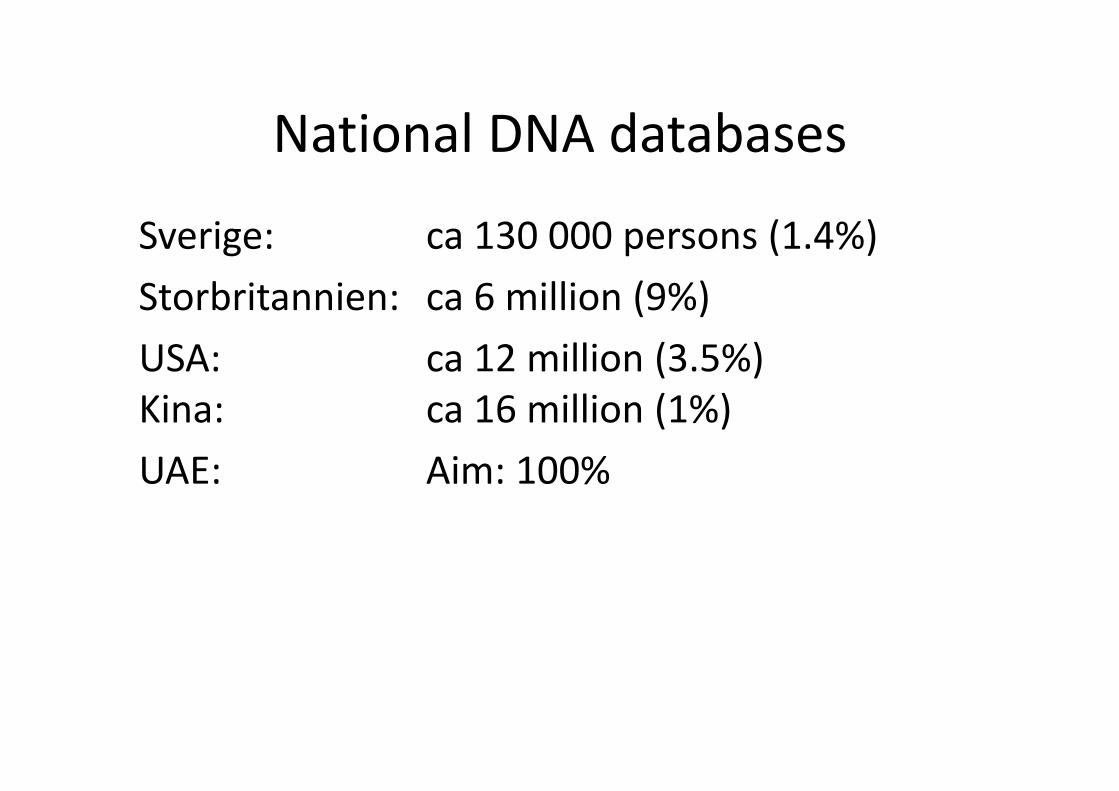
National DNA databases
Sverige: ca 130 000 persons (1.4%)Storbritannien: ca 6 million (9%) USA: ca 12 million (3.5%)Kina: ca 16 million (1%)UAE: Aim: 100%
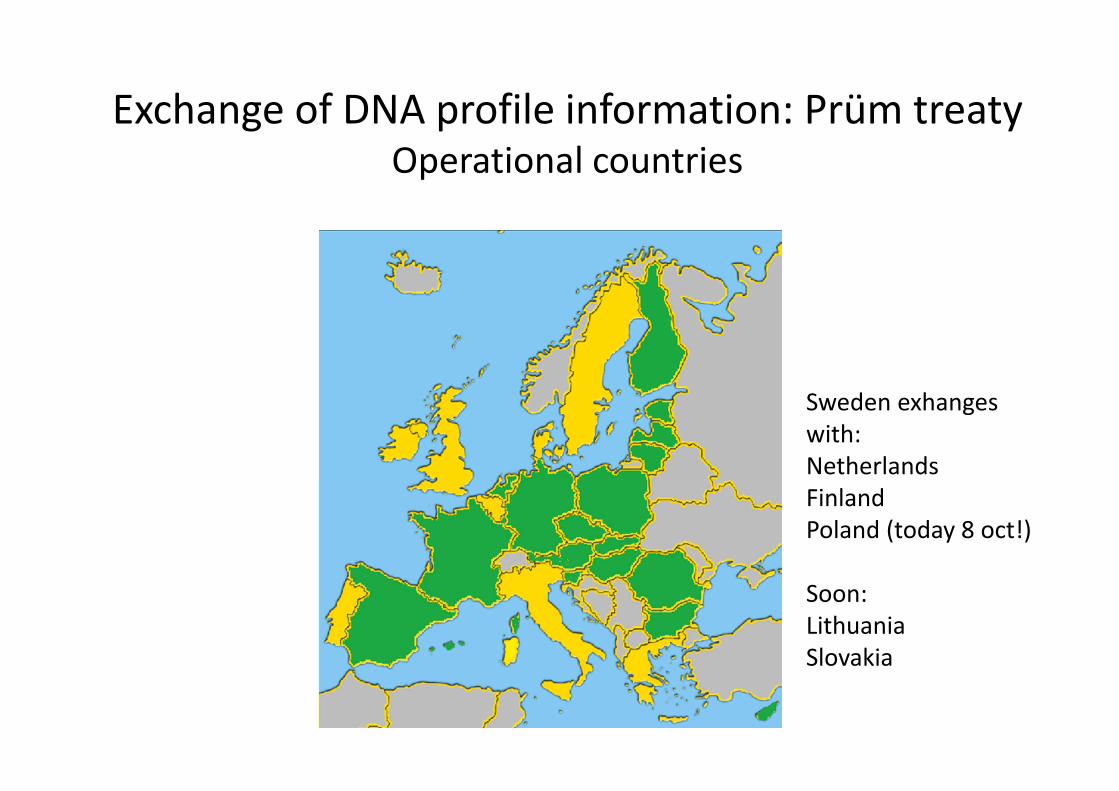
Exchange of DNA profile information: Prüm treatyOperational countries
Sweden exhanges with:NetherlandsFinlandPoland (today 8 oct!)
Soon:LithuaniaSlovakia
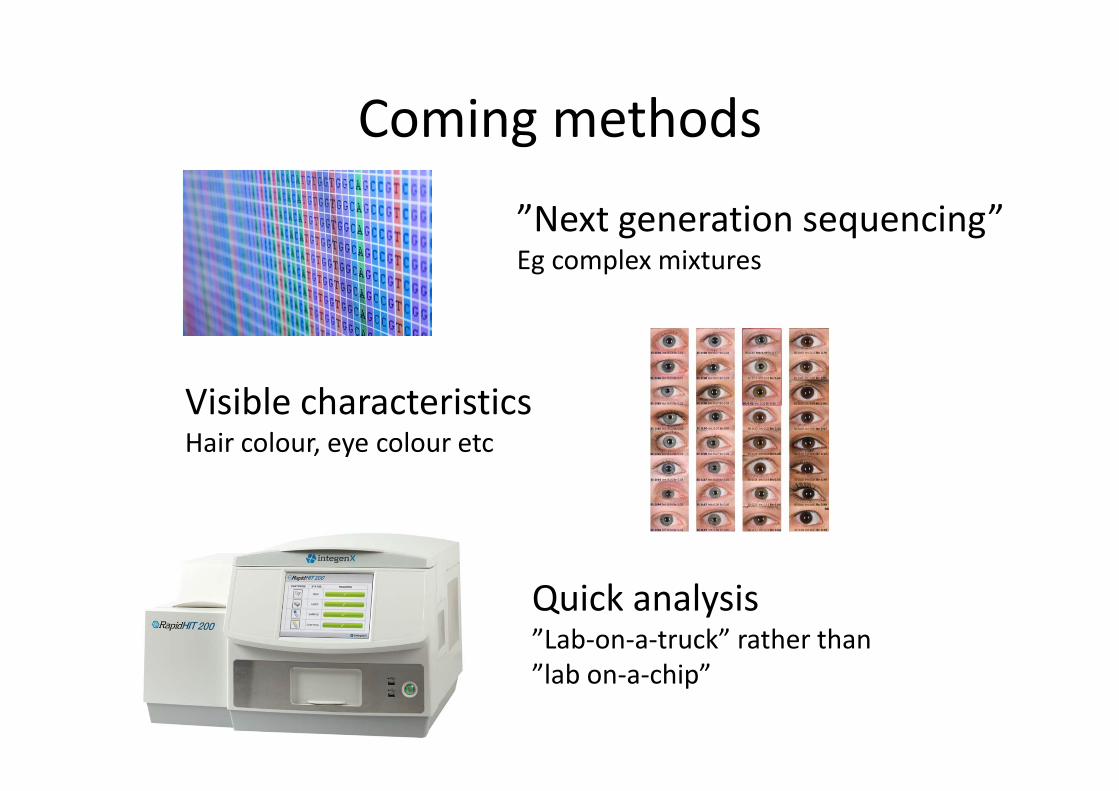
Coming methods
Visible characteristicsHair colour, eye colour etc
Quick analysis”Lab‐on‐a‐truck” rather than”lab on‐a‐chip”
”Next generation sequencing”Eg complex mixtures
qPCR: Kinetics and quality control
0
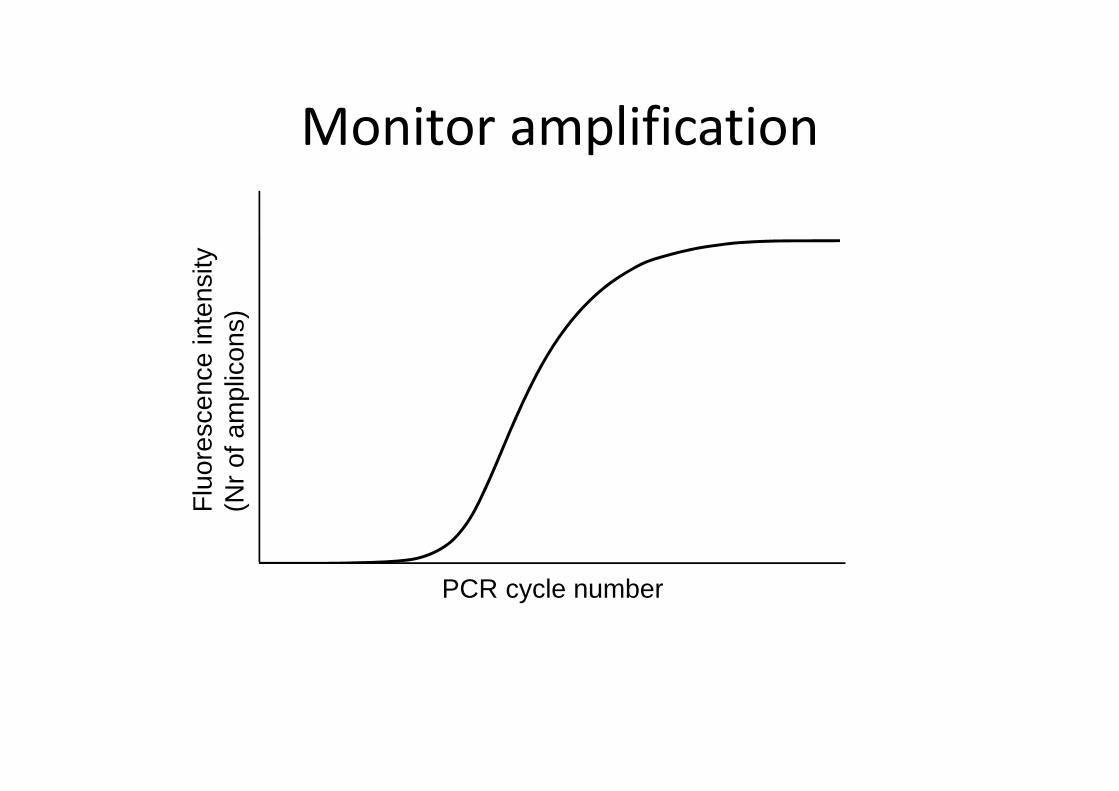
PCR cycle number
Fluo
resc
ence
inte
nsity
(Nr o
fam
plic
ons)
Monitor amplification
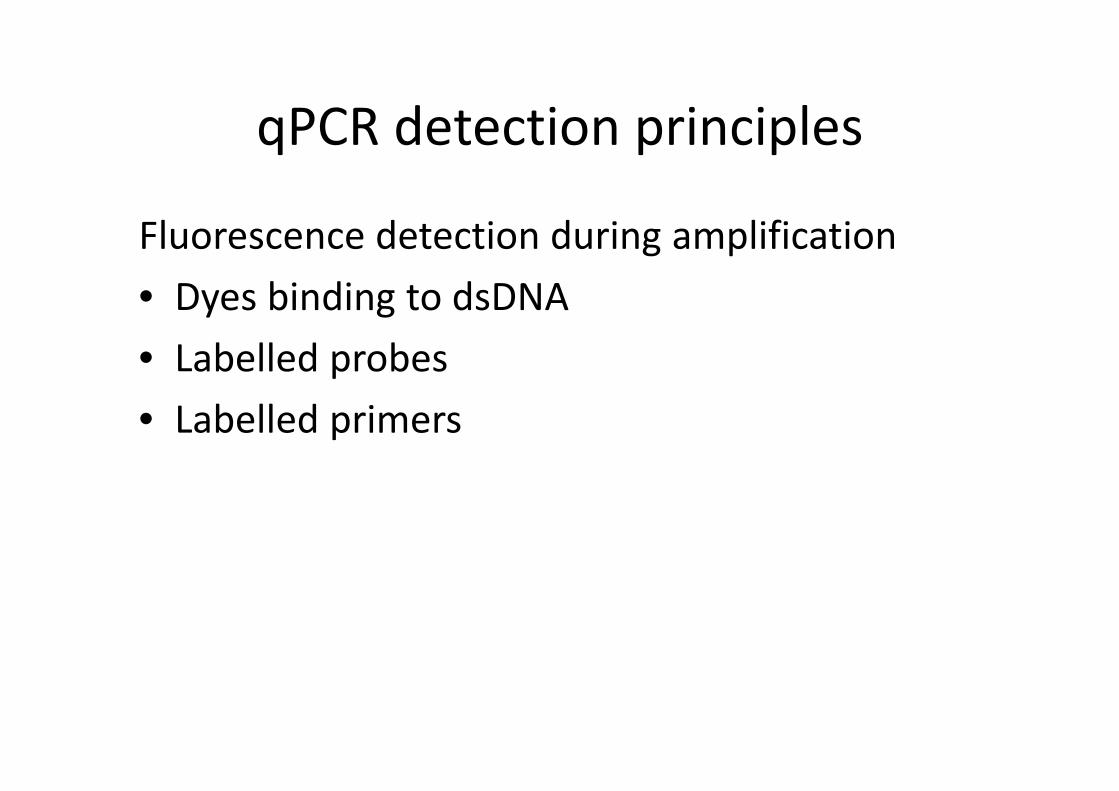
qPCR detection principles
Fluorescence detection during amplification• Dyes binding to dsDNA• Labelled probes• Labelled primers
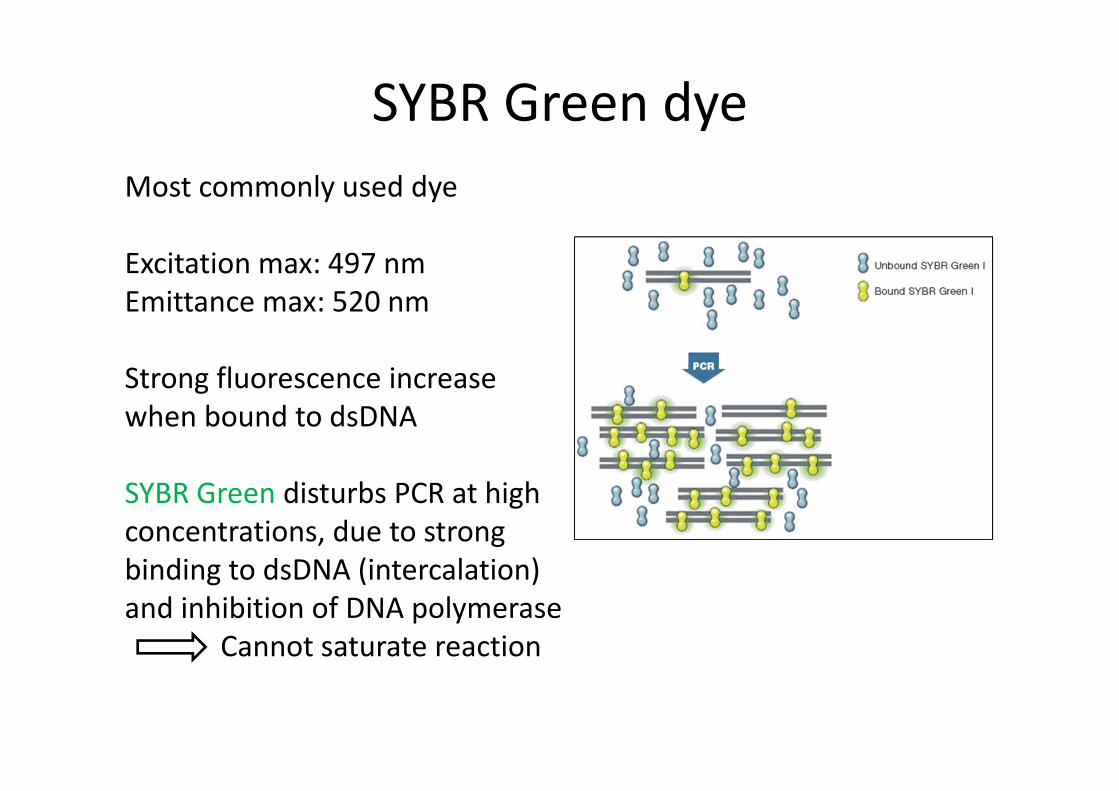
SYBR Green dyeMost commonly used dye
Excitation max: 497 nmEmittance max: 520 nm
Strong fluorescence increasewhen bound to dsDNA
SYBR Green disturbs PCR at highconcentrations, due to strong binding to dsDNA (intercalation) and inhibition of DNA polymerase
Cannot saturate reaction
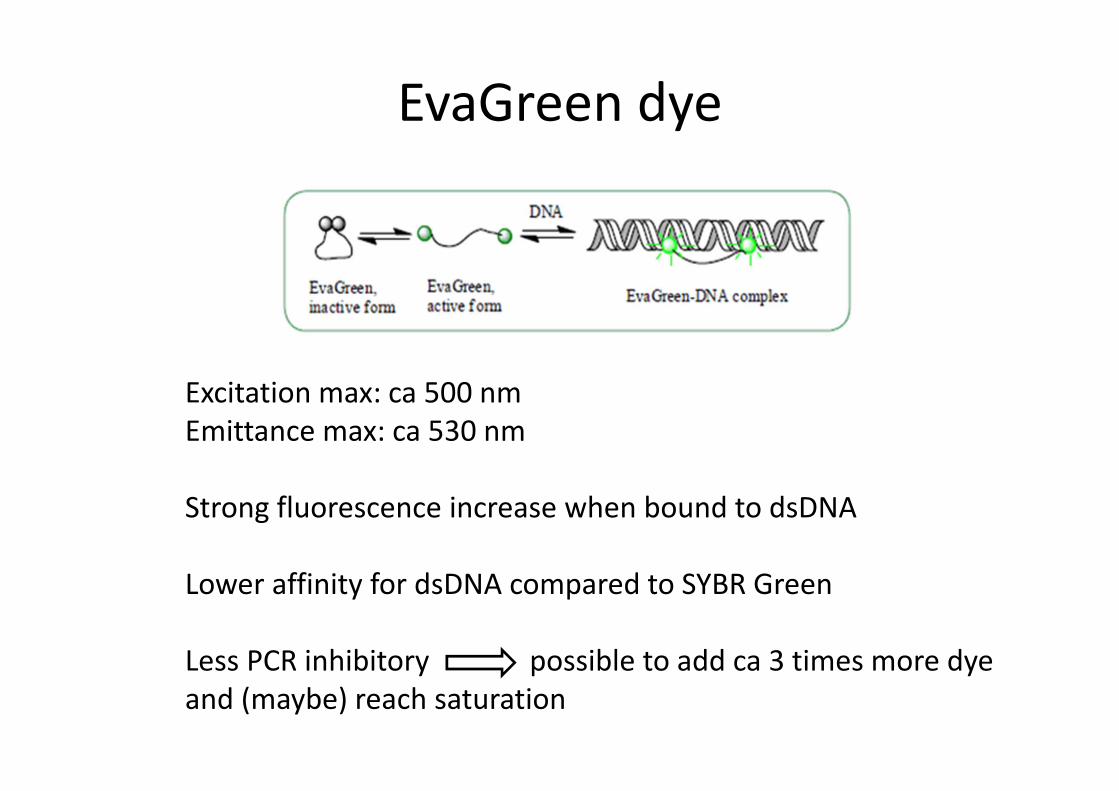
EvaGreen dye
Excitation max: ca 500 nmEmittance max: ca 530 nm
Strong fluorescence increase when bound to dsDNA
Lower affinity for dsDNA compared to SYBR Green
Less PCR inhibitory possible to add ca 3 times more dyeand (maybe) reach saturation
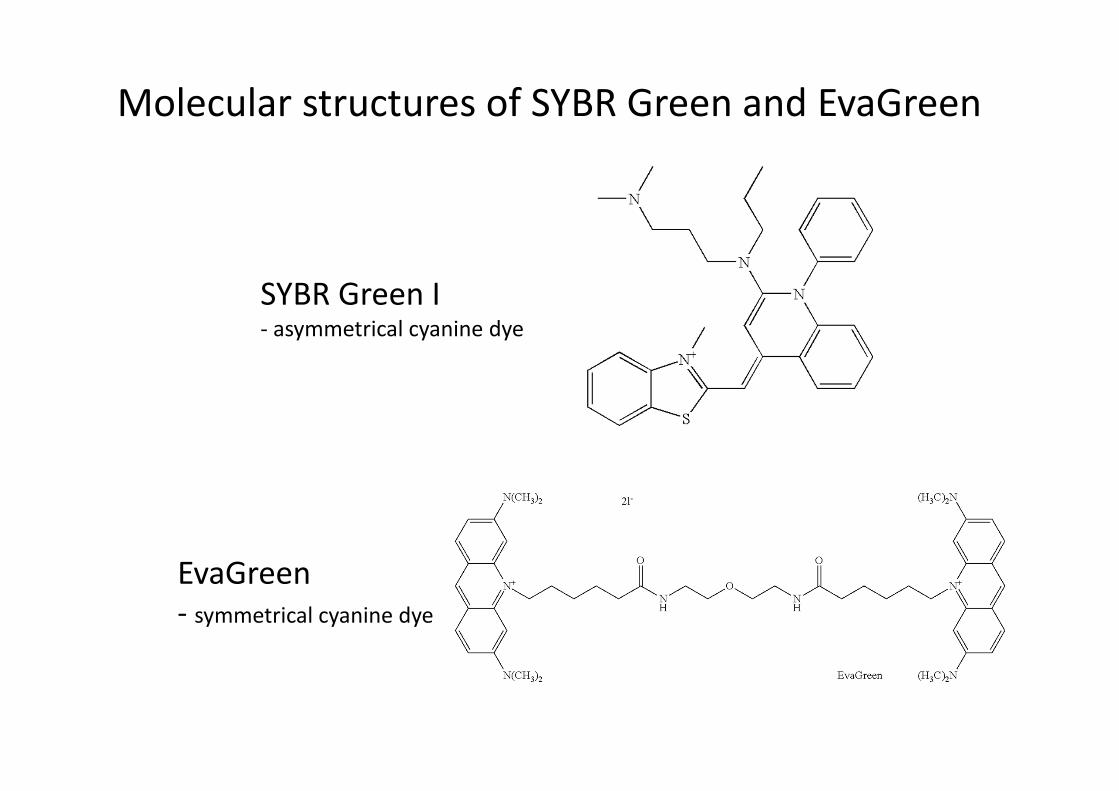
SYBR Green I‐ asymmetrical cyanine dye
EvaGreen‐ symmetrical cyanine dye
Molecular structures of SYBR Green and EvaGreen
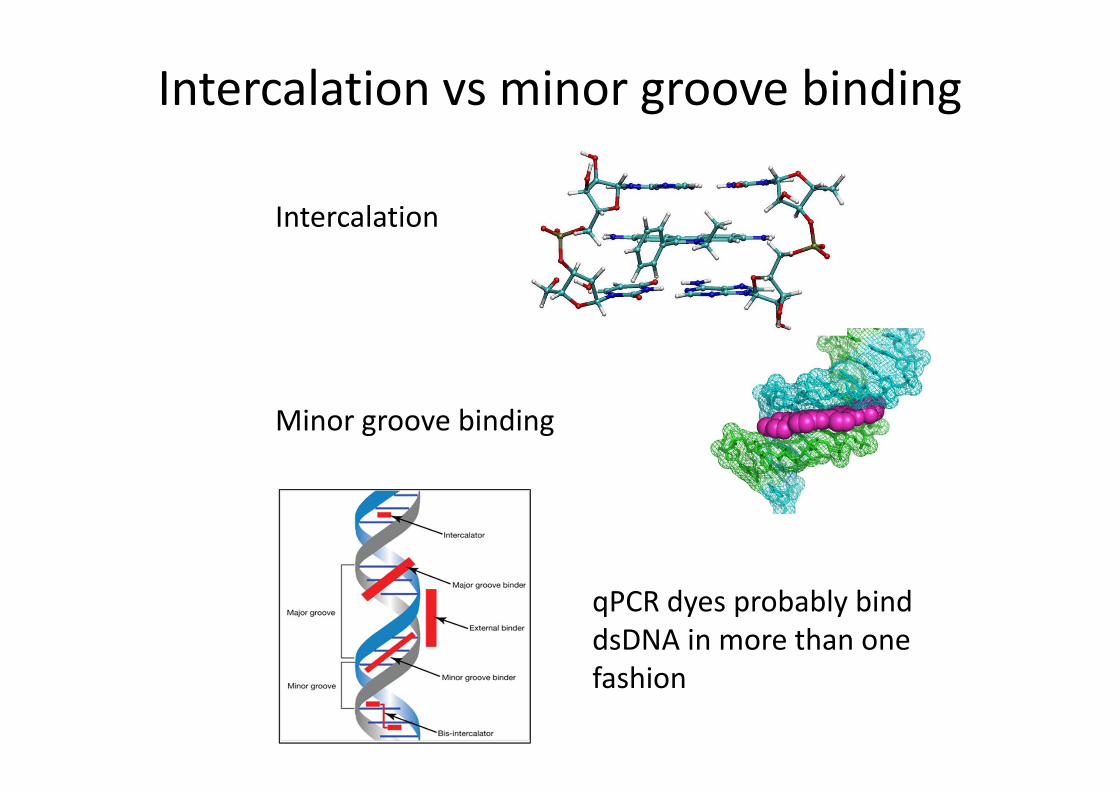
Intercalation vs minor groove binding
Intercalation
Minor groove binding
qPCR dyes probably bind dsDNA in more than onefashion
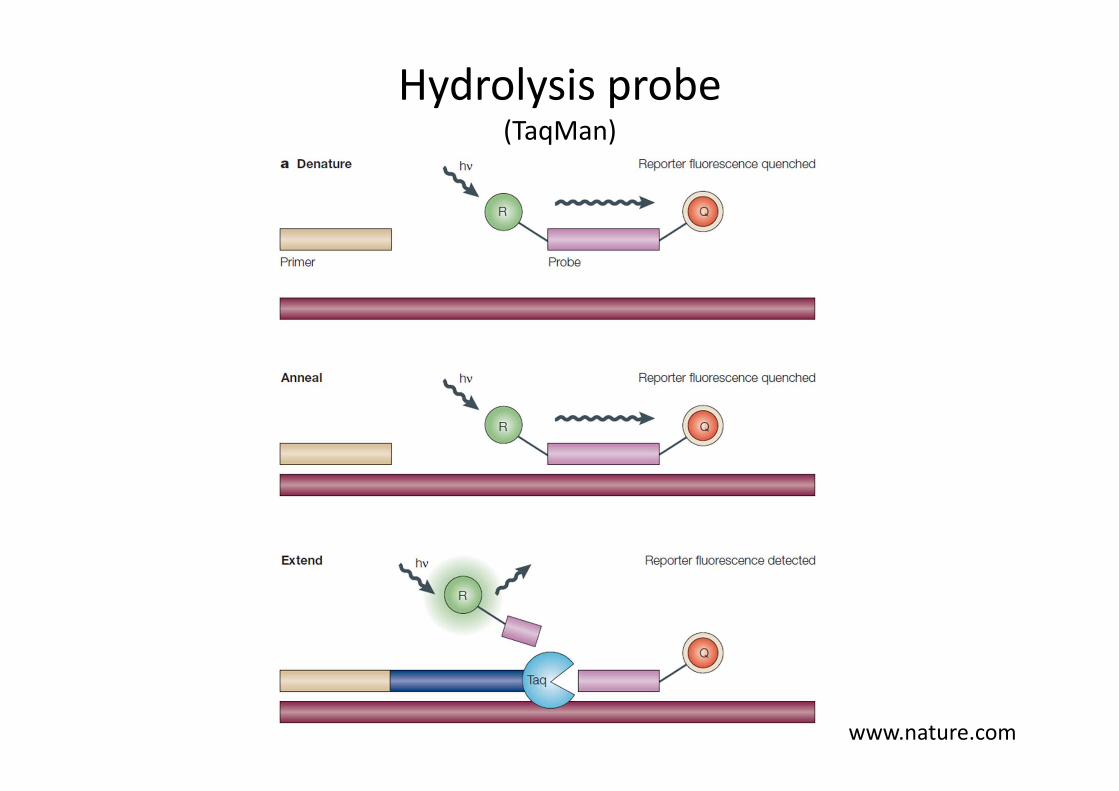
Hydrolysis probe(TaqMan)
www.nature.com
0
PCR cycle number
Fluo
resc
ence
inte
nsity
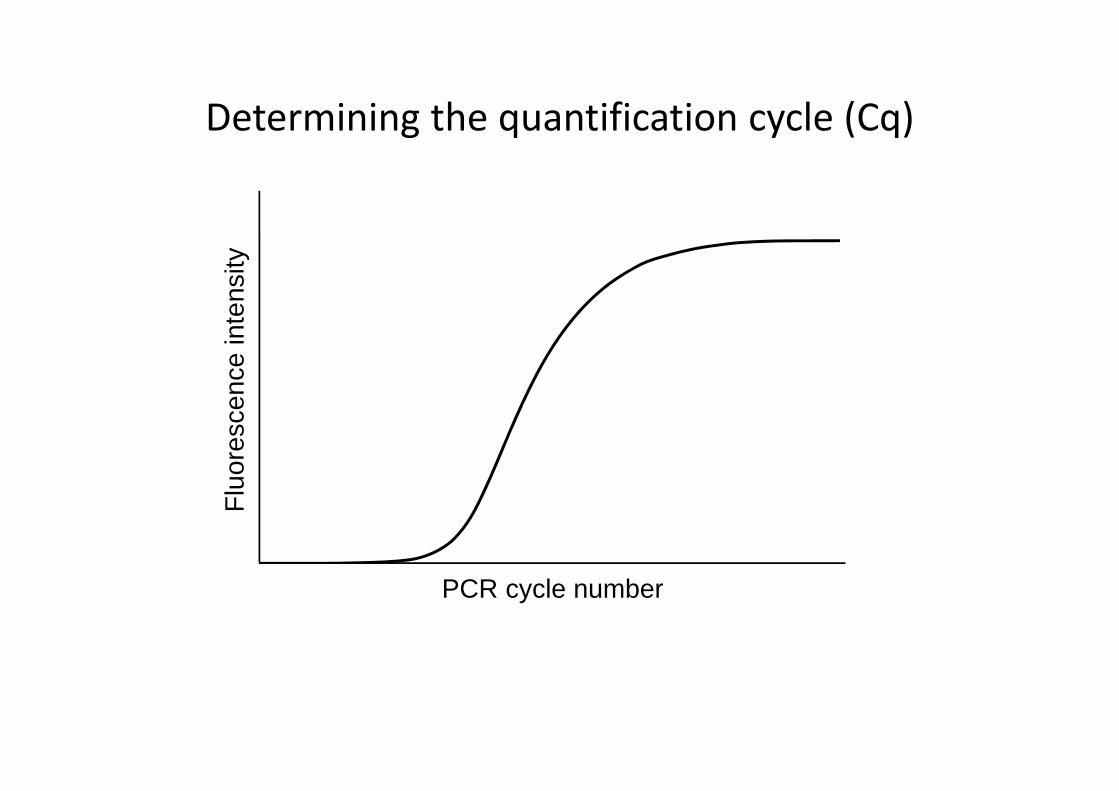
Determining the quantification cycle (Cq)
0
Cq1
PCR cycle number
Fluo
resc
ence
inte
nsity
f´´(max)
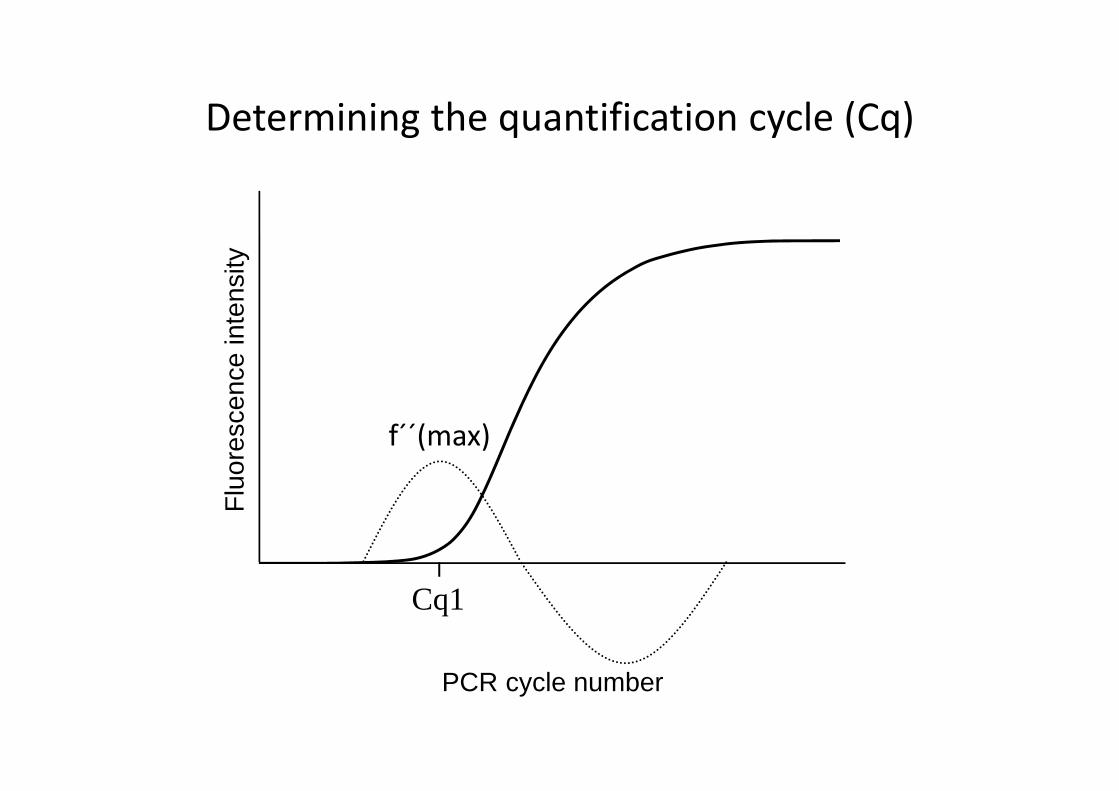
Determining the quantification cycle (Cq)
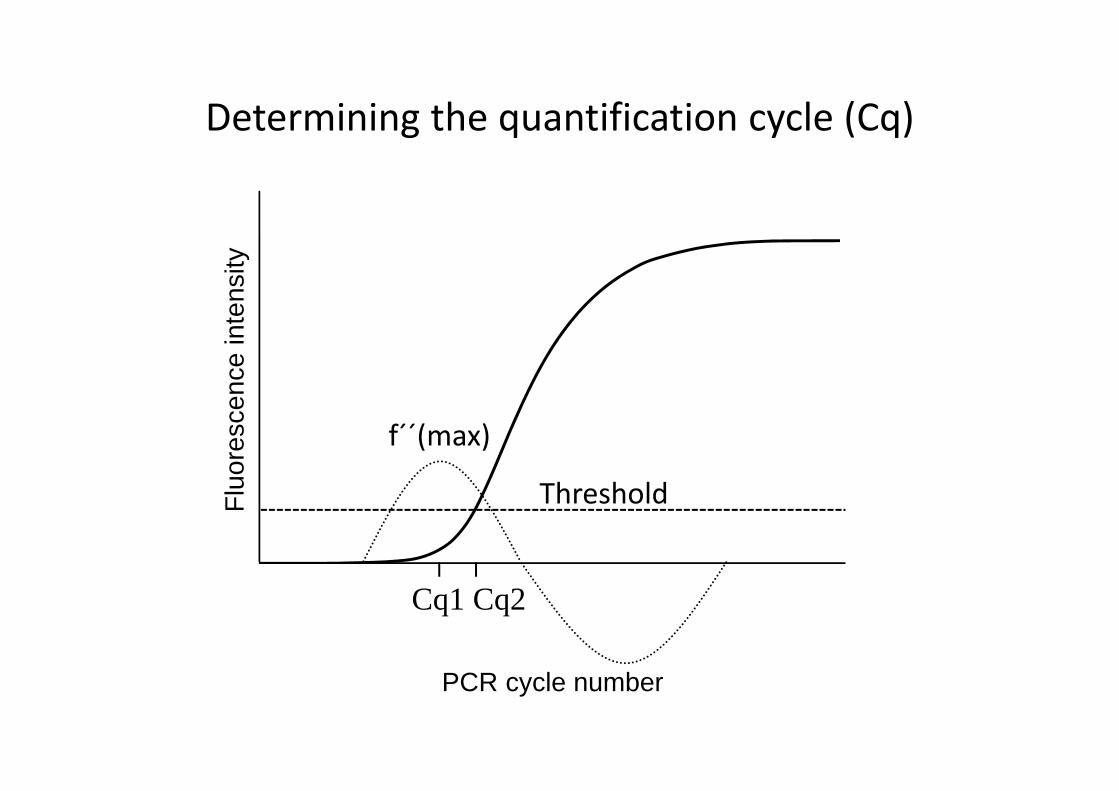
0
Cq1 Cq2
PCR cycle number
Fluo
resc
ence
inte
nsity
f´´(max)
Threshold
Determining the quantification cycle (Cq)
Quality control in qPCR
• PCR control or process control• Internal or external control
Quality control in qPCR
• Internal Amplification Control (IAC)• Kinetic Outlier Detection (KOD)
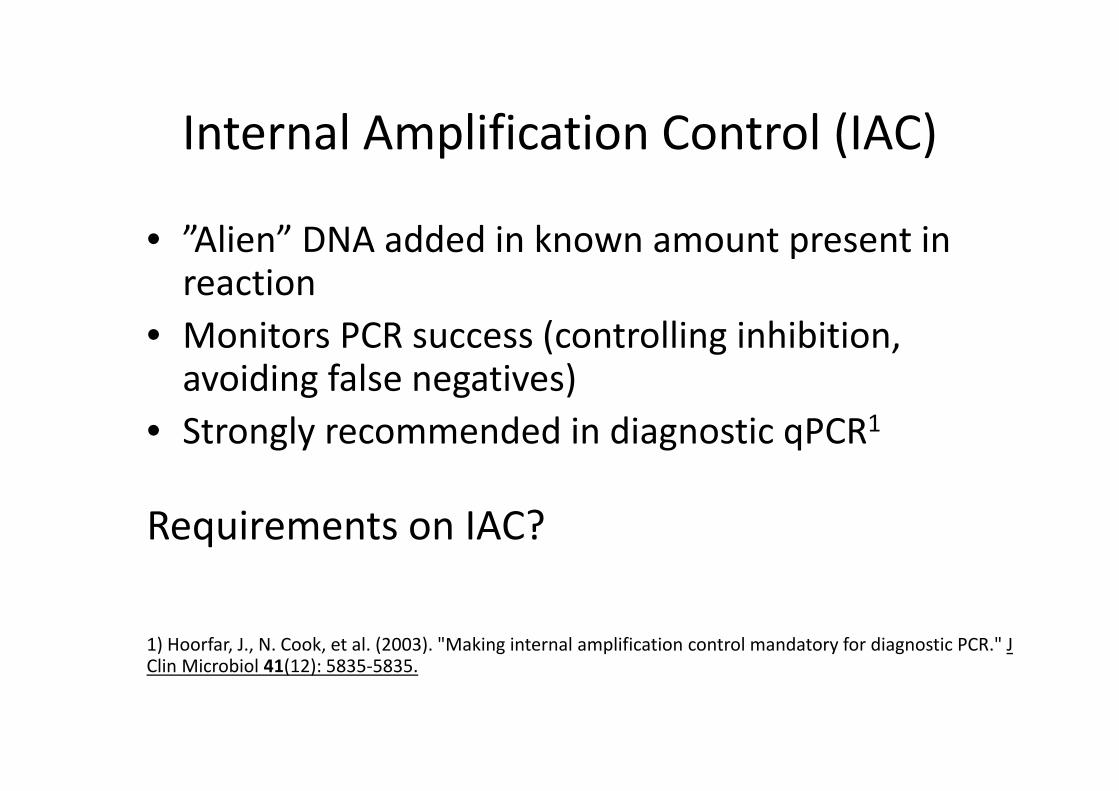
Internal Amplification Control (IAC)
• ”Alien” DNA added in known amount present in reaction
• Monitors PCR success (controlling inhibition, avoiding false negatives)
• Strongly recommended in diagnostic qPCR1
Requirements on IAC?
1) Hoorfar, J., N. Cook, et al. (2003). "Making internal amplification control mandatory for diagnostic PCR." J Clin Microbiol 41(12): 5835‐5835.
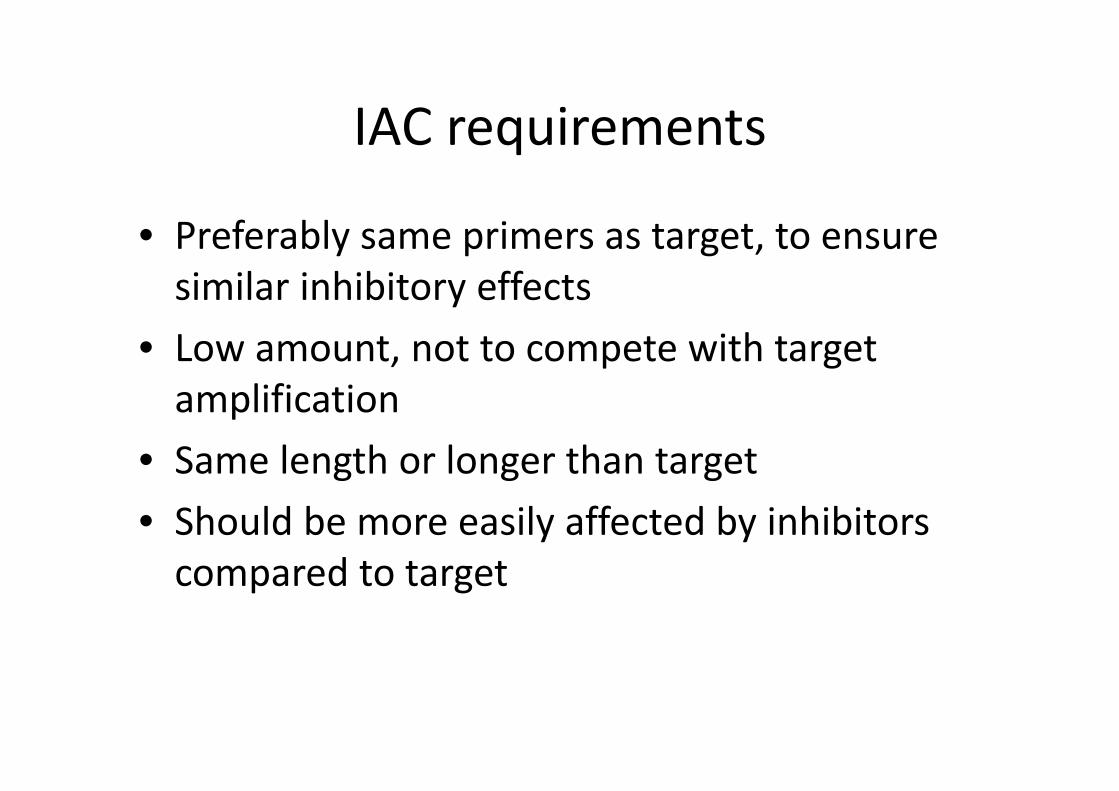
IAC requirements
• Preferably same primers as target, to ensuresimilar inhibitory effects
• Low amount, not to compete with targetamplification
• Same length or longer than target• Should be more easily affected by inhibitors compared to target
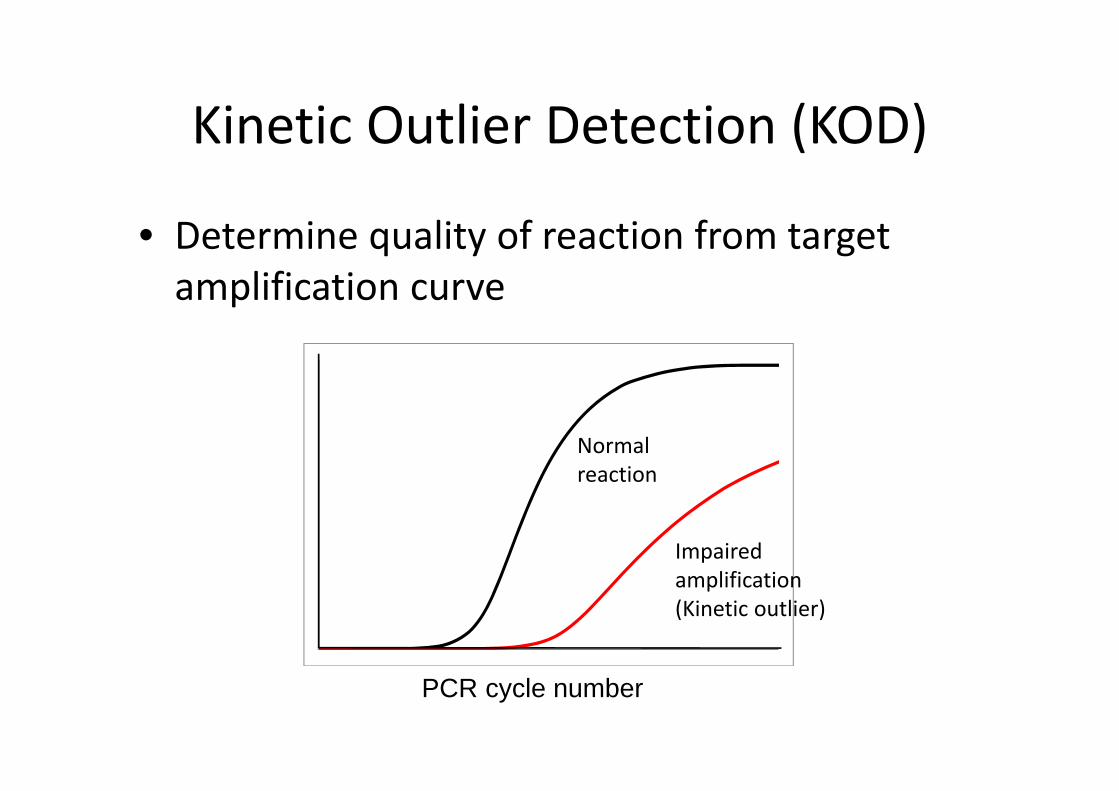
Kinetic Outlier Detection (KOD)
• Determine quality of reaction from targetamplification curve
0
PCR cycle number
Impairedamplification(Kinetic outlier)
Normal reaction
Kinetic Outlier Detection (KOD)
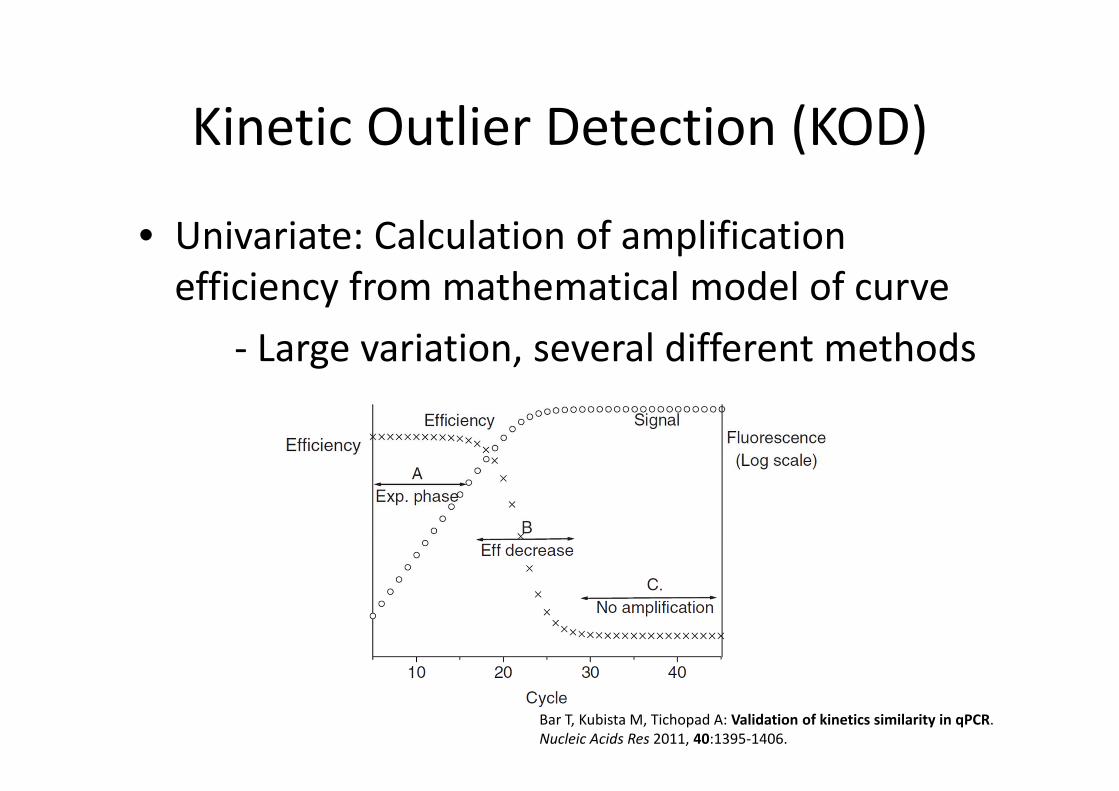
• Univariate: Calculation of amplificationefficiency from mathematical model of curve
‐ Large variation, several different methods
Bar T, Kubista M, Tichopad A: Validation of kinetics similarity in qPCR. Nucleic Acids Res 2011, 40:1395‐1406.
Kinetic Outlier Detection (KOD)
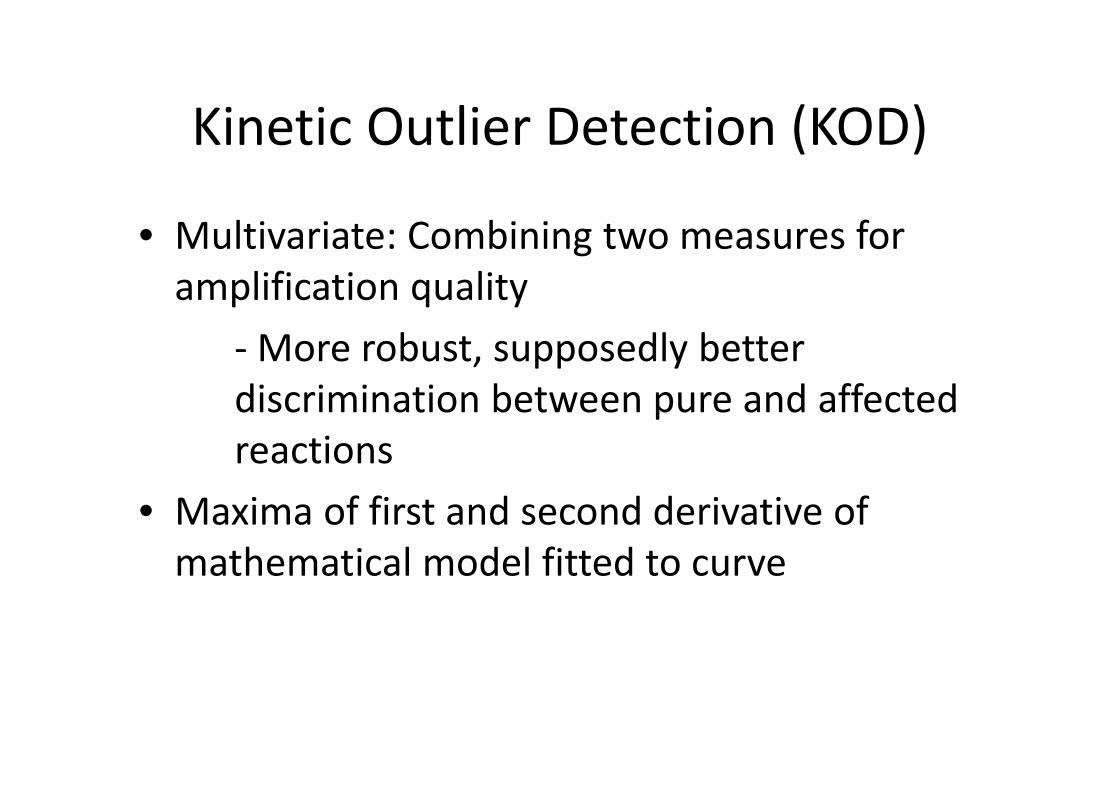
• Multivariate: Combining two measures for amplification quality
‐More robust, supposedly betterdiscrimination between pure and affectedreactions
• Maxima of first and second derivative ofmathematical model fitted to curve
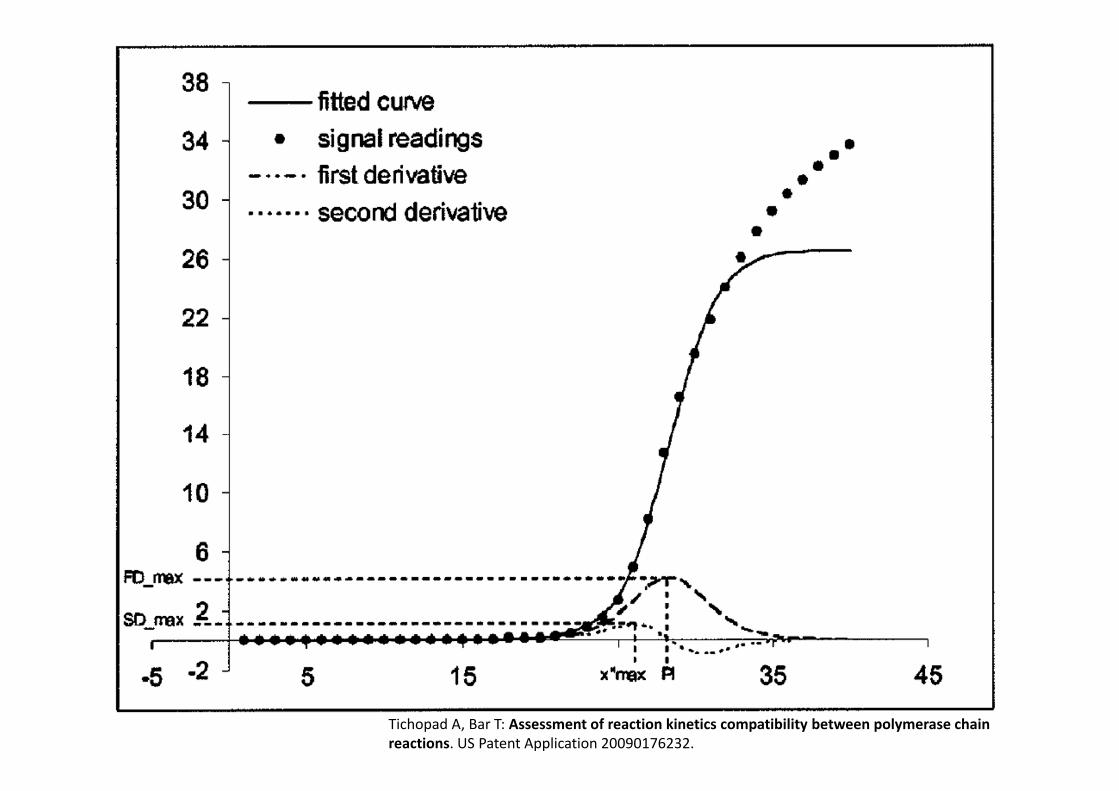
Tichopad A, Bar T: Assessment of reaction kinetics compatibility between polymerase chainreactions. US Patent Application 20090176232.
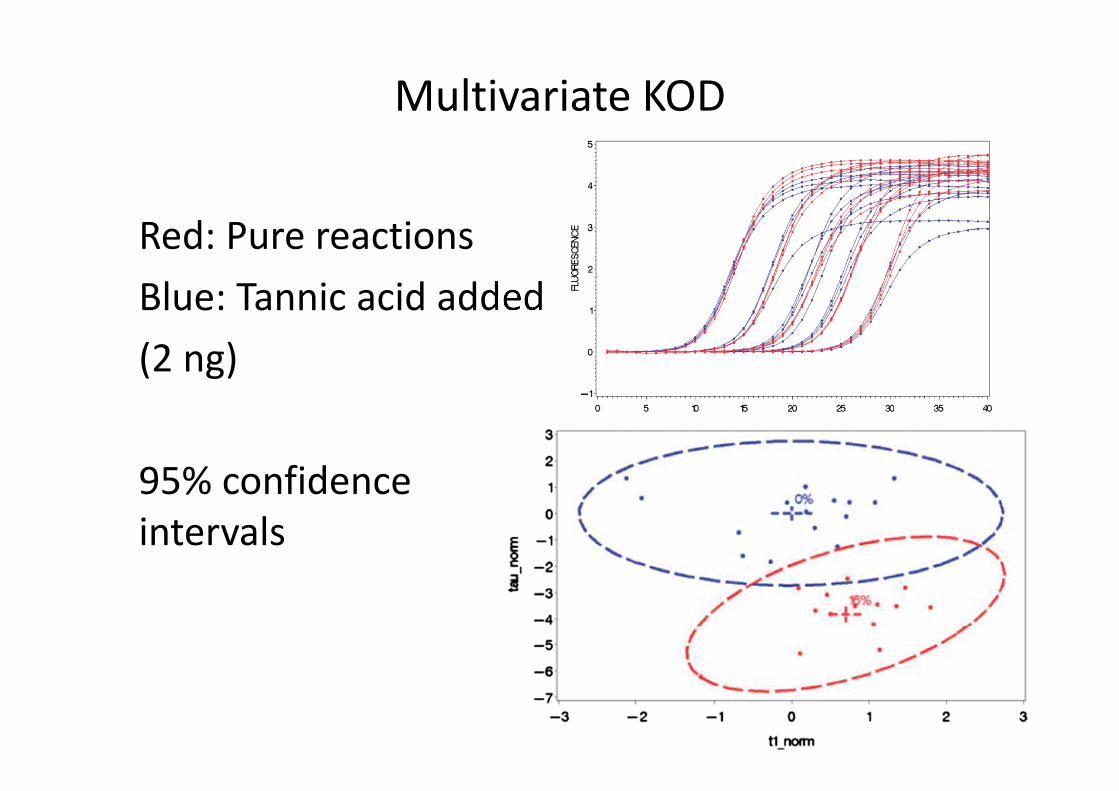
Multivariate KOD
Red: Pure reactionsBlue: Tannic acid added(2 ng)
95% confidenceintervals
Free softwares for qPCR data handling
• R package: qpcRhttp://cran.r‐project.org/web/packages/qpcR/index.htmlRitz C, Spiess AN: qpcR: an R package for sigmoidal model selection in quantitative real‐time polymerase chain reaction analysis. Bioinformatics2008, 24(13):1549‐1551.
• Web‐based Java software: QPCRhttp://icbi.at/software/qpcr/qpcr.shtmlPabinger S, Thallinger GG, Snajder R, Eichhorn H, Rader R, Trajanoski Z: QPCR: Application for real‐time PCR data management and analysis. BMC Bioinformatics 2009, 10:268.
Pre‐PCR processing and PCR inhibition
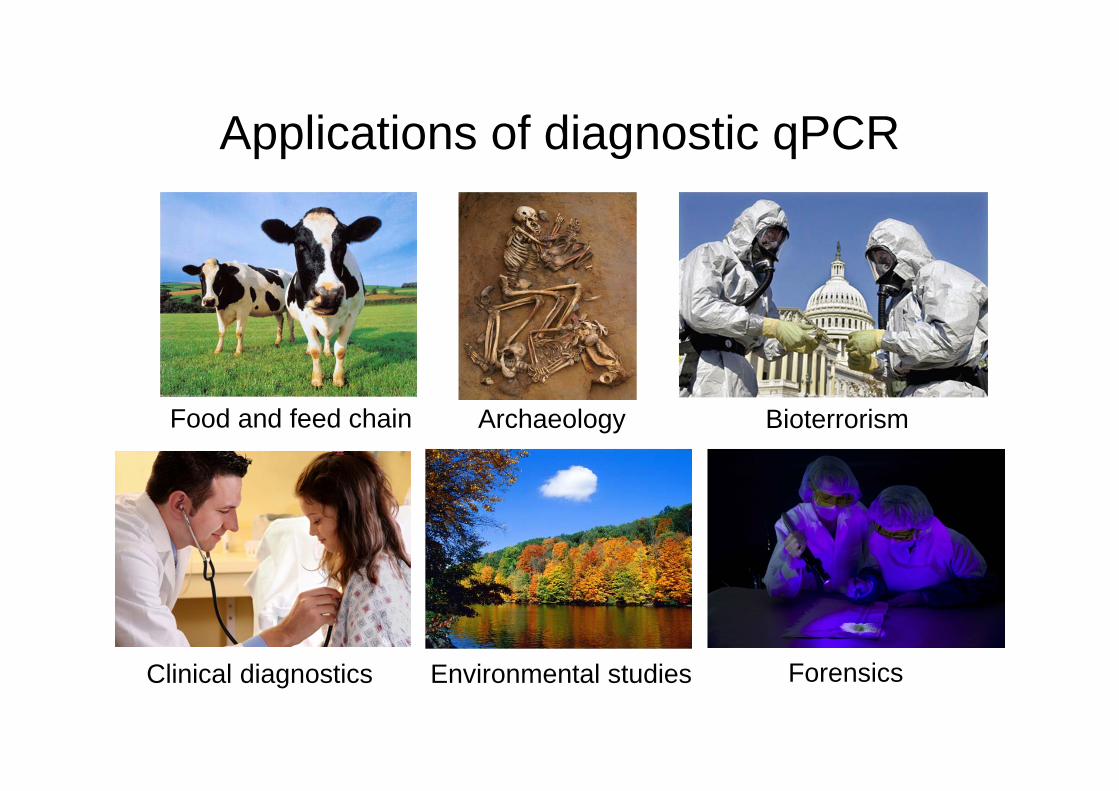
Applications of diagnostic qPCR
Food and feed chain
ForensicsEnvironmental studiesClinical diagnostics
BioterrorismArchaeology

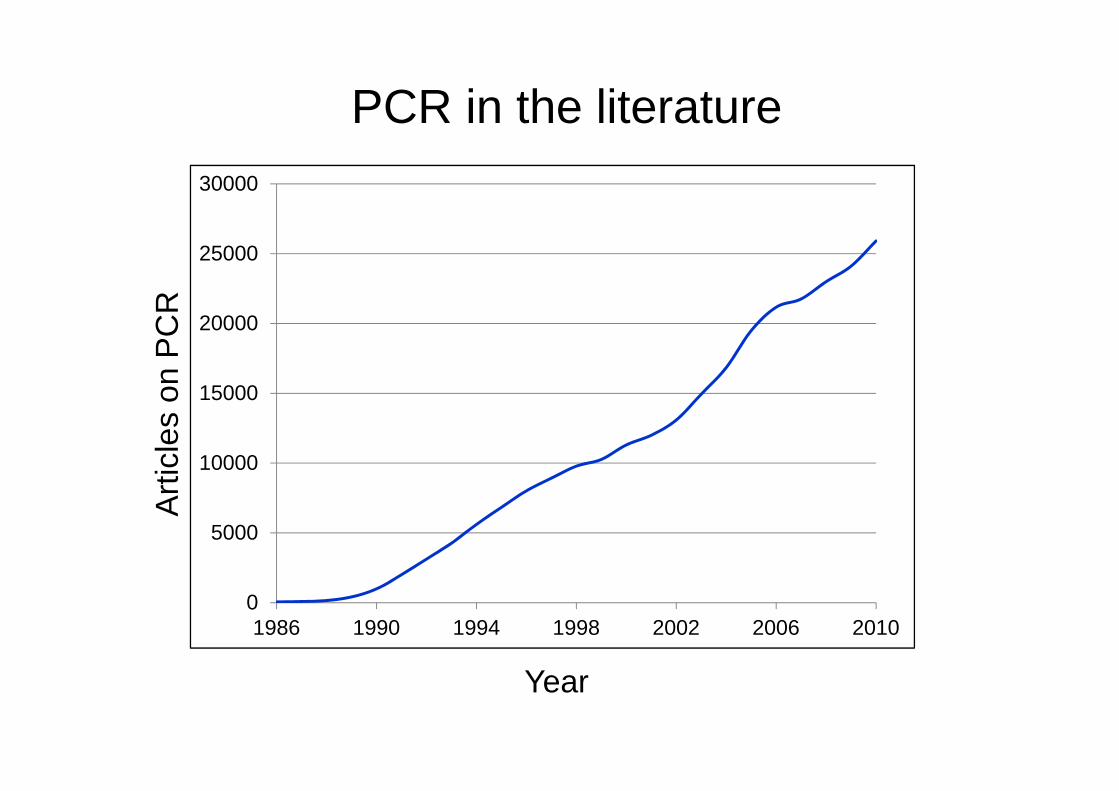
Arti
cles
on
PC
R
0
5000
10000
15000
20000
25000
30000
1986 1990 1994 1998 2002 2006 2010
Year
PCR in the literature
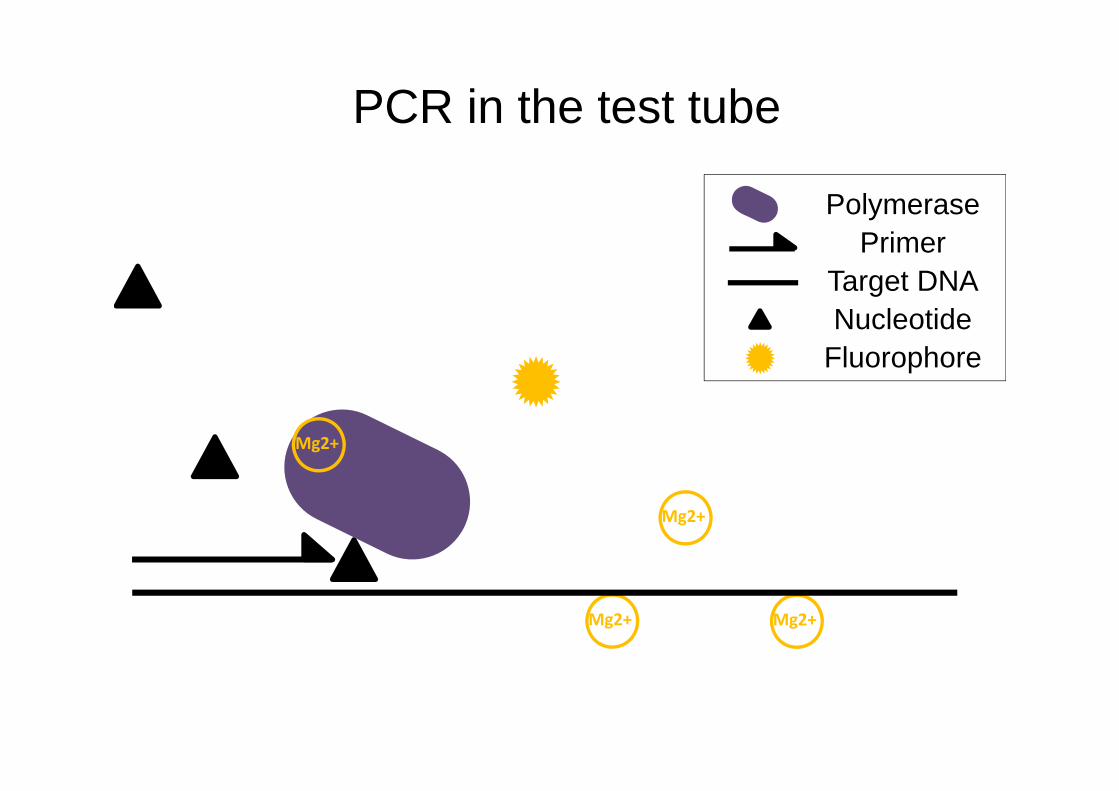
Mg2+ Mg2+
Mg2+
PolymerasePrimer
Target DNANucleotide
Fluorophore
Mg2+
PCR in the test tube
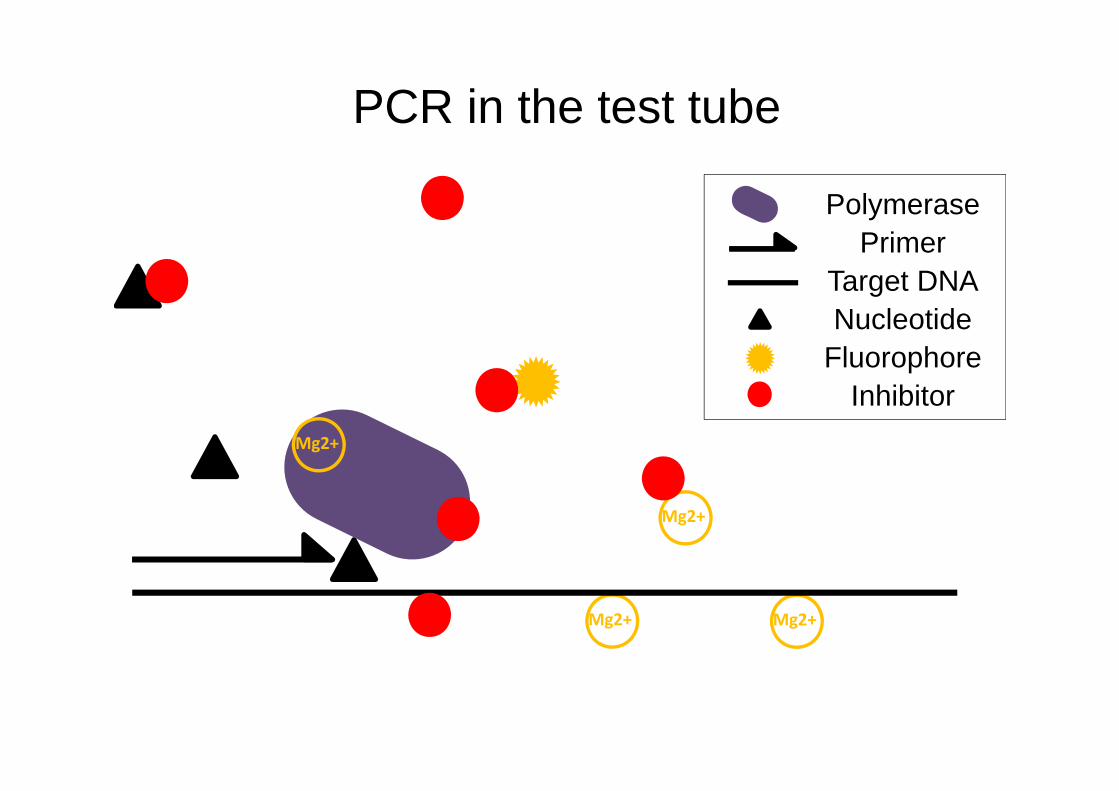
Mg2+ Mg2+
Mg2+
Mg2+
PolymerasePrimer
Target DNANucleotide
FluorophoreInhibitor
PCR in the test tube
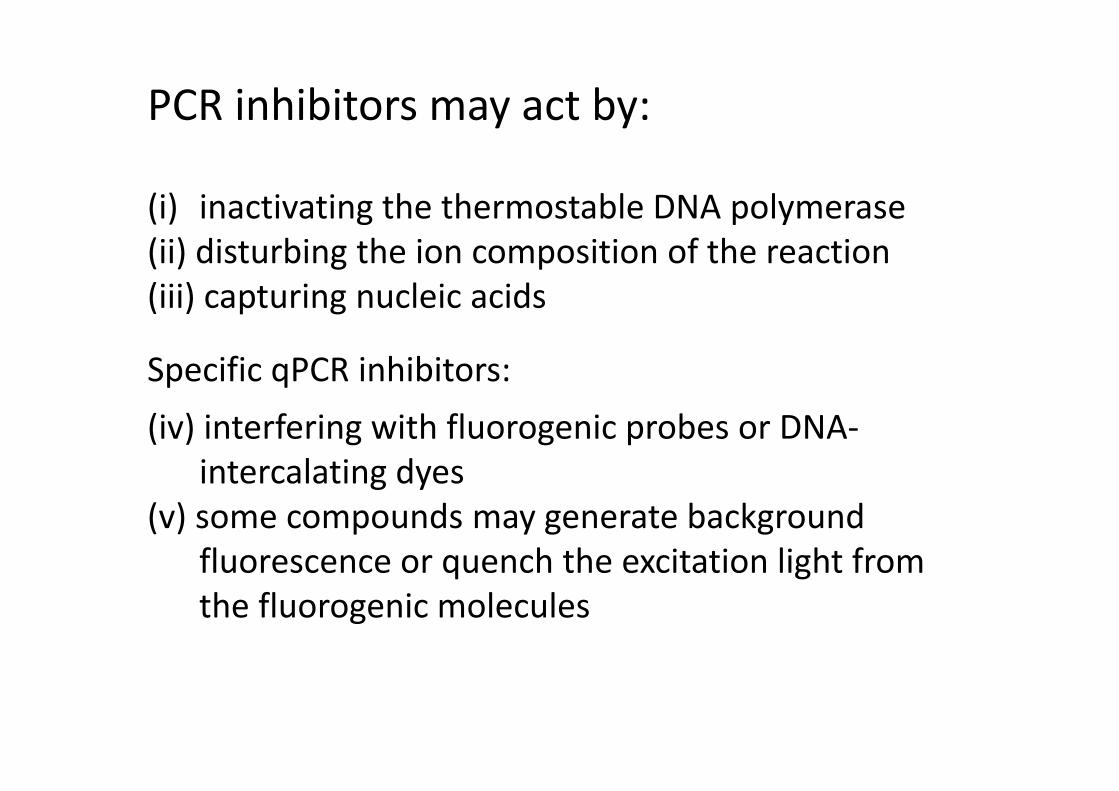
PCR inhibitors may act by:
(i) inactivating the thermostable DNA polymerase (ii) disturbing the ion composition of the reaction(iii) capturing nucleic acids
Specific qPCR inhibitors:(iv) interfering with fluorogenic probes or DNA‐
intercalating dyes(v) some compounds may generate background
fluorescence or quench the excitation light from the fluorogenic molecules
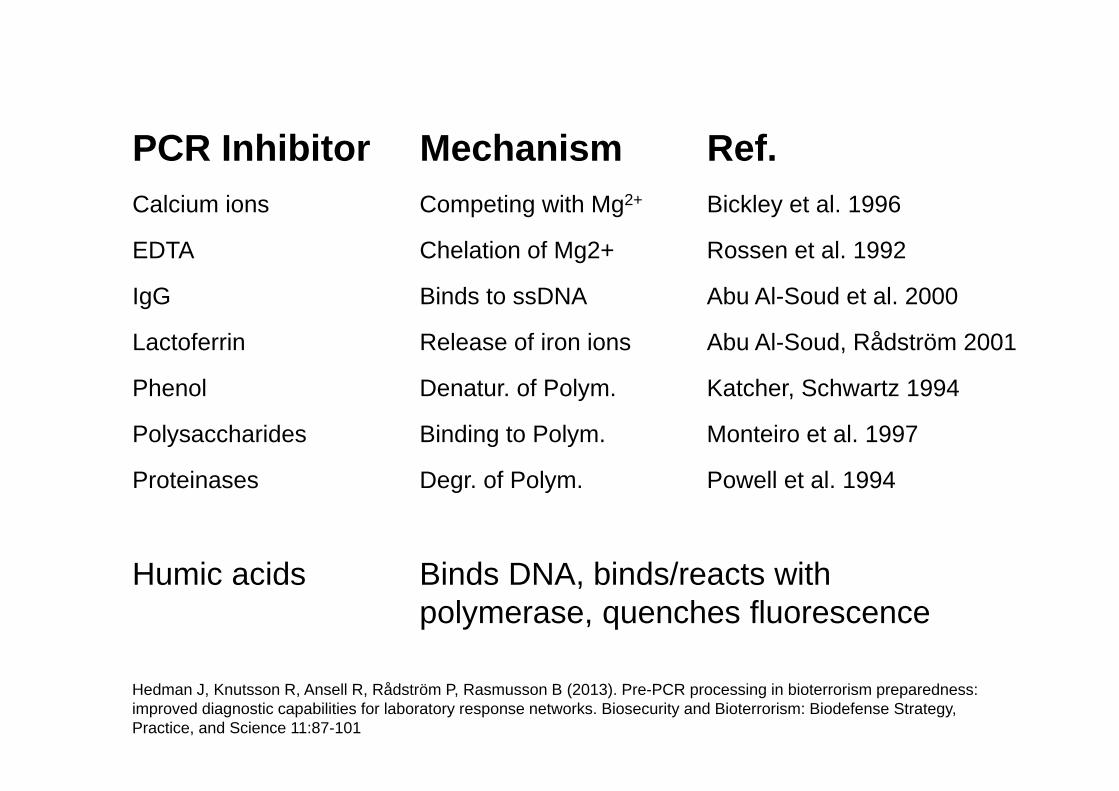
PCR Inhibitor Mechanism Ref.Calcium ions Competing with Mg2+ Bickley et al. 1996
EDTA Chelation of Mg2+ Rossen et al. 1992
IgG Binds to ssDNA Abu Al-Soud et al. 2000
Lactoferrin Release of iron ions Abu Al-Soud, Rådström 2001
Phenol Denatur. of Polym. Katcher, Schwartz 1994
Polysaccharides Binding to Polym. Monteiro et al. 1997
Proteinases Degr. of Polym. Powell et al. 1994
Humic acids Binds DNA, binds/reacts with polymerase, quenches fluorescence
Hedman J, Knutsson R, Ansell R, Rådström P, Rasmusson B (2013). Pre-PCR processing in bioterrorism preparedness: improved diagnostic capabilities for laboratory response networks. Biosecurity and Bioterrorism: Biodefense Strategy, Practice, and Science 11:87-101
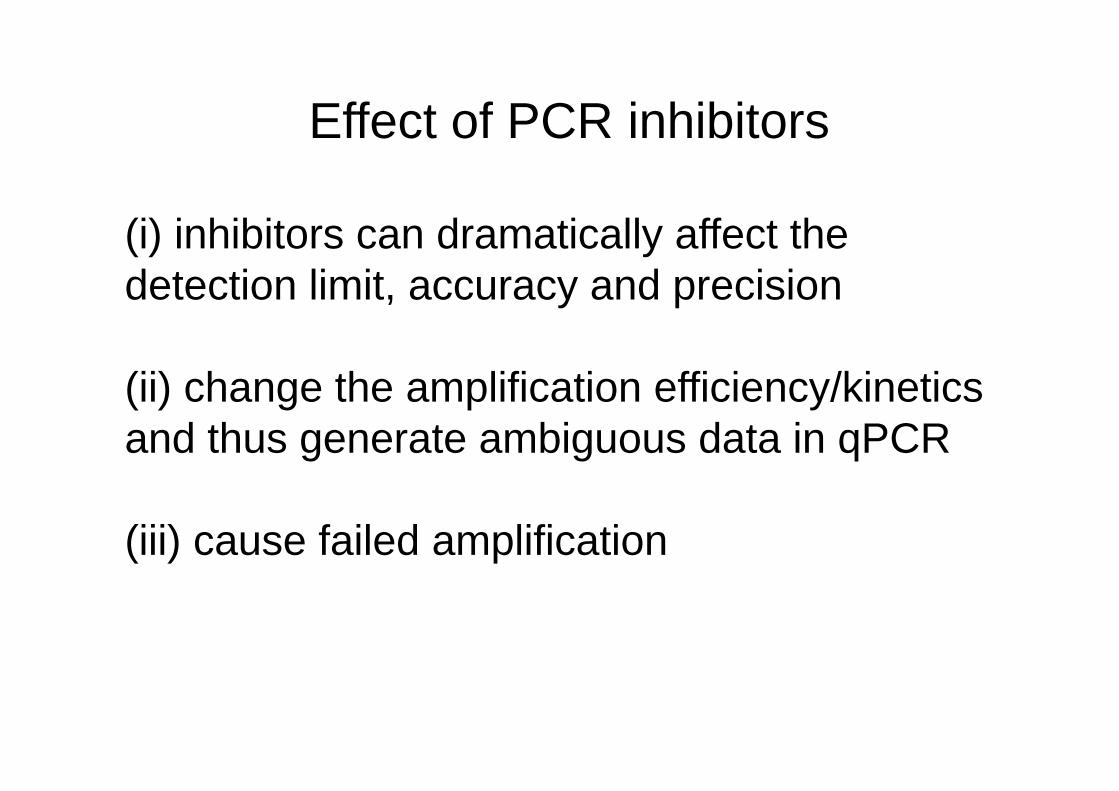
Effect of PCR inhibitors
(i) inhibitors can dramatically affect the detection limit, accuracy and precision
(ii) change the amplification efficiency/kinetics and thus generate ambiguous data in qPCR
(iii) cause failed amplification
Arti
cles
on
PC
R
0
5000
10000
15000
20000
25000
30000
1986 1990 1994 1998 2002 2006 2010
Year
PCR in the literature
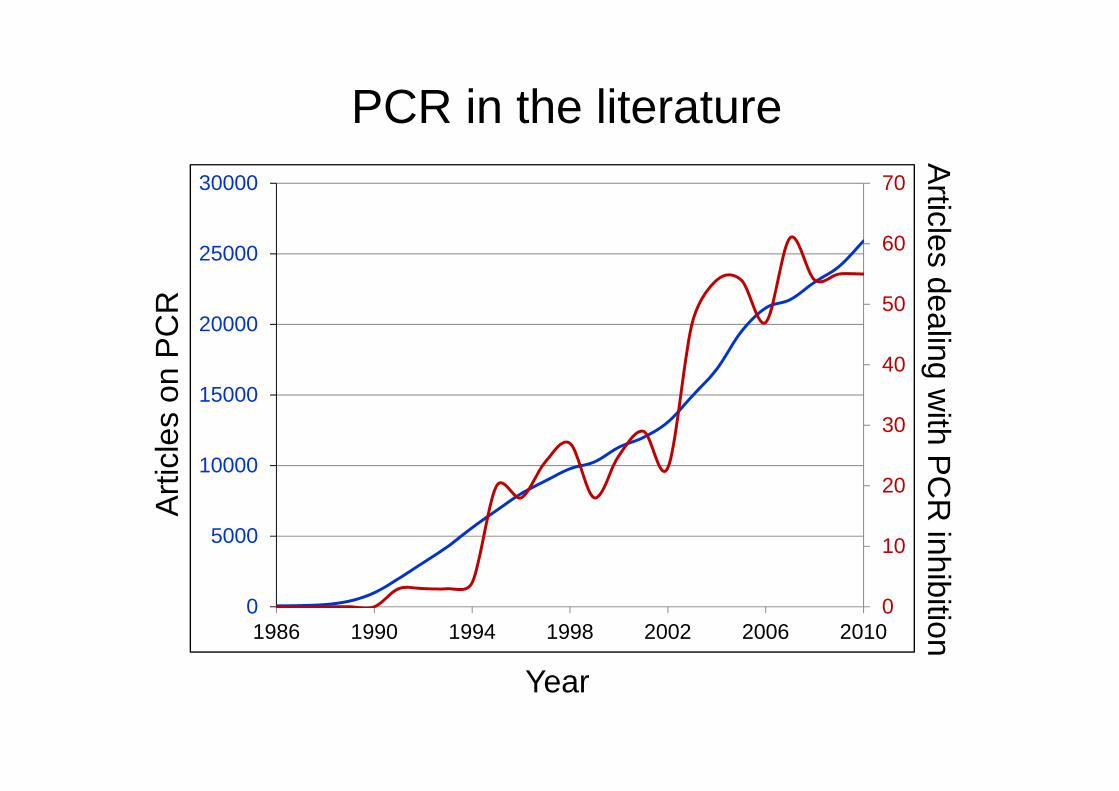
Arti
cles
on
PC
RA
rticles dealing with P
CR
inhibition
0
10
20
30
40
50
60
70
0
5000
10000
15000
20000
25000
30000
1986 1990 1994 1998 2002 2006 2010
Year
PCR in the literature
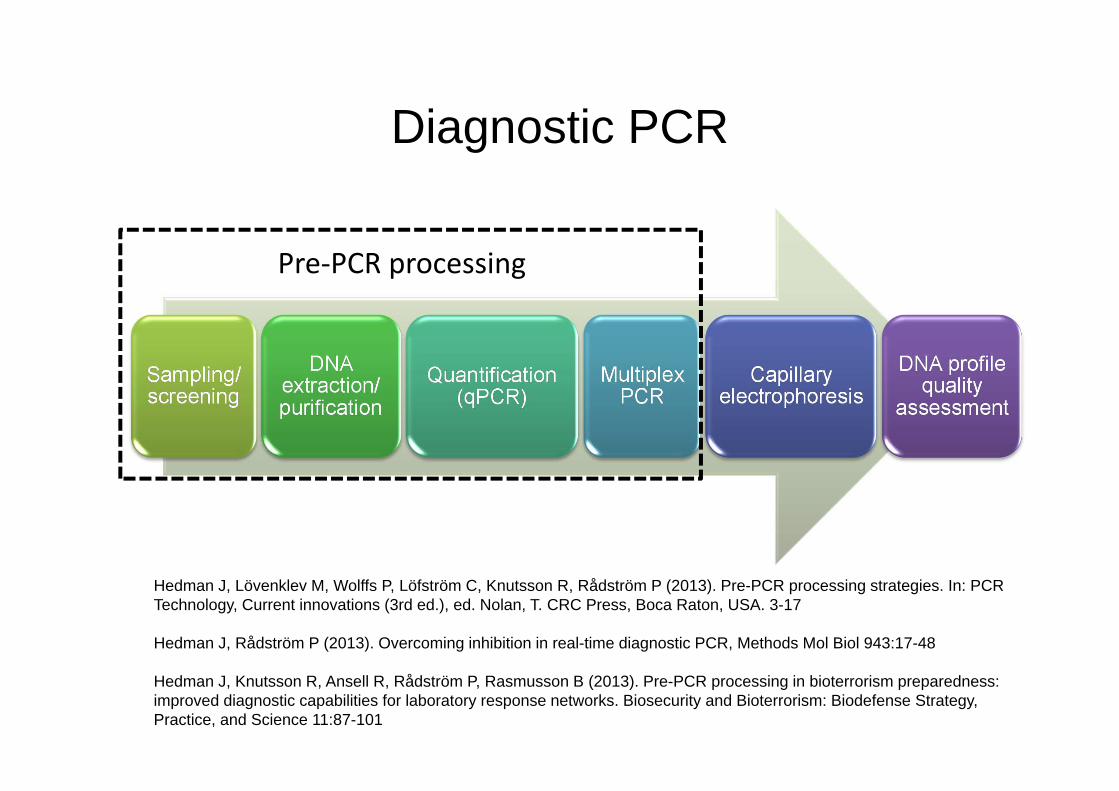
Diagnostic PCR
Pre‐PCR processing
Hedman J, Lövenklev M, Wolffs P, Löfström C, Knutsson R, Rådström P (2013). Pre-PCR processing strategies. In: PCR Technology, Current innovations (3rd ed.), ed. Nolan, T. CRC Press, Boca Raton, USA. 3-17
Hedman J, Rådström P (2013). Overcoming inhibition in real-time diagnostic PCR, Methods Mol Biol 943:17-48
Hedman J, Knutsson R, Ansell R, Rådström P, Rasmusson B (2013). Pre-PCR processing in bioterrorism preparedness: improved diagnostic capabilities for laboratory response networks. Biosecurity and Bioterrorism: Biodefense Strategy, Practice, and Science 11:87-101
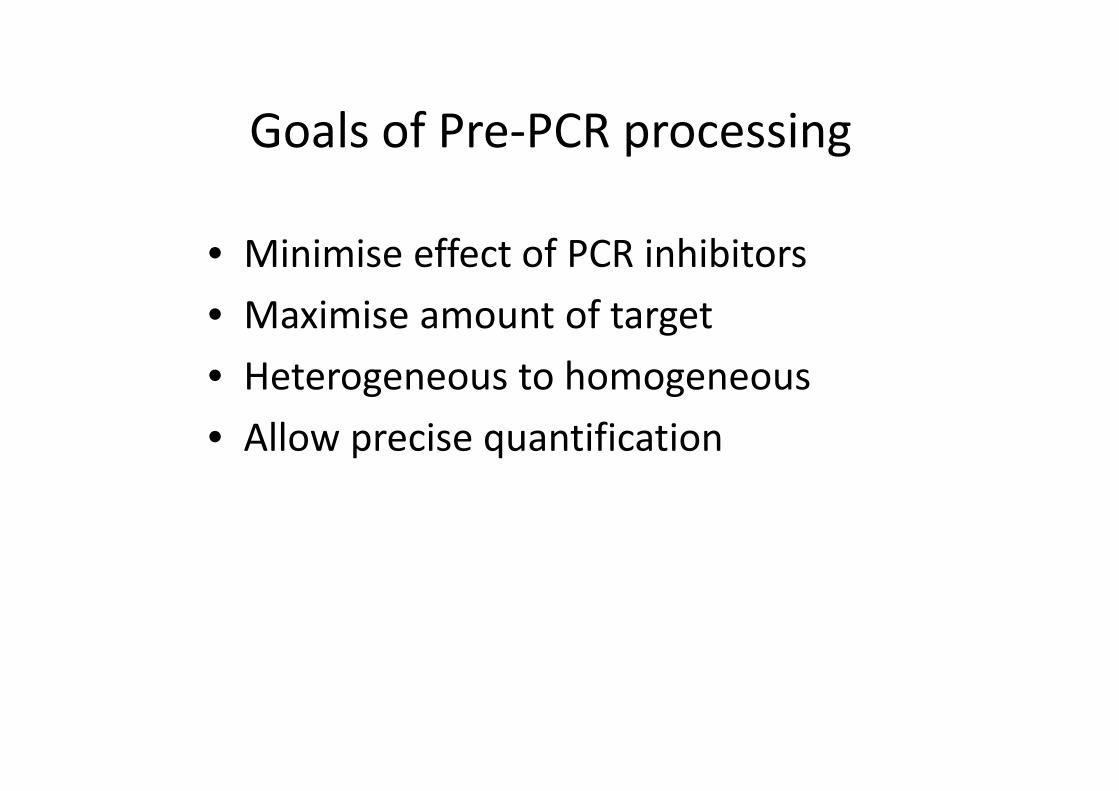
Goals of Pre‐PCR processing
• Minimise effect of PCR inhibitors• Maximise amount of target• Heterogeneous to homogeneous • Allow precise quantification
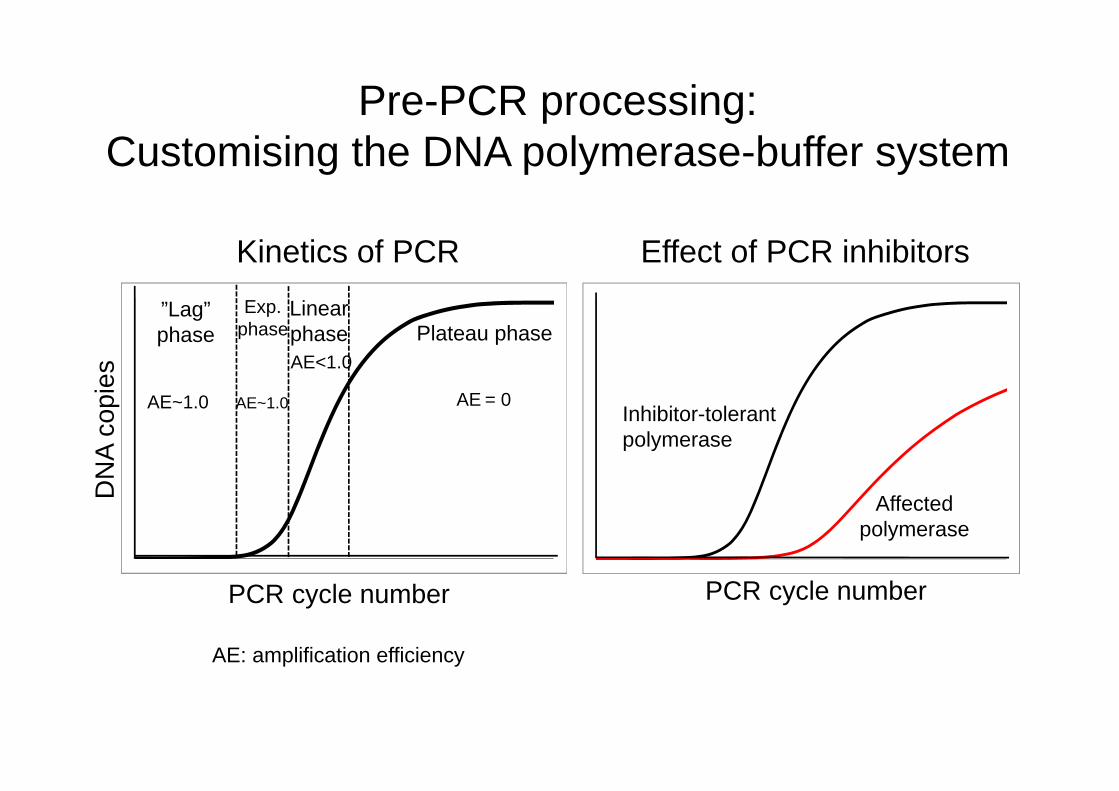
Pre-PCR processing: Customising the DNA polymerase-buffer system
0
”Lag” phase
Linearphase Plateau phase
Exp. phase
PCR cycle number
DN
A co
pies
AE~1.0
AE<1.0
AE~1.0 AE = 0
0
Kinetics of PCR Effect of PCR inhibitors
PCR cycle number
Affected polymerase
Inhibitor-tolerant polymerase
AE: amplification efficiency
PCR cycle number
Fluo
resc
ence
inte
nsity
(D
NA
copi
es)
0
1
2
10 15 20 25 30 35 40 45
15
20
25
30
35
40
Log (input DNA concentration or cell number)
Qua
ntifi
catio
n cy
cle
(Cq)
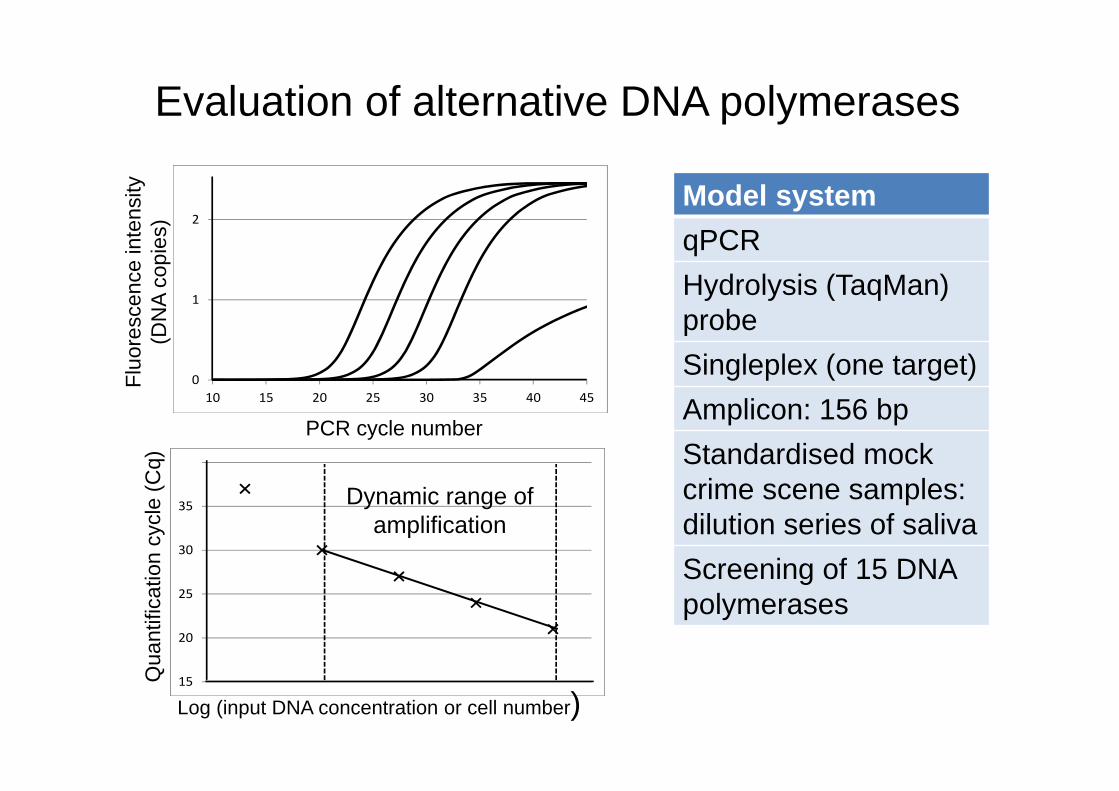
Dynamic range of amplification
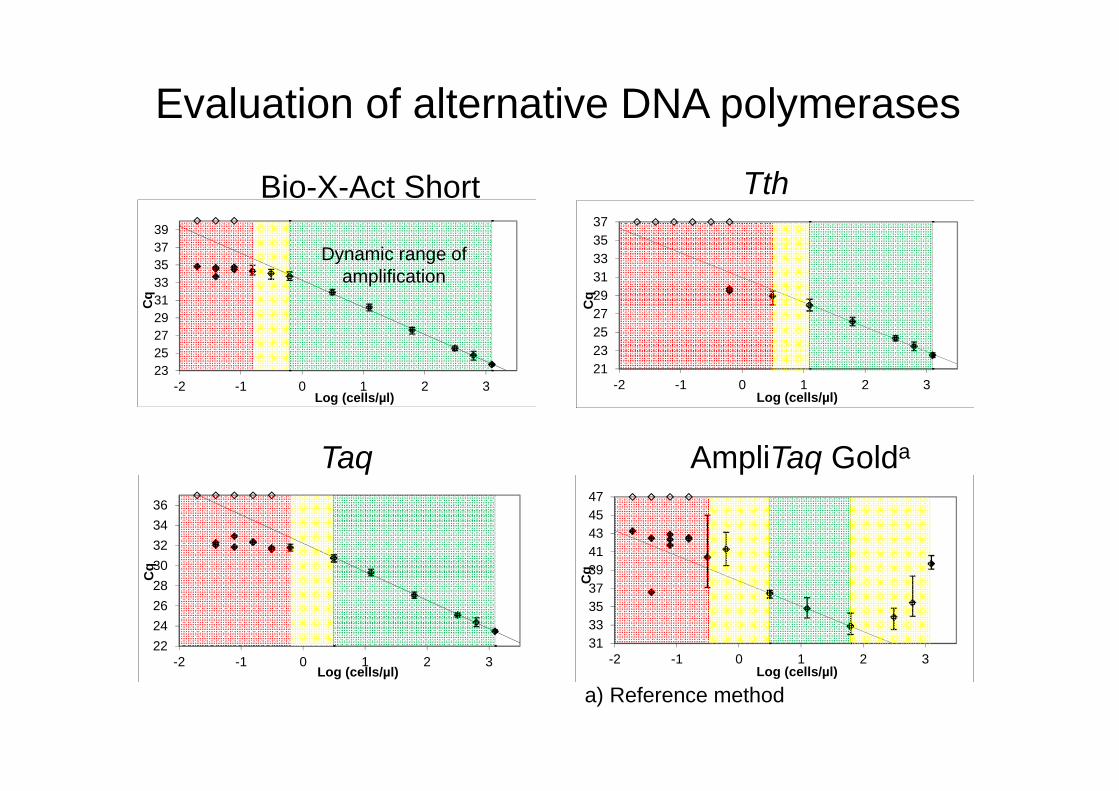
Evaluation of alternative DNA polymerases
Model systemqPCRHydrolysis (TaqMan) probeSingleplex (one target)Amplicon: 156 bpStandardised mockcrime scene samples:dilution series of salivaScreening of 15 DNA polymerases
232527293133353739
-2 -1 0 1 2 3
Cq
Log (cells/µl)
2224262830323436
-2 -1 0 1 2 3
Cq
Log (cells/µl)
Bio-X-Act Short
Taq
Dynamic range of amplification
Evaluation of alternative DNA polymerases
212325272931333537
-2 -1 0 1 2 3
Cq
Log (cells/µl)
Tth
313335373941434547
-2 -1 0 1 2 3
Cq
Log (cells/µl)
AmpliTaq Golda
a) Reference method
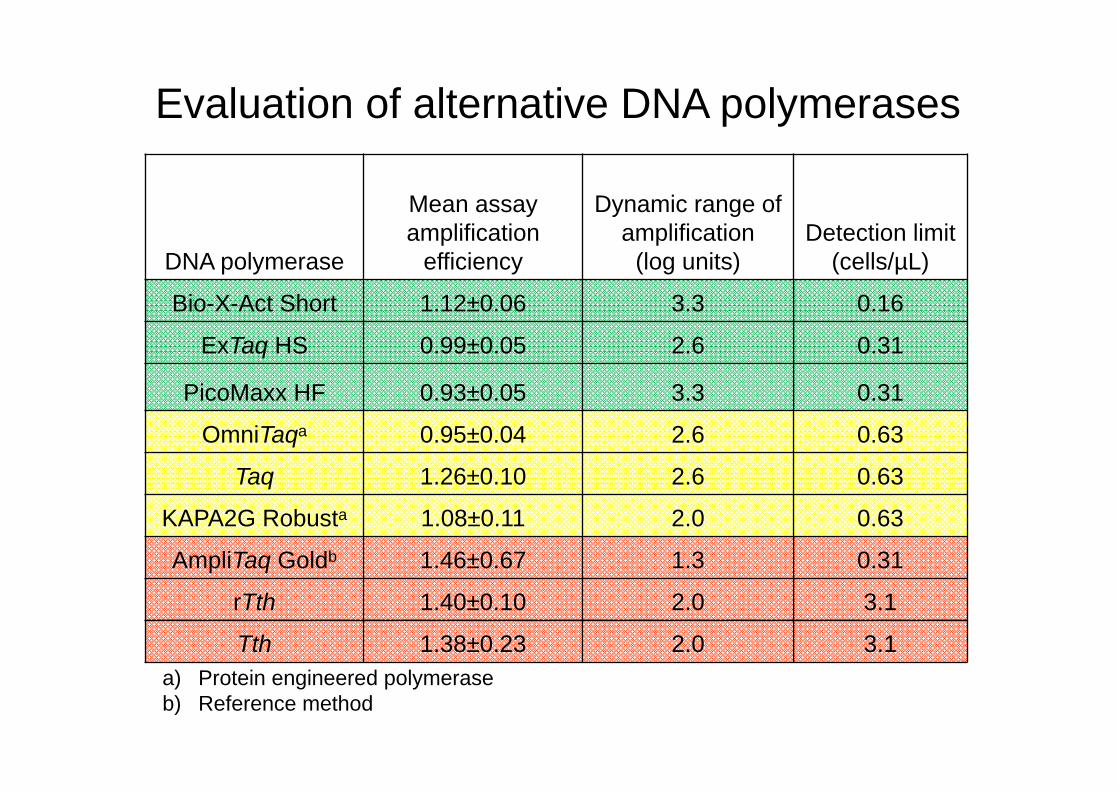
DNA polymerase
Mean assayamplification
efficiency
Dynamic range ofamplification
(log units)Detection limit
(cells/µL)
Bio-X-Act Short 1.12±0.06 3.3 0.16
ExTaq HS 0.99±0.05 2.6 0.31
PicoMaxx HF 0.93±0.05 3.3 0.31
OmniTaqa 0.95±0.04 2.6 0.63
Taq 1.26±0.10 2.6 0.63
KAPA2G Robusta 1.08±0.11 2.0 0.63
AmpliTaq Goldb 1.46±0.67 1.3 0.31
rTth 1.40±0.10 2.0 3.1
Tth 1.38±0.23 2.0 3.1a) Protein engineered polymeraseb) Reference method
Evaluation of alternative DNA polymerases
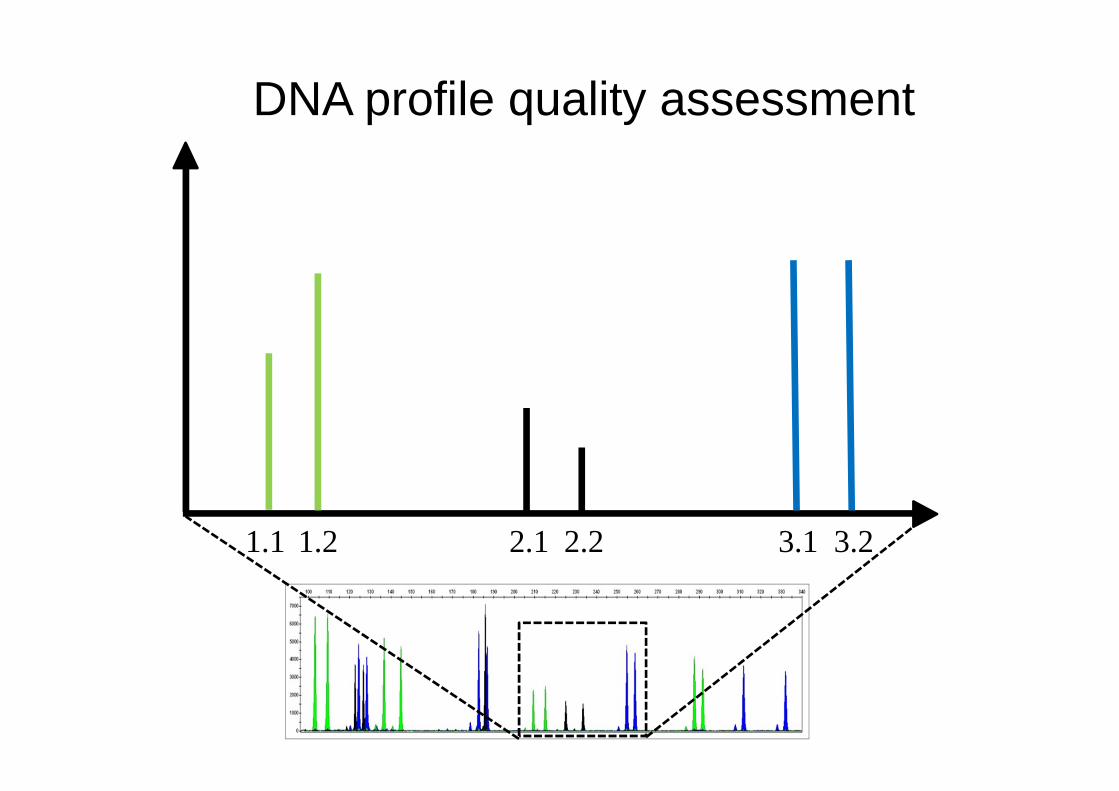
1.1 3.21.2 3.12.1 2.2
DNA profile quality assessment
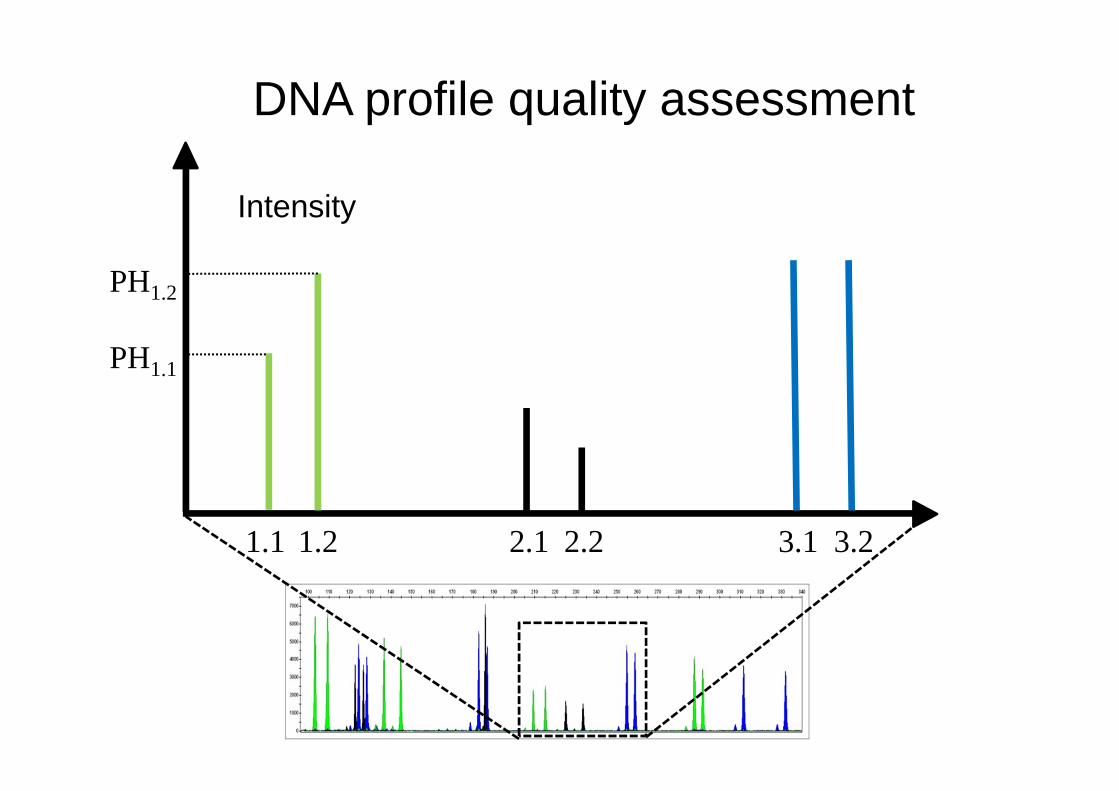
1.1 3.21.2 3.12.1 2.2
PH1.2
PH1.1
Intensity
DNA profile quality assessment
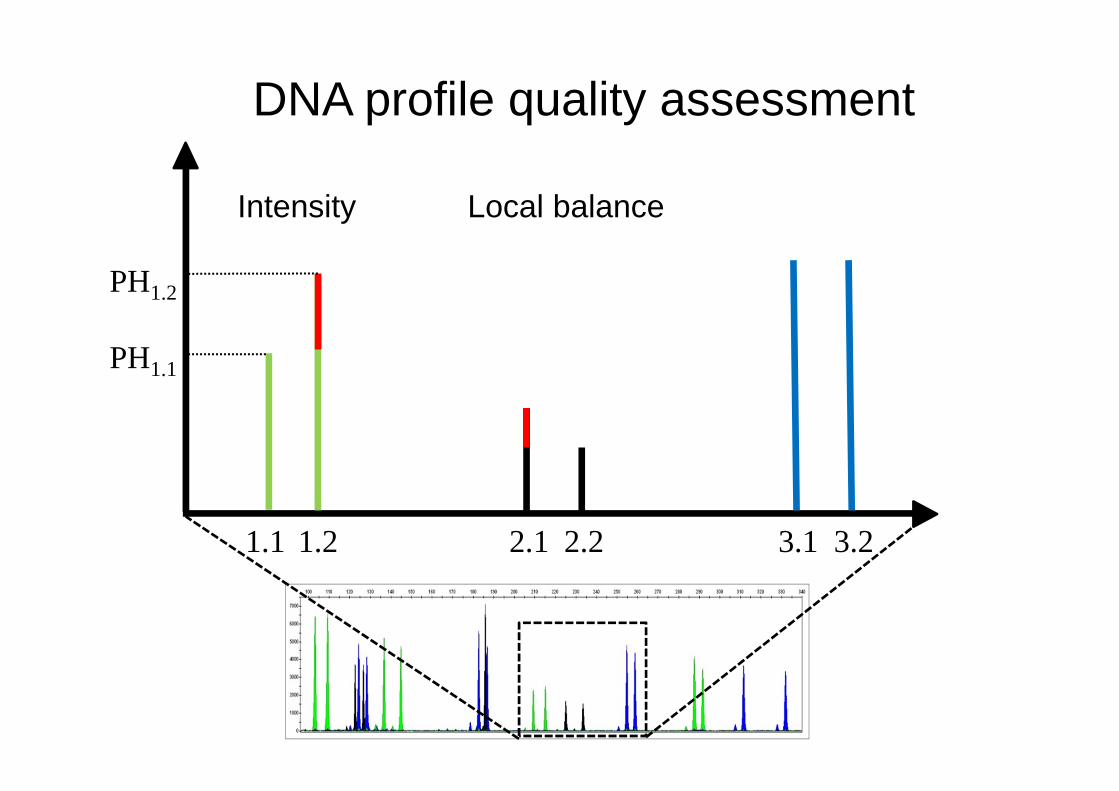
1.1 3.21.2 3.12.1 2.2
PH1.2
PH1.1
Intensity Local balance
DNA profile quality assessment
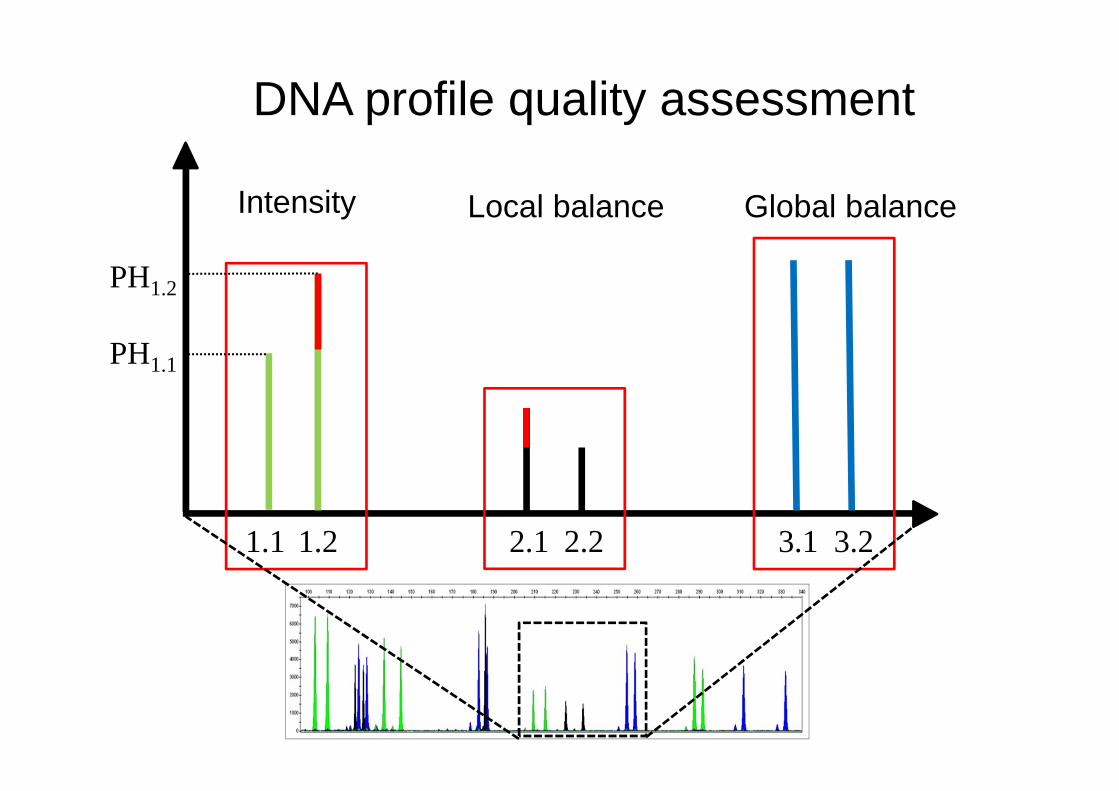
1.1 3.21.2 3.12.1 2.2
PH1.2
PH1.1
Intensity Local balance Global balance
DNA profile quality assessment
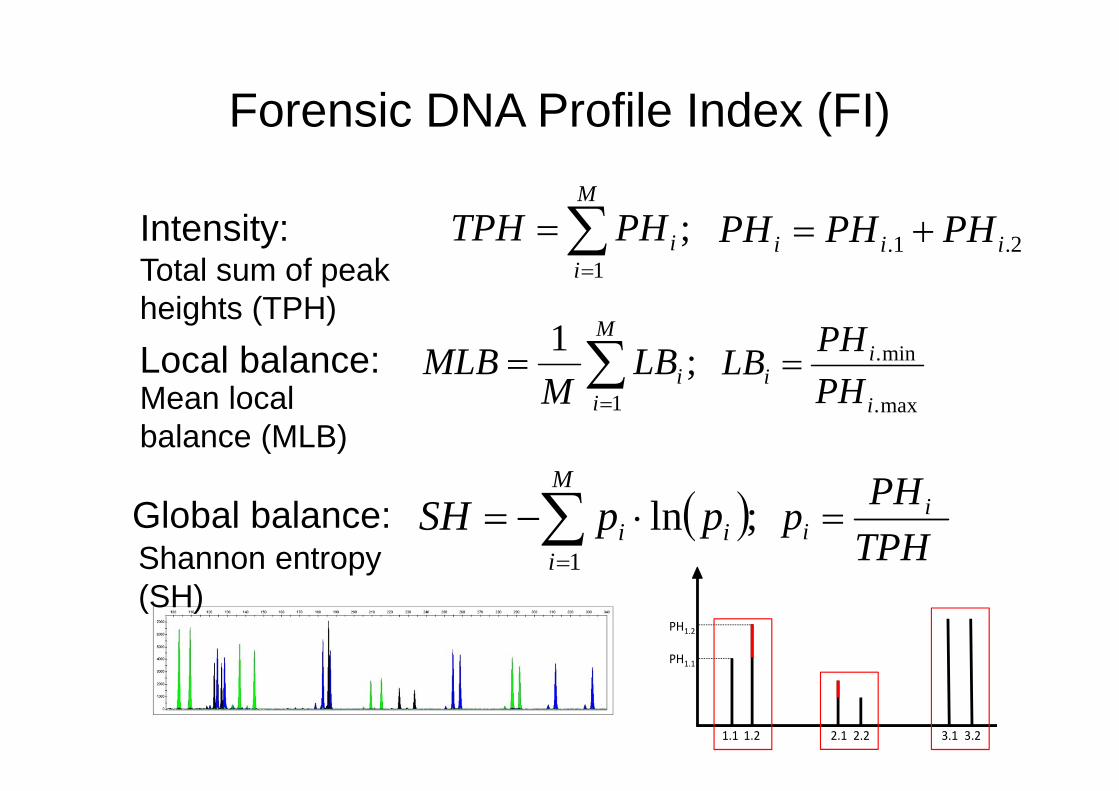
Forensic DNA Profile Index (FI)
;1
M
iiPHTPH
;11
M
iiLB
MMLB
;ln1
M
iii ppSH
Intensity:
Local balance:
Global balance:
2.1. iii PHPHPH
max.
min.
i
ii PH
PHLB
TPHPHp i
i
1.1 3.21.2 3.12.1 2.2
PH1.2
PH1.1
Total sum of peakheights (TPH)
Mean local balance (MLB)
Shannon entropy (SH)
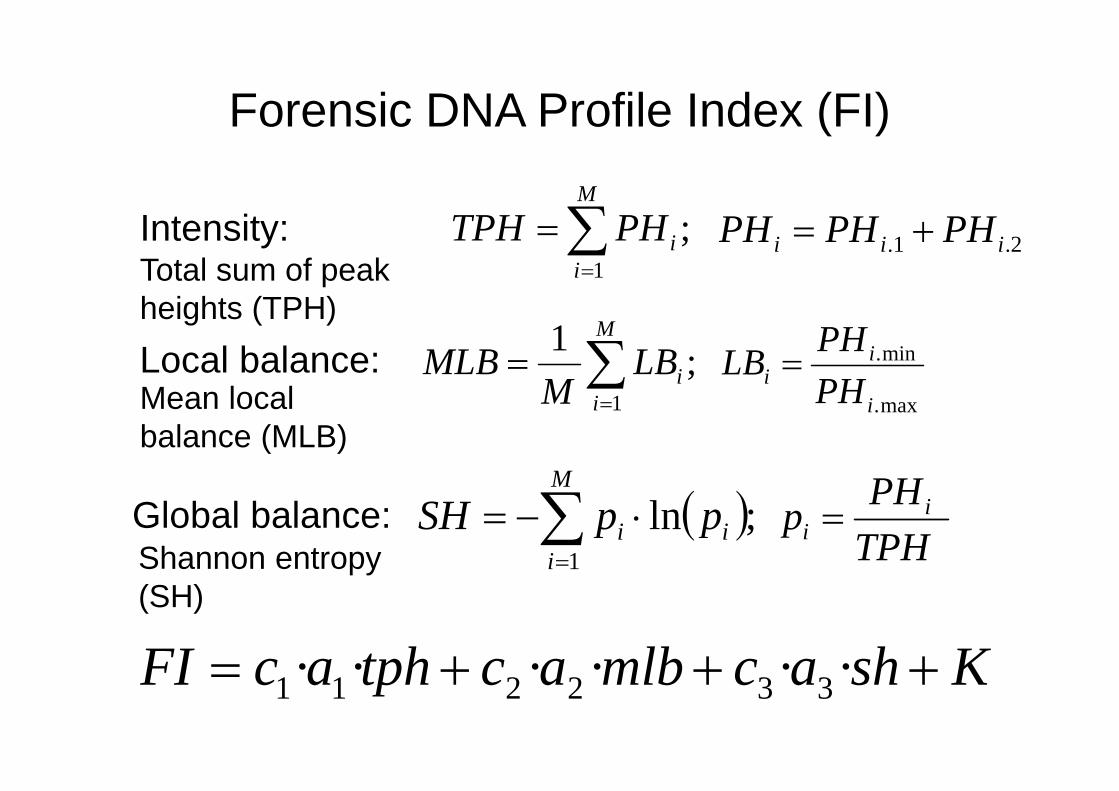
Forensic DNA Profile Index (FI)
;1
M
iiPHTPH
;11
M
iiLB
MMLB
;ln1
M
iii ppSH
KshacmlbactphacFI ······ 332211
2.1. iii PHPHPH
max.
min.
i
ii PH
PHLB
TPHPHp i
i
Intensity:
Local balance:
Global balance:
Total sum of peak heights (TPH)
Mean local balance (MLB)
Shannon entropy (SH)

DNA 0.19 ng/µL
Alternative DNA polymerases in forensic analysis
FI values:a) 0.05b) 0.50c) 10.85d) 13.85
ExTaq HS/PicoMaxx HF blendd
ExTaq HSb
PicoMaxx HFc
AmpliTaq Golda
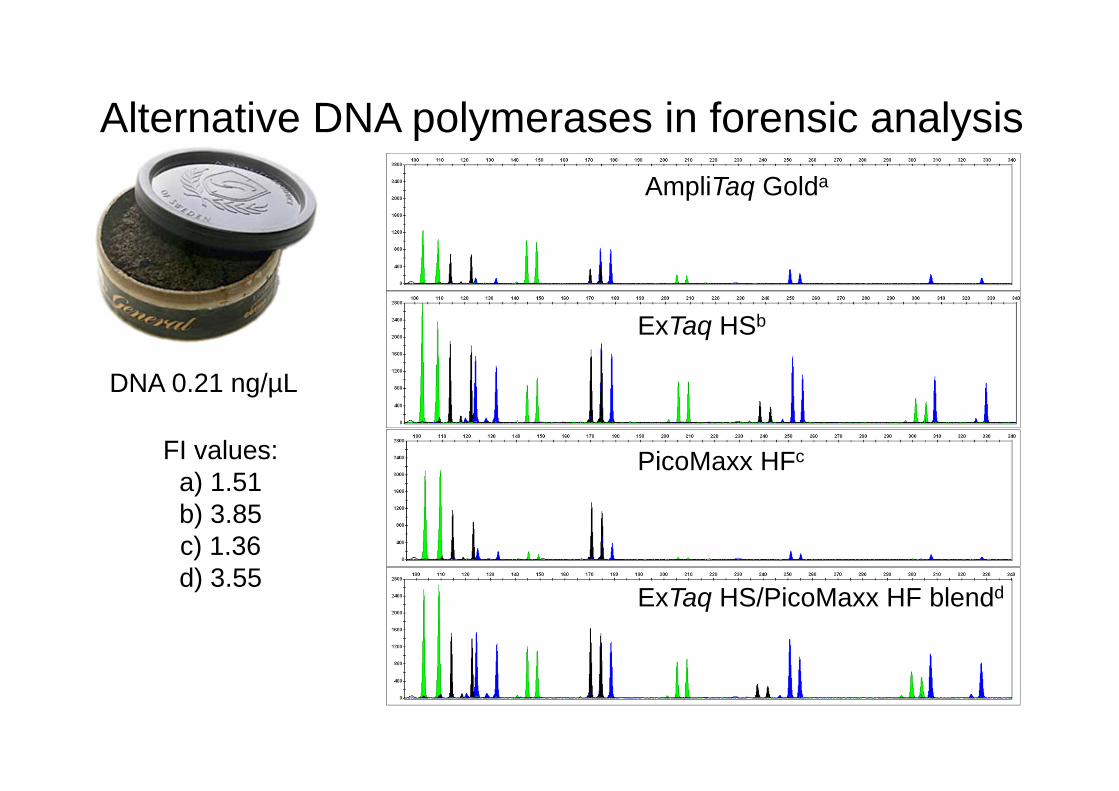
DNA 0.21 ng/µL
Alternative DNA polymerases in forensic analysis
ExTaq HS/PicoMaxx HF blendd
ExTaq HSb
PicoMaxx HFc
AmpliTaq Golda
FI values:a) 1.51b) 3.85c) 1.36d) 3.55
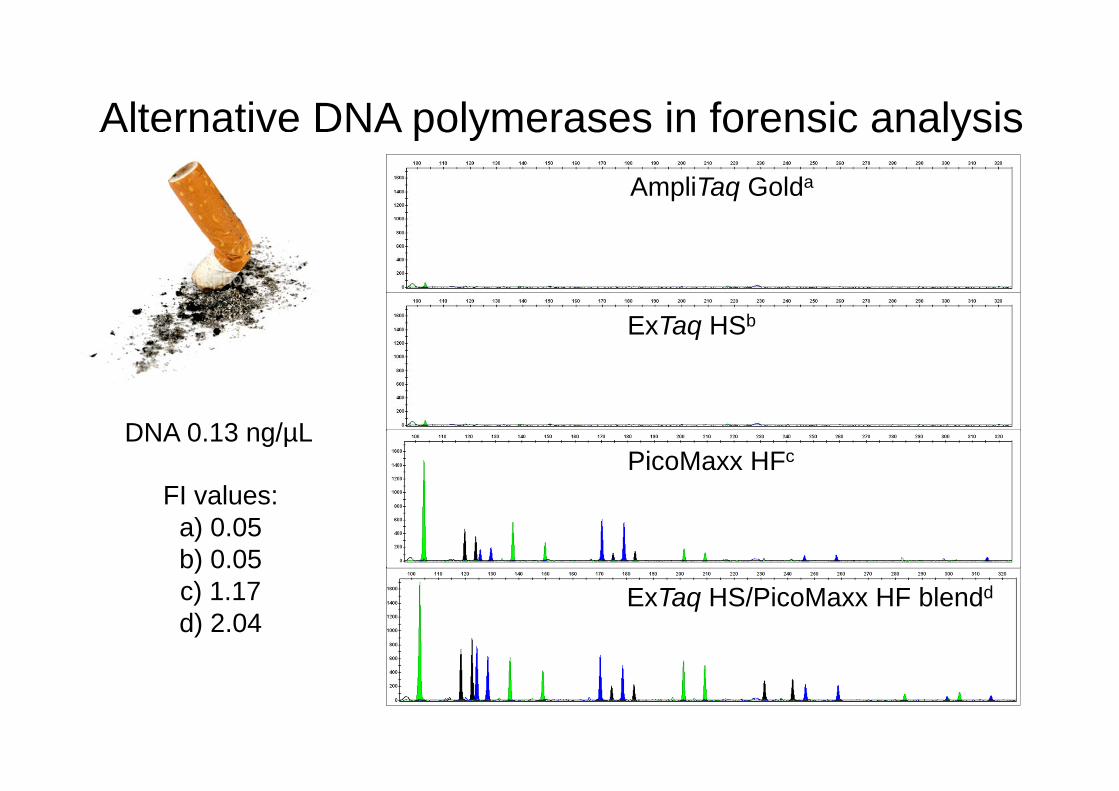
DNA 0.13 ng/µL
Alternative DNA polymerases in forensic analysis
FI values:a) 0.05b) 0.05c) 1.17d) 2.04
AmpliTaq Golda
ExTaq HS/PicoMaxx HF blendd
ExTaq HSb
PicoMaxx HFc
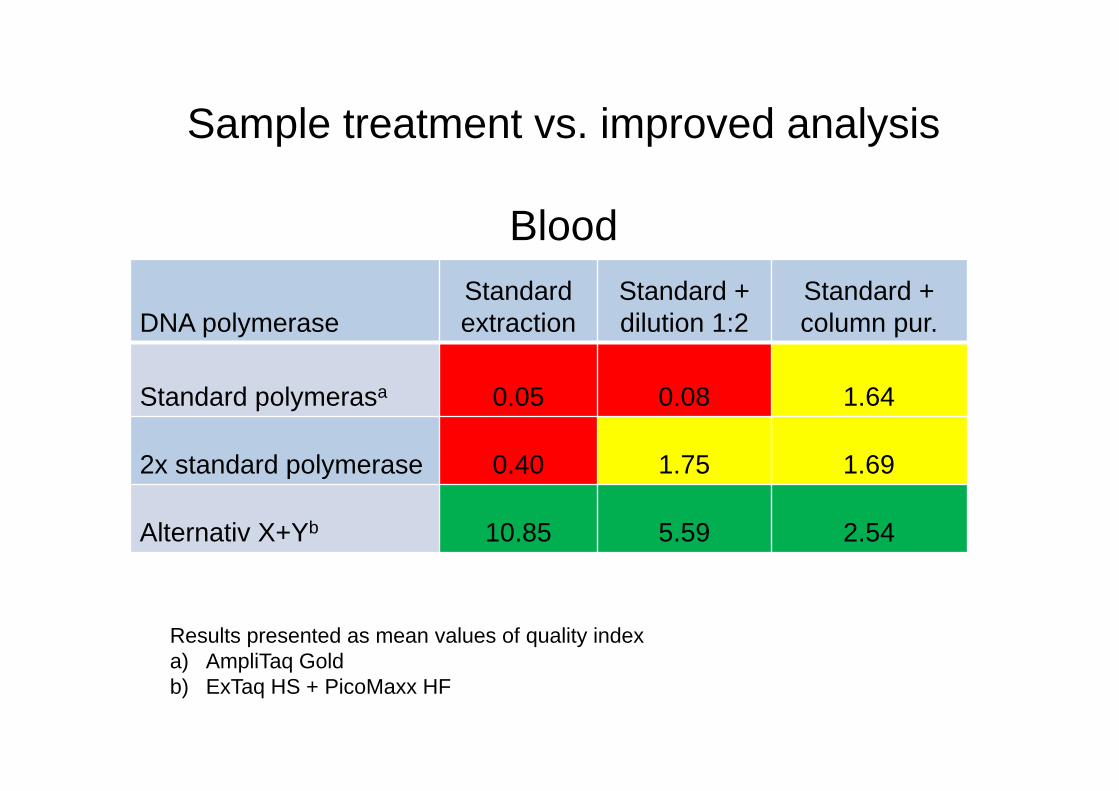
Sample treatment vs. improved analysis
Blood
DNA polymeraseStandard extraction
Standard + dilution 1:2
Standard +column pur.
Standard polymerasa 0.05 0.08 1.64
2x standard polymerase 0.40 1.75 1.69
Alternativ X+Yb 10.85 5.59 2.54
Results presented as mean values of quality indexa) AmpliTaq Goldb) ExTaq HS + PicoMaxx HF
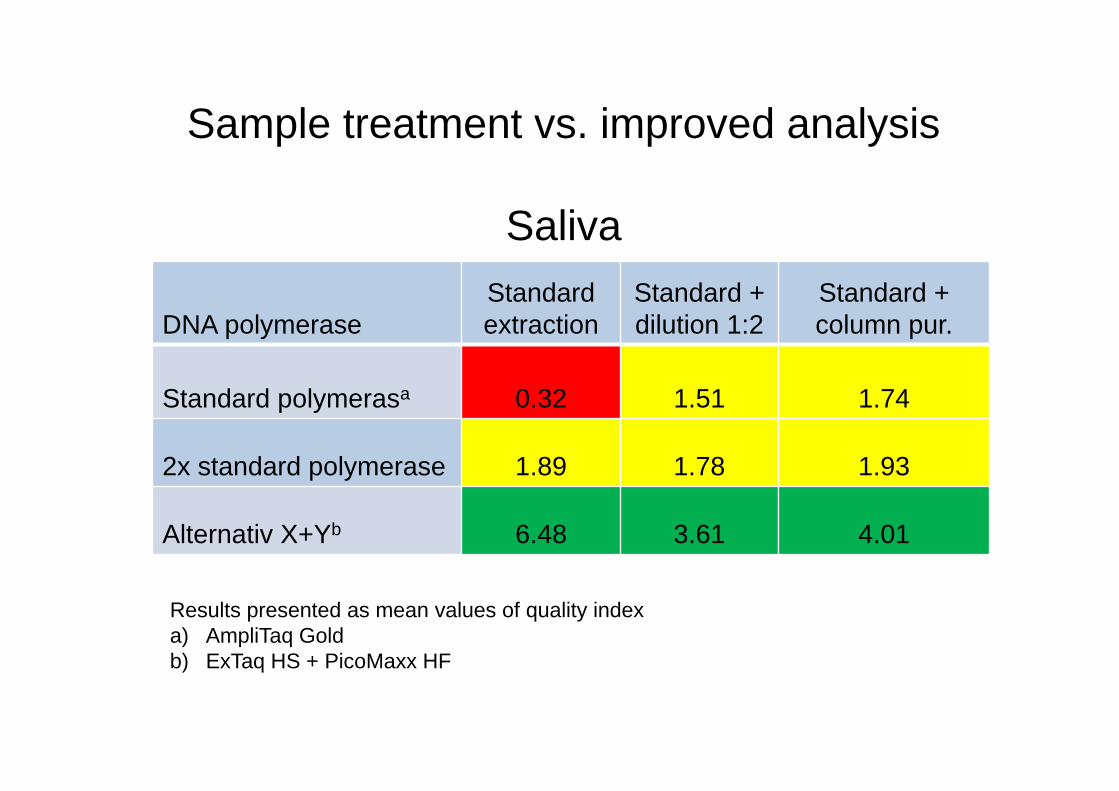
DNA polymeraseStandard extraction
Standard + dilution 1:2
Standard +column pur.
Standard polymerasa 0.32 1.51 1.74
2x standard polymerase 1.89 1.78 1.93
Alternativ X+Yb 6.48 3.61 4.01
Results presented as mean values of quality indexa) AmpliTaq Goldb) ExTaq HS + PicoMaxx HF
Sample treatment vs. improved analysis
Saliva
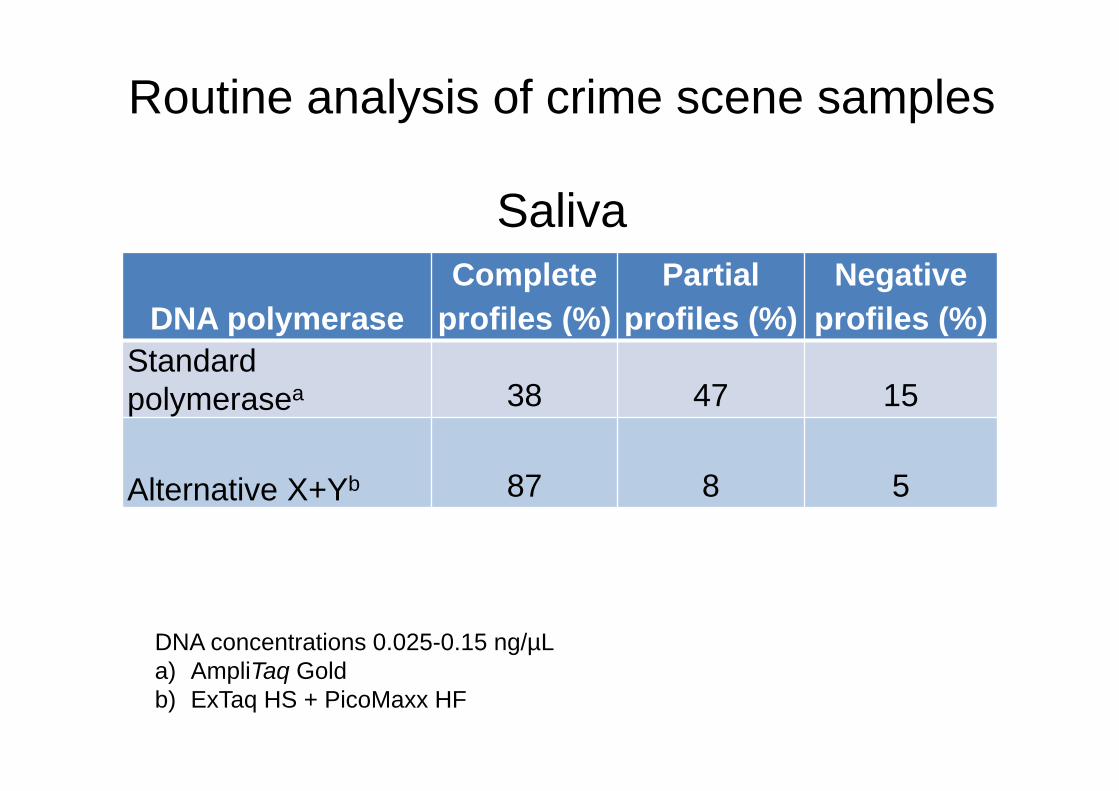
Routine analysis of crime scene samples
Saliva
DNA polymeraseComplete
profiles (%)Partial
profiles (%)Negative
profiles (%)Standard polymerasea 38 47 15
Alternative X+Yb 87 8 5
DNA concentrations 0.025-0.15 ng/µLa) AmpliTaq Goldb) ExTaq HS + PicoMaxx HF
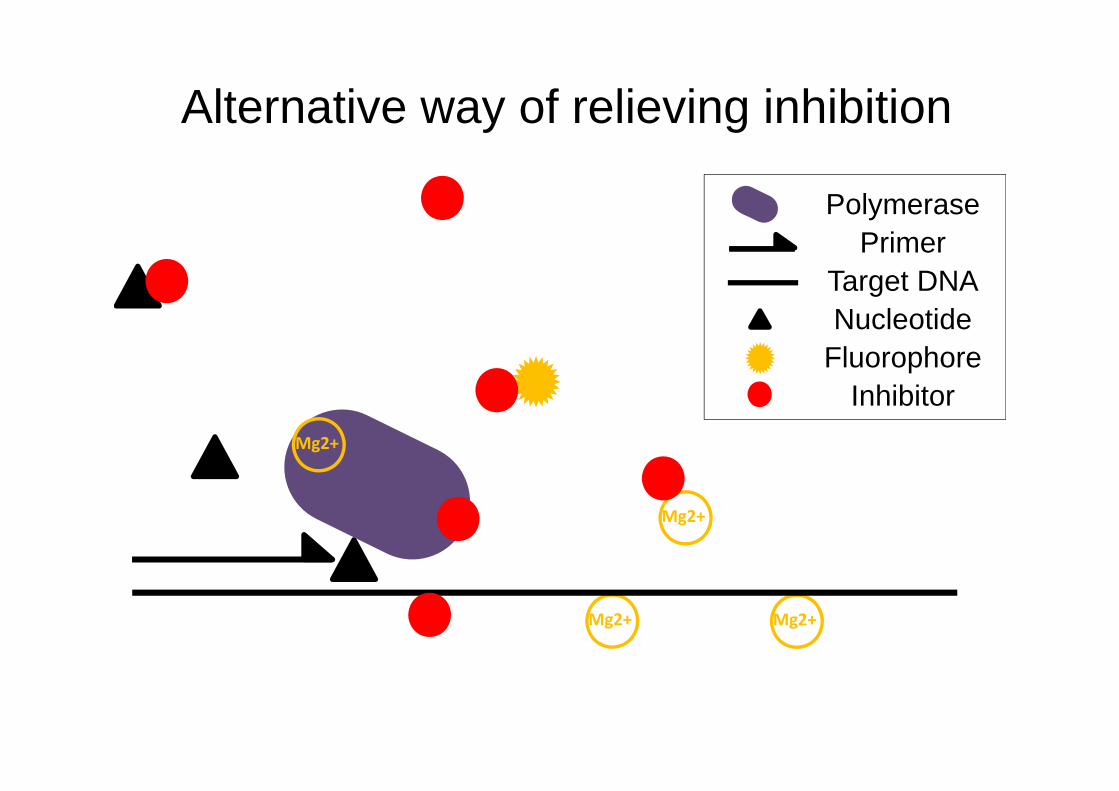
Mg2+ Mg2+
Mg2+
Mg2+
PolymerasePrimer
Target DNANucleotide
FluorophoreInhibitor
Alternative way of relieving inhibition
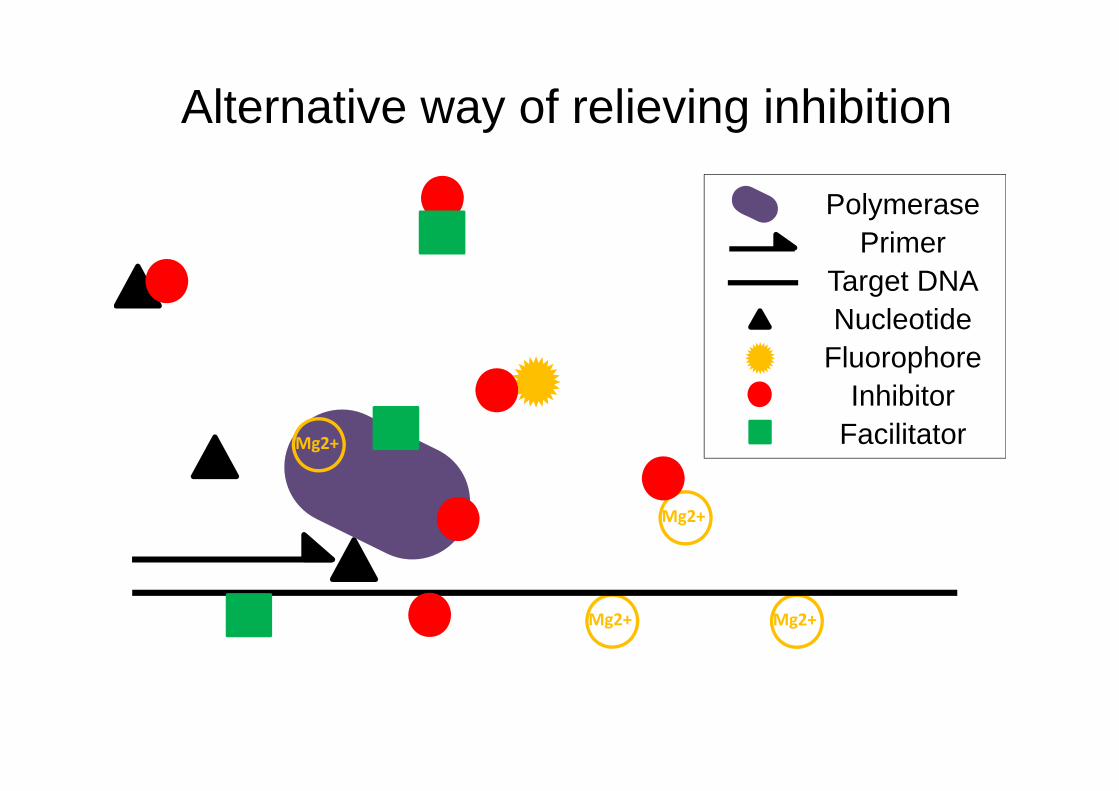
Mg2+ Mg2+
Mg2+
Mg2+
PolymerasePrimer
Target DNANucleotide
FluorophoreInhibitor
Facilitator
Alternative way of relieving inhibition
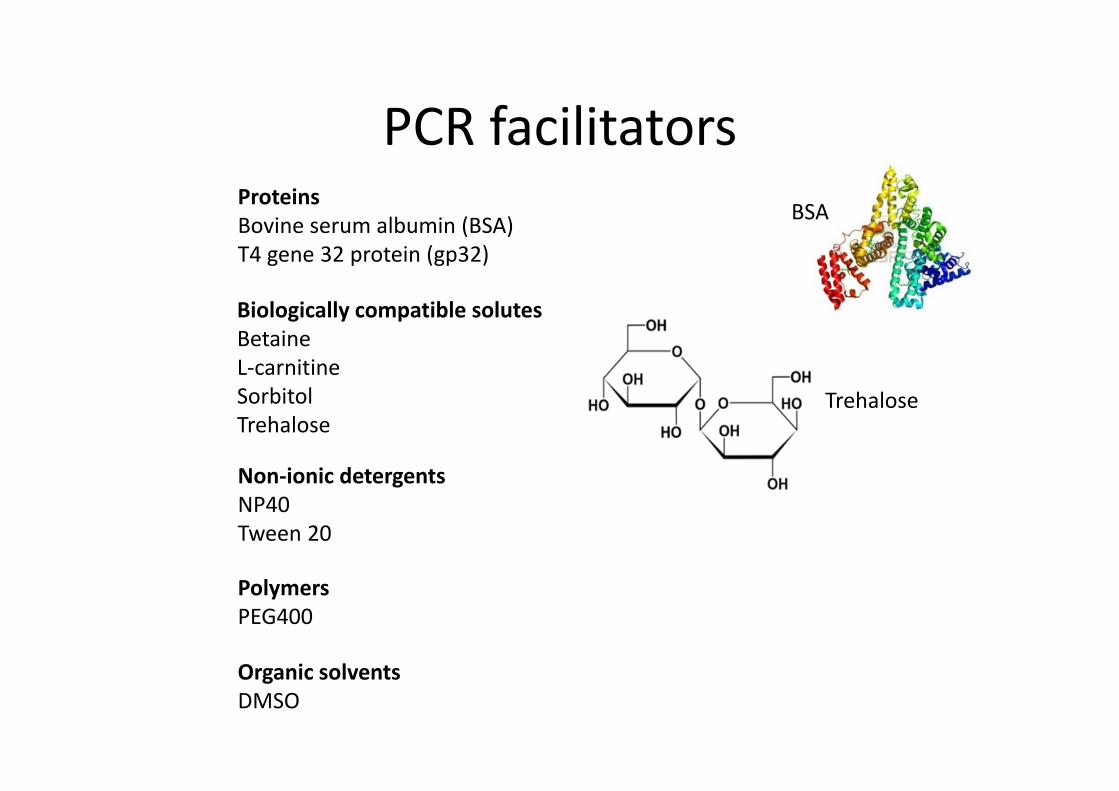
PCR facilitators
Organic solventsDMSO
Non‐ionic detergentsNP40Tween 20
PolymersPEG400
ProteinsBovine serum albumin (BSA) T4 gene 32 protein (gp32)
BSA
Biologically compatible solutesBetaineL‐carnitineSorbitolTrehalose
Trehalose
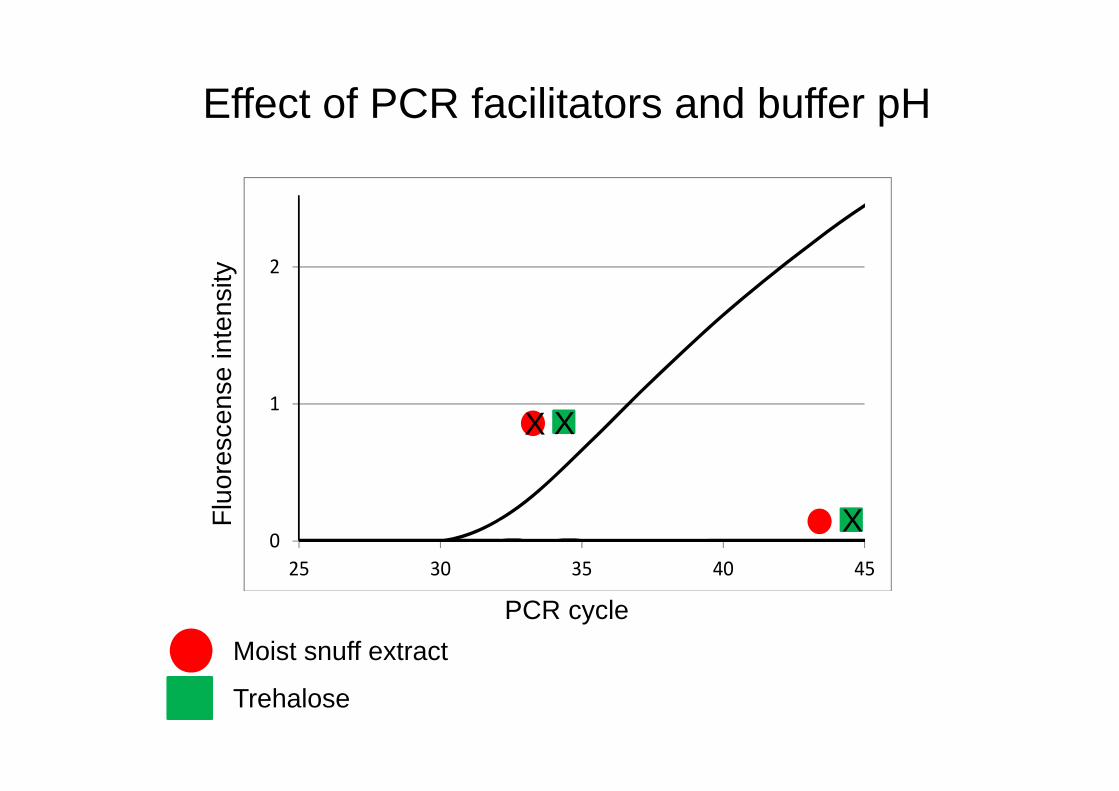
0
1
2
25 30 35 40 45
23
PCR cycle
Fluo
resc
ense
inte
nsity
X X
Trehalose
Moist snuff extract
X
Effect of PCR facilitators and buffer pH
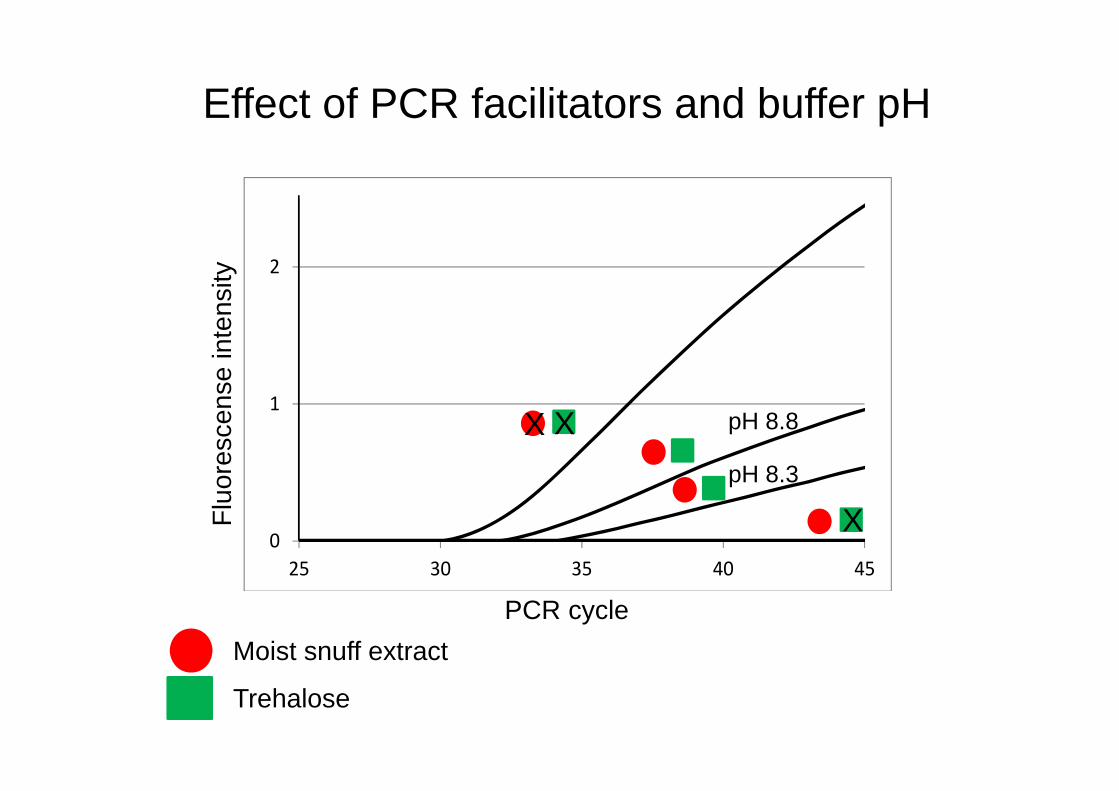
0
1
2
25 30 35 40 45
pH 8.3
PCR cycle
Fluo
resc
ense
inte
nsity
Trehalose
pH 8.8
Moist snuff extract
X
X X
Effect of PCR facilitators and buffer pH

Questions?
Recommended