Ying
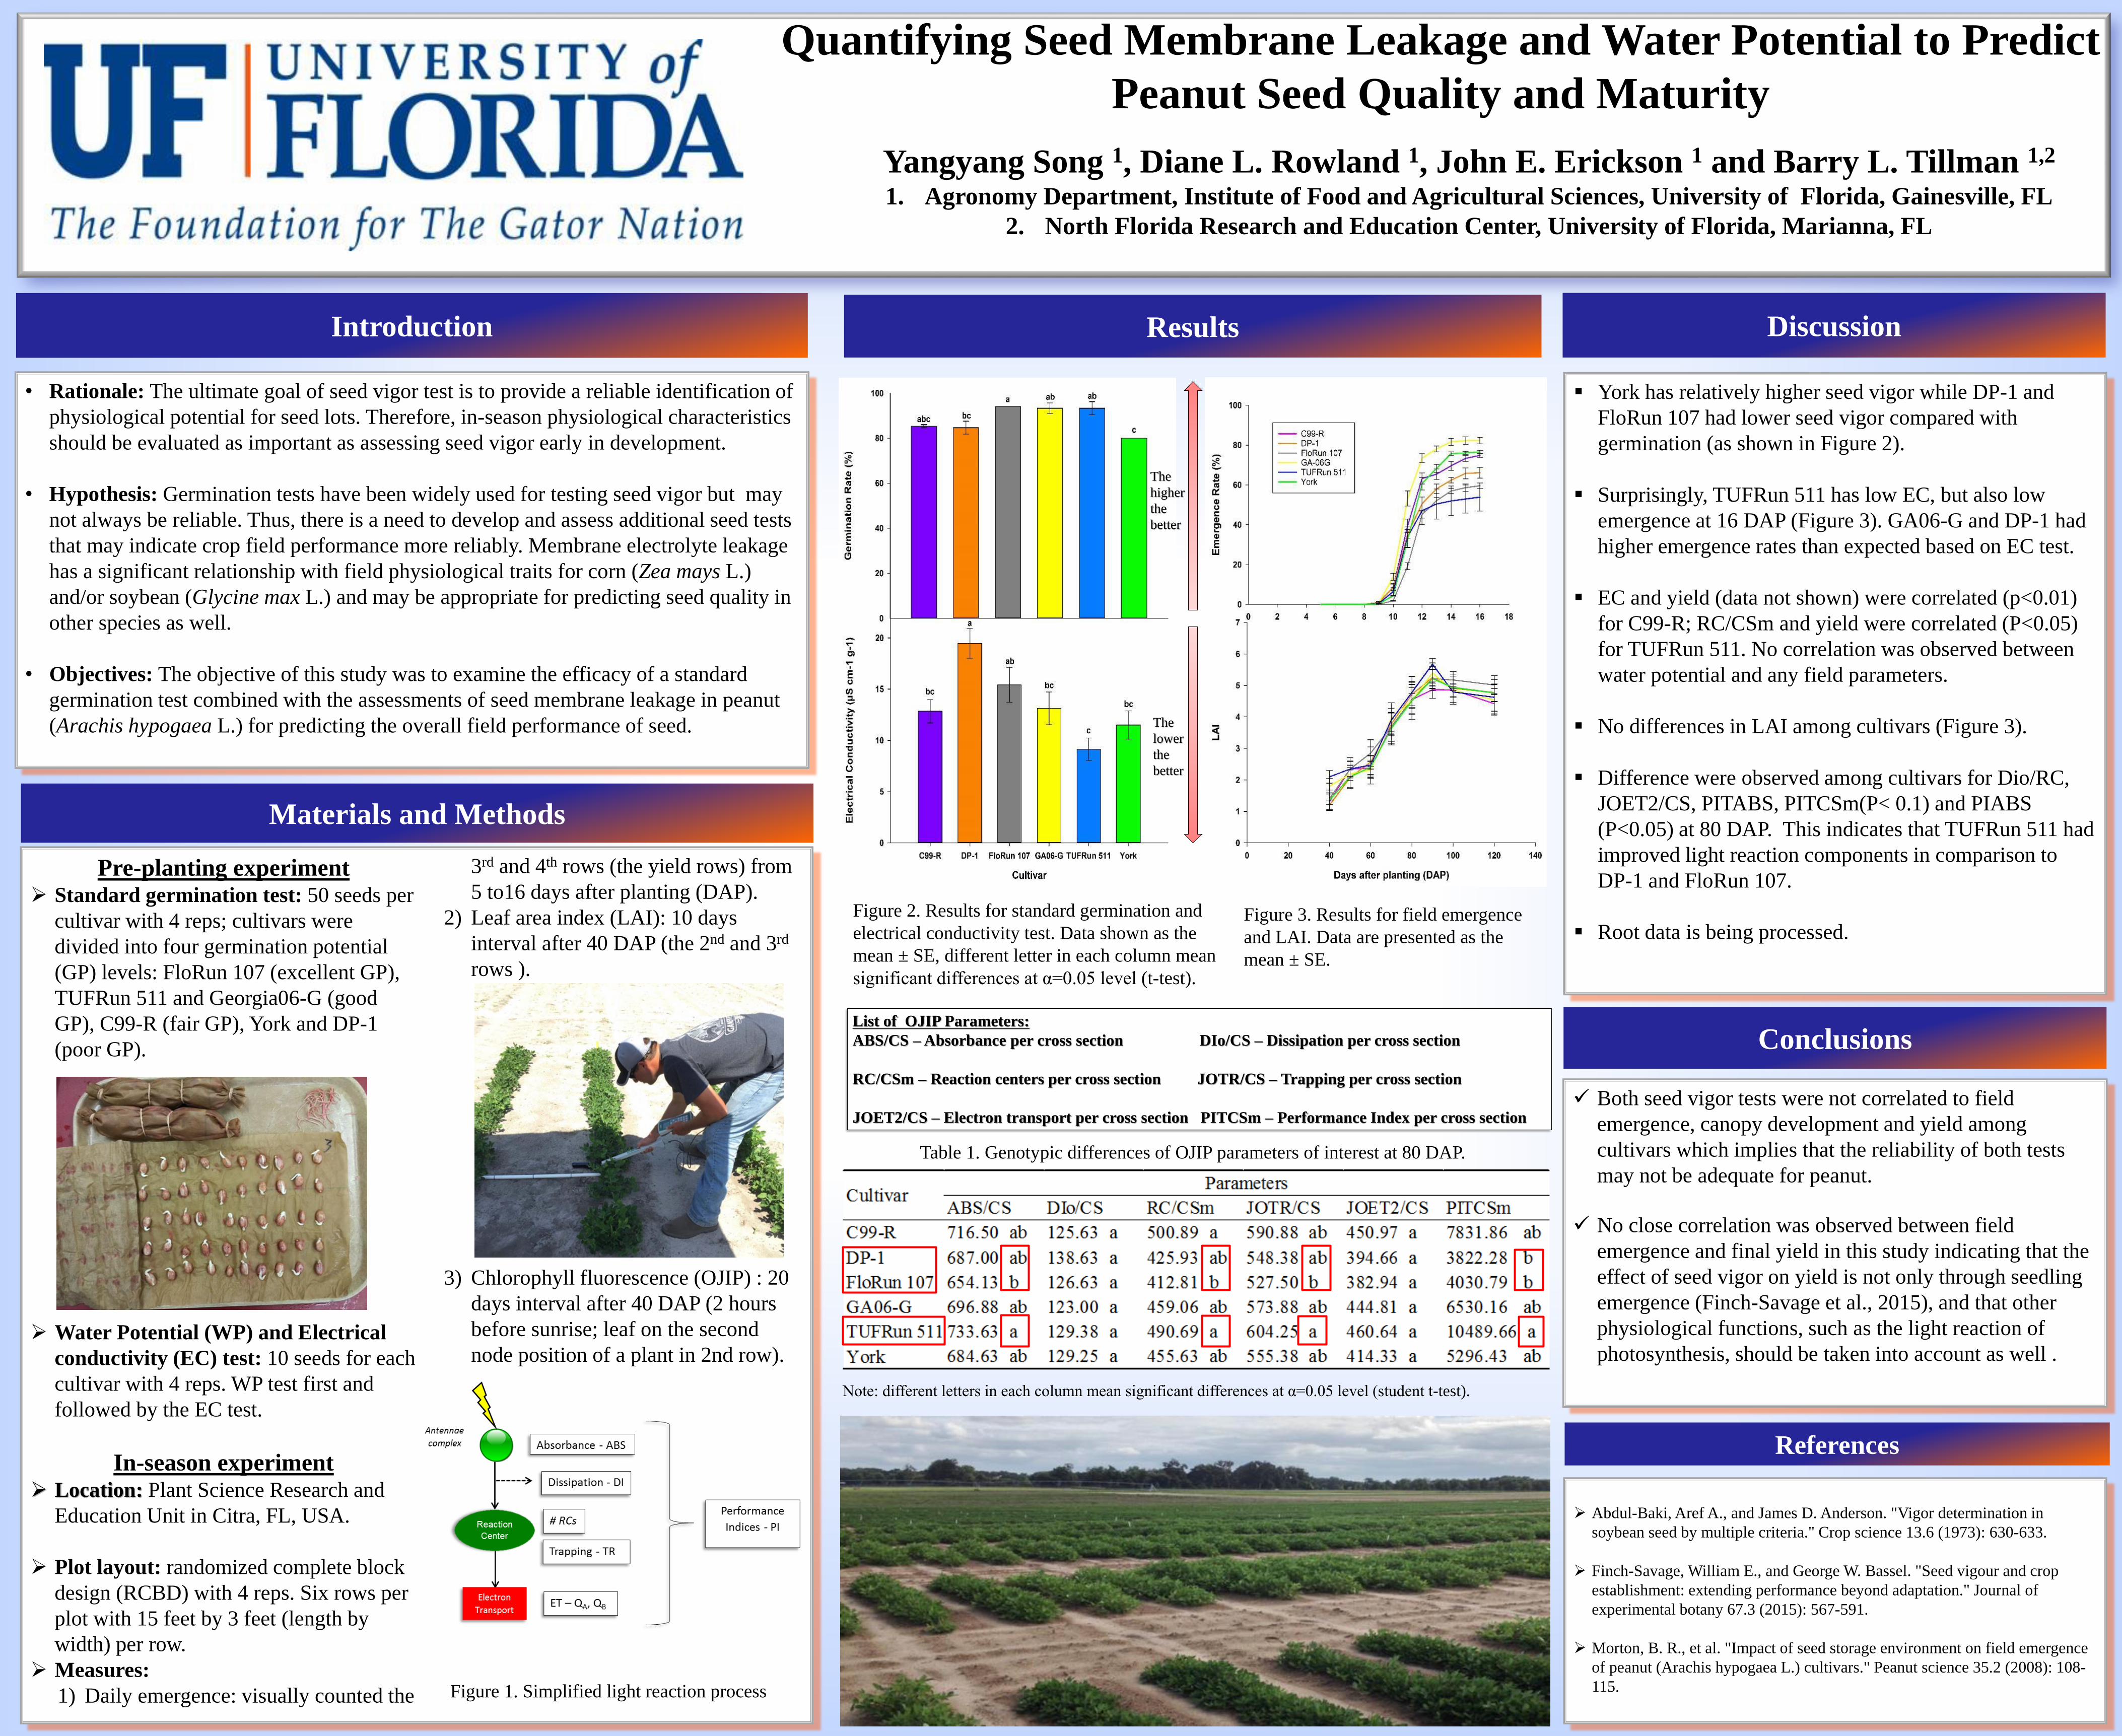
York has relatively higher seed vigor while DP-1 and
FloRun 107 had lower seed vigor compared with
germination (as shown in Figure 2).
Surprisingly, TUFRun 511 has low EC, but also low
emergence at 16 DAP (Figure 3). GA06-G and DP-1 had
higher emergence rates than expected based on EC test.
EC and yield (data not shown) were correlated (p<0.01)
for C99-R; RC/CSm and yield were correlated (P<0.05)
for TUFRun 511. No correlation was observed between
water potential and any field parameters.
No differences in LAI among cultivars (Figure 3).
Difference were observed among cultivars for Dio/RC,
JOET2/CS, PITABS, PITCSm(P< 0.1) and PIABS
(P<0.05) at 80 DAP. This indicates that TUFRun 511 had
improved light reaction components in comparison to
DP-1 and FloRun 107.
Root data is being processed.
Introduction
Yangyang Song 1, Diane L. Rowland 1, John E. Erickson 1 and Barry L. Tillman 1,2
1. Agronomy Department, Institute of Food and Agricultural Sciences, University of Florida, Gainesville, FL
2. North Florida Research and Education Center, University of Florida, Marianna, FL
• Rationale: The ultimate goal of seed vigor test is to provide a reliable identification of
physiological potential for seed lots. Therefore, in-season physiological characteristics
should be evaluated as important as assessing seed vigor early in development.
• Hypothesis: Germination tests have been widely used for testing seed vigor but may
not always be reliable. Thus, there is a need to develop and assess additional seed tests
that may indicate crop field performance more reliably. Membrane electrolyte leakage
has a significant relationship with field physiological traits for corn (Zea mays L.)
and/or soybean (Glycine max L.) and may be appropriate for predicting seed quality in
other species as well.
• Objectives: The objective of this study was to examine the efficacy of a standard
germination test combined with the assessments of seed membrane leakage in peanut
(Arachis hypogaea L.) for predicting the overall field performance of seed.
Materials and Methods
Quantifying Seed Membrane Leakage and Water Potential to Predict
Peanut Seed Quality and Maturity
Results
Conclusions
Both seed vigor tests were not correlated to field
emergence, canopy development and yield among
cultivars which implies that the reliability of both tests
may not be adequate for peanut.
No close correlation was observed between field
emergence and final yield in this study indicating that the
effect of seed vigor on yield is not only through seedling
emergence (Finch-Savage et al., 2015), and that other
physiological functions, such as the light reaction of
photosynthesis, should be taken into account as well .
.References
Abdul-Baki, Aref A., and James D. Anderson. "Vigor determination in
soybean seed by multiple criteria." Crop science 13.6 (1973): 630-633.
Finch-Savage, William E., and George W. Bassel. "Seed vigour and crop
establishment: extending performance beyond adaptation." Journal of
experimental botany 67.3 (2015): 567-591.
Morton, B. R., et al. "Impact of seed storage environment on field emergence
of peanut (Arachis hypogaea L.) cultivars." Peanut science 35.2 (2008): 108-
115.
Pre-planting experiment Standard germination test: 50 seeds per
cultivar with 4 reps; cultivars were
divided into four germination potential
(GP) levels: FloRun 107 (excellent GP),
TUFRun 511 and Georgia06-G (good
GP), C99-R (fair GP), York and DP-1
(poor GP).
Water Potential (WP) and Electrical
conductivity (EC) test: 10 seeds for each
cultivar with 4 reps. WP test first and
followed by the EC test.
In-season experiment Location: Plant Science Research and
Education Unit in Citra, FL, USA.
Plot layout: randomized complete block
design (RCBD) with 4 reps. Six rows per
plot with 15 feet by 3 feet (length by
width) per row.
Measures:
1) Daily emergence: visually counted the
3rd and 4th rows (the yield rows) from
5 to16 days after planting (DAP).
2) Leaf area index (LAI): 10 days
interval after 40 DAP (the 2nd and 3rd
rows ).
3) Chlorophyll fluorescence (OJIP) : 20
days interval after 40 DAP (2 hours
before sunrise; leaf on the second
node position of a plant in 2nd row).
Figure 2. Results for standard germination and
electrical conductivity test. Data shown as the
mean ± SE, different letter in each column mean
significant differences at α=0.05 level (t-test).
Figure 3. Results for field emergence
and LAI. Data are presented as the
mean ± SE.
Table 1. Genotypic differences of OJIP parameters of interest at 80 DAP.
Figure 1. Simplified light reaction process
Note: different letters in each column mean significant differences at α=0.05 level (student t-test).
List of OJIP Parameters:
ABS/CS –Absorbance per cross section DIo/CS – Dissipation per cross section
RC/CSm – Reaction centers per cross section JOTR/CS – Trapping per cross section
JOET2/CS – Electron transport per cross section PITCSm – Performance Index per cross section
Discussion
The
higher
the
better
The
lower
the
better
Recommended