Quantitative Investigation of the
Multicomponent Fuel Droplet
Combustion Using High Speed Imaging
and Digital Image Processing
A Thesis Submitted to the University of Sheffield for the Degree of
Doctor Philosophy in the Faculty of Engineering
By
AHMAD MUNEEREL-DEEN FAIK
(M.Sc. 2006)
August 2017
Department of Mechanical Engineering

1
Dedication
To the woman who lived the dream and did not witness the
achievement ...
My Mother (may Allah grant her His mercy)
To the man who supported and continues to support ...
My Father (may Allah bless him)
This is the result of the eagerness, diligence, and dedication which
I learnt from both of you

2
Contents
Dedication ............................................................................................................................. 1
Contents ................................................................................................................................ 2
Declaration ........................................................................................................................... 6
Publications .......................................................................................................................... 7
Acknowledgments ................................................................................................................ 8
Abstract ................................................................................................................................ 9
List of Figures .................................................................................................................... 11
List of Tables ...................................................................................................................... 18
Nomenclature ..................................................................................................................... 19
Chapter 1. Introduction .................................................................................................... 21
1.1 Motivations ................................................................................................................ 21
1.2 Objectives .................................................................................................................. 23
1.3 Thesis Outline ............................................................................................................ 24
Chapter 2. Literature Review ........................................................................................... 26
2.1 Introduction ............................................................................................................... 26
2.2 Liquid Fuel Combustion ............................................................................................ 27
2.2.1 Liquid Fuel Spray Combustion .......................................................................... 29
2.2.2 Atomization and Droplet Formation .................................................................. 30
2.3 Droplet Combustion .................................................................................................. 31
2.3.1 The Classical Theory of Droplet Combustion .................................................... 32
2.3.2 Development of the Droplet Combustion Investigation ..................................... 37
2.4 Multicomponent Fuel Droplet Combustion ............................................................... 41
2.4.1 Droplet Puffing, Secondary Atomization, and Microexplosion ......................... 44
2.4.2 Nucleation and Bubble Generation .................................................................... 47
2.5 The Combustion of Interacting Fuel Droplets ........................................................... 49
2.6 Droplet Combustion Diagnostics............................................................................... 51
2.6.1 Shadowgraphy .................................................................................................... 52
2.6.2 Schlieren ............................................................................................................. 53

3
2.6.3 Laser-Based Techniques ..................................................................................... 56
2.6.4 Optical Interferometry ........................................................................................ 60
2.6.5 Self-Illuminated Direct Imaging ......................................................................... 62
2.6.6 Backlighting Imaging ......................................................................................... 63
2.7 Summary .................................................................................................................... 65
Chapter 3. Experimental Considerations, Image Processing, and Validations ........... 67
3.1 Introduction ............................................................................................................... 67
3.2 The Fuels under Investigation ................................................................................... 67
3.2.1 Diesel Fuel Emulsification ................................................................................. 69
3.2.2 Diesel Fuel Blending .......................................................................................... 72
3.3 Experimental Characterizations ................................................................................. 73
3.3.1 Droplet Generation, Suspension, and Ignition ................................................... 73
3.3.2 Optical Setups ..................................................................................................... 79
3.4 Image Processing for Feature Extraction ................................................................... 82
3.4.1 Image Enhancement ........................................................................................... 83
3.4.2 Segmentation and Morphological Operations .................................................... 84
3.4.3 Validation and Error Estimation ......................................................................... 85
3.4.4 Feature Extraction .............................................................................................. 87
3.5 Object True Size Calculation ..................................................................................... 88
3.6 Summary .................................................................................................................... 89
Chapter 4. Size and Shape Characteristics of the Burning Isolated Multicomponent
Fuel Droplet ....................................................................................................................... 91
4.1 Introduction ............................................................................................................... 91
4.2 Experimental Setup.................................................................................................... 91
4.3 Results and Discussion .............................................................................................. 93
4.3.1 Validation by Burning Rate Comparison ........................................................... 94
4.3.2 Burning Rate of the Multicomponent Fuel Droplets .......................................... 97
4.3.3 Droplet Size Evolution ..................................................................................... 100
4.3.4 Droplet Size Fluctuation ................................................................................... 106
4.3.5 Flame Characteristics ....................................................................................... 112
4.4 Summary .................................................................................................................. 123

4
Chapter 5. Puffing, Sub-Droplets Dynamics, and Micro-Explosion during the
Combustion of Multicomponent Fuel Droplet .............................................................. 124
5.1 Introduction ............................................................................................................. 124
5.2 Experimental Setup.................................................................................................. 125
5.3 Results and Discussion ............................................................................................ 126
5.3.1 Single-Component Droplets ............................................................................. 127
5.3.2 Multicomponent Fuel Droplet Puffing Dynamics ............................................ 130
5.3.3 Sub-Droplet Emission by Secondary Atomization ........................................... 138
5.3.4 Emulsion Droplet Microexplosion ................................................................... 148
5.4 Summary .................................................................................................................. 154
Chapter 6. Liquid-Phase Monitoring during the Combustion of Multicomponent Fuel
Droplet .............................................................................................................................. 155
6.1 Introduction ............................................................................................................. 155
6.2 Experimental Setup.................................................................................................. 156
6.3 Results and Discussion ............................................................................................ 157
6.3.1 Liquid-Phase of the Single-Component Fuel Droplets .................................... 158
6.3.2 Liquid-Phase of the Multicomponent Fuel Droplets ........................................ 161
6.3.3 Nucleation Rate ................................................................................................ 164
6.3.4 Bubble Dynamics ............................................................................................. 166
6.3.5 The Effect of Bubbles on Puffing, Secondary Atomization, and Microexplosion
................................................................................................................................... 170
6.3.6 Accumulation within the Burning Multicomponent Fuel Droplet ................... 174
6.4 Summary .................................................................................................................. 175
Chapter 7. Combustion Characteristics of Two-Neighbouring Multicomponent Fuel
Droplets ............................................................................................................................ 177
7.1 Introduction ............................................................................................................. 177
7.2 Experimental Setup.................................................................................................. 178
7.3 Results and Discussion ............................................................................................ 179
7.3.1 Flame Shape and Droplet Burning Rate ........................................................... 179
7.3.2 Nucleation and Bubble Growth Rates .............................................................. 188
7.3.3 Secondary Atomization and Micro-Explosion ................................................. 191
7.3.4 Other Liquid Phase Dynamics .......................................................................... 193

5
7.4 Summary .................................................................................................................. 196
Chapter 8. Summary and Future Work ........................................................................ 197
8.1 Summary .................................................................................................................. 197
8.1.1 Shape and Size Characteristics of the Isolated Multicomponent Fuel Droplet 197
8.1.2 Puffing, Sub-droplet Emission, and Microexplosion Characteristics of the
Isolated Multicomponent Fuel Droplet ..................................................................... 200
8.1.3 Liquid-Phase Dynamics of the Multicomponent Fuel Droplet ........................ 203
8.1.4 Two-Neighbouring Droplets Interaction .......................................................... 205
8.2 Future Work ............................................................................................................. 206
8.2.1 Multi-Component Fuels: .................................................................................. 206
8.2.2 Developing the Experimental Techniques: ...................................................... 206
8.2.3 Droplet Dynamics: ............................................................................................ 207
Appendices ....................................................................................................................... 208
References......................................................................................................................... 216

6
Declaration
No portion of the work referred to in the thesis has been submitted in
support of an application for another degree or qualification of this or any
other university or institute of learning.

7
Publications
Journal Papers:
[1]. Faik, A. M., Zhang, Y., 2014. Quantitative Spray Analysis of Diesel Fuel and its
Emulsions Using Digital Image Processing. EPJ Web of Conferences. Vol. 92. EDP
Sciences, 2015.
[2]. Faik, A. M., Zhang, Y., Hanriot, S., 2016. Droplet Combustion Characteristics Of
Biodiesel–Diesel Blends Using High Speed Backlit and Schlieren Imaging. Heat
Transfer Engineering, Accepted.
[3]. Faik, A. M., Ma, Z., Zheng, L., Zhang, Y., 2017. Quantitative Investigation of the
Flame Characteristics throughout Droplet Combustion of the Diesel-in-water
Emulsions. Under Preparation.
[4]. Faik, A. M., Zhang, Y., 2017. Multicomponent Fuel Droplet Combustion Investigation
Using Magnified High Speed Backlighting and Shadowgraph Imaging. Under Preparation.
Conference Presentations:
[1]. Faik, A. M., Zhang, Y., 2014. Quantitative Spray Analysis of Diesel Fuel and its
Emulsions Using Digital Image Processing. International Conference on
Experimental Fluid Mechanics (EFM 2014), Cesky Krumlov, Czech Republic, Oral
Presentation.
[2]. Faik, A. M., Zhang, Y., Hanriot, S., 2016. The Investigation Of Droplet Combustion
Characteristics Of Biodiesel–Diesel Blends Using High Speed Camera. 12th
International Conference on Heat Transfer, Fluid Mechanics, and Thermodynamics
(HEFAT 2016), Malaga, Spain, Oral Presentation.
[3]. Zheng, L., Faik, A. M., Zhang, Y., 2016. Flame Colour Analysis for the Droplet
Combustion of Water-in-Diesel Emulsions. 12th
International Conference on Heat
Transfer, Fluid Mechanics, and Thermodynamics (HEFAT 2016), Malaga, Spain,
Oral Presentation.
[4]. Faik, A. M., Zhang, Y., 2017. High Speed Visualization of the Liquid-Phase
Dynamics during the Combustion of Multicomponent Fuel Droplet. 8th
European
Combustion Meeting (ECM 2017), Dubrovnik, Croatia.

8
Acknowledgments Praise be to Allah (first and foremost) for his blessing and grace in the completion of
this work.
The present work has been carried out under a scholarship granted by the Higher
Committee for Education Development (HCED) in Iraq. All the efforts, help, and support
received from the people working in HCED are gratefully acknowledged.
Grateful thanks and deep appreciation to my supervisor Professor Doctor Yang
Zhang for his continuous guidance, encouragement, and respected advice throughout the
research period.
Also, I would like to thank my colleagues in the Combustion and Flow Diagnostics
Research Group; Doctor Francisco Javier Carranza Chavez, Doctor Halleh Mortazavi,
Doctor Zhen Ma, Mrs Lukai Zheng, Miss Yiran Wang, Mr. Shuaida Ji, and all the other
members of the group. I have benefited a lot from all the support and help from those
people during the last four years.
I would like to express my gratitude to Professor Doctor Sérgio De Morais
Hanriot (Pontifical Catholic University of Minas Gerais, Brazil) for the valuable
collaboration, and for providing the biodiesel fuel. And to my friend Assistant Professor
Doctor Maath Abdulwahed Dheeb (Al-Mustansiryah University, Iraq) for his help and
support.
I cannot forget the help provided by the staff of the University of Sheffield at
different levels and departments, including the staff of: the Department of Mechanical
Engineering, the Doctoral Development Program (DDP), and the university libraries, and
all other services provided by the university. Those are the Unknown Warriors behind the
success of both the students and university.
Many thanks to my beloved wife Safa for all the efforts, support, and patience she
provided throughout the years of my study. Without your help I couldn’t manage doing
this work. Thank you for being part of this achievement. My truthful love is dedicated to
you and to our beloved Taim and Mayya. Three of you are the shiny stars of my life.
Deep appreciation to the support I have received from all the friends and family.

9
Abstract
The liquid-phase processes occurring during fuel droplet combustion are important in
deciding the behaviour of the overall combustion process, especially, for the
multicomponent fuel droplets. Hence, understanding these processes is essential for
explaining the combustion of the multicomponent fuel droplet. However, the very fast
combustion of the too small fuel droplet makes experimental investigation of these
processes uneasily affordable.
In the present work, a high speed backlighting, and shadowgraph imaging and
subsequent image processing leading to quantitative analysis of the multicomponent fuel
droplet combustion including liquid-phase dynamics are performed. Two categories of
multicomponent fuels – in which diesel is the base fuel – are prepared and utilized. The
first category is biodiesel/diesel and bioethanol/diesel blends, while the second category is
the water-in-diesel and diesel-in-water emulsions. The portion of the added components is
set to 10%, 20%, and 30% of the total mixture volume for all the multicomponent fuel
mixtures (blends and emulsions).
Specific optical setups are developed in-lab and used for tracking droplet
combustion. The first setup is associated with the backlighting imaging with the resulting
magnification of the droplet images being 30 times the real size. The second optical setup
is used for Schlieren and shadowgraph imaging, with the resulting magnification being 10
times the real size for both techniques. Those magnifications made it possible to visualize
the droplet interior at high imaging rates (250, 1000, 10000, and 40000 fps) so that
tracking of the droplet liquid-phase processes is easily performed.
Using the aforementioned optical setups, spatial and temporal tracking of nucleation,
bubble generation, internal circulation, puffing, microexplosion, and secondary
atomization during the combustion of the isolated multicomponent fuel droplets are
performed. This offered the privilege of full sequential tracking of droplet secondary
atomization from initiation to sub-droplet generation.
Emulsion fuel droplet fragmentation has also been tracked and visualized using
Schlieren imaging. The effect of water content of the emulsion on the intensity of the
resulting droplet explosion wave has also been evaluated.
Spatial and temporal tracking of the sub-droplets generated by secondary
atomization, and their subsequent combustion, in addition to their overall lifetimes have

10
also been performed. Accordingly, a comparison of the burning rate constant between the
parent droplet and the resulting sub-droplets is carried out.
Specifically written and developed algorithms are used for image processing and
feature extraction purposes. These algorithms are executed using Matlab. Using these
algorithms, droplet projected area, perimeter, equivalent diameter, flame height and width,
and sub-droplet generation rate have been temporally evaluated.
The high speed magnified imaging and subsequent image processing revealed that
the rate of droplet secondary atomization is higher than those obtained by relatively low
imaging rate. Additionally, it is shown that during a large portion of its entire lifetime, the
droplet geometry has been affected by combustion significantly.
The combustion of two-interacting multicomponent fuel droplets at different spacing
distances has also been investigated. The liquid-phase processes inside both droplets have
been conceived. The effect of secondary atomization from one droplet on the other
neighbouring droplet has also been studied.
The burning rate constants evaluated for the interacting fuel droplets are found to
have the same trends as the isolated droplet combustion. However, the ratio of the droplet
burning rate constant of the interactive droplet combustion to that of the isolated droplet
combustion is higher than unity. The nucleation rate within the interacting fuel droplets is
also found to be higher than that within the corresponding isolated fuel droplets.

11
List of Figures
Figure 1-1: Motivation sequence of the present work. ...................................................................... 23
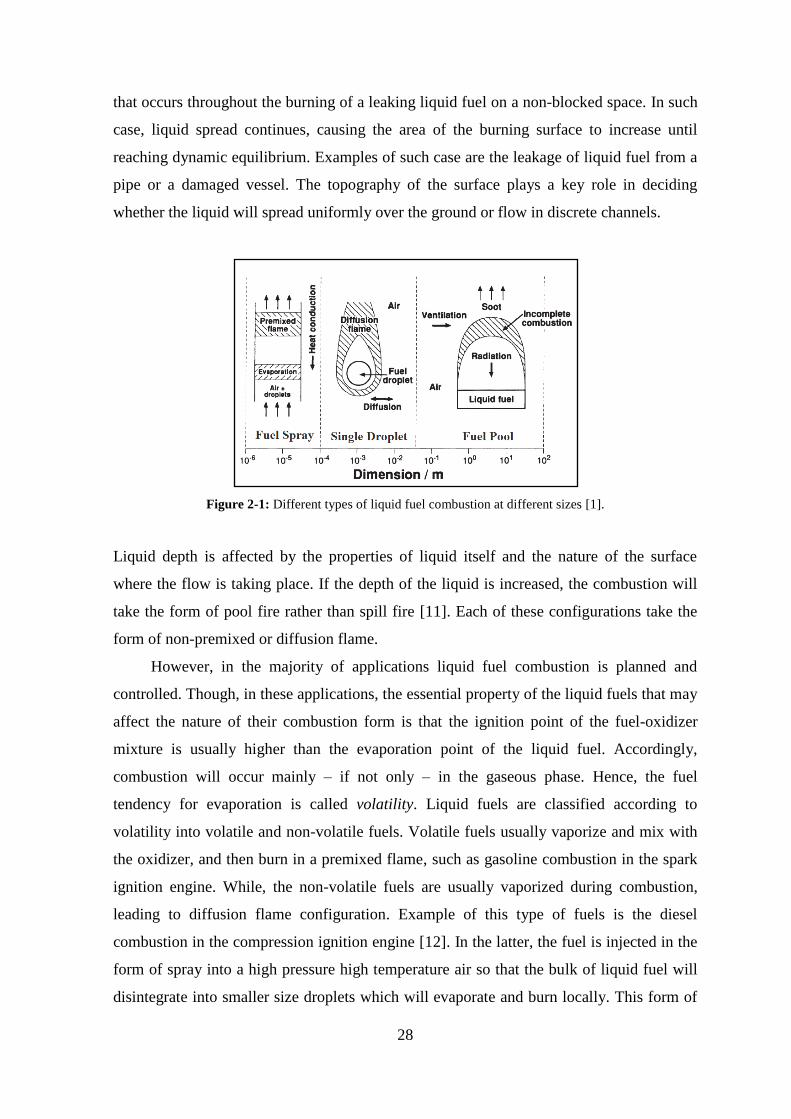
Figure 2-1: Different types of liquid fuel combustion at different sizes [1]. .......................................... 28
Figure 2-2: Spray formation and breakup (reproduced from [16]). ...................................................... 29
Figure 2-3: Idealized process of droplet formation from a liquid sheet [19]. ......................................... 31
Figure 2-4: Combustion model of an isolated liquid droplet in an infinite oxidizing medium. .................. 33
Figure 2-5: Shadowgraph image of the soot shell formation during the combustion of ethanol fuel droplet in
microgravity [62] (with permission from the publisher). ......................................................... 36
Figure 2-6: The shape of the flame surrounding a burning droplet as it appears under: (a) microgravity
conditions, (b) normal gravity conditions [66] (with permission form the publisher). .................... 37
Figure 2-7: The falling chamber used by Kumagai and Isoda [67] (with permission from the publisher). ... 38
Figure 2-8: The 110m Height ZARM Drop Tower in Bremen, Germany [73]. ...................................... 38
Figure 2-9: Parabolic Flight Profile of the Zero-Gravity Airbus A300 Aircraft of Novespace - France [73]. 39
Figure 2-10: Comparison between the portion of research work on droplet combustion carried out under
normal gravity and that carried out under reduced gravity conditions for the period 1949-2017. ..... 40
Figure 2-11: Puffing from an ethanol-in-decane emulsion droplet [159]............................................... 45
Figure 2-12: Schematic representation of the vapour bubble formation inside an evaporating water-in-oil
droplet [151]. ................................................................................................................. 48
Figure 2-13: Theoretical simulation of the vapour bubble movement inside an evaporating ethanol-in-decane
droplet [158]. ................................................................................................................. 49
Figure 2-14: The effect of spacing between two-neighbouring droplets [173] (with permission from the
publisher). ..................................................................................................................... 50
Figure 2-15: (a) Parallel light shadowgraph setup, (b) sample shadowgram of a spherical particle moving in
stagnant air (reproduced from [185]). .................................................................................. 52
Figure 2-16: Schematic layout of three different Schlieren arrangements: (a) Single-lens, (b) Dual-lens, (c) Z-
type two-mirror Schlieren (reproduced from [186]). ............................................................... 54
Figure 2-17: Sample Schlieren images of droplet combustion [204] (with permission from the publisher). . 55
Figure 2-18: Schematic drawing of the dual-beam LDV system [215]. ................................................ 58
Figure 2-19: Schematic drawing of the dual-beam PDA system [215]. ................................................ 58
Figure 2-20: PIV setup for flow visualization in a wind tunnel [222]. .................................................. 59
Figure 2-21: Michelson interferometer [230]. ................................................................................. 61
Figure 2-22: The burning droplet and the surrounding luminous flame tracking using self-illuminated direct
imaging [26] (with permission from the publisher). ................................................................ 62

12
Figure 2-23: Schematic of the backlighting imaging arrangement. ...................................................... 63
Figure 2-24: Sample of the images obtained by [153] (with permission from the publisher). .................... 64
Figure 3-1: The difference between the water-in-oil and oil-in-water emulsions [259] (with permission from
the publisher). ................................................................................................................ 69
Figure 3-2: Prepared samples of water-in-diesel and diesel-in-water emulsions of 10%, 20%, and 30% water
concentration. ................................................................................................................. 72
Figure 3-3: A chart of the fuels utilized in the present work. .............................................................. 73
Figure 3-4: Laboratory fuel droplet generation and combustion in an oxidizing atmosphere: (a) porous sphere
method, (b) suspended droplet method, and (c) falling droplet method (reproduced from [265]). .... 74
Figure 3-5: Droplet suspension using a single (100 µm) monofilament SiC fibre. .................................. 75
Figure 3-6: Micro-fine syringe with hypodermic needle for droplet generation...................................... 75
Figure 3-7: (a) The initial diameter of all the droplets adopted in experiments, (b) the frequency distribution
of these diameters. ........................................................................................................... 76
Figure 3-8: Representative samples of the large droplet initial size diameter range implemented in the
literature of experimental droplet combustion. ...................................................................... 77
Figure 3-9: Droplet ignition by side heating of the SiC fibre. The legend in the figure represents the pixel
intensity distribution. ....................................................................................................... 78
Figure 3-10: Droplet ignition using an electrically heated kanthal wire coil. The legend in the figure
represents the pixel intensity distribution. ............................................................................ 78
Figure 3-11: Components of the optical setup used for backlit imaging of the droplet combustion: (a)
Extension tube, (b) Lens, (c) Light diffuser, (d) Light source. .................................................. 80
Figure 3-12: Components of the optical setup used for Shadowgraph imaging of the droplet combustion: (a)
Light Source, (b) Magnifying Lens, (c) Concave Mirror, (d) Close-up Lens. ............................... 80
Figure 3-13: Schematic comparison between (a) the droplet real size, and the resulting magnifications by the
optical setups: (b) 10x, (c) 20x, and (d) 30x magnification. ...................................................... 81
Figure 3-14: The Photron FASTCAM SA4 Camera. ........................................................................ 81
Figure 3-15: Flowchart of the image processing sequence in the present work. ..................................... 83
Figure 3-16: Sequence of image processing to isolate the droplet from its surroundings; (a) the original
image, (b) grayscale image, (c) complementation, (d) holes filling (first), (e) thresholdeding, (f) noise
removal by filtering, (g) holes filling (second), (h) final imge of the isolated droplet..................... 83
Figure 3-17: Comparison between the original image and the resulting processed image of diesel fuel droplet
at different time periods; (a) original images, (b) processed images, (c) matching the boundary of the
processed images with the grayscale form of the original image. .............................................. 86
13
Figure 3-18: Comparison of the droplet major and minor diameters on (a) the original image, and (b) the
same image after processing. ............................................................................................. 87
Figure 3-19: Camera calibration using the SiC fibre: (a) Backlighting imaging, (b) Shadowgraph imaging. 89
Figure 4-1: Experimental setup of the droplet combustion with backlighting imaging. ............................ 92
Figure 4-2: Temporal images of a burning WD20 fuel droplet. .......................................................... 93
Figure 4-3: Burning rate comparison for diesel, biodiesel, and ethanol droplets respectively of the present
work and those corresponding values published in literature. ................................................... 95
Figure 4-4: The effect of SiC fibre mesh arrangement on the burning rate of diesel, biodiesel, and ethanol
droplets. ........................................................................................................................ 96
Figure 4-5: Droplet burning rate (mm2/s) of the multicomponent fuels with respect to the amount of: (a)
water content for the water-in-diesel and diesel-in-water emulsions, (b) blending agent for the
biodiesel- and ethanol-blended diesel fuel droplets. ................................................................ 98
Figure 4-6: Normalized diesel consumption with respect to the amount of: (a) water content for the water-in-
diesel and diesel-in-water emulsions, (b) blending agent for the biodiesel- and ethanol-blended diesel
fuel droplets. ................................................................................................................ 100
Figure 4-7: Droplet size evolution with respect to time for: the single-component fuels (1st row),
biodiesel/diesel blends (2nd
row), ethanol/diesel blends (3rd
row), water-in-diesel emulsions (4th
row),
and diesel-in-water emulsions (5th
row). The y-axis is the normalized droplet size (D/D0)2, and the x-
axis is the normalized droplet lifetime (t/ttotal). ..................................................................... 102
Figure 4-8: Bubble nucleation inside a burning BD10 fuel droplet (D0=1.3 mm). ................................ 103
Figure 4-9: Size increase and instability due to bubble growth and puffing within a burning ED10 fuel droplet
(D0=1.23 mm). ............................................................................................................. 104
Figure 4-10: Comparison between the predicted droplet size evolutions using the D2-law (upper row) and
those evaluated from experimental results (lower row) for diesel, biodiesel, and ethanol. The y-axis is
((D/D0)2), and the x-axis is (t/ttotal) .................................................................................... 105
Figure 4-11: Temporal size fluctuation of diesel, BD10, ED10, WD10, and DW10 fuel droplets undergoing
combustion. The x-axis the (t/ttotal), and the y-axis is the droplet size variation normalized by the initial
droplet diameter. ........................................................................................................... 108
Figure 4-12: Average droplet size increase rate normalized with respect to droplet initial diameter for the: (a)
single-component fuel droplets, (b) diesel/water and water/diesel emulsion droplets, and (c)
biodiesel/diesel and ethanol/diesel blend droplets. ............................................................... 109
Figure 4-13: Maximum droplet size increase normalized with respect to droplet initial diameter for the: (a)
single-component fuel droplets, (b) diesel/water, water/diesel and biodiesel/diesel droplets, and (c)
ethanol/diesel droplets. ................................................................................................... 110

14
Figure 4-14: Average droplet size increase time with respect to the total droplet lifetime for the: (a) single-
component fuel droplets, (b) diesel/water and water/diesel emulsion droplets, and (c) biodiesel/diesel
and ethanol/diesel blend droplets. ..................................................................................... 110
Figure 4-15: Maximum droplet size increase rate normalized with respect to droplet instantaneous diameter
for the fuels under investigation. ...................................................................................... 112
Figure 4-16: Sample images of the luminous flame surrounding a WD10 fuel droplet. ......................... 113
Figure 4-17: Temporal variation of the normalized flame height (blue) and normalized flame width (red) with
time for neat diesel and neat biodiesel fuel droplets. ............................................................. 114
Figure 4-18: Flame increase during the early ignition stage for diesel and biodiesel fuel droplets. ........... 115
Figure 4-19: Temporal variation of the normalized flame height (blue) and normalized flame width (red) with
time for the multicomponent fuel droplets. ......................................................................... 117
Figure 4-20: Ignition and flame initiation of the biodiesel/diesel blend droplets................................... 118
Figure 4-21: Flame size reduction during the combustion of WD20 emulsion fuel droplet. .................... 118
Figure 4-22: The effect of puffing on the shape of the flame surrounding the burning multicomponent fuel
droplets. ...................................................................................................................... 119
Figure 4-23: The effect of droplet microexplosion on the shape of the flame surrounding an ED10 fuel
droplet. ....................................................................................................................... 120
Figure 4-24: Flame stand-off ratio for neat diesel and neat biodiesel droplets. ..................................... 121
Figure 4-25: Flame stand-off ratio for biodiesel/diesel blend (1st row), ethanol/diesel blends (2nd
row), water-
in-diesel emulsions (3rd
row), and diesel-in-water emulsions (4th
row). .................................... 122
Figure 5-1: Schematic of the z-type Schlieren imaging setup. .......................................................... 126
Figure 5-2: Two shadowgraph images of the same droplet (a) before combustion, (b) during combustion,
distinguished by the appearance of the flame. ..................................................................... 127
Figure 5-3: Biodiesel droplet puffing sequence at the end of its lifetime (the time starts from puffing
initiation). .................................................................................................................... 128
Figure 5-4: Diesel droplet recoiling sequence after puffing (the time starts at the end of puffing). ........... 129
Figure 5-5: Sub-droplets emitted from a neat ethanol droplet. .......................................................... 129
Figure 5-6: Temporal sequence of an ED20 droplet size change before and during puffing. ................... 131
Figure 5-7: WD10 droplet necking prior to puffing and the resulted multiple sub-droplets subsequent an
intense puffing incident. ................................................................................................. 132
Figure 5-8: BD10 droplet secondary atomization upwards as a reaction to the puffing occurrence downwards
(time is set from the start of puffing). ................................................................................ 133
Figure 5-9: Flame blow-off subsequent to vapour jet puffing from a DW10 droplet. ............................ 134

15
Figure 5-10: Puffing occurrence during the ED10 droplet combustion with an illustration to the shape of the
vapour (time is set from the start of puffing). ...................................................................... 135
Figure 5-11: The effect of water, biodiesel, and ethanol concentrations on the average vapour (a) normalized
vapour penetration, (b) puffing velocity from the burning multicomponent fuel droplets. ............ 136
Figure 5-12: Temporal sequence of sub-droplet emission from a burning BD10 droplet. ....................... 138
Figure 5-13: Samples of the reconstructed trajectories of single ((a) and (b)) and three (c) sub-droplets ejected
from different burning fuel droplets undergoing secondary atomization. .................................. 139
Figure 5-14: Sub-droplet combustion after ejection from a BD10 fuel droplet (time is set from the sub-droplet
detachment from the parent droplet). ................................................................................. 140
Figure 5-15: The effect of additive (water, biodiesel, and ethanol) concentration on the number of sub-
droplets emitted during the overall droplet lifetime of the multicomponent fuel mixtures. ............ 141
Figure 5-16: Sample images of the large sub-droplets ejected from the ED fuel droplets. ...................... 142
Figure 5-17: The effect of additive (water, biodiesel, and ethanol) concentration on the net portion of the
secondary atomization with respect to the overall droplet lifetime. .......................................... 144
Figure 5-18: Sub-droplet ejection probability (%) – y-axis – with respect to the normalized droplet lifetime –
x-axis – for biodiesel/diesel blends (1st row), ethanol/diesel blends (2
nd row), water-in-diesel
emulsions (3rd
row), and diesel-in-water emulsions (4th
row). ................................................. 146
Figure 5-19: The portion of the total secondary atomization period with respect to the overall droplet lifetime
for all the multicomponent fuel mixtures under investigation. ................................................ 147
Figure 5-20: The temporal evolution of sub-droplet ejection from a WD10 emulsion droplet illustrating the
sub-droplet microexplosion after a period of time (time is set from the sub-droplet detachment). .. 149
Figure 5-21: Comparison of the WD10 droplet microexplosion images obtained by shadowgraphy and
Schlieren methods. ........................................................................................................ 150
Figure 5-22: Temporal sequence of microexplosion initiation on the surface of a WD10 emulsion droplet
(time is set from the start of microexplosion). ..................................................................... 150
Figure 5-23: The effect of water content on the normalized fragmentation diameter of the water-in-diesel and
diesel-in-water emulsion droplets. .................................................................................... 151
Figure 5-24: The effect of water content on the explosion wave effective diameter normalized with respect to
the droplet initial diameter for both the water-in-diesel and diesel-in-water emulsions. ............... 152
Figure 5-25: The effect of water content on the fragmentation effective diameter spread rate for the water-in-
diesel and diesel-in-water emulsion droplets. ...................................................................... 153
Figure 6-1: Experimental setup of the droplet combustion with backlighting imaging. .......................... 156
Figure 6-2: The effect of image intensity enhancement on highlighting the bubble growing inside a diesel fuel
droplet. (a) the raw image, (b) the intensity enhanced image. ................................................. 157

16
Figure 6-3: Temporal sequence of the droplet combustion of the neat diesel, biodiesel, and ethanol. ....... 158
Figure 6-4: Heterogeneous nucleation occurrence time with respect to overall droplet lifetime for the neat
diesel, biodiesel, and ethanol fuels. ................................................................................... 159
Figure 6-5: Temporal sequence of bubble growth inside a diesel fuel droplet (the time is set from the
initiation of the bubble). ................................................................................................. 160
Figure 6-6: Liquid-phase appearance of the biodiesel/diesel and ethanol/diesel blends and the water/diesel
emulsions. The upper row represents the initial droplets, and the lower row represents the droplets
after a certain time of combustion. .................................................................................... 161
Figure 6-7: Temporal sequence of the droplet shape variation consequent to bubble burst and puffing within a
WD20 fuel droplet (the time is set from the start of puff). ..................................................... 163
Figure 6-8: Average nucleation rate variation with the content of the substance added to diesel. ............. 165
Figure 6-9: Different nucleation sites inside the burning fuel droplet. ................................................ 165
Figure 6-10: The effect of additive content on the average bubble growth rate inside the multicomponent fuel
droplet. ....................................................................................................................... 166
Figure 6-11: The temporal sequence of two bubbles merging occurrence inside an ED10 fuel droplet (time is
set from the instant of bubbles attachment). ........................................................................ 167
Figure 6-12: Temporal sequence of two bubbles merging process inside a neat diesel fuel droplet. ......... 168
Figure 6-13: Temporal sequence of bubble growth inside a burning BD10 fuel droplet. ........................ 168
Figure 6-14: Short bubble growth time during the combustion of WD20 fuel droplet. .......................... 169
Figure 6-15: Temporal sequence of the effect of a growing bubble on the sub-droplet ejection from a burning
ED20 fuel droplet. ......................................................................................................... 170
Figure 6-16: Temporal sequence of the effect of a growing bubble on the sub-droplet ejection from a burning
WD10 fuel droplet. ........................................................................................................ 172
Figure 6-17: Temporal sequence of the ejected sub-droplet lifetime during the combustion of a WD20 fuel
droplet. ....................................................................................................................... 173
Figure 6-18: WD20 emulsion fuel droplet microexplosion during combustion (the time difference between
images is 25µs). ............................................................................................................ 173
Figure 6-19: The temporal sequence of diesel fuel accumulation during the combustion of ED30 fuel droplet.
.................................................................................................................................. 174
Figure 6-20: Water accumulation during the combustion of WD20 fuel droplet: (a) original image of the
droplet at time =0, (b) original image of the droplet with water accumulation appears in the middle, (c)
intensity enhanced image of the (a) image, and (d) intensity enhanced image of the (b) image. ..... 175
Figure 7-1: Schematic drawing of the two-neighbouring droplets suspension. ..................................... 178

17
Figure 7-2: The effect of droplet normalized spacing distance on the flame surrounding the burning diesel
fuel droplets. ................................................................................................................ 180
Figure 7-3: The interactive combustion of two-biodiesel fuel droplets at different normalized spacing
distance values. ............................................................................................................. 181
Figure 7-4: Temporal sequence of the flame propagation from a burning DW20 emulsion fuel droplet to its
neighbour droplet. ......................................................................................................... 182
Figure 7-5: The effect of normalized spacing distance on the flame surrounding the interacting BD10 fuel
droplets. ...................................................................................................................... 183
Figure 7-6: The interactive combustion of two-neighbouring ED10 fuel droplets at different normalized
spacing distance values. .................................................................................................. 183
Figure 7-7: The effect of the normalized spacing distance (x-axis) on the average burning rate constant
(mm2/s) (y-axis) during the interactive droplet combustion of all the fuels under investigation. .... 185
Figure 7-8: The average of η for all the fuels under investigation. .................................................... 187
Figure 7-9: Temporal sequence of the bubble growth inside a WD20 droplet during the combustion of two-
interactive droplets. ....................................................................................................... 188
Figure 7-10: Average nucleation rate with respect to the concentration of the substance added to diesel in the
multicomponent fuels during the combustion of two interacting fuel droplets. ........................... 189
Figure 7-11: The effect of additive concentration on the ratio of the average nucleation rate evaluated to the
two-interacting fuel droplets to that evaluated to the single isolated fuel droplet. ....................... 190
Figure 7-12: The effect of additive concentration on the average bubble growth rate during the combustion of
two-interacting fuel droplets. ........................................................................................... 191
Figure 7-13: Temporal sequence of WD10 droplet merging with a sub-droplet emitted from a neighbouring
parent droplet. .............................................................................................................. 192
Figure 7-14: Temporal sequence of the effect of WD10 droplet explosion on the droplet neighbouring it (the
time is set from the start of explosion). .............................................................................. 193
Figure 7-15: Temporal sequence of the effect of water agglomeration on the nucleation and bubble growth
within a WD10 droplet. .................................................................................................. 194
Figure 7-16: Temporal sequence of the effect of the SiC fibre on inducing circulation within the suspended
burning droplets. ........................................................................................................... 195
Figure 7-17: Temporal sequence of the soot aggregation around a burning diesel fuel droplet (the time is set
from the appearance of the soot). ...................................................................................... 195
Figure 8-1: Temporal variation of the normalized flame height (blue) and normalized flame width (red) with
time for the multicomponent fuel droplets. ......................................................................... 199

18
List of Tables
Table 2-1: Flame types with examples. ......................................................................................... 28
Table 2-2: The total combustion time with respect to the rotational speed for a 4-stroke engine. ............... 47
Table 2-3: Selected published work showing the range of droplet spacing with the number of droplets. ..... 52
Table 2-4: Samples of the spatial resolution and magnification ranges for droplet combustion shown in
literature. ......................................................................................................................... 65
Table 3-1: HLB ranges and applications [261]. ............................................................................... 71
Table 3-2: Size range and appearance of emulsions [261]. ................................................................ 72
Table 3-3: Camera settings with the resulting magnification rate and spatial resolution for each technique. 83
Table 3-4: The area covered by the optical setup as evaluated by image size......................................... 90

19
Nomenclature
Symbol Description
∆D Droplet size variation.
A Area (mm2).
B Spalding transfer number.
Cp Constant-pressure specific heat (kJ/kg.K)
D Diameter (mm).
Ð Mass diffusivity (m2/s).
f Focal length (mm)
H Flame Height (mm)
Ḣ Rate of heat release (kJ/kg)
hc Heat of combustion (kJ/kg)
hfg Latent heat of vaporization (kJ/kg)
K Burning rate constant (mm2/s).
k Thermal conductivity (W/m.K)
m Mass (kg)
ṁ Mass burning rate (kg/s)
N Engine rotational speed (rpm)
P Perimeter (mm)
q Heat per unit mass (kJ/kg)
r Radius (mm)
t Time (s)
T Temperature (K)
W Flame Width (mm)
x Spacing distance (mm)
Y Mass fraction
Greek Symbols
∆ Difference
δ Droplet deformation
η Normalized burning rate ratio for interactive droplet combustion
λ Thermal conductivity (W/m.K)
ρ Density (kg/m3)
υ Stoichiometric Air/Fuel ratio
Subscripts
0 Initial
∞ Environment

20
eff Effective
exp Explosion
F Fuel
f Flame
g Gas
i Instantaneous
l Liquid
maj Major
min Minor
O Oxygen
s Surface
Abbreviations
BD Biodiesel-in-diesel blend
bsfc Break specific fuel consumption
DW Diesel-in-water emulsion
ED Ethanol-in-diesel blend
F.F. Free Fall
fps Frames per second
HLB Hydrophile-Lipophile Balance number
LDA Laser Doppler Anemometry
LDV Laser Doppler Velocimetry
LIF Laser Induced Fluorescence
M.G. Microgravity
N.G. Normal Gravity
PDA Phase Doppler Anemometry
PDI Phase Doppler Interferometry
PLIF Planar Laser Induced Fluorescence
RGB Red, Green, Blue model for colour image representation
SiC Silicon Carbide
TIFF Tag Image File Format
WD Water-in-diesel emulsion
Notes:
Fuel terminology is listed in Appendix (A).
Other symbols have been mentioned in their locations.

21
Chapter 1. Introduction
1.1 Motivations
Combustion has been identified and exploited since the early forms of human life.
Fire has been used as a source of heat and light, it led to the expansion in digestive food
variety, and helped to fabricate the metal tools used for hunting and farming [1].
Additionally, it has been assumed as one of the universe basic elements in addition to
water, earth, and air [2]. However, the paradigm shift in combustion explanation occurred
in the late eighteenth century, with Lavoisier’s postulations on the role of oxygen in
combustion and the invention of the safety lamp and premixed gas burner, in addition to
the studies in flame propagation and detonation. These besides Semenov’s theory in
thermal ignition and chain reactions, and the works of Zeldovich, Damköhler, and Von
Karman in the first half of the twentieth century, in addition to the contributions of many
other researchers and scientific societies have helped in pushing combustion investigation
many steps forward [3].
Presently, combustion plays an essential role in industry, transportation, energy
production, and different aspects of life and civilization, and accounts for the highest
portion of energy production around the world. Therefore, great efforts are conducted and
being applied to investigate, develop, and then control the diverse combustion processes
and systems with the associated phenomena. All these efforts are aspired by one objective
that is to make energy production safer, cleaner, and more efficient.
Liquid hydrocarbon fuels contribute a great amount of this energy, due to the ease
and flexibility of transporting and storing these fuels compared to the gaseous forms, in
addition to their availability compared to the solid fuels. However, liquid fuels cannot be
used in their bulky form. Therefore, in most of the applications the liquid fuel is mixed
with the oxidizer and burned in the form of sprays of small size droplets. This form of
combustion is relevant to a variety of systems including diesel, rocket, and gas turbine
engines, in addition to the oil-fired boilers, furnaces, and process heaters. Hence, for
developing these systems, a thorough understanding of the basic physical processes related
to spray combustion is essential, not only for increasing energy production but also for
controlling the fire hazard when handling the fuels, and reducing the combustion-generated
pollution.
22
However, spray combustion is a complicated multidimensional aerothermochemical
problem that involves different physical and chemical processes interacting
simultaneously. These processes include – but not limited to – multicomponent two-phase
flows, chemical reactions, heat and mass transfer, and phase change [4]. Thus, a detailed
understanding of spray combustion requires a full comprehension of each of these
processes along with the associated occurring phenomena. Though, this can only be
performed by localizing the analysis within the spray instead of giving overall descriptions,
i.e. microscopic rather than macroscopic investigation. This can be achieved by exploring
an individual droplet as opposed to the complete spray, giving the fact that the spray is an
ensemble of individual droplets that constitute the dispersed phase that is surrounded by a
gaseous medium which represent the continuous phase.
Accordingly, droplet combustion has been the subject of a vast number of
investigations both experimentally and theoretically in an effort to address the mentioned
physical and chemical processes taking place during spray combustion [5]. However, there
are still some gaps to be filled by further investigations. Droplet combustion of the
multicomponent fuels is one of these areas that need further comprehension. The
multicomponent fuel is defined in the present work as the mixture of two or more liquid
fuels or fuel mixtures that are prepared prior to combustion. This include, fuel blends,
emulsions, and all other mixtures resulting from the physical mixing rather than chemical
reaction of the mixture constituents. In this context, the single-component fuel is meant to
be the regular neat liquid fuel that is used in its original form without mixing with other
components, such as regular diesel, gasoline, ethanol, and methanol.
Hence, the aim of the present work is to fill in some of these gaps. This would be
achieved by implementing experiments on three different categories of droplet combustion,
namely, multicomponent fuel droplet combustion, in-droplet dynamics, and the reciprocal
interaction of two-neighbouring droplets during combustion. These aims and a summary of
the overall motivations behind this work are shown in Figure 1-1.
Conversely, optical diagnosis is one of the mostly implemented techniques in
combustion measurements both qualitatively and quantitatively. And it is receiving an
increased interest due to a variety of advantages such as non-disturbing the flow field
inside the measured system, quick and precise record of the instantaneous changes in the
environment under study, and large data provided in comparison to other measurement
techniques [6]. However, a single optical technique is limited in the number of parameters
studied for every process. Therefore, in the present work three different imaging

23
techniques are used for studying droplet combustion, namely, the backlighting imaging,
shadowgraphy, and Schlieren imaging. This resulted in covering as much as possible of the
processes and phenomena associated to droplet combustion.
Figure 1-1: Motivation sequence of the present work.
In conclusion, the main motivation behind the present work is taking the current
understanding of droplet combustion a step further by carrying out an in-focus
experimental investigation of the liquid-phase dynamics during the combustion of the
multicomponent fuel droplet using three different high speed imaging techniques.
1.2 Objectives
According to the aforementioned motivations, the main objective of the present work
is the study of the multicomponent fuel droplet combustion using high speed imaging. This
objective in turn, is subdivided into the following sub-objectives:
i. Performing a comprehensive review of the up-to-date research works in droplet
combustion. The intension is to collect, classify, outline, and summarize all the
possible available previous work dedicated to droplet combustion.
ii. Developing an optical setup (or setups) capable of tracking the different processes
occurring within the liquid-phase of the droplet during combustion. Considering
Dropelt Liquid-Phase Dynamics
Droplet Combustion
Spray Combustion
Liquid Fuel Combustion
Fuel Combustion
Energy Production

24
initial droplet diameter, size variation, transparency, and the chaotic nature of
combustion, in addition to the short time span of the overall process.
iii. Using the developed setups for studying the combustion of multicomponent fuel
droplets with an emphasis to the droplet liquid-phase processes. These include
nucleation and bubble dynamics, puffing and microexplosion, and sub-droplet
generation by secondary atomization.
iv. Developing and validating appropriate algorithms for processing the images obtained
by experimentation, and extracting the required droplet features with high precision
and minimum uncertainty.
v. Testing different fuels and fuel mixtures and providing quantitative data for the
droplet combustion characteristics of these fuels.
vi. Studying the effect of multi-droplet interaction on the droplet liquid-phase dynamics
of the multicomponent fuel droplets during combustion.
vii. Providing quantitative data for the occurrence of puffing and microexplosion and
secondary atomization rate during the combustion of multicomponent fuel droplets.
1.3 Thesis Outline
The thesis is divided into eight chapters arranged sequentially to outline the
development of the work carried out starting from the motivations behind the work and
ending with the main findings and conclusions. These chapters are as follows:
Chapter 1 contains the motivation and objectives of this work. The covered areas of
droplet combustion and the used diagnosis techniques for each area are outlined as well.
Afterwards, the work objectives are listed.
Chapter 2 presents a theoretical review of the problem starting from atomization and
liquid fuel combustion, in addition to a basic description of droplet combustion and the
classical “D2-law” theory. The most used diagnostic techniques for droplet combustion
investigation have also been reviewed.
Chapter 3 outlines the main experimental features of the work, including
multicomponent fuel preparation, droplet generation, suspension, and ignition techniques.
Then, the image processing methodology and algorithms are explained. Furthermore, data
validation and error analysis for the experimental results and image processing algorithms
have been depicted in the end of the chapter.

25
Chapter 4 demonstrates the experimental work carried out for evaluating the
characteristic parameters in the combustion of an isolated multicomponent fuel droplet.
These include the burning rate constant, droplet size evolution, and the flame stand-off
ratio, in addition to the droplet shape variation throughout the entire droplet combustion
time.
Chapter 5 focuses on the puffing and microexplosion processes leading to secondary
atomization and sub-droplet emission from the isolated multicomponent fuel droplets
during combustion.
Chapter 6 tracks the droplet liquid-phase including nucleation and bubble generation
and growth inside the multicomponent fuel droplet during combustion.
Chapter 7 presents the combustion characteristics of two-interacting droplets of the
multicomponent fuels using magnified high speed imaging.
Chapter 8 summarizes the overall findings of the present work, and proposes the
probable future works for further investigations.
Additionally, five appendices are incorporated at the end of the thesis for elucidating
the auxiliary data and methods used in the present work. These include fuel terminology,
fuel properties, droplet diameter evaluation methods, published burning rates, and the
Matlab code flowcharts.

26
Chapter 2. Literature Review
2.1 Introduction
Combustion as a process is an extremely fast exothermic reaction that releases
energy in the form of heat and propagates through the surrounding environment in the form
of flame [7]. Combustion is an integral of different physical and chemical processes that
start by fuel-oxidizer mixing, proceed by ignition and flame propagation, and terminate by
the production of various chemical substances as a result of fuel oxidation. The essential
part of combustion is the flame, since it is the zone where fuel and oxidizer meet and react
and it is the region of the highest temperature in combustion. Therefore, it has received and
still receiving the greatest interest in scientific investigation. The flame is defined as a
rapidly propagating, self-sustaining, reaction in a tiny space between the fuel and oxidizer.
Flames are classified according to different categories depending on the type of reactants,
flow condition, and other factors. The most famous flame classifications are based on:
Combustible Mixture Formation: flames are classified according to the
fuel/oxidizer mixing into Premixed Flames and Diffusion Flames. Premixed flames
take place when the fuel and oxidizer are well mixed prior to combustion, or the
fuel-oxidizer mixing occurs ahead of the flame front as in the Bunsen burner.
Whereas the diffusion flames occur when the fuel and oxidizer enter the
combustion zone separately and react rapidly as they mix.
Type of Flow: flames are classified according to the reactants nature of flow into
Laminar Flames when the flow is laminar, and Turbulent Flames for turbulent
flows [8].
Examples of flame types and applications are shown in Table 2-1. Diffusion flames are
preferred in the majority of industrial applications since it is safer to keep the fuel and
oxidizer away from each other, in addition to the greater flexibility they provide in
controlling combustion intensity and flame structure. Turbulence on the other hand is
more preferred in combustion than laminar flow due to the resulting mixing
enhancement by turbulence compared to laminar flow [9]. However, diffusion flames
are sometimes superimposed on the premixed flames in some practical combustion
systems involving the combustion of liquid fuels.

27
Table 2-1: Flame types with examples.
Flow/Flame Premixed Diffusion
Laminar Bunsen Burner Candle Flame
Turbulent Spark Ignition Engine Compression Ignition engine
On the other hand, combustion may be classified according to the physical state of
the reactants. Where, the term homogeneous combustion is used for describing the
combustion of fuel that is in the same physical state as the oxidizer, such as the Bunsen
flame. Whereas the heterogeneous combustion describes the combustion when the fuel and
oxidizer are initially in different physical phases, such as the combustion of coal particle in
air [10]. Since the majority of combustion applications are based on burning the fuel in air;
therefore, the heterogeneous combustion will take place basically in the combustion of
liquid and solid fuels due to the multiphase nature of the combustion of these fuels. And,
due to the same reason, heterogeneous combustion is more complicated than the
homogeneous combustion. Therefore, further investigations are required for acquiring in-
depth information and developing the understanding of the chemical and physical
processes that take place throughout the heterogeneous combustion. Hence, the scope of
the present work is the heterogeneous combustion of liquid fuels in air.
2.2 Liquid Fuel Combustion
A large portion of the global energy requirements comes from burning liquid
hydrocarbons. This is due to the ease and flexibility of transporting and storing these fuels
compared to the gaseous forms, in addition to their availability compared to the solid fuels.
Liquid fuel combustion may take different forms according to the type and quantity
of liquid and the nature of combustion system. These forms are shown in Figure 2-1. Some
of these forms take place in the form of accidental fires such as the Pool Fire and the Spill
Fire. The former type occurs for the liquid fuels stored in open tanks, buds, and fuels
accumulated in depressions in the ground. The term pool is usually used for describing
liquids of free surface and considerable depth (more than 10mm). In the pool fire the depth
of the liquid is important in deciding the burning rate and continuity of combustion. When
the depth is high, the heat dissipation to the bottom of the liquid is of minimum effect on
the burning rate. The spill fire on the other hand is assumed as special case of the pool fire
28
that occurs throughout the burning of a leaking liquid fuel on a non-blocked space. In such
case, liquid spread continues, causing the area of the burning surface to increase until
reaching dynamic equilibrium. Examples of such case are the leakage of liquid fuel from a
pipe or a damaged vessel. The topography of the surface plays a key role in deciding
whether the liquid will spread uniformly over the ground or flow in discrete channels.
Figure 2-1: Different types of liquid fuel combustion at different sizes [1].
Liquid depth is affected by the properties of liquid itself and the nature of the surface
where the flow is taking place. If the depth of the liquid is increased, the combustion will
take the form of pool fire rather than spill fire [11]. Each of these configurations take the
form of non-premixed or diffusion flame.
However, in the majority of applications liquid fuel combustion is planned and
controlled. Though, in these applications, the essential property of the liquid fuels that may
affect the nature of their combustion form is that the ignition point of the fuel-oxidizer
mixture is usually higher than the evaporation point of the liquid fuel. Accordingly,
combustion will occur mainly – if not only – in the gaseous phase. Hence, the fuel
tendency for evaporation is called volatility. Liquid fuels are classified according to
volatility into volatile and non-volatile fuels. Volatile fuels usually vaporize and mix with
the oxidizer, and then burn in a premixed flame, such as gasoline combustion in the spark
ignition engine. While, the non-volatile fuels are usually vaporized during combustion,
leading to diffusion flame configuration. Example of this type of fuels is the diesel
combustion in the compression ignition engine [12]. In the latter, the fuel is injected in the
form of spray into a high pressure high temperature air so that the bulk of liquid fuel will
disintegrate into smaller size droplets which will evaporate and burn locally. This form of
29
spray combustion involves different physical and chemical processes that interact
simultaneously throughout the overall combustion process. This interaction makes it
worthwhile to invest in the investigation and further analysis of such processes in an
objective to comprehend the nature and mechanism of each of these processes. Therefore,
liquid fuel spray combustion will be the scope of the rest of the present work.
2.2.1 Liquid Fuel Spray Combustion
Spray combustion earliest implementation was in the late nineteenth century for
burning non-volatile liquid fuels. Certainly it remained the main technique of burning
heavy fuel oils at present in spite of the use of fluidized bed combustors.
The burning liquid fuel spray is different from a premixed gaseous fuel; the former is
being non uniform in composition. The liquid fuel exists in the form of discrete variable
size droplets moving in random directions and variable velocities compared to the main
stream. This form of non-uniformity in the combustible mixture leads to irregularities in
flame propagation through the spray, which makes the combustion zone geometrically
poorly defined [13]. Liquid fuel combustion consists mainly of four processes, namely:
spray formation, fuel evaporation, combustible mixture formation, and mixture combustion
[14,15]. The fuel spray is usually formed by injecting the fuel through a nozzle at very high
pressure (up to 2000 bar) towards the combustion chamber (that is normally a hot
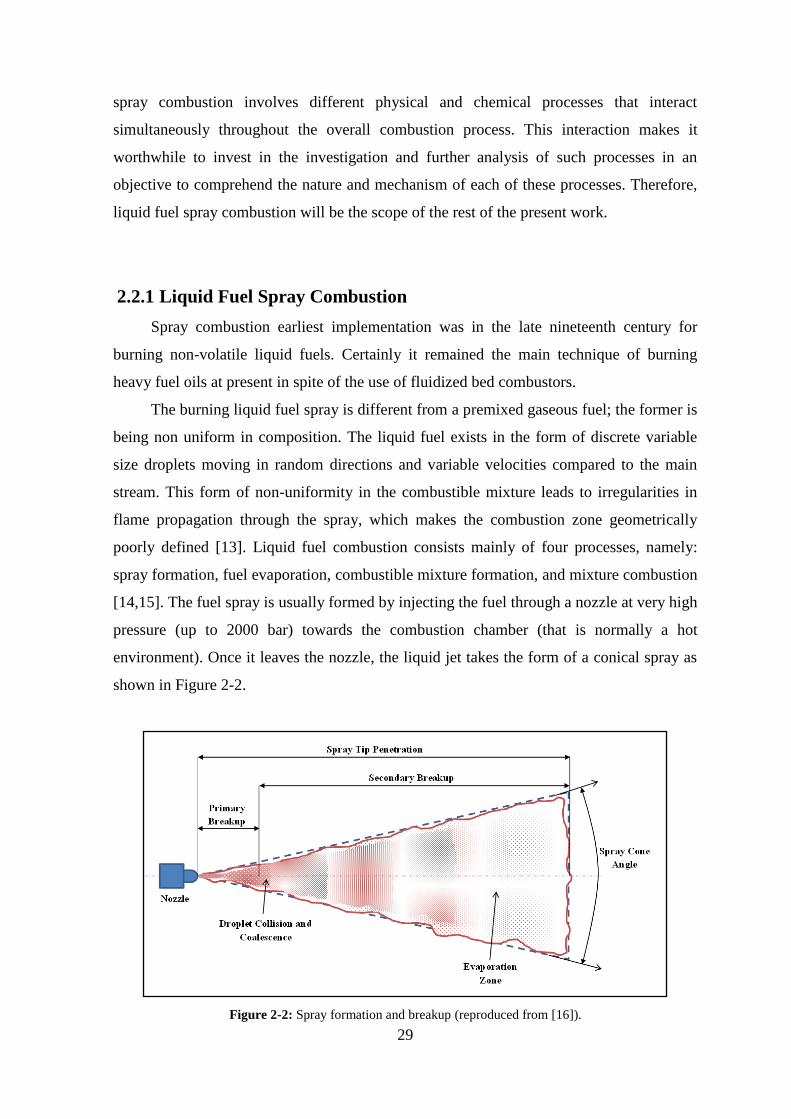
environment). Once it leaves the nozzle, the liquid jet takes the form of a conical spray as
shown in Figure 2-2.
Figure 2-2: Spray formation and breakup (reproduced from [16]).

30
Turbulence inside the liquid stream causes its break up into a bundle of liquid threads
that subsequently progress into a dense cloud of different size droplets that penetrate
through the gas into the combustion zone, evaporate and mix with the oxidizer to initiate
(and then maintain) combustion. Liquid break up and droplet formation is known as
atomization. Atomization is important in combustion, since most of the combustion
systems (such as the industrial furnaces and internal combustion engines) work on liquid
fuels that cannot be used before being atomized. And it is essential in increasing the
combustion efficiency in such systems because of the high liquid surface to mass ratio
generated after atomization, which in turn leads to higher rates of evaporation and mixing,
and then combustion [17].
2.2.2 Atomization and Droplet Formation
Atomization is defined as the conversion of liquid from its bulky form into a spray of
droplets and other physical dispersions of small particles in a gaseous environment. This
could take place due to the kinetic energy of the liquid being atomized, such as that carried
out by the pressure atomizers, or by being in contact with high-velocity gaseous substance,
in what is called the air-assist atomizers, or as a result of an external force, such as the
flash boiling atomization, effervescent atomization, ultrasonic atomization, and
electrostatic atomization [17].
Despite how the sheet is produced, its instability is increased by the surrounding
aerodynamic disturbances, causing it to spread out from the nozzle with a decrease in its
thickness and perforations that take place and develop toward each other creating threads
and ligaments as shown in Figure 2-3. The collapse of these ligaments with each other
leads to the formation of variable size droplets. This initial collapse of the spray into
threads and ligaments, and then into droplets is called primary break-up. The size of the
resulting droplets ranges from few microns to hundreds of microns [18], and is determined
by the liquid sheet initial thickness, velocity gradient between the liquid and the
surrounding gas, and liquid physical properties (mainly viscosity and surface tension) [17].
These droplets may undergo a subsequent break-up due to the aerodynamic forces resulted
by the velocity gradient between the droplets and environment. This subsequent break-up
is called secondary atomization [16].

31
Figure 2-3: Idealized process of droplet formation from a liquid sheet [19].
Thence, it is found that droplet size variation has an effect on both spray and engine
performance characteristics. Spray tip penetration distance and velocity are found to
increase with increasing droplet size due to the longer evaporation time required [20,21].
Flame shape is affected by droplet size as well. Large droplets usually burn in a diffusion
flame around the liquid phase, while a premixed gas flame appearance is noticed in the
combustion of very small droplets, due to the complete evaporation of these droplets
upstream of the flame front [22]. Furthermore, NOx formation is found to decrease by
decreasing droplet size in the spray due to enhanced evaporation and the domination of
premixed combustion mode compared to the diffusion combustion mode of the large size
droplets [23].
Accordingly, it can be deduced how prominent are the droplet characteristics in
defining the fuel spray and engine performance characteristics. Hence, a comprehensive
understanding of the single constituent of the spray would be helpful for explaining the
more general spray structure. This is due to the fact that the fuel spray is an integral of a
large number of small size droplets. Therefore, the previously set scope of the work on
liquid fuel combustion is further converged to single fuel droplet combustion.
2.3 Droplet Combustion
Studies of spray combustion are categorized into two major trends: the first is based
on analysing the real combustion process, starting from single fuel droplet combustion or
an idealized spray, while in the second trend; direct observations of spray combustion are
made to investigate the different accompanying phenomena such as flame length,

32
radiation, flame oscillation and stability. Moreover, spray combustion could be studied
theoretically using the information from a single fuel droplet in the turbulent gas diffusion
combustion [24]. Therefore, droplet combustion investigation is essential for
understanding spray combustion, since the spray prior to combustion turns into an integral
of a large number of fine droplets.
First of all, it is important to differentiate between the different forms of droplet
combustion. In fact, there are two forms of droplet combustion; the first is the
monopropellant droplet combustion, where the fuel and oxidizer exist in a single
substance, as it is seen in the combustion of hydrazine by nitromethane [25]. This form of
droplet combustion has been the subject of a variety of research work, both experimental
[26–28], and theoretical [29–33]. The second form is the bipropellant droplet combustion,
which is by far more employed in practical applications that involve fuel droplet
combustion in a surrounding oxidizing medium (usually air). The present work is
conducted mainly on the second form of droplet combustion.
2.3.1 The Classical Theory of Droplet Combustion
The first experimental work carried out for investigating the combustion of an
isolated fuel droplet belongs to Godsave in 1949 [34] and 1950 [35], and Kumagai and
Isoda in 1950 [36]. Whereas, the first and simplest model designed for describing droplet
evaporation and combustion – also known as the classical theory (or D2-law) of droplet
combustion – is carried out by Godsave [37] and Spalding [38] in 1953 [39]. The classical
theory exemplifies the essential physics and gives an elementary speculation on droplet
regression rate [4]. In this model, the fuel droplet is exposed to a stagnant oxidizing
environment. This droplet evaporates at its surface, though the resulting vapour diffuses
outward and reacts with the oxidizer – which is diffusing inward from the surroundings –
in a non-premixed flame, as shown in Figure 2-4.
The fuel vapour and oxidizer consume each other in the flame zone in a
stoichiometric reaction. The heat generated by the reaction conducts inward towards the
droplet and outward towards the environment. The heat portion conducted towards the
droplet will provide the required energy for persisting droplet evaporation and maintaining
combustion until full consumption of the fuel droplet.

33
Figure 2-4: Combustion model of an isolated liquid droplet in an infinite oxidizing medium.
The resulting heat is transferred from the flame through conduction and radiation
towards both the environment and the droplet surface [39]. Hence, the energy, fuel, and
oxidizer conservation equations are taking the forms shown in equations 2-1, 2-2, and 2-3
respectively:
𝑟2𝜌ν𝑑(𝐶𝑝𝑇)
𝑑𝑟=
𝑑
𝑑𝑟[𝑟2
𝜆
𝐶𝑝
𝑑(𝐶𝑝𝑇)
𝑑𝑟] − 𝑟2�̇� ……… (2-1)
𝑟2𝜌ν𝑑𝑚𝐹
𝑑𝑟=
𝑑
𝑑𝑟[𝑟2𝐷𝜌
𝑑𝑚𝐹
𝑑𝑟] − 𝑟2𝑚𝐹̇ ……… (2-2)
𝑟2𝜌ν𝑑𝑚𝑂
𝑑𝑟=
𝑑
𝑑𝑟[𝑟2𝐷𝜌
𝑑𝑚𝑂
𝑑𝑟] − 𝑟2𝑚𝑂̇ ……… (2-3)
For solving the above equations, and developing the classical theory of droplet
combustion, the following assumptions have been made:
i. Quasi-steady droplet combustion.
ii. Spherical symmetry. Therefore, convection and diffusion only take place radially, and,
temperature and mass fractions of the fuel and oxidizer depend only on the radial position.
iii. Stoichiometric reaction between the fuel and oxidizer at the flame front. Hence, the rate
of change of energy is determined by the rate of consumption of both reactants.
iv. The chemical kinetics are infinitely fast compared to diffusion, resulting in an
infinitesimally thin flame interface between fuel and oxidizer.
v. The gas-phase heat capacity and transport properties are all constant.

34
vi. Gas-phase quasi-steadiness.
vii. Uniform and constant droplet temperature close to the saturation point, so that the
heating up period is neglected.
viii. Both Soret and Dufour effects are neglected. This is to neglect the heat flux due to
concentration difference and mass diffusion due to temperature gradient.
ix. Single-component fuel droplet with no internal flows in any dimension.
x. No soot formation, negligible radiation. To cancel out the effect of luminosity radiation
in the conservation of energy term.
xi. Unity Lewis number. For combining the energy and mass conservation equations and
eliminating the rate-dependent source terms.
Correspondingly, equations (2-1)-(2-3) are simplified and solved for evaluating the
main characteristic parameters of droplet combustion as follows:
The mass burning rate of the burning droplet is evaluated as:
𝑚𝐹̇ =4𝜋𝑘𝑔𝑟𝑠
𝑐𝑝𝑔ln[1 + 𝐵] ……… (2-4)
Flame temperature is expressed in terms of droplet surface temperature, fuel properties,
and stoichiometric fuel/air mixture as:
𝑇𝑓 = 𝑇𝑠 +𝑞𝑖 + ℎ𝑓𝑔
𝑐𝑝𝑔(1 + 𝜈)[𝜈𝐵 − 1] ……… (2-5)
Flame radius, on the other hand, is expressed in terms of the droplet radius as shown in
equation (2-6). This ratio is known as the flame stand-off ratio of droplet combustion.
𝑟𝑓
𝑟𝑠=
ln[1 + 𝐵]
ln[1+𝜈𝜈 ]
……… (2-6)
Fuel mass fraction at the droplet surface has also been evaluated as:
𝑌𝐹,𝑠 =𝐵 − (1
𝜈⁄ )
𝐵 + 1 ……… (2-7)
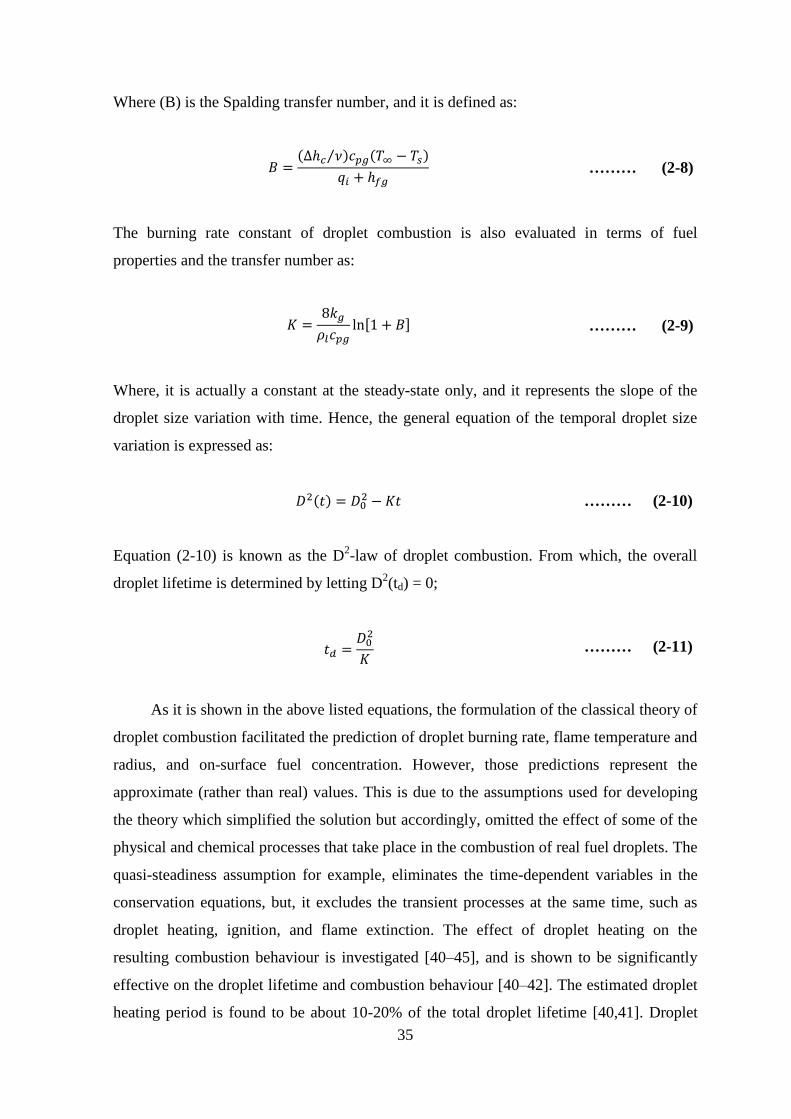
35
Where (B) is the Spalding transfer number, and it is defined as:
𝐵 =(∆ℎ𝑐 𝜈⁄ )𝑐𝑝𝑔(𝑇∞ − 𝑇𝑠)
𝑞𝑖 + ℎ𝑓𝑔 ……… (2-8)
The burning rate constant of droplet combustion is also evaluated in terms of fuel
properties and the transfer number as:
𝐾 =8𝑘𝑔
𝜌𝑙𝑐𝑝𝑔ln[1 + 𝐵] ……… (2-9)
Where, it is actually a constant at the steady-state only, and it represents the slope of the
droplet size variation with time. Hence, the general equation of the temporal droplet size
variation is expressed as:
𝐷2(𝑡) = 𝐷02 − 𝐾𝑡 ……… (2-10)
Equation (2-10) is known as the D2-law of droplet combustion. From which, the overall
droplet lifetime is determined by letting D2(td) = 0;
𝑡𝑑 =𝐷0
2
𝐾 ……… (2-11)
As it is shown in the above listed equations, the formulation of the classical theory of
droplet combustion facilitated the prediction of droplet burning rate, flame temperature and
radius, and on-surface fuel concentration. However, those predictions represent the
approximate (rather than real) values. This is due to the assumptions used for developing
the theory which simplified the solution but accordingly, omitted the effect of some of the
physical and chemical processes that take place in the combustion of real fuel droplets. The
quasi-steadiness assumption for example, eliminates the time-dependent variables in the
conservation equations, but, it excludes the transient processes at the same time, such as
droplet heating, ignition, and flame extinction. The effect of droplet heating on the
resulting combustion behaviour is investigated [40–45], and is shown to be significantly
effective on the droplet lifetime and combustion behaviour [40–42]. The estimated droplet
heating period is found to be about 10-20% of the total droplet lifetime [40,41]. Droplet

36
ignition delay time is also important in the real combustion systems, since it defines the
portion of heterogeneous combustion and the rate of heat and mass transfer to and from the
droplet [46]. The droplet ignition delay time is considerably variable and is affected by the
type of fuel [47–49], droplet initial size [50,51] and initial temperature [51], and the
environmental pressure and temperature [52,53].
The constant transport properties assumption causes uncertainty in the results due to
the strong dependence of the thermophysical properties on both temperature and species
concentration [54,55]. These uncertainties may reach about 20% of the experimentally
evaluated characteristics [54]. Therefore, different theoretical models have been developed
for investigating droplet combustion under variable transport properties [56–58].
On the other hand, experimental investigation of the droplet combustion under zero
or microgravity conditions have revealed the formation of sootshell around the droplet for
different types of fuels [59–64]. A sample image of this sootshell is shown in Figure 2-5.
This finding practically neutralized the assumption of no soot formation that is used for
developing the classical theory of droplet combustion.
Figure 2-5: Shadowgraph image of the soot shell formation during the combustion of ethanol fuel droplet in
microgravity [62] (with permission from the publisher).
Accordingly, the values predicted by the use of the classical theory of droplet
combustion may be utilized for primary estimation purposes rather than precise
calculations. However, the characteristic parameters set by the classical theory, such as the
burning rate constant, flame stand-off ratio, and droplet lifetime became the key
parameters to be evaluated throughout the majority of the research work conducted for

37
investigating droplet combustion both theoretically and experimentally. A review of the
development of such research works is performed below.
2.3.2 Development of the Droplet Combustion Investigation
After the D2-law formulation by Godsave and Spalding, and the preceding
pioneering experiments of Godsave, and Kumagai and Isoda, droplet combustion
investigation received an increased interest and experienced rapid development, especially
with the evolution of both instrumentation and experimental techniques, on one hand, and
the computers and computational methods on the other. Kumagai and Isoda [65] performed
the first droplet combustion experiment under microgravity conditions. They aimed to
prove the spherical symmetry assumptions of the classical theory by eliminating the effect
of buoyancy and natural convection on the droplet burning rate. Due to the effect of
buoyancy, the visible flame takes a more oval-like shape rather than the spherical shape
assumed by the classical theory, as shown in Figure 2-6 for a diesel fuel droplet burning
under both microgravity and normal gravity conditions.
Figure 2-6: The shape of the flame surrounding a burning droplet as it appears under: (a) microgravity
conditions, (b) normal gravity conditions [66] (with permission form the publisher).
Accordingly, Kumagai and Isoda have created the microgravity environment for their
experiment by suspending the droplet inside a freely falling chamber and imaging the
droplet – that is ignited inside the chamber – when the chamber passes a certain predefined
point in its path as shown in Figure 2-7. Glass windows are added to the chamber to allow
imaging the droplet during combustion.

38
Figure 2-7: The falling chamber used by Kumagai and Isoda [67] (with permission from the publisher).
This experiment is then developed by Kumagai and his co-workers for eliminating the
effect of the suspending fibre [68–70], and studying the effects of air flow [71], and initial
droplet diameter [72] respectively on the droplet burning rate under microgravity
conditions. The work of Kumagai and Isoda was the start of a new path in droplet
combustion investigation that is carried out under zero/micro/low gravity conditions. Some
are carried out according to the same principle of freely falling chamber. This is
encouraged by the establishment of the drop tower facilities for performing gravity-related
studies, such as the NASA zero-gravity and 2.2 second drop towers operated in the mid-
sixties of the last century, and the MGLAB, ZARM, and NML drop towers in Japan,
Germany, and China respectively.
Figure 2-8: The 110m Height ZARM Drop Tower in Bremen, Germany [73].

39
The drop towers are air-evacuated, specially built structures either above the ground
(towers), or underground (shafts) of heights around 100 m, in which microgravity
experiments are carried out by free falling capsules inside these towers [73], as shown in
Figure 2-8. These towers may generate a microgravity environment in the range of (10-5
-
10-6
g). Diversity of droplet combustion research work has been carried out using these
towers [49,59,62,74–77].
Another microgravity experiments are carried out using the parabolic flight
technique [78–82]. The experiments are performed inside specially modified aircrafts
which are used for reducing the gravity by flying through paths with a set of parabolic
trajectories as shown in Figure 2-9. The microgravity generated using this technique is
about (10-2
g) [73,78,79,81,82], which is lower than that obtained by the drop tower
method. The third method for investigating droplet combustion under reduced gravity
conditions is to perform the test in space. This is carried out on-board either the
International Space Station ISS [77,83–87], or space shuttles with specifically assigned
experimental testing missions, such as the space shuttle Columbia, in which a variety of
experiments are carried out [88–92].
Figure 2-9: Parabolic Flight Profile of the Zero-Gravity Airbus A300 Aircraft of Novespace - France [73].
Likewise, droplet combustion investigation under normal gravity conditions has also
been extensively performed, since the real fuel combustion usually takes place under
normal – rather than reduced (or zero) – gravity environments. Despite the effects of
buoyancy and natural convection associated with the normal gravity conditions, the
experimental work performed under certain conditions has the privilege of flexibility and
suitability for every type of measurement techniques. The size and weight limitations

40
associated with the falling chamber and drop tower techniques are not encountered in the
normal gravity experiments. The cost effectiveness and ease of repeatability are other
factors to be added for the advantages of the normal gravity experiments when compared
to the microgravity experiments carried out in space and the parabolic flights. Therefore, in
a 276 sample statistical survey of the published work on droplet combustion research for
the period of time from the early 1950’s to 2017, the portion of experimental research work
carried out under normal gravity conditions is found to be higher than that of the
corresponding work under reduced (or micro) gravity conditions as shown in Figure 2-10.
Among these 276 experimental research papers, 63% are performed under normal gravity
and the remaining 37% is carried out under reduced gravity conditions. A variety of
research areas have been considered under normal gravity conditions, these include but not
limited to droplet ignition [52,93,94], burning rate [95–97], microexplosion [98,99], and
sooting behaviour [100], of different single-component [95,101–105] and multi-component
[93,94,98,99] fuels, and under variable environmental conditions [52,96,97,102,106,107].
Figure 2-10: Comparison between the portion of research work on droplet combustion carried out under
normal gravity and that carried out under reduced gravity conditions for the period 1949-2017.
Droplet combustion modelling, on the other hand, has encountered substantial
developments since the earliest description and formulation of the D2-law by Godsave and
Spalding. New models have been – and are being – developed for more accurate
description of the problem and precise evaluation of the corresponding parameters. These
models commenced initially with the attempts to modify the D2-law model. Initially,
Goldsmith and Penner [108] modified Godsave’s model by eliminating the unity Lewis
number assumption, and using temperature dependent – rather than Godsave’s constant –
0
2
4
6
8
10
12
14
16
1950's 1960's 1970's 1980's 1990's 2000's 2010's
To
tal
Sa
mp
les
(%)
Normal Gravity Reduced Gravity

41
specific heat and thermal conductivity. More generalized formulas for the transport
properties are then set and used by Kassoy and Williams [54] for studying droplet
combustion. Afterwards, different models are developed for studying droplet heating [40–
45], ignition [43,53,109–113], extinction [109,110,114,115], and other aspects of droplet
combustion.
However, droplet combustion investigation has not been limited to studying the
combustion of isolated single-component fuel droplets. Instead, interacting droplet clusters
and streams has also been investigated, in addition to the implementation of
multicomponent fuels and fuel mixtures on an extensive number of droplet combustion
studies. Despite the importance of the isolated, single-component fuel droplet combustion
model in understanding the overall droplet combustion process and proving the classical
theory of droplet combustion, but, the multicomponent fuel droplet and interacting multi-
droplet combustion models are more realistic compared to the aforementioned model.
Since, the majority of liquid fuels utilized in combustion applications are in fact mixtures
of different components rather than a single component, and are burning in the form of
sprays of a large number of droplets that are interacting together within the boundaries of
the spray. Accordingly, further exploration of these two categories is believed to be
helpful. Hence, detailed reviews of the multicomponent fuel droplet combustion and the
combustion of interacting fuel droplets are outlined in sections ( 2.4) and ( 2.5) respectively.
2.4 Multicomponent Fuel Droplet Combustion
A large portion of fuels are utilized in the form of multicomponent fuels or fuel
mixtures. These fuels are either initially produced in the multicomponent form (such as the
diesel fuel), or prepared as multicomponent fuel mixtures prior to usage. These mixtures
are either taking the form of blends (such as diesel and gasoline blending with alcohol),
emulsions (as in the water-in-oil emulsions), or slurries (found in the coal/water mixtures).
Three main purposes are behind the use of fuel mixtures in combustion: the first is
increasing the performance of the combustion system by the addition of higher heating
value fuels. The second is reducing the harmful environmental impact of the conventional
fuels. And the third is the depletion of the conventional liquid fuel resources. Hence, the
components added to the conventional fuels are usually selected according to the above
mentioned purposes, and have to fulfil the conditions of system performance, fuel

42
availability and sustainability, and better environmental impact. Accordingly, alcohols and
biofuels are the most utilized fuels with the conventional liquid fuels in combustion
applications, because of their evidenced soot and NOx reduction effects and relatively
comparable combustion efficiency as those of the conventional liquid fuels.
In the multicomponent fuel mixtures, no chemical reaction will occur between the
fuel constituents, and each constituent sustains its own physical and chemical properties.
Therefore, the combustion of the resulting mixture is more complicated than the pure fuel
combustion, because different components are burning simultaneously at the same point
and instant of time. Hence, unlike the single component fuel droplet combustion – in which
droplet evaporation is the rate controlling process – the multicomponent fuel droplet
combustion encompasses the effect of droplet interior heat and mass transfer [116].
As a result, the multicomponent fuel droplet combustion is much more complicated
compared to the single-component fuel droplet combustion. Firstly, the different
constituents of the multicomponent fuel have different boiling points and different
evaporation rates that leads to creating concentration gradients inside the droplet (in the
liquid phase). Secondly, due to the boiling point gradient, a difference in volatility
tendency is expected. Hence, the more volatile components tend to evaporate first until
their concentrations are reduced, changing the concentration gradient inside the droplet.
Lastly, the evaporation of the more volatile components reduces their concentrations but
does not consume them completely. Thus, the remaining quantities of the highly volatile
components tend to diffuse to the droplet surface due to their tendency of evaporation, and
the less volatile components will tend to diffuse inward. This in turn, will create an internal
circulation in the liquid phase, and will affect the evaporation rate of the droplet because of
concentration difference on its surface along its lifetime [117]. Therefore, the main
parameters that are affecting droplet combustion of the multicomponent fuels are: (i) the
volatility and relative concentration of each of the constituents of the multicomponent fuel,
(ii) the miscibility of these constituents, and (iii) the relative motion inside the droplet [4].
Each of these parameters has its direct effect on the resulting combustion behaviour of the
multicomponent fuel. The volatility and concentration gradient of the constituents paly an
essential rule in the circulation inside the droplet. The phase change characteristics within
the liquid-phase of the droplet are controlled by the miscibility of these constituents on
each other. Whereas, the relative motion inside the droplet will enhance evaporation on the
droplet surface by assisting outward flow of the volatile components inside the droplet.

43
Accordingly, droplet combustion of the multicomponent fuels has been – and is
being – investigated extensively both theoretically and experimentally for better
understanding of the physical and chemical processes associated with this form of droplet
combustion. Primarily, the multicomponent fuel droplet combustion investigation is
carried out by Wood, Wise, and Inami [118] for evaluating the effect of changing fuel
composition on the resulting burning rate of the fuel droplet. They have used heptane,
trimethylpentane, and dibutyl ether all blended with butanol individually to form binary
mixtures. From that time hitherto, the multicomponent fuel droplet combustion has been
extensively investigated in an effort to comprehend its nature and understand the various
associated processes. For instance, assuming uniform composition and temperature
distributions within the droplet liquid-phase, Law [119] developed two theoretical models
for describing the unsteady combustion of the multicomponent fuel droplet. However, the
uniform composition distribution is unattainable in the real droplet combustion process.
On the other hand, Wang, Liu, and Law [116] characterized three distinct stages
during the combustion of freely falling heptane/propanol, hexadecane/propanol,
heptane/hexadecane, and propanol/water mixture droplets. These three stages are: the
volatile component evaporation and consumption stage, the transition droplet heating
stage, and the quasi-steady combustion stage. These stages have also been described by
Niioka and co-workers [120,121] for fibre-supported heptane/hexadecane droplets burning
in high pressure and high temperature environments respectively. And, described by
Botero et al., [122] and Hoxie, Schoo, and Braden [99] during the combustion of freely
falling diesel/ethanol and biodiesel/ethanol, and fibre-supported biodiesel/butanol blend
droplets respectively. However, in certain cases these three stages are not distinctive, due
to the relatively fast consumption rate of the volatile component, so that the combustion of
the droplet will take the form of single-component fuels [59].
Additionally, different types of multicomponent fuel mixtures have been devoted for
experimental studies. These include fuel blends that are either paraffin-based
[59,98,116,120,123–127], diesel-based [99,102,122,128–132], and/or alcohol-based
[116,129,133–136] mixtures; in addition to water-in-oil [125,129,137–143], oil-in-water
[144–146], and alcohol/oil [124,147] emulsions; and liquid-solid mixtures [93,148–150] in
which micro- and nano-particles are added to the liquid fuel for increasing its heating value
and in turn enhancing its combustion efficiency.
Besides, different physical processes which are associated with the combustion of
multicomponent fuel droplets have been the scope of a large portion of studies, such as the

44
puffing and microexplosion leading to droplet secondary atomization. These processes are
initiating and occurring in the liquid-phase of the fuel droplet either in the surface or deep
within the droplet internals, and are directly affecting the overall droplet combustion
behaviour. Accordingly, further exploration of these processes is essential for more in
depth understanding of the multicomponent droplet combustion. Hence, a review of the
origins, physics, consequences, and the research work associated with these processes is
outlined below.
2.4.1 Droplet Puffing, Secondary Atomization, and Microexplosion
Droplet microexplosion is defined as the prompt fragmentation of the
multicomponent droplet as a result of nucleation and explosive boiling of the less boiling
point component(s) [98,151]. If this fragmentation is less intensive and limited to part of
the droplet, it is usually called as puffing. Though, Tsue et. al. [139] and Watanbe et al.,
[152], gave a more specific definition for droplet puffing, that is the process of vapour jet
liberation form the surface of the multicomponent fuel droplet. This vapour jet is usually
filled with finely small sub-droplets of the dispersed phase. The continuous phase may also
detaches from the droplet surface in the form of ligaments or small size droplets as a
consequence of an intensive puffing incident [153]. This detachment of ligaments and
small droplets is called secondary atomization. Therefore, the secondary atomization is
defined as the processes of droplet disintegration into smaller size droplets. This
disintegration results when the dynamic forces acting on the droplet are higher than the
restoration force of the droplet [154].
Puffing and microexplosion are direct results of the nucleation and bubble generation
within the multicomponent fuel droplets. The occurrence of these processes during the
multicomponent fuel droplet combustion is firstly described by Dryer and co-workers
[123–125,155] who gave a general name for these processes that is the disruptive burning
of the multicomponent fuel droplets. The same phenomenon has been distinguished by
Avedisian and co-workers [64,126,147] for n-heptane based binary fuel mixtures including
emulsions. Hoxie, Schoo, and Braden [99], Botero et al., [122], and Segawa et al., [145]
have also described the occurrence of disruptive burning during the combustion of soybean
oil/butanol, diesel/ethanol/biodiesel blends and n-hexadecane/water emulsion droplets
respectively. Lasheras, Fernandez-Pello, and Dryer [124] studied the disruptive burning of

45
the ethanol/n-paraffin and n-propanol/n-paraffin binary solutions under atmospheric
pressure. They found that droplet disruption results from the homogeneous bubble
nucleation, expansion, and explosion inside the droplet. Recently, Avulapati et. al., [131]
have studied the puffing and microexplosion occurrence during the droplet combustion of
diesel/ethanol, diesel/biodiesel, and ethanol/biodiesel blends, in addition to a diesel-
biodiesel-ethanol micro-emulsion. Whereas Zhang et al., [156] have investigated the
puffing occurrence during the heating and evaporation of biodiesel/butanol fuel droplets.
Numerical modelling on the other hand has also been performed for more detailed
understanding of these phenomena. Watanabe et. al., [157] have developed a numerical
model of emulsion fuel spray combustion with an emphasis on the puffing occurrence.
Shinjo and co-workers have performed extensive numerical investigations on the dynamics
of puffing and microexplosion during the evaporation of single fuel droplet [151], and a
group of fuel droplets[158], in addition to the combustion of single and multiple fuel
droplets [159]. They have made a detailed description of the initiation and development of
puffing and partial microexplosion as shown in Figure 2-11. They have found also that the
puffing intensity is a function of the size and depth of the bursting bubble.
Figure 2-11: Puffing from an ethanol-in-decane emulsion droplet [159].
Watanabe and co-workers on the other hand, have conducted a series of experimental
studies dedicated for characterizing the secondary atomization from emulsified fuels in the
form of spray [160–162] and single-isolated droplet [160,163,164]. They have used
shadowgraph imaging for tracking the secondary atomization occurrence from an
evaporating water-in-n-decane emulsion spray and found the same puffing behaviour for
the single droplet of 1 mm diameter and the spray of 50 µm average droplet size [161].

46
Furthermore, it is reported that droplet complete microexplosion occurs in a time
interval less than 200 µs [4], and that this time scale is longer than the time scale available
for the real spray combustion [151,161], therefore, this phenomenon has not much been the
scope of experimental investigations. However, the total combustion time (in ms) inside a
4-stroke engine can be evaluated as a function of the rotational speed according to equation
(2-12) [165]:
𝑡 = 60 ∗ 1000
(𝑁2⁄ )
……… (2-12)
The evaluated combustion time values for a range of engine rotation speeds are listed in
Table 2-2. These time values are sufficiently enough for the real spray droplets to undergo
heating, phase separation, and complete microexplosion, even at low possibilities.
Therefore, further investigation of droplet microexplosion is required for comprehending
the current understanding of this phenomenon.
Table 2-2: The total combustion time with respect to the rotational speed for a 4-stroke engine.
Engine Speed (rpm) Total Combustion Time (ms)
1000 120
2000 60
3000 40
4000 30
5000 24
6000 20
In conclusion, a substantial number of studies have been conducted to explain the
physics of puffing, secondary atomization, and microexplosion. As a result, the effects of
these processes on the combustion efficiency by enhancing fuel evaporation and fuel/air
mixing are well addressed. Additionally, the effect of nucleation and bubble growth in the
droplet liquid-phase on the initiation and development of these processes is also
established. Nonetheless, further comprehension of the physics of these processes
including initiation and development is required. This can be executed by conducting a

47
magnified experimental visualization and tracking of the droplet liquid-phase for obtaining
in-depth quantitative and qualitative description of these processes and the corresponding
mechanisms.
2.4.2 Nucleation and Bubble Generation
Nucleation is defined as the appearance of the first forms of the new phase when a
thermodynamic system undergoes phase change [166]. It is shown in the formation of
bubbles in a boiling liquid, and ice crystals in the solidification of water. For boiling
liquids, nucleation takes place due to the metastability of the liquid compared to its vapour.
Liquid metastability results either from liquid superheating above its boiling point or
expansion below the saturated pressure (the so called cavitation). Hence, the nucleation
occurs due to the tendency of the liquid to retrieve equilibrium [167]. This form of
nucleation arises within the bulk of the liquid and is known as the Homogeneous
Nucleation. If the nucleation takes place at the liquid interface regions rather than the bulk,
it is termed as the Heterogeneous Nucleation [168].
Despite its type and occurrence location, the most important parameter in nucleation
is the nucleation limit – also known as the superheat limit – of the liquid. The nucleation
limit in boiling is defined as the maximum temperature before the critical point at which
the liquid maintains its phase without experiencing any phase change. The energy released
from the vaporizing liquid at the nucleation limit is sometimes sufficient to create the so
called vapour explosion. This explosion takes place as a result of either the thermal
detonation waves resulting from energy release or due to the excessive bubble growth rate
compared to the liquid response [169]. Hence, in the case of multicomponent fuel droplet
combustion, the interior of the droplet is heated by convection and radiation from the
surrounding flame and hot gases. Due to boiling point difference between the different
components of the multicomponent fuel, the lower boiling point components become
superheated. When the droplet temperature approaches the nucleation limit of that
component, bubble nucleation takes place within the droplet liquid-phase leading to vapour
bubble formation [168]. These bubbles move towards the droplet surface due to the density
difference, and then burst outside the droplet by pressure difference across the bubble as
shown in Figure 2-12.
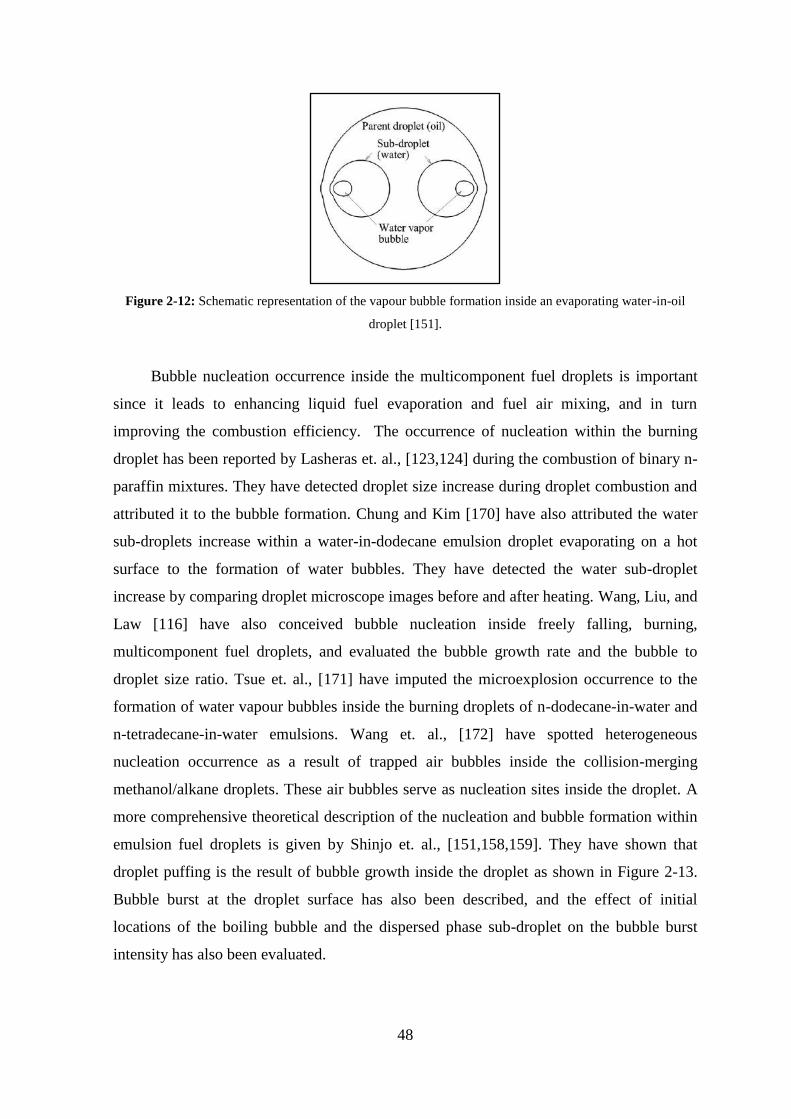
48
Figure 2-12: Schematic representation of the vapour bubble formation inside an evaporating water-in-oil
droplet [151].
Bubble nucleation occurrence inside the multicomponent fuel droplets is important
since it leads to enhancing liquid fuel evaporation and fuel air mixing, and in turn
improving the combustion efficiency. The occurrence of nucleation within the burning
droplet has been reported by Lasheras et. al., [123,124] during the combustion of binary n-
paraffin mixtures. They have detected droplet size increase during droplet combustion and
attributed it to the bubble formation. Chung and Kim [170] have also attributed the water
sub-droplets increase within a water-in-dodecane emulsion droplet evaporating on a hot
surface to the formation of water bubbles. They have detected the water sub-droplet
increase by comparing droplet microscope images before and after heating. Wang, Liu, and
Law [116] have also conceived bubble nucleation inside freely falling, burning,
multicomponent fuel droplets, and evaluated the bubble growth rate and the bubble to
droplet size ratio. Tsue et. al., [171] have imputed the microexplosion occurrence to the
formation of water vapour bubbles inside the burning droplets of n-dodecane-in-water and
n-tetradecane-in-water emulsions. Wang et. al., [172] have spotted heterogeneous
nucleation occurrence as a result of trapped air bubbles inside the collision-merging
methanol/alkane droplets. These air bubbles serve as nucleation sites inside the droplet. A
more comprehensive theoretical description of the nucleation and bubble formation within
emulsion fuel droplets is given by Shinjo et. al., [151,158,159]. They have shown that
droplet puffing is the result of bubble growth inside the droplet as shown in Figure 2-13.
Bubble burst at the droplet surface has also been described, and the effect of initial
locations of the boiling bubble and the dispersed phase sub-droplet on the bubble burst
intensity has also been evaluated.

49
Figure 2-13: Theoretical simulation of the vapour bubble movement inside an evaporating ethanol-in-decane
droplet [158].
From the above, it can be inferred that in almost all the studies, bubble nucleation has
been reported and deduced with respect to droplet size increase. However, except the
numerical simulation work performed by Shinjo et al., bubble nucleation initiation, growth,
and its subsequent dynamics inside the burning multicomponent fuel droplet has not been
well investigated. In particular, magnified experimental investigation of the droplet liquid-
phase dedicated for studying bubble nucleation is not available. Therefore, part of the
present work is devoted for conducting such experimental investigation for different
multicomponent fuel droplets.
2.5 The Combustion of Interacting Fuel Droplets
The classical D2-law of droplet combustion assumes isolated droplet combustion for
neglecting the effect of interaction between the droplet and its neighbouring droplets. This
assumption, in particular, is useful for simplifying the model but it is imprecise for real
spray combustion applications. In the typical spray situations, there is a strong mutual
interaction between the droplets in a specific neighbourhood and among the overall spray
volume. This interaction is intensely affecting the ambient environment surrounding the
droplets, and in turn affects the evaporation and burning rates of each individual droplet
[117]. Hence, considering this interaction in the study of droplet combustion for spray
applications is indispensable.
For investigation and problem characterization purposes, the multi-droplet
interactive combustion is classified into three levels. The first level is termed as the droplet
array, and involves the interaction of a few number of droplets within a specific space. In
the second level of interaction, the number of droplets is higher, and is called the droplet
group, whereas, the third level of interaction accounts for the entire spray [173]. In these

50
levels, the number of droplets and the spacing between them are the main effective
parameters.
Figure 2-14: The effect of spacing between two-neighbouring droplets [173] (with permission from the
publisher).
Droplet spacing is the distance between the centres of two adjacent droplets as shown
in Figure 2-14. This spacing is crucial in deciding the shape and behaviour of droplet
combustion. Where, there is a critical droplet spacing below which the adjacent droplets
are burning in one envelope flame, whereas for higher values of the spacing distance each
droplet will has its own surrounding flame as shown in Figure 2-14. The droplet spacing
distance is usually normalized by and expressed in terms of the droplet diameter, for
example, it is found that the ratio of the critical droplet spacing to the diameter of n-
heptane droplets is about 17 [117].
The effect of droplet spacing on the combustion behaviour of the interacting fuel
droplets has been widely investigated. It is found that increasing the droplet spacing will
decrease the ignition delay time [174,175] and increase the flame spread [176] of the
interacting droplets. The droplet burning rate on the other hand, is found to decrease by
increasing the droplet spacing [134,177,178], however, it is claimed by Struk et al., [107]
that this effect is relatively less significant. Accordingly, and in order to quantify more
knowledge on its effect on the combustion of interacting fuel droplets, a relatively wide
range of the droplet spacing distance has been tested and presented in literature. Table 2-3
shows the mostly used values of the normalized droplet spacing distance with the
corresponding number of burning droplets as published in the literature.
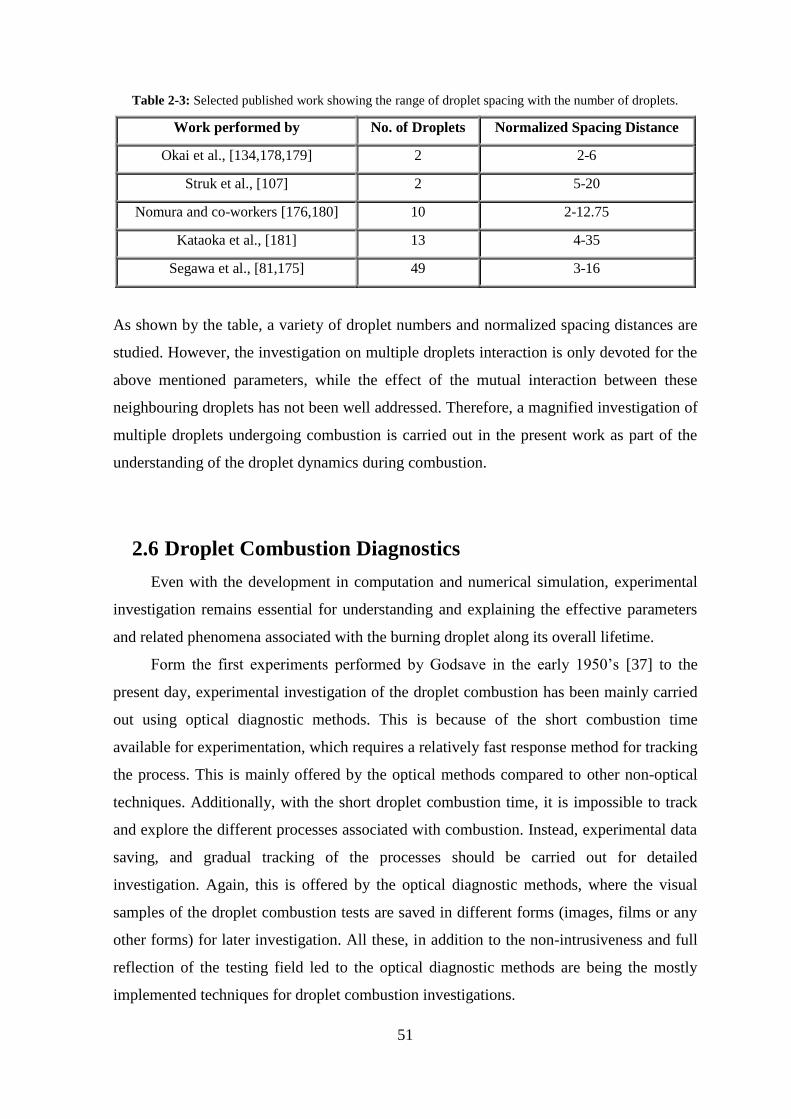
51
Table 2-3: Selected published work showing the range of droplet spacing with the number of droplets.
Work performed by No. of Droplets Normalized Spacing Distance
Okai et al., [134,178,179] 2 2-6
Struk et al., [107] 2 5-20
Nomura and co-workers [176,180] 10 2-12.75
Kataoka et al., [181] 13 4-35
Segawa et al., [81,175] 49 3-16
As shown by the table, a variety of droplet numbers and normalized spacing distances are
studied. However, the investigation on multiple droplets interaction is only devoted for the
above mentioned parameters, while the effect of the mutual interaction between these
neighbouring droplets has not been well addressed. Therefore, a magnified investigation of
multiple droplets undergoing combustion is carried out in the present work as part of the
understanding of the droplet dynamics during combustion.
2.6 Droplet Combustion Diagnostics
Even with the development in computation and numerical simulation, experimental
investigation remains essential for understanding and explaining the effective parameters
and related phenomena associated with the burning droplet along its overall lifetime.
Form the first experiments performed by Godsave in the early 1950’s [37] to the
present day, experimental investigation of the droplet combustion has been mainly carried
out using optical diagnostic methods. This is because of the short combustion time
available for experimentation, which requires a relatively fast response method for tracking
the process. This is mainly offered by the optical methods compared to other non-optical
techniques. Additionally, with the short droplet combustion time, it is impossible to track
and explore the different processes associated with combustion. Instead, experimental data
saving, and gradual tracking of the processes should be carried out for detailed
investigation. Again, this is offered by the optical diagnostic methods, where the visual
samples of the droplet combustion tests are saved in different forms (images, films or any
other forms) for later investigation. All these, in addition to the non-intrusiveness and full
reflection of the testing field led to the optical diagnostic methods are being the mostly
implemented techniques for droplet combustion investigations.

52
However, some fine thermocouples are used in a number of experimental
investigations for droplet temperature [143,149] and the surrounding gas temperature
[99,182,183] measurements. Nonetheless, compared to the optical measuring techniques,
these thermocouples suffer from the same drawbacks of the non-optical methods formerly
mentioned [184]. This is especially when high sampling rates are required. Hence, the
emphasis in the present work is on the fast, non-intrusive, optical diagnostic techniques.
Further descriptions of the types and characteristics of these techniques are shown below.
2.6.1 Shadowgraphy
Shadowgraphy gives the main features of a subject without large modifications in
illumination. This is because of the use of point-light source [185], and the projection of
parallel light on the object under study and collecting the resulting shadow on a viewing
screen [186]. The light spreading from the point source is collected by a lens that transfers
it into a parallel light rays passing through the test object towards the second lens, and then
to the viewing screen (or camera) as shown in Figure 2-15(a).
Figure 2-15: (a) Parallel light shadowgraph setup, (b) sample shadowgram of a spherical particle moving in
stagnant air (reproduced from [185]).
This type of setup is termed as the parallel setup. If the two lenses are replaced by two
concave mirrors, the resulting setup will take the z-like shape and termed as the z-setup, as
shown in Figure 2-16(c). The light rays passing through the test object refract and deviate
away from the original path. This deviation is displayed on the viewing screen as shown in
Figure 2-16(c).
The shadowgraph imaging is invented by Robert Hooke in the seventeenth century
[186], but its first scientific implementation for flow visualization is carried out by Vincenz
Dvorak in the late nineteenth century [185,186]. He focused sunlight onto a 1 mm aperture
and projected the diverging light onto a white wall in his darkened lab. Hence, the

53
refracted light rays appeared in the form of shadows on the white wall [186]. Dvorak then
used this imaging method for describing different phenomena such as the convection from
a warm hand and mixing in air and water.
Since then, shadowgraph imaging has been used extensively for studying different
aspects of flow including fluid dynamics [187–190], heat transfer [191–193], and
combustion [194–196]. Droplet combustion likewise, has been the scope of several
experimental studies in which shadowgraphy is the principal visualizing technique.
Kobayasi [197] used shadowgraph imaging for tracking and imaging both evaporation and
combustion of 0.7-1.7 mm diameter droplets suspended inside a high temperature furnace.
With the aid of the images obtained using this method, he was able to evaluate the burning
rate of different single-component and multi-component fuels. Faeth et al., [198] used
shadowgraphy at 100 fps imaging rate for studying the combustion of isolated decane
droplets suspended inside a high pressure chamber. Tanabe et al., [199] utilized
shadowgraphy at 250 fps with a laser light source for visualizing soot formation during the
combustion of n-decane fuel droplet in a standing sound wave. A sample of the obtained
images is shown in Figure 2-5. Some other experimental investigations of droplet
evaporation [200] and combustion [143,201] have been carried out using shadowgraph
imaging for tracking droplet size evolution.
2.6.2 Schlieren
Schlieren imaging is usually used for visualizing the flows with variable density
gradients [202]. It is one of the most frequently used methods for visualization in
aerodynamics and thermodynamics, because it combines both simplicity and high
resolution [185]. Similar to shadowgraphy, the Schlieren imaging is based on utilizing a
point-light source, and passing a parallel light rays through the test field. Besides, in the
Schlieren method, a knife edge is ordinarily placed between the second lens (or mirror) and
the viewing screen as shown in Figure 2-16. This knife edge is located at the focal length
of the second lens (or mirror) and used for cutting off part of the illumination light and
decreasing its intensity. This technique is developed by August Toepler in the second half
of the nineteenth century for visualizing the flow within the compressible fluids. Although
the first implementation of the knife edge in optical studies belongs to Leon Foucault in the
same period [185,186,202].

54
Figure 2-16: Schematic layout of three different Schlieren arrangements: (a) Single-lens, (b) Dual-lens, (c)
Z-type two-mirror Schlieren (reproduced from [186]).
There are different types of Schlieren imaging according to the type, quantity, and
arrangement of the optical components. These types include the single-field-lens Schlieren
shown in Figure 2-16(a). In this arrangement a large diameter high quality lens is required
for providing the adequate sharpness. Due to the use of a single lens, the illumination light
is transferred passing the test object in the converging form rather than the parallel rays,
which is disadvantageous in some applications [186]. This type is then modified to the
dual-field-lens Schlieren shown in Figure 2-16(b). This type is the mostly used setup for
Schlieren experiments due to its simplicity. It overcomes the light problem associated with
the first type by providing parallel light rays through the test object. Additionally, a
condensing lens is usually placed after the light source for increasing light effectiveness
[186]. When the two lenses in the dual-field-lens Schlieren are replaced by two mirrors, the
system will take the form shown in Figure 2-16(c), that is the z-type two-mirror Schlieren.
Any type of mirrors can be used in this setup; however the concave mirrors are mostly

55
utilized. Despite its popularity in flow visualization experimental research, careful setup
considerations are required for this type. Such as the minimum distance between the two
mirrors that should be twice the focal length (f) for providing the proper size for the test
object, and the optimum off-axis angle, for eliminating any optical aberration [186]. In
addition to these types, more Schlieren arrangements are available in literature, such as the
single-mirror coincident Schlieren, single-mirror off-axis Schlieren, and multiple pass
mirror system [186].
Schlieren imaging is one of the first methods used and continued to be used for
droplet combustion investigation. Kumagai and Isoda [65] carried out the first published
experimental work on spherical droplet combustion under microgravity conditions created
by the use of a falling chamber. They implemented the dual-field-lens Schlieren for
tracking the combustion of n-heptane and ethanol fuel droplets. A spark light is used for
illumination during the experiments. When the falling chamber reaches its optical axis, the
spark light is activated by a photo-relay action. They have reported that the Schlieren
method used was insufficient for tracking flame boundaries during droplet combustion;
direct imaging is used in accordance for that purpose. This is in controversy with what is
reported by Krier and Wronkiewicz [203] who used the same dual-field-lens Schlieren
setup for studying the combustion of n-heptane and n-pentane fuel droplets. They reported
the reason for using Schlieren imaging is the insufficient flame luminosity that makes it
irrelevant for direct self-illuminated imaging, and invisible compared to the relatively high
intensity illumination for backlighting imaging. Ogami et al., [204] used the z-type two
mirror Schlieren for investigating 1-butanol droplet combustion under oscilatory flow, high
pressure, microgravity conditions. A set of sample Schlieren images of their work is
presented in Figure 2-17.
Figure 2-17: Sample Schlieren images of droplet combustion [204] (with permission from the publisher).
Illumination is executed by a xenon lamp, and camera framing rate is varied through the
range of 250-1000 fps. This optical setup is the same as that used by Reichenbach et al.,
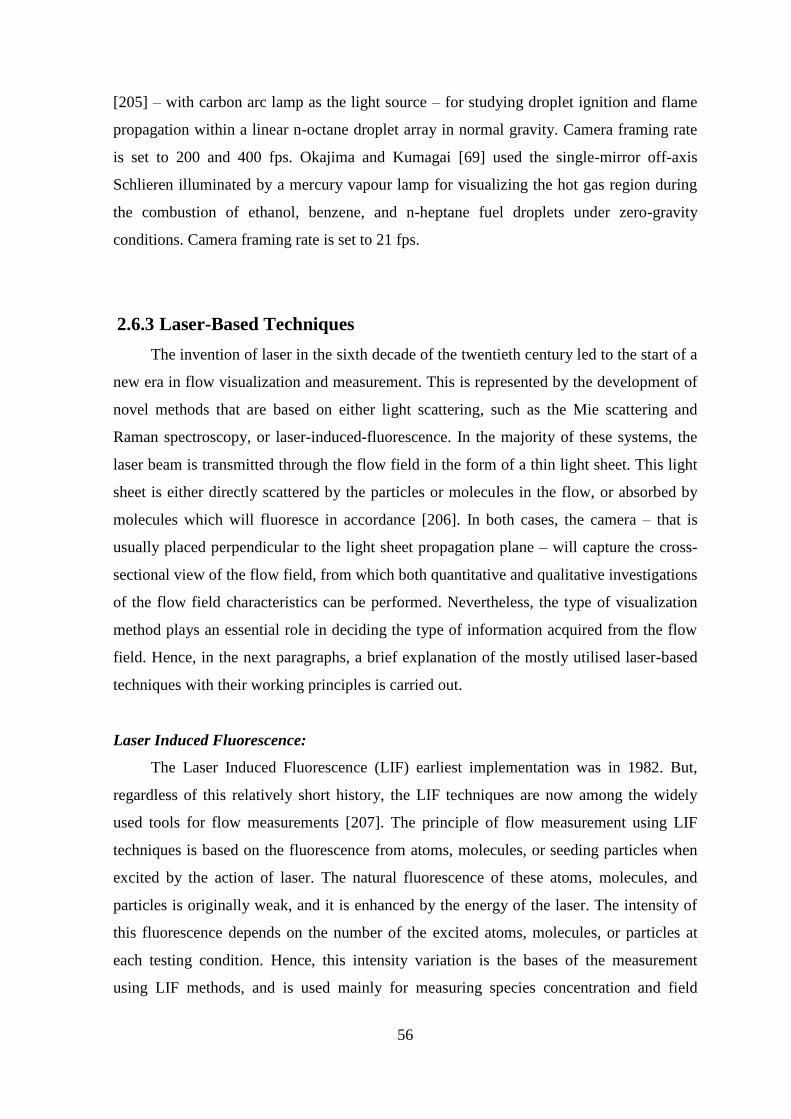
56
[205] – with carbon arc lamp as the light source – for studying droplet ignition and flame
propagation within a linear n-octane droplet array in normal gravity. Camera framing rate
is set to 200 and 400 fps. Okajima and Kumagai [69] used the single-mirror off-axis
Schlieren illuminated by a mercury vapour lamp for visualizing the hot gas region during
the combustion of ethanol, benzene, and n-heptane fuel droplets under zero-gravity
conditions. Camera framing rate is set to 21 fps.
2.6.3 Laser-Based Techniques
The invention of laser in the sixth decade of the twentieth century led to the start of a
new era in flow visualization and measurement. This is represented by the development of
novel methods that are based on either light scattering, such as the Mie scattering and
Raman spectroscopy, or laser-induced-fluorescence. In the majority of these systems, the
laser beam is transmitted through the flow field in the form of a thin light sheet. This light
sheet is either directly scattered by the particles or molecules in the flow, or absorbed by
molecules which will fluoresce in accordance [206]. In both cases, the camera – that is
usually placed perpendicular to the light sheet propagation plane – will capture the cross-
sectional view of the flow field, from which both quantitative and qualitative investigations
of the flow field characteristics can be performed. Nevertheless, the type of visualization
method plays an essential role in deciding the type of information acquired from the flow
field. Hence, in the next paragraphs, a brief explanation of the mostly utilised laser-based
techniques with their working principles is carried out.
Laser Induced Fluorescence:
The Laser Induced Fluorescence (LIF) earliest implementation was in 1982. But,
regardless of this relatively short history, the LIF techniques are now among the widely
used tools for flow measurements [207]. The principle of flow measurement using LIF
techniques is based on the fluorescence from atoms, molecules, or seeding particles when
excited by the action of laser. The natural fluorescence of these atoms, molecules, and
particles is originally weak, and it is enhanced by the energy of the laser. The intensity of
this fluorescence depends on the number of the excited atoms, molecules, or particles at
each testing condition. Hence, this intensity variation is the bases of the measurement
using LIF methods, and is used mainly for measuring species concentration and field

57
temperature of the flow. However, with some specific arrangements of the system, it can
be used for estimating the velocity and pressure distributions [207].
The LIF methods have been used for studying droplet combustion. Castanet,
Lebouché, and Lemoine [208] used the two-colour LIF method for evaluating the temporal
variation of droplet temperature with time during the combustion of monodisperse ethanol
droplet stream. Pfeil et al., [209] used the Planar Laser Induced Fluorescence (PLIF)
method for studying the effect of blending ethanol with ammonia borane on the droplet
combustion of the resulting fuel mixture. The term PLIF is usually used for describing the
LIF technique that is based on atoms and molecules excitation rather than seeding particles
excitation [206]. Pfeil et al., used a 283.2 nm wavelength laser for exciting the OH
radicals, so the method they used is termed as the OH-PLIF method. Beck, Koch, and
Bauer [210] on the other hand, have used the CH-PLIF method, in which a 390.3 nm
wavelength laser is used for exciting the CH radicals during the combustion of n-heptane
fuel spray. Whereas, Burkert et al., [211] used a 353.373 nm wavelength laser for exciting
the formaldehyde radicals in the Formaldehyde-LIF during the combustion of single gas-
to-liquid diesel droplet. Additionally, the LIF method has been utilized for evaluating the
temperature variation during droplet evaporation rather than combustion [212–214].
Laser Doppler and Phase Doppler Techniques:
The first invention of the laser Doppler systems was in the sixth decade of the
twentieth century directly after laser invention, whereas, its first implementation for flow
measurements was twenty years later. The phase Doppler systems, on the other hand, are
first developed and used in the mid-nineties of the same century. Once they have been
used, both techniques received increased attention, high reputation, and in accordance,
continuous development among other measurement techniques. This is due to the relatively
high accuracy, spatial and temporal resolution, and sensitivity to directional change [215].
The laser Doppler measurement principle is based on the Mie scattering effect. Hence, the
flow is seeded by particles having flow ability, so that their movement is a reflection of the
flow motion [216]. The light scattered from these particles – also known as the tracer
particles – is used for measuring the velocity of the flow. This technique is therefore
referred to as the Laser Doppler Velocimetry (LDV), or the Laser Doppler Anemometry
(LDA). A monochromatic laser is usually used as a light source in the LDV systems. The
laser beam first splits into two beams using a beam splitter as shown in Figure 2-18. The
interference of these two beams crossing in the test volume creates a fringe pattern on the
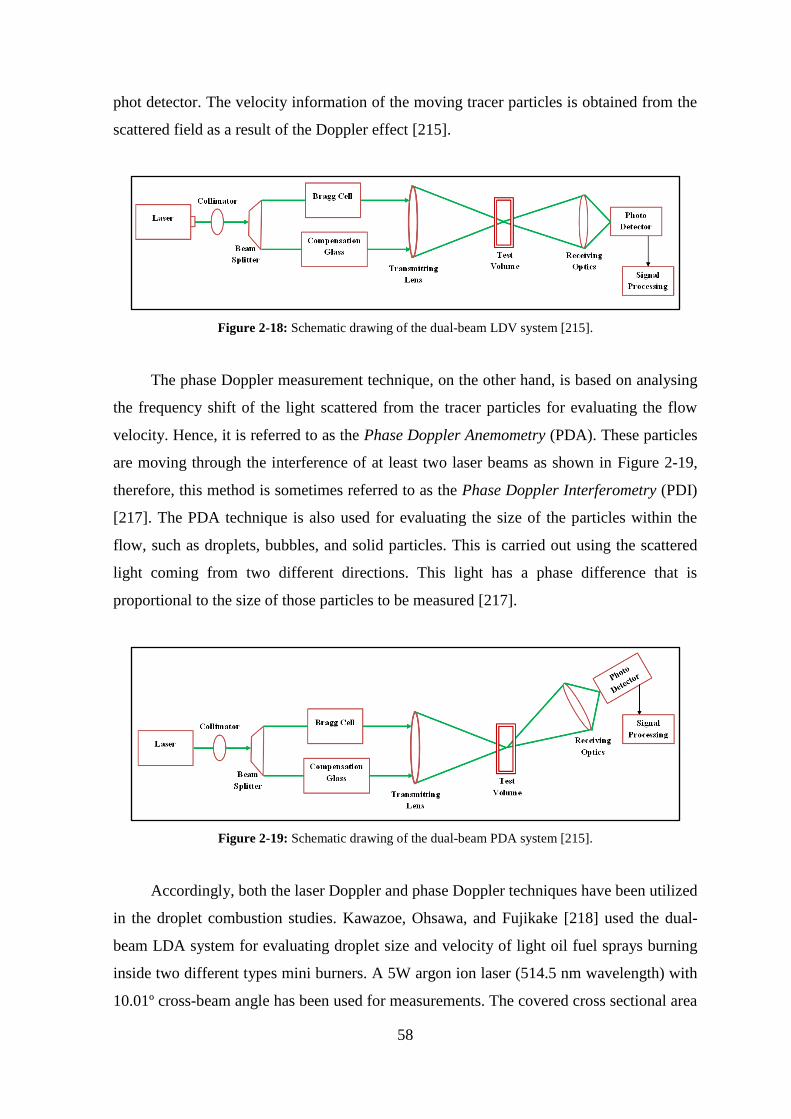
58
phot detector. The velocity information of the moving tracer particles is obtained from the
scattered field as a result of the Doppler effect [215].
Figure 2-18: Schematic drawing of the dual-beam LDV system [215].
The phase Doppler measurement technique, on the other hand, is based on analysing
the frequency shift of the light scattered from the tracer particles for evaluating the flow
velocity. Hence, it is referred to as the Phase Doppler Anemometry (PDA). These particles
are moving through the interference of at least two laser beams as shown in Figure 2-19,
therefore, this method is sometimes referred to as the Phase Doppler Interferometry (PDI)
[217]. The PDA technique is also used for evaluating the size of the particles within the
flow, such as droplets, bubbles, and solid particles. This is carried out using the scattered
light coming from two different directions. This light has a phase difference that is
proportional to the size of those particles to be measured [217].
Figure 2-19: Schematic drawing of the dual-beam PDA system [215].
Accordingly, both the laser Doppler and phase Doppler techniques have been utilized
in the droplet combustion studies. Kawazoe, Ohsawa, and Fujikake [218] used the dual-
beam LDA system for evaluating droplet size and velocity of light oil fuel sprays burning
inside two different types mini burners. A 5W argon ion laser (514.5 nm wavelength) with
10.01º cross-beam angle has been used for measurements. The covered cross sectional area

59
of the test volume is (1150 µm x 100 µm). Birouk and co-workers [219,220] utilized the
LDA method for characterizing the turbulence intensity around isolated fuel droplets
undergoing combustion. Standard pressure conditions are used in the first work, whereas
high pressure conditions are applied in the second. They found that the turbulence around
the burning droplet has a negligible effect on droplet burning rate under atmospheric
pressure, however, this effect is found to increase under elevated pressure conditions.
Sankar et al., [221] used the PDI system for measuring droplet size and velocity. They
have implemented the PDI system as a part of an integrated diagnostic system including
rainbow thermometer and point-diffraction interferometer for studying the combustion of
an isolated n-heptane droplet in free fall. Castanet, Lebouché, and Lemoine [208] used the
PDA method for evaluating the temporal variation of droplet size with respect to time
during the combustion of monodisperse ethanol droplet stream.
Particle Velocimetry Techniques:
As the name manifests, the particle velocimetry methods are used for evaluating the
velocity of the flow field. The working principle of these methods is based on seeding the
flow to be visualized with tracer particles as show in Figure 2-20.
Figure 2-20: PIV setup for flow visualization in a wind tunnel [222].
These particles are illuminated by a laser sheet rather than laser beam for increasing the
cross-sectional area of the flow field. The movement of these particles is tracked and
recorded using an orthogonally (relative to the laser sheet) placed camera [222]. At least
two successful images of the tracer particles at different instants of time are required for
evaluating the velocity vectors of those particles [223].

60
The term particle velocimetry comprises different measurement techniques that share
the same described working principle. However, the two main particle velocimetry
techniques are the particle image velocimetry (PIV) and particle tracking velocimetry
(PTV). The key difference between these two methods is the image-density number of the
tracer particles. That is the number of particles in a test area representing the intersection of
the laser sheet and a circle of diameter equivalent to that of a test area in the image
projected into the fluid [224]. The image density number (NI) is evaluated according to
equation (2-13) as:
𝑁𝐼 =𝜋
4𝐶∆𝑍0 (
𝑑𝐼
𝑀)
2
……… (2-13)
where C is the average concentration of the tracer particles per unit volume, ∆Z0 is the
laser sheet thickness, dI is the diameter of the test area, and M is the image magnification
co-efficient. Hence, the particle velocimetry technique is characterized according to the
image density number as follows [224]:
NI << 1 → Low density particles → PTV Method
NI >> 1 → High density particles → PIV Method
The particle velocimetry techniques have been used for studying droplet combustion.
Birouk and Toth [220] used the PIV technique for evaluating the turbulent integral length
scale during the combustion of n-heptane and n-decane fuel droplets in a high pressure
environment. Roth et al., [225] utilized the PIV method for evaluating droplet velocity
during the combustion of upward flowing monodisperse droplet stream. Whereas, Nomura
et al., [226] relied on the PTV method for evaluating droplet velocity during the
combustion of partially pre-vaporized droplet stream. In addition, the PIV has also been
used in the droplet evaporation studies [227–229].
2.6.4 Optical Interferometry
The wavelength of the visible light is relatively small; hence, any small alterations in
the optical path will lead to measurable variations in the intensity of an interference
pattern. Accordingly, highly accurate measurements are performed using the optical
interferometry [230]. The first implementation of optical interferometry in the flow

61
measurement investigation was carried out by Ernst Mach in the late nineteenth century
[185]. Interferometry is characterized by the formation of sufficiently visible interference
fringes on the test section. This is due to the matching between the path lengths of the
interfering light beams, so that the resulting difference in the path length is less than the
coherence length [202]. The working principle of interferometry is based on the response
to the change in the speed of light when passing different media. The interferometers
respond directly to the refractive index of the media. The light passing through different
fluids of various refractive indices will experience speed change and, in turn, phase shift.
This phase shift is detected by the interferometers [202].
Different types of interferometers have been utilized in flow measurements, such as
the Rayleigh interferometer, the Mach-Zeldovich interferometer, the Sagnac
interferometer, and the Michelson interferometer [230]. The latter has been used by
Moriue et al., [47] for studying the single droplet combustion of n-decane when diluted by
1-Methylnaphthalene and 1,2,4-trimethylbenzene. Using this method, they were able to
detect the occurrence of cold-flame during ignition besides the hot-flame. The same
interferometer is used by Tanabe et al., [82] for detecting the occurrence of cool-flame
during the ignition of an isolated n-decane droplet. The schematic drawing of the working
principle of the Michelson interferometer is shown in Figure 2-21.
Figure 2-21: Michelson interferometer [230].
In this interferometer, a beam splitter is used for splitting the light emitted from the
light source, and then combining the light reflected back from the mirrors as shown in
Figure 2-21. Additionally, Sankar et al., [221] have used the point-diffraction
interferometry (PDI) for evaluating the gas-phase temperature distribution during the

62
combustion of freely falling n-heptane droplets. As mentioned in section ( 2.6.3), Sankar et
al., have used an integrated, laser-based, diagnostic system for complete investigation of
the combustion of freely falling fuel droplets. The point-diffraction interferometer is a part
of this system.
2.6.5 Self-Illuminated Direct Imaging
Direct imaging is one of the widely used imaging methods in droplet combustion. In
this method the light emitted from the sooty flame surrounding the droplet is used for
illumination. Hence, no external light source is required for droplet and flame illumination.
Therefore, self-illuminated direct imaging is usually implemented for flame tracking
purposes such as the work conducted by Mikami and co-workers for studying flame spread
[231–233], and that performed by Marchese et. al., [74,234] for studying the emission of
different radicals, and the flame intensity variation analysis used by Ambekar et. al. [26]
for studying the droplet combustion of isopropyl nitrate blends as shown in Figure 2-22.
As the figure shows, flame intensity is varying with the fuel mixture composition;
therefore, it has been used for comparison between the different fuel mixtures.
Figure 2-22: The burning droplet and the surrounding luminous flame tracking using self-illuminated direct
imaging [26] (with permission from the publisher).
Furthermore, this imaging method is also used when the work is carried out in a
limited space, so that no enough room for lighting source is available in the testing section.
Therefore, the self-illumination provides the proper lighting required for imaging and

63
process tracking. Examples of that are the droplet combustion experiments inside a heated
furnace conducted by Hoxie, Schoo, and Braden [99], and the micro-tube droplet
combustion experiments carried out by Yao et. al., [235].
2.6.6 Backlighting Imaging
Backlighting (or backlit) imaging has been used extensively for tracking droplet size
evolution during combustion. It is pursued by placing the droplet between the lighting
source and imaging system as shown in Figure 2-23.
Figure 2-23: Schematic of the backlighting imaging arrangement.
This makes the droplet boundaries look sharp and ensures that they are easily
distinguished, increasing the opportunities of tracking droplet lifetime and its size
evolution rate more accurately. As a result, backlighting imaging has been implemented in
the vast majority of droplet combustion experimental studies.
In view of that, it is aimed to find the backlighting imaging setup that provides the
mostly proper magnification for the intended work. Therefore, samples of experimental
studies with their representative images, in addition to the spatial resolution and the
maximum obtained magnifications are shown in Table 2-4. The spatial resolution of the
image is the ratio of the physical length to image pixels. The studies listed in Table 2-4 are
selected because they include sufficient descriptions of the optical imaging setup
characteristics. As the table demonstrates, the maximum obtained zoom is 10x of the
original size despite the small spatial resolution values. These magnification rates are
sufficient for precisely tracking the droplet surface boundaries, but not much helpful for
droplet interior tracking.

64
Table 2-4: Samples of the spatial resolution and magnification ranges for droplet combustion shown in
literature.
No. Authors
Image
Resolution
Spatial
Resolution Magnification Sample
Image (pixel*pixel) µm/pixel (X)
1 Nomura et. al. [180] 1280*1024 6-10 10
2 Liu et. al., [236] 580*580 32 ---
3 Wu and Yang [237] 800*600 22 4
4 Han et. al., [132] 1024*1024 5.3 10
Note: All the images in this table are used with permissions from the corresponding publishers.
The only adequate magnification for droplet liquid-phase visualization was
performed by Miglani, Basu, and Kumar [153] with 3.9 µm/pixel spatial resolution. They
have used a microscopic lens attached to the high speed camera for studying the droplet
combustion of a water/ethanol droplet blended with nanostructured ceria particles. A
sample of the images obtained by them is shown in Figure 2-24.
Figure 2-24: Sample of the images obtained by [153] (with permission from the publisher).
Ultimately, a variety of optical diagnostic techniques have been used for droplet
combustion investigations. Each of which has its own features that makes it suitable for a
specific function. Hence, for the formerly set objectives of magnified investigation of the
65
droplet liquid-phase dynamics, the most proper technique is found to be the backlighting
imaging. However, some optical arrangements have to be performed for obtaining the
maximum possible zoom for proper visualization of the droplet interior. Additionally,
since secondary atomization involves sub-droplets emission away from the parent droplet,
shadowgraph imaging is utilized for tracking secondary atomization from the droplet
surface, also with proper magnification. Thus both backlighting and shadowgraphy are
implemented for droplet combustion investigation in the present work.
2.7 Summary
In the previous discussions, a detailed description of the droplet combustion problem
has been carried out. From which, a route map for the development of the current work’s
objectives has been outlined. These objectives are drawn from the motivations set in
Chapter One. The importance of single droplet combustion in the study of the overall spray
combustion is revealed. Then, a general review of the droplet combustion research
development is facilitated. This review is converged to the combustion of multicomponent
and interacting fuel droplets. These two categories are believed to be more realistic and
close to the real spray combustion than the isolated single-component droplet combustion.
Hence, investing in experimental research on those categories is substantial. Accordingly,
the rest of the present work is dedicated to experimental investigation of the combustion of
isolated and interacting multicomponent fuel droplets. An emphasis is placed on the
droplet liquid-phase processes that occur during combustion. These include nucleation,
bubble generation and dynamics, puffing and micro-explosion, secondary atomization and
sub-droplet combustion.
Studying the liquid phase processes of the burning droplet requires a highly
magnified visualization technique with very short response time for proper tracking of the
different processes occurring at very short time spans. Consequently, a review is performed
on the main diagnostic techniques utilized for droplet combustion investigation. With the
aid of this review, high speed backlighting imaging found to be the most appropriate
technique for tracking the liquid-phase processes of the burning droplet. With proper
optical setup, and in conjunction with the high speed imaging, sharp, magnified,
illuminated images of the droplet boundaries and interior will be acquired. Shadowgraph
imaging, on the other hand, is found to be suitable for tracking the sub-droplets emitted by

66
secondary atomization, because it offers the option of magnified shadow images of the
object with larger view field compared to the backlighting imaging technique. Therefore,
both techniques are utilized in the present work with the aid of high speed camera for
studying the combustion of multicomponent fuel droplet.
In the following chapters, detailed explanations of the experimental work carried out
and the main findings with their interpretations and significance to droplet combustion and
in turn, to the practical combustion systems will be presented. These are preceded by the
experimental considerations and image processing methods which are explained in Chapter
Three.
67
Chapter 3. Experimental Considerations, Image
Processing, and Validations
3.1 Introduction
The present work is an investigation of the internal and external droplet dynamics
during the combustion of multicomponent fuels. This investigation has been carried out
experimentally with high speed imaging being the main technique for tracking droplet
physics throughout its overall lifetime. Yet, there are some measures and processes applied
before, during, and after the experimental work which should be outlined. Hence, this
chapter is devoted for depicting these processes. The first of these processes is the
multicomponent fuel preparation that is described in section ( 3.2). While the methods used
for droplet generation, suspension, and ignition as well as the optical setups are clarified in
section ( 3.3). Procedures and algorithms used for image processing owing to feature
extraction are demonstrated in section ( 3.4), whereas section ( 3.5) shows the calibration for
the true size calculations. Finally, a summary of the chapter is shown in section ( 3.6).
3.2 The Fuels under Investigation
Diesel fuel is of great importance in energy production by combustion. However, the
major problem with diesel is the pollutant emissions during its oxidation, particularly CO
and NOx emissions. This, in addition to the other problems associated with the fossil fuels
such as depletion, price fluctuation, and increased energy demands, all together are playing
a crucial rule in the future of diesel fuel utilization in energy production. Hence, a variety
of solutions are explored and being explored for tackling – or mitigating the effect of –
these problems. Blending the diesel with oxygenated fuels is one of the solutions used for
decreasing CO emissions. Alcohols are the most famous oxygenated fuels that have been
added to diesel in the internal combustion engines [238–243]. Alcohols are produced by
vegetable and fruit fermentation which makes them renewable resources. However, the
high latent heat of vaporization and low cetane number makes alcohols not sufficient for
replacing the diesel completely [244]. This in addition to the harmful environmental and
biological effects of alcohol presented in the formation of the photochemical smog and

68
high volatility of the alcohols [242]. Hence, blending diesel with alcohols offers the
optimal solution rather than complete replacement.
Biodiesels on the other hand are presently the most widely attractive fuels for this
objective due to various advantages; such as higher biodegradation, reduced toxicity, safe
storage, and enhanced lubricity compared to the ordinary diesel fuels [245]. In fact, they
are being increasingly utilized in gas turbine engines [246–248] in addition to the
compression ignition engines [249–251]. Biodiesels are derived from animal fats or
vegetable oils and are usually blended with diesel in different proportions and used without
substantial engine modifications. This is due to the complete miscibility of biodiesel on
diesel fuels [245]. However, compared to conventional diesel fuels, biodiesel has a higher
viscosity that results in poor atomization characteristics [156,245], and higher NOx
emission due to the increase in combustion efficiency and adiabatic flame temperature by
the presence of oxygen in biodiesel [249,252]. Therefore, biodiesel addition to diesel in the
form of blends is practically advocated than complete replacement.
Additionally, emulsifying the diesel by water has been used in an objective to
decrease the NOx formation [253–257]. Water addition decreases the overall combustion
temperature, which in turn reduces N2 oxidation and NOx formation.
Accordingly, ethanol, biodiesel, and water have been selected to be added to diesel
fuel for producing the multicomponent fuels in the present work. In addition to the above
reasons of using these three additives, the difference in diesel miscibility of these liquids is
considered. Biodiesel is completely miscible in diesel as stated above. Ethanol is partially
miscible in diesel [240], that’s why it is used in the form of blend and emulsion [244]. And
water is immiscible in diesel. Hence, the effect of additive miscibility on diesel will also be
considered in the present work. Therefore, the fuels utilized in the present work are:
Single Component (Neat) Fuels:
These are the base fuels of the multicomponent fuels. Three single fuels have been
used in the present work. These fuels are:
Diesel: it is the base fuel in the present work. The type of diesel used in the
experimental work is the regular Shell Diesel Fuel.
Biodiesel: it is a B-100 Petrobras biodiesel. It is produced from both tallow and soy
with a composition of 40% and 60% by volume respectively.
Bioethanol: it is a Biofuel-500 Gardeco plant-based ethanol produced by industrial
distillation.
Multicomponent Fuels:

69
Emulsions: two types of emulsions have been prepared in-lab and used for
studying droplet combustion. These emulsions are Water-in-Diesel and Diesel-in-
Water emulsions. Further discussions on the emulsification process and
concentration proportions are outlined in section ( 3.2.1).
Blends: two types of blends have been prepared and implemented for
experimentation. These are the Biodiesel/Diesel, and Bioethanol/Diesel blends. The
blending process and proportions of constituents are further clarified in section
( 3.2.2).
3.2.1 Diesel Fuel Emulsification
The emulsification is the process of blending two (or more) immiscible liquids, with
the aid of an emulsifier (or surfactant agent) [258]. For water-in-diesel emulsions, the
water is added to the diesel so that the former is the dispersed phase and the latter is the
continuous phase [151]. This is exactly the opposite in the case of diesel-in-water
emulsions, where diesel is the dispersed phase and water is the continuous phase [258].
An illustration of the structure of the two emulsion types is shown in Figure 3-1.
Figure 3-1: The difference between the water-in-oil and oil-in-water emulsions [259] (with permission from
the publisher).
These two types of emulsions have been prepared and tested in the present work.
The reason behind using them is to investigate the effect of emulsion type – in addition to
the concentrations – on the behaviour of the droplet during combustion. Since, the ratio of
the densities of both the dispersed phase and the continuous phase is found to influence
the rate of nucleation within the emulsions [260]. This in turn, will have an effect on the
droplet combustion behaviour. For that reason, further investigation on this point is

70
supposed to be worthy. The preparations of these emulsions in addition to the criterion
followed for emulsifier selection are all discussed below.
3.2.1.A Emulsifier Selection
Since emulsions are mixtures of two (or more) insoluble liquids, they are
thermodynamically unstable. This instability comes from higher free energy of the mixture
by surface energy compared to other mixtures. Therefore, droplet coalescence inside the
emulsion will occur so as to minimize the surface area while maximizing the volume. This
in turn leads to phase separation within the emulsion. Consequently, producing a long-
lasting emulsion requires a third agent that accumulates at the interface between the two
liquids forming the emulsion; this agent is the emulsifier (or surfactant). The rule of the
emulsifier is to form protective, elastic, and relatively strong film layer that can withstand
droplet collision and prevent phase separation. However, the type of emulsifier is an
essential parameter in defining the type of emulsion. Hydrophilic emulsifiers prompt the
formation of oil-in-water emulsions, while water-in-oil emulsions are mostly produced by
the use of lipophilic emulsifiers [261]. This is known as Bancroft’s Rule which states that
“the phase in which the surfactant is more soluble is the continuous phase” [262]. This
solubility inclination is characterized by the Hydrophile-Lipophile Balance (HLB) number.
The HLB number is developed by Griffin as the balance of the size and strength of both
the hydrophilic and lipophilic groups within the emulsifier molecules [263]. Hence, each
emulsifying agent has its own HLB number which is in the range of 0 to 20, and this
number defines whether the emulsifier is oil-soluble or water-soluble as shown in
Table 3-1.
Table 3-1: HLB ranges and applications [261].
0 ≤ HLB ≤ 9 oil-soluble emulsifiers for producing water-in-oil emulsions
11 ≤ HLB ≤ 20 water-soluble emulsifiers for producing oil-in-water emulsions
HLB = 10 hydrophilically-lipophilically balanced emulsifier
Consequently, in the present work two emulsifiers have been selected for emulsion
preparation. The first is the Polysorbate 80 (HLB = 15) for making the diesel-in-water

71
emulsions, and the other is the Sorbitan Mono Oleate (also known as Span 80) (HLB =
4.3) for making the water-in-diesel emulsions.
3.2.1.B Emulsion Preparation
In principle, emulsification is the process of mixing two (or more) liquids that are
originally immiscible. Thus, the main task in the emulsification process is to finely
disperse one of the liquids into the other. Therefore, the majority of practical
emulsification techniques depend on the dispersion method and the application of
mechanical energy to the system. When the disperse phase is exposed to a high velocity
gradient, the droplets within will break up into smaller sub-droplets.
The water-in-diesel and diesel-in-water emulsions have been prepared in the lab prior
to the combustion experiments. The method followed and described by Califano, Calabria,
and Massoli [143] and Jackson and Avedisian [147] has been used for preparation. For
each of the emulsions, the emulsifier is added to the continuous phase (diesel in the case of
water-in-diesel emulsions, and water in the case of diesel-in-water emulsions) with a
quantity less than 1% of the mixture volume. The emulsifier and the continuous phase are
then stirred for ensuring solubility. The required quantity of the dispersed phase (water in
the case of water-in-diesel emulsions, and diesel in the case of diesel-in-water emulsions)
is then added gradually to the mixture. A 20000 rpm electric hand blender has been used
for mixing the liquids for more than five minutes until a homogeneous milky white liquid
is produced. The interpretation of emulsion colours is shown in Table 3-2. From the table,
it is implied that the obtained emulsions are the coarse macro-emulsions with 3-100 µm
disperse phase particles.
Table 3-2: Size range and appearance of emulsions [261].
Disperse Phase Particle Size (µm) Emulsion Appearance
0.001-0.003 Molecular Solution Transparent
0.003-0.01 Micellar Solution Transparent
0.01-0.1 Micro-Emulsion Translucent
0.1-3 Fine Macro-Emulsion Blue-White
3-100 Coarse Macro-Emulsion Milky White
Water content in both emulsions has been fixed to 10%, 20%, and 30% of the total
emulsion volume, and the remaining part is diesel. Figure 3-2 shows the samples prepared

72
in the lab prior to experiment. However, diesel-in-water emulsion of 40% water content
has also been prepared, and many trials for igniting the droplet have been carried out, but
without any success.
Finally, it is worthy to mention that for every new test, a new emulsion sample is
prepared and tested. Hence, these samples are kept in small containers, and during the
testing period no visible changes have been observed.
Figure 3-2: Prepared samples of water-in-diesel and diesel-in-water emulsions of 10%, 20%, and 30% water
concentration.
3.2.2 Diesel Fuel Blending
Fuel blending is defined as the process of adding hydrocarbon fuels, additives, and/or
other compounds to the base fuel in the form of mixing at different proportions to produce
a final fuel of specific performance characteristics [264]. In the present work, Biodiesel-in-
Diesel and Bioethanol-in-Diesel Blends have been prepared in-lab. For each blend, three
blending proportions are used, in which diesel accounts for (90%, 80%, and 70%) of the
total mixture volume, and the added fuel accounts for the remaining (10%, 20%, and 30%)
respectively. These proportions are selected in accordance to those corresponding values of
diesel emulsions. This ensures relatively comparable results.
Concisely, fifteen different liquid fuels have been utilized in the experiments of the
present work. Three of them are single-component fuels, and the rest are multicomponent
ones. A complete list of these fuels is shown in Figure 3-3, and their abbreviations and
physical properties are shown in Appendices (A) and (B) respectively.

73
Figure 3-3: A chart of the fuels utilized in the present work.
3.3 Experimental Characterizations
The experimental work carried out during the course of the present work will be
described in detail in the forthcoming chapters. Nevertheless, a brief characterization of the
key instruments and processes implemented in experiments is found to be important. These
include droplet generation and suspension, droplet ignition, and the optical setups for each
test.
3.3.1 Droplet Generation, Suspension, and Ignition
Three major techniques are usually used for single droplet combustion investigations
[265]. These techniques are shown in Figure 3-4.
In the first technique (Figure 3-4(A)), the fuel is introduced through a porous
spherical structure to create a thin layer of fuel that is consumed during combustion. This
technique has been used by [266–272] for studying flame structure throughout droplet
combustion of different fuels.
Fuel Type
Single Component
Diesel
Biodiesel
Ethanol
Multicomponent
Emulsions
Water-in-Diesel
10% Water
20% Water
30% Water
Diesel-in-Water
10% Water
20% Water
30% Water
Blends
Biodiesel/Diesel
10% Biodiesel
20% Biodiesel
30% Biodiesel
Ethanol/Diesel
10% Ethanol
20% Ethanol
30% Ethanol

74
Figure 3-4(C) shows the third technique in which the droplet is set to fall freely
during combustion. This technique is used for studying the combustion of very small
droplets analogous to the real size droplets as it is shown in [116,122,129,269,273–276].
Figure 3-4: Laboratory fuel droplet generation and combustion in an oxidizing atmosphere: (a) porous
sphere method, (b) suspended droplet method, and (c) falling droplet method (reproduced from [265]).
Figure 3-4(B) shows the second technique, that is droplet suspension on a thin
filament. This technique is the most used among all methods, since it offers a relatively
fixed droplet position for easier and more precise lifetime and burning tracking.
Additionally, studying multi-droplet combustion in the form of an array is conceivable
using this method. The filament may take the form of a single fibre [84,86,277,278] or a
mesh of two-cross-shaped fibres [64,232,279,280], and it may be in different sizes ranging
from (12 µm) to (250 µm).
For the present work, droplet suspension method is implemented for fixing the
droplet. Because, studying the droplet liquid-phase dynamics requires the droplet to be
fixed in a certain position so that it will be at the camera view field during its whole
burning time without any fluctuation or outsized movement. This is ensured by droplet
suspension. For the same reason, the droplet is required to be large in size for easier
tracking of the internal processes that occur during combustion. Accordingly, increasing
droplet size makes it difficult (if not possible) to use very thin filament (<50 µm) for
suspending the droplet. This is proven by trials and evidenced by comparison with Liu et
al., [281] who have used 14 µm fibre mesh for droplets with diameters less than 1 mm and
80 µm fibre mesh for droplets with diameters larger than 1 mm. Therefore, higher size
filaments are required, with the need to keep this within the minimum possible limit.

75
Hence, a 100 µm diameter fibre is found to be proper for suspending the droplet in the
present work.
On the other hand, careful selection of the filament material has also been
considered. It is obvious that any material to be suitable for droplet suspension during
combustion should have a melting point higher than the flame temperature (i.e. > 2000K in
average). Silicon carbide (SiC) fibre (whose melting temperature is around twice the flame
temperature) is found to be suitable for droplet suspension, especially with the fact that its
effect on droplet burning rate is reported to be negligibly small for larger droplet diameters
[281,282].
Figure 3-5: Droplet suspension using a single (100 µm) monofilament SiC fibre.
Consequently, the SiC fibre has been implemented for droplet suspension in the
present work. It has been used in the form of a single monofilament of (100 µm) diameter.
This fibre consists of 95 µm silicon carbide enforced by a 5 µm Tungsten core to increase
its strength. Hence, this offered the privilege of suspending the droplet without being bent
as shown in Figure 3-5.
Figure 3-6: Micro-fine syringe with hypodermic needle for droplet generation.

76
Droplet generation on the other hand, is performed using a micro-fine syringe with
hypodermic (0.33 mm) diameter and (12.7 mm) length needle as shown in Figure 3-6. A
relatively constant amount of fuel volume is injected every time for generating and
suspending the droplet on the SiC fibre.
The initial diameters of all the droplets generated and adopted in experiments are
evaluated using image processing and shown in Figure 3-7. As the figure shows, 302
sample droplets have been generated and used in experiments. 84% of these droplets are of
initial diameter in the range of 1-1.4 mm, while the remaining 16% counts for the droplets
that are outside this range (0.8<D0<1 and 1.4<D0<1.6 mm respectively). The average
diameter of all the droplets is evaluated to be 1.207 mm with a standard deviation of 0.269.
Therefore, a relatively high repeatability is obtained using the micro-fine syringe for
droplet generation. Although, this is a relatively large droplet size compared to the real size
in practical applications. But, it is essential for visualizing and tracking the liquid-phase
processes.
Figure 3-7: (a) The initial diameter of all the droplets adopted in experiments, (b) the frequency distribution
of these diameters.
Additionally, it is worthy to point out that the use of droplets with relatively large
sizes is prevalent in the experimental investigations of literature of droplet combustion.
Figure 3-8 presents some representative samples of the large size droplets (above the real
droplet size range) with respect to the publication year of the work. Despite the extensive
0.0
0.2
0.4
0.6
0.8
1.0
1.2
1.4
1.6
1.8
0 100 200 300
Dro
ple
t In
itia
l D
iam
eter
(m
m)
Experiment Index No. (-)
(a)
Diameter
Average0.0
5.0
10.0
15.0
20.0
25.0
30.0
35.0
40.0
<0
.8
0.8
-0.9
0.9
-1
1-1
.1
1.1
-1.2
1.2
-1.3
1.3
-1.4
1.4
-1.5
1.5
-1.6
1.6
-1.7
1.7
-1.8
>1
.8
Fre
qu
ency
Dis
trib
uti
on
(%
)
Droplet Initial Diameter (mm)
(b)

77
number of work carried out on large size droplets, only the largest size samples are
selected for each year, since the figure is made for demonstration purposes only.
Figure 3-8: Representative samples of the large droplet initial size diameter range implemented in the
literature of experimental droplet combustion.
As it is shown by the figure, the large size droplets are used in the past and being
continually used in present for droplet combustion investigations. Since, it is easier to
generate and investigate a larger droplet compared to the real size one. For that reason, the
droplets generated and investigated in the present work are larger than the real droplet size.
However, as it will be shown in the next chapters, all the studied characteristic
parameters are normalized with respect to the initial droplet diameter. This is to ensure a
minimum effect of the droplet size variation on the studied parameters.
Eventually, droplet ignition has been carried out using the hot wire ignition method.
Hot wire ignition is widely used for igniting the droplet in experimental work, for example
those carried out by [99,150,180,283]. In the present work, two hot wire techniques have
been attempted. The first is using the SiC fibre as a hot wire. This is carried out by heating
the fibre on the side far from the droplet suspension location as shown in Figure 3-9. After
the droplet is suspended, a butane flame is placed below the fibre 5 mm away from the
droplet. This point is selected to keep the effect of the butane flame on droplet combustion
to minimum. This includes preventing any form of interference between the butane flame
and the flame surrounding the burning droplet. The heat generated in the zone above the
flame is transferred quickly by conduction to the part suspending the droplet. This is due to
the relatively high thermal conductivity of the SiC fibre. The butane flame is then removed
after the droplet is ignited. The resulting ignition delay time using this method is estimated
0
1
2
3
4
5
6
7
8
9
10
11
1953 1961 1969 1977 1985 1993 2001 2009 2017
Dro
ple
t D
iam
eter
(m
m)
Publication Year

78
to be in the range of 150 ms. This comprises the time period from placing the flame under
the fibre to the first appearance of the visible flame around the droplet.
Figure 3-9: Droplet ignition by side heating of the SiC fibre. The legend in the figure represents the pixel
intensity distribution.
The second hot wire ignition method applied in the present work consists of using an
electrically heated kanthal wire coil as shown in Figure 3-10. The kanthal wire coil is first
heated using a 28.5 W electric power supplied by 3.96 V DC power supply. The wire is
then set below the droplet at a distance of 1.5 mm from the SiC fibre. It is then removed
quickly after the droplet is ignited. The ignition delay time using this method is estimated
to be about 50 ms, which is one-third that of the SiC fibre side heating.
Both methods are found to produce a reliable and repeatable droplet ignition for all the
tested fuel droplets. The droplet initial diameter, for both ignition methods, is evaluated at
the first image preceding the appearance of the visible flame around the droplet.
Figure 3-10: Droplet ignition using an electrically heated kanthal wire coil. The legend in the figure
represents the pixel intensity distribution.

79
3.3.2 Optical Setups
Every measuring technique has its own capabilities and limitations that make it
appropriate for a certain task rather than others. Therefore, a careful selection of the
technique is essential for the outcomes required from the investigation. In the present
work, the physical processes associated with droplet combustion of the multi-component
fuel are investigated using high speed imaging. However, these processes are dissimilar to
each other; some take place inside the droplet such as nucleation and cavitation, while
others occur on the droplet surface like secondary atomization. Some of the processes are
macroscopic such as droplet shape and size change during its lifetime, whereas some are
relatively microscopic and require magnification for proper tracking such as the bubble
growth and movement. Therefore, using a single imaging technique is not appropriate for
studying these phenomena simultaneously. Thus, two imaging techniques have been
employed sequentially in the present work for studying droplet combustion at different
focusing levels. The techniques are the backlighting and shadowgraph imaging techniques
which are presented below with a description of their major optical components whereas
the full experimental setups and their descriptions are presented in the corresponding
chapters.
3.3.2.A Backlighting Imaging
Backlighting imaging has been employed in the present work for obtaining sharp
edges of the droplet boundaries in addition to focused imaging of the droplet internal
dynamics. The major components of the optical setup for backlit imaging are shown in
Figure 3-11. A 55mm Macro Extension Tube Set (a) is mounted between the high speed
camera and the Nikon AF Micro NIKKOR 60mm f/2.8D Lens (b) for achieving the
required magnification. An LED illuminator (d) is used for generating the backlight needed
for imaging. In order to decrease the light intensity, a translucent white light diffuser (c) is
mounted between the light source and droplet. Two types of LED illuminators have been
used in experiments. The first is a 6-Volt, 72-LED domestic illuminator that is used for
droplet size tracking at low framing rates. Whereas the second is an IDT 19-LED, 48-Volt,
200 Watt, high intensity illuminator which has been used for high frame rate imaging that
requires intensive lighting.

80
Figure 3-11: Components of the optical setup used for backlit imaging of the droplet combustion: (a)
Extension tube, (b) Lens, (c) Light diffuser, (d) Light source.
Using this optical setup, 20x and 30x magnification rates are achieved successfully.
Hence, the ability of tracking the various dynamic processes inside the droplet throughout
its overall lifetime is enhanced.
3.3.2.B Shadowgraph Imaging
Shadowgraph imaging has been implemented in the present work for tracking the
puffing, microexplosion, and secondary atomization and sub-droplet emission during the
combustion of the multicomponent fuel droplets. The optical components used for building
the shadowgraph optical setup are shown in Figure 3-12.
Figure 3-12: Components of the optical setup used for Shadowgraph imaging of the droplet combustion: (a)
Light Source, (b) Magnifying Lens, (c) Concave Mirror, (d) Close-up Lens.

81
In this setup, light intensity is increased by mounting a Trixes 40x 25mm loupe eye
magnifier lens (b) in front of the 150W halogen, Dolan-Jenner MI-150 fibre optic high
intensity illuminator (a) that is used as the light source. Light is then reflected by two (75
mm diameter, 7 mm thick, 750 mm focal length) concave spherical mirrors (c) into a Hoya
49 mm Close-up lens (d) before which the droplet is mounted. This optical setup for
shadowgraph imaging resulted in a (10x) magnification rate. Again, this has given the
possibility of tracking puffing and secondary atomization and droplet size variation using
shadowgraph imaging. The 10x, 20x, and 30x magnification rates have been schematically
presented in Figure 3-13 to demonstrate the degree of amplification in the droplet recorded
size compared to the real size.
Figure 3-13: Schematic comparison between (a) the droplet real size, and the resulting magnifications by the
optical setups: (b) 10x, (c) 20x, and (d) 30x magnification.
The 2 mm diameter spherical particle in Figure 3-13(a) is magnified into 20 mm,
40mm, and 60 mm diameter particles in Figure 3-13(b) to (d) to replicate the 10x, 20x, and
30x magnification rates respectively. From this figure, it can be inferred how helpful are
those magnifications for tracking droplet boundaries and interior using high speed imaging.
Figure 3-14: The Photron FASTCAM SA4 Camera.

82
Eventually, the described techniques have been executed consecutively using a single
Photron FASTCAM SA4 High Speed Colour Camera shown in Figure 3-14. The ultra-
sensitive sensor of the camera increases the chance of obtaining highly clear images in
low-light conditions. Camera imaging conditions have been varied according to each test,
and are listed in Table 3-3 with the resulting magnification rate and spatial resolution. The
acquired images are stored in the (TIFF) file format for further enhancement and analysis
using specially built and developed Matlab algorithms. The processing structure and
procedures are described in the next section.
Table 3-3: Camera settings with the resulting magnification rate and spatial resolution for each technique.
Imaging
Technique
Frame
Rate
(fps)
Exposure
Time
(µs)
Image
Resolution
(pixel)
Area
Covered
(mm2)
Spatial
Resolution
(µm/pixel)
Magnification
Rate (X)
Backlighting 250 4000 1024 x 1024 17x17 16.6 10
250 4000 384 x 288 3.84x2.88 10 20
Shadowgraph 10000 100 384 x 288 9.6x7.2 25 10
Backlighting 40000 25 320 x 240 3.2x2.4 10 30
3.4 Image Processing for Feature Extraction
Image acquisition is the final process in experimental work, and at the same time it is
the first process in image processing. Image processing is essential for performing the full
analysis, since the image is not an objective in its own, rather it is the information
contained within the image that represent the objective, i.e. turning images into data.
Therefore, after acquisition, a series of processes are performed sequentially on the images
to extract the required features. These processes are carried out according to the sequence
shown in Figure 3-15. Once read, the image is cropped into a specific size decided by the
nature of analysis, whether it is droplet or flame analysis, for single droplet or two-droplet
combustion. Later on, the cropped image went on the processing steps characterized by
enhancement, morphological operations, segmentation, and feature extraction. A detailed
explanation of each of these processes is shown below.

83
Figure 3-15: Flowchart of the image processing sequence in the present work.
3.4.1 Image Enhancement
Image enhancement is the process of image manipulation for obtaining an image that
is more suitable for particular applications than the original one [284]. This manipulation is
carried out by improving image contrast and object sharpness for efficient computer-aided
analysis. However, image enhancement criteria are poorly defined, and are often
subjective, because it depends on the application context rather than a standard objective
[285]. Hence, image enhancement in the present work is carried out first by transforming
the image from an RGB format into a grayscale format as shown in Figure 3-16(a and b).
Figure 3-16: Sequence of image processing to isolate the droplet from its surroundings; (a) the original
image, (b) grayscale image, (c) complementation, (d) holes filling (first), (e) thresholdeding, (f) noise
removal by filtering, (g) holes filling (second), (h) final imge of the isolated droplet.
Reading and Cropping the RGB Raw Image
Image Enhancement
Segmentation and Morphological Operations
Feature Extraction
Data Saving

84
Then, image complementation is applied in the case of droplet analysis rather than flame
analysis, because droplets are shown to be relatively dark in both backlit and shadowgraph
imaging techniques. This is due to the droplet being between the light source and camera.
Whereas, the flame is luminous by its own and its light intensity is higher than that of the
light source, therefore it does not have the dark appearance of the droplet. An example of
droplet image complementation is shown in Figure 3-16(c). Thereafter, image
enhancement is preceded by working all the gaps that take place in the image due to light
intensity difference. This is carried out by holes filling as shown in Figure 3-16(d and g).
To this point, the selected image enhancement processes fulfilled the objective of
improving object sharpness and image contrast as it is demonstrated by Figure 3-16(a-d).
Subsequently, segmentation and morphological operations are carried out as shown in
section ( 3.4.2).
3.4.2 Segmentation and Morphological Operations
Segmentation in image processing is the process of subdividing the image into
specific regions or objects of certain significance to the intended application [284].
Therefore, it is essential for describing the image and classifying its objects prior to feature
extraction. Various methods are used for image segmentation depending on the objectives
of image analysis and the required features [285]. Nonetheless, these methods are assorted
under two major categories according to the approach of segmentation. The first category
is boundary-based segmentation, in which the boundaries around the regions in the image
are formed according the discontinuities in the image. The second category is region-based
segmentation, where the similarity between image regions is the bases for segmentation.
Thresholding is an example of the latter category [284,285], and it has been utilized for
segmentation in the present work. Thresholding according to intensity is the process of
differentiating between the pixels contained in an image. The pixels with values more than
a certain threshold are assumed to be “foreground” and set white, while those less than the
threshold are assumed as “background” and set black [285]. The effect of thresholding on
the resulting image can be depicted by comparing the images shown in Figure 3-16(d and
e) that are droplet images before and after thresholding respectively.
However, even with thresholding there are still some parts of the image that contain
unfavourable noise that should be removed before going on analysis. Increasing the

85
threshold value will not solve the problem; in fact it may get it worse, because it may cut
parts of the objects of interest. Therefore, finding another tool for finalizing the task is
obligatory. This is done by the use of morphological operations.
The morphological operators in image processing serve as a tool to modify or extract
the image components towards better representation of the shape and structure of the
objects within the image [284,285]. There is a wide range of morphological operators such
as erosion, dilation, and skeletonization, and a lot more that are useful in binary image in
addition to grayscale image analysis. The use of morphological operations in image
processing includes – but not limited to – filtering, segmentation, edge detection, noise
removal, object counting, and feature recognition [285]. Hence, these operations have been
implemented in the present work in two steps; the pre-processing and post-processing
steps. In the pre-processing step, morphological operations are performed in the form of
noise removal by filtering (Figure 3-16(f)) and erosion followed by dilation using the
MATLAB function imopen (Figure 3-16(g)). While in the post-processing step, feature
extraction is carried out mostly by morphological operations as it is further explained in
section ( 3.4.4).
To this stage, the image is enhanced and modified to the form that is appropriate for
efficient feature extraction. But, an evaluation of the effect of image processing on the
shape and size of the objects in the image is essential. This is carried out by testing the
similarity between the original raw image acquired by the optical system and that obtained
by image processing. Accordingly, the degree of certainty and the amount of error margins
can be estimated. All these validation approaches have been explained in section ( 3.4.3).
3.4.3 Validation and Error Estimation
As mentioned earlier, it is essential to ensure that the effect of image processing
operations on the shapes and sizes of the elements within the processed image are always
kept to minimum. Since, the processed image is the source of the data that will be used
later for the intended analysis. Therefore, error analysis is performed for the digital image
processing part of the present work and the uncertainty is estimated.
The error between the original image and processed image is firstly expressed in
terms of discrepancy, and then uncertainty. The discrepancy is defined as the difference
between two magnitudes of the same quantity [286]. Discrepancy testing is carried out

86
both visually and mathematically. Figure 3-17 shows a comparison between original
images and those corresponding processed images. In row (a) of the figure are five original
images of diesel fuel droplet combustion at different time intervals, while those
corresponding processed images are shown in row (b), whereas row (c) shows the
matching between the outer boundaries of the images in row (b) with the grayscale forms
of the images in row (a).
Figure 3-17: Comparison between the original image and the resulting processed image of diesel fuel droplet
at different time periods; (a) original images, (b) processed images, (c) matching the boundary of the
processed images with the grayscale form of the original image.
From the figure it can be seen that the processed images are almost exactly matching
the original images regardless of droplet size or shape. Even at the worse cases of image
blur such as that shown for the time (290 ms), the processed image is almost typically
simulating the original one. This is highly favourable because sometimes the droplet
movement takes it out of camera focusing point, especially for the multicomponent
droplets. However, this droplet movement did not decrease the probability of obtaining
relatively sharp images appropriate for precise feature extraction.
In addition to the visual matching between images shown in Figure 3-17,
mathematical analysis is carried out to evaluate the exact discrepancy between images.
This analysis is carried out according to the measured droplet major and minor diameters
as the droplet is not fully circular.
Figure 3-18 shows a sample of the comparison between the measured major and
minor diameters of the droplet shown in original image (a) and its corresponding processed
image (b). The selected images are for the first case in Figure 3-17, which is for (0 ms)

87
droplet lifetime. This comparison has been applied for many images at different cases. The
maximum evaluated discrepancy for both the major and minor diameters is found to be 1
pixel. This is in the cases of image blur like the one shown in Figure 3-17. This
corresponds to 10 µm of real droplet size.
Figure 3-18: Comparison of the droplet major and minor diameters on (a) the original image, and (b) the
same image after processing.
However, the average discrepancy is found to be 0.6 and 0.3 pixel which corresponds
to 6 and 3 µm for the major and minor diameters respectively. Hence, the uncertainty is
evaluated according to equation (3-1):
𝑈𝑛𝑐𝑒𝑟𝑡𝑎𝑖𝑛𝑡𝑦 = 𝐴𝐵𝑆 (𝑋𝑂𝑟𝑔 − 𝑋𝑃𝑟𝑐
𝑋𝑂𝑟𝑔) ……… (3-1)
And the average uncertainty it found to be 0.3%.
From all the above, it can be inferred that the digital image processing operations
utilized in the present work result in a highly accurate extraction of the objects within the
image without deteriorating neither the shape nor the size of these objects. This ensures
confidence in the subsequent data extracted from those images.
3.4.4 Feature Extraction
Feature extraction is the last step in the processing of images. The aim of this step is
to convert the images into quantitative data that can be analysed, explained, and presented
in the proper form. Feature extraction is also based on the morphological operations,

88
because these are the processes that deal with parameters like object shape, size, and
quantity. Therefore, feature extraction in the present work is performed using various
morphological operators, such as edge detection for flame size estimation, object counting
for evaluating the rate of secondary atomization from a burning droplet, and area,
perimeter, and centroid estimation for droplet size evolution and fluctuation monitoring
respectively.
It is worthy to emphasise here that droplet size is expressed in its diameter, and there
are different methods described in literature for evaluating this diameter from the images
of the droplet. Some are using the equivalent diameter of the elliptical shape [287], and
volume [142,183,288], and some are evaluating the diameter from the droplet projected
area as an equivalent to sphere of the same diameter [77,84,197]. The last technique is
implemented for droplet size evaluation in the present work. The selection criterion of this
method is shown in Appendix (C).
Once the quantitative data is extracted from the images, they are saved in excel files
for further analysis. Though, the extracted data is based on the image coordinates rather
than the real coordinates. Therefore, it is required to convert these data into their
corresponding real coordinates. This is done by calibrating the images using a known size
object, and is shown in section ( 3.5).
3.5 Object True Size Calculation
The calibration in general is defined as the process of quantifying a relationship
between the input and output data of a measuring system [289]. In order to attain the real
dimensions of the investigated objects, object size calibration is carried out for defining the
magnitude of magnification resulted by the optical setup. This has been performed with the
aid of the SiC fibre whose real diameter is specified and permanently fixed.
Figure 3-19 shows the SiC fibre images for both backlighting imaging (a) and
shadowgraph imaging (b). Since the real size of the fibre is known, then the real size of
any object in the image can be evaluated in accordance to that of the fibre as shown in
equation (3-2)
𝑋𝑅 = 100 ∗ 10−3𝑋𝑖𝑚
𝑋𝐹 ……… (3-2)
Where:
XR = the real value of the object (mm).

89
Xim = the corresponding value in the image (pixel).
XF = the size of the SiC fibre in the image (pixel), and the (100*10-3
) is the real diameter of
the fibre in mm.
Figure 3-19: Camera calibration using the SiC fibre: (a) Backlighting imaging, (b) Shadowgraph imaging.
Accordingly, the real droplet diameter and flame height and width are all evaluated using
equation (3-2). The real size of the area covered by the imaging system has also been
evaluated according to the image size. The results are shown in Table 3-4 for all the image
resolution values used in the present work.
Table 3-4: The area covered by the optical setup as evaluated by image size.
Image Resolution (pixel) Corresponding Area (mm2)
320 x 240 3.2 x 2.4
384 x 288 3.84 x 2.88
768 x 512 7.68 x 5.12
1024 x 1024 25.6 x 25.6
3.6 Summary
In the present chapter, some of the processes carried out prior to (and after) the
experimental work have been presented and discussed. These include, fuel mixture
preparation, droplet generation, suspension, and ignition, the optical setups, and image
processing. The reason behind presenting these processes in this chapter is that these
processes take place with every experimental test performed in the present work. Thus,

90
combining these processes in one chapter and referring to them whenever required is more
practical than discussing them in every chapter.
Now, with the above processes explained in the present chapter, and the theoretical
basis discussed in Chapter Two, describing the experimental work performed in the next
chapters turn out to be less challenging. Though, the new task to be fulfilled is the
validation of the experimental results and findings. This is executed particularly in Chapter
Four.

91
Chapter 4. Size and Shape Characteristics of the
Burning Isolated Multicomponent Fuel
Droplet
4.1 Introduction
Droplet burning rate and size evolution throughout its overall lifetime are the most
frequently studied parameters by the majority of droplet combustion research works. This
is due to the impact of these two parameters on the performance of the corresponding
practical combustion systems. Therefore, this chapter is devoted for exploring those
parameters in addition to droplet size fluctuation with respect to the total combustion time.
Droplet size analysis is performed to emphasize the difference in stability between the
single-component fuel droplet combustion and multicomponent fuel droplet combustion on
one hand, and between the different multicomponent fuel mixtures on the other. The
analysis are carried out for diesel, biodiesel, and ethanol as the base fuels, in addition to the
multicomponent fuels formed by biodiesel/diesel and ethanol/diesel blends in addition to
water-in-diesel and diesel-in-water emulsions at different proportions.
For validation purposes, a comparison between the evaluated burning rates of diesel,
biodiesel, and ethanol droplets and those corresponding values from another experimental
works reported in literature has been performed first. Therefore, the burning rate is the first
parameter presented for all the tested fuels. Then, droplet size evolution behaviours are
presented with an emphasis on size fluctuation and its frequency to highlight the degree of
instability resulted from combining two fuels. Finally, flame width and height are
presented for all the fuels.
4.2 Experimental Setup
The schematic diagram of the experimental setup is shown in Figure 4-1. The droplet
is suspended on the single monofilament SiC fibre described in Chapter Three. This fibre
is attached to the sliding arm of a lab stand for easier control of the droplet position in
accordance to the camera. Backlighting imaging with the optical setup described in section

92
( 3.3.2.A) has been used for tracking droplet combustion throughout this experiment. This
technique offers the benefits of sharply visualizing the boundaries of both the droplet and
the corresponding flame. These boundaries are then used for tracking and calculating
droplet size evolution and flame size variation in response to droplet combustion
advancement.
Figure 4-1: Experimental setup of the droplet combustion with backlighting imaging.
The high speed camera is set in front of the droplet, whereas the light source is
installed behind the droplet as shown in the figure. The 6-Volt, 72-LED illuminator is used
for providing the light required for illumination. The translucent white light diffuser is
installed between the droplet and the light source for lower light intensity, and more
uniform light distribution behind the droplet. Two camera settings are used in the tests. The
first is used for droplet size change tracking, where the camera is set to 250 fps framing
rate, 4 ms exposure time, and 384x288 pixels image resolution. The area covered by the
camera was 3.84x2.88 mm2, giving a spatial resolution of 10 µm/pixel for each image. The
magnification rate achieved using this setup is 30 times the physical size. Therefore, a
detailed investigation of the instantaneous droplet size and shape change during its overall
lifetime is performed. The second setup is used for tracking flame characteristics, so the
image resolution is set to 1024x1024 pixels, giving a spatial resolution of 16.6 µm/pixel, a
covered area of 17x17 mm2, and a 10x magnification rate. Camera framing rate and
exposure time on the other hand, are fixed to the same values of the first setting. The
investigated fuels are water-in-diesel and diesel-in-water emulsions, biodiesel/diesel and

93
ethanol/diesel blends, in addition to the neat diesel, biodiesel, and ethanol as single-
component base fuels. The multicomponent fuel mixtures have been prepared in-lab prior
to experiments according to the procedures described in section ( 3.2). The tests have been
performed many times for each fuel, and three successful tests are selected and saved for
processing in each case for each setup. The images have been stored in the (TIFF) format
and processed according to specifically written Matlab algorithms following the processing
procedures described in Chapter Three. The flowcharts of those algorithms are shown in
Appendix (E). The obtained parameters are further discussed in section ( 4.3) below.
4.3 Results and Discussion
Figure 4-2 shows a representative sample of the obtained images for the combustion
of WD20 fuel droplet (fuel terminology is listed in Appendix (A)). Such images have been
processed for extracting the required characteristic parameters of droplet combustion.
Figure 4-2: Temporal images of a burning WD20 fuel droplet.
As mentioned earlier, the aim of this chapter is to explore in details the droplet
burning rate, size evolution, and shape change in addition to the flame characteristics of the
multicomponent fuel droplets compared to those corresponding single-component fuel
droplets. This exploration is carried out using the data extracted by processing the images

94
obtained from experiments. Droplet projected area, perimeter, major and minor diameters,
and centroid are the extracted data from the processed images. These parameters are used
for evaluating droplet size (expressed in its diameter), position, aspect ratio, sphericity, and
roundness. The disparity in these parameters between the droplets of the tested fuels is
discussed in the next section, before which, a validation of the experimental results is
discussed.
4.3.1 Validation by Burning Rate Comparison
According to equation (2-11), droplet burning rate is the ratio between the initial
droplet diameter squared and its total lifetime. Droplet lifetime is the interval of time
between droplet ignition and flame extinction. Therefore, once the droplet initial diameter
is extracted and its lifetime is determined, its burning rate can be easily evaluated.
On the other hand, the burning rate is reported extensively in the published literature
for different fuel droplets. Hence, it can be used for validating the experimental results by
comparison with the corresponding values from other published work. Especially, if it is
known that the effect of droplet size change is compromised by the change in its lifetime.
Thus, the burning rate can be used for comparison without any reluctance of droplet size
variation between the present work and the published work. Accordingly, a full
comparison is drawn for the combustion of diesel, biodiesel, and ethanol droplets and it is
shown in Appendix (D). A summarised version of the table is shown in Figure 4-3. These
fuels have been selected particularly because they are single-component so that the effect
of fuel preparation method on the results is neglected. In addition to the availability of the
burning rate data of these fuels in literature compared to the multicomponent fuels.
In general, Figure 4-3 illustrates that the burning rates published in literature are
varied within a relatively wide range for each fuel, and that the estimated values in the
present work are within these ranges. However, the present results show a certain
similarity with a specific set of the published data. Hence, a detailed examination of the
figure and the corresponding values in Appendix (D) reveals that the burning rate value is
affected by the conditions under which the test is performed. Three different test conditions
are reported for droplet combustion; suspended droplet combustion under microgravity
conditions, suspended droplet combustion under normal gravity conditions, and
combustion of freely falling droplets.

95
Figure 4-3: Burning rate comparison for diesel, biodiesel, and ethanol droplets respectively of the present
work and those corresponding values published in literature.
The burning rate values of the present work show a quite close similarity with the
majority of the published microgravity works [66,70,128,130,290] for the three fuels. This
similarity is tested by evaluating the discrepancy between both values. The discrepancy is
defined as the absolute of the net difference between two values of the same quantity
[286]. If this discrepancy is less (or slightly higher) than the standard deviation of the data
to be tested, then a high degree of confidence is reached [286]. The standard deviation of
diesel, biodiesel, and ethanol are reported in Appendix (D) and are 0.04, 0.09, and 0.06
respectively. Whereas the discrepancies between the evaluated burning rates of these fuels
and those corresponding values reported for microgravity testing conditions are found to be
0.03-0.06 for diesel, 0.03-0.08 for biodiesel, and 0.02-0.08 for ethanol. Thus, a high degree
of confidence is built on the obtained burning rates for the three fuels. This, in turn is
reflected on the overall experimental work carried out.
Furthermore, as it is shown in the Figure 4-3 and Appendix (D), the burning rate
constant of the ethanol is too close to the minimum published values which are belonging
to the burning rate constants at the microgravity conditions. This is attributed to the pure
nature of the ethanol, where it is usually available in the form of single-component neat
substance, and is utilized in all experimental work in this form. Diesel and biodiesel on the
other hand, are available in different proportions and different structures according to the
suppliers and different standards around the world. Hence, the burning rate constants of
these two fuels are slightly dispersed compared to ethanol.
One more point to be revealed, that is the reason behind the relative dissimilarity
between the current results and those corresponding published results under normal gravity
0.4
0.5
0.6
0.7
0.8
0.9
1
1.1
Diesel Biodiesel Ethanol
Bu
rnin
g R
ate
(m
m2/s
)
Published Work Present Work

96
conditions despite that the current work is performed under normal gravity. This is
explained by the effect of droplet suspension method. The size and mesh arrangement of
the suspension fibre have in fact a certain effect on the droplet burning rate. This effect is
clearly noticeable when comparing the burning rates of the same testing conditions but
different suspension material or mesh in Appendix (D). For that reason, the effect of SiC
fibre mesh arrangement on droplet burning rate has been investigated in the present work
using diesel, biodiesel, and ethanol as the burning fuels. A cross-shaped (100 µm) SiC
fibre mesh is used for suspending the droplet rather than the single-filament (100 µm) SiC
fibre. The burning rates are then evaluated for the three fuels, and the comparison with
those of the single filament fibre is shown in Figure 4-4.
Figure 4-4: The effect of SiC fibre mesh arrangement on the burning rate of diesel, biodiesel, and ethanol
droplets.
As it is shown in the figure, the droplet burning rates of diesel, biodiesel, and ethanol
are all increased with the new fibre arrangement despite the net size of the fibre is the
same. This suggests that a single filament fibre has less effect on droplet combustion than
the cross-shaped mesh. Although it is reported that the thermal asymmetries resulted from
the cross-shaped mesh are less than those from the single-filament fibres [281]. The
reduction in droplet burning rate for diesel, biodiesel, and ethanol when using single
filament fibre compared to the cross-shaped one of the same size is found to be 29%, 30%,
and 33% respectively. However, a closer look to the burning rates of the cross-shaped fibre
support experiments show that their values are almost similar to those corresponding
burning rate values under normal gravity conditions in Appendix (D), especially those
reported by Pan et. al., [66] for biodiesel, and Bartle et. al., [291] for ethanol. This in turn
0.4
0.5
0.6
0.7
0.8
0.9
1
Diesel Biodiesel Ethanol
Bu
rnin
g R
ate
(m
m2/s
)
x-Mesh 1-fibre

97
confirms the similarity of the present experimental work with the equivalent published
work using both single filament fibre and cross-shaped fibre mesh. Thereby, the analysis of
droplet burning rate and the other parameters is continued in the forthcoming sections.
Moreover, the values shown in Figure 4-4 represent the average values of ten samples for
each fuel, with the error bars in the figure representing the standard deviation of these
values. Except the biodiesel in single-fibre experiments, the standard deviation of all the
cases is around 0.05 which is about 5% of the burning rate values. This in turn, suggests a
good repeatability of the results.
4.3.2 Burning Rate of the Multicomponent Fuel Droplets
Once the droplet combustion experimental procedures and burning rate estimation
method have been validated, continuing data analysis and presentation is viable at the
moment. The burning rate of the multicomponent fuel droplets has been evaluated
according to the same principle of the single-component fuel droplets shown in equation
(2-11). That is by dividing the initial droplet diameter squared by the total droplet lifetime
evaluated from ignition to flame extinction. Therefore, only the droplets proceeded
successfully to the end are considered for evaluating droplet burning rate. That is because,
in some of the multicomponent fuel droplets, especially for the water-in-diesel and diesel-
in-water emulsions, the droplets go on explosion and do not proceed for complete
combustion. However, in the case of diesel-in-water emulsions, for all mixture
compositions, no single droplet survived to the end for complete evaporation and
combustion, despite the amount of experimental tests carried out. All the droplets went on
microexplosion rather than complete combustion. Accordingly, the slope of the droplet
size evolution curve with time has been evaluated and assumed as the burning rate for this
fuel mixture. This assumption is valid according to equation (2-10) in which the burning
rate constant is the slope of the equation relating droplet size evolution with burning time.
Additionally, this method of evaluating the burning rate has been implemented by other
published works for evaluating the burning rate for emulsion droplets, such as that of
Wang et al., [129].
Figure 4-5 shows the evaluated droplet burning rates of the multicomponent fuels
with respect to the volume fraction of the component added to diesel. The figure is split
into two parts to highlight the difference in behaviour between the emulsions and blends.

98
Figure 4-5: Droplet burning rate (mm2/s) of the multicomponent fuels with respect to the amount of: (a)
water content for the water-in-diesel and diesel-in-water emulsions, (b) blending agent for the biodiesel- and
ethanol-blended diesel fuel droplets.
Figure 4-5(a) shows the burning rates of the water-in-diesel (WD) and diesel-in-
water (DW) emulsions at 10%, 20%, and 30% volume fraction of water. Both types of
emulsions show an increase in the burning rate with increasing water content in the
emulsion, with the higher rates shown for the WD emulsions. This is attributed to the
increase in puffing and secondary atomization from the emulsion droplets, which in turn,
raises the disintegration of the droplet leading to the increases in its burning rate. This is in
agreement with the results of both Wang et al., [129] for water-in-diesel emulsion, and
Kim and Baek [292] for water-in-n-decane emulsion, but, at the same time it is in contrast
with the burning rate values estimated by Jackson and Avedisian [147] for water-in-n-
heptane emulsion. Thus, it may be inferred that the type of base fuel has an effect on the
combustion behaviour of the emulsion, especially, its boiling point. The boiling points of
diesel, n-decane, and n-heptane fuels are >170ºC [293], 174.1ºC, and 98.4ºC [294]
respectively. The boiling point of n-heptane is lower than that of water; whereas, diesel and
n-decane both have boiling temperatures higher than that of water. Therefore, the case of
water-in-n-heptane emulsion is completely different from those of water-in-diesel and
water-in-n-decane emulsions. In the latter emulsions, water is the component that
undergoes superheat nucleation. Whereas in the former emulsion, both components have
almost the same boiling point with that of n-heptane is slightly less than the boiling point
of water. Hence, both components are likely to undergo evaporation at the same rate
0.0
0.4
0.8
1.2
1.6
2.0
0 10 20 30 40
Water Content (%)
(a) WD DW
0.0
0.4
0.8
1.2
1.6
2.0
0 10 20 30 40
Blending Fuel Content (%)
(b) BD ED

99
without the occurrence of superheat nucleation. This probably is the reason behind the
difference in burning rate behaviour.
Figure 4-5(b) shows the burning rate values of the biodiesel-blended diesel (BD) and
ethanol-blended diesel (ED) for 10%, 20%, and 30% of the blending fuel. The figure
shows that increasing the concentrations of ethanol and biodiesel in the mixture will lead to
a steep – in the ED blends – and a slight – in the BD blends – decrease in the droplet
burning rate. This is expected in light of the burning rate values of the single-component
fuels (diesel, biodiesel, and ethanol) shown in Figure 4-3 and Figure 4-4 respectively.
Since, the burning rates of both biodiesel and ethanol are less than that of diesel.
Consequently, adding these fuels to diesel will result in decreasing the burning rate of the
mixture. Again, this is in agreement with the published work on diesel burning rate values
when blended with biodiesel and ethanol respectively [122].
According to Figure 4-5, the burning rates of the diesel-based multicomponent fuel
droplets are variable both in behaviour and magnitude in response to several parameters,
such as the concentration of the added substance, and boiling point difference between the
diesel and the added constituent. This variation in burning rate ranges from 0.49 mm2/s for
BD30 to 1.88 mm2/s for WD30. Then, the effect of this relatively broad range of burning
rate on the consumption of the base fuel (diesel) is evaluated.
Figure 4-6 shows the effect of (a) water and (b) blends concentrations on diesel fuel
consumption of the multicomponent fuel droplets. Diesel fuel consumption is normalized
with respect to the burning rate of the neat diesel. As shown in Figure 4-6(a), emulsifying
diesel by water results in increased diesel fuel consumption due to increasing the burning
rate of the emulsion. This increase in diesel fuel consumption is shown to be less for the
diesel-in-water emulsions; in fact it is negligibly small for the three concentrations. For the
diesel blends shown in Figure 4-6(b), increasing the blending fuel results in decreasing
diesel fuel consumption. This decrease may reach up to 70% and 50% of the neat diesel
burning rate for ED30 and BD30 respectively. All that implies that blending diesel by
either biodiesel or ethanol has a better impact on diesel fuel economy than water
emulsification. This in turn will have an effect on the break specific fuel consumption of
the engine fuelled with such fuels. The break specific fuel consumption (bsfc) of the
engine is defined as the ratio of fuel consumption rate to the break power of the engine
[165]. This means that the break specific fuel consumption is proportional to the fuel
consumption rate.

100
Figure 4-6: Normalized diesel consumption with respect to the amount of: (a) water content for the water-in-
diesel and diesel-in-water emulsions, (b) blending agent for the biodiesel- and ethanol-blended diesel fuel
droplets.
Hence, Figure 4-6 suggests that the break specific fuel consumption of the engine
will increase when fuelled with the emulsified diesel and decrease when fuelled with
ethanol-blended or biodiesel-blended diesel. This is in agreement with the published work
on engine performance for diesel-water emulsions [253,255,295,296], but in contrast with
that for diesel blends [238–240,249,297]. However, the above suggestion accounts only for
one parameter of the brake specific fuel consumption that is the fuel consumption rate and
disregards the other effective parameter that is the brake power. The brake power may vary
by varying fuel type according to the heating value of the fuel. Hence, the above
suggestion only gives an indication of the effect of changing fuel composition on the
consumption rate rather than power output.
Once, the burning rate constant of the different multicomponent fuel droplets has
been evaluated, it is time now for comparing the second important macroscopic parameter,
that is the droplet size evolution with time. This is executed in the next section.
4.3.3 Droplet Size Evolution
Figure 4-7 shows the droplet size evolution with time for all the fuels tested in the present
work. These include diesel, biodiesel, and ethanol as single-component fuels, in addition to
biodiesel-blended diesel, ethanol-blended diesel, water-in-diesel emulsions, and diesel-in-
water emulsions as multicomponent fuels. The multicomponent fuels are of 10%, 20%, and
0.0
0.5
1.0
1.5
2.0
2.5
0 10 20 30 40
Norm
ali
zed
Die
sel
Con
sum
pti
on
Water Content (%)
(a) WD DW
0.0
0.5
1.0
1.5
2.0
2.5
0 10 20 30 40
Blending Fuel Content (%)
(b) BD ED

101
30% volume fraction of the added component. Droplet size evolution is expressed in terms
of its diameter squared. It has been tracked and estimated using droplet images during
combustion. Droplet size is normalized by the droplet initial diameter squared to eliminate
the effect of initial droplet size variation on the comparison between fuels. Instantaneous
combustion time has also been normalized by the total droplet lifetime so that the effect of
combustion time difference between the fuels is eliminated. Hence, an assessment of
droplet combustion behaviour for all the tested fuels became appropriately conceivable by
unifying the time domain. As mentioned in Chapter Three and Appendix (C), droplet
diameter is estimated using the equivalent diameter of the droplet projected area from its
sequential images for all the tested fuels. All the fuels listed in Figure 4-7 are of droplets
that went through complete combustion, i.e. from the initial size to a size equal to zero.
Except one case which is the diesel-in-water emulsion of all volume fractions, where the
droplets experience explosion before complete evaporation despite the large number of
trials carried out for investigating this case. Therefore, the final size of this case is not the
complete combustion size; rather it is the explosion size. The first row of Figure 4-7 shows
the size evolution of the single-component fuels; diesel, biodiesel, and ethanol
respectively.
Generally, the combustion of these single-component fuels is smooth compared to
the chaotic combustion of the multicomponent fuels. Additionally, the size variation of the
three fuels relatively obeys the D2-law of droplet combustion, especially after the first 20%
of the droplet lifetime. A linear slope is obtained for the three fuels that is compatible with
what is predicted by the D2-law analysis. Whereas, in the first 20% portion of the droplet
lifetime, droplet size is either equal to or relatively higher than its initial value. This is due
firstly, to the combustion of the already existing fuel vapour that is generated by droplet
vaporization prior to combustion, and secondly, to the heating of the initially cold droplet
[40]. Therefore, droplet heating rather than evaporation is the dominant process in the early
stages of combustion, and in turn, relatively constant droplet size behaviour is shown in the
size evolution curve of the single-component fuels in Figure 4-7.
The second row of Figure 4-7 shows the size evolution of the biodiesel-blended
diesel (BD) of 10%, 20%, and 30% biodiesel volume fractions respectively. Firstly, it can
be inferred that the BD blends are burning relatively smoothly compared to the other
multicomponent fuels as a result of the miscibility of diesel and biodiesel in each other
leading to a relatively homogeneous mixture. Secondly, the early stage constant droplet
size shown for the single-component fuels is also occurring with the BD fuel droplets.

102
Figure 4-7: Droplet size evolution with respect to time for: the single-component fuels (1st row),
biodiesel/diesel blends (2nd
row), ethanol/diesel blends (3rd
row), water-in-diesel emulsions (4th
row), and
diesel-in-water emulsions (5th
row). The y-axis is the normalized droplet size (D/D0)2, and the x-axis is the
normalized droplet lifetime (t/ttotal).
0.00.20.40.60.81.01.21.41.61.82.0
0.0 0.2 0.4 0.6 0.8 1.0
Diesel
0.00.20.40.60.81.01.21.41.61.82.0
0.0 0.2 0.4 0.6 0.8 1.0
Biodiesel
0.00.20.40.60.81.01.21.41.61.82.0
0.0 0.2 0.4 0.6 0.8 1.0
Ethanol
0.00.20.40.60.81.01.21.41.61.82.0
0.0 0.2 0.4 0.6 0.8 1.0
BD10
0.00.20.40.60.81.01.21.41.61.82.0
0.0 0.2 0.4 0.6 0.8 1.0
BD20
0.00.20.40.60.81.01.21.41.61.82.0
0.0 0.2 0.4 0.6 0.8 1.0
BD30
0.00.20.40.60.81.01.21.41.61.82.0
0.0 0.2 0.4 0.6 0.8 1.0
ED10
0.00.20.40.60.81.01.21.41.61.82.0
0.0 0.2 0.4 0.6 0.8 1.0
ED20
0.00.20.40.60.81.01.21.41.61.82.0
0.0 0.2 0.4 0.6 0.8 1.0
ED30
0.00.20.40.60.81.01.21.41.61.82.0
0.0 0.2 0.4 0.6 0.8 1.0
WD10
0.00.20.40.60.81.01.21.41.61.82.0
0.0 0.2 0.4 0.6 0.8 1.0
WD20
0.00.20.40.60.81.01.21.41.61.82.0
0.0 0.2 0.4 0.6 0.8 1.0
WD30
0.00.20.40.60.81.01.21.41.61.82.0
0.0 0.2 0.4 0.6 0.8 1.0
DW10
0.00.20.40.60.81.01.21.41.61.82.0
0.0 0.2 0.4 0.6 0.8 1.0
DW20
0.00.20.40.60.81.01.21.41.61.82.0
0.0 0.2 0.4 0.6 0.8 1.0
DW30

103
Moreover, as shown in the regions highlighted by the circles in the second row of
Figure 4-7, for a short time period within the interval bounded by the 50% and 60%
portions of the droplet lifetime, a slightly constant droplet size pattern is noticed for the
blends compared to diesel and biodiesel. This is referred to the heating and evaporation of
the less volatile component in the multicomponent mixtures [116]. These components last
to the end inside the droplet, and then start to boil and evaporate causing the droplet size to
increase due to increased internal pressure by vapour generation [124]. In the present work,
biodiesel is the less volatile component [298]. Hence, diesel will evaporate first leaving the
biodiesel to accumulate in the centre of the droplet. This will result in a form of nucleation
and phase separation between diesel and biodiesel as shown in Figure 4-8. After a certain
time, the concentrations of the mixture will change due to diesel depletion and biodiesel
accumulation resulting in a new mixture of high biodiesel concentration. Therefore,
biodiesel will move towards the droplet surface due to concentration gradient. Though, at
the droplet surface, biodiesel will evaporate at a temperature higher than that of diesel.
This will result in increasing the droplet surface temperature, and accordingly increasing
the temperature inside the droplet.
Figure 4-8: Bubble nucleation inside a burning BD10 fuel droplet (D0=1.3 mm).
Consequently, the remaining diesel that is trapped inside that droplet will start
boiling and generate bubbles that are growing and causing droplet expansion. This
expansion is shown to occur in the second half of its lifetime and for the diesel and blends
rather than biodiesel. For diesel, the expansion is less intensive compared to the
biodiesel/diesel blends, and it may be related to the constituents of diesel. Since the diesel

104
fuel is a mixture of different components that have different volatilities, making the diesel
droplet to behave similarly like the multicomponent fuel droplets [13].
The third row of Figure 4-7 shows the size evolution of the ethanol-blended diesel
(ED) of 10%, 20%, and 30% ethanol volume fractions respectively. As the figure
illustrates, the ED blends show the most chaotic behaviour among all the studied fuels.
This is attributed to the partial miscibility of ethanol in diesel as stated previously. Hence,
compared to the mixtures produced by blending diesel with biodiesel – which are
completely miscible in each other – and the emulsions generated by mixing water with
diesel – with the aid of the emulsifying agents – blending diesel with ethanol results in
highly metastable mixtures. So, the relatively random droplet combustion behaviour of
these blends is attributed to their metastable nature which leads to increased nucleation rate
as shown in Figure 4-9. This is in agreement with the findings of Avulapati et. al., [131]
for blending diesel with 10%, 25% and 50% ethanol by volume. Furthermore, in the ED
blends ethanol is the more volatile component and diesel is the less volatile one, with a
relatively large boiling point difference between them (in the order of 100). Hence, the
superheat boiling described for the BD blends is expected to occur in the ED fuel droplets
with diesel being the component experiencing superheat boiling. The constant droplet size
regions shown in the BD blends have also been noticed for the ED blends and bounded by
the red circles in Figure 4-7.
Figure 4-9: Size increase and instability due to bubble growth and puffing within a burning ED10 fuel
droplet (D0=1.23 mm).

105
The final two rows of Figure 4-7 show the size evolution of the water-in-diesel (WD)
and diesel-in-water (DW) emulsions of 10%, 20%, and 30% water volume fractions
respectively. As mentioned earlier, droplet fragmentation was the dominant behaviour
during the combustion of the DW droplets. Accordingly, the droplets did not undergo
complete combustion for the all water concentrations studied. The same combustion
behaviour of the ED blends is shown to happen during the combustion of the emulsion
droplets with less instability. This is due to the effect of the emulsifying agents used for
preparing the emulsions. These agents act as mixture stabilizers that prevent phase
separation within the emulsified fuel as discussed in Chapter Three.
Figure 4-10: Comparison between the predicted droplet size evolutions using the D2-law (upper row) and
those evaluated from experimental results (lower row) for diesel, biodiesel, and ethanol. The y-axis is
((D/D0)2), and the x-axis is (t/ttotal)
Furthermore, in order to compare the difference between the theoretical prediction
and experimental calculations, the droplet size evolutions of the three single-component
fuels have been evaluated using the D2-law equations described in Chapter Two. These
evolutions have been drawn with those corresponding evolutions from experimentation in
Figure 4-10. These three fuels have been selected because the D2-law is only valid for
single-component fuels rather than the multicomponent fuels as it is shown in the
assumptions used for developing the D2-model in Chapter Two. Hence, as Figure 4-10
0.0
0.2
0.4
0.6
0.8
1.0
1.2
0.0 0.2 0.4 0.6 0.8 1.0
Diesel
0.0
0.2
0.4
0.6
0.8
1.0
1.2
0.0 0.2 0.4 0.6 0.8 1.0
Biodiesel
0.0
0.2
0.4
0.6
0.8
1.0
1.2
0.0 0.2 0.4 0.6 0.8 1.0
Ethanol
0.0
0.2
0.4
0.6
0.8
1.0
1.2
0.0 0.2 0.4 0.6 0.8 1.0
Diesel
0.0
0.2
0.4
0.6
0.8
1.0
1.2
0.0 0.2 0.4 0.6 0.8 1.0
Biodiesel
0.0
0.2
0.4
0.6
0.8
1.0
1.2
0.0 0.2 0.4 0.6 0.8 1.0
Ethanol
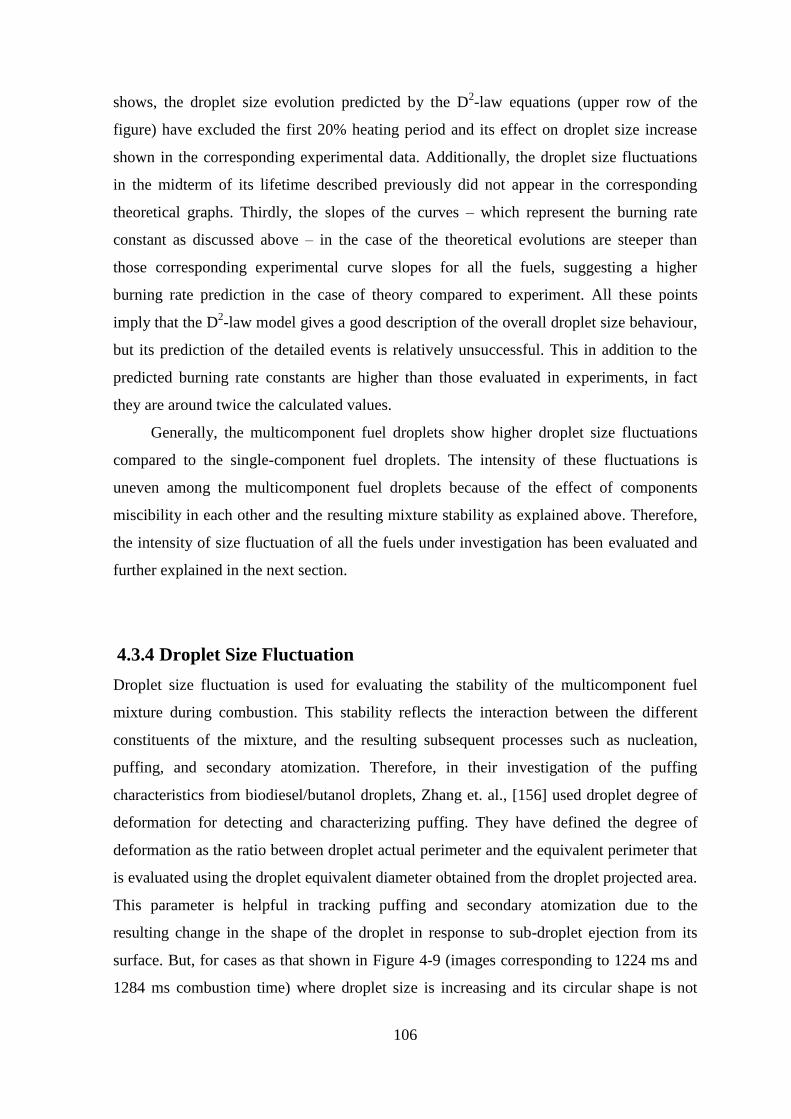
106
shows, the droplet size evolution predicted by the D2-law equations (upper row of the
figure) have excluded the first 20% heating period and its effect on droplet size increase
shown in the corresponding experimental data. Additionally, the droplet size fluctuations
in the midterm of its lifetime described previously did not appear in the corresponding
theoretical graphs. Thirdly, the slopes of the curves – which represent the burning rate
constant as discussed above – in the case of the theoretical evolutions are steeper than
those corresponding experimental curve slopes for all the fuels, suggesting a higher
burning rate prediction in the case of theory compared to experiment. All these points
imply that the D2-law model gives a good description of the overall droplet size behaviour,
but its prediction of the detailed events is relatively unsuccessful. This in addition to the
predicted burning rate constants are higher than those evaluated in experiments, in fact
they are around twice the calculated values.
Generally, the multicomponent fuel droplets show higher droplet size fluctuations
compared to the single-component fuel droplets. The intensity of these fluctuations is
uneven among the multicomponent fuel droplets because of the effect of components
miscibility in each other and the resulting mixture stability as explained above. Therefore,
the intensity of size fluctuation of all the fuels under investigation has been evaluated and
further explained in the next section.
4.3.4 Droplet Size Fluctuation
Droplet size fluctuation is used for evaluating the stability of the multicomponent fuel
mixture during combustion. This stability reflects the interaction between the different
constituents of the mixture, and the resulting subsequent processes such as nucleation,
puffing, and secondary atomization. Therefore, in their investigation of the puffing
characteristics from biodiesel/butanol droplets, Zhang et. al., [156] used droplet degree of
deformation for detecting and characterizing puffing. They have defined the degree of
deformation as the ratio between droplet actual perimeter and the equivalent perimeter that
is evaluated using the droplet equivalent diameter obtained from the droplet projected area.
This parameter is helpful in tracking puffing and secondary atomization due to the
resulting change in the shape of the droplet in response to sub-droplet ejection from its
surface. But, for cases as that shown in Figure 4-9 (images corresponding to 1224 ms and
1284 ms combustion time) where droplet size is increasing and its circular shape is not

107
changing, the degree of deformation is not effectively applicable. For that reason, droplet
size fluctuation – the size increase in particular – has been chosen to illustrate the stability
of the fuel mixtures under investigation.
Figure 4-11 shows the temporal size fluctuation of the burning BD10, ED10, WD10,
and DW10 fuel droplets respectively compared to that of the neat diesel droplet. Droplet
size fluctuation (∆D) has been evaluated according to equation (4-1):
∆𝐷 =(𝐷𝑖+1 − 𝐷𝑖)
𝐷0 ……… (4-1)
This fluctuation has been normalized by the initial droplet diameter for minimizing the
effect of droplet initial size variation on the results, and for the relevance and practicality
offered by the non-dimensional quantities compared to their corresponding dimensional
ones.
Figure 4-11 shows representative samples of each type of the fuel mixtures –
biodiesel/diesel blends, ethanol/diesel blends, water-in-diesel emulsions, and diesel-in-
water emulsions – in addition to a sample from the neat diesel fuel droplet tests. The figure
shows that the intensity of size fluctuation is higher at the second half of the droplet
lifetime for all the presented fuels. This intensity is occasionally high compared to the
droplet initial diameter, as shown in the case of ED10 fuel droplet. The size fluctuation in
this case is around 30% of the initial droplet diameter. Therefore, further exploration in
these fluctuations is thought to be merited. However, due to the random nature of droplet
size fluctuation, presenting it in the form of Figure 4-11 for every fuel is not practically
worthy. Therefore, a broader statistical analysis is performed among three samples for each
fuel and the maximum limit of the average values for every fuel has been evaluated.
Figure 4-12 shows the average droplet size fluctuations of all the fuels under
investigation. These fuels are divided into three categories; (a) the single-component fuels
(biodiesel, diesel, and ethanol), (b) the WD and DW emulsions, and (c) the BD and ED
blends. The presented values are for the sum of the average values and standard deviation
for each case in order to illustrate the maximum possible size increase rate. As it is shown
in the figure, the multicomponent fuels have higher size fluctuations compared to the
single-component fuels.

-30
-10
10
30
0.0 0.1 0.2 0.3 0.4 0.5 0.6 0.7 0.8 0.9 1.0
Diesel
-30
-10
10
30
0.0 0.1 0.2 0.3 0.4 0.5 0.6 0.7 0.8 0.9 1.0
BD10
-30
-10
10
30
0.0 0.1 0.2 0.3 0.4 0.5 0.6 0.7 0.8 0.9 1.0
ED10
-30
-10
10
30
0.0 0.1 0.2 0.3 0.4 0.5 0.6 0.7 0.8 0.9 1.0
WD10
-30
-10
10
30
0.0 0.1 0.2 0.3 0.4 0.5 0.6 0.7 0.8 0.9 1.0
DW10
Figure 4-11: Temporal size fluctuation of diesel, BD10, ED10, WD10, and DW10 fuel droplets undergoing combustion. The x-axis the (t/ttotal), and the y-axis is the droplet
size variation normalized by the initial droplet diameter.

The larger average size fluctuation occurs during the combustion of ethanol/diesel blends
that is about 7% of the instantaneous droplet diameter and 4% of the initial diameter in
maximum in the case of ED10, and the rest of the mixtures are below these values.
Figure 4-12: Average droplet size increase rate normalized with respect to droplet initial diameter for the: (a)
single-component fuel droplets, (b) diesel/water and water/diesel emulsion droplets, and (c) biodiesel/diesel
and ethanol/diesel blend droplets.
Furthermore, the BD and ED blends initially, have higher fluctuations than the
corresponding emulsions of the same diesel concentration, as in the case of 10% additive
mixture fuels. Increasing the additive concentration in the ED and BD blends then
decreases the fluctuations in the droplet size. This is exactly the opposite in the case of
emulsion droplets, where the fluctuation is increased by increasing the concentration of
water in the emulsion. This can be explained by looking at the maximum droplet size
increase in Figure 4-13, and the size increase time portion in Figure 4-14.
Figure 4-13 shows the higher value of droplet size with respect to its initial diameter.
This value is the average of three samples for each fuel. The same three categories used in
Figure 4-12 have been used for presenting the maximum values, except the BD data that
has been moved to Figure 4-13(b) to show the similarity in behaviour. Second order
polynomial curve fitting is used for connecting the points for each of the multicomponent
fuels in Figure 4-13(b and c).
0.0
0.5
1.0
1.5
2.0
2.5
3.0
3.5
4.0
4.5
5.0
Aver
ag
e S
ize
Incr
ease
/D0
(%)
(a) ∆D/D0
0.0
0.5
1.0
1.5
2.0
2.5
3.0
3.5
4.0
4.5
5.0
10 20 30
Water Content (%)
(b) DW WD
0.0
0.5
1.0
1.5
2.0
2.5
3.0
3.5
4.0
4.5
5.0
10 20 30
Blending Fuel Content (%)
(c) BD ED
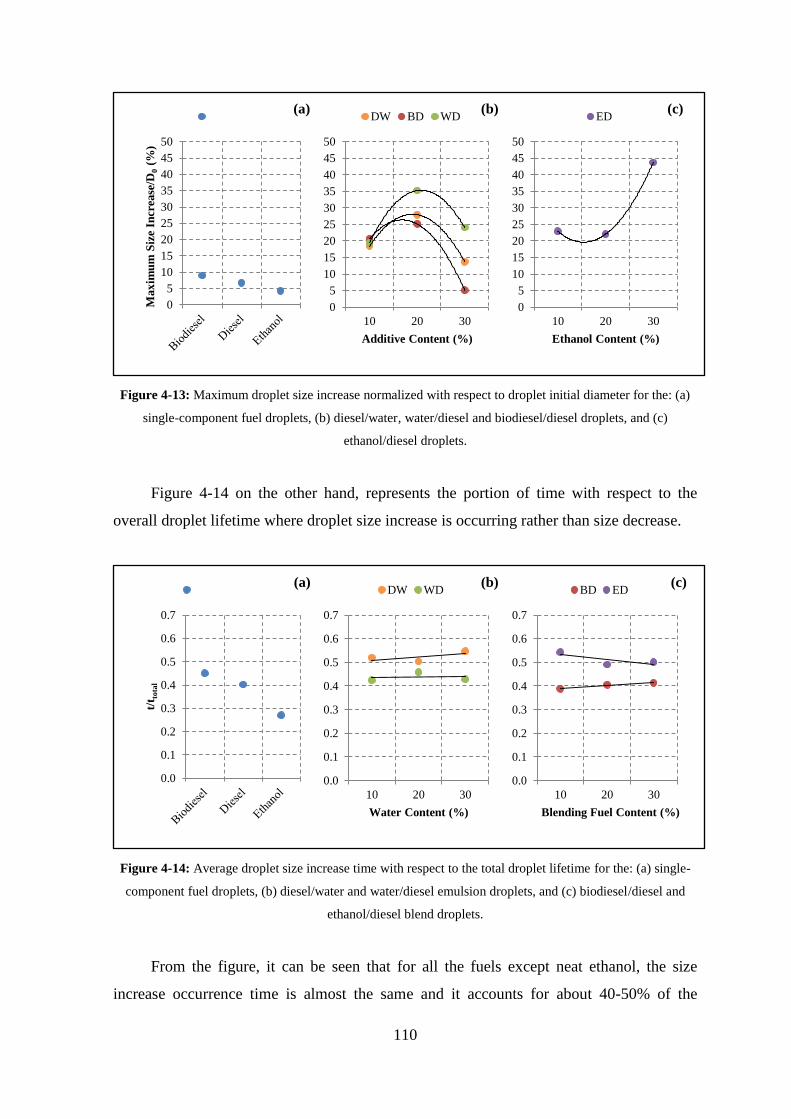
110
Figure 4-13: Maximum droplet size increase normalized with respect to droplet initial diameter for the: (a)
single-component fuel droplets, (b) diesel/water, water/diesel and biodiesel/diesel droplets, and (c)
ethanol/diesel droplets.
Figure 4-14 on the other hand, represents the portion of time with respect to the
overall droplet lifetime where droplet size increase is occurring rather than size decrease.
Figure 4-14: Average droplet size increase time with respect to the total droplet lifetime for the: (a) single-
component fuel droplets, (b) diesel/water and water/diesel emulsion droplets, and (c) biodiesel/diesel and
ethanol/diesel blend droplets.
From the figure, it can be seen that for all the fuels except neat ethanol, the size
increase occurrence time is almost the same and it accounts for about 40-50% of the
0
5
10
15
20
25
30
35
40
45
50M
ax
imu
m S
ize
Incr
ease
/D0 (
%)
(a) Max/D0
0
5
10
15
20
25
30
35
40
45
50
10 20 30
Additive Content (%)
(b) DW BD WD
0
5
10
15
20
25
30
35
40
45
50
10 20 30
Ethanol Content (%)
(c) ED
0.0
0.1
0.2
0.3
0.4
0.5
0.6
0.7
t/t t
ota
l
(a) Period Portion
0.0
0.1
0.2
0.3
0.4
0.5
0.6
0.7
10 20 30
Water Content (%)
(b) DW WD
0.0
0.1
0.2
0.3
0.4
0.5
0.6
0.7
10 20 30
Blending Fuel Content (%)
(c) BD ED

111
droplet lifetime. This implies that in a large portion – almost half – of its lifetime, the
burning multicomponent fuel droplet experiences size fluctuation leading to an increase in
its diameter. This fluctuation is basically attributed to the stability of the multicomponent
fuel mixture resulting from the miscibility of its components in each other. This is
practically interpreted by the nucleation and bubble generation within the liquid-phase of
the burning fuel droplet, and the subsequent puffing and secondary atomization.
Altogether, figures (4-11), (4-12), and (4-13) give a broader description for the
stability of the multicomponent fuel droplets during combustion. Since, Figure 4-12 gives
the average fluctuation rate among the overall droplet lifetime, Figure 4-13 gives the
maximum size increase, and Figure 4-14 gives the time portion of that increase with
respect to the droplet lifetime.
Hence, recalling the final finding of Figure 4-12 regarding the effect of additive
concentration on the variation of average size increase. This effect can be explained in
light of the three figures. Firstly, for the emulsions, increasing the water content in the
emulsion increases the chance for superheat boiling of water and the resulting nucleation
and bubble generation. This in turn, is reflected on the size increase rate and its occurrence
time which both are increased for the WD and DW types of emulsions as shown in
Figure 4-12(b) and Figure 4-14(b) respectively. Secondly, for the biodiesel/diesel blends,
increasing the biodiesel content in the blend resulted in decreasing the average increase
rate from 1.5% to 0.6% of the droplet initial diameter, and increasing the occurrence time
span from 38% to 42% of the total droplet lifetime as shown in Figure 4-12(c) and
Figure 4-14(c) respectively. In other words, the instability in the biodiesel/diesel fuel blend
is reflected in the fluctuation time rather than fluctuation intensity. This could be attributed
to the sequential combustion of diesel and biodiesel in the blend and the slightly low
burning rate of the blends as shown in Figure 4-5. Thirdly, for the ethanol/diesel blends,
the fluctuation size increase rate is decreased from 4% to 2.8% of the droplet initial
diameter, and the occurrence time also decreased from 55% to 50% of the total droplet
lifetime when the concentration of ethanol in the blend is increased from 10% to 30% as
shown in Figure 4-12(c) and Figure 4-14(c) respectively. However, as shown in
Figure 4-13(c), the maximum size increase is augmented from 23% to 44% by increasing
the ethanol concentration in the blend from 10% to 30%. This implies that the mixture
instability in the case of the ethanol/diesel blends is reflected in the form of smaller
number of large scale fluctuations occurring in a shorter period of time. An example of

112
these large scale fluctuations is shown in the spikes bounded by the red circles in
Figure 4-11.
Finally, despite its representation with respect to initial droplet diameter, the droplet
size fluctuation could be instantaneously effective compared to the droplet instantaneous
diameter, especially for smaller droplet diameters. Therefore, in order to quantify its
significance, the maximum droplet size fluctuation rate is evaluated and normalized by the
instantaneous droplet diameter for all the fuels under investigation and plotted in
Figure 4-15. As it is shown in the figure, compared to droplet instantaneous diameter, the
fluctuation rate is relatively high, and in some cases such as the ED blends, the fluctuation
in the size is equivalent to – or even larger than – the droplet diameter. This is especially
occurs in the end of the droplet lifetime where droplet diameter is relatively small.
Additionally, it can be seen that in the case of DW emulsions, the fluctuations are too small
compared to the corresponding WD emulsions and BD and ED blends. This is because the
DW fuel droplets did not maintain combustion to the end of the droplet lifetime, rather
droplet fragmentation takes place when droplet size still relatively large. Hence, the
resulting ∆D/Di ratio is high compared to the corresponding multicomponent fuel mixtures
that are successfully burning towards the complete evaporation of the fuel droplet.
Figure 4-15: Maximum droplet size increase rate normalized with respect to droplet instantaneous diameter
for the fuels under investigation.
4.3.5 Flame Characteristics
Figure 4-16 shows sample images of the luminous flame surrounding a WD10 fuel
droplet. The first image represents the droplet just before ignition initiation, therefore it is
0
20
40
60
80
100
120
Max
imu
m S
ize
Incr
ease
/Di (%
)

113
assigned time (t = 0 ms). The images at times 380 ms and 484 ms show the flame
propagation, while the image at time 676 ms demonstrates the maximum dimensions of the
flame. The influence of droplet puffing on the shape and appearance of the luminous flame
is shown in the images of times 756 ms and 1504 ms. Flame shrinkage and extinction due
to complete droplet evaporation and fuel consumption is shown in the images of time
periods 1588 ms and 1616 ms respectively.
As shown by the images in Figure 4-16, flame boundaries are well defined and easily
distinguished from both the droplet and surrounding environment, giving the opportunity
to track and extract flame size variation during the overall combustion time. Additionally,
as shown by the images, the effect of forced convection has been eliminated by working in
a relatively quiescent environment. However, the natural convection and buoyancy could
not be avoided because the experiments are performed under normal gravity conditions.
Figure 4-16: Sample images of the luminous flame surrounding a WD10 fuel droplet.
The flame tests have been carried out for all the fuels under investigation, including
the single-component fuels – except neat ethanol – and the multicomponent fuel mixtures
comprising the blends and emulsions. Ethanol has no luminous flame; therefore it has been
excluded from the flame characteristic analysis. Three experimental tests have been
performed for every fuel for assuring repeatability. The images obtained from these tests
have been processed using the same sequence followed for the droplet image processing
described in Chapter Three. The flowchart of flame image analysis is shown in Appendix
(E). From the test images, flame height and width variation with time are evaluated. These
parameters are normalized with droplet initial diameter for the same reasons mentioned

114
earlier regarding the elimination of droplet size variation effect on the obtained results, and
the applicability of the non-dimensional quantities compared to the dimensional ones.
Figure 4-17 shows the temporal variation of the luminous flame height (H/D0) and
width (W/D0) with time for the neat diesel and biodiesel fuel droplets. Both the flame
height and width have been normalized according to the droplet initial diameter for each
fuel. Time as well has been normalized in accordance to the total time required for
complete combustion of the droplet, in order to study flame behaviour for all the fuels
across the same portion of time. The flame height is assumed to start from the SiC fibre;
hence the small portion of droplet size above the fibre has been neglected. From the figure
it can be seen that diesel droplet has the highest flame (H/D0 ≤ 11) while biodiesel has the
lowest (H/D0 < 7). This is attributed to the sooting tendency of the fuels, where biodiesel
has a lower sooting tendency compared to diesel that is classified as a sooting fuel. This
supports the previous findings of the effect of biodiesel on decreasing soot generation
when added to diesel [66,122,128]. This in fact is the idea behind blending diesel with
biodiesel.
Figure 4-17: Temporal variation of the normalized flame height (blue) and normalized flame width (red)
with time for neat diesel and neat biodiesel fuel droplets.
Furthermore, as shown in the flame height (blue) lines of Figure 4-17, there are three
distinctive stages in the combustion of the fuel droplet. The first stage is shown in the early
20% of the droplet lifetime, where ignition and flame initiation takes place, followed by
flame propagation. The second stage is for the next 60% of droplet lifetime, where steady
0
2
4
6
8
10
12
14
16
18
0.0 0.2 0.4 0.6 0.8 1.0
t/ttotal
Diesel
0
2
4
6
8
10
12
14
16
18
0.0 0.2 0.4 0.6 0.8 1.0
t/ttotal
Biodiesel

115
burning of fuel takes place, and flame size is relatively constant. And the third stage is the
last 20% of the droplet lifetime, where the flame starts to shrink height wise while its width
remains almost the same until the final stages of combustion. These stages are shown to
occur during the combustion of both the neat diesel and neat biodiesel.
In addition, it is noticed that at the early 10% of the overall droplet combustion time,
the diesel droplet experiences dramatic increase in flame height, as shown in the spike
bounded by the red circle in Figure 4-17. This luminous flame height increase is further
illustrated in Figure 4-18.
Figure 4-18: Flame increase during the early ignition stage for diesel and biodiesel fuel droplets.
For the diesel droplet, the first image is the droplet just before ignition initiation,
that’s why it is assigned time (t = 0 ms). In the second image – at 4 ms – the first
appearance of the luminous flame takes place. This flame is a faint blue in colour implying
a premixed combustion mode rather than the regular diffusion combustion of the liquid
fuel droplets [13]. This flame is then followed by the sudden increase in the yellow
luminous flame shown in the image of time 8 ms. Thereafter, the flame decreases slightly,
and grow again, as shown in the image of time 12 ms and the subsequent images. This
increase in flame height is therefore, attributed to the combustion of the diesel vapour that
is generated during droplet heating prior to ignition. After the vapour is consumed by
combustion, flame height decreases to a certain level that is defined by the rate of diesel
fuel evaporation from the droplet surface and the tendency of this fuel to generate soot
during combustion. However, this sudden increase in flame height has not been seen for
the flame surrounding biodiesel droplets. As shown in Figure 4-18, the biodiesel flame
grows gradually without any sudden increase in its dimensions. Additionally, the faint blue
flame region in image 4 ms of the biodiesel fuel is barely recognized. This could be

116
attributed to the flash point of biodiesel that is much higher than that of diesel. This means
that biodiesel needs a higher temperature for evaporation and ignition, in addition to the
aforementioned low sooting tendency of biodiesel.
Figure 4-19 shows the temporal variation of the normalized luminous flame height
(H/D0) and width (W/D0) with time for the biodiesel/diesel blends (first row),
ethanol/diesel blends (second row), water-in-diesel emulsions (third row), and diesel-in-
water emulsions (fourth row), all of 10%, 20%, and 30% additive agent volume fraction in
the fuel mixture. From the figure it can be seen that the biodiesel/diesel blends have the
most stable flames among all the studied fuel mixtures. This is due to the relatively stable
droplet combustion of these blends compared to the other mixtures as shown in the
previous sections. Besides, compared to the flame surrounding the neat diesel fuel droplet,
the flames of all the diesel-based multicomponent fuels are lower in height and similar in
width. Accordingly, lower sooting tendency of the multicomponent fuels is suggested. This
is in agreement with the published data for biodiesel/diesel blends [66,299], ethanol/diesel
blends [300], and water/diesel emulsions [137,168]. In addition, the three combustion
stages shown during the combustion of the single-component fuels, are also recognisable
for the multicomponent fuels, especially for the BD and ED blends. However, for the WD
and DW emulsions, the third stage is shifting to the final 10% of the droplet lifetime.
This is because the emulsion droplets usually suffer from higher rates of puffing leading to
the droplet dose not burn steadily to the end of its lifetime – especially in the case of the
DW emulsions – therefore, the third stage in the case of emulsions usually starts when the
droplet is either partially or completely fragmented resulting in the rapid decrease of flame
height in accordance.
Furthermore, the sudden increase in flame height observed during the combustion of
the neat diesel droplet has also been observed during the early stages of droplet combustion
of the ethanol/diesel blends and water-in-diesel emulsions as shown by the red bounding
circles in Figure 4-19. Though, in the case of biodiesel/diesel blends, the sudden increase
in flame height is barely recognized to occur during the combustion of the BD10, and its
intensity is slightly decreasing with the increase of biodiesel concentration in the blend.
This is clearly illustrated in Figure 4-20, especially by comparing the images of time 8 ms
for all the blends.

117
0
2
4
6
8
10
12
14
16
18
0.0 0.2 0.4 0.6 0.8 1.0
BD10
0
2
4
6
8
10
12
14
16
18
0.0 0.2 0.4 0.6 0.8 1.0
BD20
0
2
4
6
8
10
12
14
16
18
0.0 0.2 0.4 0.6 0.8 1.0
BD30
0
2
4
6
8
10
12
14
16
18
0.0 0.2 0.4 0.6 0.8 1.0
ED10
0
2
4
6
8
10
12
14
16
18
0.0 0.2 0.4 0.6 0.8 1.0
ED20
0
2
4
6
8
10
12
14
16
18
0.0 0.2 0.4 0.6 0.8 1.0
ED30
0
2
4
6
8
10
12
14
16
18
0.0 0.2 0.4 0.6 0.8 1.0
WD10
0
2
4
6
8
10
12
14
16
18
0.0 0.2 0.4 0.6 0.8 1.0
WD20
0
2
4
6
8
10
12
14
16
18
0.0 0.2 0.4 0.6 0.8 1.0
WD30
0
2
4
6
8
10
12
14
16
18
0.0 0.2 0.4 0.6 0.8 1.0
DW10
0
2
4
6
8
10
12
14
16
18
0.0 0.2 0.4 0.6 0.8 1.0
DW20
0
2
4
6
8
10
12
14
16
18
0.0 0.2 0.4 0.6 0.8 1.0
DW30
Figure 4-19: Temporal variation of the normalized flame height (blue) and normalized flame width (red) with
time for the multicomponent fuel droplets.

118
Figure 4-20: Ignition and flame initiation of the biodiesel/diesel blend droplets.
Contrariwise, flames surrounding the emulsion droplets have experienced sudden
decrease in the size – both height and width – midterm the droplet lifetime as shown in the
WD20 flame in Figure 4-19. This reduction in the luminous flame size is ascribed to the
instantaneous blow-off of the flame due to water vapour emission from the droplet by
puffing. This water vapour blows the soot – that gives the flame its luminosity – away
from the droplet so that the luminous flame height appears to be reduced. This flame blow-
off during droplet combustion has also been visualized and described by Teodorczyk and
Wojcicki [275] for droplet combustion under forced convection, Yao et. al., [235] for
droplet combustion in micro-tube, and Xu et. al., [130] during the combustion of
biodiesel/diesel blends. Once the effect of the vapour jet is retracted, soot accumulation
upstream resumes, and the flame retrieve its size as shown in Figure 4-21.
Figure 4-21: Flame size reduction during the combustion of WD20 emulsion fuel droplet.
Moreover, the puffing and secondary atomization has an effect on the shape and size
of the flame surrounding the burning droplet. Size wise, this effect appears in the spikes

119
shown on the flame width (red) lines in Figure 4-19, whereas the effect of these processes
on the shape of the flame is shown in Figure 4-22. As shown in the figure, the shape of the
flame surrounding the droplet is highly affected by the puffing, leading to relatively
considerable fluctuations in the size – especially the width – of the flame.
Figure 4-22: The effect of puffing on the shape of the flame surrounding the burning multicomponent fuel
droplets.
The intensity of puffing and its effect on flame shape ranges between the relatively
moderate puffing – such as the case of biodiesel/diesel blends – and the chaotic puffing
shown in the ethanol/diesel blends. Some of these spikes in the flame width lines of
Figure 4-19 are very intensive implying and reflecting a highly intensive puffing or
microexplosion. An example of these spikes is the case of ED30 fuel droplet. As explained
in the previous sections, the ED blend droplets show off a high degree of instability during
combustion due to the metastable structure of the blend. So, the flame size of the ED30
fuel droplet shown in Figure 4-19 reflects this instability. Some sample images of the
combustion of this droplet are shown in Figure 4-23.

120
Figure 4-23: The effect of droplet microexplosion on the shape of the flame surrounding an ED10 fuel
droplet.
Finally, since flame width is almost constant and is not affected by buoyancy, it
might be considered as the flame diameter. Especially, when compared with flame results
under zero gravity conditions, it shows a good similarity in shape and magnitude [301].
Accordingly, with the aid of droplet diameter variation and using the flame width as its
diameter, the flame stand-off ratio can be evaluated as the ratio of the flame width to the
droplet instantaneous diameter. Figure 4-24 shows the temporal variation of flame stand-
off ratio with time for neat diesel and neat biodiesel fuel droplets. The lines terminate when
the droplet completely evaporates, while the time represents the full time span from the
appearance of the luminous flame around the droplet to the complete flame extinction. As
the figure shows, the flame stand-off ratio of both diesel and biodiesel are increasing with
time. This is contrary to the D2-lw predictions shown in equation (2-6) which estimates the
flame stand-off ratio as a ratio of a constant quantity (the Spalding transfer number) to
another constant quantity (the stoichiometric fuel/air ratio), leading to the stand-off ratio
being constant despite the droplet size variation. However, the variable flame stand-off
ratio is reported by the majority of experimental work conducted on droplet combustion
such as [76,116,236], and is in agreement with the fuel accumulation principles [116]. It
can be shown from the figure also that the stand-off ratio of the biodiesel fuel droplet is
slightly higher than that of the diesel, which in turn results in the burning rate of the
biodiesel is expected to be less than that of the diesel fuel droplet [150]. This is in
agreement with the findings of Figure 4-3 that shows a lower burning rate of the biodiesel
droplet compared to the diesel droplet.

121
Figure 4-24: Flame stand-off ratio for neat diesel and neat biodiesel droplets.
Figure 4-25 shows the flame stand-off ratio variation with respect to the normalized
time for the multicomponent fuel droplets. The first row is for the biodiesel/diesel blends,
the second row is for the ethanol/diesel blends, while the third row is for the water-in-
diesel emulsions, and the fourth row is for the diesel-in-water emulsions, all of 10%, 20%,
and 30% volumetric concentrations of the added substance. The flame stand-off ratio of the
multicomponent fuels is shown to be similar to those of diesel and biodiesel both in
behaviour and magnitude. However, the fluctuations in the ratio are relatively higher, due
to the quite unstable combustion of the multicomponent fuel droplet compared to that of
the single-component fuel droplet. Additionally, some steep declines are noticed in the
case of the water-in-diesel emulsions and ethanol/diesel blends as shown by the regions
bounded by the red circles in Figure 4-25. These declines are due to the flame blow-off
effect discussed formerly. Due to this effect, the flame shrinks in width and move away
above the droplet as a result of the vapour jet release by puffing, this blow-off terminates
and the flame refrain its regular shape and dimensions when the effect of the vapour jet is
vanished.
0
2
4
6
8
10
12
14
16
18
0.0 0.2 0.4 0.6 0.8 1.0
Sta
nd
-Off
Rati
o
t/ttotal
Diesel
0
2
4
6
8
10
12
14
16
18
0.0 0.2 0.4 0.6 0.8 1.0
t/ttotal
Biodiesel

122
Figure 4-25: Flame stand-off ratio for biodiesel/diesel blend (1st row), ethanol/diesel blends (2nd
row),
water-in-diesel emulsions (3rd
row), and diesel-in-water emulsions (4th
row).
0
2
4
6
8
10
12
14
16
18
0.0 0.2 0.4 0.6 0.8 1.0
BD10
0
2
4
6
8
10
12
14
16
18
0.0 0.2 0.4 0.6 0.8 1.0
BD20
0
2
4
6
8
10
12
14
16
18
0.0 0.2 0.4 0.6 0.8 1.0
BD30
0
2
4
6
8
10
12
14
16
18
0.0 0.2 0.4 0.6 0.8 1.0
ED10
0
2
4
6
8
10
12
14
16
18
0.0 0.2 0.4 0.6 0.8 1.0
ED20
0
2
4
6
8
10
12
14
16
18
0.0 0.2 0.4 0.6 0.8 1.0
ED30
0
2
4
6
8
10
12
14
16
18
0.0 0.2 0.4 0.6 0.8 1.0
WD10
0
2
4
6
8
10
12
14
16
18
0.0 0.2 0.4 0.6 0.8 1.0
WD20
0
2
4
6
8
10
12
14
16
18
0.0 0.2 0.4 0.6 0.8 1.0
WD30
0
2
4
6
8
10
12
14
16
18
0.0 0.2 0.4 0.6 0.8 1.0
DW10
0
2
4
6
8
10
12
14
16
18
0.0 0.2 0.4 0.6 0.8 1.0
DW20
0
2
4
6
8
10
12
14
16
18
0.0 0.2 0.4 0.6 0.8 1.0
DW30

123
4.4 Summary
In the present chapter, a detailed analysis of the droplet macroscopic characteristics
during combustion is performed. The main objective of this chapter was to validate the
results of the present work and evaluate the main features of the droplet combustion for
providing quantitative data to the fuels under investigation.
Isolated droplet experiments are carried out for investigating the combustion of the
biodiesel/diesel blends, ethanol/diesel blends, water-in-diesel emulsions, and diesel-in-
water emulsions in addition to the three single-component fuels, namely diesel, biodiesel,
and ethanol.
In the start of the analysis, results validation is performed by comparing the
calculated burning rate constants of the three neat fuels with the corresponding values in
the published research works. Thereafter, the main characteristic parameters of droplet
combustion are presented for all the fuels under investigation. These included the burning
rate, droplet size evolution and fluctuation, and flame size.
The next chapters will concentrate on studying the liquid-phase processes occurring
during the combustion of the multicomponent fuel droplets. This study is divided into three
parts; the first part is the puffing, microexplosion, and secondary atomization during the
combustion of the multicomponent fuel droplets. The second part is the nucleation and
bubble generation during the combustion of multicomponent fuel droplets. And the third
part is the interactive two-droplet combustion of the multicomponent fuels. Hence, in the
next chapter, the first part of the liquid-phase analysis is performed.

124
Chapter 5. Puffing, Sub-Droplets Dynamics, and Micro-
Explosion during the Combustion of
Multicomponent Fuel Droplet
5.1 Introduction
The combustion of multicomponent fuel droplet is characterized by the occurrence of
puffing, secondary atomization leading to sub-droplets generation, and sometimes
microexplosion during the overall droplet lifetime. The initiation, development, and effect
of these processes on the multicomponent fuel droplet combustion need to be further
comprehended. Considering the microscopic size of the fuel droplets within the real spray,
studying these processes during spray combustion is quite challenging. Alternatively, these
processes can only be extensively investigated using an isolated fuel droplet undergoing
combustion. Magnified visualization of the droplet surface and the surrounding
environment during combustion will provide more in depth details about the occurrence of
puffing and microexplosion, and in turn sub-droplet generation due to secondary
atomization of the parent droplet. Although, these processes have been described in the
isolated droplet combustion studies as shown in Chapter Two. This description is based on
the consequent behaviour of the droplet combustion in response to the action of these
processes. However, a detailed experimental investigation of the droplet liquid phase
during combustion has not been reported.
Additionally, it is evidenced that some of these processes occur in a very short time
interval, such as the microexplosion that is stated to occur in less than 200 µs [4],
suggesting that the imaging rate should be higher than 5000 frames per second for the
proper tracking of the phenomenon. Therefore, high speed imaging is found to be
necessary for studying these physical processes.
Furthermore, in order to track the sub-droplets emitted from the parent droplet it is
required to cover a large area around the droplet. This in turn will affect the magnification
rate of droplet size image. Hence, in order to attain both droplet size magnification and
sub-droplet tracking at the same time, magnified shadowgraph imaging is more preferred
in this case than backlighting imaging. This is because the former ensures larger field of
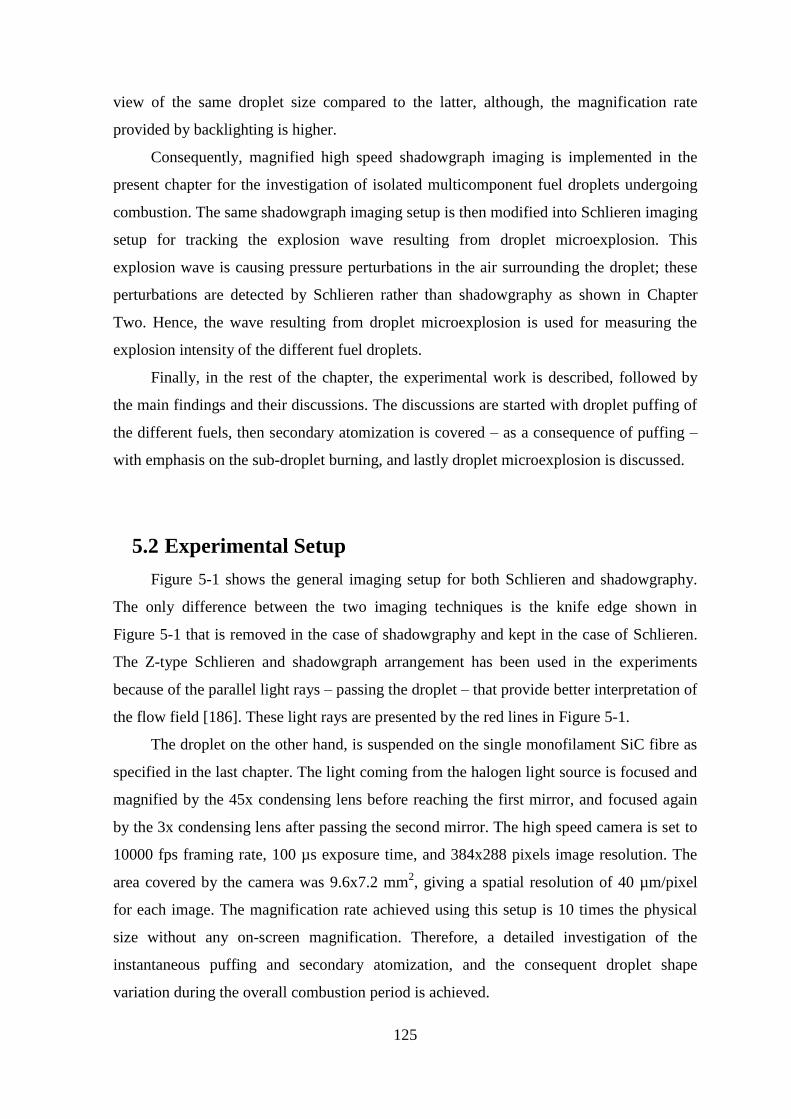
125
view of the same droplet size compared to the latter, although, the magnification rate
provided by backlighting is higher.
Consequently, magnified high speed shadowgraph imaging is implemented in the
present chapter for the investigation of isolated multicomponent fuel droplets undergoing
combustion. The same shadowgraph imaging setup is then modified into Schlieren imaging
setup for tracking the explosion wave resulting from droplet microexplosion. This
explosion wave is causing pressure perturbations in the air surrounding the droplet; these
perturbations are detected by Schlieren rather than shadowgraphy as shown in Chapter
Two. Hence, the wave resulting from droplet microexplosion is used for measuring the
explosion intensity of the different fuel droplets.
Finally, in the rest of the chapter, the experimental work is described, followed by
the main findings and their discussions. The discussions are started with droplet puffing of
the different fuels, then secondary atomization is covered – as a consequence of puffing –
with emphasis on the sub-droplet burning, and lastly droplet microexplosion is discussed.
5.2 Experimental Setup
Figure 5-1 shows the general imaging setup for both Schlieren and shadowgraphy.
The only difference between the two imaging techniques is the knife edge shown in
Figure 5-1 that is removed in the case of shadowgraphy and kept in the case of Schlieren.
The Z-type Schlieren and shadowgraph arrangement has been used in the experiments
because of the parallel light rays – passing the droplet – that provide better interpretation of
the flow field [186]. These light rays are presented by the red lines in Figure 5-1.
The droplet on the other hand, is suspended on the single monofilament SiC fibre as
specified in the last chapter. The light coming from the halogen light source is focused and
magnified by the 45x condensing lens before reaching the first mirror, and focused again
by the 3x condensing lens after passing the second mirror. The high speed camera is set to
10000 fps framing rate, 100 µs exposure time, and 384x288 pixels image resolution. The
area covered by the camera was 9.6x7.2 mm2, giving a spatial resolution of 40 µm/pixel
for each image. The magnification rate achieved using this setup is 10 times the physical
size without any on-screen magnification. Therefore, a detailed investigation of the
instantaneous puffing and secondary atomization, and the consequent droplet shape
variation during the overall combustion period is achieved.

126
Figure 5-1: Schematic of the z-type Schlieren imaging setup.
The investigated fuels are biodiesel/diesel blends, ethanol/diesel blends, water-in-
diesel emulsions, and diesel-in-water emulsions of 10%, 20%, and 30% volume content of
the additive to diesel, in addition to the neat diesel, biodiesel, and ethanol as the base
single-component fuels. The multicomponent fuel mixtures are prepared in the lab prior to
experiments and according to the methods described in Chapter Three. The images have
been stored in the (TIFF) format and processed using specially written Matlab algorithms.
The flowcharts of these algorithms are shown in Appendix (E).
5.3 Results and Discussion
Figure 5-2 shows two sample images for the droplet using shadowgraphy. The figure
shows how the start of combustion is easily recognized by the appearance of the sooty
flame. This flame appearance has been used for deciding the start of droplet lifetime and
combustion initiation.
Though, as the name of the chapter implies, and as explained in the introduction, the
three main characteristic parameters investigated in the present chapter are: droplet
puffing, sub-droplet dynamics, and droplet micro-explosion. These parameters are
discussed according to the sequence of occurrence with respect to the overall droplet
lifetime, starting with droplet puffing and ending with micro-explosion, but first, the
puffing behaviour in the single-component fuel droplets is highlighted.
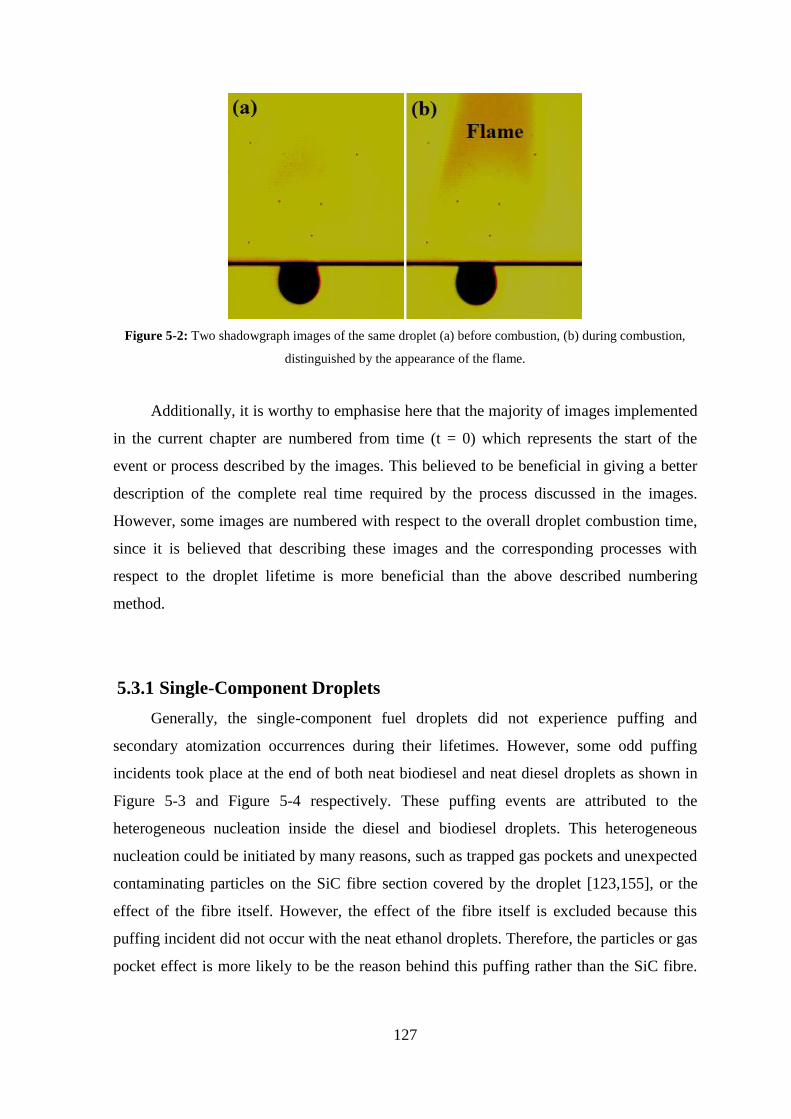
127
Figure 5-2: Two shadowgraph images of the same droplet (a) before combustion, (b) during combustion,
distinguished by the appearance of the flame.
Additionally, it is worthy to emphasise here that the majority of images implemented
in the current chapter are numbered from time (t = 0) which represents the start of the
event or process described by the images. This believed to be beneficial in giving a better
description of the complete real time required by the process discussed in the images.
However, some images are numbered with respect to the overall droplet combustion time,
since it is believed that describing these images and the corresponding processes with
respect to the droplet lifetime is more beneficial than the above described numbering
method.
5.3.1 Single-Component Droplets
Generally, the single-component fuel droplets did not experience puffing and
secondary atomization occurrences during their lifetimes. However, some odd puffing
incidents took place at the end of both neat biodiesel and neat diesel droplets as shown in
Figure 5-3 and Figure 5-4 respectively. These puffing events are attributed to the
heterogeneous nucleation inside the diesel and biodiesel droplets. This heterogeneous
nucleation could be initiated by many reasons, such as trapped gas pockets and unexpected
contaminating particles on the SiC fibre section covered by the droplet [123,155], or the
effect of the fibre itself. However, the effect of the fibre itself is excluded because this
puffing incident did not occur with the neat ethanol droplets. Therefore, the particles or gas
pocket effect is more likely to be the reason behind this puffing rather than the SiC fibre.
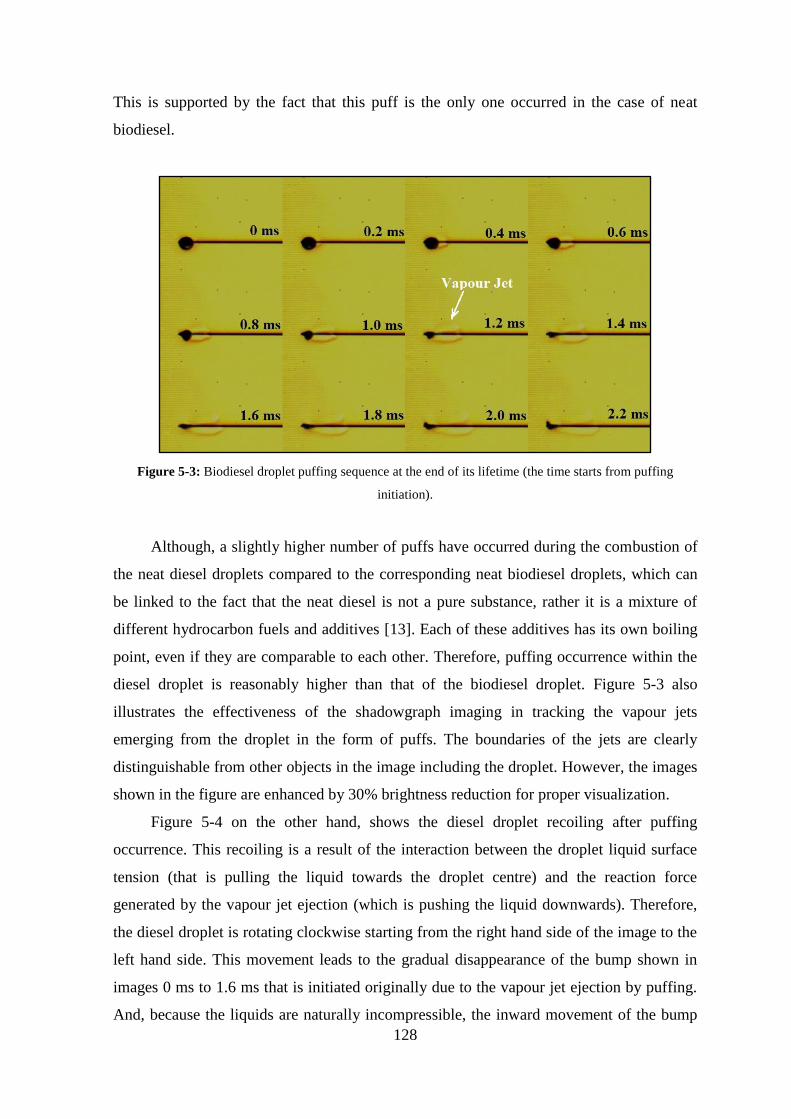
128
This is supported by the fact that this puff is the only one occurred in the case of neat
biodiesel.
Figure 5-3: Biodiesel droplet puffing sequence at the end of its lifetime (the time starts from puffing
initiation).
Although, a slightly higher number of puffs have occurred during the combustion of
the neat diesel droplets compared to the corresponding neat biodiesel droplets, which can
be linked to the fact that the neat diesel is not a pure substance, rather it is a mixture of
different hydrocarbon fuels and additives [13]. Each of these additives has its own boiling
point, even if they are comparable to each other. Therefore, puffing occurrence within the
diesel droplet is reasonably higher than that of the biodiesel droplet. Figure 5-3 also
illustrates the effectiveness of the shadowgraph imaging in tracking the vapour jets
emerging from the droplet in the form of puffs. The boundaries of the jets are clearly
distinguishable from other objects in the image including the droplet. However, the images
shown in the figure are enhanced by 30% brightness reduction for proper visualization.
Figure 5-4 on the other hand, shows the diesel droplet recoiling after puffing
occurrence. This recoiling is a result of the interaction between the droplet liquid surface
tension (that is pulling the liquid towards the droplet centre) and the reaction force
generated by the vapour jet ejection (which is pushing the liquid downwards). Therefore,
the diesel droplet is rotating clockwise starting from the right hand side of the image to the
left hand side. This movement leads to the gradual disappearance of the bump shown in
images 0 ms to 1.6 ms that is initiated originally due to the vapour jet ejection by puffing.
And, because the liquids are naturally incompressible, the inward movement of the bump

129
from the right produced a new bulge in the droplet surface on the left as shown in images
3.2 ms to 6.4 ms, which in turn is pulled inwards by the liquid surface tension. This action
and reaction continues until the droplet retains its original circular shape that it has before
puffing. The overall time required by the droplet to retain its shape was about 12 ms as
shown in Figure 5-4.
Figure 5-4: Diesel droplet recoiling sequence after puffing (the time starts at the end of puffing).
Furthermore, as it is mentioned above, the neat ethanol droplet did not experience
any vapour ejection during its overall lifetime. Instead, it suffered from very small size
sub-droplet ejections on the connection point with the SiC fibre as shown in Figure 5-5.
Figure 5-5: Sub-droplets emitted from a neat ethanol droplet.
These sub-droplet ejections are noticed to occur for diesel and biodiesel droplets, and
are taking place only on the fibre side (right hand side of the image) rather than the free
side (left side of the image). As discussed in Chapter Three and Chapter Four, the effect of

130
the fibre on the overall droplet burning rate is negligibly small, especially for the large size
droplets [281,282]. So, this small effect is appearing on the contact between the droplet
and the fibre, since the fibre temperature at that point is relatively higher than that of the
droplet surface, causing higher droplet heating and evaporation rates at that point
compared to the other regions of the droplet surface. Local boiling of the droplet surface at
that point may also take place. This is because the droplet surface is already slightly below
the boiling point of the fuel [267], so with the local heat gain from the fibre at that point,
the droplet may experience local film boiling or the Leidenfrost effect. This is in
agreement with the micro-convection and vortex-like soot flow in the droplet-fibre
connection zone described by Liu et. al., [281]. However, these micron-size sub-droplets
are very tiny in size compared to the parent droplet, and occurring at a relatively low rate
compared to the overall fuel droplet lifetime, therefore, it is believed that the effect of these
sub-droplets, and in a broader sense, the effect of the fibre on the overall droplet
combustion is negligibly small.
With the puffing behaviour of the neat fuels being clarified and discussed, it is time
now to continue the discussions with the puffing occurrence within the multicomponent
fuel droplets.
5.3.2 Multicomponent Fuel Droplet Puffing Dynamics
Generally, the droplets of all the multicomponent fuel mixtures studied in the present
work have experienced puffing and secondary atomization. The puffing incidents are
shown to occur over the entire droplet lifetime. The number and intensity of these puffs are
variable for each type of the multicomponent fuel mixtures. The biodiesel/diesel blends
have shown the least number of puffs compared to the other mixtures that were relatively
comparable to each other. Furthermore, some of the water-in-diesel and diesel-in-water
emulsion droplets have suffered microexplosion before undergoing complete evaporation
as it is discussed in Chapter Four. This in turn, have resulted in the emulsion droplets
experiencing high number of puffs along a short period of time, resulting in higher puffing
rates compared to the droplet of the biodiesel/diesel and ethanol/diesel blends.
Additionally, despite the type of fuel mixture, almost all the droplets shared the same
sequence of events before and during puffing. These events are shown in Figure 5-6 for
puffing from an ED20 fuel droplet.

131
Figure 5-6: Temporal sequence of an ED20 droplet size change before and during puffing.
The first sign of puffing occurrence is the droplet size increase as shown in the
images corresponding to time periods 741 ms to 747 ms in Figure 5-6 compared to time
periods 739 ms and 740 ms. This increase in diameter is evaluated to be from 1.5 mm on
739 ms to 1.8 mm on 747 ms, which means about 20% of the droplet instantaneous
diameter. This droplet size increase is attributed to the bubble growth inside the droplet
prior to puffing [125,130]. This bubble continues pushing the thin layer of the droplet
surface outwards from inside until the moment when the droplet surface cannot withstand
this force, so the droplet raptures locally and the vapour contained in the bubble emerges
outside in the form of a jet as shown by the white spray emerging from the droplet in
Figure 5-6 images 748 ms to 750 ms respectively. The release of the vapour from the
droplet causes sudden size reduction and shape deformation of the burning droplet as
shown in images 749 ms to 756 ms compared to images 741 ms to 747 ms. To this point,
vapour ejection by puffing is complete. However, different processes will take place within
the droplet subsequent to the puffing incident according to the puffing strength [158]. If the
puff is weak, the droplet will retain its original shape and size after a short period of
recoiling as happened to the diesel droplet shown in Figure 5-4. But, if the puff is strong,
ligament detachment from the droplet surface leading to sub-droplet generation will take
place as shown in images 751 ms to 756 ms in Figure 5-6 for the ED20 fuel droplet, and
Figure 5-7 for the WD10 fuel droplet. In the former, the puffing occurrence gave rise to
four sub-droplets that are ejected from the droplet subsequently, whereas in the latter,
many sub-droplets are generated and emitted away from the droplet as a result of a strong
puff.
The mechanism by which ligament detachment takes place will be further discussed
in Chapter Six. But, it should be emphasised here that prior to sub-droplet ejection, the
parent droplet is found to encounter a certain shape change that may be linked to the

132
strength of the puff and in turn, to the size of the bubble triggering that puff. An example
of this shape variation is shown in Figure 5-7 (image 0.8 ms and the followings). As shown
in these images, droplet necking takes place on the droplet/fibre contact region, this
necking occurred just after the vapour release. This implies that this necking is a result of
the vacuum created on the droplet section near its surface due to vapour release by puffing.
To fill up this vacuum and to compensate for the released vapour, droplet edges moved
inwards creating this neck. This necking and inward movement may enhance sub-droplet
evolution from the parent droplet by the impact of the oppositely moving droplet edges in
one hand, and the decrease in sub-droplet ejection area and the resulting increase in the
ejection velocity in the other hand. The effect of this necking can be shown by the
relatively large number of sub-droplets emerged from the parent droplet during the same
puffing incident.
Figure 5-7: WD10 droplet necking prior to puffing and the resulted multiple sub-droplets subsequent an
intense puffing incident.
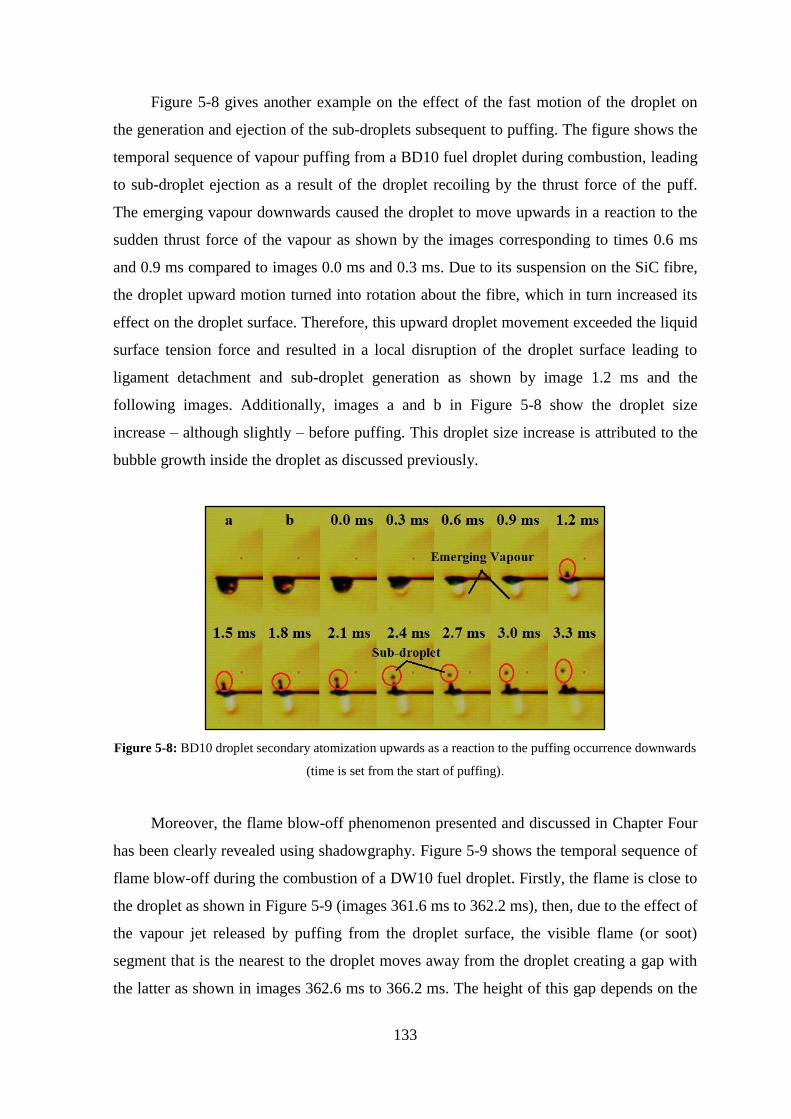
133
Figure 5-8 gives another example on the effect of the fast motion of the droplet on
the generation and ejection of the sub-droplets subsequent to puffing. The figure shows the
temporal sequence of vapour puffing from a BD10 fuel droplet during combustion, leading
to sub-droplet ejection as a result of the droplet recoiling by the thrust force of the puff.
The emerging vapour downwards caused the droplet to move upwards in a reaction to the
sudden thrust force of the vapour as shown by the images corresponding to times 0.6 ms
and 0.9 ms compared to images 0.0 ms and 0.3 ms. Due to its suspension on the SiC fibre,
the droplet upward motion turned into rotation about the fibre, which in turn increased its
effect on the droplet surface. Therefore, this upward droplet movement exceeded the liquid
surface tension force and resulted in a local disruption of the droplet surface leading to
ligament detachment and sub-droplet generation as shown by image 1.2 ms and the
following images. Additionally, images a and b in Figure 5-8 show the droplet size
increase – although slightly – before puffing. This droplet size increase is attributed to the
bubble growth inside the droplet as discussed previously.
Figure 5-8: BD10 droplet secondary atomization upwards as a reaction to the puffing occurrence downwards
(time is set from the start of puffing).
Moreover, the flame blow-off phenomenon presented and discussed in Chapter Four
has been clearly revealed using shadowgraphy. Figure 5-9 shows the temporal sequence of
flame blow-off during the combustion of a DW10 fuel droplet. Firstly, the flame is close to
the droplet as shown in Figure 5-9 (images 361.6 ms to 362.2 ms), then, due to the effect of
the vapour jet released by puffing from the droplet surface, the visible flame (or soot)
segment that is the nearest to the droplet moves away from the droplet creating a gap with
the latter as shown in images 362.6 ms to 366.2 ms. The height of this gap depends on the

134
intensity and penetration of the vapour jet, and it has been evaluated for the case shown in
Figure 5-9 and found to be 2.5 mm from the position of the fibre. This gap decreased again
and soot accumulation resumed once the effect of the vapour is vanished as shown in
images 368.0 ms to 369.8 ms. This visible flame blow-off phenomenon has been found to
occur during the combustion of the water-in-diesel and diesel-in-water emulsion droplets
rather than the biodiesel/diesel and ethanol/diesel blends. This suggests that the intensity of
the puffs resulting from the emulsion droplets is higher than those of the corresponding
blend droplets.
Figure 5-9: Flame blow-off subsequent to vapour jet puffing from a DW10 droplet.
Furthermore, the maximum penetration of the vapour jet is found to be variable, and
is a function of the size of the growing bubble within the droplet [153]. This penetration is
expressed in terms of the droplet instantaneous radius prior to puffing, and is found to
range from a fraction of the droplet radius, as shown in Figure 5-7, to several droplet radii,
as shown in Figure 5-10. The figure shows the tip penetration and shape of the vapour jet
emerged from an ED10 fuel droplet during combustion. As shown by the figure, the
maximum tip penetration of the vapour jet is more than five times the instantaneous droplet
radius prior to puffing. However, this value of the jet penetration is not the average range
of the vapour jets emerging from the ED10 droplets; rather it is the maximum value. For

135
that reason, and for characterizing the puffing intensity of the multicomponent fuel
mixtures during droplet combustion, the average penetration distance of the vapour jet
emerged by droplet puffing is calculated. Another advantage of the vapour penetration
calculation is that it describes more the puffing intensity rather than the number of puffs
per droplet lifetime. This is because as mentioned earlier, the difference in droplet lifetime
between the blends and emulsions – due to emulsion droplets microexplosion – and the
difference in droplet instantaneous diameter will result in a non-realistic description of the
puffing rate.
Figure 5-10: Puffing occurrence during the ED10 droplet combustion with an illustration to the shape of the
vapour (time is set from the start of puffing).
Additionally, the calculated puffing rate will not be practically worthwhile because,
the real droplets in the liquid fuel sprays are order of magnitudes less than the ones studied

136
in the present work, in addition to the lifetime of the real droplet is much less than that of
the one studied in-lab. Hence, it is more practically beneficial to evaluate the effect of
these puffs firstly, on the neighbouring droplets, and secondly, on the overall spray
configuration. Hence the average effective distance – or penetration – of these puffs and
the average vapour jet velocity have been evaluated for all the multicomponent fuels and
shown in Figure 5-11 against the concentration of the added components (water, biodiesel,
and ethanol) to the overall mixture volume. The vapour jet penetration is normalized by the
droplet instantaneous radius to give a non-dimensional characterization of the distance.
The presented penetration in Figure 5-11 is the average value of all the puffs for each fuel
droplet. The average puffing velocity, on the other hand, has been evaluated by dividing
the max penetration in millimetre by the total time required in millisecond. The average of
all the velocity values calculated from every puffing incident has been evaluated and
presented for every multicomponent fuel.
Figure 5-11: The effect of water, biodiesel, and ethanol concentrations on the average vapour (a) normalized
vapour penetration, (b) puffing velocity from the burning multicomponent fuel droplets.
As shown in Figure 5-11(a), the average normalized penetration is proportional to the
concentration of the added component (whether it is water, biodiesel, or ethanol), so it is
increasing by the increase of additive concentration in the fuel mixture for both blends and
emulsions. However, this penetration distribution needs to be further comprehended
because from the first look it does not interpret the real conditions of the multicomponent
fuel droplets. From the figure it may be implied that the BD blend droplets are the ones
with the highest penetration and the DW emulsion droplets are the ones with the lowest. In
0
1
2
3
4
5
6
0 10 20 30 40
Aver
ag
e N
orm
ali
zed
Pen
etra
tion
Additive Content (%)
(a) WD DW BD ED
0.0
0.1
0.2
0.3
0.4
0.5
0.6
0.7
0 10 20 30 40
Aver
ag
e P
uff
ing
Vel
oci
ty (
m/s
)
Additive Content (%)
(b) WD DW BD ED

137
fact, the BD droplets are shown to have the lowest puffing rate among all the
multicomponent fuels. But, what is shown by Figure 5-11(a) is the vapour penetration
normalized by the droplet instantaneous diameter as mentioned earlier. So, in the case of
the BD droplets, firstly the droplet undergoes complete evaporation, and secondly, the
puffs take place at the final stages of the droplet lifetime when the droplet diameter is
relatively small. Therefore, the resulting penetration to droplet diameter is comparatively
high. This is exactly the opposite scenario in the case of the DW droplets. The DW droplet
consistently explodes before complete evaporation, and the puffing takes place with the
droplet instantaneous diameter is relatively large, so that the resulting normalized
penetration is slightly small. The WD emulsions and ED blends on the other hand, have
experienced both situations, where complete evaporation takes place in both mixture
droplets, and puffing rate is higher and it occurs slightly earlier than that of the BD
droplets.
Additionally, it is worthy to mention that the shadowgraph imaging method
implemented in the present work provides a 2-D (rather than 3D) visualization of the
testing section; and the depth of the testing section is not possible. Therefore, the vapour
penetration is only tracked in the xy axes without the z-axis. Hence, any inclination in the
direction of the puff cannot be detected. This in turn, may have an effect on the net values
of the vapour penetration distance which should be divided by the sine of the inclination
angle in the z-direction for obtaining the true value. This inclination angle could be any
value from 1º to 89º resulting in a wide range of angle sine values. Thus, the obtained
penetration values are more in the qualitative – rather than quantitative – denomination.
Figure 5-11(b) on the other hand, interprets well the real puffing condition, where the
WD and ED puffs are faster than those resulting from the DW and BD droplets. As shown
by the figure, the average vapour ejection velocity is also increasing with the increase of
additive concentration in the multicomponent fuel mixture for all the fuels. As mentioned
earlier, this velocity is evaluated according to the total time required by the vapour jet to
reach its maximum penetration. However, the initial discharge velocity has also been
evaluated and its values are found to be ten times the average velocity shown in
Figure 5-11(b). These calculated velocity ranges are in agreement with the 5 m/s discharge
velocity reported by Miglani, Basu, and Kumar [153] for water-ethanol mixtures, but less
than the predicted values by Shinjo et. al., [158] for the velocity of a vapour emerging from
a decane/ethanol droplet. The obtained values for the ethanol/diesel droplets – which are
the most comparable mixtures to the decane/ethanol mixture – are in the range of 0.5 to 0.6
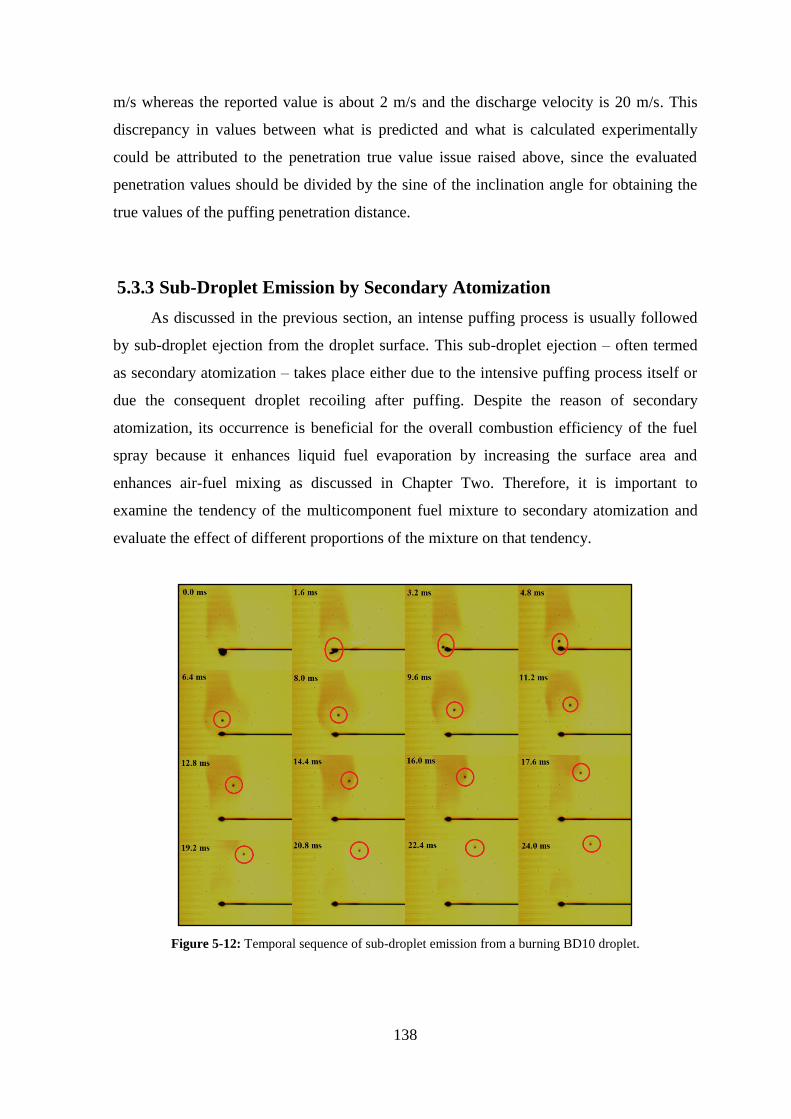
138
m/s whereas the reported value is about 2 m/s and the discharge velocity is 20 m/s. This
discrepancy in values between what is predicted and what is calculated experimentally
could be attributed to the penetration true value issue raised above, since the evaluated
penetration values should be divided by the sine of the inclination angle for obtaining the
true values of the puffing penetration distance.
5.3.3 Sub-Droplet Emission by Secondary Atomization
As discussed in the previous section, an intense puffing process is usually followed
by sub-droplet ejection from the droplet surface. This sub-droplet ejection – often termed
as secondary atomization – takes place either due to the intensive puffing process itself or
due the consequent droplet recoiling after puffing. Despite the reason of secondary
atomization, its occurrence is beneficial for the overall combustion efficiency of the fuel
spray because it enhances liquid fuel evaporation by increasing the surface area and
enhances air-fuel mixing as discussed in Chapter Two. Therefore, it is important to
examine the tendency of the multicomponent fuel mixture to secondary atomization and
evaluate the effect of different proportions of the mixture on that tendency.
Figure 5-12: Temporal sequence of sub-droplet emission from a burning BD10 droplet.

139
Figure 5-12 shows the temporal sequence of sub-droplet emission from a BD10 fuel
droplet during combustion. This sub-droplet is produced subsequent to droplet recoiling
after puffing. The size of the sub-droplet is found to be 0.2 mm whereas the size of the
parent droplet prior to secondary atomization is 0.42 mm. The trajectory of the sub-droplet
is tracked by the aid of image processing using Matlab. This trajectory is reconstructed and
shown in Figure 5-13(a). Using the length of this trajectory and the time required for the
sub-droplet to pass it, the flow velocity of the sub-droplet is evaluated and found to be 0.26
m/s which is in the same range with the puffing velocity of the vapour jet shown in
Figure 5-11(b) for BD10.
Figure 5-13: Samples of the reconstructed trajectories of single ((a) and (b)) and three (c) sub-droplets
ejected from different burning fuel droplets undergoing secondary atomization.
Additionally, as shown in Figure 5-13(c), sometimes multiple sub-droplets are ejected
from the droplet surface at the same time. However, the size and velocity of the emerging
sub-droplets are not necessarily the same. Sometimes, the emerging sub-droplet is entirely
small so that it will evaporate completely once ejected from the droplet surface, such as the
sub-droplets emerging from the WD10 fuel droplet shown in Figure 5-7. While, in some
instants, the sub-droplet is quite large in size so that it may ignite before undergoing
complete evaporation, and in some extreme cases, it may withstand its own surrounding
flame for a period of time, such as the sub-droplet shown in Figure 5-14. The sub-droplet
shown in Figure 5-14 is initially large in size, and once it left the parent droplet, heating
and ignition took place as shown in image 6.9 ms. Due to the motion of the sub-droplet, the
flame takes the form of an elongated wake behind the sub-droplet. Another evidence of the
sub-droplet large size is its relatively heavy weight that exceeded the buoyancy force

140
making the sub-droplet to fall by the effect of gravity as shown in images 16.1 ms and the
followings.
Figure 5-14: Sub-droplet combustion after ejection from a BD10 fuel droplet (time is set from the sub-
droplet detachment from the parent droplet).
Likewise the size of the sub-droplets ejected by secondary atomization, the number
of these sub-droplets is also important. Despite the fact that the parent droplets under
investigation are larger than the real spray droplets. The number of sub-droplets gives an
indication of the tendency of the fuel to secondary atomization. Therefore, an algorithm
has been developed for counting the number of sub-droplets emitted per incident and the
occurrence time, and then the total number of these sub-droplets from the shadowgraph
images of the droplets undergoing combustion. The flowchart of this algorithm is sown in
Appendix (E), and its execution has been carried out using Matlab.
Figure 5-15 shows the total number of sub-droplets ejected during the overall droplet
lifetime for the water-in-diesel and diesel-in-water emulsions, in addition to the
biodiesel/diesel and ethanol/diesel blends at all the three proportions 10%, 20%, and 30%
additive concentration in the overall mixture volume. As the figure shows, a relatively
large variation of the total sub-droplets number is obtained between the four fuel mixtures.
Therefore, a logarithmic scale is used for presenting the data in a more comparable
configuration. It can be seen from the figure that the number of sub-droplets generated by
secondary atomization is proportional to the concentration of both water and biodiesel in
the cases of WD emulsions and BD blends, while it is inversely proportional to the water
and ethanol concentrations for the DW emulsions and ED blends respectively. This
secondary atomization is an indirect consequence of the nucleation inside the droplet

141
[158]. Bubble nucleation inside the droplet leads to puffing, and puffing is often followed
by secondary atomization. Hence, the change in the mixtures trend for secondary
atomization may be associated to the bubble nucleation and growth rates within the
droplet. It can be noticed also, that despite the difference in values between the mixtures,
some similarity in trends is obtained between each two pairs of them. The sub-droplets
number in the WD emulsions and the BD blends is shown to increase by increasing the
concentrations of both water and biodiesel respectively in the mixture. Exactly the opposite
is noticed to occur for the DW emulsions and the ED blends. These different behaviours
are sequentially explained.
Figure 5-15: The effect of additive (water, biodiesel, and ethanol) concentration on the number of sub-
droplets emitted during the overall droplet lifetime of the multicomponent fuel mixtures.
Firstly, regarding the BD blends, both diesel and biodiesel have relatively high
boiling points and these boiling points are close to each other despite that of the biodiesel
is higher than the boiling point of the diesel as shown in Appendix (B). This low boiling
point difference between the BD blend components is not available for the ED, WD, and
DW fuel mixtures; therefore, they have experienced higher rates of secondary atomization
compared to the BD blends. It is established on the other hand, that the nucleation and
bubble growth rate within the liquid-phase of the multicomponent fuel mixture is a
function of the boiling point difference between the different components of the mixture
[123]. Therefore, this low boiling point difference resulted in lower nucleation rates within
the BD fuel droplets and in turn, lower secondary atomization rates. Additionally, the
1
10
100
1000
10000
0 10 20 30 40
Log
(S
ub
dro
ple
ts Q
uan
tity
/Lif
etim
e)
Additive Content (%)
WD DW BD ED

142
nucleation rate inside the multicomponent fuel droplet is influenced by the density ratio
between the dispersed phase and the continuous phase. The bubble nucleation and growth
rate within the droplets of the multicomponent fuel mixtures depends on the densities of
the constituents forming the mixture [260]. This is because bubble growth from a higher
density liquid to a lower density liquid is certainly different from bubble growth from
lower density component to a higher density component. Bubble growth towards the lower
density component suggests higher nucleation and growth rates due to the less resistance to
the bubble growth, while bubble growth towards the higher density components is
suggesting a decrease in the nucleation rate because of the increased resistance to the
bubble growth due to the high density of the liquid. Thus for the BD blends, biodiesel is
the higher density and higher boiling point component, while diesel is the lower density
and lower boiling point component as shown in Appendix (B). Hence, it is expected that
the diesel is the constituent undergoing superheated boiling and nucleation, and that bubble
growth will take place from diesel to biodiesel. This means bubble growth towards a
higher density liquid, suggesting a relatively low rate of nucleation. However, increasing
the biodiesel concentration in the blend increased the secondary atomization rate, implying
a higher nucleation rate, which is true, but this increased rate of secondary atomization is
attributed to increasing the nucleation sites within the droplet by increasing the biodiesel
concentration due to the increase in the interference regions between diesel and biodiesel.
Figure 5-16: Sample images of the large sub-droplets ejected from the ED fuel droplets.
Secondly, regarding the secondary atomization in the ED blends, the scenario is
slightly different from that of the BD blends. The boiling point of ethanol is much less than

143
that of diesel, and the density also is slightly lower. Therefore, in the case of a burning ED
fuel droplet, it is expected that ethanol will ignite first due to its higher volatility and lower
boiling point, resulting that the diesel will suffer the superheated boiling as in the case of
the BD blends. But, the density of ethanol is less than that of the diesel; therefore,
nucleation and bubble growth is higher due to the lower resistance of the ethanol to bubble
nucleation. This high growth rate within the ED droplets is reflected on the size of the sub-
droplets ejected from the parent droplet, the majority of these sub-droplets are of relatively
large sizes – in fact they are the largest among the other fuel mixtures – so they are more in
the form of large ligaments rather than small sub-droplets as shown in Figure 5-16.
Moreover, it is noticed that increasing the ethanol concentration in the blend resulted
in a slight change in the sub-droplet ejection behaviour of the droplet. For the ED10
droplets, multiple sub-droplets are ejected per single incident. The number of these sub-
droplets is shown to decrease and their sizes increase when the ethanol concentration is
increased. Therefore, in the ED30 case, a single, large sub-droplet is ejected per incident
rather than multiple, small sub-droplets. Thus, the number of sub-droplets is shown to be
inversely proportional to the ethanol concentration on Figure 5-15.
Thirdly, regarding the WD and DW emulsions, both of the emulsions have
experienced a significant increase in the sub-droplet ejection processes. This suggests
higher nucleation rates compared to the BD and ED blends. This high nucleation rate of the
emulsions compared to the blends has also been described by Lasheras, Fernandez-Pello,
and Dryer [123] and is attributed to the large specific volume change of water in the
emulsion droplet compared to the components of the blends, in addition to the wide
dispersion of water droplets in the emulsion mixture compared to the blends, this in turn,
results in higher number of nucleation sites initiation within the emulsion mixture at the
same time compared to the blends. These two main parameters led to higher nucleation
rates and consequently higher secondary atomization rates from the water-in-diesel and
diesel-in-water emulsion droplets compared to the biodiesel/diesel and ethanol/diesel
blends. Nevertheless, increasing the water concentration in the emulsions had different
effects on the rate of sub-droplet generation from both the WD and DW emulsions as
shown in Figure 5-15. The sub-droplet emission rate is shown to increase in the WD
emulsions and decrease in the DW emulsions with increasing the water concentration. Sub-
droplet generation rate escalation due to increasing the water concentration is expected
because of augmenting the nucleation sites by increasing water droplets in the emulsion.
But, the decrease in sub-droplet generation shown in the DW emulsions is the unexpected

144
behaviour. This could be attributed to the effect of surfactant used for emulsion
preparation. Because the type of surfactant is the only difference between the WD and DW
emulsions, especially with the volume fractions of the constituents are the same. The effect
of surfactant weakens with the increase of the emulsion temperature [171]. Therefore,
water/diesel separation, and in turn, water coagulation in the centre of the droplet will take
place making the droplet to burn in a single-component-like mode rather than
multicomponent combustion. This water coagulation is expected to escalate by increasing
the water concentration in the emulsions because the same quantity of surfactant is used for
all the emulsions, hence, its effect is decreasing with the increase of water volume because
of the increased interfacial regions within the emulsion droplet by the increase of water
concentration. This water coagulation, then, is the effective parameter in decreasing the
number of sub-droplet generation due to nucleation rate decrease [302]. This water
coagulation is more revealed during the droplet microexplosion analysis in the next
section. However, explosive boiling in the heart of the droplet will continue to occur due to
the availability of water.
The same trends of Figure 5-15 are shown in Figure 5-17 which illustrates the effect
of added liquid (water, biodiesel, and ethanol) concentrations on the net portion of
secondary atomization time compared to the overall droplet lifetime.
Figure 5-17: The effect of additive (water, biodiesel, and ethanol) concentration on the net portion of the
secondary atomization with respect to the overall droplet lifetime.
0.01
0.10
1.00
10.00
0 10 20 30 40
Log
(Port
ion
of
Dro
ple
t L
ifet
ime
(%))
Additive Content (%)
WD DW BD ED

145
Figure 5-17 represents the ratio of the total period of time (evaluated in µs) where
secondary atomization takes place to the total droplet lifetime (also evaluated in µs), to
compare the sub-droplet ejection portion with respect to the overall droplet lifetime. The
figure has also been presented in the logarithmic form due to the broad difference in
magnitudes between the emulsion droplets and those of the blends. As the figure shows,
the secondary atomization portion of the droplet lifetime for the BD and ED blends is quite
small; in fact it is in the order of O(10-2
) in the case of the BD blends and O(10-1
) in the
case of the ED blends compared to the overall droplet lifetime. Whereas, it is in the order
of O(1) in the cases of WD and DW emulsions. This suggests that the secondary
atomization portion of time represents an infinitesimally small percentage of the overall
droplet lifetime. However, this small percentage is important for enhancing fuel
evaporation and increasing fuel-air mixing. Thus, increasing this portion of time is
important as well. Additionally, as it is discussed above, the figure shows that this portion
of time is proportional with the volume fractions of both water and biodiesel in the WD
emulsions and BD blends respectively, and is inversely proportional to the volume
fractions of water and ethanol in the DW emulsions and ED blends respectively.
Furthermore, in spite of its small percentage in the droplet lifetime, secondary
atomization of the multicomponent fuel droplet is found to occur at certain intervals of this
lifetime. Hence, these intervals may represent the best occurrence probability for droplet
secondary atomization of each fuel. Thus, Figure 5-18 shows the secondary atomization
occurrence probability with respect to the droplet lifetime for all the multicomponent fuel
mixtures under investigation. Generally, the figure shows that each of the four mixtures is
following a certain atomization trend that is different from the other mixtures. And that this
trend is responsive to the increase of the additive in that mixture.
For the biodiesel/diesel blends shown in the first row of Figure 5-18, it can be seen
that the droplet secondary atomization is more likely to start after the first 20% of the
droplet lifetime after the heating up period described in Chapter Four. And that its
maximum occurrence probability is shifting from the early 30% for BD10 forwards to
midterm the droplet lifetime for the BD20 and BD30 blends. This suggests that the peak
sub-droplet population is increasing with increasing the biodiesel concentration in the
blends. This sub-droplets proportionality with concentration is shown also in the case of
the ethanol/diesel blends in the second row of Figure 5-18. For these blends, the secondary
atomization is shown to take place after the first 10% of the droplet lifetime, so it is
slightly earlier than that of the BD blends.

146
Figure 5-18: Sub-droplet ejection probability (%) – y-axis – with respect to the normalized droplet lifetime –
x-axis – for biodiesel/diesel blends (1st row), ethanol/diesel blends (2
nd row), water-in-diesel emulsions (3
rd
row), and diesel-in-water emulsions (4th
row).
0
10
20
30
40
50
60
0.0 0.2 0.4 0.6 0.8 1.0
BD10
0
10
20
30
40
50
60
0.0 0.2 0.4 0.6 0.8 1.0
BD20
0
10
20
30
40
50
60
0.0 0.2 0.4 0.6 0.8 1.0
BD30
0
10
20
30
40
50
60
0.0 0.2 0.4 0.6 0.8 1.0
ED10
0
10
20
30
40
50
60
0.0 0.2 0.4 0.6 0.8 1.0
ED20
0
10
20
30
40
50
60
0.0 0.2 0.4 0.6 0.8 1.0
ED30
0
10
20
30
40
50
60
0.0 0.2 0.4 0.6 0.8 1.0
WD10
0
10
20
30
40
50
60
0.0 0.2 0.4 0.6 0.8 1.0
WD20
0
10
20
30
40
50
60
0.0 0.2 0.4 0.6 0.8 1.0
WD30
0
10
20
30
40
50
60
0.0 0.2 0.4 0.6 0.8 1.0
DW10
0
10
20
30
40
50
60
0.0 0.2 0.4 0.6 0.8 1.0
DW20
0
10
20
30
40
50
60
0.0 0.2 0.4 0.6 0.8 1.0
DW30

147
This trend is in agreement with what is found by Miglani, Basu, and Kumar [153] for
bubble generation within the ethanol multicomponent mixtures.
The third row of Figure 5-18 shows the secondary atomization occurrence
probability for the water-in-diesel emulsions. Secondary atomization in this mixture is
slightly different from those of the BD and ED blends. It starts after the first 10% of the
droplet lifetime and continues to increase with time until reaching its peak slightly before
the end of the droplet lifetime. This is the same trend as those of the diesel-in-water
emulsion droplets shown in the fourth row. This continuous increase in secondary
atomization indicates the high degree of nucleation within the liquid-phase of the droplet
compared to the blends. Especially, when the droplet diameter decreases with time. This is
in agreement with the onset rate distribution of secondary atomization obtained by Tsue et.
al., [171] for n-dodecane/water and n-tetradecan/water emulsions.
Figure 5-18 shows also that except the probability shift shown in the blends, the
concentration of the additive (water, biodiesel, and ethanol) have no effect on the
secondary atomization occurrence probability along the droplet lifetime. However, for the
samples analysed, the starting time of secondary atomization is shown to be responsive to
the concentrations. This is illustrated clearly in Figure 5-19 which demonstrates the total
interval of time between the first and final occurrences of droplet secondary atomization
for all the multicomponent fuel mixtures under investigation. This figure gives an
overview about the sub-droplet emission trend for every fuel.
Figure 5-19: The portion of the total secondary atomization period with respect to the overall droplet lifetime
for all the multicomponent fuel mixtures under investigation.
0
10
20
30
40
50
60
70
80
90
100
BD10 BD20 BD30 ED10 ED20 ED30 WD10 WD20 WD30 DW10 DW20 DW30
Dro
ple
t L
ifet
ime
(%)

148
From Figure 5-19 it can be seen that the emulsion fuel droplets are experiencing secondary
atomization along almost the whole period of their lifetimes, whereas secondary
atomization of the blend fuel droplets constitutes half of that period in average. This is
attributed to the higher nucleation rate within the liquid-phase of the emulsion droplets
compared to that of the blend droplets. Furthermore, it can be noticed from Figure 5-19
that the secondary atomization in the emulsion droplets almost lasts to the end of the
droplet lifetime. This is because the emulsion droplets usually do not undergo complete
evaporation; instead droplet microexplosion takes place fragmenting the droplet into
smaller size sub-droplets. This phenomenon did not occur during the combustion of the
biodiesel/diesel and ethanol/diesel blends, so that secondary atomization from the droplets
of these mixtures does not last to the end of the droplet lifetime. This emulsion droplet
microexplosion has been further investigated in the next section for acquiring more insight
information to help comprehending this phenomenon that is associated to the combustion
of the emulsion fuel droplets.
5.3.4 Emulsion Droplet Microexplosion
Most of the emulsion droplets prepared and tested in the present work have endured
microexplosion before complete evaporation of the liquid-phase. This explosion is
attributed to the explosive boiling of the water droplets inside the emulsion droplet [143].
Although, it is reported that the time scale required for this explosion is longer than
the time scale available for the real spray combustion [151,161]. But, as shown by
Figure 5-20, the ejected sub-droplet have experienced microexplosion causing its
fragmentation and evaporation after 4.33 ms of ejection. The sub-droplet initial diameter
and explosion diameter are calculated to be 45 µm and 31 µm respectively. These
diameters are comparable to the diameter range of the real spray droplets. Thus, comparing
the combustion time values evaluated in Table 2-2 in Chapter Two with the time required
by the sub-droplet shown in Figure 5-20 it can be inferred that in the real combustion
applications – such as the internal combustion engine – there is enough time for the real
spray droplets to undergo heating, phase separation, and complete microexplosion, even at
low possibilities. Therefore, further investigation of droplet microexplosion is required for
comprehending the current understanding of this phenomenon.

149
Figure 5-20: The temporal evolution of sub-droplet ejection from a WD10 emulsion droplet illustrating the
sub-droplet microexplosion after a period of time (time is set from the sub-droplet detachment).
However, in spite of the enhanced visualization of the droplet surface and the
associated processes such as puffing and secondary atomization – as shown in the previous
sections – the shadowgraph imaging method implemented in the present investigation did
not provide the proper tracking images of the explosion even with the high framing rate
used during experimentation. Therefore, the same shadowgraph setup has been modified
and turned into Schlieren system by the introduction of a sharp knife edge between the
second mirror and the condensing lens as shown in Figure 5-1. Accordingly, a density
difference is created across the knife edge increasing the possibility of visualizing the flow
of air within the imaging section. This in turn, gave the privilege of tracking the effect of
droplet microexplosion on the surrounding air as shown in Figure 5-21.
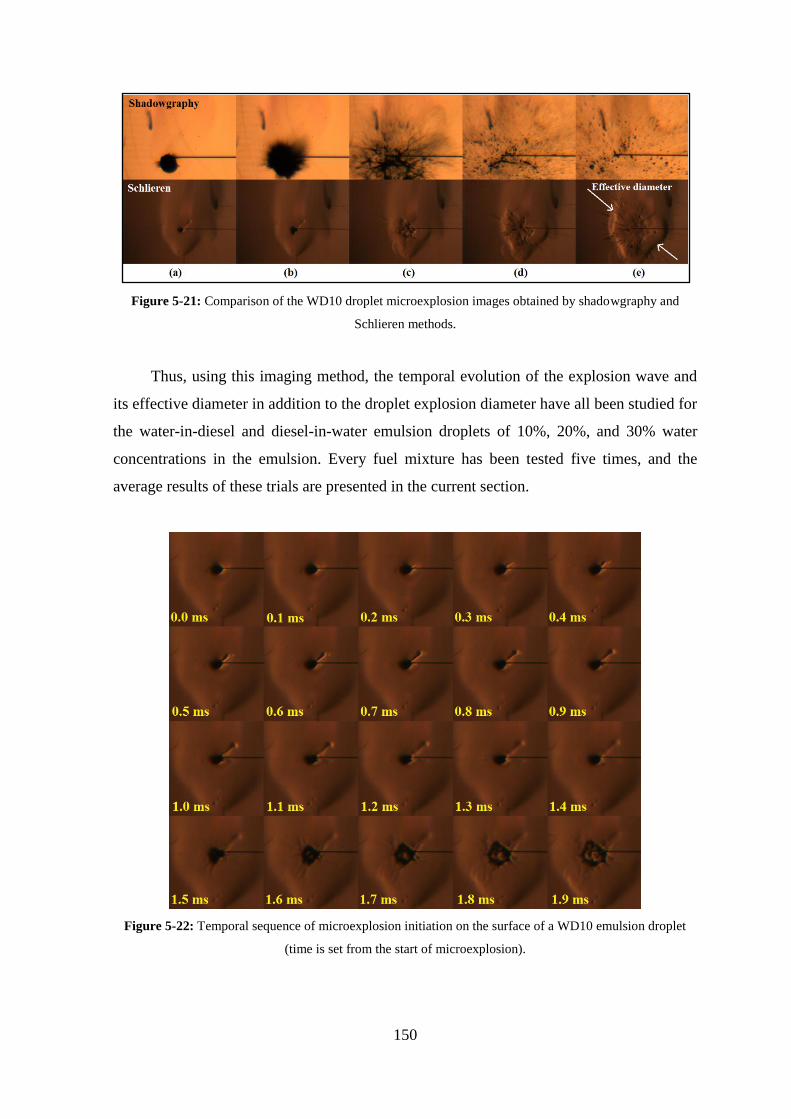
150
Figure 5-21: Comparison of the WD10 droplet microexplosion images obtained by shadowgraphy and
Schlieren methods.
Thus, using this imaging method, the temporal evolution of the explosion wave and
its effective diameter in addition to the droplet explosion diameter have all been studied for
the water-in-diesel and diesel-in-water emulsion droplets of 10%, 20%, and 30% water
concentrations in the emulsion. Every fuel mixture has been tested five times, and the
average results of these trials are presented in the current section.
Figure 5-22: Temporal sequence of microexplosion initiation on the surface of a WD10 emulsion droplet
(time is set from the start of microexplosion).

151
Generally, droplet microexplosion is shown to initiate locally in a single site on the
droplet surface as shown in Figure 5-22. This has happened for all the tested droplets and
for all mixture proportions, proving that droplet microexplosion is basically the result of a
catastrophic burst of a single bubble inside the droplet. This bubble pushes the droplet
surface outside under the action of the high pressure of the bubble interior causing the
droplet to completely disintegrate into smaller size sub-droplets.
Figure 5-23 shows the effect of water concentration in the emulsion on the droplet
explosion diameter normalized by the initial droplet diameter for both the water-in-diesel
and diesel-in-water emulsion droplets. The explosion diameter is meant to be the droplet
diameter at the instant of explosion initiation. First of all, the range of explosion diameter
for both emulsions is the same, which is between 0.8 and 1.2 of the droplet initial diameter.
Then, this diameter is shown to be susceptible to the variation in water concentration in the
emulsion. It is proportional to this concentration in the case of the WD emulsions and
inversely proportional in the case of DW emulsions. This proportionality variation between
the WD and DW emulsions can be explained in the same way Figure 5-15 and Figure 5-17
were explained. The increased nucleation rate with increasing water concentration in the
case of the WD emulsion droplets causes the instantaneous droplet size to increase as a
consequent of the bubble growth inside the droplet. While, increasing the water
concentration in the DW emulsion droplet increases the water/diesel separation and in turn
water coagulation, leading to the decrease in the rate of nucleation within the DW
emulsion droplet, and relatively supresses the droplet size increase by nucleation.
0.0
0.2
0.4
0.6
0.8
1.0
1.2
1.4
1.6
0 10 20 30 40
Dex
p/D
0
Water Content (%)
WD
0.0
0.2
0.4
0.6
0.8
1.0
1.2
1.4
1.6
0 10 20 30 40
Dex
p/D
0
Water Content (%)
DW
Figure 5-23: The effect of water content on the normalized fragmentation diameter of the water-in-
diesel and diesel-in-water emulsion droplets.

152
Figure 5-24 shows the effect of water concentration on the effective diameter of the
explosion wave for the water-in-diesel and diesel-in-water emulsions. The effective
diameter has been evaluated as the equivalent diameter of the circle having the same area
of the explosion wave. This method of diameter calculation is the same method
implemented in the present work for droplet diameter evaluation as discussed in Chapter
Four and Appendix (C).
Figure 5-24: The effect of water content on the explosion wave effective diameter normalized with respect to
the droplet initial diameter for both the water-in-diesel and diesel-in-water emulsions.
The effective diameter is then normalized by the explosion diameter of the droplet – that is
the instantaneous diameter of the droplet at the start of explosion as defined earlier – rather
than the droplet initial diameter because of its direct relevance on the explosion wave than
the latter diameter. Hence, a more practical, realistic, non-dimensional description of the
explosion wave effective diameter is obtained regardless the droplet size variation. As the
figure shows, the effective diameter of the explosion wave resulting from the WD
emulsion is higher than that of the DW emulsions. The effective diameter of the former is
ranging between 18.1 in the case of WD10 and 14.6 for WD30, whereas the effective
diameter of the latter ranges between 11.1 for DW10 and 13.6 for DW30. This suggests
that higher internal pressure in the bubbles is produced in the case of the WD emulsions
compared to the DW emulsions.
Additionally, increasing the water concentration in the emulsions is shown to
decrease the effective diameter in the case of WD emulsions, and increases it in the case of
DW emulsions. Regarding the WD emulsions, the effective diameter is shown to be almost
0
3
6
9
12
15
18
21
24
0 10 20 30 40
Def
f/D
exp
Water Content (%)
WD
0
3
6
9
12
15
18
21
24
0 10 20 30 40
Def
f/D
exp
Water Content (%)
DW

153
constant for all the water-diesel proportions, and that the decrease in diameter is merely
because of the increase in explosion diameter shown in Figure 5-23. While, for the DW
emulsions, in addition to the decrease in the droplet explosion diameter of Figure 5-23,
increasing the water concentration in the emulsion indeed causes a certain increase in the
effective diameter of the explosion wave. This could be attributed to the depth of the
bursting bubbles inside the droplet, where the intensity of explosion is proportional to the
depth of the bubble initiating the explosion [151]. Hence, increasing the water
concentration results in increased water coagulation in the DW emulsions as explained
earlier in this section. This in turn, causes the water to accumulate in the centre of the
droplet, which is the furthest distance from the droplet surface. Then, due to explosive
boiling, the water vapour bubbles will burst from the centre of the droplet causing the
catastrophic explosion of the droplet. Then, the effective diameter of this explosion is
increased by the increase in the quantity of water in the centre of the droplet.
The rate of development of the normalized effective diameter has been used for
evaluating the explosion wave spread rate that is shown in Figure 5-25.
As shown in the figure, the explosion wave may spread to up to the diameter of
exploding droplet within 1 ms in both emulsions, which means 10 ms for reaching 10 times
the droplet diameter. Therefore, with the aid of Table 2-2, it may be inferred that the
explosion wave from a single realistic droplet will have the time and strength to affect the
surrounding neighbouring droplets in the spray. Additionally, it can be seen from the figure
that the standard deviation of the tested samples in the case of the WD emulsions is quite
0.0
0.2
0.4
0.6
0.8
1.0
1.2
1.4
1.6
1.8
0 10 20 30 40
Sp
read
Rate
(1
/ms)
Water Content (%)
WD
0.0
0.2
0.4
0.6
0.8
1.0
1.2
1.4
1.6
1.8
0 10 20 30 40
Sp
read
Rate
(1
/ms)
Water Content (%)
DW
Figure 5-25: The effect of water content on the fragmentation effective diameter spread rate for the
water-in-diesel and diesel-in-water emulsion droplets.

154
low suggesting highly repeatable values of the spread rate for that emulsions, whereas the
standard deviation for the DW emulsion is relatively high, especially for the DW30.
5.4 Summary
In the present chapter, detailed experimental analyses of the puffing, sub-droplet
generation, and microexplosion processes occurring in the burning multicomponent fuel
droplets are performed.
Isolated droplet experiments are carried out for investigating the above processes
during the combustion of biodiesel/diesel and ethanol/diesel blends, water-in-diesel and
diesel-in-water emulsions in addition to the three single-component diesel, biodiesel, and
ethanol fuels.
The results have revealed that the droplets of the whole multicomponent fuel
mixtures have experienced puffing and secondary atomization with variable intensities, but
only the emulsion droplets have undergone microexplosion. The biodiesel/diesel blends
have shown the least puffing and secondary atomization tendencies, whereas the other
three mixtures have experienced comparable tendencies. The effect of puffing and
secondary atomization on both the burning droplet and the surrounding flame has also been
revealed. Emulsion droplet microexplosion has been investigated and some quantitative
analyses have been carried out.
Furthermore, as it is established, all of the studied processes are driven or triggered
by the processes taking place in the liquid-phase of the burning droplet. These processes
include nucleation, bubble generation and growth, internal circulation, and bubble burst.
Therefore, a localized comprehensive experimental investigation of these processes is
demanded. Hence, in the next chapter, the results of a magnified high speed investigation
of the droplet liquid-phase during the combustion of multicomponent fuel droplets are
presented and discussed.

155
Chapter 6. Liquid-Phase Monitoring during the
Combustion of Multicomponent Fuel
Droplet
6.1 Introduction
Nucleation and bubble generation are occurring inside the burning multicomponent
fuel droplet in the course of its lifetime. The initiation, development, and effect of these
processes on the multicomponent fuel droplet combustion need to be further
comprehended. Considering the microscopic size of the fuel droplets in the real spray,
studying these processes during the real spray combustion is quite challenging.
Accordingly, the investigation of these processes is only affordable during the combustion
of an isolated fuel droplet undergoing combustion. However, even with the isolated liquid
fuel droplet, obtaining a clear view of the droplet liquid-phase is not easily attainable.
Therefore, magnified imaging of the droplet liquid phase during combustion is essential for
more in depth investigations of these processes.
Furthermore, as it is shown in Chapter Five, high speed imaging is required for
tracking such processes. Consequently, magnified high speed imaging is implemented in
the present chapter for investigating the liquid-phase dynamics during the combustion of
isolated multicomponent fuel droplets. Backlighting imaging technique has been
implemented for studying the liquid-phase dynamics during droplet combustion.
Hence, after describing the experimental work and procedures in section 6.2), the
achieved results are presented and discussed in section ( 6.3). Firstly, the liquid-phase
dynamics of the single-component fuel droplets are reviewed, followed by the liquid-phase
dynamics of the multicomponent fuel droplets. Then, the nucleation and bubble growth
analysis are presented and discussed. The effect of these processes on the puffing,
secondary atomization and microexplosion is then covered. And finally, the phase
separation and component accumulation in the core of the droplet liquid-phase is
discussed. The overall findings of the present chapter are then outlined and summarized in
section ( 6.4).

156
6.2 Experimental Setup
Generally, the same experimental setup used in Chapter Four has been utilized in this
chapter. The schematic drawing of this setup is recalled in Figure 7-1. Some simple but
essential changes have been made. The high speed camera is set to 40000 fps framing rate,
25 µs exposure time, and 384x288 pixels image resolution. The IDT 19-LED high intensity
illuminator is used in the present test instead of the 72-LED domestic illuminator to
provide the adequate lighting for the high imaging rate. The area covered by the camera is
3.84x2.88 mm2, giving a spatial resolution of 10 µm/pixel for each image. The
magnification rate achieved using this setup is thirty times the physical size. Therefore, a
detailed investigation of the instantaneous droplet size and shape change during its overall
lifetime is performed, in addition to the full tracking of the physical processes occurring in
the liquid-phase.
Figure 6-1: Experimental setup of the droplet combustion with backlighting imaging.
The investigated fuels are water-in-diesel and diesel-in-water emulsions,
biodiesel/diesel and ethanol/diesel blends, in addition to the neat diesel, biodiesel, and
ethanol as single-component base fuels. As it is mentioned in the previous chapters, the
biodiesel/diesel blends and diesel-in-water emulsions are characterised by the higher
boiling point of the dispersed phase that is biodiesel in the case of the blends and diesel in
the case of emulsions compared to the continuous phase which is diesel in the case of the
former and water in the case of the latter. In the ethanol/diesel blends and water-in-diesel
emulsions on the other hand, the continuous phase – the diesel in both cases – has a higher

157
boiling point compared to both ethanol and water in both mixtures. Additionally, the
miscibility of the constituents is variable for each multicomponent fuel mixture. Biodiesel
is completely miscible in diesel, ethanol is partially miscible, and water is immiscible.
Therefore, quite variable droplet liquid-phase behaviour is expected for each of these
multicomponent fuel mixtures. Three samples have been tested for each of the neat diesel
fuel, water-in-diesel, and diesel-in-water emulsions, while two samples have been tested
for the rest of the fuels.
The images have been stored in the (TIFF) format and processed according to the
procedures described in Chapter Three. Besides, intensity transformation of the grayscale
images is performed for image enhancement. This intensity transformation is carried out
using the imadjust function in the Image Processing Toolbox in Matlab, that maps the
intensity values of an image between two certain limits and neglects the values beyond
these limits [303]. Accordingly, proper and efficient droplet liquid-phase visualization and
tracking is performed as shown in Figure 6-2. In turn, a variety of processes have been
tracked and investigated. These processes are presented and discussed in the next section.
Figure 6-2: The effect of image intensity enhancement on highlighting the bubble growing inside a diesel
fuel droplet. (a) the raw image, (b) the intensity enhanced image.
6.3 Results and Discussion
The results section has been arranged according to the sequence of events occurring
within the droplet. Therefore, nucleation sites and nucleation rate in the multicomponent
fuel droplet are discussed first, and then the dynamics of the growing bubbles are covered.
The effect of nucleation and bubble generation on the puffing and secondary atomization

158
from the multicomponent fuel droplet has also been discussed. Additionally, water and
diesel agglomeration has been noticed to occur during the combustion of diesel-in-water
emulsions and ethanol/diesel blends. This phenomenon has been discussed at the final part
of the present section. These discussions are preceded by general descriptions of the liquid-
phase characteristics of both the single-component and multicomponent fuel droplets.
6.3.1 Liquid-Phase of the Single-Component Fuel Droplets
Despite the present work is devoted for studying the liquid-phase dynamics of the
multicomponent fuel droplets, the droplet liquid-phase of the single component base fuels
has also been investigated. This is for two main reasons; the first is to compare the burning
behaviours of these fuels with their multicomponent mixtures, and the second is to estimate
the effect of the SiC fibre on the droplet combustion, exploiting the clear structure
appearance of these neat fuels compared to the multicomponent mixtures.
Figure 6-3: Temporal sequence of the droplet combustion of the neat diesel, biodiesel, and ethanol.
Figure 6-3 shows the droplet liquid-phase of the diesel, biodiesel, and ethanol single-
component fuels at various periods of the droplet lifetime. Image (a) for each fuel
represents the initial droplet diameter, whereas image (f) represents the droplet prior to
complete evaporation at the end of its lifetime. Images (b), (c), (d), and (e) are selected so
that they represent the droplet after 20%, 40%, 60%, and 80% of its lifetime for each fuel.
As the figure shows, the droplets of all the fuels have a transparent structure that is relevant
for droplet interior monitoring. Furthermore, the droplet interior remains clear with no
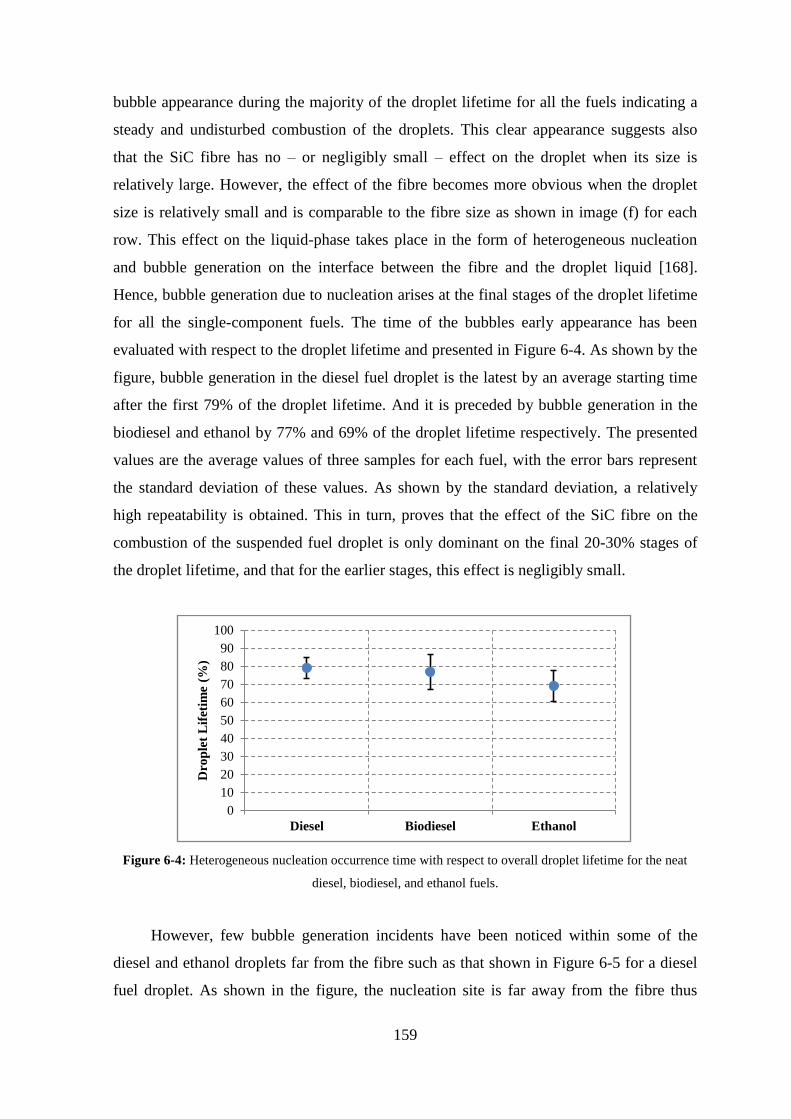
159
bubble appearance during the majority of the droplet lifetime for all the fuels indicating a
steady and undisturbed combustion of the droplets. This clear appearance suggests also
that the SiC fibre has no – or negligibly small – effect on the droplet when its size is
relatively large. However, the effect of the fibre becomes more obvious when the droplet
size is relatively small and is comparable to the fibre size as shown in image (f) for each
row. This effect on the liquid-phase takes place in the form of heterogeneous nucleation
and bubble generation on the interface between the fibre and the droplet liquid [168].
Hence, bubble generation due to nucleation arises at the final stages of the droplet lifetime
for all the single-component fuels. The time of the bubbles early appearance has been
evaluated with respect to the droplet lifetime and presented in Figure 6-4. As shown by the
figure, bubble generation in the diesel fuel droplet is the latest by an average starting time
after the first 79% of the droplet lifetime. And it is preceded by bubble generation in the
biodiesel and ethanol by 77% and 69% of the droplet lifetime respectively. The presented
values are the average values of three samples for each fuel, with the error bars represent
the standard deviation of these values. As shown by the standard deviation, a relatively
high repeatability is obtained. This in turn, proves that the effect of the SiC fibre on the
combustion of the suspended fuel droplet is only dominant on the final 20-30% stages of
the droplet lifetime, and that for the earlier stages, this effect is negligibly small.
Figure 6-4: Heterogeneous nucleation occurrence time with respect to overall droplet lifetime for the neat
diesel, biodiesel, and ethanol fuels.
However, few bubble generation incidents have been noticed within some of the
diesel and ethanol droplets far from the fibre such as that shown in Figure 6-5 for a diesel
fuel droplet. As shown in the figure, the nucleation site is far away from the fibre thus
0
10
20
30
40
50
60
70
80
90
100
Diesel Biodiesel Ethanol
Dro
ple
t L
ifet
ime
(%)

160
eliminating the heterogeneous nucleation probability and implying either the superheat
boiling of one of the diesel base constituents or because of some trapped gas pockets in the
fuel [123,155]. Additionally, the transparent nature of the diesel fuel droplet made it easy
to visualize and track the temporal evolution of the growing bubble. The bubble firstly
initiated at the periphery of the droplet interior far from the suspension fibre as shown in
the image corresponding to time 0 ms of Figure 6-5. Bubble growth then proceeded in
conjunction with circulation around the droplet periphery as shown in images 2.25 ms to
11.25 ms. This circulation is attributed to the temperature gradient between the droplet
surface and centre [304]. Then, as the bubble diameter increases, it moves towards the
centre of the droplet as shown in images 13.50 ms to 38.25 ms. Then, the bubble bursts
causing droplet puffing as shown in image 42.75 ms. The bubble growth rate has been
evaluated as the time required by the bubble to reach its maximum volume. This volume is
calculated using the maximum bubble diameter that is estimated by means of the
equivalent circle diameter of the projected area algorithm that is implemented and
described in the previous chapters.
Figure 6-5: Temporal sequence of bubble growth inside a diesel fuel droplet (the time is set from the
initiation of the bubble).
Hence, the maximum diameter of the bubble is the one that is in image 40.50 ms in
Figure 6-5, and is found to be 0.46 mm. Thus, the bubble growth rate is found to be about

161
1.28 µm3/µs. This rate will then be compared with the bubble growth rates obtained from
the multicomponent fuels. The bubble circulation velocity has also been evaluated as the
time required for crossing half the circumference of the droplet. This time is estimated
from the images to be 6.8 ms and the droplet diameter is 0.74 mm, therefore, the distance
is 0.5*0.74*π and is found to be 1.16 mm, hence, the circulation velocity is about 171
mm/s which is in agreement with the 90-200 mm/s circulation velocity estimated by
Miglani, Basu, and Kumar [153]. Eventually, it can be said that the nucleation and bubble
generation within the single-component fuel droplets is mostly infrequent, and that the
scarce incidents are either because of dissolved gases or low boiling components as in the
diesel. However, these rare occurrences were useful in estimating the circulation velocity
and bubble growth rate due to the clear and transparent structure of the single-component
fuel droplets.
6.3.2 Liquid-Phase of the Multicomponent Fuel Droplets
In contrast to the single-component fuel droplets, the multicomponent fuel droplets
have a less transparent structure as shown in Figure 6-6.
Figure 6-6: Liquid-phase appearance of the biodiesel/diesel and ethanol/diesel blends and the water/diesel
emulsions. The upper row represents the initial droplets, and the lower row represents the droplets after a
certain time of combustion.
This transparency is variable between the different multicomponent mixtures utilized in the
present work. The biodiesel/diesel blends have the highest transparency compared to the
other mixtures, then, it comes the ethanol/diesel mixtures, and finally the emulsions of both

162
types the water-in-diesel and diesel-in-water. This is related to the miscibility of biodiesel,
ethanol, and water in diesel, where, the biodiesel that is the most miscible liquid in diesel
among the three have the most homogeneous – and in turn most transparent – mixture
when blended with diesel compared to ethanol and water as shown in the first column of
Figure 6-6. Ethanol, on the other hand, is partially miscible as formerly explained. Hence,
the resulting ethanol/diesel mixture is less homogeneous and less transparent compared to
biodiesel, as shown in the second column of Figure 6-6. While, the water/diesel emulsions
shown in the third column of Figure 6-6 have a relatively opaque structure compared to the
biodiesel and ethanol blends, that is due to the immiscible nature of water in diesel, even
with the use of the emulsifying agent. The second row of Figure 6-6 shows that the ED
blend, WD and DW emulsions may experience some sort of agglomeration due to the
separation of components. This phenomenon will be discussed at the end of this chapter.
In addition to the difference in transparency, the multicomponent fuel mixtures differ
from each other in the nucleation rate and subsequent liquid-phase dynamics. The
biodiesel/diesel blend droplets are characterized by steady, undisturbed combustion, with
the least nucleation and bubble generation incidents among all the mixtures. Whereas, the
other mixtures including ethanol/diesel blends, water-in-diesel-emulsions, and diesel-in-
water emulsions are characterized by chaotic combustion behaviours due to the high
nucleation and bubble generation incidents leading to increased puffing and sub-droplet
generation values as discussed in the previous chapter. These chaotic behaviours are
reflected on the shape of the burning droplet as shown in Figure 6-7. The droplet in the
figure endures high deformations in shape subsequent to the puffing incident. Additionally,
it experiences all the possible processes subsequent to bubble growth and burst, therefore,
it serves as an ideal model for describing these processes. The droplet is initially spherical
and contains a large bubble with a diameter equals to 90% of the droplet instantaneous
diameter so that it is occupying a large space inside the droplet as shown in the image
corresponding to time 0.0 ms in Figure 6-7. When the bubble bursts, the droplet starts to
flatten on the right side as shown in the images corresponding to times 0.3 ms to 0.9 ms
respectively. This flattening is a result of the droplet reaction to the thrust force generated
during the water vapour release by puffing. The puffing vapour could not be visualized in
the tests corresponding to the present chapter because of the high intensity illumination
light used for the backlighting imaging. This illumination light is required to compensate
for the high speed imaging, but, unfortunately, the too bright background generated by
illumination obscures the visualization of the low intensity vapour emitted by puffing.

163
Figure 6-7: Temporal sequence of the droplet shape variation consequent to bubble burst and puffing within
a WD20 fuel droplet (the time is set from the start of puff).
Subsequent to puffing, some of the liquid is ejected outside the droplet accompanied
by the detachment of different size ligaments in the form of sub-droplets as shown in
images 1.2 ms to 2.4 ms respectively. The thrust force resulting from puffing then pushes
the droplet to the left side so that it takes a plum shape rather than its original spherical (or
semi-spherical) shape, as shown in times 2.7 ms to 3.3 ms in the figure. The droplet then
continues to move towards the left side under the puffing thrust force, but, the surface
tension of the liquid will resist this movement and keep the droplet suspended in the fibre,
causing the droplet to elongate at its far end as shown in times 3.6 ms to 5.7 ms
respectively. This droplet elongation continues until the surface tension force exceeds the
thrust force and brings the droplet back to its normal position (times 6.0 ms to 7.2 ms
respectively) and shape (times 7.5 ms to 11.7 ms).

164
This sequence of events occurs almost after every bubble growth and burst processes
but with varying intensity, because not all bubble burst processes end up with ligament or
sub-droplet detachment as it is postulated in Chapter Five.
Furthermore, as shown in image 1.5 ms and the following images, another bubble is
generated in the ejection location subsequent to ligament and sub-droplets detachment.
Direct connection between the ejection site and the evolution of the new bubble could not
be confirmed. Despite the reasons behind this bubble generation, it gives an indication of
the nucleation and bubble growth rates in the emulsion droplets. Moreover, Figure 6-7
shows the variety of shapes taken by the droplet during a single occurrence of secondary
atomization. Hence, keeping in mind the repeatability of such process, especially for the
emulsion droplets, it can be inferred how dominant is the irregular shape of the droplet
compared to the regular spherical configuration.
6.3.3 Nucleation Rate
In spite of the size – and the resulting time scale – difference between the tested
droplets in the present work and those on the real sprays, the nucleation behaviour of the
different multicomponent fuels under investigation could be estimated. Hence, the
nucleation rates during the droplet combustion of these fuels have been evaluated and
presented in Figure 6-8 with respect to the concentration of the added substance (biodiesel,
ethanol, or water). These nucleation rates have been evaluated for the overall droplet
lifetime and normalized by 100 ms time interval for procuring more realistic results
comparable to the real spray droplet lifetime. Additionally, the nucleation rate has been
presented in the logarithmic form due to the large difference in the order of magnitude of
the computed values for the different multicomponent fuel mixtures. Bubble nucleation
around the fibre region inside the droplet is neglected to eliminate the probability of adding
any bubble generated by heterogeneous nucleation due to the presence of the fibre. Hence,
the presented results are only for homogeneous nucleation away from the fibre. As shown
in the figure, the nucleation rates of all the investigated mixtures are inversely proportional
to the concentration of the additive in that mixture. However, the degree of this
proportionality is variable among those mixtures. Where, the water-in-diesel emulsions
show steep line behaviour with increasing the concentration of the water in the emulsions,
whereas this behaviour is less for the other mixtures.

165
Figure 6-8: Average nucleation rate variation with the content of the substance added to diesel.
Additionally, the nucleation rate in the WD emulsions is the highest among all
mixtures, while that of the BD blends is the least, this could be a reflection to the
miscibility of these liquids to diesel, where biodiesel is completely miscible and water is
completely immiscible.
Figure 6-9: Different nucleation sites inside the burning fuel droplet.
Figure 6-9 shows the various nucleation sites inside a WD10 emulsion droplet. The
figure shows that the nuclei could initiate at any location inside the droplet, whether this
location is the droplet centre as in image 489.1 ms, or any of the peripheries, as it is shown
in the other images. All these nucleation sites are away from the suspension fibre, which
gives certainty about the occurrence of homogeneous nucleation within the burning
0
1
10
100
0 10 20 30 40
Lo
g(N
ucl
eati
on
Ra
te)
(N/1
00
ms)
Additive Content (%)
WD DW BD ED

166
multicomponent fuel droplet. Furthermore, the figure shows that more than one nucleus
may develop at the same time, as it is revealed in images 422.9 ms and 544.9 ms.
6.3.4 Bubble Dynamics
Once the nucleation rate has been evaluated, the resulting bubble growth and
dynamics are investigated. Figure 6-10 shows the bubble growth rate inside the burning
droplets of the multicomponent fuels under investigation presented with respect to the
concentration of the substance added to diesel (biodiesel, ethanol, and water). The growth
rate is expressed in the logarithmic form due to the big difference between the different
mixtures. As Figure 6-10 shows, the bubble growth rate of ethanol/diesel blends is
proportional to the increase of ethanol concentration in the blend, while, those growth rates
of both biodiesel/diesel blends and water-in-diesel emulsions are inversely proportional to
the increase in both biodiesel and water concentrations in the mixture. The bubble growth
rate of the diesel-in-water emulsions on the other hand is found to be unaffected by the
increase of water concentration in the emulsion.
Figure 6-10: The effect of additive content on the average bubble growth rate inside the multicomponent fuel
droplet.
Furthermore, as mentioned in section 6.3.3, more than one bubble could be initiated
at the same – or relatively close – time. Hence, some of these bubbles are shown to merge
into a single large bubble as shown in Figure 6-11. In this figure, two different size bubbles
generated during the combustion of ED10 fuel droplet are united in one large bubble
1
10
100
1000
10000
100000
0 10 20 30 40
Log
(Bu
bb
le G
row
th R
ate
) (µ
m3/µ
s)
Additive Content (%)
BD
WD
1
10
100
1000
10000
100000
0 10 20 30 40
Log
(Bu
bb
le G
row
th R
ate
) (µ
m3/µ
s)
Additive Content (%)
ED
DW

167
occupying the whole droplet interior. The time periods shown in the figure are set to start
from the instant when the two bubbles are attaching each other. However, the first two
images in the first row of the figure are before that time, but they have been added to
illustrate the change in bubble locations inside the droplet. As the figure shows, the smaller
bubble is contained by the larger bubble.
Figure 6-11: The temporal sequence of two bubbles merging occurrence inside an ED10 fuel droplet (time is
set from the instant of bubbles attachment).
This bubble merging process has occurred in many occasions and within different
fuel droplets including the neat diesel fuel droplet as shown in Figure 6-12. In this figure,
both bubbles are circulating inside the droplet and approaching each other in the centre of
the droplet. These merging incidents are playing a crucial rule in the dynamics of the
droplet surface since these processes unite multiple small bubbles in one large bubble; the
explosion of this large bubble is expected to be more effective than the initial smaller ones.
However, the larger bubble size will not necessarily generate the sufficient disturbance for
disintegrating the droplet. Since the bubble size is not the only effective parameter in
droplet disintegration and sub-droplet generation, the other factors are droplet size, bubble
location prior to burst, and droplet liquid surface tension.

168
Figure 6-12: Temporal sequence of two bubbles merging process inside a neat diesel fuel droplet.
Figure 6-13: Temporal sequence of bubble growth inside a burning BD10 fuel droplet.
Figure 6-13 shows the temporal sequence of bubble growth inside a burning BD10
fuel droplet. The presented bubble has initiated near the droplet surface and developed in

169
the same location as shown in image 3.50 ms and the followings. Its diameter on image
52.50 ms prior to explosion is measured to be 0.73 of the droplet diameter. However, when
exploded, its effect on the droplet is only shown in the form of vapour ejection by puffing
without detachment of any portion of the liquid droplet as shown in image 53.40 ms and
following images. This suggests that the thrust force resulted from bubble explosion and
the subsequent puffing was not sufficiently high to overcome the surface tension of the
liquid droplet. Especially, the surface tension of the biodiesel fuels is higher than that of
the regular diesel fuels [305]. So that its only effect appeared in the form of droplet shape
change followed by restitution to the normal shape.
Figure 6-14: Short bubble growth time during the combustion of WD20 fuel droplet.
In contrast, Figure 6-14 shows bubble evolution and explosion inside a WD20 fuel
droplet, in which this explosion led to sub-droplet detachment from the parent droplet
surface. The bubble is also initiated near the surface of the droplet as shown in image 50
µs, and developed adjacent to the surface as shown in images 100 µs to 550 µs
respectively. Its maximum diameter prior to burst is estimated from image 550 µs to be
0.28 of the droplet diameter, and its evolution time is 1/95 of the evolution time for that
bubble shown in Figure 6-13. However, its explosion led to the generation of small size

170
sub-droplet as shown in image 750 µs. Thus, it can be inferred that the size of the bubble is
not always the major factor in deciding the occurrence of droplet secondary atomization.
6.3.5 The Effect of Bubbles on Puffing, Secondary Atomization, and
Microexplosion
Figure 6-15 shows the effect of bubble burst on the sub-droplet ejection from the
surface of an ED20 fuel droplet undergoing combustion.
Figure 6-15: Temporal sequence of the effect of a growing bubble on the sub-droplet ejection from a burning
ED20 fuel droplet.
Prior to burst, the bubble – bounded by the red box in the first row – is adjacent to the
droplet surface. Hence, it is forcing the frontal thin liquid layer of the liquid until it is in
contact with the gaseous environment. So, the pressure difference across the bubble causes
its rapture releasing all the content vapour outside. The release of this vapour created a low
pressure spot on the droplet surface causing the surrounding liquid on the droplet to flow

171
towards this spot as shown in images 0.05 ms to 0.45 ms in Figure 6-15. These images
illustrate the inward movement of the droplet surface subsequent to vapour release by
bubble rapture. This inward motion of the liquid edges results in a reflective outward
motion of part of the liquid due to the impact of the liquid edges in the low pressure spot as
shown in image 0.45 ms and the followings. If the force resulting from this reflective
motion is high enough, the moving liquid portion will continue forward with a decrease in
the cross-sectional area and flattening in the upstream side as shown in images 0.85 ms to
0.95 ms. With the increase of outward motion of the liquid, the cross-sectional area
decrease and upstream face increase will initiate nicking in the liquid portion structure
behind the flattened face as shown in the red circles of images 1.00 ms to 1.20 ms.
Disintegration of the liquid from this nick then occurs causing a small ligament of liquid to
escape in the form of sub-droplet as shown in images 1.25 ms to 1.95 ms respectively.
Otherwise, if the force produced by the impact is not sufficiently enough, liquid nicking
will not take place, and the resulting effect will be limited to instantaneous deterioration of
the droplet surface for a certain time after which the droplet will retain its original shape as
it is previously shown in Figure 6-13.
The above described synopsis occurs for all the growing bubbles inside the fuel
droplets, but with varying degree. Where, occasionally the impact force is relatively small
due to the small size of the exploding bubble and in turn the low pressure difference.
Hence, smaller portion of the liquid is forced outside as shown in Figure 6-16. This figure
illustrates the temporal sequence of bubble growth inside a WD20 fuel droplet. As it is
shown by tracking the bubble bounded by the red box in each image, the bubble is initiated
at time 181.1 ms near the droplet surface. Then, it continued to grow up with time until
reaching the instant 183.1 ms where it reached its maximum size and attached the droplet
surface from inside. Since, the liquid layer at the droplet surface is thin; it did not
withstand the force exerted by the bubble. Therefore, droplet surface layer rupture occurred
bringing the bubble in contact with the surrounding gaseous environment. This attachment
with the environment led to the rapture of the bubble itself due to the pressure difference
across the bubble boundaries. Because of this rapture, a small portion of the liquid from the
droplet surface is ejected according to the same mechanism described formerly. However,
this liquid portion is relatively small as shown in images 183.5 ms to 183.8 ms.

172
Figure 6-16: Temporal sequence of the effect of a growing bubble on the sub-droplet ejection from a burning
WD10 fuel droplet.
Figure 6-17 on the other hand, shows the secondary atomization and sub-droplet
emission from a WD20 fuel droplet. The sub-droplet is bounded by the white rectangle for
tracking purposes. It is emitted as a result of the parent droplet puffing shown in images at
0 ms and 0.1 ms. Although the exact composition of the sub-droplet is not currently
affordable; its burning characteristics are compared to the parent droplet that is WD20. The
initial diameter of the sub-droplet is found to be 40 µm. It has experienced explosion at
about 1.9 ms after its ejection. Therefore, its burning rate constant is calculated as (0.84
mm2/s), which is slightly lower than that of the WD20 fuel droplet evaluated in Chapter
Four, that is (1.18 mm2/s). Though, in the case of sub-droplet, this value represents the
vaporization rate constant rather than the burning rate constant since the sub-droplet
experienced explosion before leaving the vaporization zone of the parent droplet. Since the
radial distance of the sub-droplet centre from the parent droplet centre in image 1.8 ms is
evaluated to be 1.8 of the parent droplet instantaneous radius. Whereas, the flame stand-off
ratio for that droplet is found to be ~ 4. Thus, the sub-droplet is more likely to explode
during vaporization rather than combustion. This implies that the actual secondary

173
atomization from the emulsion droplet is higher than that estimated from the regular
droplet and flame observations.
Figure 6-17: Temporal sequence of the ejected sub-droplet lifetime during the combustion of a WD20 fuel
droplet.
Figure 6-18: WD20 emulsion fuel droplet microexplosion during combustion (the time difference between
images is 25µs).

174
Figure 6-18 shows the temporal sequence of WD20 emulsion fuel droplet
microexplosion during combustion. The images have been inverted using Matlab for
proper visualization of the explosion initiation point. The use of high intensity backlight
during imaging resulted in the tracking of the explosion point inside the droplet is quiet
challenging. As the figure reveals, the micro-explosion of the droplet took place due to the
explosion of one of the bubbles inside the droplet. This bubble – bounded by the red box –
exploded inside the droplet in a point relatively far away from the droplet surface. Hence,
due to its location inside the droplet, the effect of this explosion on the droplet was more
intensive than the bubble explosions on the droplet surface. This form of microexplosion
has been noticed to occur during the combustion of the majority of the water-in-diesel and
diesel-in-water emulsion droplets and for some of the ethanol/diesel blends.
6.3.6 Accumulation within the Burning Multicomponent Fuel Droplet
During the liquid-phase magnified monitoring during the combustion of the
multicomponent fuel droplets, some of the droplets belonging to the ethanol/diesel blends,
water-in-diesel and diesel-in-water emulsions have experienced a kind of component
separation. This is followed by accumulation of one of these components in the form of a
spherical mass moving in the centre of the droplet as shown in Figure 6-19.
Figure 6-19: The temporal sequence of diesel fuel accumulation during the combustion of ED30 fuel droplet.
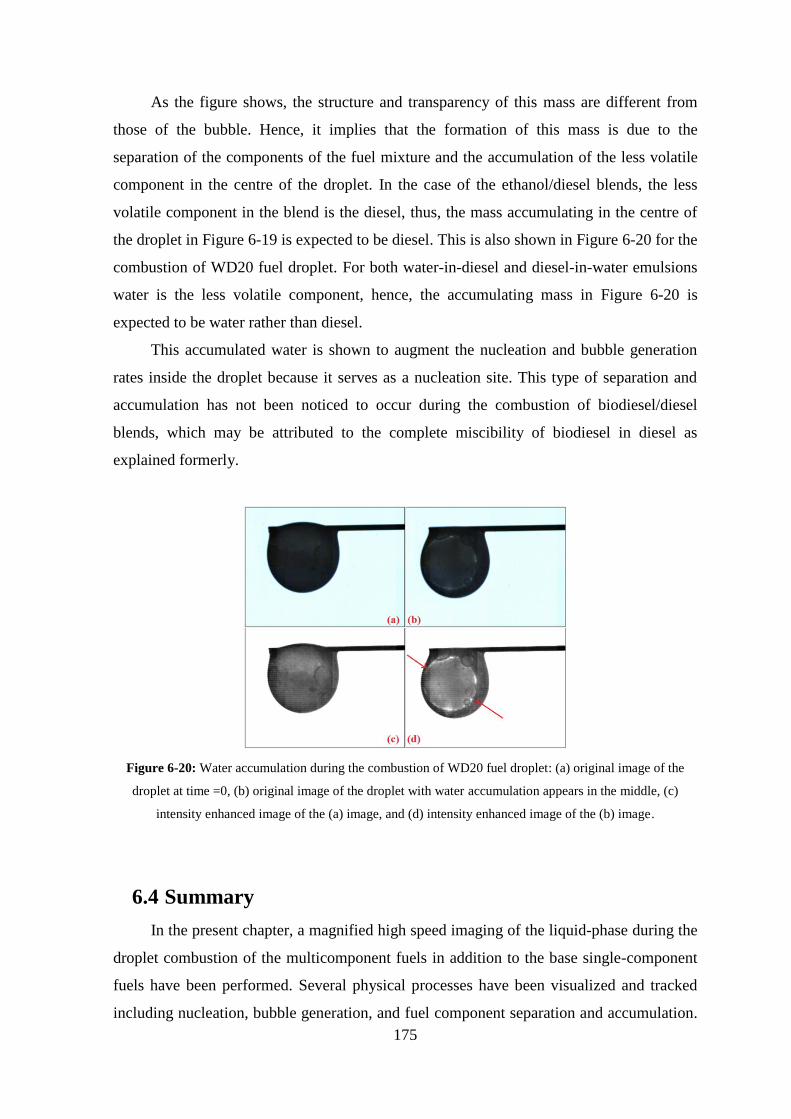
175
As the figure shows, the structure and transparency of this mass are different from
those of the bubble. Hence, it implies that the formation of this mass is due to the
separation of the components of the fuel mixture and the accumulation of the less volatile
component in the centre of the droplet. In the case of the ethanol/diesel blends, the less
volatile component in the blend is the diesel, thus, the mass accumulating in the centre of
the droplet in Figure 6-19 is expected to be diesel. This is also shown in Figure 6-20 for the
combustion of WD20 fuel droplet. For both water-in-diesel and diesel-in-water emulsions
water is the less volatile component, hence, the accumulating mass in Figure 6-20 is
expected to be water rather than diesel.
This accumulated water is shown to augment the nucleation and bubble generation
rates inside the droplet because it serves as a nucleation site. This type of separation and
accumulation has not been noticed to occur during the combustion of biodiesel/diesel
blends, which may be attributed to the complete miscibility of biodiesel in diesel as
explained formerly.
Figure 6-20: Water accumulation during the combustion of WD20 fuel droplet: (a) original image of the
droplet at time =0, (b) original image of the droplet with water accumulation appears in the middle, (c)
intensity enhanced image of the (a) image, and (d) intensity enhanced image of the (b) image.
6.4 Summary
In the present chapter, a magnified high speed imaging of the liquid-phase during the
droplet combustion of the multicomponent fuels in addition to the base single-component
fuels have been performed. Several physical processes have been visualized and tracked
including nucleation, bubble generation, and fuel component separation and accumulation.

176
Quantitative analysis has been performed for estimating the nucleation and bubble growth
rates.
The high speed images have revealed the occurrence of homogeneous nucleation
within the multicomponent fuel droplet during combustion. The subsequent analysis then,
have shown that the rate of this nucleation is inversely proportional to the degree of
miscibility between the basic constituents of the multicomponent fuel mixture. Thus, the
biodiesel/diesel blends – which are the mixtures of the completely miscible components –
are characterized with the least nucleation rates, whereas the water/diesel emulsions –
which are the mixtures with the least miscibility of components among all the studied
mixtures – have had the highest nucleation rates.
The effect of nucleation and bubble generation on the puffing, secondary
atomization, and microexplosion of the multicomponent fuel droplet has also been
investigated. It is shown that the size of the bubble is not the only factor that determines
sub-droplet emission from the droplet surface.
Additionally, some bubble dynamics have also been observed, such as the bubble
circulation and the multiple bubble merge. All these processes have an effect on the overall
dynamics of the droplet liquid-phase and surface during combustion.
Furthermore, separation and accumulation of diesel in the ethanol/diesel blends, and
water in the water-in-diesel and diesel-in-water emulsions has been observed. This
accumulation leads to the generation of a relatively large size mass in the centre of the
droplet; this mass sometimes serves as a nucleation site resulting in increasing the
nucleation rate within the droplet.
To conclude, the magnified high speed imaging of the droplet liquid phase was
effective in revealing the different occurring processes during droplet combustion.
However, these results are for the combustion of an isolated fuel droplet. Nevertheless, the
real burning spray is an integral of a vast number of droplets which are interacting among
each other and with the surrounding environment along their own lifetimes. Hence, the
effect of droplet-droplet interaction on the liquid-phase dynamics of the burning droplet
have been investigated and further discussed in the next chapter.
177
Chapter 7. Combustion Characteristics of Two-
Neighbouring Multicomponent Fuel
Droplets
7.1 Introduction
The liquid fuel spray is a group of small size droplets that can interact among each
other within the spray volume. This interaction is in turn reflected on the overall
characteristics of the spray. During combustion, this interaction could be more effective
due to the presence of the flame that is either surrounding a single droplet or multiple
droplets. Hence, the combustion characteristics of the isolated fuel droplet are expected to
be different from those of the same droplet when surrounded by other droplets. This
applies to the droplet liquid-phase dynamics, since the droplet interior is directly affected
by the surrounding temperature and species gradients which are influenced by the droplet-
droplet interaction. Therefore, in the present chapter a magnified high speed visualization
of the interaction between two multicomponent fuel droplets undergoing combustion is
carried out. Emphasis is applied to the liquid-phase dynamics including nucleation, bubble
generation, and the related droplet surface processes such as puffing and secondary
atomization. The effect of droplet fragmentation on the neighbouring droplet has also been
investigated.
Biodiesel/diesel blends, ethanol/diesel blends, water-in-diesel emulsions, and diesel-
in-water emulsions have been investigated in the present work as the multicomponent
fuels, in addition to the neat diesel, biodiesel, and ethanol as the single-component base
fuels. The experimental work procedures and setups are explained in section ( 7.2) of the
chapter. After which, the main findings are presented and discussed in section ( 7.3). The
first part of the results section is assigned for discussing the effect of interactive droplet
combustion on the droplet combustion characteristics – mainly the burning rate constant
and flame shape – compared to those of the corresponding isolated fuel droplet. The liquid-
phase dynamics of the interacting fuel droplets are then discussed. Additionally, the effects
of droplet puffing and secondary atomization on its neighbour droplet are outlined. The
overall findings of the present chapter are then summarized in section ( 7.4).

178
7.2 Experimental Setup
The schematic diagram of the two-droplet suspension setup is shown in Figure 7-1.
The droplets are suspended opposite to each other with a spacing distance (x). Each of the
droplets is suspended on a single monofilament SiC fibre that is attached to the sliding arm
of a lab stand for easier control of the droplet position in accordance to the camera. The
normalized spacing distance is varied in a range of (1-5) to investigate its effect on the
droplet combustion. Backlighting imaging with the optical setup described in section
( 3.3.2.A) has been used for tracking droplet combustion throughout this experiment. Two
camera settings are used in the present work. The first setting is used for tracking the
droplet overall combustion and the surrounding flame. For these reasons, the camera is set
to 1000 fps framing rate, 1 ms exposure time, and 768x768 pixels image resolution. The
area covered by the camera was 7.68x7.68 mm2, giving a spatial resolution of 30 µm/pixel
for each image. The magnification rate achieved using this setup is 30 times the physical
size. The second setting on the other hand, is used for tracking the liquid-phase of the
interacting fuel droplets. Hence, the camera is set to 40000 fps framing rate, 25 µs
exposure time, and 320x240 pixels image resolution. The area covered by the camera was
3.2x2.4 mm2, giving a spatial resolution of 30 µm/pixel for each image.
Figure 7-1: Schematic drawing of the two-neighbouring droplets suspension.
The investigated fuels are water-in-diesel and diesel-in-water emulsions,
biodiesel/diesel and ethanol/diesel blends all of 10%, 20%, and 30% of the added
substance concentration by volume with respect to the overall mixture volume. The neat

179
diesel, biodiesel, and ethanol have also been investigated as the single-component base
fuels. The multicomponent fuel mixtures have been prepared in-lab prior to experiments
according to the procedures described in section ( 3.2). The tests have been carried out
many times for each fuel, and three successful tests are selected and saved for processing
for each case. The images have been stored in the (TIFF) format and processed according
to specifically written Matlab algorithms following the procedures described in Chapter
Three.
7.3 Results and Discussion
The first part of the results section has been dedicated for presenting and discussing
the variation in burning rate constant between the isolated fuel droplet and the
corresponding interactive fuel droplets. Then, the nucleation rates and bubble growth rates
in the multicomponent fuel droplet are discussed. The effect of nucleation and bubble
generation on the puffing and secondary atomization from the multicomponent fuel droplet
has also been discussed. Additionally, the secondary atomization and microexplosion as
two forms of physical interaction between the neighbouring droplets has been discussed.
Then, some of the processes tracked during the combustion of interacting droplets have
been presented and discussed in the final part of the present section.
7.3.1 Flame Shape and Droplet Burning Rate
As mentioned in the experimental work description of the present chapter, the
normalized droplet spacing distance has been varied along a span of (1-5). The spacing
distance is defined in Chapter Two as the distance between the centres of the adjacent
droplets normalized by the initial diameter. The present values of the normalized spacing
distance have been selected so that the magnified imaging of the droplet is not affected,
since, increasing the spacing distance results in the need to increasing the covered imaging
area by increasing the distance between the lens and the droplet. This in turn, results in
decreasing the magnification rate. Hence, the above range is selected to compromise for
both the spacing distance and droplet image magnification. Additionally, since the distance
is normalized by the droplet initial diameter, its values are not exactly the same for all the
tested fuel droplets, but all are within the above specified range. This is because the droplet

180
initial diameter is changing slightly every time within a small range, and due to the delay
resulting from suspending each droplet on its own fibre, these values are also slightly
different. Hence, the resulting normalized spacing distance is within the range but not
exactly the same for all the fuels as it will be shown in the following discussions.
Figure 7-2: The effect of droplet normalized spacing distance on the flame surrounding the burning diesel
fuel droplets.
Figure 7-2 shows the effect of changing the normalized spacing distance on the flame
surrounding the interacting diesel fuel droplets. The normalized droplet spacing distance is
set to 1.2, 1.3, 1.5, 1.8, 3.3, and 3.8 respectively. As the figure shows, for small distance
values (<2), one flame is surrounding both droplets, and for higher values of the spacing
distance (namely 3.3 and 3.8), each droplet have had its own surrounding luminous flame.
Each of the interacting droplets in the cases listed in Figure 7-2 initially had its own flame,
and then for small distances, these flames have merged into a single large flame. The same
behaviour is shown to occur during the interactive combustion of the biodiesel droplets
presented in Figure 7-3. The normalized droplet spacing distance for biodiesel fuel droplets
is set to 1.2, 1.5, 2.7, 3, 3.4, and 3.8 respectively. As shown in Figure 7-3, for the first two
cases – 1.2 and 1.5 spacing – the adjacent droplets are surrounded by a single flame. The
same fuel droplets have had two separated flames for the spacing distances 2.7, 3, and 3.4.
It is worthy to emphasize here that the ignition process of the droplets is fixed for all the
tests. This process is performed by side heating of the SiC fibre of the droplet on the right

181
side of the viewing plane. After this droplet is ignited, the droplet to the left is ignited by
the heat transferred from the burning droplet.
Figure 7-3: The interactive combustion of two-biodiesel fuel droplets at different normalized spacing
distance values.
As shown in Figure 7-3 for the 3.8 spacing distance, the droplet to the left did not
ignite despite the fact that its neighbouring droplet is already undergoing combustion. This
implies that the heat transferred to the left droplet was not sufficient for creating a
combustible mixture above the droplet, which in turn suggests that this heat was also not
sufficient for raising the surface temperature of the droplet to the boiling point of the
biodiesel.
The mechanism of flame propagation from a burning fuel droplet to its neighbouring
droplet and the subsequent ignition of the latter droplet are shown in Figure 7-4. As shown
in the figure, the droplet on the right side of the viewing plane – perpendicular to the paper
– is ignited by the hot wire ignition method described in Chapter Three. The suspension
fibre is heated by the butane flame away from the suspension point. Once it reached the
ignition point, the fuel vapour/air mixture above the droplet is ignited as shown in the
image corresponding to time 63 ms. Flame propagation then takes place as shown in
images 71 ms to 119 ms respectively. In the interim, the left side droplet – that did not
ignite yet – will start to heat up by the effect of the heat received from the adjacent droplet
via convection and radiation. This is illustrated in the liquid phase of the left side droplet in
images 87 ms to 143 ms compared to the preceding images. The heating up processes
raises the droplet surface temperature, until reaching the boiling point of the diesel. Hence,

182
fuel vapour is emitted from the droplet surface and mixed with the surrounding air forming
a combustible mixture that is ready for ignition. Once reached the instantaneous ignition
point of the diesel, the combustible mixture is ignited on top of the droplet surface as
shown by the red bounding circles in images 143 ms and 151 ms. Flame propagation took
place through the combustible mixture until the left side droplet is completely surrounded
by its own flame as shown in images 159 ms to 183 ms.
Figure 7-4: Temporal sequence of the flame propagation from a burning DW20 emulsion fuel droplet to its
neighbour droplet.
Figure 7-5 shows the interactive combustion of two BD10 fuel droplets at
normalized spacing distance values of 1.3, 1.7, 1.9, 2.4, 2.5, and 2.9 respectively. As
shown in the figure, a single flame is surrounding the two droplets for the distance values
up to 2.5, while for the spacing distance 2.9, each droplet had its own flame surrounding it.
This is the same scenario for the BD10 fuel droplets and BD30 fuel droplets. Thus, it can
be inferred that in the case of the biodiesel/diesel blends, the critical normalized spacing

183
distance below which the adjacent droplets will have a single flame surrounding them is
about 3.
Figure 7-5: The effect of normalized spacing distance on the flame surrounding the interacting BD10 fuel
droplets.
This is slightly different from the case of ethanol/diesel blends. In the case of the ED
blends a single flame is bounding the two adjacent droplets even at higher distance values,
as shown in Figure 7-6. The figure shows an example of the ED blends combustion, where
two adjacent ED10 droplets are investigated at different normalized spacing distance
values. The two droplets are surrounded by a single flame at distance values up to (2.9),
and that the two droplets have had their own separated flames at 3.4 spacing distance.
Figure 7-6: The interactive combustion of two-neighbouring ED10 fuel droplets at different normalized
spacing distance values.
Therefore, it can be suggested that the critical normalized spacing distance for the
ethanol/diesel blends is slightly above those of the biodiesel/diesel blends. This is shown to
be somewhat comparable to the critical normalized spacing distance of the emulsion
droplets. The latter are shown to have a single flame surrounding the adjacent droplet at a
distance of 3 as shown in Figure 7-4, and shown to have two separate flames at 3.4 spacing

184
distance in the case of DW20. Hence it can be deduced that the critical normalized spacing
distance of the emulsion droplets is between these two values.
The average burning rate constant during the combustion of two-neighbouring fuel
droplets has also been investigated and evaluated for all the fuels under investigation.
These include the single-component diesel, biodiesel, and ethanol, and the multicomponent
biodiesel/diesel blends, ethanol/diesel blends, water-in-diesel emulsions, and diesel-in-
water emulsions.
Figure 7-7 shows the effect of the normalized droplet spacing distance on the burning
rate constant during the interactive droplet combustion of the single-component fuels,
biodiesel/diesel blends, ethanol/diesel blends, diesel-in-water emulsions, and water-in-
diesel emulsions. The first graph in the figure shows the burning rates of the neat diesel,
biodiesel, and ethanol fuels. As shown in the graph, the burning rates of both diesel and
biodiesel fuel droplets are proportional to the droplet spacing distance, while those of the
ethanol fuel droplets are shown to be irresponsive to the normalized spacing distance. This
is attributed to the increase in the projected area of the sooty flame by increasing the
distance leading to the increasing the effect of heat transfer by radiation and convection
and in turn, rising the temperature of the surrounding environment [107]. Additionally, the
concentration gradient in the combustion zone is proportional to the normalized spacing
distance [178], hence, increasing the spacing distance causes the increase in the burning
rate.
The second graph of Figure 7-7 shows the effect of the normalized spacing distance
on the burning rate constants of the biodiesel/diesel blends. The blends are of 10%, 20%,
and 30% biodiesel volume concentration with respect to the overall volume of the mixture.
The burning rate of the BD blends shows a slight increase with increasing the normalized
spacing distance for all the blend proportions. This increase is from 0.96 to 1.01 mm2/s,
096 to 1.17 mm2/s, and 0.84 to 1.16 mm
2/s for spacing increase from 1.7 to 2.5, 0.9 to 4,
and 1.2 to 3.5 in the cases of BD10, BD20, and BD30 blends respectively. The same trends
are shown in the third graph of Figure 7-7 for the ethanol/diesel blends but with higher
values of the burning rate constant.
It can be seen from the figure also, that both the BD and ED blends show a uniform
distribution of the burning rate with respect to the spacing distance. This uniform
distribution is not seen in the cases of the emulsions presented in the fourth and fifth
graphs of the figure. The burning rates of the interactive emulsion droplets are more
scattered as a response to changing the spacing distance.

185
Figure 7-7: The effect of the normalized spacing distance (x-axis) on the average burning rate constant
(mm2/s) (y-axis) during the interactive droplet combustion of all the fuels under investigation.
0
2
4
6
8
10
0 0.5 1 1.5 2 2.5 3 3.5 4 4.5 5
Diesel
Biodiesel
Ethanol
0
2
4
6
8
10
0 0.5 1 1.5 2 2.5 3 3.5 4 4.5 5
BD10
BD20
BD30
0
2
4
6
8
10
0 0.5 1 1.5 2 2.5 3 3.5 4 4.5 5
ED10
ED20
ED30
0
2
4
6
8
10
0 0.5 1 1.5 2 2.5 3 3.5 4 4.5 5
DW10
DW20
DW30
0
2
4
6
8
10
0 0.5 1 1.5 2 2.5 3 3.5 4 4.5 5
WD10
WD20
WD30

186
This is shown in the case of the DW10 emulsion, where the burning rate constants at 1.8
and 2.6 spacing distance values are less than those at 1.3, 1.9, and 3.8 distance values. This
in turn, makes it difficult to decide whether the burning rate is proportional or inversely
proportional to the spacing distance. This is because the emulsion droplet did not undergo
complete evaporation in all the tested cases, instead, microexplosion and complete rapture
of the droplets takes place in all the cases.
Additionally, in all these cases the droplet experiences a slight increase in size rather
than the expected decrease due to the generation and growth of bubbles within these
droplets. These bubbles are grown to sizes almost comparable to the droplet size; hence the
droplet size did not decrease a lot. This resulted that the calculated droplet burning rate
constant is not precisely reflecting the burning rate of the droplet because it is simply
evaluated as the rate of change of droplet diameter with time, and because the rate of
change could not be evaluated exactly, due to the interaction between the effect of fuel
evaporation from the droplet surface that leads to droplet size decrease on one side, and the
effect of bubble growth inside the droplet that results in droplet size increase on the other.
This scenario did not occur for the other multicomponent fuel droplets, thus, the evaluated
burning rate constants reflect precisely the burning rate of the droplet for these fuels.
Furthermore, comparing the burning rate values of Figure 7-7 with those evaluated
for the isolated fuel droplet combustion described in Chapter Four, it can be inferred that
the present burning rate constants of the interactive droplet combustion are higher than
those of the corresponding isolated droplet combustion. In order to compare the difference
in magnitude between the burning rates of both cases, the ratio of these values has been
evaluated according to equation (7-1).
𝜂 =
𝐾𝑖𝑛𝑡𝑋𝑛
⁄
𝐾𝑖𝑠𝑜𝑙 ……… (7-1)
Where Kint is the burning rate during the interactive droplet combustion, Xn is the
corresponding normalized spacing distance, and Kisol is the burning rate of the isolated
droplet. The burning rate of the interactive droplet combustion has been normalized by the
spacing distance to evaluate the net value of the burning rate per unit value of the distance.
The average of all the η ratio values and the corresponding standard deviation values have
been evaluated and presented in Figure 7-8. As the figure shows, the value of η for the neat
diesel and biodiesel are slightly above unity, while that of the neat ethanol is below unity.

187
The η values of the multicomponent fuel mixtures are all above unity implying higher
burning rates of the interactive fuel droplet combustion compared to the corresponding
isolated fuel droplet combustion. However, different ratio magnitudes are obtained for
each fuel mixture.
Figure 7-8: The average of η for all the fuels under investigation.
The BD blends have shown the least ratio magnitudes among all the multicomponent fuel
mixtures, with values in the range of 1.1-1.5. The ED blends also are showing η values in
the range of 1.5-1.7, whereas these values jump to the ranges of 3-7 and 4-10 in the cases
of the DW and WD emulsions respectively. Although, the standard deviation of all the
emulsion droplets are relatively high, suggesting an uneven repeatability of the calculated
ratio compared to those of the BD and ED blends in addition to the single-component
fuels.
In conclusions, the burning rate of the multicomponent and even single-component
fuel droplets under interactive combustion is almost proportional to the spacing distance
separating between the adjacent droplets. And that the critical normalized spacing distance
below which the two adjacent droplets will have a single flame surrounding them is about
3 in the case of the biodiesel/diesel blends, and slightly above 3 for each of the
ethanol/diesel blends, water-in-diesel emulsions, and diesel-in-water emulsions.
With the flame shape and droplet burning rate constant of the interacting fuel
droplets are clarified, it is time now to further investigate the liquid-phase of the interacting
fuel droplets. This is carried out in the next section.
0
2
4
6
8
10
12
14
16
Av
era
ge η

188
7.3.2 Nucleation and Bubble Growth Rates
As mentioned in the experimental work description, for studying the liquid-phase
dynamics, the camera is set to 40000 fps framing rate rather that the 1000 fps used for
studying flame shape and burning rate. Hence, a magnified high speed tracking of the
interiors of the two-interacting fuel droplets is achieved.
Figure 7-9: Temporal sequence of the bubble growth inside a WD20 droplet during the combustion of two-
interactive droplets.
Figure 7-9 shows the temporal sequence of bubble growth inside one of the
interactively burning WD20 fuel droplets. The bubble is initiated in one site and travelled
due to circulation inside the droplet into another site. The sequence of bubble growth is the
same as discussed in Chapter Six, therefore, no further discussions will be performed on
this issue. However, the number of bubbles generated is noticed to be higher than that of
the isolated fuel droplets. Hence, statistical investigation has been carried out to compare
the nucleation rates of the multicomponent fuel droplets during interactive two droplet
combustion with those obtained in Chapter Six for the isolated droplets during combustion.
Figure 7-10 shows the effect of biodiesel, ethanol, and water concentrations on the average
nucleation rate within the biodiesel/diesel blend, ethanol/diesel blend, water-in-diesel
emulsion, and diesel-in-water emulsion fuel droplets. The nucleation rate has been
presented in the logarithmic form due to the big difference in magnitudes between the
different multicomponent fuel mixtures. As shown in the figure, the nucleation rate for all
the fuel mixtures is inversely proportional with the concentration of the substance –

189
biodiesel, ethanol, or water – added to diesel. This is the same trend shown for the
nucleation rate inside the isolated fuel droplets of these mixtures in Chapter Six.
Additionally, the emulsion droplets of both water-in-diesel and diesel-in-water have had
the highest nucleation rates, followed by the ethanol/diesel blends, and the lowest are the
biodiesel/diesel blends. Again, this is attributed to the miscibility of the added substances
on diesel, where biodiesel is completely miscible in diesel so that the resulting mixture
from blending diesel with biodiesel has the most stable structure compared to the others
and accordingly the lowest nucleation rate is obtained. This is because nucleation takes
place due to the separation of the constituents and superheat boiling of the low boiling
point components.
Figure 7-10: Average nucleation rate with respect to the concentration of the substance added to diesel in the
multicomponent fuels during the combustion of two interacting fuel droplets.
Ethanol on the other hand, is partially miscible in diesel; therefore, the nucleation rate
within the ethanol/diesel blends is higher than that in the corresponding biodiesel/diesel
blends of the same concentrations. Whereas, the water is completely immiscible in diesel,
therefore, the resulting emulsions – whether WD or DW – are unstable and the separation
of the components is potentially high. Thus, the nucleation rate within the emulsion
droplets is the highest as shown in Figure 7-10. Furthermore, to compare the nucleation
rate within the multicomponent droplets during both isolated combustion and interactive
combustion conditions, the ratio of the latter to the former has been evaluated and
presented in Figure 7-11 with respect to the concentration of both water and ethanol on the
0
1
10
100
0 10 20 30 40
Lo
g N
ucl
eati
on
Ra
te (
N/1
00
ms)
Additive Content (%)
WD DW BD ED

190
left side, and water and biodiesel on the right side. In order to illustrate the similarity in
behaviours, the water-in-diesel emulsions and ethanol/diesel blends are presented together,
while the diesel-in-water emulsions and biodiesel/diesel blends are plot together. As the
figure shows, generally, the nucleation rate within the interacting fuel droplets is higher
than that within the corresponding isolated fuel droplets. This is imputed to the higher heat
transfer rates to the droplet from the neighbouring droplet and its surrounding flame. This
in turn increases the temperature of the liquid-phase of the droplet and increases the
superheat boiling of the low boiling point components in the mixtures, leading to
augmenting the nucleation sites and nucleation rate in the droplet interior.
Figure 7-11: The effect of additive concentration on the ratio of the average nucleation rate evaluated to the
two-interacting fuel droplets to that evaluated to the single isolated fuel droplet.
Additionally, it can be seen from the figure that even the BD blends which are the least in
nucleation rate are experiencing an increase in the nucleation rate during the two-droplet
interactive combustion. This increase may reach up to more than three times the rates of
the isolated droplet as sown in the case of BD10 fuel blend. These high ratio magnitudes of
the BD blends and also the ED blends are due to the lower nucleation rates reported for
these fuels in the isolated droplet case, which makes the denominator relatively small,
whereas in the case of emulsions, the denominator is relatively large therefore, the ratio of
the nucleation rate between the two-droplet and single droplet combustion is slightly above
unity in most of the cases except the DW10 case in which the ratio is up to two and a half.
Figure 7-12 shows the effect of additive concentration on the average bubble growth
rate within the multicomponent fuel droplets. The bubble growth rate has been presented in
0.0
0.5
1.0
1.5
2.0
2.5
3.0
3.5
4.0
0 10 20 30 40
Nu
clea
tio
n R
ate
Ra
tio
Additive Content (%)
WD
ED
0.0
0.5
1.0
1.5
2.0
2.5
3.0
3.5
4.0
0 10 20 30 40
Nu
clea
tio
n R
ate
Ra
tio
Additive Content (%)
DW
BD

191
the logarithmic format because of the big value difference between the different fuel
mixtures. From the figure it can be seen that except the diesel-in-water emulsion, the
bubble growth rate is inversely proportional to the increase in additive concentration.
Additionally, it can be seen that the ethanol/diesel blends and water-in-diesel emulsions
have had the highest growth rates, while the lowest growth rates are shown in the case of
the biodiesel/diesel blends which are preceded by the diesel-in-water emulsions. This is in
agreement with the nucleation rate behaviours shown in Figure 7-10.
Figure 7-12: The effect of additive concentration on the average bubble growth rate during the combustion
of two-interacting fuel droplets.
7.3.3 Secondary Atomization and Micro-Explosion
The interaction between the adjacent droplets may take different forms, such as the
thermal interaction shown in the form of increased high transfer rates between the droplets
as formerly discussed, sharing the same flame in the case of small size droplets, and the
dynamic interaction shown in the collision and coalescence of these droplets. On the other
hand, the multicomponent fuel droplet combustion is mostly characterized by the high
rates of secondary atomization. Hence, the effect of this process on the neighbouring
droplets may be added to the dynamic interaction between the adjacent droplets. Therefore,
understanding the effect of secondary atomization on the neighbouring droplets is essential
for understanding the overall dynamic behaviour of the real spray during combustion.
Figure 7-13 shows the temporal sequence of the impact and merge of sub-droplet
emitted from a burning WD10 fuel droplet with an adjacent droplet. The sub-droplet is
1
10
100
1000
10000
100000
0 10 20 30 40
Lo
g(B
ub
ble
Gro
wth
Ra
te)
Additive Content (%)
BD
ED
WD
DW

192
emitted from the droplet on the right side of the viewing plane. It continued moving
towards the droplet on the left side as shown in images 187.25 ms to 187.85 ms. The sub-
droplet, then touched the droplet as shown by the red bounding box in image 187.90 ms.
The collision between the left droplet and moving sub-droplet then occurred in the form of
coalescence as shown in image 187.90 ms and the subsequent images. By this coalescence,
the sub-droplet is merged with the droplet causing an increase in the size and mass of the
latter. The droplet has also experienced a shape change due to the impact of the fast
flowing sub-droplet as shown in image 188.20 ms. Hence, it can be deduced that this form
of interaction between the neighbouring droplets – that is not available in the case of
isolated droplets – is effective in defining the nature of the consequent combustion
behaviour of the droplet.
Figure 7-13: Temporal sequence of WD10 droplet merging with a sub-droplet emitted from a neighbouring
parent droplet.
Another form of droplet-droplet interaction is revealed in the effect of droplet
microexplosion on its neighbour droplet as shown in Figure 7-14. The droplet on the left
hand side of the viewing plane is exploded by the high pressure burst of the bubble inside
as explained in Chapter Six. The resulting explosion wave has travelled radially as shown
in images 0.03 ms and 0.13 ms. This wave then, hit the droplet on the right causing an
impact-like disturbance on the droplet side facing the wave as shown in images 0.13 ms to
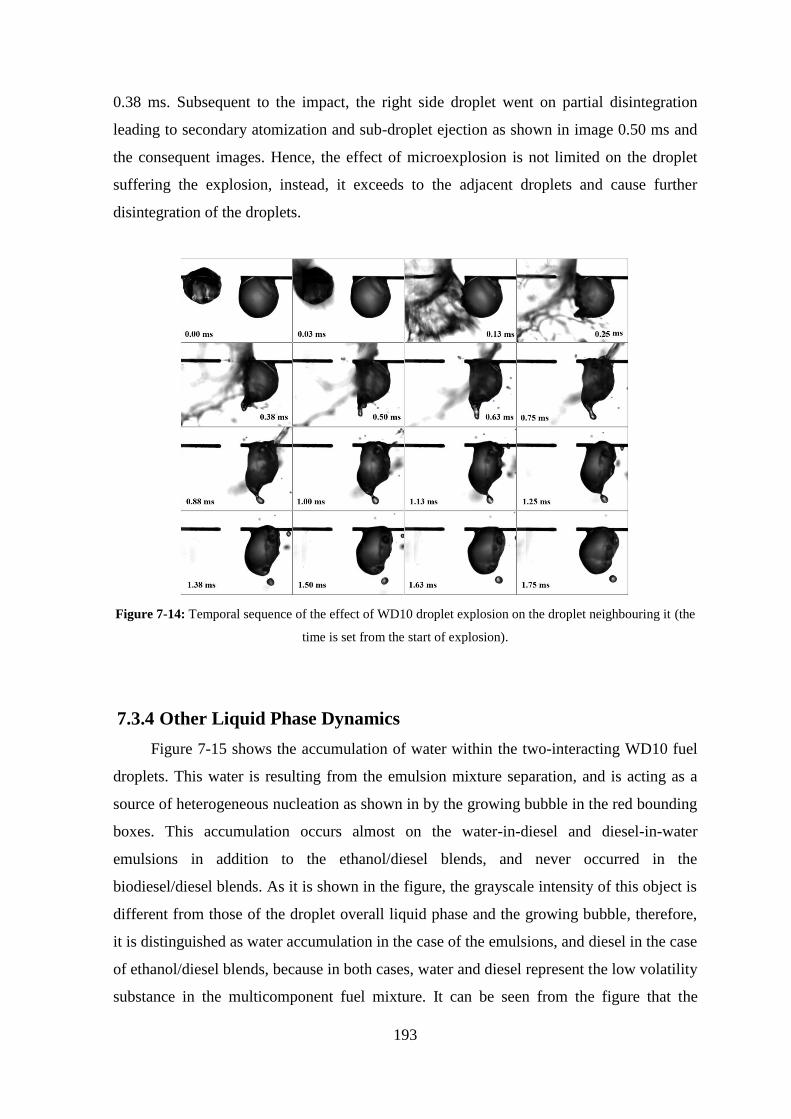
193
0.38 ms. Subsequent to the impact, the right side droplet went on partial disintegration
leading to secondary atomization and sub-droplet ejection as shown in image 0.50 ms and
the consequent images. Hence, the effect of microexplosion is not limited on the droplet
suffering the explosion, instead, it exceeds to the adjacent droplets and cause further
disintegration of the droplets.
Figure 7-14: Temporal sequence of the effect of WD10 droplet explosion on the droplet neighbouring it (the
time is set from the start of explosion).
7.3.4 Other Liquid Phase Dynamics
Figure 7-15 shows the accumulation of water within the two-interacting WD10 fuel
droplets. This water is resulting from the emulsion mixture separation, and is acting as a
source of heterogeneous nucleation as shown in by the growing bubble in the red bounding
boxes. This accumulation occurs almost on the water-in-diesel and diesel-in-water
emulsions in addition to the ethanol/diesel blends, and never occurred in the
biodiesel/diesel blends. As it is shown in the figure, the grayscale intensity of this object is
different from those of the droplet overall liquid phase and the growing bubble, therefore,
it is distinguished as water accumulation in the case of the emulsions, and diesel in the case
of ethanol/diesel blends, because in both cases, water and diesel represent the low volatility
substance in the multicomponent fuel mixture. It can be seen from the figure that the

194
growth time of the bubble generated on the water mass is about 0.95 ms which is relatively
short period, this implies that the accumulation of water – or diesel in the ED blend –
enhances bubble growth rate, and in turn, the subsequent dynamics such as puffing and
secondary atomization.
Figure 7-15: Temporal sequence of the effect of water agglomeration on the nucleation and bubble growth
within a WD10 droplet.
Another phenomenon that is noticed to occur in the droplet liquid-phase is the
internal circulation of the droplet. This phenomenon has already been described by a
number of studies. However, in the present work it is noticed that the direction of this
circulation is variable between the left and right hand side droplets. Figure 7-16 shows the
temporal sequence of bubble circulation inside each of the two-interactive burning BD10
fuel droplets. The motion of the bubble in the left droplet is tracked by the red bounding
box, and that of the bubble in the right droplet is tracked by the yellow box. As the figure
shows, the bubble in the yellow box is moving clockwise and that in the red box is moving
counter-clockwise. This direction has been noticed to occur for all the bubbles inside all
the droplets, but, the case in Figure 7-16 is selected to be representative because the bubble
motion inside the two droplets is occurring simultaneously. Accordingly, this internal
circulation is attributed to the effect of the SiC fibre on the droplet, because the direction of
circulation is always starting from the side of the fibre and continuing to the other side.

195
Figure 7-16: Temporal sequence of the effect of the SiC fibre on inducing circulation within the suspended
burning droplets.
This in turn, suggests that the suspension fibre has an effect on inducing circulation within
the droplet due to the temperature difference between the fibre and the droplet liquid-
phase. This is in agreement with the findings of Liu et. al., [281] about the effect of the
supporting fibre on inducing gas-phase micro-convection during the combustion of n-
octane and n-decane fuel droplets in microgravity.
Figure 7-17: Temporal sequence of the soot aggregation around a burning diesel fuel droplet (the time is set
from the appearance of the soot).

196
Moreover, Figure 7-17 shows the local and instantaneous soot aggregation on one
side of a burning neat diesel fuel droplet during the interactive combustion of two adjacent
fuel droplets. The neat diesel fuel is burning steadily without any chaotic shape variation
and sub-droplet emission. Hence, flow visualization within and around the diesel fuel
droplet is easier than that during the multicomponent fuel droplet combustion. Once
formed, the soot aggregated on the outer side of the right hand side droplet as shown in
images 0.75 ms to 11.25 ms. The soot aggregation on this side is because it represents the
boundary of the flame surrounding both droplets; therefore, soot aggregation on the middle
part between the two droplets was not possible. Thereafter, the soot move upwards due to
the buoyancy effect as shown in images 5.25 ms to 11.25 ms. The upward motion of the
soot takes the form of a vortex as shown in the figure. This suggests the existence of such
vortices around the burning droplet.
7.4 Summary
In the present chapter, a magnified high speed imaging of the liquid-phase during the
interactive two droplet combustion of the multicomponent fuels in addition to the base
single-component fuels have been implemented. The effect of droplet-droplet interaction
on the droplet burning rate constant and the resulting flame shape have been firstly
investigated. Then, the effect of the interactive droplet combustion on the nucleation and
bubble generation within the droplet has been investigated. Quantitative analysis has then
been performed for estimating the nucleation and bubble growth rates. The results have
shown that compared to the isolated fuel droplet results, both nucleation and bubble growth
rates within the multicomponent fuel droplet are increased with the presence of an adjacent
fuel. These rates may reach to up to three times the rates of the corresponding isolated fuel
droplet. This is attributed to the increased heat transfer rates to the droplet from the
adjacent fuel droplet and its surrounding flame.
The effect of secondary atomization and microexplosion processes of one of the
droplets on the other neighbouring droplet has also been investigated. These processes are
shown to enhance the secondary atomization and sub-droplet emission propensity of the
droplet by causing impact like action that induces droplet disintegration.
Furthermore, separation and accumulation of diesel in the ethanol/diesel blends, and
water in the water-in-diesel and diesel-in-water emulsions has also been observed.

197
Chapter 8. Summary and Future Work
8.1 Summary
In the present work, a high speed backlighting and shadowgraph imaging and
subsequent image processing leading to quantitative analysis of the multicomponent fuel
droplet combustion including liquid-phase dynamics are performed. Two categories of
multicomponent fuels – in which diesel is the base fuel – are prepared and utilized. The
first category is the biodiesel/diesel and bioethanol/diesel blends, while the second
category is the water-in-diesel and diesel-in-water emulsions.
Specific optical setups are developed in-lab and used for tracking droplet
combustion. The first setup is associated with the backlighting imaging with the resulting
magnification of the droplet images being 30 times the real size. The second optical setup
is used for Schlieren and shadowgraph imaging, with the resulting magnification being 10
times the real size for both techniques. Those magnifications made the high speed
visualization and tracking of the droplet interior easily affordable.
Using the aforementioned optical setups, spatial and temporal tracking of nucleation,
bubble generation, internal circulation, puffing, microexplosion, and secondary
atomization during the combustion of isolated multicomponent fuel droplets are
performed. This offered the privilege of full sequential tracking of droplet secondary
atomization from initiation to sub-droplet generation.
8.1.1 Shape and Size Characteristics of the Isolated Multicomponent
Fuel Droplet
Both types of emulsions show an increase in the burning rate with increasing water
content in the emulsion, with higher rate for the WD emulsion. This is attributed to
the increase in puffing and secondary atomization from the emulsion droplets that
enhances air fuel mixing and in turn increases burning rate. And it is in agreement
with the published results.
Increasing the concentrations of ethanol and biodiesel in the mixture will lead to a
steep – in the ED blends – and slight – in the BD blends – decrease in the droplet
198
burning rate. This is expected in light of the burning rate values of the single-
component fuels (diesel, biodiesel, and ethanol) respectively, and is in agreement
with the published work on diesel burning rate values when blended with biodiesel
and ethanol respectively.
The BD blends are burning relatively smoothly compared to the other
multicomponent fuels as a result of the miscibility of diesel and biodiesel in each
other leading to a relatively homogeneous mixture. The early stage constant droplet
size shown for the single-component fuels is also occurring with the BD fuel
droplets. Moreover, for a short time period within the interval bounded by the 50%
and 60% portions of the droplet lifetime, a slightly constant droplet size pattern is
noticed for the blends compared to diesel and biodiesel. This is referred to the
heating and evaporation of the less volatile component in the multicomponent
mixtures.
The ED blends have shown the most chaotic behaviour among all the studied fuels.
This is attributed to the partial miscibility of ethanol in diesel as stated previously.
Hence, compared to the mixtures produced by blending diesel with biodiesel –
which are completely miscible in each other – and the emulsions generated by
mixing water with diesel – with the aid of the emulsifying agents – blending diesel
with ethanol results in highly metastable mixtures. This random droplet combustion
behaviour of the ED blends is in agreement with the published results.
The same combustion behaviour of the ED blends is shown to happen during the
combustion of the emulsion droplets with less instability. This is due to the effect of
the emulsifying agents used for preparing the emulsions. These agents act as
mixture stabilizers that prevent phase separation within the emulsified fuel.
Generally, the multicomponent fuel droplets show a higher droplet size fluctuation
compared to the single-component fuel droplets. The intensity of this fluctuation is
uneven among the multicomponent fuel droplets because of the effect of
components miscibility in each other and the resulting mixture stability as
explained above. This intensity is higher at the second half of the droplet lifetime
for all the studied fuels. And is occasionally high compared to the droplet initial
diameter.
Increasing the additive concentration in the ED and BD blends decreases the
fluctuations in the droplet size. This is exactly the opposite in the case of emulsion

199
droplets, where the fluctuation is increased by increasing the concentration of water
in the emulsion. The size increase occurrence time is almost the same and it
accounts for about 40-50% of the droplet lifetime. This implies that in a large
portion – almost half – of its lifetime, the burning multicomponent fuel droplet
experiences size fluctuation leading to an increase in its diameter. This fluctuation
is basically attributed to the stability of the multicomponent fuel mixture resulting
from the miscibility of its components in each other.
There are three distinctive stages in the combustion of the fuel droplet. The first
stage is shown in the early 20% of the droplet lifetime, where ignition and flame
initiation takes place, followed by flame propagation. The second stage is for the
next 60% of droplet lifetime, where steady burning of fuel takes place, and flame
size is relatively constant. And the third stage is the last 20% of the droplet lifetime,
where the flame starts to shrink height wise while its width remains almost the
same until the final stages of combustion.
At the early 10% of the overall droplet combustion time, the diesel droplet
experiences dramatic increase in flame height, thereafter, the flame decreases
slightly, and grows again. This increase in flame height is attributed to the
combustion of the diesel vapour that is generated during droplet heating prior to
ignition. After the vapour is consumed by combustion, flame height decreases to a
certain level that is defined by the rate of diesel fuel evaporation from the droplet
surface and the tendency of this fuel to generate soot during combustion.
Compared to the flame surrounding the neat diesel fuel droplet, the flames of all the
diesel-based multicomponent fuels are lower in height and similar in width.
Accordingly, lower sooting tendency of the multicomponent fuels is suggested.
This is in agreement with the published data for biodiesel/diesel blends,
ethanol/diesel blends, and water/diesel emulsions.
The three combustion stages shown during the combustion of the single-component
fuels are also recognisable for the multicomponent fuels, especially for the BD and
ED blends. However, for the WD and DW emulsions, the third stage is shifting to
the final 10% of the droplet lifetime.
The sudden increase in flame height noticed during the combustion of the neat
diesel droplet has also been observed during the early stages of droplet combustion
of the ethanol/diesel blends and water-in-diesel emulsions. Though, in the case of

200
biodiesel/diesel blends, the sudden increase in flame height is barely recognized to
occur during the combustion of the blend.
The flames surrounding the emulsion droplets have experienced sudden decrease in
the size – both height and width – midterm the droplet lifetime. This reduction in
the luminous flame size is ascribed to the instantaneous blow-off of the flame due
to water vapour emission from the droplet by puffing. This water vapour blows the
soot – that gives the flame its luminosity - away from the droplet so that the
luminous flame height appears to be reduced. Once the effect of the vapour jet is
retracted, soot accumulation upstream resumes, and the flame retrieve its size.
Since flame width is almost constant and is not affected by buoyancy, it might be
considered as the flame diameter. Especially, when compared with flame results
under zero gravity conditions, it shows a good similarity in shape and magnitude.
Accordingly, with the aid of droplet diameter variation and using the flame width
as its diameter, the flame stand-off ratio is evaluated.
8.1.2 Puffing, Sub-droplet Emission, and Microexplosion Characteristics
of the Isolated Multicomponent Fuel Droplet
Shadowgraph imaging is found to be effective in tracking the vapour jets emerging
from the droplet in the form of puffs. The boundaries of the jets were clearly
distinguishable from other objects in the image including the droplet.
The single-component droplets did not experience puffing and secondary
atomization occurrences during their lifetimes. However, some odd puffing
incidents took place at the end of both neat biodiesel and neat diesel droplets. These
puffing events are attributed to the heterogeneous nucleation inside the diesel and
biodiesel droplets.
Generally, the droplets of all the multicomponent fuel mixtures studied in the
present work have experienced puffing and secondary atomization. The puffing
incidents are shown to occur over the entire droplet lifetime. The number and
intensity of these puffs are variable for each type of the multicomponent fuel
mixtures.
The biodiesel/diesel blends have shown the least number of puffs compared to the
other mixtures that were relatively comparable to each other. Furthermore, some of

201
the water-in-diesel and diesel-in-water emulsion droplets have suffered
microexplosion before undergoing complete evaporation. This in turn, have
resulted the emulsion droplets are experiencing high number of puffs along a short
period of time, resulting in higher puffing rates compared to the droplet of the
biodiesel/diesel and ethanol/diesel blends.
Despite the type of fuel mixture, almost all the droplets shared the same sequence
of events before and during puffing. The first sign of puffing occurrence is the
droplet size increase. This increase is attributed to the bubble growth inside the
droplet prior to puffing. This bubble continues pushing the thin layer of the droplet
surface outwards from inside until the moment when the droplet surface cannot
withstand this force, so the droplet raptures locally and the vapour contained in the
bubble emerges outside in the form of a jet. The release of the vapour from the
droplet causes sudden size reduction and shape deformation of the burning droplet.
If the puff is weak, the droplet will retain its original shape and size after a short
period of recoiling. And, if the puff is strong, ligament detachment from the droplet
surface leading to sub-droplet generation will take place.
Prior to sub-droplet ejection, the parent droplet is found to encounter a certain
shape change that may be linked to the strength of the puff and in turn, to the size
of the bubble triggering that puff.
The maximum penetration of the vapour jet is found to range from a fraction of the
droplet radius to several droplet radii, and is proportional to the concentration of the
added component. The average vapour ejection velocity is also increasing with the
increase of additive concentration in the multicomponent fuel mixture for all the
fuels.
The number of sub-droplets generated by secondary atomization is proportional to
the concentration of both water and biodiesel in the cases of WD emulsions and BD
blends, while it is inversely proportional to the water and ethanol concentrations for
the DW emulsions and ED blends respectively.
Increasing the ethanol concentration in the blend resulted in a slight change in the
sub-droplet ejection behaviour of the droplet. For the ED10 droplets, multiple sub-
droplets are ejected per single incident. The number of these sub-droplets is shown
to decrease and their sizes increase when the ethanol concentration is increased.

202
Both of the WD and DW emulsions have experienced a significant increase in the
sub-droplet ejection processes. This suggests higher nucleation rates compared to
the BD and ED blends. This high nucleation rate is attributed to the large specific
volume change of water in the emulsion droplet compared to components of the
blends, in addition to the wide dispersion of water droplets in the emulsion mixture
compared to the blends, this in turn, results in higher number of nucleation sites
initiation within the emulsion mixture at the same time compared to the blends.
The sub-droplet emission rate is shown to decrease in the DW emulsions with
increasing the water concentration due to the effect of surfactant used for emulsion
preparation.
The secondary atomization portion of the droplet lifetime represents an
infinitesimally small percentage of the overall droplet lifetime. However, this small
percentage is important for enhancing fuel evaporation and increasing fuel-air
mixing. Thus, increasing this portion of time is important as well.
Generally, each of the four mixtures is following a certain secondary atomization
trend that is different from the other mixtures. This trend is responsive to the
increase of the additive in that mixture. The secondary atomization in the emulsion
droplets almost lasts to the end of the droplet lifetime. This is because the emulsion
droplets usually do not undergo complete evaporation; instead droplet
microexplosion takes place fragmenting the droplet into smaller size sub-droplets.
This phenomenon did not occur during the combustion of the biodiesel/diesel and
ethanol/diesel blends, so that secondary atomization from the droplets of these
mixtures does not last to the end of the droplet lifetime.
Schlieren imaging is found to be effective in tracking the explosion wave formed
due to the microexplosion of the emulsion droplets.
Droplet microexplosion is shown to initiate locally in a single site on the droplet
surface. And is a result of a catastrophic burst of a single bubble inside the droplet.
This bubble pushes the droplet surface outside under the action of the high pressure
of the bubble interior causing the droplet to completely disintegrate into smaller
size sub-droplets.
The droplet explosion diameter is found to be proportional to the concentration of
water in the emulsions in the case of the WD emulsions and inversely proportional

203
in the case of DW emulsions. This is due to increasing bubble growth in the former
and water/diesel separation in the latter.
The effective diameter of the explosion wave resulting from the WD emulsion is
higher than that of the DW emulsions. This suggests that higher internal pressure in
the bubbles is produced in the case of the WD emulsions compared to the DW
emulsions. Additionally, increasing the water concentration in the emulsions is
shown to decrease the effective diameter in the case of WD emulsions, and
decreases it in the case of DW emulsions.
8.1.3 Liquid-Phase Dynamics of the Multicomponent Fuel Droplet
The SiC fibre has no – or negligibly small – effect on the droplet when its size is
relatively large. However, the effect of the fibre becomes more obvious when the
droplet size is relatively small and is comparable to the fibre size. This effect on the
liquid-phase takes place in the form of heterogeneous nucleation and bubble
generation on the interface between the fibre and the droplet liquid.
The nucleation and bubble generation within the single-component fuel droplets is
mostly infrequent, and that the scarce incidents are either because of dissolved
gases or low boiling components as in the diesel.
The biodiesel/diesel blend droplets are characterized by the least nucleation and
bubble generation incidents among all the mixtures. Whereas, the ethanol/diesel
blends, water-in-diesel-emulsions, and diesel-in-water emulsions are all
characterized by high nucleation and bubble generation incidents. These chaotic
behaviours are reflected on the shape of the burning droplet. The droplets endure
high shape deformations subsequent to the puffing incident.
Subsequent to puffing, some of the liquid is ejected outside the droplet
accompanied by the detachment of different size ligaments in the form of sub-
droplets.
The nucleation rates of all the investigated mixtures are inversely proportional to
the concentration of the additive in that mixture. However, the degree of this
proportionality is variable among those mixtures. The nucleation rate in the WD
emulsions is the highest among all mixtures, while that of the BD blends is the

204
least, this could be a reflection to the miscibility of these liquids to diesel, where
biodiesel is completely miscible and water is completely immiscible.
The nuclei could initiate at any location inside the droplet, whether this location is
the droplet centre or any of the peripheries.
The bubble growth rate of ethanol/diesel blends is proportional to the increase of
ethanol concentration in the blend, while, those growth rates of both
biodiesel/diesel blends and water-in-diesel emulsions are inversely proportional to
the increase in both biodiesel and water concentrations in the mixture. The bubble
growth rate of the diesel-in-water emulsions on the other hand is found to be
unaffected by the increase of water concentration in the emulsion.
Some of the bubbles are shown to merge into single large bubble. These merging
incidents are playing crucial rules in the dynamics of the droplet surface since these
processes unite multiple small bubbles in one large bubble; the explosion of this
large bubble is expected to be more effective than the initial smaller ones.
The effect of bubble burst on the sub-droplet ejection from the surface of the
burning fuel droplet is revealed. Prior to burst, the bubble is adjacent to the droplet
surface. Hence, it is forcing the frontal thin liquid layer of the liquid until it is in
contact with the gaseous environment. So, the pressure difference across the bubble
causes its rapture releasing all the content vapour outside. The release of this
vapour will create a low pressure spot on the droplet surface causing the
surrounding liquid on the droplet to flow towards this spot. This inward motion of
the liquid edges results in a reflective outward motion of part of the liquid due to
the impact of the liquid edges in the low pressure spot.
During the magnified monitoring of the droplet liquid-phase throughout the
combustion of the multicomponent fuel droplets, some of the droplets belonging to
the ethanol/diesel blends, water-in-diesel and diesel-in-water emulsions have
experienced a kind of component separation. This is followed by accumulation of
one of these components in the form of a spherical object that is moving in the core
of the droplet. This type of separation and accumulation has not been noticed to
occur during the combustion of biodiesel/diesel blends, which may be attributed to
the complete miscibility of biodiesel in diesel.

205
8.1.4 Two-Neighbouring Droplets Interaction
The critical normalized spacing distance below which the two adjacent droplets will
have a single flame surrounding them is found to be about 3 in the case of the
biodiesel/diesel blends and slightly higher for each of the ethanol/diesel blends,
water-in-diesel emulsions, and diesel-in-water emulsions.
The same trends of the burning rate constants evaluated for the isolated droplet
combustion are obtained for the interactive two-droplet combustion. However, the
ratio of the droplet burning rate constant of the interactive droplet combustion to
that of the isolated droplet combustion is higher than unity. This implies that the
droplet burning rate constant for all the fuels under investigation is higher than that
of the isolated droplet combustion for these fuels. Therefore, the interactive droplet
combustion has an effect on the predicted droplet burning rate compared to that of
the isolated droplet combustion. This is attributed to the increased heat transfer rate
to the droplet by the presence of the neighbouring droplet with its surrounding
flame.
The nucleation rate of all the fuel mixtures is inversely proportional to the
concentration of the substance – biodiesel, ethanol, or water – added to diesel. This
is the same trend shown for the nucleation rate inside the isolated fuel droplets of
these mixtures. Additionally, the emulsion droplets both water-in-diesel and diesel-
in-water have had the highest nucleation rates, followed by the ethanol/diesel
blends, and the lowest are the biodiesel/diesel blends. This is attributed to the
miscibility of the added substances on diesel.
The nucleation rate within the interacting fuel droplets is higher than that within the
corresponding isolated fuel droplets. This is imputed to the higher heat transfer
rates to the droplet from the neighbouring droplet and its surrounding flame.
Except the diesel-in-water emulsion, the bubble growth rate is inversely
proportional to the increase in additive concentration. Additionally, the
ethanol/diesel blends and water-in-diesel emulsions have the highest growth rates,
while the lowest growth rates are shown in the case of the biodiesel/diesel blends
which are preceded by the diesel-in-water emulsions.

206
8.2 Future Work
During the course of this research, there appear some aspects that can be further
developed to enhance this work; the following suggestions could serve as further topics of
research within the same field of this thesis.
8.2.1 Multi-Component Fuels:
i. Producing and testing micro- and nano-emulsions (both water-in-diesel and diesel-in-
water).
ii. Trying higher diesel, biodiesel, and ethanol blends.
iii. Trying tri-component diesel mixtures.
iv. Studying the chemical side of the problem by performing colour image processing.
v. Studying the effect of nano-particles on the droplet dynamics.
vi. Studying the effect of blending diesel by Ferro fluids on the droplet dynamics.
vii. Testing the effect of diluting the environment by CO, CO2, and N2 respectively.
viii. Investigating the effect of boiling point difference between diesel and its different
blending additives on the droplet dynamics.
ix. Blending diesel by another fuel with a boiling point equal or at least very close to that
of water, and then comparing the results. And then emulsifying diesel by another
liquid that is immiscible with diesel, and comparing the results. This is for
investigating whether the chaos behaviour of water/diesel fuels is because of
chemistry or boiling point difference.
8.2.2 Developing the Experimental Techniques:
i. Using simultaneous high speed imaging for studying different levels of the droplet
combustion at the same time. This may be performed using two cameras, one for the
flame characteristics and the other for droplet liquid-phase dynamics. This will insure
relevant and confirmed matching between the liquid phase dynamics and the flame
dynamics.
ii. Performing three dimensional analyses for the sub-droplets generated by secondary
atomization. This can be carried out using magnified stereo imaging for visualizing of
the sub-droplet. Alternatively, magnified stereo shadowgraphy can be utilized for the
same purposes.

207
iii. Trying other non-intrusive methods for suspending the droplet, such as ultrasonic
suspension or electromagnetic fields.
8.2.3 Droplet Dynamics:
i. Studying the effect of environmental conditions (pressure and/or temperature) on the
droplet dynamics if possible.
ii. Studying the effect of forced convection on droplet dynamics.
iii. Performing three dimensional analysis for the sub-droplets generated by secondary
atomization.
iv. Trying more than two-adjacent droplets for studying droplet interactions. However,
increasing the number of adjacent droplets will affect the image magnification rate.
v. Focusing on droplet dynamics during ignition, but with more precise ignition
technique.
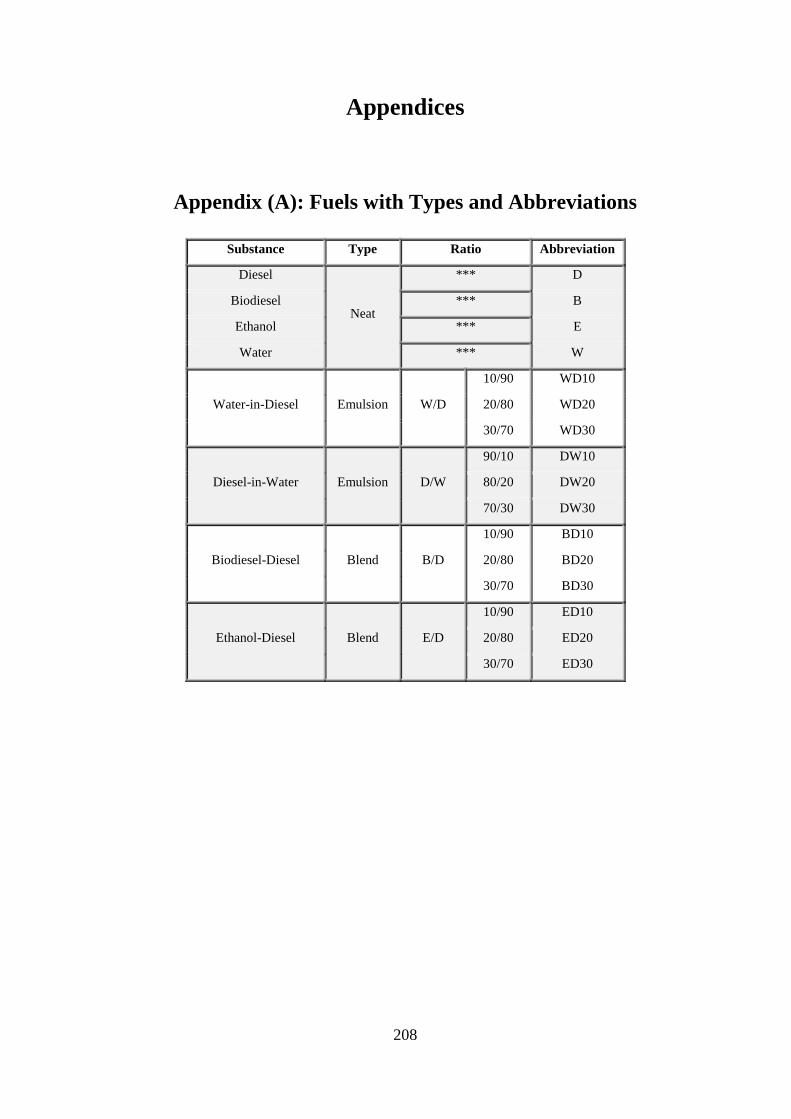
208
Appendices
Appendix (A): Fuels with Types and Abbreviations
Substance Type Ratio Abbreviation
Diesel
Neat
*** D
Biodiesel *** B
Ethanol *** E
Water *** W
Water-in-Diesel Emulsion W/D
10/90 WD10
20/80 WD20
30/70 WD30
Diesel-in-Water Emulsion D/W
90/10 DW10
80/20 DW20
70/30 DW30
Biodiesel-Diesel Blend B/D
10/90 BD10
20/80 BD20
30/70 BD30
Ethanol-Diesel Blend E/D
10/90 ED10
20/80 ED20
30/70 ED30

209
Appendix (B): Neat Fuel Properties
Fuel Property Unit Diesel Biodiesel Ethanol
Kinematic Viscosity @ 40ºC mm2/s 3.05
(a) 4.363
(a) 1.08
Density @ 15.5ºC kg/m3 830
(a) 877.8
(a) 785
Specific Gravity @ 15.5ºC --- 0.83(a)
0.88(a)
0.79
Flash Point ºC 79(a)
122(a)
16.6
Cloud Point ºC 3(a)
5(a)
Boiling Point ºC 181(b)
302(b)
78
Pour Point ºC -35 to -15(b)
-15 to 10(b)
Surface Tension @ 25ºC mN/m 28.2(b)
30.7-31.1(b)
22.1
Higher Heating Value MJ/kg 47.8(b)
41.2(b)
29.7
Lower Heating Value MJ/kg 43.2(b)
37.1(b)
26.8
Latent Heat of Vaporization kJ/kg 254(b)
254(b)
873
(a) From the supplier. (b) From literature.
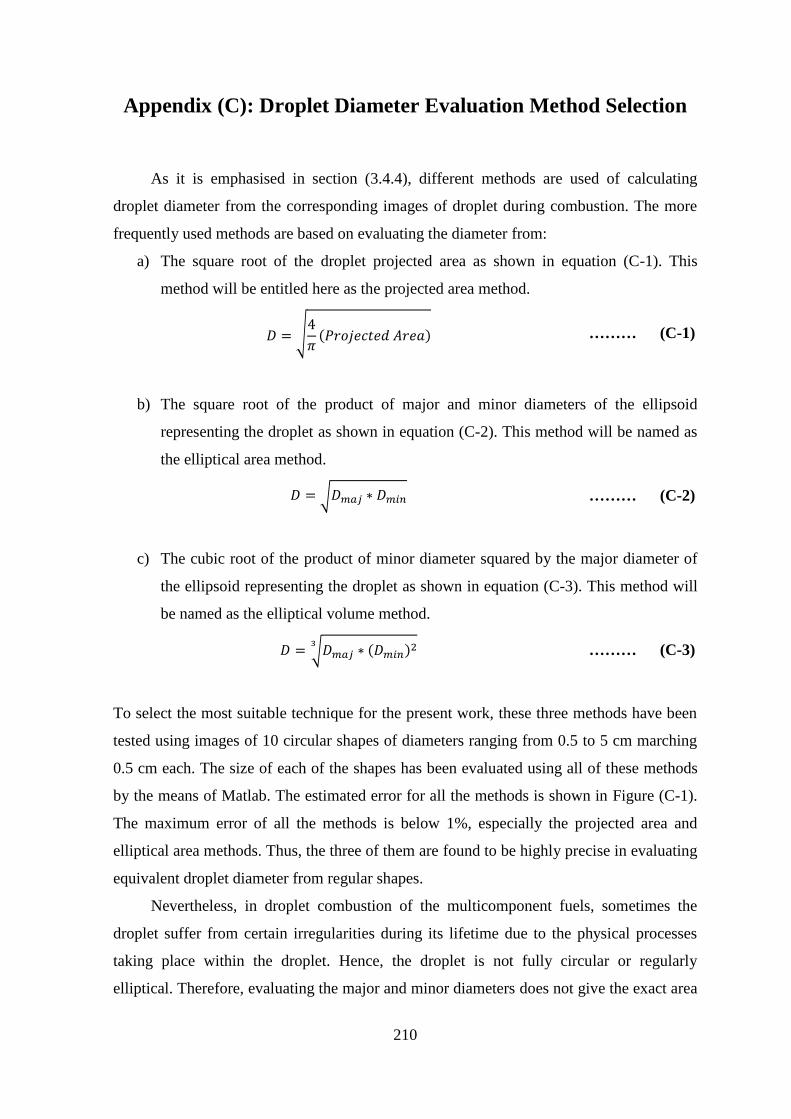
210
Appendix (C): Droplet Diameter Evaluation Method Selection
As it is emphasised in section ( 3.4.4), different methods are used of calculating
droplet diameter from the corresponding images of droplet during combustion. The more
frequently used methods are based on evaluating the diameter from:
a) The square root of the droplet projected area as shown in equation (C-1). This
method will be entitled here as the projected area method.
𝐷 = √4
𝜋(𝑃𝑟𝑜𝑗𝑒𝑐𝑡𝑒𝑑 𝐴𝑟𝑒𝑎) ……… (C-1)
b) The square root of the product of major and minor diameters of the ellipsoid
representing the droplet as shown in equation (C-2). This method will be named as
the elliptical area method.
𝐷 = √𝐷𝑚𝑎𝑗 ∗ 𝐷𝑚𝑖𝑛 ……… (C-2)
c) The cubic root of the product of minor diameter squared by the major diameter of
the ellipsoid representing the droplet as shown in equation (C-3). This method will
be named as the elliptical volume method.
𝐷 = √𝐷𝑚𝑎𝑗 ∗ (𝐷𝑚𝑖𝑛)23 ……… (C-3)
To select the most suitable technique for the present work, these three methods have been
tested using images of 10 circular shapes of diameters ranging from 0.5 to 5 cm marching
0.5 cm each. The size of each of the shapes has been evaluated using all of these methods
by the means of Matlab. The estimated error for all the methods is shown in Figure (C-1).
The maximum error of all the methods is below 1%, especially the projected area and
elliptical area methods. Thus, the three of them are found to be highly precise in evaluating
equivalent droplet diameter from regular shapes.
Nevertheless, in droplet combustion of the multicomponent fuels, sometimes the
droplet suffer from certain irregularities during its lifetime due to the physical processes
taking place within the droplet. Hence, the droplet is not fully circular or regularly
elliptical. Therefore, evaluating the major and minor diameters does not give the exact area

211
of the projected shape. Accordingly, the projected area method offers the best precision
among the three methods. Therefore, it has been implemented for droplet size estimation
from droplet images in the present work.
Figure C-1: The estimated error percentage resulting from different methods of droplet equivalent diameter
calculation.
0
0.2
0.4
0.6
0.8
1
0 0.5 1 1.5 2 2.5 3 3.5 4 4.5 5 5.5
Err
or
(%)
Circle Diameter (cm)
Projected Area Elliptical Area Elliptical Volume

212
Appendix (D): Burning Rate Comparison
Table D-1: Burning rate constants of diesel, biodiesel, and ethanol published in literature.
Fuel Authors Test Condition Burning Rate
(mm2/s)
Present
Work
Diesel
Xu et al., 2016 [130] M.G. (SiC Mesh) 0.46
0.63±0.04
Pan and Chiu 2013 [128] M.G. (fibre mesh) 0.57
Pan et al., 2009 [66] M.G. (SiC Mesh) 0.6
Wang et al., 2013 [129] F. F. 0.68
Ooi et al., 2016 [149] N.G. (thermocouple) 0.68
Pan et al., 2009 [66] N.G. (SiC Mesh) 0.75
Ghamari and Ratner, 2016 [150] N.G. (SiC Mesh) 0.75
Bartle et al., 2011 [291] N.G. (ceramic rod) 0.79
Botero et al., 2012 [122] F. F. 0.8
Biodiesel
Xu et al., 2016 [130] M.G. (SiC Mesh) 0.54
0.57±0.09
Pan et al., 2009 [66] M.G. (SiC Mesh) 0.65
Pan and Chiu 2013 [128] M.G. (fibre mesh) 0.65
Botero et al., 2012 [122] F. F. 0.7
Pan et al., 2009 [66] N.G. (SiC Mesh) 0.78
Bartle et al., 2011 [291] N.G. (ceramic rod) 1
Ethanol
Hara and Kumagai, 1990 [70] M.G. (SiC Mesh) 0.55
0.53±0.06
Ueda et al., 2002 [201] M.G. (quartz fibre) 0.6
Nakaya et al., 2013 [290] M.G. (quartz fibre) 0.62
Okajima and Kumagai, 1975 [69] M.G. (SiC fibre) 0.65
Bartle et al., 2011 [291] N.G. (ceramic rod) 0.8
Imamura et al., 2005 [306] N.G. (quartz fibre) 0.9
F.F: Free Fall M.G: Microgravity N.G: Normal gravity

213
Appendix (E): Flow Charts of the Matlab Codes
E-1: Droplet Size Calculations
The sequence followed for evaluating the droplet size from each image is shown
below. From which the droplet real diameter is evaluated and stored. This sequence is
repeated for every droplet image.
Read Image(i)
Evaluate the corresponding time
Crop and change image fromat from RGB to Grayscale
Apply the segmentation operations described in Chapter Three
Apply the morphological operation described in Chapter Three
Evaluate droplet area and the equivalent diameter
Evaluate the real droplet diameter by converting the size in pixel into millimeter as descibed in Chapter Three
Save the results in Microsoft Excel File format

214
E-2: Flame Size Calculations
The flame size analyses are divided into two parts, the first part is dedicated to
evaluate flame dimensions including the height and width, while the second part is set for
evaluating the instantaneous size evolution of the droplet corresponding to each image of
the flame. The flow chart combining these two parts is shown below. By which the flame
dimensions and the corresponding droplet diameter are evaluated and stored. These
calculation steps are repeated for every flame image.
Read Image(i)
Evaluate the corresponding time
Read the background image
Subtract the background from image(i)
Apply the segmentation operations described in Chapter Three
Evaluate flame height and with in pixel
Normalize flame height and width by initial droplet diameter
Evaluate flame stand-off ratio according to equation (2.6)
Save the results in Microsoft Excel File format
Crop the image for droplet only
Apply the same procedure described in section (E-1) for droplet size calculation

215
E-3: Sub-Droplet Counting
The number of sub-droplets emitted by the droplet through secondary atomization is
evaluated according to the sequence shown below. This sequence is repeated for every
droplet image.
Read Image(i)
Evaluate the corresponding time
Change image fromat from RGB to Grayscale
Take the negative of the image and then threshold
Evaluate the max number of objects N(i) within the image
Evaluate the number of sub-droplets emitted from:
N(i) - N(i-1)
Save the results in Microsoft Excel File format

216
References
[1] Griffiths, J.F., Barnard, J.A. “Flame and Combustion.” 3rd Editio. Springer
Science+Business Media Dordrecht; 1995.
[2] Keating, E.L. “Applied Combustion.” 2nd Editio. CRC Press/Taylor and Francis
Group; 2007.
[3] Jarosinski, J., Veyssiere, B. “Combustion Phenomena, Selected Mechanisms of
Flame Formation, Propagation, and Extinction.” CRC Press/Taylor and Francis
Group; 2009.
[4] Law, C.K. “Recent Advances in Droplet Vaporization and Combustion.” Progress in
Energy and Combustion Science 1982;8:171–201.
[5] Sirignano, W.A. “Advances in Droplet Array Combustion Theory and Modeling.”
Progress in Energy and Combustion Science 2014;42:54–86.
[6] Wang, Q. Advanced Optical and 3D Reconstruction Diagnostics for Combustion
and Fluids Research. The University of Sheffield, 2012.
[7] El-Mahallawy, F., Habik, S.E. “Fundamentals and Technology of Combustion.”
Elsevier Science Ltd; 2002.
[8] Ragland, K. W., Bryden, K.M. “Combustion Engineering.” 2nd Editio. CRC
Press/Taylor and Francis Group; 2011.
[9] Chigier, N.A. “Energy, Combustion, And Environment.” McGraw-Hill; 1981.
[10] Law, C.K. “Combustion Physics.” Cambridge University Press; 2006.
[11] Drysdale, D. “An Introduction to Fire Dynamics.” 3rd Editio. John Wiley and Sons
Ltd.; 2011.
[12] Kanury, M.A. “Introduction to Combustion Phenomena.” Gordon and Breach
Publishers; 1975.
[13] Williams, A. “Combustion of Liquid Fuel Sprays.” Butterworth and Co Publishers;
1990.
[14] Williams, D. A., Jone, G. “Liquid Fuels.” New York: Pergamon Press; 1963.
[15] Warnatz, J., Maas, U., Dibble, R.W. “Combustion: Physical and Chemical
Fundamentals, Modeling and Simulation, Experiments, Pollutant Formation.” 4th
Editio. Springer; 2006.
[16] Baumgarten, C. “Mixture Formation in Internal Combustion Engines.” Springer;
2006.
[17] Lefebvre, A.H. “Atomization and Sprays.” Hemisphere Publishing Corporation;

217
1989.
[18] Lefebvre, A. H., Ballal, D.R. “Gas Turbine Combustion: Alternative Fuels and
Emissions.” 3rd Editio. CRC Press/Taylor and Francis Group; 2010.
[19] Beer, J. M., Chigier, N.A. “Combustion Aerodynamics.” London: Applied Science
Publishers; 1972.
[20] Iyer, V. A., Abraham, J., Magi, V. “Exploring Injected Droplet Size Effects on
Steady Liquid Penetration in a Diesel Spray with a Two-Fluid Model.” International
Journal of Heat and Mass Transfer 2002;45:519–31.
[21] Komada, K., Sakaguchi, D., Tajima, H., Ueki, H., Ishida, M. “Relation between Tip
Penetration and Droplet Size of Diesel Spray.” SAE Technical Paper 2013;2.
[22] Polymeropoulos, C. E., Das, S. “The Effect of Droplet Size on the Burning Velocity
of Kerosene-Air Sprays.” Combustion and Flame 1975;25:247–57.
[23] Sarv, H., Nizami, A. A., Cernansky, N.P. Droplet Size Effects on NOx Formation in
a One-Dimensional Monodisperse Spray Combustion System. 1982 Joint Power
Generation Conference: GT Papers, The American Society of Mechanical Engineers
(ASME); 1982.
[24] Onuma, Y., Ogasawara, M. “Studies on the Structure of a Spray Combustion
Flame.” Symposium (International) on Combustion / The Combustion Institute
1975;15:453–65.
[25] Sutton, G.P. “Rocket Propulsion Elements.” John Wiley and Sons Ltd.; 1976.
[26] Ambekar, A., Chowdhury, A., Challa, S., Radhakrishna, D. “Droplet Combustion
Studies of Hydrocarbon-Monopropellant Blends.” Fuel 2014;115:697–705.
[27] Yu, Y., Li, M., Zhou, Y., Lu, X., Pan, Y. “Study on Electrical Ignition and Micro-
Explosion Properties of HAN-Based Monopropellant Droplet.” Frontiers of Energy
and Power Engineering in China 2010;4:430–5.
[28] Dakka, S. M., Shaw, B.D. “Influences of Pressure on Reduced-Gravity Combustion
of HAN-Methanol-Water Droplets in Air.” Combustion and Flame 2006;146:484–
92.
[29] Tarifa, C. S., Del Notario, P. P., Moreno, F.G. “Combustion of Liquid
Monopropellants and Bipropellants in Droplets.” Symposium (International) on
Combustion / The Combustion Institute 1961;8:1035–56.
[30] Fendell, F. “Near-Equilibrium Decompositional Burning of Monopropellant
Droplets in a Stagnant Atmosphere.” International Journal of Heat and Mass
Transfer 1969;12:223–31.

218
[31] Faeth, G.M. “Monopropellant Droplet Burning at Low Reynolds Numbers.”
Combustion and Flame 1967;11:167–174.
[32] Faeth, G.M. “Flame Zone Development of Monopropellant Droplets.” Combustion
and Flame 1968;2007:4–4.
[33] Allison, C. B., Faeth, G.M. “Decomposition and Hybrid Combustion of Hydrazine,
MMH and UDMH as Droplets in a Combustion Gas Environment.” Combustion and
Flame 1972;19:213–26.
[34] Godsave, G.A.E. “Combustion of Droplets in a Fuel Spray.” Nature 1949;164:708.
[35] Godsave, G.A.E. “Combustion of Fuel Droplets.” Nature 1950;166:1111.
[36] Kumagai, S., Isoda, H. “Combustion of Fuel Droplets.” Nature 1950;166:1111.
[37] Godsave, G.A.E. “Studies of the Combustion of Drops in a Fuel Spray-The Burning
of Single Drops of Fuel.” Symposium (International) on Combustion/The
Combustion Institute 1953;4:818–30.
[38] Spalding, D.B. “The Combustion of Liquid Fuels.” Symposium (International) on
Combustion/The Combustion Institute 1953;4:847–64.
[39] Choi, M. Y., Dryer, F.L. Microgravity Droplet Combustion. In: Ross HD, editor.
Microgravity Combustion: Fire in Free Fall, Academic Press; 2001, p. 183–297.
[40] Law, C.K. “Unsteady Droplet Combustion with Droplet Heating.” Combustion and
Flame 1976;26:17–22.
[41] Law, C. K., Sirignano, W.A. “Unsteady Droplet Combustion with Droplet Heating-
II: Conduction Limit.” Combustion and Flame 1977;28:175–86.
[42] Prakash, S., Sirignano, W.A. “Liquid Fuel Droplet Heating with Internal
Circulation.” International Journal of Heat and Mass Transfer 1978;21:885–95.
[43] Shaygan, N., Prakash, S. “Droplet Ignition and Combustion Including Liquid-Phase
Heating.” Combustion and Flame 1995;102:1–10.
[44] Sazhin, S. “Modelling of Heating, Evaporation and Ignition of Fuel Droplets:
Combined Analytical, Asymptotic and Numerical Analysis.” Journal of Physics:
Conference Series 2005;22:174–93.
[45] Sazhin, S. S., Abdelghaffar, W. A., Sazhina, E. M., Heikal, M.R. “Models for
Droplet Transient Heating: Effects on Droplet Evaporation, Ignition, and Break-
up.” International Journal of Thermal Sciences 2005;44:610–22.
[46] Aggarwal, S.K. “Single Droplet Ignition: Theoretical Analyses and Experimental
Findings.” Progress in Energy and Combustion Science 2014;45:79–107.
[47] Moriue, O., Eigenbrod, C., Rath, H. J., Sato, J., Okai, K., Tsue, M., Kono, M.

219
“Effects of Dilution by Aromatic Hydrocarbons on Staged Ignition Behavior of n-
Decane Droplets.” Proceedings of the Combustion Institute 2000;28:969–75.
[48] Moriue, O., Eigenbrod, C., Rath, H., Tsue, M., Kono, M., Sato, J. “Spontaneous
Ignition of n-Alkane Droplets with Various Volatility.” Transactions of the Japan
Society for Aeronautical and Space Sciences 2004;47:189–94.
[49] Marchese, A. J., Vaughn, T. L., Kroenlein, K., Dryer, F.L. “Ignition Delay of Fatty
Acid Methyl Ester Fuel Droplets: Microgravity Experiments and Detailed
Numerical Modeling.” Proceedings of the Combustion Institute 2011;33:2021–30.
[50] Nishiwaki, N. “Kinetics of Liquid Combustion Processes: Evaporation and Ignition
Lag of Fuel Droplets.” Symposium (International) on Combustion/The Combustion
Institute 1955;5:148–58.
[51] Saitoh, T., Ishiguro, S., Niioka, T. “An Experimental Study of Droplet Ignition
Characteristics Near the Ignitable Limit.” Combustion and Flame 1982;48:27–32.
[52] Nakanishi, R., Kobayashi, H., Kato, S., Niioka, T. “Ignition Experiment of a Fuel
Droplet in High-Pressure High-Temperature Ambient.” Symposium (International)
on Combustion/The Combustion Institute 1994;25:447–53.
[53] Huang, L. W., Chen, C.H. “Droplet Ignition in a High-Temperature Convective
Environment.” Combustion and Flame 1997;109:145–62.
[54] Kassoy, D. R., Williams, F.A. “Variable Property Effects on Liquid Droplet
Combustion.” AIAA Journal 1968;6:1961–5.
[55] Puri, I. K., Libby, P.A. “The Influence of Transport Properties on Droplet Burning.”
Combustion Science and Technology 1991;76:67–80.
[56] LAW, C. K., LAW, H.K. “Quasi-Steady Diffusion Flame Theory with Variable
Specific Heats and Transport Coefficients.” Combustion Science and Technology
1976;12:207–16.
[57] Law, C. K., Law, H.K. “Theory of Quasi-Steady One-Dimensional Diffusional
Combustion with Variable Properties Including Distinct Binary Diffusion
Coefficients.” Combustion and Flame 1977;29:269–75.
[58] Chung, S. H., Law, C.K. “Importance of Dissociation Equilibrium and Variable
Transport Properties on Estimation of Flame Temperature and Droplet Burning
Rate.” Combustion and Flame 1984;55:225–35.
[59] Jackson, G. S., Avedisian, C. T., Yang, J.C. “Observations of Soot during Droplet
Combustion at Low Gravity: Heptane and Heptane/Monochloroalkane Mixtures.”
International Journal of Heat and Mass Transfer 1992;35:2017–33.

220
[60] Choi, M. Y., Lee, K.O. “Investigation of Sooting in Microgravity Droplet
Combustion.” Symposium (International) on Combustion/The Combustion Institute
1996;26:1243–9.
[61] Manzello, S. L., Yozgatligil, A., Choi, M.Y. “An Experimental Investigation of
Sootshell Formation in Microgravity Droplet Combustion.” International Journal of
Heat and Mass Transfer 2004;47:5381–5.
[62] Urban, B. D., Kroenlein, K., Kazakov, A., Dryer, F. L., Yozgatligil, A., Choi, M. Y.,
Manzello, S. L., Lee, K. O., Dobashi, R. “Sooting Behavior of Ethanol Droplet
Combustion at Elevated Pressures under Microgravity Conditions.” Microgravity
Science and Technology 2004;15:12–8.
[63] Xu, G., Ikegami, M., Honma, S., Ikeda, K., Dietrich, D. L., Struk, P.M. “Sooting
Characteristics of Isolated Droplet Burning in Heated Ambients under
Microgravity.” International Journal of Heat and Mass Transfer 2004;47:5807–21.
[64] Liu, Y. C., Avedisian, C.T. “A Comparison of the Spherical Flame Characteristics
of Sub-Millimeter Droplets of Binary Mixtures of n-Heptane/Iso-Octane and n-
Heptane/Toluene with a Commercial Unleaded Gasoline.” Combustion and Flame
2012;159:770–83.
[65] Kumagai, S., Isoda, H. “Combustion of Fuel Droplets in a Falling Chamber.”
Symposium (International) on Combustion/The Combustion Institute 1957;6:726–
31.
[66] Pan, K. L., Li, J. W., Chen, C. P., Wang, C.H. “On Droplet Combustion of Biodiesel
Fuel Mixed with Diesel/Alkanes in Microgravity Condition.” Combustion and Flame
2009;156:1926–36.
[67] Isoda, H., Kumagai, S. “New Aspects of Droplet Combustion.” Symposium
(International) on Combustion / The Combustion Institute 1958;7:523–31.
[68] Kumagai, S., Sakai, T., Okajima, S. “Combustion of Free Fuel Droplets in a Freely
Falling Chamber.” Symposium (International) on Combustion/The Combustion
Institute 1971;13:779–85.
[69] Okajima, S., Kumagai, S. “Further Investigations of Combustion of Free Droplets in
a Freely Falling Chamber Including Moving Droplets.” Symposium (International)
on Combustion/The Combustion Institute 1975;15:401–7.
[70] Hara, H., Kumagai, S. “Experimental Investigation of Free Droplet Combustion
under Microgravity.” Symposium (International) on Combustion/The Combustion
Institute 1990;23:1605–10.

221
[71] Okajima, S., Kumagai, S. “Experimental Studies on Combustion of Fuel Droplets in
Flowing Air under Zero- and High-Gravity Conditions.” Symposium (International)
on Combustion/The Combustion Institute 1982;19:1021–7.
[72] Hara, H., Kumagai, S. “The Effect of Initial Diameter on Free Droplet Combustion
with Spherical Flame.” Symposium (International) on Combustion/The Combustion
Institute 1994;25:423–30.
[73] Norberg, C. “Human Spaceflight and Exploration.” Springer Berlin Heidelberg;
2013.
[74] Marchese, A. J., Dryer, F. L., Colantonio, R. O., Nayagam, V. “Microgravity
Combustion of Methanol and Methanol/Water Droplets: Drop Tower Experiments
and Model Predictions.” Symposium (International) on Combustion/The
Combustion Institute 1996;26:1209–17.
[75] Farouk, T. I., Liu, Y. C., Savas, A. J., Avedisian, C. T., Dryer, F.L. “Sub-Millimeter
Sized Methyl Butanoate Droplet Combustion: Microgravity Experiments and
Detailed Numerical Modeling.” Proceedings of the Combustion Institute
2013;34:1609–16.
[76] Dakka, S. M., Shaw, B.D. “Influences of Pressure on Reduced-Gravity Combustion
of 1-Propanol Droplets.” Microgravity Science and Technology 2006;18:5–13.
[77] Shaw, B. D., Vang, C.L. “Oxygen Lewis Number Effects on Reduced Gravity
Combustion of Methanol and n-Heptane Droplets.” Combustion Science and
Technology 2016;188:1–20.
[78] Kadota, T., Satoh, K., Segawa, D., Sato, J., Marutani, Y. “Autoignition and
Combustion of a Fuel Droplet in Supercritical Gaseous Environments under
Microgravity.” Symposium (International) on Combustion/The Combustion Institute
1998;27:2595–601.
[79] Chauveau, C., Gökalp, I., Segawa, D., Kadota, T., Enomoto, H. “Effects of Reduced
Gravity on Methanol Droplet Combustion at High Pressures.” Proceedings of the
Combustion Institute 2000;28:1071–7.
[80] Segawa, D., Kadota, T., Nakainkyo, A., Hirota, S., Enomoto, H. “Effects of Ambient
Pressure on Autoignition of a Fuel Droplet in Supercritical and Microgravity
Environment.” Proceedings of the Combustion Institute 2000;28:1063–9.
[81] Segawa, D., Yoshida, M., Nakaya, S., Kadota, T. “Autoignition and Early Flame
Behavior of a Spherical Cluster of 49 Monodispersed Droplets.” Proceedings of the
Combustion Institute 2007;31:2149–56.

222
[82] Tanabe, M., Kono, M., Sato, J, Koenig, J., Eigenbord, C., Rath, H. “Effects of
Natural Convection on Two Stage Ignition of an n-Dodecane Droplet.” Symposium
(International) on Combustion/The Combustion Institute 1994;25:455–61.
[83] Hicks, M. C., Nayagam, V., Williams, F.A. “Methanol Droplet Extinction in
Carbon-Dioxide-Enriched Environments in Microgravity.” Combustion and Flame
2010;157:1439–45.
[84] Dietrich, D. L., Nayagam, V., Hicks, M. C., Ferkul, P. V., Dryer, F. L., Farouk, T.,
Shaw, B. D., Suh, H. K., Choi, M. Y., Liu, Y. C., Avedisian, C. T., Williams, F.A.
“Droplet Combustion Experiments Aboard the International Space Station.”
Microgravity Science and Technology 2014;26:65–76.
[85] Nayagam, V., Dietrich, D. L., Hicks, M. C., Williams, F.A. “Cool-Flame Extinction
during n-Alkane Droplet Combustion in Microgravity.” Combustion and Flame
2015;162:2140–7.
[86] Farouk, T. I., Hicks, M. C., Dryer, F.L. “Multistage Oscillatory ‘Cool Flame’
Behavior for Isolated Alkane Droplet Combustion in Elevated Pressure
Microgravity Condition.” Proceedings of the Combustion Institute 2015;35:1701–8.
[87] Vang, C. L., Shaw, B.D. “Estimates of Liquid Species Diffusivities in N-
Propanol/Glycerol Mixture Droplets Burning in Reduced Gravity.” Microgravity
Science and Technology 2015;27:281–95.
[88] Dietrich, D. L., Haggard, J. B., Dryer, F. L., Nayagam, V., Shaw, B. D., Williams,
F.A. “Droplet Combustion Experiments in Spacelab.” Symposium (International) on
Combustion/The Combustion Institute 1996;26:1201–7.
[89] Nayagam, V., Haggard Jr., J. B., Colantonio, R. O., Marchese, A. J., Dryer, F. L.,
Zhang, B. L., Williams, F.A. “Microgravity n-Heptane Droplet Combustion in
Oxygen-Helium Mixtures at Atmospheric Pressure.” AIAA Journal 1998;36:1369–
78.
[90] Marchese, A. J., Dryer, F. L., Colantonio, R.O. “Radiative Effects in Space-Based
Methanol / Water Droplet Combustion Experiments.” Symposium (International) on
Combustion/The Combustion Institute 1998;27:2627–34.
[91] Manzello, S. L., Choi, M. U., Kazakov, A., Dryer, F. L., Dobashi, R., Hirano, T.
“The Burning of Large n-Heptane Droplets in Microgravity.” Proceedings of the
Combustion Institute 2000;28:1079–86.
[92] Shaw, B. D., Harrison, M.J. “Influences of Support Fibers on Shapes of
Heptane/Hexadecane Droplets in Reduced Gravity.” Microgravity Science and

223
Technology 2002;13:30–40.
[93] Javed, I., Baek, S. W., Waheed, K. “Autoignition and Combustion Characteristics of
Kerosene Droplets with Dilute Concentrations of Aluminum Nanoparticles at
Elevated Temperatures.” Combustion and Flame 2015;162:774–87.
[94] Sabourin, S. W., Boteler, C. I., Hallett, W.L.H. “Droplet Ignition of Approximately
Continuous Liquid Mixtures of n-Paraffins and n-Alkyl Aromatics.” Combustion and
Flame 2016;163:326–36.
[95] Choi, M. Y., Dryer, F. L., Haggard, J.B. “Observations on a Slow Burning Regime
for Hydrocarbon Droplets: n-Heptane/Air Results.” Symposium (International) on
Combustion/The Combustion Institute 1990;23:1597–604.
[96] Xu, G., Ikegami, M., Honma, S., Ikeda, K., Ma, Xi., Nagaishi, H., Dietrich, D. L.,
Struk, P.M. “Inverse Influence of Initial Diameter on Droplet Burning Rate in Cold
and Hot Ambiences: A Thermal Action of Flame in Balance with Heat Loss.”
International Journal of Heat and Mass Transfer 2003;46:1155–69.
[97] Xu, G., Ikegami, M., Honma, S., Ikeda, K., Dietrich, D. L., Struk, P.M. “Interactive
Influences of Convective Flow and Initial Droplet Diameter on Isolated Droplet
Burning Rate.” International Journal of Heat and Mass Transfer 2004;47:2029–35.
[98] Mikami, M., Yagi, T., Kojima, N. “Occurrence Probability of Microexplosion in
Droplet Combustion of Miscible Binary Fuels.” Symposium (International) on
Combustion/The Combustion Institute 1998;27:1933–41.
[99] Hoxie, A., Schoo, R., Braden, J. “Microexplosive Combustion Behavior of Blended
Soybean Oil and Butanol Droplets.” Fuel 2014;120:22–9.
[100] Lee, K., Jensen, K. A., Choi, M.Y. “Investigation of Sooting in Normal-Gravity
Droplet Combustion using Light Extinction and Gravimetric Techniques.”
Symposium (International) on Combustion/The Combustion Institute
1996;26:2397–404.
[101] Marsh, N. D., Zhu, D., Wornat, M.J. “Pyrolysis Product Absorption by Burning
Benzene Droplets.” Symposium (International) on Combustion/The Combustion
Institute 1998;27:1897–905.
[102] Xu, G., Ikegami, M., Honma, S., Sasaki, M., Ikeda, K., Nagaishi, H., Takeshita, Y.
“Combustion Characteristics of Droplets Composed of Light Cycle Oil and Diesel
Light Oil in a Hot-Air Chamber.” Fuel 2003;82:319–30.
[103] Wardana, I.N.G. “Combustion Characteristics of Jatropha Oil Droplet at Various
Oil Temperatures.” Fuel 2010;89:659–64.

224
[104] Mishra, D. P., Patyal, A., Padhwal, M. “Effects of Gellant Concentration on the
Burning and Flame Structure of Organic Gel Propellant Droplets.” Fuel
2011;90:1805–10.
[105] Mishra, D. P., Patyal, A. “Effects of Initial Droplet Diameter and Pressure on
Burning of ATF Gel Propellant Droplets.” Fuel 2012;95:226–33.
[106] Sato, J., Tsue, M., Niwa, M., Kono, M. “Effects of Natural Convection on High-
Pressure Droplet Combustion.” Combustion and Flame 1990;82:142–50.
[107] Struk, P. M., Dietrich, D. L., Ikegami, M., Xu, G. “Interacting Droplet Combustion
under Conditions of Extinction.” Proceedings of the Combustion Institute
2002;29:609–15.
[108] Goldsmith, M., Penner, S.S. “On the Burning of Single Drops of Fuel in an
Oxidizing Atmosphere.” Journal of Jet Propulsion 1954;24:245–51.
[109] Polymeropoulos, C. E., Peskin, R.L. “Ignition and Extinction of Liquid Fuel
Drops—Numerical Computations.” Combustion and Flame 1969;13:166–72.
[110] Law, C.K. “Asymptotic Theory for Ignition and Extinction in Droplet Burning.”
Combustion and Flame 1975;24:89–98.
[111] Dash, S. K., Som, S.K. “Ignition and Combustion of Liquid Fuel Droplet in a
Convective Medium.” Journal of Energy Resources Technology 1991;113:167–70.
[112] Chiu, H. H., Hu, L.H. “Dynamics of Ignition Transience and Gasification Partition
of a Droplet.” Symposium (International) on Combustion / The Combustion
Institute 1998;27:1889–96.
[113] Lacas, F., Calimez, X. “Numerical Simulation of Simultaneous Breakup and Ignition
of Droplets.” Proceedings of the Combustion Institute 2000;28:943–51.
[114] Pindera, M. Z., Brzustowski, T.A. “A Model for the Ignition and Extinction of
Liquid Fuel Droplets.” Combustion and Flame 1984;55:79–91.
[115] Pope, D. N., Gogos, G. “Numerical Simulation of Fuel Droplet Extinction due to
Forced Convection.” Combustion and Flame 2005;142:89–106.
[116] Wang, C. H., Liu, X. Q., Law, C.K. “Combustion and Microexplosion of Freely
Falling Multicomponent Droplets.” Combustion and Flame 1984;56:175–97.
[117] Siringnano, W.A. “Fluid Dynamics and Transport of Droplets and Sprays.” 2nd
Editio. Cambridge University Press; 2010.
[118] Wood, B. J., Wise, H., Inami, S.H. “Heterogeneous Combustion of Multicomponent
Fuels.” Combustion and Flame 1960;4:235–42.
[119] Law, C.K. “Multicomponent Droplet Combustion with Rapid Internal Mixing.”

225
Combustion and Flame 1976;26:219–33.
[120] Niioka, T., Sato, J. “Combustion and Microexplosion Behavior of Miscible Fuel
Droplets under High Pressure.” Symposium (International) on Combustion/The
Combustion Institute 1986;21:625–31.
[121] Takei, M., Tsukamoto, T., Niioka, T. “Ignition of Blended-Fuel droplet in High-
Temperature Atmosphere.” Combustion and Flame 1993;93:149–56.
[122] Botero, M. L., Huang, Y., Zhu, D. L., Molina, A., Law, C.K. “Synergistic
Combustion of Droplets of Ethanol, Diesel and Biodiesel Mixtures.” Fuel
2012;94:342–7.
[123] Lasheras, J. C., Fernandez-Pello, A. C., Dryer, F.L. “Experimental Observations on
the Disruptive Combustion of Free Droplets of Multicomponent Fuels.” Combustion
Science and Technology 1980;22:195–209.
[124] Lasheras, J. C., Fernandez-Pello, A. C., Dryer, F.L. “On the Disruptive Burning of
Free Droplets of Alcohol/n-Paraffin Solutions and Emulsions.” Symposium
(International) on Combustion/The Combustion Institute 1981;18:293–305.
[125] Yap, L., Kennedy, I. M., Dryer, F.L. “Disruptive and Micro-Explosive Combustion
of Free Droplets in Highly Convective Environments.” Combustion Science and
Technology 1984;41:291–313.
[126] Yang, J. C., Avedisian, C.T. “The Combustion of Unsupported Heptane/Hexadecane
Mixture Droplets at Low Gravity.” Symposium (International) on Combustion/The
Combustion Institute 1988;22:2037–44.
[127] Mikami, M., Kono, M., Sato, J., Dietrich, D.L. “Interactive Effects in Two-Droplet
Combustion of Miscible Binary Fuels at High Pressure.” Symposium (International)
on Combustion/The Combustion Institute 1998;27:2643–9.
[128] Pan, K. L., Chiu, M.C. “Droplet Combustion of Blended Fuels with Alcohol and
Biodiesel/Diesel in Microgravity Condition.” Fuel 2013;113:757–65.
[129] Wang, C. H., Pan, K. L., Ueng, G. J., Kung, L. J., Yang, J.Y. “Burning Behaviors of
Collision-Merged Water/Diesel, Methanol/Diesel, and Water+Methanol/Diesel
Droplets.” Fuel 2013;106:204–11.
[130] Xu, Y., Keresztes, I., Condo, A. M., Phillips, D., Pepiot, P., Avedisian, C.T.
“Droplet Combustion Characteristics of Algae-Derived Renewable Diesel,
Conventional #2 Diesel, and their Mixtures.” Fuel 2016;167:295–305.
[131] Avulapati, M. M., Ganippa, L. C., Xia, J., Megaritis, A. “Puffing and Micro-
Explosion of Diesel-Biodiesel-Ethanol Blends.” Fuel 2016;166:59–66.

226
[132] Han, K., Chen, H., Yang, B., Ma, X., Song, G., Li, Y. “Experimental Investigation
on Droplet Burning Characteristics of Diesel-Benzyl Azides Blend.” Fuel
2017;190:32–40.
[133] Yang, J. C., Jackson, G. S., Avedisian, C.T. “Combustion of Unsupported
Methanol/Dodecanol Mixture Droplets at Law Gravity.” Symposium (International)
on Combustion/The Combustion Institute 1990;23:1619–25.
[134] Okai, K., Moriue, O., Araki, M., Tsue, M., Kono, M., Sato, J., Dietrich, D. L.,
Williams, F.A. “Pressure Effects on Combustion of Methanol and
Methanol/Dodecanol Single Droplets and Droplet Pairs in Microgravity.”
Combustion and Flame 2000;121:501–12.
[135] Avedisian, C. T., Callahan, B.J. “Experimental Study of Nonane/Hexanol Mixture
Droplet Combustion without Natural or Forced Convection.” Proceedings of the
Combustion Institute 2000;28:991–7.
[136] Dee, V., Shaw, B.D. “Combustion of propanol-glycerol mixture droplets in reduced
gravity.” International Journal of Heat and Mass Transfer 2004;47:4857–67.
[137] Randolph, A. L., Law, C.K. “Time-Resolved Gasification and Sooting
Characteristics of Droplets of Alcohol/Oil Blends and Water/Oil Emulsions.”
Symposium (International) on Combustion/The Combustion Institute
1986;21:1125–31.
[138] Yamasaki, H., Tsue, M., Kadota, T. “Evaporation and Combustion of Emulsified
Fuel: Onset of Microexplosion.” JSME International Journal Series B 1993;36:677–
81.
[139] Tsue, M., Segawa, D., Kadota, T., Yamasaki, H. “Observation of Sooting Behavior
in an Emulsion Droplet Flame by Planar Laser Light Scattering in Microgravity.”
Symposium (International) on Combustion/The Combustion Institute
1996;26:1251–8.
[140] Kadota, T., Tanaka, H., Segawa, D., Nakaya, S., Yamasaki, H. “Microexplosion of
an Emulsion Droplet during Leidenfrost Burning.” Proceedings of the Combustion
Institute 2007;31:2125–31.
[141] Jeong, I. C., Lee, K.H. “Auto-Ignition and Micro-Explosion Behaviors of Droplet
Arrays of Water-in-Fuel Emulsion.” International Journal of Automotive
Technology 2008;9:735–40.
[142] Jeong, I., Lee, K. H., Kim, J. “Characteristics of Auto-Ignition and Micro-Explosion
Behavior of a Single Droplet of Water-in-Fuel.” Journal of Mechanical Science and
227
Technology 2008;22:148–56.
[143] Califano, V., Calabria, R., Massoli, P. “Experimental Evaluation of the Effect of
Emulsion Stability on Micro-Explosion Phenomena for Water-in-Oil Emulsions.”
Fuel 2014;117:87–94.
[144] Tsue, M., Kadota, T., Segawa, D., Yamasaki, H. “Statistical Analysis on Onset of
Microexplosion for an Emulsion Droplet.” Symposium (International) on
Combustion/The Combustion Institute 1996;26:1629–35.
[145] Segawa, D., Yamasaki, H., Kadota, T., Tanaka, H., Enomoto, H., Tsue, M. “Water-
Coalescence in an Oil-in-Water Emulsion Droplet Burning under Microgravity.”
Proceedings of the Combustion Institute 2000;28:985–90.
[146] Ocampo-Barrera, R., Villasenor, R., Diego-Marin, A. “An Experimental Study of the
Effect of Water Content on Combustion of Heavy Fuel Oil/Water Emulsion
Droplets.” Combustion and Flame 2001;126:1845–55.
[147] Jackson, G. S., Avedisian, C.T. “Combustion of Unsupported Water-in-n-Heptane
Emulsion Droplets in a Convection-Free Environment.” International Journal of
Heat and Mass Transfer 1998;41:2503–15.
[148] Tanvir, S., Qiao, L. “Droplet Burning Rate Enhancement of Ethanol with the
Addition of Graphite Nanoparticles: Influence of Radiation Absorption.”
Combustion and Flame 2016;166:34–44.
[149] Ooi, J. B., Ismail, H. M., Swamy, V., Wang, X., Swain, A. K., Rajanren, J.R.
“Graphite Oxide Nanoparticle as a Diesel Fuel Additive for Cleaner Emissions and
Lower Fuel Consumption.” Energy and Fuels 2016;30:1341–53.
[150] Ghamari, M., Ratner, A. “Combustion Characteristics of Diesel and Jet-A Droplets
Blended with Polymeric Additive.” Fuel 2016;178:63–70.
[151] Shinjo, J., Xia, J., Ganippa, L.C., Megaritis, A. “Physics of Puffing and
Microexplosion of Emulsion Fuel Droplets.” Physics of Fluids 2014;26:103302.
[152] Watanabe, H., Harada, T., Matsushita, Y., Aoki, H., Miura, T. “The Characteristics
of Puffing of the Carbonated Emulsified Fuel.” International Journal of Heat and
Mass Transfer 2009;52:3676–84.
[153] Miglani, A., Basu, S., Kumar, R. “Insight into Instabilities in Burning Droplets.”
Physics of Fluids 2014;26.
[154] Wang, Z.G. “Internal Combustion Processes of Liquid Rocket Engines: Modeling
and Numerical Simulations.” John Wiley and Sons Ltd.; 2016.
[155] Lasheras, J. C., Yap, L. T., Dryer, F.L. “Effect of the Ambient Pressure on the

228
Explosive Burning of Emulsified and Multicomponent Fuel Droplets.” Symposium
(International) on Combustion / The Combustion Institute 1984;20:1761–72.
[156] Zhang, Y., Huang, R., Wang, Z., Xu, S., Huang, S., Ma, Y. “Experimental Study on
Puffing Characteristics of Biodiesel-Butanol Droplet.” Fuel 2017;191:454–62.
[157] Watanabe, H., Matsushita, Y., Aoki, H., Miura, T. “Numerical Simulation of
Emulsified Fuel Spray Combustion with Puffing and Micro-Explosion.” Combustion
and Flame 2010;157:839–52. doi:10.1016/j.combustflame.2010.01.013.
[158] Shinjo, J., Xia, J., Ganippa, L. C., Megaritis, A. “Puffing-Enhanced Fuel/Air Mixing
of an Evaporating n-Decane/Ethanol Emulsion Droplet and a Droplet Group under
convective heating.” Journal of Fluid Mechanics 2016;793:444–76.
[159] Shinjo, J., Xia, J. “Combustion Characteristics of a Single Decane/Ethanol
Emulsion Droplet and a Droplet Group under Puffing Conditions.” Proceedings of
the Combustion Institute 2017;36:2513–21.
[160] Watanabe, H., Harada, T., Hoshino, K., Matsushita, Y., Aoki, H., Miura, T. “An
Experimental Investigation of the Characteristics of the Secondary Atomization and
Spray Combustion for Emulsified Fuel.” Journal of Chemical Engineering of Japan
2008;41:1110–8.
[161] Watanabe, H., Okazaki, K. “Visualization Of Secondary Atomization in Emulsified-
Fuel Spray Flow by Shadow Imaging.” Proceedings of the Combustion Institute
2013;34:1651–8.
[162] Watanabe, H., Shoji, Y., Yamagaki, T., Hayashi, J., Akamatsu, F., Okazaki, K.
“Secondary Atomization Behavior and Spray Flame Characteristics of Carbonated
W/O Emulsified Fuel.” Fuel 2016;182:6–7.
[163] Watanabe, H., Suzuki, Y., Harada, T., Matsushita, Y., Aoki, H., Miura, T. “An
Experimental Investigation Of The Breakup Characteristics Of Secondary
Atomization Of Emulsified Fuel Droplet.” Energy 2010;35:806–13.
[164] Suzuki, Y., Harada, T., Watanabe, H., Shoji, M., Matsushita, Y., Aoki, H., Miura, T.
“Visualization of Aggregation Process of Dispersed Water Droplets and the Effect
of Aggregation on Secondary Atomization of Emulsified Fuel Droplets.”
Proceedings of the Combustion Institute 2011;33:2063–70.
[165] Pulkrabek, W.W. “Engineering Fundamentals of the Internal Combustion Engine.”
Prentice Hall; 1997.
[166] Vehkamäki, H. “Classical Nucleation Theory in Multicomponent Systems.” Springer
Berlin Heidelberg; 2006.

229
[167] Caupin, F., Herbert, E. “Cavitation in Water: A Review.” Comptes Rendus Physique
2006;7:1000–17.
[168] Kadota, T., Yamasaki, H. “Recent Advances in the Combustion of Water Fuel
Emulsion.” Progress in Energy and Combustion Science 2002;28:385–404.
[169] Avedisian, C.T. “The Homogeneous Nucleation Limits of Liquids.” Journal of
Physical and Chemical Reference Data 1985;14:695–729.
[170] Chung, S. H., Kim, J.S. “An Experiment on Vaporization and Microexplosion of
Emulsion Fuel Droplets on a Hot Surface.” Symposium (International) on
Combustion / The Combustion Institute 1990;23:1431–5.
[171] Tsue, M., Yamasaki, H., Kadota, T., Segawa, D., Kono, M. “Effect of Gravity on
Onset of Microexplosion for an Oil-in-Water Emulsion Droplet.” Symposium
(International) on Combustion/The Combustion Institute 1998;27:2587–93.
[172] Wang, C. H., Fu, S. Y., Kung, L. J., Law, C.K. “Combustion and Microexplosion of
Collision-Merged Methanol/Alkane Droplets.” Proceedings of the Combustion
Institute 2005;30:1965–72.
[173] Sirignano, W.A. “Fuel Droplet Vaporization and Spray Combustion Theory.”
Progress in Energy and Combustion Science 1983;9:291–322.
[174] Sangiovanni, J. J., Kesten, A.S. “Effect of Droplet Interaction on Ignition in
Monodispersed Droplet Streams.” Symposium (International) on Combustion/The
Combustion Institute 1977;16:577–92.
[175] Segawa, D., Yoshida, M., Nakaya, S., Kadoka, T. “Effects of Spacing and
Arrangement of Droplet on Combustion Characteristics of Monodispersed
Suspended-Droplet Cluster Model under Microgravity.” Microgravity Science and
Technology 2005;17:23–30. doi:10.1007/BF02872084.
[176] Nomura, H., Iwasaki, H., Suganuma, Y., Mikami, M., Kikuchi, M. “Microgravity
Experiments of Flame Spreading Along a Fuel Droplet Array in Fel Vapor-Air
Mixture.” Proceedings of the Combustion Institute 2011;33:2013–20.
[177] Koshland, C. P., Bowman, C.T. “Combustion of Monodisperse Droplet Clouds in a
Reactive Environment.” Symposium (International) on Combustion/The
Combustion Institute 1984;20:1799–807.
[178] Okai, K., Tsue, M., Kono, M., Mikami, M., Sato, J., Dietrich, D. L., Williams, F.A.
“Strongly Interacting Combustion of Two Miscible Binary-Fuel Droplets at High
Pressure in Microgravity.” Symposium (International) on Combustion/The
Combustion Institute 1998;27:2651–7.
230
[179] Okai, K., Moriue, O., Araki, M., Tsue, M., Kono, M., Sato, J., Dietrich, D. L.,
Williams, F.A. “Combustion of Single Droplets and Droplet Pairs in a Vibrating
Field under Microgravity.” Proceedings of the Combustion Institute 2000;28:977–
83.
[180] Nomura, H., Takahashi, H., Suganuma, Y., Kikuchi, M. “Droplet Ignition Behavior
in the Vicinity of the Leading Edge of a Flame Spreading along a Fuel Droplet
Array in Fuel-Vapor/Air Mixture.” Proceedings of the Combustion Institute
2013;34:1593–600.
[181] Kataoka, H., Yamashita, H., Tada, J., Oka, Y., Morinaga, Y., Itai, M., Segawa, D.,
Kadota, T. “Autoignition Behavior of a Spherical Cluster Consisted of a Center Fine
Droplet and Surrounding Twelve Fine Droplets.” Proceedings of the Combustion
Institute 2015;35:1629–37.
[182] Queiroz, M., Yao, S.C. “Experimental Exploration of the Thermal Structure of an
Array of Burning Droplet Streams.” Combustion and Flame 1990;82:346–60.
[183] Mikami, M., Niwa, M., Kato, H., Sato, J., Kono, M. “Clarification of the Flame
Structure of Droplet Burning Based on Temperature Measurement in Microgravity.”
Symposium (International) on Combustion/The Combustion Institute 1994;25:439–
46.
[184] Rosebrock, C. D., Shirinzadeh, S., Soeken, M., Riefler, N., Wriedt, T., Drechsler,
R., Mädler, L. “Time-Resolved Detection of Diffusion Limited Temperature
Gradients Inside Single Isolated Burning Droplets using Rainbow Refractometry.”
Combustion and Flame 2016;168:255–69.
[185] Merzkirch, W. “Flow Visualization.” 2nd Editio. Academic Press; 1987.
[186] Settles, G.S.S. “Schlieren and Shadowgraph Techniques: Visualizing Phenomena in
Transport Media.” Springer; 2001.
[187] Klein-Douwel, R. J. H., Frijters, P. J. M., Somers, L. M. T., de Boer, W. A., Baert,
R.S.G. “Macroscopic Diesel Fuel Spray Shadowgraphy using High Speed Digital
Imaging in a High Pressure Cell.” Fuel 2007;86:1994–2007.
[188] Klinner, J., Willert, C. “Tomographic Shadowgraphy for Three-Dimensional
Reconstruction of Instantaneous Spray Distributions.” Experiments in Fluids
2012;53:531–43.
[189] Mauger, C., Méès, L., Michard, M., Lance, M. “Velocity Measurements Based on
Shadowgraph-Like Image Correlations in a Cavitating Micro-Channel Flow.”
International Journal of Multiphase Flow 2014;58:301–12.

231
[190] Xu, F., Patterson, J. C., Lei, C. “Shadowgraph Observations of the Transition of the
Thermal Boundary Layer in a Side-Heated Cavity.” Experiments in Fluids
2005;38:770–9.
[191] Vinze, R., Chandel, S., Limaye, M. D., Prabhu, S. V. “Heat Transfer Distribution
and Shadowgraph Study for Impinging Underexpanded Jets.” Applied Thermal
Engineering 2017;115:41–52.
[192] Schöpf, W., Patterson, J. C., Brooker, A.M.H. “Evaluation of the Shadowgraph
Method for the Convective Flow in a Side-Heated Cavity.” Experiments in Fluids
1996;21:331–40.
[193] Jenkins, D.R. “Interpretation of Shadowgraph Patterns in Rayleigh-Bénard
Convection.” Journal of Fluid Mechanics 1988;190:451–69.
[194] Ishino, Y., Hasegawa, T., Yamaguchi, S., Ohiwa, N. “Optical Analysis of Pulse
Combustion using Shadowgraph and Planar CH-LIF Imaging Technique.” Journal
of Energy Resources Technology 2001;123:59–63.
[195] Ochoterena, R. “High Speed Shadowgraph and Diffraction Based Imaging for Spray
Characterisation and Combustion Studies.” SAE Technical Paper 2009.
[196] Ogawa, H., Shibata, G., Noguchi, Y., Numata, M. “Visualization Analysis of Diesel
Combustion with Water and Diesel Fuel Emulsified Blend in a Constant Volume
Chamber Vessel.” SAE International 2014.
[197] Kobayasi, K. “An Experimental Study on the Combustion of a Fuel Droplet.”
Symposium (International) on Combustion/The Combustion Institute 1955;5:141–8.
[198] Faeth, G. M., Dominicis, D. P., Tulpinsky, J. F., Olson, D.R. “Supercritical
Bipropellant Droplet Combustion.” Symposium (International) on Combustion /
The Combustion Institute 1969;12:9–18.
[199] Tanabe, M., Kuwahara, T., Satoh, K., Fujimori, T., Sato, J., Kono, M. “Droplet
Combustion in Standing Sound Waves.” Proceedings of the Combustion Institute
2005;30:1957–1964.
[200] Lehmann, S., Lorenz, S., Rivard, E., Brüggemann, D. “Experimental Analysis and
Semicontinuous Simulation of Low-Temperature Droplet Evaporation of
Multicomponent Fuels.” Experiments in Fluids 2015;56:1871.
[201] Ueda, T., Imamura, O., Okai, K., Tsue, M., Kono, M., Sato, J. “Combustion
Behavior of Single Droplets for Sooting and Non-Sooting Fuels in Direct Current
Electric Fields under Microgravity.” Proceedings of the Combustion Institute
2002;29:2595–601.

232
[202] Bachalo, W.D. Methods for Compressible Flows. In: Smits, A. J., Lim TT, editor.
Flow Visualization: Techniques and Examples. 2nd Editio, Imperial College Press;
2012, p. 227–65.
[203] Krier, H., Wronkiewicz, J.A. “Combustion of Single Drops of Fuel.” Combustion
and Flame 1972;18:159–66.
[204] Ogami, Y., Sakurai, S., Hasegawa, S., Jangi, M., Nakamura, H., Yoshinaga, K.,
Kobayashi, H. “Microgravity Experiments of Single Droplet Combustion in
Oscillatory Flow at Elevated Pressure.” Proceedings of the Combustion Institute
2009;32:2171–8.
[205] Reichenbach, R., Squires, D., and Penner, S.S. “Flame Propagation in Liquid-Fuel
Droplet Arrays.” Symposium (International) on Combustion/The Combustion
Institute 1961;8:1068–73.
[206] Miles, R.B. Planar Imaging of Gas Phase Flows. In: Smits, A. J., Lim TT, editor.
Flow Visualization: Techniques and Examples. 2nd Editio, Imperial College Press;
2012, p. 107–42.
[207] Andersen, P. Laser Induced Fluorescence. Optical Measurements: Techniques and
Applications. 2nd Editio, Springer Berlin Heidelberg; 2001, p. 199–230.
[208] Castanet, G., Lebouché, M., Lemoine, F. “Heat and Mass Transfer of Combusting
Monodisperse Droplets in a Linear Stream.” International Journal of Heat and Mass
Transfer 2005;48:3261–75.
[209] Pfeil, M. A., Groven, L. J., Lucht, R. P., Son, S.F. “Effects of Ammonia Borane on
the Combustion of an Ethanol Droplet at Atmospheric Pressure.” Combustion and
Flame 2013;160:2194–203.
[210] Beck, C. H., Koch, R., Bauer, H.J. “Identification of Droplet Burning Modes in
Lean, Partially Prevaporized Swirl-Stabilized Spray Flames.” Proceedings of the
Combustion Institute 2009;32:2195–203.
[211] Burkert, A., Paa, W., Reimert, M., Klinkov, K., Eigenbrod, C. “Formaldehyde LIF
Detection with Background Subtraction Around Single Igniting GTL Diesel
Droplets.” Fuel 2013;111:384–92.
[212] Castanet, G., Maqua, C., Orain, M., Grisch, F., Lemoine, F. “Investigation of Heat
and Mass Transfer between the Two Phases of an Evaporating Droplet Stream
using Laser-Induced Fluorescence Techniques: Comparison with Modeling.”
International Journal of Heat and Mass Transfer 2007;50:3670–83.
[213] Maqua, C., Castanet, G., Lemoine, F. “Bicomponent Droplets Evaporation:

233
Temperature Measurements and Modelling.” Fuel 2008;87:2932–42.
[214] Zhang, Y., Zhang, G., Xu, M., Wang, J. “Droplet Temperature Measurement based
on 2-Color Laser-Induced Exciplex Fluorescence.” Experiments in Fluids
2013;54:1–10.
[215] Albrecht, H. E., Borys, M., Damaschke, N., Tropea, C. “Laser Doppler and Phase
Doppler Measurement Techniques.” Springer; 2003.
[216] Eder, A., Durst, B., Jordan, M. Laser-Doppler Velocimetry - Principle and
Application to Turbulence Measurements. In: Mayinger, F., Feldmann O, editor.
Optical Measurements: Techniques and Applications. 2nd Editio, Springer Berlin
Heidelberg; 2001, p. 117–38.
[217] Ofner, B. Phase Doppler Anemometry (PDA). In: Mayinger, F., Feldmann O, editor.
Optical Measurements: Techniques and Applications. 2nd Editio, Springer Berlin
Heidelberg; 2001, p. 139–52.
[218] Kawazoe, H., Ohsawa, K., Fujikake, K. “LDA Measurement of Fuel Droplet Sizes
and Velocities in a Combustion Field.” Combustion and Flame 1990;82:151–62.
[219] Birouk, M., Chauveau, C., Gökalp, I. “Turbulence Effects on the Combustion of
Single Hydrocarbon Droplets.” Proceedings of the Combustion Institute
2000;28:1015–21.
[220] Birouk, M., Toth, S.L. “Hydrocarbon Droplet Turbulent Combustion in an Elevated
Pressure Environment.” Flow, Turbulence and Combustion 2015;94:843–58.
[221] Sankar, S. V., Buermann, D. H., Ibrahim, K. M., Bachalo, W.D. “Application of an
Integrated Phase Doppler Interferometer/Rainbow Thermometer/Point-Diffraction
Interferometer for Characterizing Burning Droplets.” Symposium (International) on
Combustion/The Combustion Institute 1994;25:413–21.
[222] Raffel, M., Willert, C., Kompenhams, J. “Particle Image Velocimetry - A Practical
Guide.” 2nd Editio. Springer; 2007.
[223] Merzkirch, W. Particle Image Velocimetry. In: Mayinger, F., Feldmann O, editor.
Optical Measurements: Techniques and Applications. 2nd Editio, Springer Berlin
Heidelberg; 2001, p. 340–57.
[224] Riethmuller, M., David, L., Lecordier, B. Particle Image Velocimetry. In: Boutier A,
editor. Laser Velocimetry in Fluid Mechanics, John Wiley and Sons Ltd.; 2012, p.
159–282.
[225] Roth, N., Karl, A., Anders, K., Frohn, A. “Flame Propagation in Planar Droplet
Arrays and Interaction Phenomena between Neighboring Droplet Streams.”

234
Symposium (International) on Combustion/The Combustion Institute
1996;26:1697–703.
[226] Nomura, H., Takahashi, M., Ujiie, Y., Hara, H. “Observation of Droplet Motion
during Flame Spread on Three-Fuel-Droplet Array with a Pendulum Suspender.”
Proceedings of the Combustion Institute 2005;30:1991–9.
[227] Birouk, M., Fabbro, S.C. “Droplet Evaporation in a Turbulent Atmosphere at
Elevated Pressure - Experimental Data.” Proceedings of the Combustion Institute
2013;34:1577–84.
[228] He, M., Qiu, H. “Internal Flow Patterns of an Evaporating Multicomponent Droplet
on a Flat Surface.” International Journal of Thermal Sciences 2016;100:10–9.
[229] Xiao, C., Zhou, L., Sun, Z., Du, X., Yang, Y. “Near-Wall Fluid Flow Near the
Pinned Contact Line during Droplet Evaporation.” Experimental Thermal and Fluid
Science 2016;72:210–7.
[230] Hairharan, P. “Basics of Interferometry.” 2nd Editio. Academic Press; 2007.
[231] Mikami, M., Oyagi, H., Kojima, N., Wakashima, Y., Kikuchi, M., Yoda, S.
“Microgravity Experiments on Flame Spread along Fuel-Droplet Arrays using a
New Droplet-Generation Technique.” Combustion and Flame 2005;141:241–52.
[232] Mikami, M., Oyagi, H., Kojima, N., Wakashima, Y., Kikuchi, M., Yoda, S.
“Microgravity Experiments on Flame Spread along Fuel-Droplet Arrays at High
Temperatures.” Combustion and Flame 2006;146:391–406.
[233] Nomura, H., Suganuma, Y., Setani, A., Takahashi, M., Mikami, M., Hara, H.
“Microgravity Experiments on Droplet Motion during Flame Spreading Along
Three-Fuel-Droplet Array.” Proceedings of the Combustion Institute 2009;32:2163–
9.
[234] Marchese, A. J., Dryer, F. L., Nayagam, V., Colantonio, R.O. “Hydroxyl radical
chemiluminescence imaging and the structure of microgravity droplet flames.”
Symposium (International) on Combustion/The Combustion Institute
1996;26:1219–26.
[235] Yao, R., Qiu, Z., Li, J., Huang, J., Chen, X., Wang, N. “Experimental Study on N-
heptane Droplet Combustion in a Micro-Tube.” Energy Procedia 2014;61:2528–31.
[236] Liu, Y. C., Xu, Y., Hicks, M. C., Avedisian, C.T. “Comprehensive Study of Initial
Diameter Effects and Other Observations on Convection-Free Droplet Combustion
in the Standard Atmosphere for n-Heptane, n-Octane, and n-dDecane.” Combustion
and Flame 2016;171:27–41.

235
[237] Wu, M. S., Yang, S.I. “Combustion Characteristics of Multi-Component Cedar Bio-
Oil/Kerosene Droplet.” Energy 2016;113:788–95.
[238] Ajav, E. A., Singh, B., Bhattacharya, T.K. “Experimental Study of Some
Performance Parameters of a Constant Speed Stationary Diesel Engine Using
Ethanol-Diesel Blends as Fuel.” Biomass and Bioenergy 1999;17:357–65.
[239] Li, D., Huang, Z., Lu, X., Zhang, W., Yang, J. “Physico-Chemical Properties of
Ethanol-Diesel Blend Fuel and its Effect on Performance and Emissions of Diesel
Engines.” Renewable Energy 2005;30:967–76.
[240] Rakopoulos, D. C., Rakopoulos, C. D., Kakaras, E. C., Giakoumis, E.G. “Effects of
Ethanol-Diesel Fuel Blends on the Performance and Exhaust Emissions of Heavy
Duty DI Diesel Engine.” Energy Conversion and Management 2008;49:3155–62.
[241] Kumar, S., Cho, J. H., Park, J. Moon, I. “Advances in Diesel-Alcohol Blends and
Their Effects on the Performance and Emissions of Diesel Engines.” Renewable and
Sustainable Energy Reviews 2013;22:46–72.
[242] Tutak, W., Lukács, K. Szwaja, S., Bereczky, Á. “Alcohol-Diesel Fuel Combustion
in the Compression Ignition Engine.” Fuel 2015;154:196–206.
[243] Datta, A., Mandal, B.K. “Impact of Alcohol Addition to Diesel on the Performance
Combustion and Emissions of a Compression Ignition Engine.” Applied Thermal
Engineering 2016;98:670–82.
[244] Rajesh Kumar, B., Saravanan, S. “Use of Higher Alcohol Biofuels in Diesel
Engines: A Review.” Renewable and Sustainable Energy Reviews 2016;60:84–115.
[245] Benjumea, P., Agudelo, J., Agudelo, A. “Basic Properties of Palm Oil Biodiesel-
Diesel Blends.” Fuel 2008;87:2069–75.
[246] Pucher, G., Allan, W., LaViolette, M., Poitras, P. “Emissions from a Gas Turbine
Sector Rig Operated with Synthetic Aviation and Biodiesel Fuel.” Journal of
Engineering for Gas Turbines and Power 2011;133:111502(8).
[247] Chiaramonti, D., Rizzo, A. M., Spadi, A., Prussi, M., Riccio, G., Martelli, F.
“Exhaust Emissions from Liquid Fuel Micro Gas Turbine Fed with Diesel Oil,
Biodiesel and Vegetable Oil.” Applied Energy 2013;101:349–56.
[248] Kurji, H., Valera-Medina, A., Runyon, J., Giles, A., Pugh, D., Marsh, R., Cerone,
N., Zimbardi, F., Valerio, V. “Combustion Characteristics of Biodiesel Saturated
with Pyrolysis Oil for Power Generation in Gas Turbines.” Renewable Energy
2016;99:443–51.
[249] Habibullah, M., Masjuki, H. H., Kalam, M. A., Rizwanul Fattah, I. M., Ashraful, A.

236
M., Mobarak, H.M. “Biodiesel Production and Performance Evaluation of Coconut,
Palm and their Combined Blend with Diesel in a Single-Cylinder Diesel Engine.”
Energy Conversion and Management 2014;87:250–7.
[250] Yasin, M. H. M., Paruka, P., Mamat, R., Yusop, A. F., Najafi, G., Alias, A. “Effect
of Low Proportion Palm Biodiesel Blend on Performance, Combustion and
Emission Characteristics of a Diesel Engine.” Energy Procedia 2015;75:92–8.
[251] Ileri, E., Atmanli, A., Yilmaz, N. “Comparative Analyses of n-Butanole-Rapeseed
Oil-Diesel Blend with Biodiesel, Diesel and Biodiesel-Diesel Fuels in a
Turbocharged Direct Injection Diesel Engine.” Journal of the Energy Institute
2016;89:586–93.
[252] Rahman, S. M. A., Masjuki, H. H., Kalam, M. A., Abedin, M. J., Sanjid, A., Sajjad,
H. “Production of Palm and Calophyllum Inophyllum based Biodiesel and
Investigation of Blend Performance and Exhaust Emission in an Unmodified Diesel
Engine at High Idling Conditions.” Energy Conversion and Management
2013;76:362–7.
[253] Alahmer, A., Yamin, J., Sakhrieh, A., Hamdan, M.A. “Engine Performance using
Emulsified Diesel Fuel.” Energy Conversion and Management 2010;51:1708–13.
[254] Maiboom, A., Tauzia, X. “NOx and PM Emissions Reduction on an Automotive
HSDI Diesel Engine with Water-in-Diesel Emulsion and EGR: An Experimental
Study.” Fuel 2011;90:3179–92.
[255] Fahd, M. E. A., Wenming, Y., Lee, P. S., Chou, S. K., Yap, C.R. “Experimental
Investigation of the Performance and Emission Characteristics of Direct Injection
Diesel Engine by Water Emulsion Diesel under Varying Engine Load Condition.”
Applied Energy 2013;102:1042–9.
[256] Debnath, B. K., Saha, U. K., Sahoo, N. “A Comprehensive Review on the
Application of Emulsions as an Alternative Fuel for Diesel Engines.” Renewable
and Sustainable Energy Reviews 2015;42:196–211.
[257] Ithnin, A. M., Ahmad, M. A., Bakar, M. A. A., Rajoo, S. Yahya, W.J. “Combustion
Performance and Emission Analysis of Diesel Engine Fuelled with Water-in-Diesel
Emulsion Fuel Made from Low-Grade Diesel Fuel.” Energy Conversion and
Management 2015;90:375–82.
[258] Leal-Calderon, F., Schmitt, V., Bibette, J. “Emulsion Science Basic Principles.” 2nd
Editio. Springer; 2007.
[259] Bakry, A. M., Abbas, S., Ali, B., Majeed, H., Abouelwafa, M. Y., Mousa, A., Liang,

237
L. “Microencapsulation of Oils: A Comprehensive Review of Benefits, Techniques,
and Applications.” Comprehensive Reviews in Food Science and Food Safety
2016;15:143–82.
[260] Roesle, M. L., Kulacki, F.A. “Boiling Heat Transfer in Dilute Emulsions.” Springer;
2013.
[261] Mollet, H., Grubenmann, A. “Formulation Technology: Emulsions, Suspensions,
Solid Forms.” Wiley-VCH; 2001.
[262] Tadros, T.F. “Emulsion Science and Technology.” Wiley-VCH; 2009.
[263] Griffin, W.C. “Classification of Surface-Active Agents by HLB.” Journal of
Cosmetic Science 1949;1:311–26.
[264] Babu, M. K. G., Subramanian, K.A. “Alternative Transportation Fuels: Utilisation
in Combustion Engines.” CRC Press/Taylor and Francis Group; 2013.
[265] Williams, F.A. “Combustion Theory.” 2nd Editio. The Benjamin/Cummings
Company Incorporation; 1985.
[266] Gollahalli, S. R., Brzustowski, T.A. “Experimental Studies on the Flame Structure
in the Wake of a Burning Droplet.” Symposium (International) on Combustion/The
Combustion Institute 1973;14:1333–44.
[267] Canada, G. S., Faeth, G.M. “Fuel Droplet Burning Rates at High Pressures.”
Symposium (International) on Combustion/The Combustion Institute
1973;14:1345–54.
[268] Gollahalli, S. R., Brzustowski, T.A. “The Effect of Pressure on the Flame Structure
in the Wake of a Burning Hydrocarbon Droplet.” Symposium (International) on
Combustion/The Combustion Institute 1975;15:409–17.
[269] Sangiovanni, J. J., Dodge, L.G. “Observations of Flame Structure in the Combustion
of Monodispersed Droplet Streams.” Symposium (International) on
Combustion/The Combustion Institute 1979;17:455–65.
[270] Gore, J. P., Meng, W. H., Jang, J.H. “Droplet Flames in Reactive Environments.”
Combustion and Flame 1990;82:126–41.
[271] Deng, S. Zhou, J. “An Experimental Study of the Effect of Water Content on
Combustion of Coal Tar/Water Emulsion Droplets.” Energy 2011;36:6130–7.
[272] Feng, S., He, B., He, H., Su, L., Hou, Z., Nie, W., Guo, X. “Experimental Studies
the Burning Process of Gelled Unsymmetrical Dimethylhydrazine Droplets under
Oxidant Convective Conditions.” Fuel 2013;111:367–73.
[273] Hottel, H. C., Williams, G. C., Simpson, H.C. “Combustion of Droplets of Heavy

238
Liquid Fuels.” Symposium (International) on Combustion/The Combustion Institute
1955;5:101–29.
[274] Bolt, J. A., Saad, M.A. “Combustion Rates of Freely Falling Fuel Drops in a Hot
Atmosphere.” Symposium (International) on Combustion/The Combustion Institute
1957;6:717–25.
[275] Teodorczyk, A., Wojcicki, S. “The Combustion of a Liquid Fuel Droplet during
Forced Convection.” Journal of Fire Sciences 1994;12:44–61.
[276] Wang, C. H., Hung, W. G., Fu, S. Y., Huang, W. C., Law, C.K. “On the Burning
and Microexplosion of Collision-Generated Two-Component Droplets: Miscible
Fuels.” Combustion and Flame 2003;134:289–300.
[277] Dietrich, D. L., Nayagam, V., Williams, F.A. Experimental Observations of Cool-
Flame Supported Binary- Droplet Arrays Combustion in Microgravity. 9th US
National Combustion Meeting, Cincinnati, Ohio, USA: 2015, p. 1–5.
[278] Farouk, T. I., Dietrich, D., Alam, F. E., Dryer, F.L. “Isolated n-decane droplet
combustion – Dual stage and single stage transition to ‘Cool Flame’ droplet
burning.” Proceedings of the Combustion Institute 2016;36:2523–30.
[279] Wakashima, Y., Yamamoto, S., Kikuchi, M., Yoda, S., Mikami, M., Umemura, A.
“Numerical and Experimental Study on Flame Propagating Mechanism of a Fuel
Droplet Array.” Microgravity Science and Technology 2005;16:338–41.
[280] Liu, Y. C., Savas, A. J., Avedisian, C.T. “The Spherically Symmetric Droplet
Burning Characteristics of Jet-A and Biofuels Derived from Camelina and Tallow.”
Fuel 2013;108:824–32.
[281] Liu, Y. C., Xu, Y., Avedisian, C. T., Hicks, M.C. “The Effect of Support Fibers on
Micro-Convection in Droplet Combustion Experiments.” Proceedings of the
Combustion Institute 2015;35:1709–16.
[282] Avedisian, C. T., Jackson, G.S. “Soot Patterns Around Suspended n-Heptane
Droplet Flames in a Convection-Free Environment.” Journal of Propulsion and
Power 2000;16:974–9.
[283] Bae, J. H., Avedisian, C.T. “High-Pressure Combustion of Submillimeter-Sized
Nonane Droplets in a Low Convection Eenvironment.” Combustion and Flame
2006;145:607–20.
[284] Gonzales, R. C., Woods, R.E. “Digital Image Processing.” 3rd Editio. Pearson
Printice Hall; 2008.
[285] Dougherty, G. “Digital Image Processing for Medical Applications.” Cambridge

239
University Press; 2009.
[286] Taylor, J.R. “An Introduction to Error Analysis: The Study of Uncertainities in
Physical Measurements.” 2nd Editio. University Science Books; 1997.
[287] Liu, Y. C., Savas, A. J., Avedisian, C.T. “Spherically Symmetric Droplet
Combustion of Three and Four Component Miscible Mixtures as Surrogates for Jet-
A.” Proceedings of the Combustion Institute 2013;34:1569–76.
[288] Villasenor, R., Garcia, F. “An Experimental Study of the Effects of Asphaltenes on
Heavy Fuel Oil Droplet Combustion.” Fuel 1999;78:933–44.
[289] Mishra, D.P. “Experimental Combustion - An Introduction.” CRC Press/Taylor and
Francis Group; 2014.
[290] Nakaya, S., Fujishima, K., Tsue, M., Kono, M., Segawa, D. “Effects of Droplet
Diameter on Instantaneous Burning Rate of Isolated Fuel Droplets in Argon-Rich or
Carbon Dioxide-Rich Ambiences under Microgravity.” Proceedings of the
Combustion Institute 2013;34:1601–8.
[291] Bartle, K. D., Fitzpatrick, E. M., Jones, J. M., Kubacki, M. L., Plant, R.,
Pourkashanian, M., Ross, A. B., Williams, A. “The Combustion of Droplets of
Liquid Fuels and Biomass Particles.” Fuel 2011;90:1113–9.
[292] Kim, H., Baek, S.W. “Combustion of a Single Emulsion Fuel Droplet in a Rapid
Compression Machine.” Energy 2016;106:422–30.
[293] Gupta, R. B., Demirbas, A. “Gasoline, Diesel, and Ethanol Biofuels from Grasses
and Plants.” Cambridge University Press; 2010.
[294] Turns, S.R. “An Introduction To Combustion - Concepts and Applications.” 3rd
Editio. McGraw-Hill; 2012.
[295] Lin, C. Y., Wang, K.H. “Diesel Engine Performance and Emission Characteristics
using Three-Phase Emulsions as Fuel.” Fuel 2004;83:537–45.
[296] Yang, W. M., An, H., Chou, S. K., Chua, K. J., Mohan, B., Sivasankaralingam, V.,
Raman, V., Maghbouli, A., Li, J. “Impact of Emulsion Fuel with Nano-Organic
Additives on the Performance of Diesel Engine.” Applied Energy 2013;112:1206–
12.
[297] Sanjid, A., Masjuki, H. H., Kalam, M. A., Ashrafur Rahman, S. M., Abedin, M. J.,
Palash, S.M. “Production of Palm and Jatropha Based Biodiesel and Investigation
of Palm-Jatropha Combined Blend Properties, Performance, Exhaust Emission and
Noise in an Unmodified Diesel Engine.” Journal of Cleaner Production
2014;65:295–303.

240
[298] Kalogeras, K., Bezergianni, S., Kazantzi, V., Pilavachi, P.A. “On the Prediction of
Properties for Diesel/Biodiesel Mixtures Featuring New Environmental
Considerations.” Computer Aided Chemical Engineering 2010;28:973–8.
[299] Li, T. X., Zhu, D. L., Akafuah, N. K., Saito, K., Law, C.K. “Synthesis, Droplet
Combustion, and Sooting Characteristics of Biodiesel Produced from Waste
Vegetable Oils.” Proceedings of the Combustion Institute 2011;33:2039–46.
[300] Hansen, A. C., Zhang, Q., Lyne, P.W.L. “Ethanol-Diesel Fuel Blends - A Review.”
Bioresource Technology 2005;96:277–85.
[301] Liu, Y. C., Farouk, T., Savas, A. J., Dryer, F. L., Avedisian, C.T. “On the
Spherically Symmetrical Combustion of Methyl Decanoate Droplets and
Comparisons with Detailed Numerical Modeling.” Combustion and Flame
2013;160:641–55.
[302] Colbeck, I. Aerosol Formation. In: Wedlock DJ, editor. Controlled Particle, Droplet
and Bubble Formation, Butterworth-Heinemann; 2004, p. 137–58.
[303] Gonzales, R. C., Woods, R. E., Eddins, S.L. “Digital Image Processing Using
Matlab.” 2nd Editio. Tata McGraw-Hill; 2010.
[304] Mandal, D. K., Bakshi, S. “Internal Circulation in a Single Droplet Evaporating in
a Closed Chamber.” International Journal of Multiphase Flow 2012;42:42–51.
[305] Shehata, M. S., Abdel Razek, S.M. “Experimental Investigation of Diesel Engine
Performance and Emission Characteristics using Jojoba/Diesel Blend and
Sunflower Oil.” Fuel 2011;90:886–97.
[306] Imamura, O., Kubo, Y., Osaka, J., Sato, J., Tsue, M., Kono, M. “A Study on Single
Fuel Droplets Combustion in Vertical Direct Current Electric Fields.” Proceedings
of the Combustion Institute 2005;30:1949–56.
Recommended