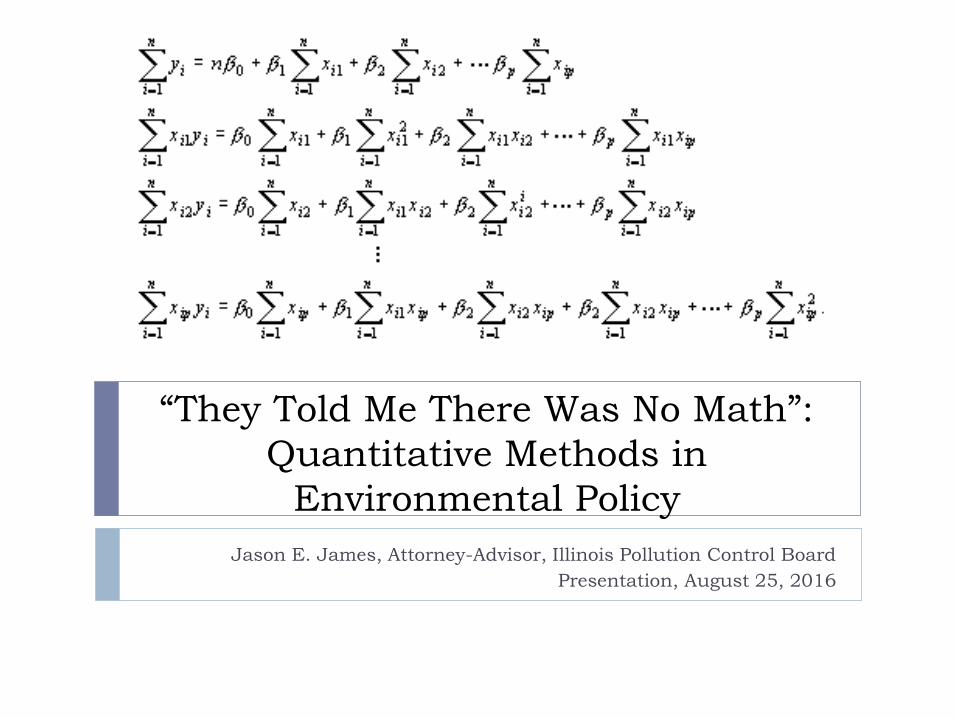
“They Told Me There Was No Math”:
Quantitative Methods in
Environmental Policy
Jason E. James, Attorney-Advisor, Illinois Pollution Control Board
Presentation, August 25, 2016
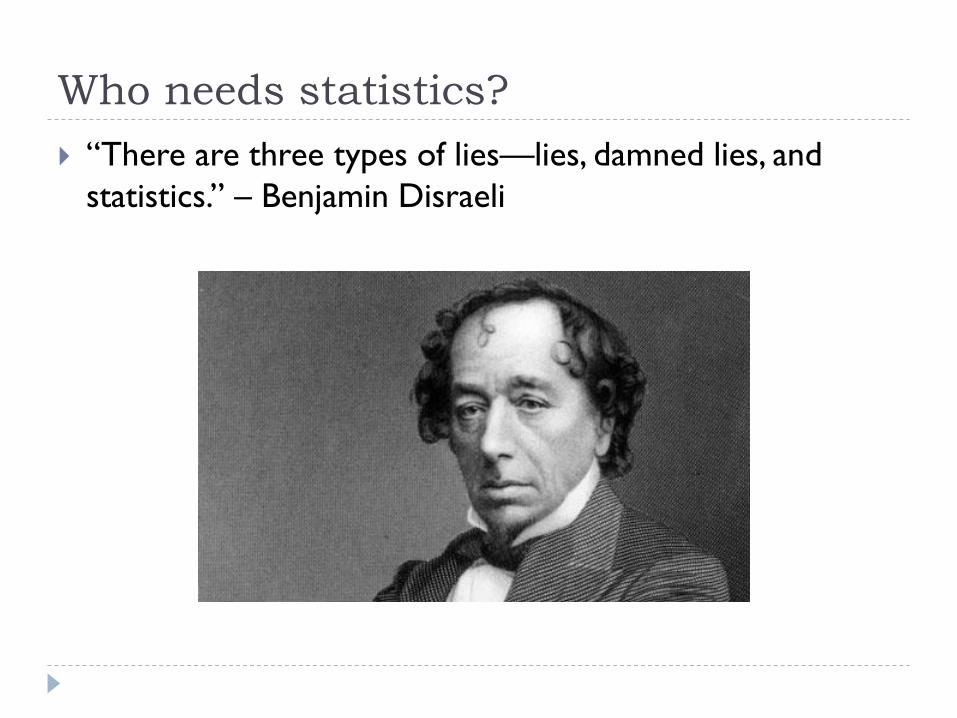
Who needs statistics?
“There are three types of lies—lies, damned lies, and
statistics.” – Benjamin Disraeli
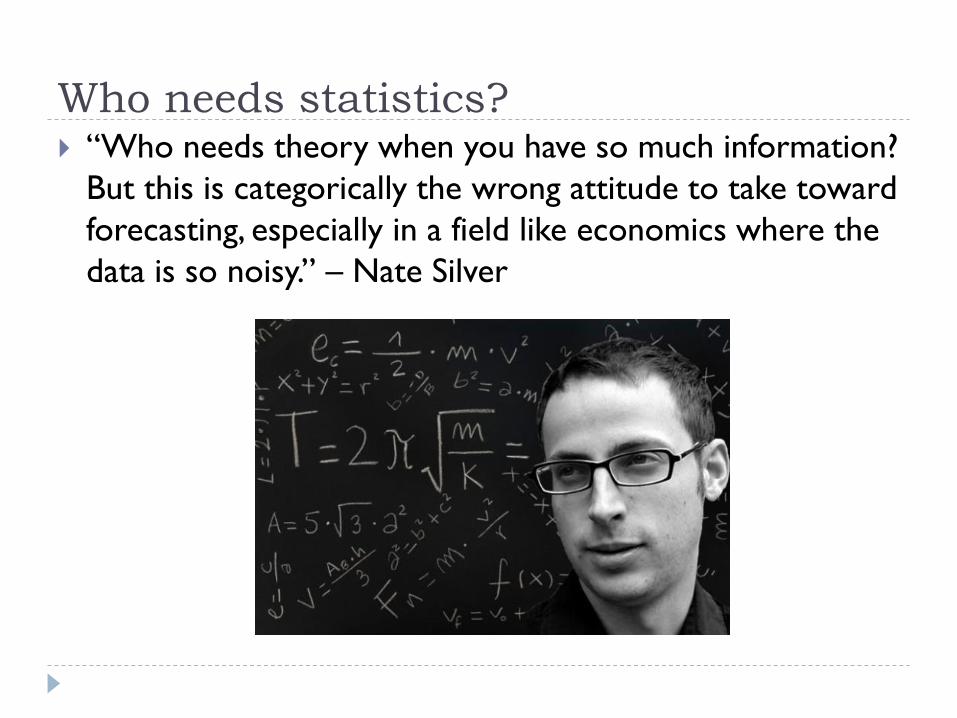
Who needs statistics? “Who needs theory when you have so much information?
But this is categorically the wrong attitude to take toward
forecasting, especially in a field like economics where the
data is so noisy.” – Nate Silver
Why statistics?
Data in public policy is here to stay
Economics underlie the policies that the Board carries
out through its adjudicatory cases and rulemakings
Economists test theory with empirical (data-based)
analysis using statistical methods
Data-based policy is a common refrain, but in policy, data
is meaningless (or worse) without statistical analysis
When parties before the Board make claims that relate
to economics, the Board as a panel of experts can
critically evaluate these claims.
My background
Not an economist or statistician
Lawyer with a mathematics background and graduate
coursework in economics and statistics
Today’s aim is to introduce some quantitative methods that
policy professionals use to assess environmental policies
Discussion will be done at a basic level—no knowledge of
math assumed
Naturally, all topics discussed get more complex as you get
into the details
When economic analysis pops up in Board matters—the
Board should be able to identify and give a basic assessment of
validity.
Outline for this hour
I. Economic theory predicts need for environmental regulation
II. Statistics interprets empirical data
III. Econometrics tests whether data supports predictions from economic theory
Notes:
All content and opinions are solely my own—not the Board’s and not Chairman Keenan’s
All discussion concerning specific policies is simply demonstrative, I am not advocating for the merits of any specific study
As always, please interrupt me with questions and comments at any point
I. Economic theory of environmental
regulation
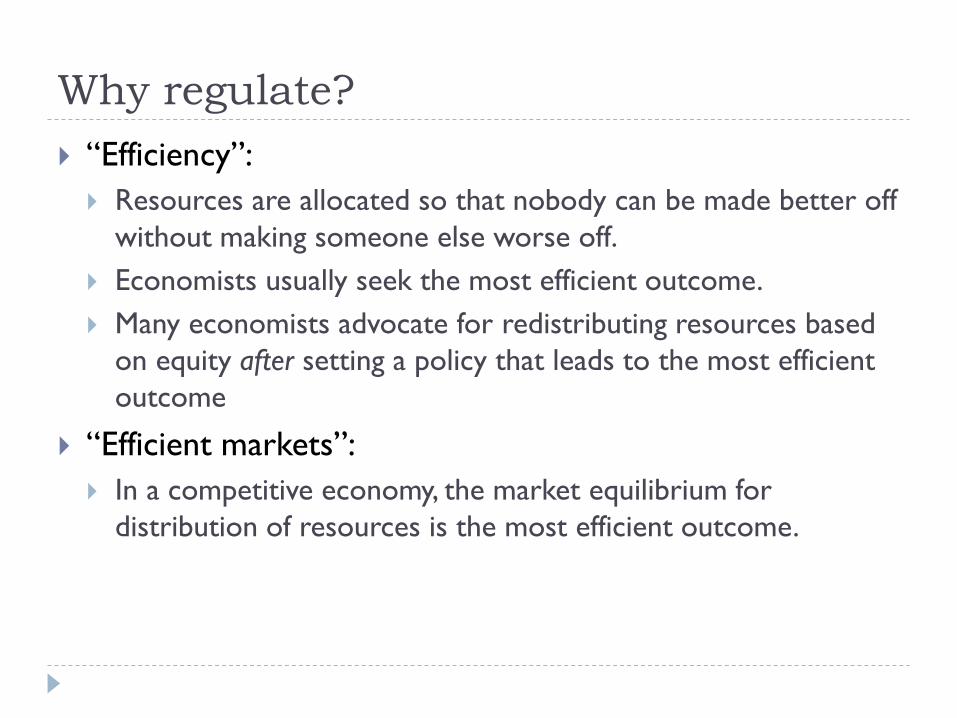
Why regulate?
“Efficiency”:
Resources are allocated so that nobody can be made better off
without making someone else worse off.
Economists usually seek the most efficient outcome.
Many economists advocate for redistributing resources based
on equity after setting a policy that leads to the most efficient
outcome
“Efficient markets”:
In a competitive economy, the market equilibrium for
distribution of resources is the most efficient outcome.
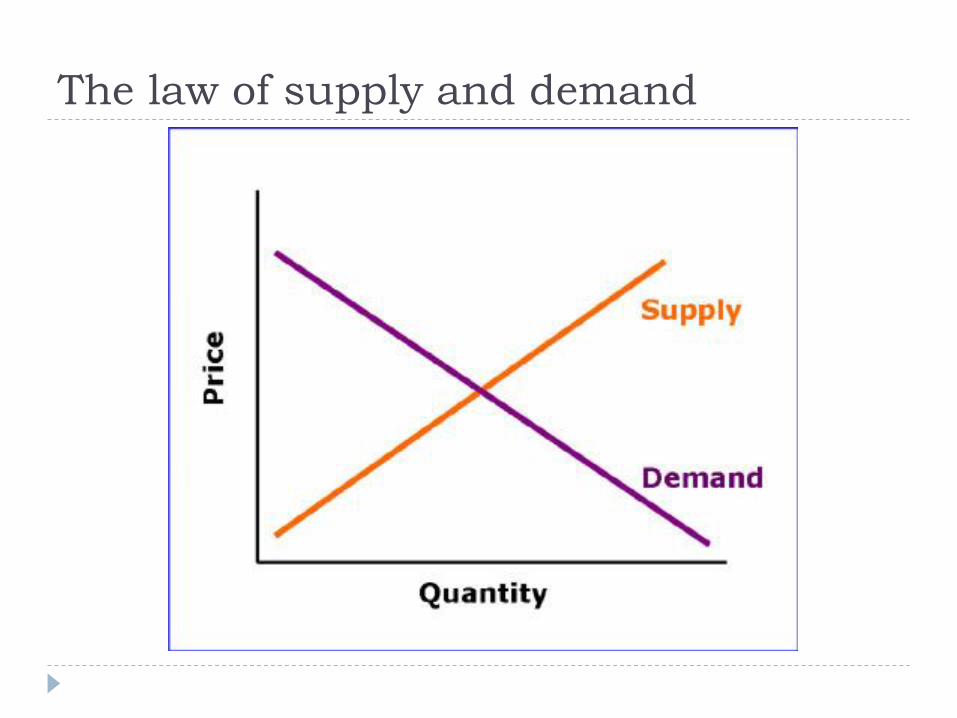
The law of supply and demand

Better if the Board never existed?
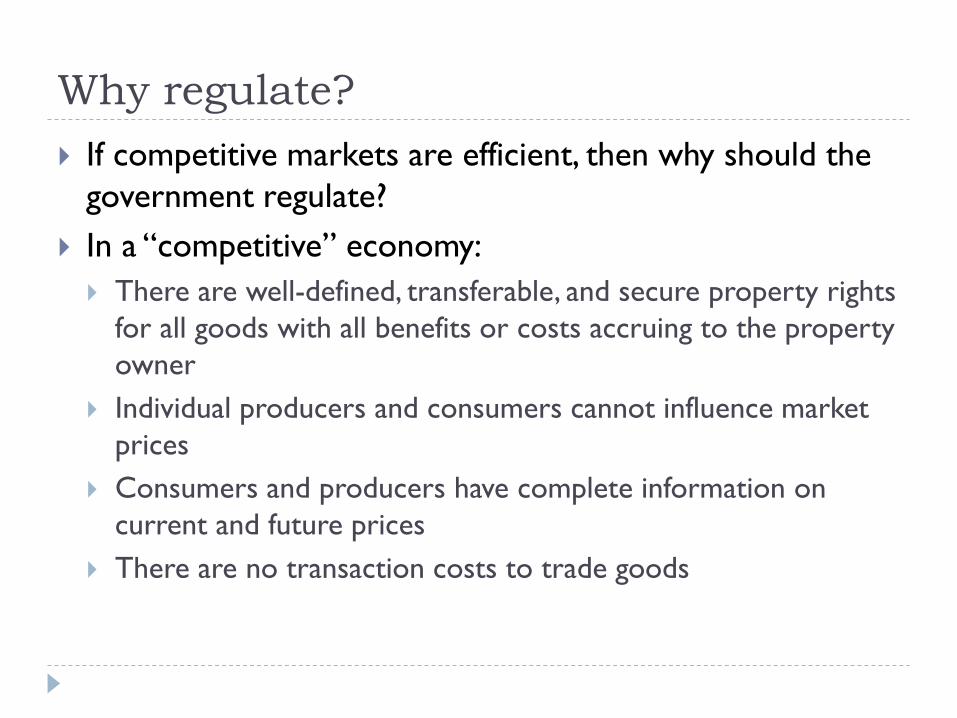
Why regulate?
If competitive markets are efficient, then why should the
government regulate?
In a “competitive” economy:
There are well-defined, transferable, and secure property rights
for all goods with all benefits or costs accruing to the property
owner
Individual producers and consumers cannot influence market
prices
Consumers and producers have complete information on
current and future prices
There are no transaction costs to trade goods
Why regulate?
Pollution violates the first assumption:
A polluting facility, absent regulation, can affect the health and
property of the nearby community.
These costs are incurred by the local community and not the
facility’s owner.
This externality is a “market failure”
An unregulated economy with a market failure does not lead
to an efficient outcome
Government regulation is needed to achieve the efficient
outcome
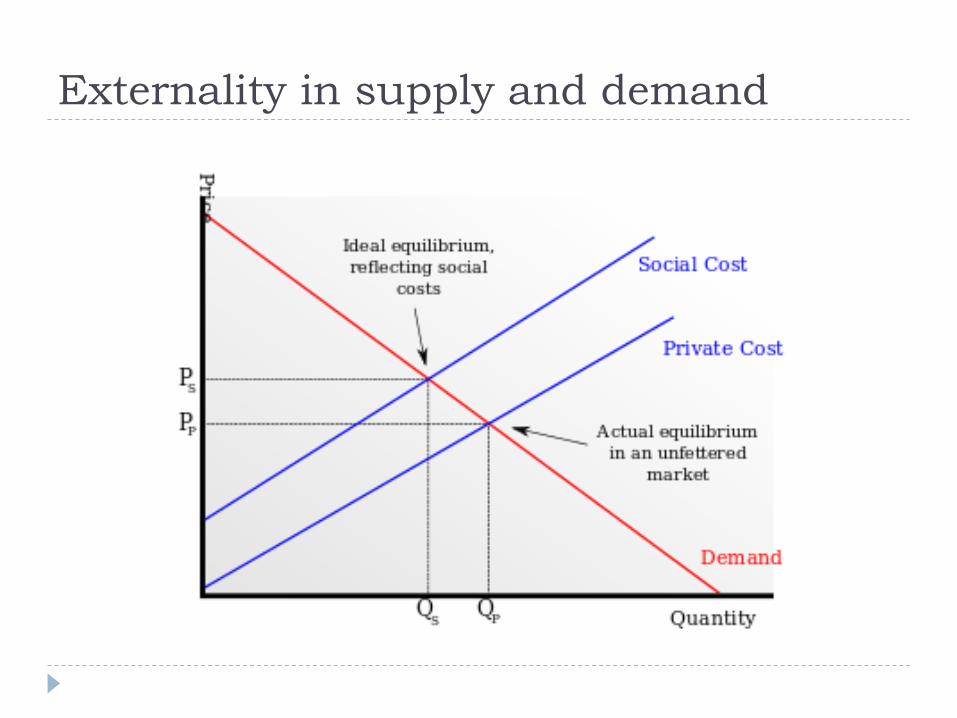
Externality in supply and demand
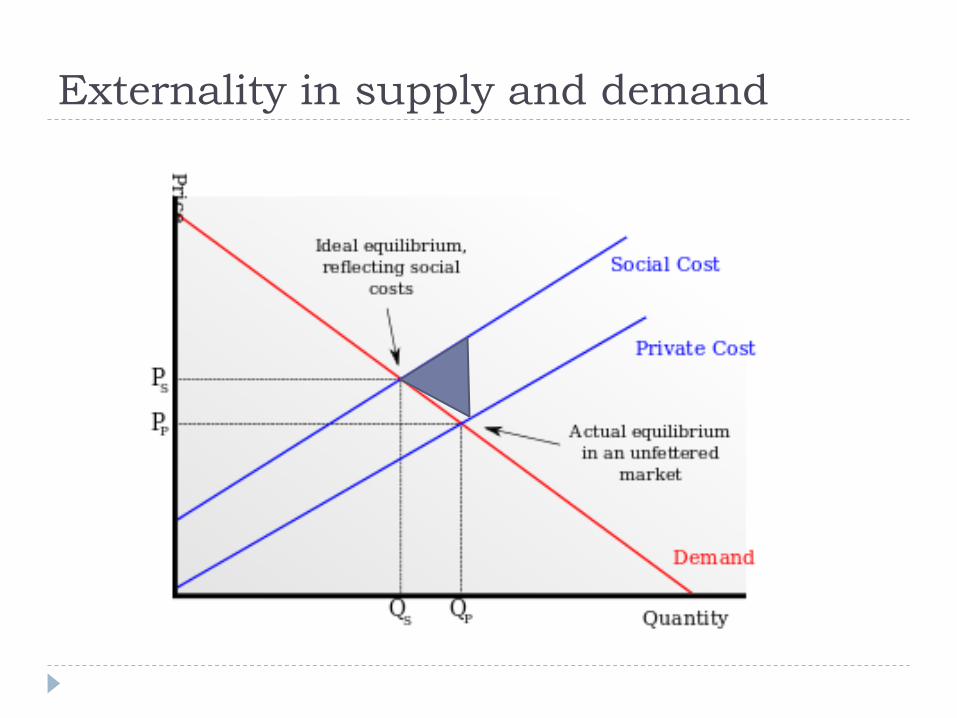
Externality in supply and demand
Regulating despite uncertainty
The economic theory of externalities is intuitive, but
deciding “how much” protection is warranted is not easy
The true and complete cost of most environmental
externalities is uncertain
Uncertainty in environmental policy makes it difficult to
decide “how much” regulation
What policies are “good deals” (cost-effective) and which are
bad (not cost-effective)?
Statistics is the best tool we have to evaluate this
uncertainty and make the best possible “bet”

Example: Climate Casino
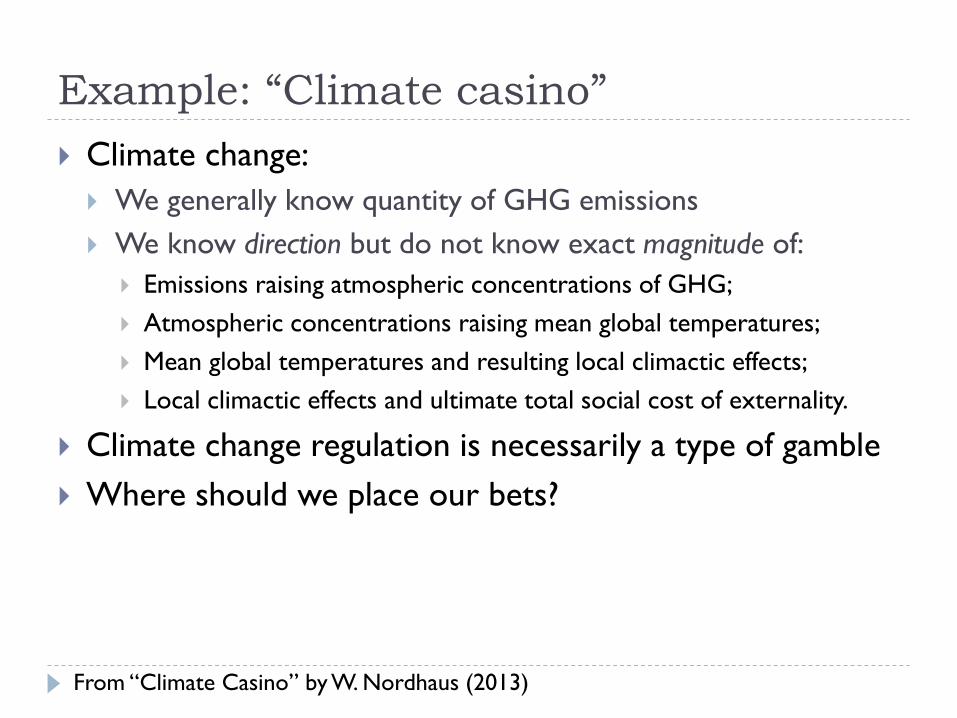
Example: “Climate casino”
Climate change:
We generally know quantity of GHG emissions
We know direction but do not know exact magnitude of:
Emissions raising atmospheric concentrations of GHG;
Atmospheric concentrations raising mean global temperatures;
Mean global temperatures and resulting local climactic effects;
Local climactic effects and ultimate total social cost of externality.
Climate change regulation is necessarily a type of gamble
Where should we place our bets?
From “Climate Casino” by W. Nordhaus (2013)
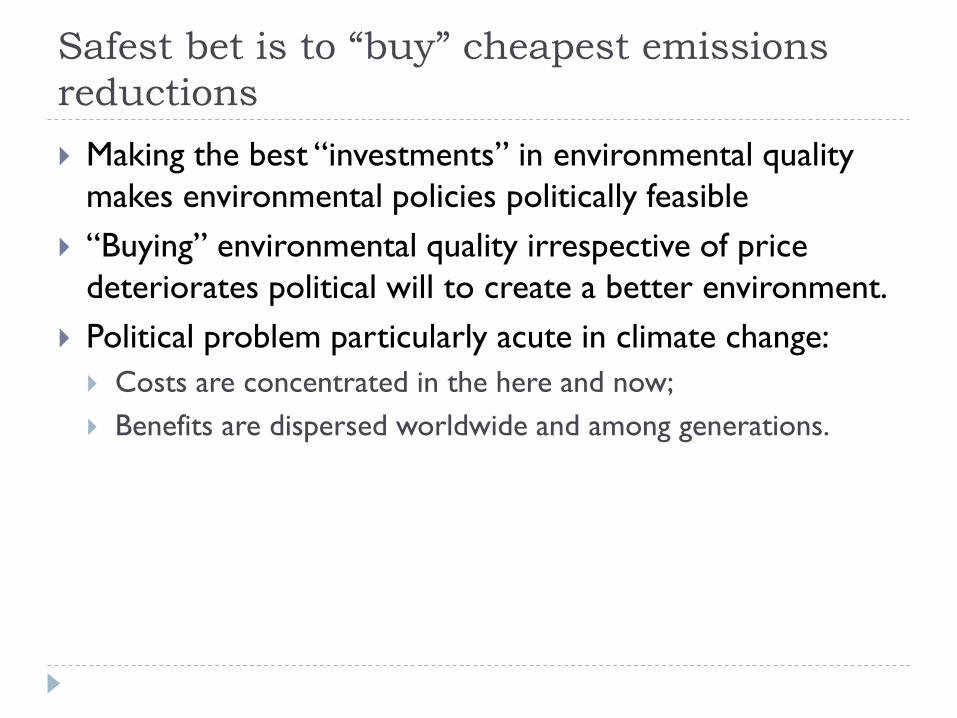
Safest bet is to “buy” cheapest emissions
reductions
Making the best “investments” in environmental quality
makes environmental policies politically feasible
“Buying” environmental quality irrespective of price
deteriorates political will to create a better environment.
Political problem particularly acute in climate change:
Costs are concentrated in the here and now;
Benefits are dispersed worldwide and among generations.
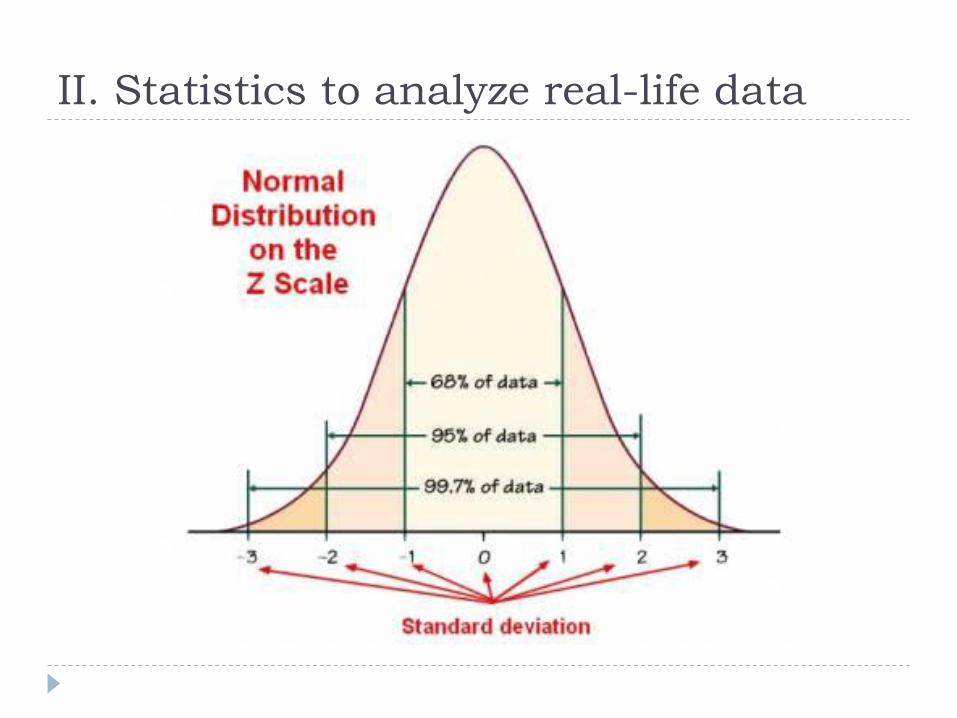
II. Statistics to analyze real-life data
Now the numbers
We turn from economic theory into analysis of empirical
data
Economists use probability, statistics, and econometrics to
evaluate policies that aim to address pollution
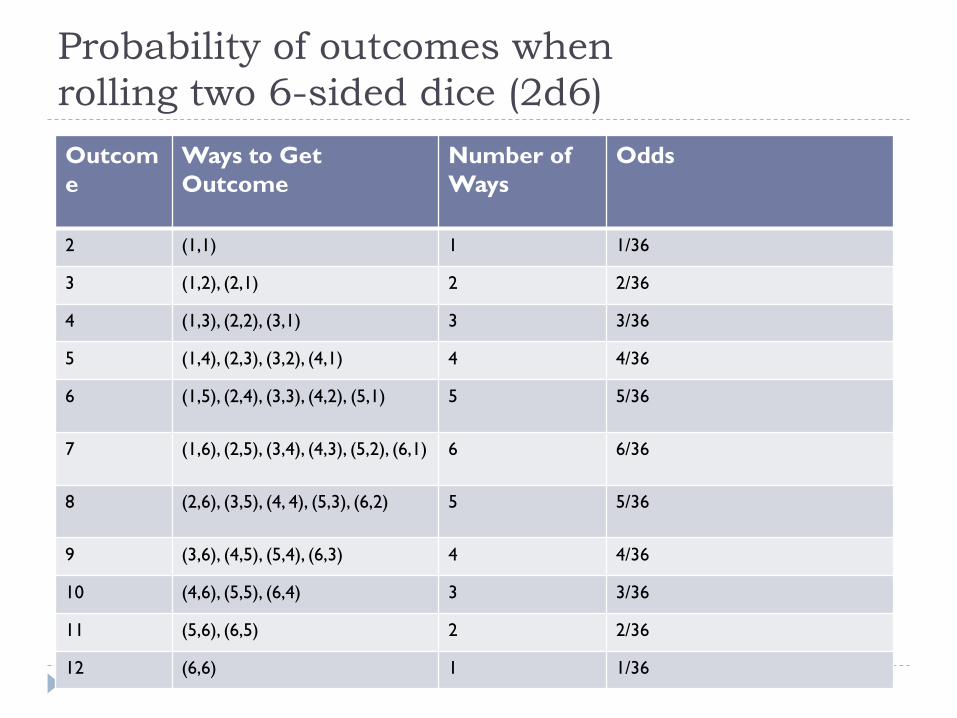
Probability of outcomes when
rolling two 6-sided dice (2d6)
Outcom
e
Ways to Get
Outcome
Number of
Ways
Odds
2 (1,1) 1 1/36
3 (1,2), (2,1) 2 2/36
4 (1,3), (2,2), (3,1) 3 3/36
5 (1,4), (2,3), (3,2), (4,1) 4 4/36
6 (1,5), (2,4), (3,3), (4,2), (5,1) 5 5/36
7 (1,6), (2,5), (3,4), (4,3), (5,2), (6,1) 6 6/36
8 (2,6), (3,5), (4, 4), (5,3), (6,2) 5 5/36
9 (3,6), (4,5), (5,4), (6,3) 4 4/36
10 (4,6), (5,5), (6,4) 3 3/36
11 (5,6), (6,5) 2 2/36
12 (6,6) 1 1/36
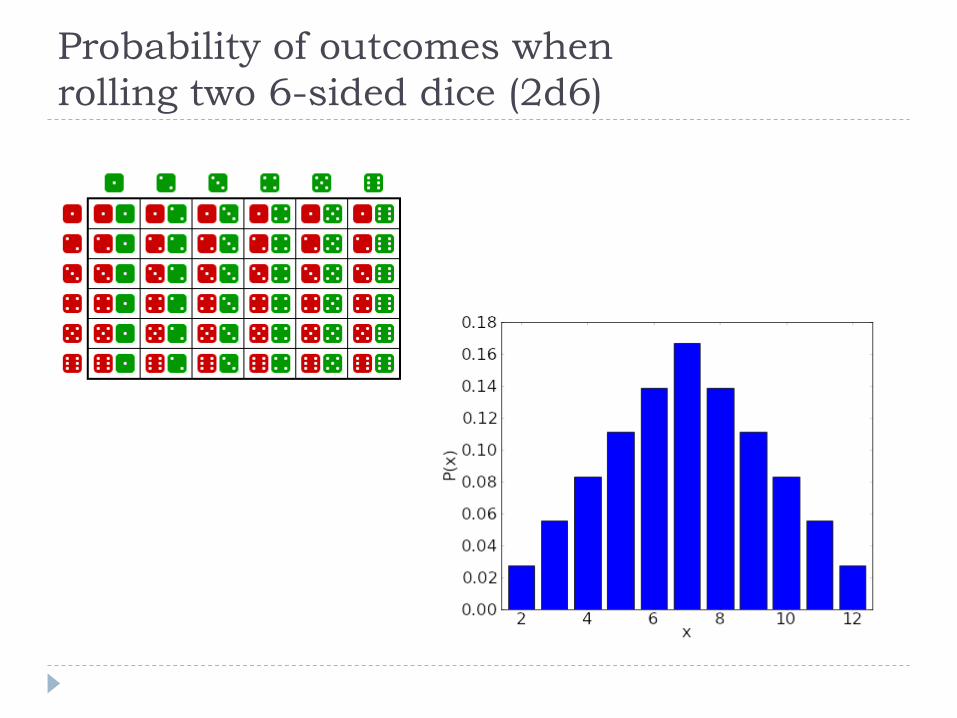
Probability of outcomes when
rolling two 6-sided dice (2d6)
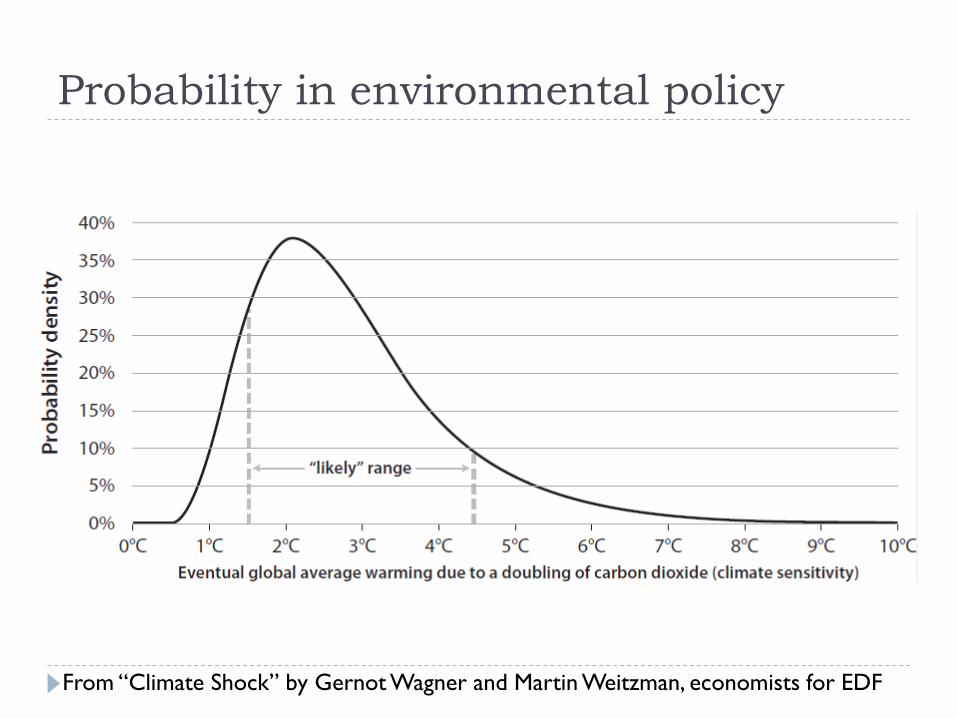
Probability in environmental policy
From “Climate Shock” by Gernot Wagner and Martin Weitzman, economists for EDF
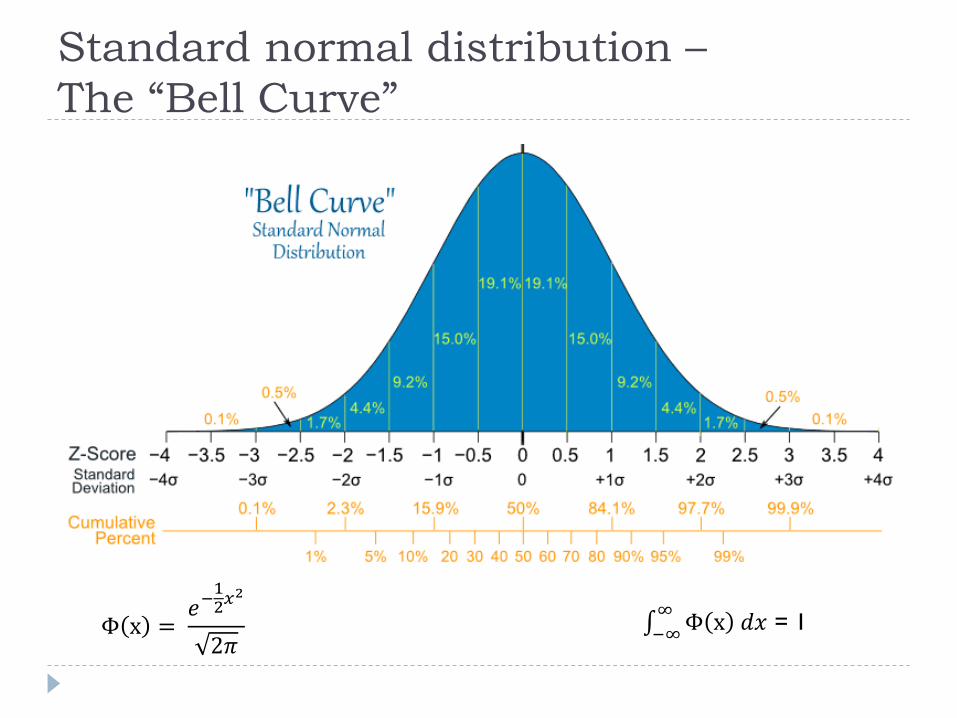
Standard normal distribution –
The “Bell Curve”
Φ x = 𝑒−
12𝑥
2
2𝜋 Φ x 𝑑𝑥
∞
−∞ = 1
Statistical significance
In law, we use “significant” in a qualitative sense.
For economists, “significant” is a hard, quantitative
measure.
This concept is central to econometrics—the means by
which economists infer causal relationships between a
policy and its effect.
Significance tests analyze data to see whether the result is
“statistically significant”—whether the result means
something or could have been created by random chance
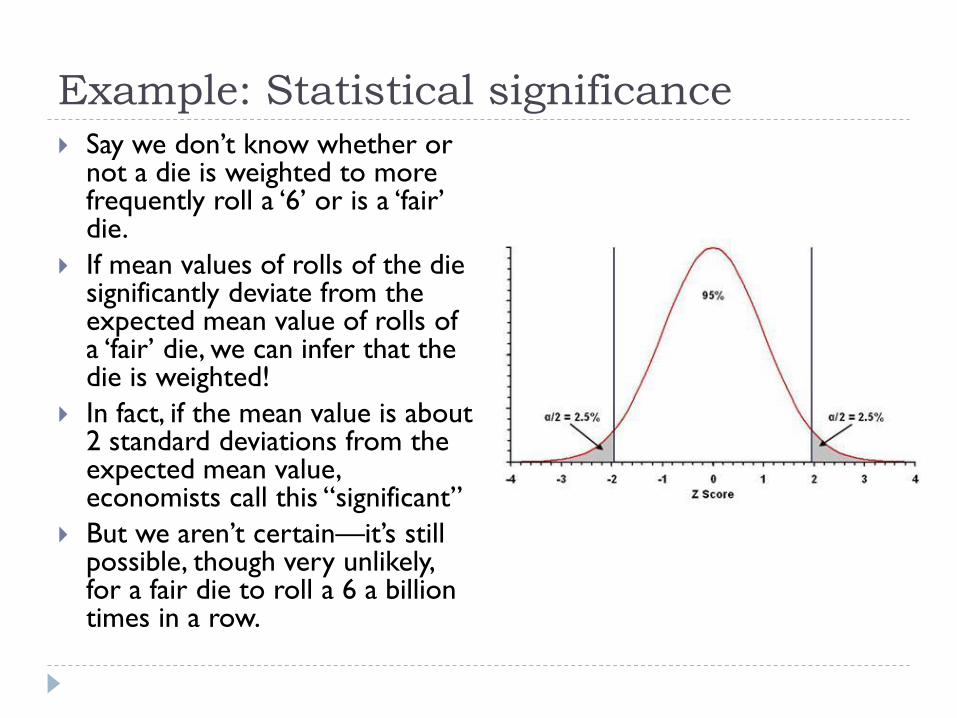
Example: Statistical significance Say we don’t know whether or
not a die is weighted to more frequently roll a ‘6’ or is a ‘fair’ die.
If mean values of rolls of the die significantly deviate from the expected mean value of rolls of a ‘fair’ die, we can infer that the die is weighted!
In fact, if the mean value is about 2 standard deviations from the expected mean value, economists call this “significant”
But we aren’t certain—it’s still possible, though very unlikely, for a fair die to roll a 6 a billion times in a row.
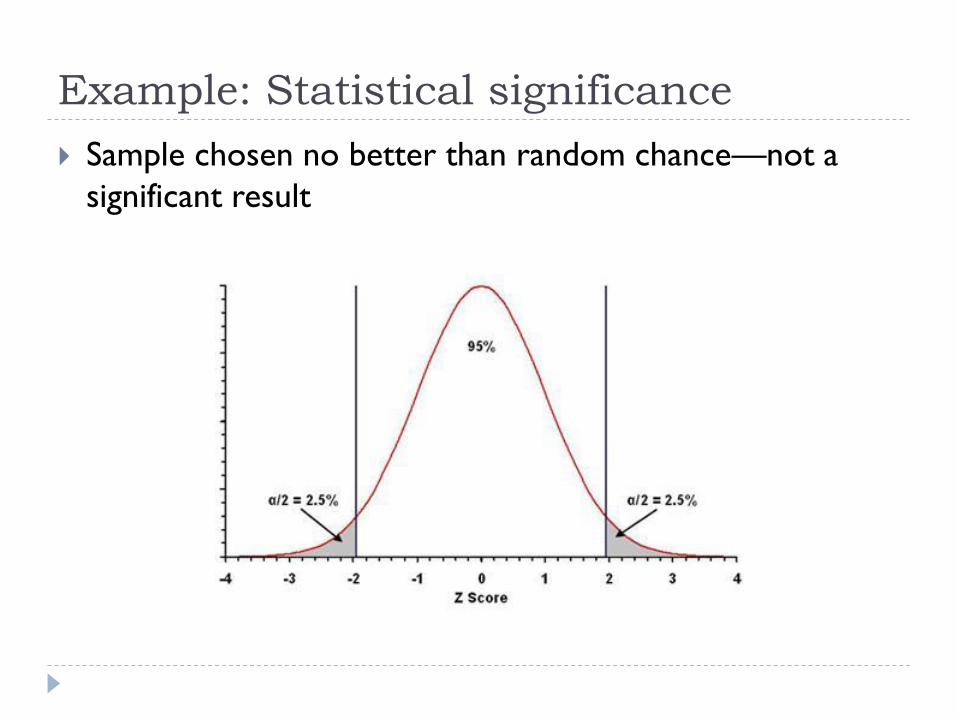
Example: Statistical significance
Sample chosen no better than random chance—not a
significant result
In the face of uncertainty, how to test a
regulation’s effects?
These tools help us test whether we can say a policy is
having an effect
Another example:
The reading level of students in an elementary school closely
correlates with students’ shoe size
A very naïve policy-maker decides to implement a policy to
increase students’ shoe size with the end goal of helping
students reading abilities.
But causation is not correlation!
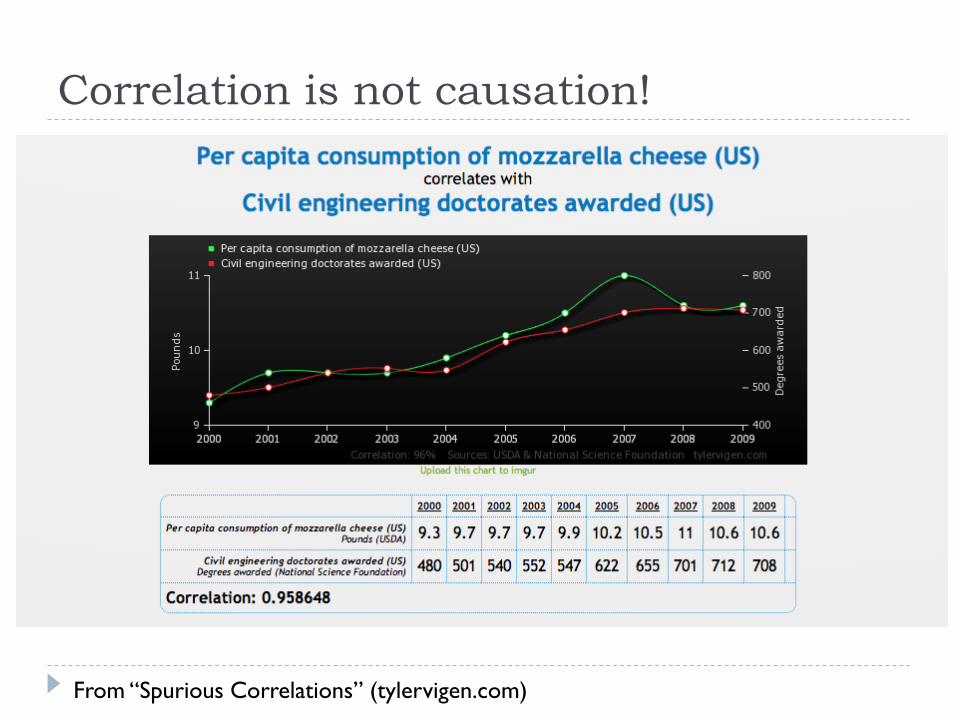
Correlation is not causation!
From “Spurious Correlations” (tylervigen.com)
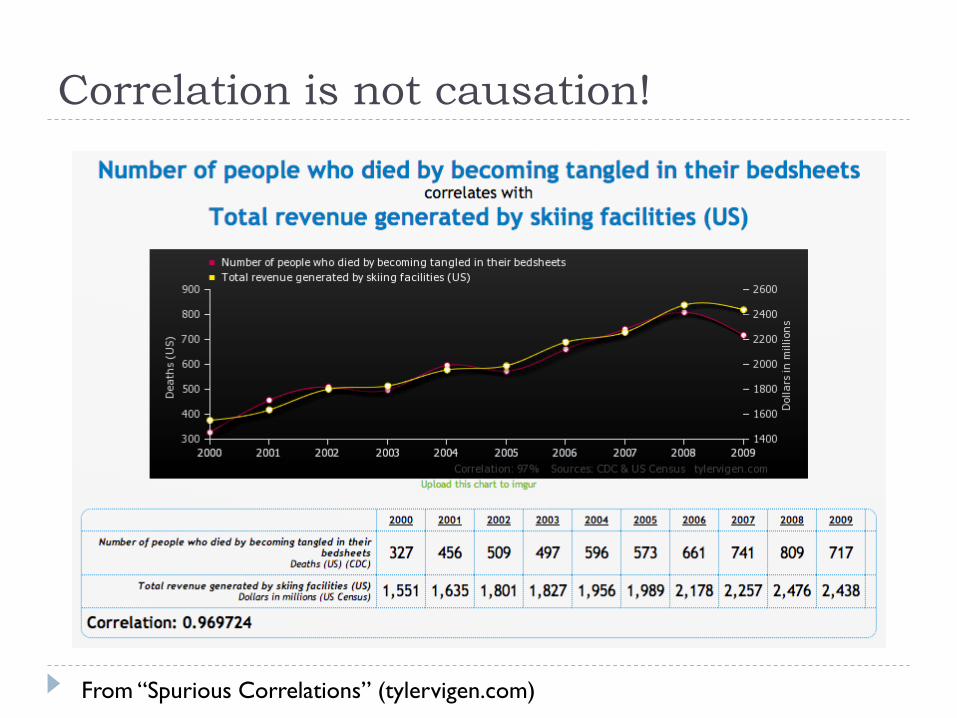
Correlation is not causation!
From “Spurious Correlations” (tylervigen.com)
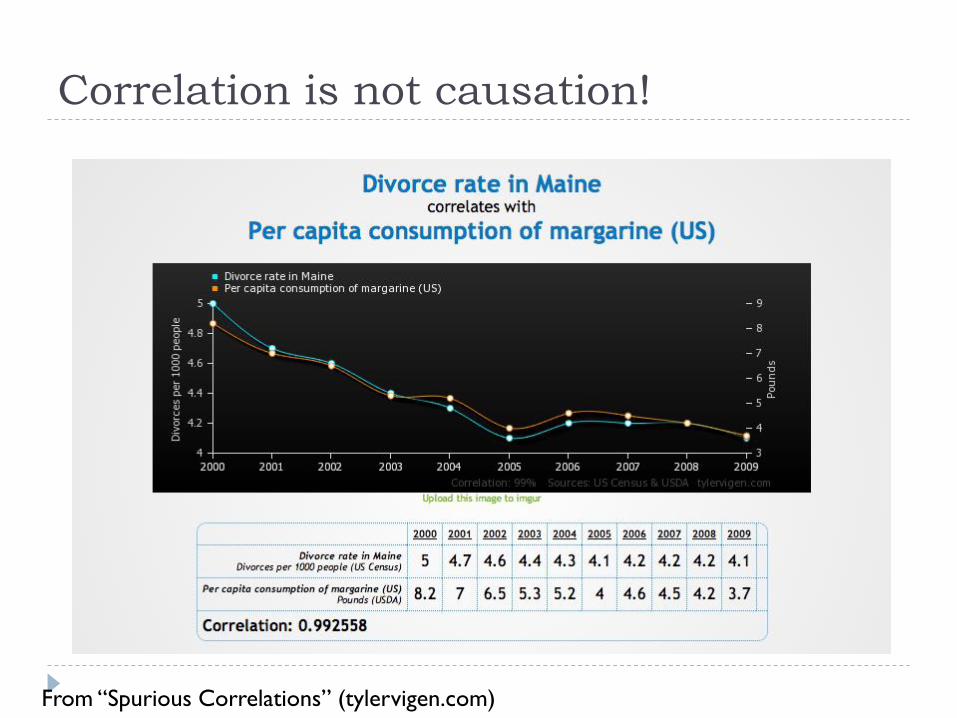
Correlation is not causation!
From “Spurious Correlations” (tylervigen.com)
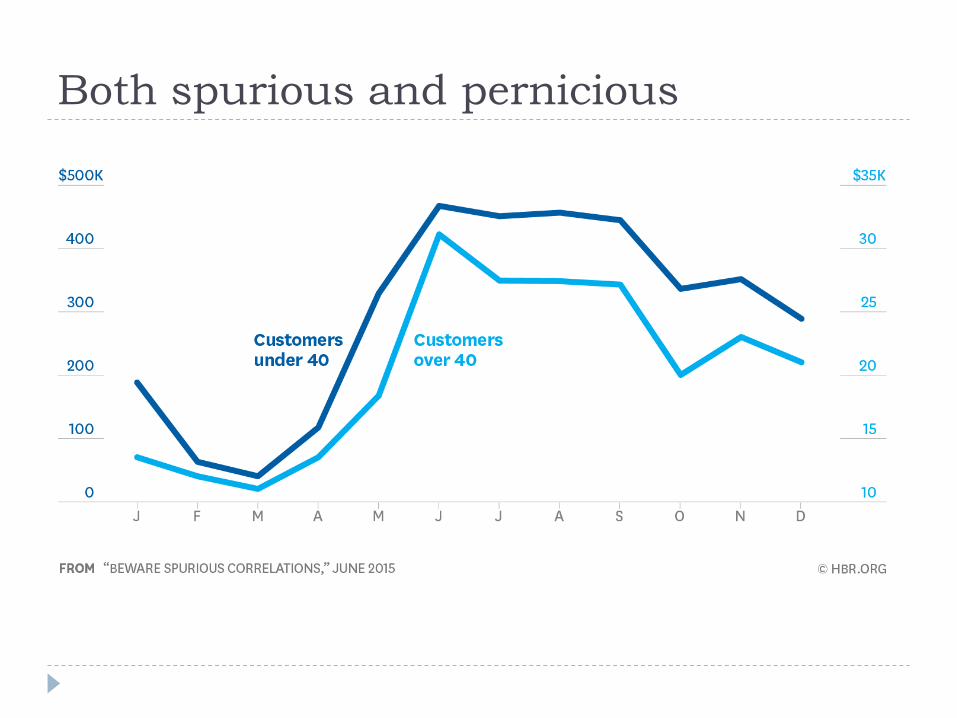
Both spurious and pernicious
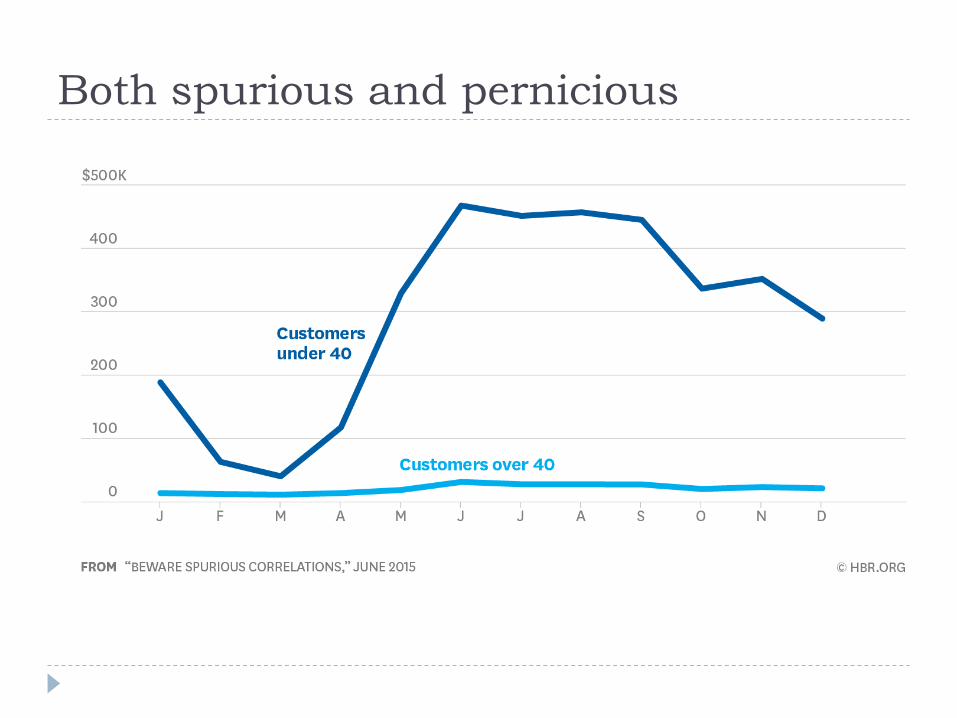
Both spurious and pernicious
III. Econometrics to test
economic theory using data
Econometrics – drawing causal inference
Applying the statistical method of linear regression to a
set of data
Essentially attempts to simulating a randomized
controlled test, as in the field of science
Hopes to show how much one factor “causes” an
effect—a stronger relationship than correlation
For example: what effect does a worker’s education,
experience, and tenure have on his or her wage?
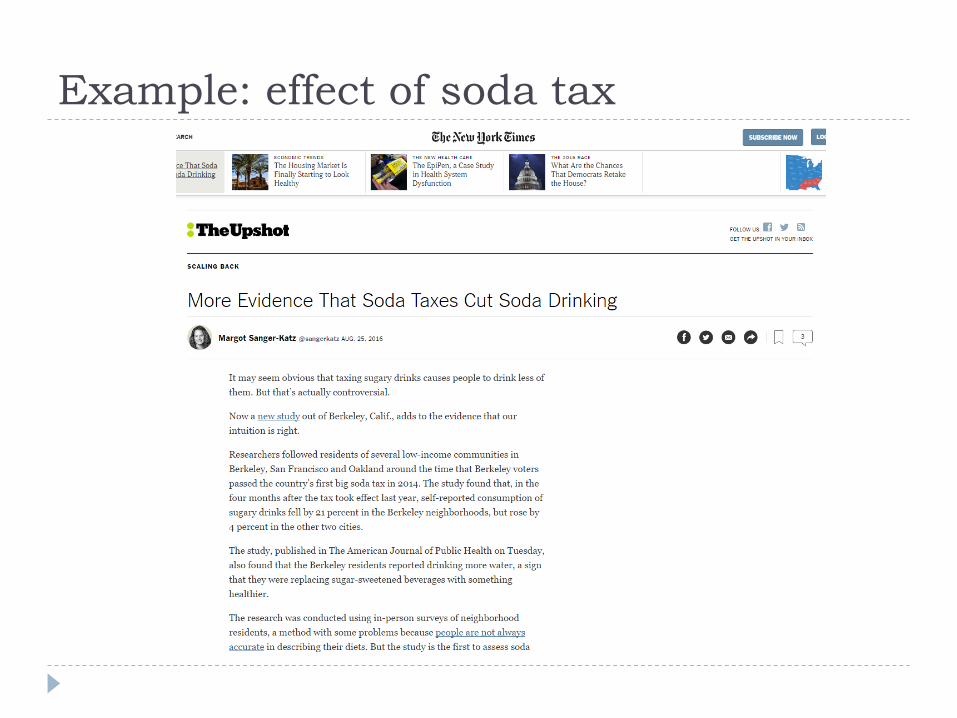
Example: effect of soda tax
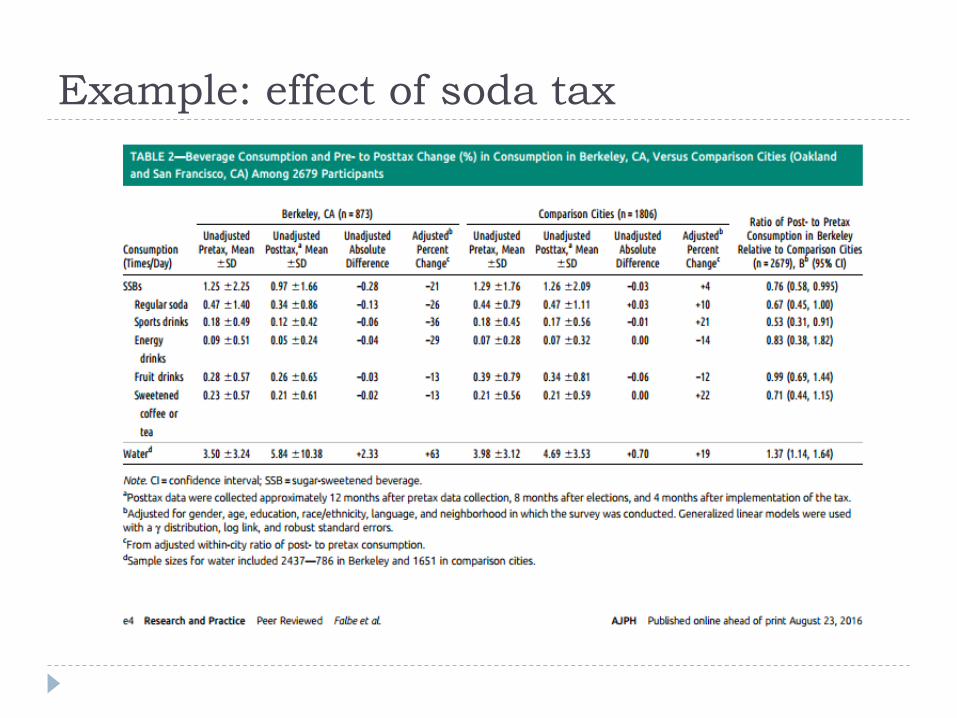
Example: effect of soda tax
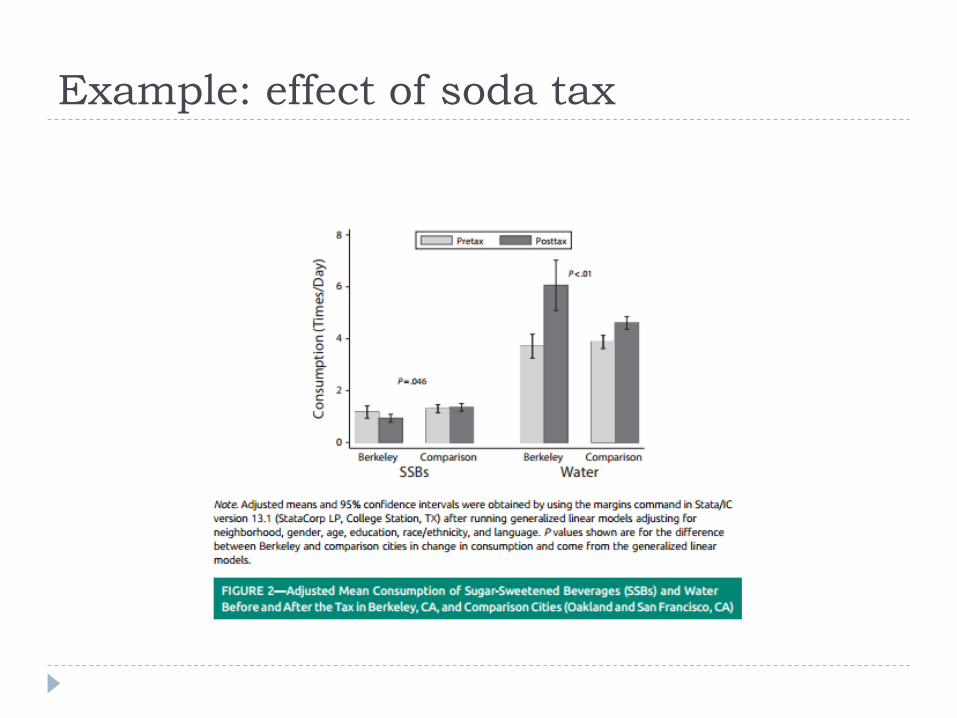
Example: effect of soda tax

Finish Line
Conclusions
Though the Board does not employ an economist, we can
do more than just uncritically accept economic evidence
at face value.
First, consider the source of data.
When presented with economic evidence, consider
whether a correlation or causal inference is being
presented.
If evidence is purportedly causal, consider how that
conclusion was made
If it’s just a correlation, consider what other contributing
factors could come into play.

Questions?
Recommended