1
Quarterly Performance Review
Quarter 2 : 2017-18 Mumbai, 14th November, 2017
India’s New Growth Story

2
Certain statements in this report may be “forward looking statements” within the meaning of applicable securities laws and regulations. Actual results could differ materially from those expressed or implied. Important factors that could make a difference to the company’s operations include global and Indian demand supply conditions, finished goods prices, feed stock availability and prices, cyclical demand and pricing in the company’s principal markets, changes in Government regulations, tax regimes, economic developments within India and the countries within which the company conducts business and other factors such as litigation and labour negotiations. The company assume no responsibility to publicly amend, modify or revise any forward looking statement, on the basis of any subsequent development, information or events, or otherwise.
Forward Looking & Cautionary Statement
Country and Year of Incorporation: India, 1947
Listing: India (BSE/NSE) , GDR (Luxembourg)
Bloomberg Ticker: GRASIM IB EQUITY , GRASIM IS EQUITY, GRAS LX (GDR)
Business Description: Viscose, Chemicals, Cement and Financial Services
Market Cap: $12.3 Bn (13th Nov)

3
Top
Priorities
Business Performance
Financial
Performance Highlights
Glossary
VSF:Viscose Staple Fiber, VFY: Viscose Filament Yarn, MT : Metric Ton, K: One Thousand, TPA : Tons Per Annum, YoY: Year on Year Comparison, CY : Current Year, LY : Last Year, YTD : Year to Date, EBITDA : Earnings Before Interest, Tax ,Depreciation and Amortisation, ECU : Electro Chemical Unit, ROAvCE : Return on Avg. Capital Employed (Excluding Capital Work In Progress), EBITDA Margin = EBITDA / (Revenue + Other Income) * 100;
Revenue is net of excise duty unless stated otherwise, Financials from FY16 onwards are as per Ind AS
Content

4
Performance
Highlights
Leadership
Businesses
Grasim:India’s New Growth
Story
Indian Economy
Highlights

5
Indian Economy
India’s GDP growth slowed to 5.7% YoY in Q1FY18
India’s industrial production grew by 4.3% YoY in Aug-17 and 0.9% in Jul-17 after contracting in Jun-17 for the first time in
4 years
• Companies increased production to restock warehouses ahead of festive season
In order accelerate the economic growth, the Government has
• Front loaded its spending (Fiscal deficit reached 96% of full year target for FY18)
• Announced a fiscal stimulus worth around Rs.7 lakh Cr.
• Bank recapitalisation programme (` 2 lakh Cr.) and highways construction project (` 5 lakh Cr.).
• The bank recapitalisation is expected to spur bank lending and boost growth

6
Grasim: India’s New Growth Story

7
Our Leadership Businesses
No.1 producer in India
No.4 producer Globally (ex China)
Cement
Top-3 players by RMS (18.9%)*
Telecom
No.1 Caustic Soda producer
(938 KTPA)
Chemicals
Top-5 private diversified NBFCs ($6 Bn) Top-4 AMC’s ($38 bn)
Financial Services
No.1 VSF producer
(498 KTPA)
Viscose
*Q1FY18

8
Grasim: India’s New Growth Story
Revenue (FY17)
Noted: Telecom Consolidated at PAT level ; USD/INR Rate: R.65; * : Proforma
$6bn $8bn*
Cement 70%
Viscose 20%
Chemicals 10%
Financial services
18%
Cement 50%
Viscose 16% Chemicals
8%
Others 8%

9
Key Highlights:Q2FY18
Low capacity utilization for the sector
Acquired asset: Cash break-even by April-June 2018
Rural share of sales increased to 40%
Energy cost rising with higher pet coke prices
Cement No.1 Cement producer Ramping up of the acquired asset
VSF Robust performance led by higher
volume and realisation Sustainability: Ranked 1st by
Canopy’s Hot Button Report (No wood sourcing from endangered forests). The ranking is highly valued by global brands
Chemicals Improving chlorine consumption
in VAP products
Viscose & Chemicals
No.1 VSF and Chemical producer
Chemicals capacity Expansion at Vilayat, Ganjam and Karwar NBFC
Achieved highest ever Lending book; Long term issuer rating upgraded to ‘AAA’ for NBFC and Housing finance business reflecting, strength of parent
Life Insurance The Embedded Value for
Insurance business for March-17 was at Rs.3,810 Cr. vs. Traditional Embedded Value at Rs.3,428 Cr.
Financial Services Listing of Aditya Birla Capital Ltd.
(BSE/NSE)
Strong Operational Performance in all our Businesses
Revenue Rs.13,646 Cr.
EBITDA Rs.2,805 Cr.
*PAT before share in profits of JVs and Associates
63% 34%

10
Strong
Financials
Consolidated
Revenue and EBITDA
Consolidated
Results
Q2FY18
Financial Performance

11
Consolidated Results Q2FY18
(Rs. Cr) Q2FY18 Q2FY17 YOY (%)
Revenue 13,646 8,386 63%
Other Income 290 312 (7%)
EBITDA 2,805 2,098 34%
Interest 430 167 157%
Depreciation / Amortisation 795 449 77%
PBT 1,580 1,482 7%
Profit /Loss of Equity accounted Investees (net of tax)1 (260) 57
Exceptional Item2 (88) - -
Tax 446 449 (1%)
PAT (Before exceptional item and share in profits of JVs and Associates)
1,134 1,033 10%
PAT (After share in profits of JVs and Associates and loss attributable to participating policyholders of Life insurance business)
799 1,090 (28%)
PAT (After Minority) 525 846 (38%)
1 Idea loss Rs.310 Cr. , AMC profit Rs.38 Cr., Pulp & Fibre JVs profit Rs.35 Cr., Payment bank loss Rs.25 Cr., Other entities profit Rs.2 Cr. 2 Rs.88 Cr. loss on divestment of GBTL Note: The Results of the Q2FY18 include the financial results of the businesses of erstwhile ABNL (merged with the Company w.e.f. 1st July, 2017) . Hence the same are not comparable with Q2FY17.

12
Consolidated Results Q2FY18 - Segmental
(Rs. Cr) Revenue YoY (%)
EBITDA YoY (%)
EBITDA Margins(%)
Viscose* 2,119 22% 468 26% 22%
Chemical* 1,168 27% 285 26% 24%
Cement 6,936 20% 1,550 12% 22%
Financial Services 2,677 - 361 - -
-
Others/Inter Segment Elimination* 746 - 141 - -
• Viscose segment includes VSF and VFY; Chemical segment includes Grasim and erstwhile ABNL (Veraval) units; Others segment includes Textile, Insulator and Fertilizer
Note: ABCL reported Consolidated revenue at `3,193 Cr., EBT `388 Cr. and PAT `227 Cr. as per IGAAP

13
Consolidated Revenue(Q2FY18)
Viscose Chemicals
Financial Services Cement
Rs.920
5771
7035 6936
Q2FY17 Q1FY18 Q2FY18
Rs.13,646 Cr
*Viscose business includes VSF and VFY revenue, Chemicals business EBITDA includes the chemicals business of erstwhile ABNL, the revenue of VFY and Veraval (Chemicals) has been incorporated since Q2FY18 since ABNL got merged from 1st July 2017
1740 1836
Q2FY17 Q1FY18 Q2FY18
VFY
2,119
200
920
1084
Q2FY17 Q1FY18 Q2FY18
76 Veraval
1,168
(Rs.C
r)
(Rs.C
r) (R
s.Cr)
2677
Q2FY17 Q1FY18 Q2FY18
(Rs.C
r)
Not part of Grasim
Viscose 15%
Chemicals 9%
Cement 51%
Financial Services
20%
Others 5%

14
Consolidated EBITDA(Q2FY18)
Viscose Chemicals
Financial Services Cement
1378
1798
1550
Q2FY17 Q1FY18 Q2FY18
VFY
*Viscose business includes VSF and VFY EBITDA, Chemicals business includes the chemicals business of erstwhile ABNL, the EBITDA of VFY and Veraval (Chemicals) has been incorporated since Q2FY18 since ABNL got merged from 1st July 2017
371
349
Q2FY17 Q1FY18 Q2FY18
61 VFY
213
244
Q2FY17 Q1FY18 Q2FY18
23 Veraval
285 468
(Rs.C
r) (R
s.Cr)
(Rs.C
r)
361
Q2FY17 Q1FY18 Q2FY18
(Rs.C
r)
Not part of Grasim
Rs. 2,805Cr
Viscose 17%
Chemicals 10%
Cement 55%
Financial Services
13%
Others 5%

15
31-03-2017 30-09-2017
Net Worth 31,387 56,261
Debt:Equity (x) 0.22 0.28
Net Debt: Equity (x) - 0.18
Net Debt / EBITDA - 1.38
ROAvCE (%)
(Excluding CWIP)12.8 11.1
Strong Balance Sheet and Financial Ratios
Consolidated Financial Ratios
* Zero net debt as on 31.3.2017; Net cash surplus is ` 2,225 Cr.
*
*
Consolidated Debt / Surplus ( ` Cr.)
Debt Liquid Investments Surplus Net Debt
Standalone Debt / Surplus ( ` Cr.)
9,213
11,438
2,225
Mar-17
22,252
7,797
14,455
Sep-17
701
2,546
1,845
Mar-17
2,479 2,753
274
Sep-17

16
Financial Services
Cement Chemicals Viscose
Business Performance

17
Viscose Industry
Global Prices Trend ($/Kg)
India demand growth ~8% (+) higher than the global demand by 200 bps (+)
VSF is the fastest growing fibre globally, the demand is growing at double the rate of the competing fibres
VSF prices remained firm during the quarter led by plants closure/turndown in China due to environmental factors
Leveraging on LIVA brand - Continued focus on expanding usage and application of VSF in domestic textile market
will bolster the VSF demand in the textile value chain
Business outlook expected to remain stable, barring some seasonal softening in sync with the global trend
0.7
0.9
1.1
1.3
1.5
1.7
1.9
2.1
2.3
Mar-1
5
Jun
-15
Sep
-15
De
c-15
Mar-1
6
Jun
-16
Sep
-16
De
c-16
Mar-1
7
Jun
-17
Sep
-17
Grey VSF Cotton PSF
Ind
ustry D
ata

18
Business Performance: Viscose
VSF volumes up by 5% YoY led by Inventory restocking in domestic market by value chain
Realisation up 5% YoY driven by global VSF prices
EBITDA Margins improved despite of input cost pressure, mainly driven by higher realisation and operational
efficiencies
VFY: EBITDA is higher mainly due to higher realization on account of finer denier and lower Fixed cost
EBITDA/Ton EBITDA (Rs.Cr)
121KT 134KT*
124KT 29,919 28,843
34,925
Q2FY17 Q1FY18 Q2FY18
Revenue (Rs. Cr)
Viscose Sales Volume
* Sales Volume includes VSF (130KT) and VFY sales (4KT)
1740 1836 200
Q2FY17 Q1FY18 Q2FY18
2,119 371 349 61
Q2FY17 Q1FY18 Q2FY18
468
VFY VFY

19
Chemicals Industry
Caustic Soda Prices ($)/Ton
Sharp increase in International Caustic prices driven by supply constraint due to environmental considerations in
China and weather disruption in US
Demand from major consuming segment expected to stay robust
Chlorine prices recovered during the quarter but oversupply situation continues
Increase in Caustic supply expected on account of new capacity additions in the industry
300
350
400
450
500
550
600
Industry Data; India landed Prices
20
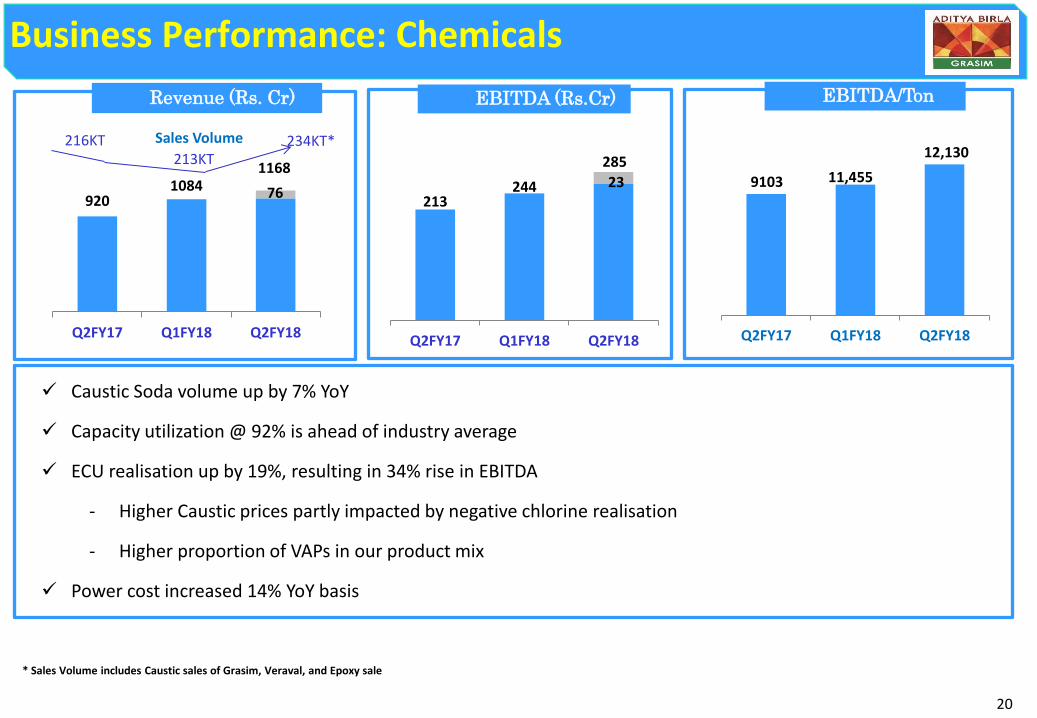
Business Performance: Chemicals
Caustic Soda volume up by 7% YoY
Capacity utilization @ 92% is ahead of industry average
ECU realisation up by 19%, resulting in 34% rise in EBITDA
- Higher Caustic prices partly impacted by negative chlorine realisation
- Higher proportion of VAPs in our product mix
Power cost increased 14% YoY basis
EBITDA/Ton EBITDA (Rs.Cr)
9103 11,455
12,130
Q2FY17 Q1FY18 Q2FY18
Revenue (Rs. Cr)
* Sales Volume includes Caustic sales of Grasim, Veraval, and Epoxy sale
920 1084
1168
Q2FY17 Q1FY18 Q2FY18
216KT 234KT* 213KT
Sales Volume
76 213
244 23
Q2FY17 Q1FY18 Q2FY18
285

21
1,378
1,798 1,550
Q2FY17 Q1FY18 Q2FY18
Business Performance: Cement
Revenue (Rs. Cr) EBITDA Rs./Ton EBITDA (Rs. Cr)
Volume up by 20%, EBITDA up by 13% at Rs.1,550 Cr.
Energy cost up by 26% with higher Petcoke and Coal prices
Logistic cost up by 5% due increase in diesel cost and change in sales pattern
JP assets EBITDA accretive from start
Revival of rural housing, Affordable housing and Infra spending are some favorable factors for demand growth
5,771 7,035 6,936
Q2FY17 Q1FY18 Q2FY18
11.2MT 13.5MT 13.7MT 1,187
1,308 1,156
Q2FY17 Q1FY18 Q2FY18
Sales Volume

22
Business Performance: Financial Services
Revenue Rs.2,677 Cr. and EBT Rs.373 Cr.
NBFC: Consistent growth across diversified portfolio
− Geographic expansion plan to drive granular growth going forward
Average borrowing cost at 7.8%
AMC: 4th largest in India with highest ever AAUM market share at 10.7%
─ Domestic Equity net sales market share at 9.9% (H1 FY18)
Industry Equity AUM seen robust growth of 49% YoY basis
23
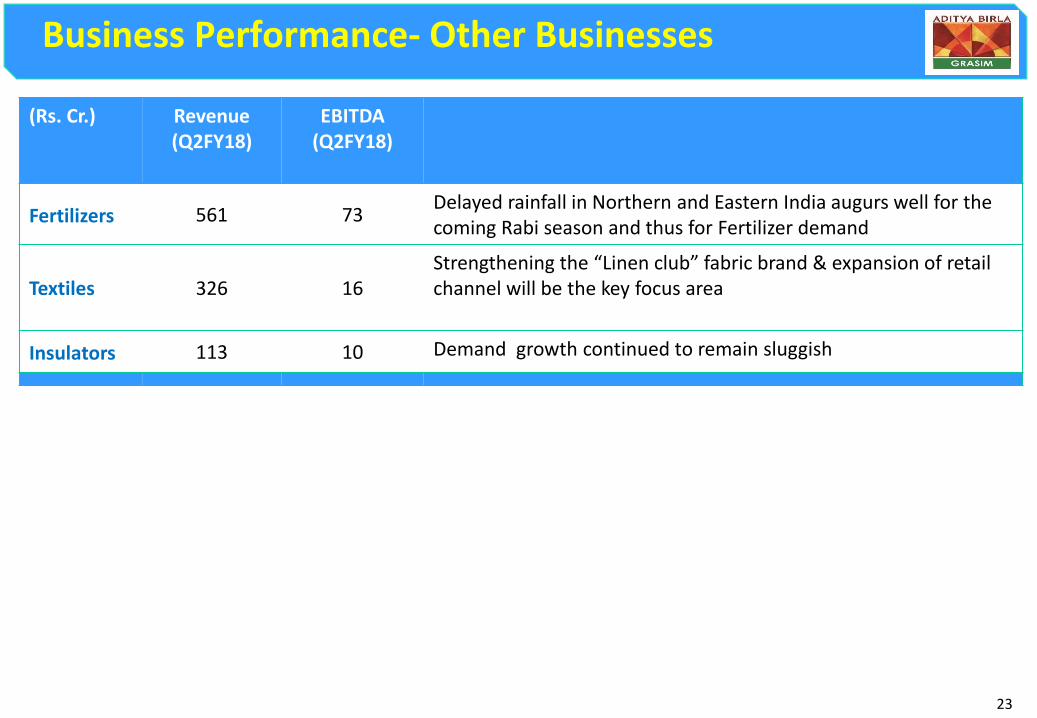
Business Performance- Other Businesses
(Rs. Cr.) Revenue (Q2FY18)
EBITDA (Q2FY18)
Fertilizers 561 73 Delayed rainfall in Northern and Eastern India augurs well for the coming Rabi season and thus for Fertilizer demand
Textiles 326 16 Strengthening the “Linen club” fabric brand & expansion of retail channel will be the key focus area
Insulators 113 10 Demand growth continued to remain sluggish

24
Capex Plan
Capital Expenditure

25
Capex Plan
Capex
(Net of CWIP
as on
01-04-17)
Cash Outflow Capex spent -
H1FY18
FY18 FY19 Onwards
Standalone
Vilayat Caustic Plant Brownfield expansion (144K TPA) 442
VSF Expansion 679
VSF : Water supply augmentation & usage reduction,
766 Research & Development, Environment and Other
normal capex
VSF debottlenecking (38K TPA) 123
Chemical capacity debottlenecking (64K TPA) & VAPs 204
VSF Expansion : Vilayat Residual capex 115
Chemical & Others : Normal capex 206
Other Manufacturing Business 320
Standalone Capex (A) 2,855 1,620 1,235 429 Cement Subsidiary : UltraTech
Capacity expansion 2429
Modernisation, Plant Infrastructure, Environment, Upgradation, logistic infra etc. 3,415
Cement Business Capex (B) 5,844 2,240 3,604 696
Capex (A + B) 8,699 3,860 4,839 1,125

26
Maintain our Industry Leadership positon
Growing Consumer Facing and High Growth Manufacturing Businesses
Invest in New Products
Expanding presence in New Markets
Expanding Capacities
Cost focus and Asset Sweating
Robust Risk and Governance Framework
Our Top Priorities

27
THANK YOU

28
Annexures

29
(` Cr.)
Consolidated Financial Performance
2017-18 2016-17 2017-18 2016-17
Net Sales & Op. Income 13,646 8,386 63 23,492 17,472 34
Other Income 290 312 (7) 526 512 3
EBITDA 2,805 2,098 34 5,224 4,312 21
EBITDA Margin (%) 20.1% 24.1% 21.8% 24.0%
Finance Cost 430 167 158 579 370 56
Finance Cost Relating to NBFC/NHFC Business 743 - 743 -
Depreciation / Amortisation 795 449 77 1,238 886 40
Share in Profit of JVs & Associates (260) 57 (261) 104 (351)
Exceptional item (88) - (119) -
Earnings before Tax 1,233 1,539 (20) 3,027 3,160 (4)
Total Tax 446 449 (1) 992 930 7
PAT 799 1,090 (27) 2,047 2,230 (8)
Less: Minority Interest 274 244 13 632 553 14
PAT (After Minority Interest & EI) 525 846 (38) 1,415 1,676 (16)
Other Comprehensive Income (After MI) (158) 183 (186) 50 569
Total Comprehensive Income 367 1,029 (64) 1,466 2,245 (35)
EPS 8.2 18.1 (38) 25.5 35.9 (16)
Quarter 2 %
Change
%
Change
Half Year

30
Standalone Financial Performance (` Cr.)
2017-18 2016-17 2017-18 2016-17
Net Sales & Op. Income 4,037 2,517 60 6,778 4,944 37
Other Income 269 330 (19) 335 388 (14)
EBITDA 1,054 889 19 1,675 1,475 14
EBITDA Margin (%) 24.5% 31.2% 23.6% 27.7%
Finance Cost 43 16 173 50 39 29
Depreciation / Amortisation 166 112 49 277 222 24
Earnings before Tax 845 761 11 1,348 1,214 11
(Before exceptional item)
Exceptional item (54) - (54)
Earnings before Tax 791 761 4 1,294 1,214 7
Tax Expense 216 169 28 373 301 24
PAT 575 592 (3) 922 913 1
Other Comprehensive Income (after tax) (198) 209 (35) 616
Total Comprehensive Income (after tax) 376 801 887 1,529
EPS 9.0 12.7 (3) 16.6 19.5 1
Quarter 2 %
Change
%
Change
Half Year

31
(` Cr.)
Balance Sheet
30th Sept'17 31st Mar'17 EQUITY & LIABILITIES 30th Sept'17 31st Mar'17
44,157 16,231 Net Worth 56,261 31,387
Non Controlling Interest 26,153 9,702
- - Borrowings related to financial services 38,639 -
2,479 701 Other Borrowings * 22,252 9,213
1,614 663 Deferred Tax Liability (Net) 5,294 3,518
- - Policy Holders Liabilities 35,359 -
3,614 2,224 Other Liabilities & Provisions 14,014 8,759
51,865 19,819 SOURCES OF FUNDS 1,97,973 62,580
ASSETS
9,877 6,887 Net Fixed Assets 52,494 31,792
807 430 Capital WIP & Advances 4,009 1,650
- - Goodwill on Consolidation 16,376 2,994
Investments:
2,636 2,636 Cement Subsidiary(UltraTech) - -
17,077 - AB Capital Subsidiary - -
7,311 171 Idea Cellular 7,958 1,166
AMC (JV) 4,900 -
950 849 Investment in other equity accounted investees 1,324 990
2,753 2,546 Liquid Investments 7,797 11,438
4,739 2,795 Other Investments(Hindalco, ABFRL, L&T etc.) 6,561 2,808
Investment of Insurance Business 11,811 -
- - Assets held to cover linked liabilities 25,040 -
- - Loans and advances of financing activities 43,558 -
5,714 3,506 Other Assets, Loans & Advances 16,146 9,943
51,865 19,819 APPLICATION OF FUNDS 1,97,973 62,580
(274) (1,845) Net Debt / (Surplus) 14,455 (2,225)
Standalone Consolidated

32
Viscose Business Summary
2017-18 2016-17 2017-18 2016-17Capacity
VSF KTPA 498 498 - 498 498 -
VFY KTPA 21 - 21 - Production (in '000s)
VSF MT 130 127 2 260 241 8
VFY MT 5 - 5 - Sales Volumes (in '000s)
VSF MT 130 124 5 251 245 2
VFY MT 5 - 5 -
Net Revenue ` Cr. 2,119 1,740 22 3,955 3,394 17
EBITDA ` Cr. 468 371 26 817 693 18
EBITDA Margin % 21.9% 21.2% -- 20.5% 20.3% --
EBIT ` Cr. 396 313 27 686 579 19
Capital Employed (Incl. CWIP) ` Cr. 5,611 4,849 16 5,611 4,849 16
ROAvCE (Excl. CWIP) % 32.3% 27.1% -- 27.9% 24.0% --
%
Change
Quarter 2 %
Change
Half Year
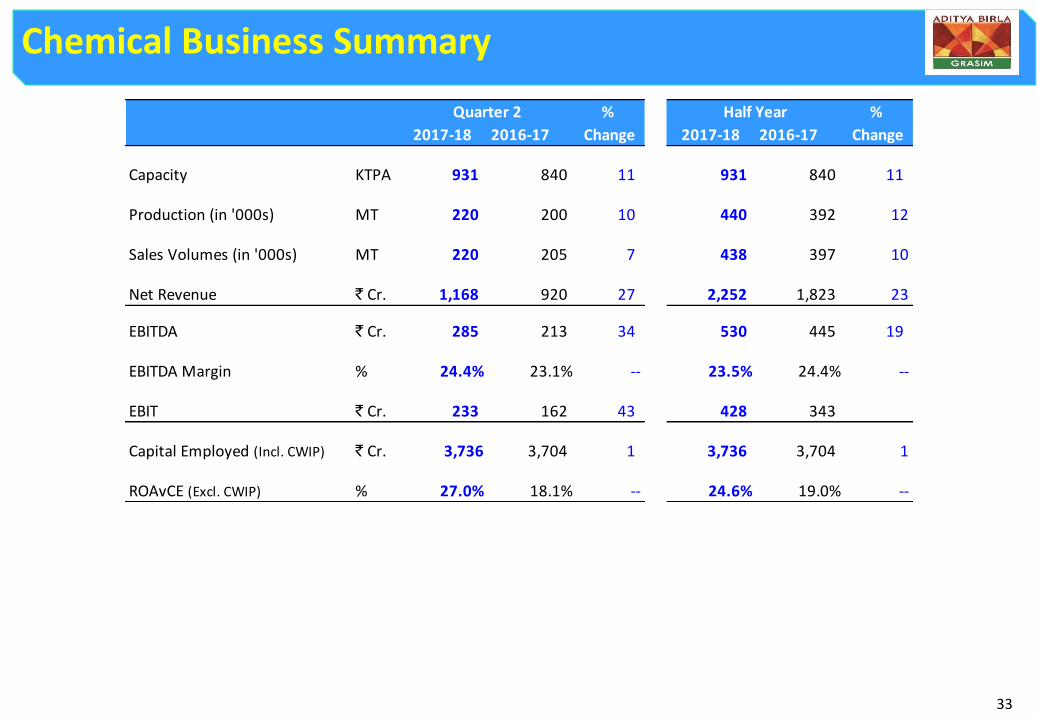
33
Chemical Business Summary
2017-18 2016-17 2017-18 2016-17
Capacity KTPA 931 840 11 931 840 11
Production (in '000s) MT 220 200 10 440 392 12
Sales Volumes (in '000s) MT 220 205 7 438 397 10
Net Revenue ` Cr. 1,168 920 27 2,252 1,823 23
EBITDA ` Cr. 285 213 34 530 445 19
EBITDA Margin % 24.4% 23.1% -- 23.5% 24.4% --
EBIT ` Cr. 233 162 43 428 343
Capital Employed (Incl. CWIP) ` Cr. 3,736 3,704 1 3,736 3,704 1
ROAvCE (Excl. CWIP) % 27.0% 18.1% -- 24.6% 19.0% --
Quarter 2 %
Change
%
Change
Half Year

34
$ Includes captive consumption for RMC and clinker volume
Cement Business Summary
2017-18 2016-17 2017-18 2016-17
Grey Cement
Capacity Mn. TPA 92.97 69.25 34 92.97 69.25 34
Production Mn. MT 13.39 11.18 20 27.17 24.66 10
Sales Volumes $ Mn. MT 13.72 11.57 19 27.67 25.34 9
White Cement & Putty
Sales Volumes $$ Lac MT 3.04 3.14 (3) 5.88 5.98 (2)
Net Revenue ` Cr. 6,936 5,771 20 13,971 12,357 13
EBITDA ` Cr. 1,550 1,378 13 3,348 3,004 11
EBITDA Margin % 21.9% 23.2% -- 23.4% 23.7% --
EBIT ` Cr. 1,028 1,043 - 2,497 2,347 6
Capital Employed (Incl. CWIP) ` Cr. 48,200 34,796 39 48,200 34,796 39
%
Change
%
Change
Quarter 2 Half Year

35
Business and Financial Performance- Telecom
Revenue (Rs.Cr)
The operating environment for Indian mobile operators remained challenging with unrelenting pressure on
pricing, introduction of GST @18% (compared to service tax @15%) and need for large investments to support
the exploding data demand.
The 4G population under coverage has nearly tripled from 14.8% (~170 mn) in Q2FY17 to 38.1% (~450 mn),
reflecting Idea’s aggressive intent to participate in emerging 4G consumer market.
Idea and Vodafone announced the companies have separately agreed to sell their respective standalone tower
businesses in India to ATC Telecom Infrastructure Private Limited (“American Tower”) for an aggregate
enterprise value of Rs. 78.5 billion.
9,300 8,167 7,465
Q2FY17 Q1FY18 Q2FY18
14.8%
16.1%
17.5%
18.9% 21.8% 18.9%
Revenue Market Share

36
Grasim: Group Structure
VSF - 498K TPA VFY - 21K TPA Pulp - 70K TPA
Overseas
Pulp & VSF JVs
AV Terrace Bay (40.0%)*
Domsjo 255K TPA (33.3%)*
AV Group NB Inc. 320K TPA (45.0%)*
UTCL (60.22%)*
Subsidiary
VSF JV Birla Jingwei
73K TPA (26.6%)*
Others
Domestic
Overseas 4 Mn. TPA
(UAE, Bangladesh, Sri Lanka)
18 Integrated plants &
1 clinkerisation unit
25 Split Grinding Units
>100 RMC Plants
White Cement & Putty
1.4 Mn. TPA
Nagda 162K TPA
Kharach 128K TPA
Harihar 87K TPA
Vilayat 120K TPA
Nagda 270K TPA
Vilayat 219K TPA
Epoxy 51K TPA
Grey Cement
89 Mn. TPA
Chemical Caustic
938K TPA
Veraval (VFY)
21K TPA
Renukoot 129K TPA
Rehla 110K TPA
Ganjam 59K TPA
Karwar 59K TPA
Veraval 91K TPA
ABCL (56.0)*
Subsidiary
NBFC
(100%)*
Broking
(75%)*
Housing Finance
(100%)*
Insurance Advisory
(50.01%)*
Life Insurance
(51%)*
Private Equity
(100%)*
AMC
(51%)*
Online Money Management
(93.7%)*
Health Insurance
(51%)* ARC
(100%)*
Wellness
(51%)*
Fertilizers
Insulators
Textiles
Idea Cellular
(27.9%)*
ABFRL
( 11.3%)*
* Equity ownership
Solar
(51.0%)* Harihar (Pulp)
70K TPA
Recommended