Slide 1 ©R. Schwartz Equity Markets: Trading and Structure
Bob SchwartzBob SchwartzZicklin School of BusinessZicklin School of BusinessBaruch College, CUNYBaruch College, CUNY

Slide 2 ©R. Schwartz Equity Markets: Trading and Structure
We have considered
• The plain vanilla, order driven market
• A simple limit order book
• Continuous trading and call auction facilities
The Plain Vanilla Order Drive Market

Slide 3 ©R. Schwartz Equity Markets: Trading and Structure
Is Trading Really This Simple?

Slide 4 ©R. Schwartz Equity Markets: Trading and Structure
Electronic Continuous Order Book Systems Work Well For
• Retail order flow
• Liquid stocks
• Non-stressful conditions
But A Plain VanillaElectronic Trading System
Cannot do it All

Slide 5 ©R. Schwartz Equity Markets: Trading and Structure
More Structure is Needed!

Slide 6 ©R. Schwartz Equity Markets: Trading and Structure
Two-Sided Markets

Slide 7 ©R. Schwartz Equity Markets: Trading and Structure
Definition of “Two-Sided”
• In the same, brief interval of time, some participants are actively looking to buy shares while others are actively looking to sell shares
• In short time intervals, the arrivals of buyer-initiated and seller-initiated trades are positively correlated

Slide 8 ©R. Schwartz Equity Markets: Trading and Structure
Some Good News
Markets are typically two-sided
• When buyers come to market, most likely sellers will also be there
• When sellers come to market, most likely buyers will also be there
• This is likely to be the case for both retail and institutional customers
• The TraderEx market is generally two-sided
Slide 9 ©R. Schwartz Equity Markets: Trading and Structure
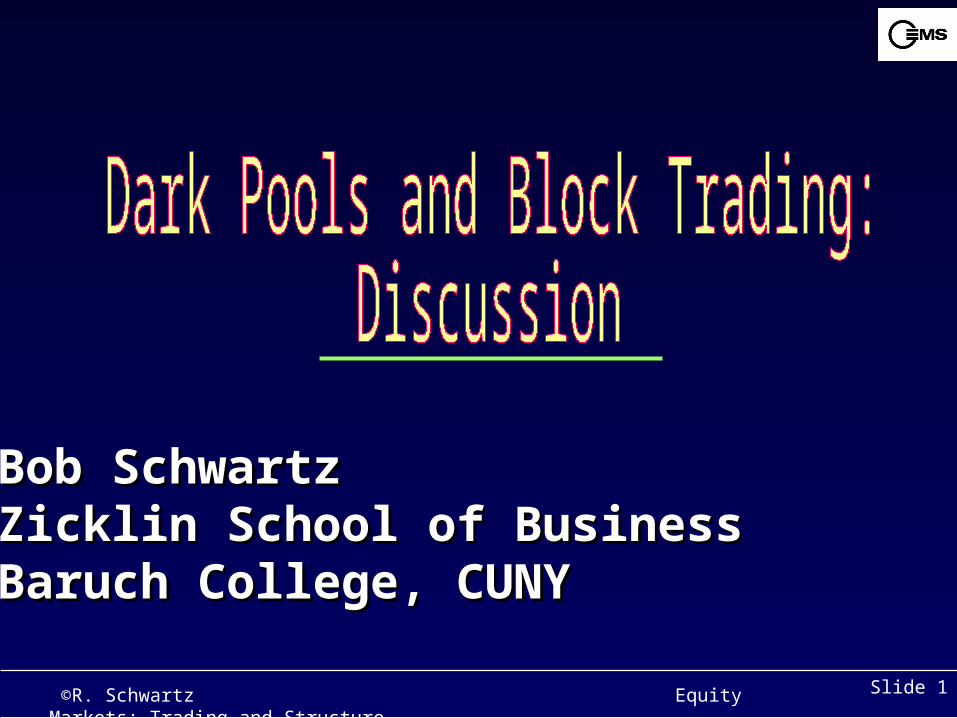
Some Interesting News
Equity trades tend to cluster in half-hour periods for
• NYSE and Nasdaq stocks
• News and non-news days
• Different times of the day– Opening ½ hour– Middle of the day– Closing ½ hour
• A spectrum of trade sizes

Slide 10 ©R. Schwartz Equity Markets: Trading and Structure
“Market Sidedness: Insights into Motives for Trade Initiation,” Asani Sarkar & Bob Schwartz,
Journal of Finance, 2008, forthcoming
Sample: TAQ data, January 2003 to May 2003. 41 NYSE & 41 Nasdaq stocks (a matched sample, using Dec 31, 2002 closing prices and market caps)
Correlation Measures:
• Count the number of buyer-triggered and seller-triggered trades in 5 minute trading windows for
→Days with no news events (control sample)
→Days before and after news events
• Correlate the no. of buyer-triggered & seller-triggered trades

Slide 11 ©R. Schwartz Equity Markets: Trading and Structure
Correlations:Earnings Report Events
Correlation generally greater for • Before, large than small dispersion•After, large than small surprise
0.64
0.81
0.62
0.26
0.35
0.32
0.49
0.51After, Small Surprise
0.60After, Large Surprise
0.51After, All
0.15Before, Small Dispersion
0.47Before, Large Dispersion
0.27 Before, All
0.36No News
NYSE Nasdaq

Slide 12 ©R. Schwartz Equity Markets: Trading and Structure
Correlations: 8:30 am Macro Announcement Events
0.430.32After, Small Surprise
0.510.36After, Large Surprise
0.530.33After, All
0.350.29Before, Small Dispersion
0.580.40Before, Large Dispersion
0.500.32Before, All
0.490.36No News
NYSE Nasdaq
Correlation greater for • Before, large than small dispersion•After, large than small surprise

Slide 13 ©R. Schwartz Equity Markets: Trading and Structure
Correlations: Corporate Restructuring News Events
NasdaqNYSE
0.550.65After
0.390.39Before
0.490.36No News
Correlation greater after than before
Slide 14 ©R. Schwartz Equity Markets: Trading and Structure
Why Are Markets Generally Two-Sided?
The Diversity of Motives for Trading
• Liquidity traders
• Technical traders
• Information traders
Divergent Expectations!
These motives are represented in TraderEx

Slide 15 ©R. Schwartz Equity Markets: Trading and Structure
Why Do Trades Cluster in Time?
Buyside trading strategies
• Do they cluster in TraderEx?
Presumably, but we haven’t analyze the data yet

Slide 16 ©R. Schwartz Equity Markets: Trading and Structure
Block Trading

Slide 17 ©R. Schwartz Equity Markets: Trading and Structure
The Challenge
How do you handle an order to buy half a million shares of a stock that, on average,
trades 300,000 shares a day?
• Dealer capital
• Shop the order
• Slice and dice the order and submit the tranches to an electronic platform
• Call auction
• Block trading facility

Slide 18 ©R. Schwartz Equity Markets: Trading and Structure
Slicing and Dicing
Average Trade Size at NYSE
• 1988 2,303 shares
• July 2007 297 shares
Block Trading Volume at the NYSE
• 1988 52 percent
• July 2007 15 percent

Slide 19 ©R. Schwartz Equity Markets: Trading and Structure
Costs
• Bid-ask spread
• Market impact
• Opportunity cost
• Implementation short fall
• Losses due to bad market timing

Slide 20 ©R. Schwartz Equity Markets: Trading and Structure
Performance Measure
Difficult to measure performance
• Need a good benchmark
• Do not make assessments on a trade-by-trade basis
• TraderEx: do not make assessments on the basis of a single simulation run
• TX point score
Slide 21 ©R. Schwartz Equity Markets: Trading and Structure
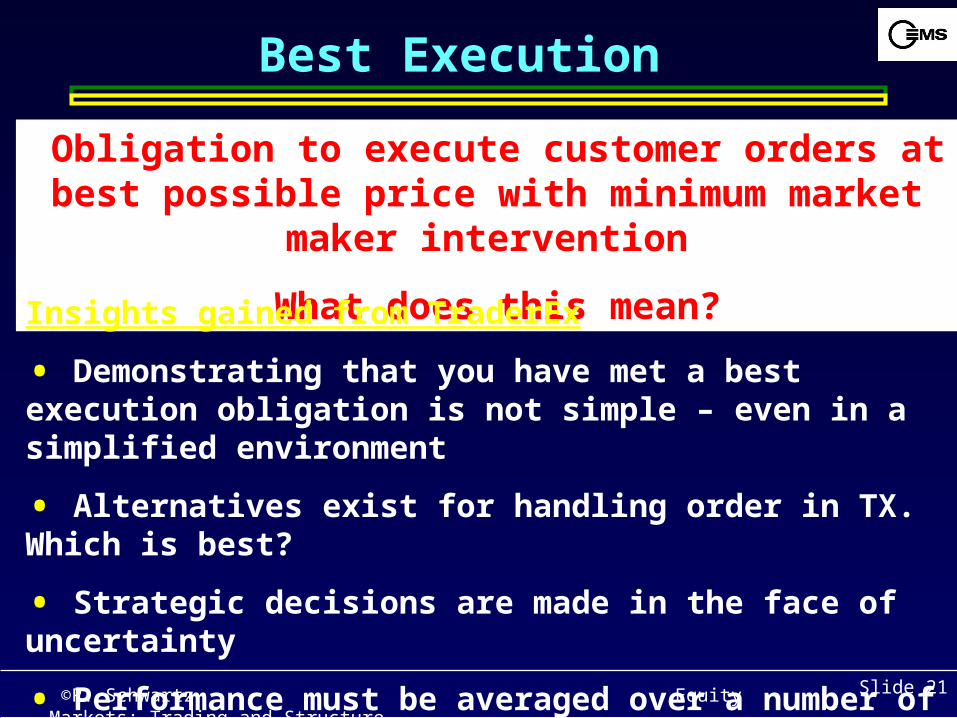
Best Execution
Obligation to execute customer orders at best possible price with minimum market maker intervention
What does this mean?Insights gained from TraderEx
• Demonstrating that you have met a best execution obligation is not simple – even in a simplified environment
• Alternatives exist for handling order in TX. Which is best?
• Strategic decisions are made in the face of uncertainty
• Performance must be averaged over a number of simulation runs
• Good, implementable benchmarks are hard to define
Slide 22 ©R. Schwartz Equity Markets: Trading and Structure
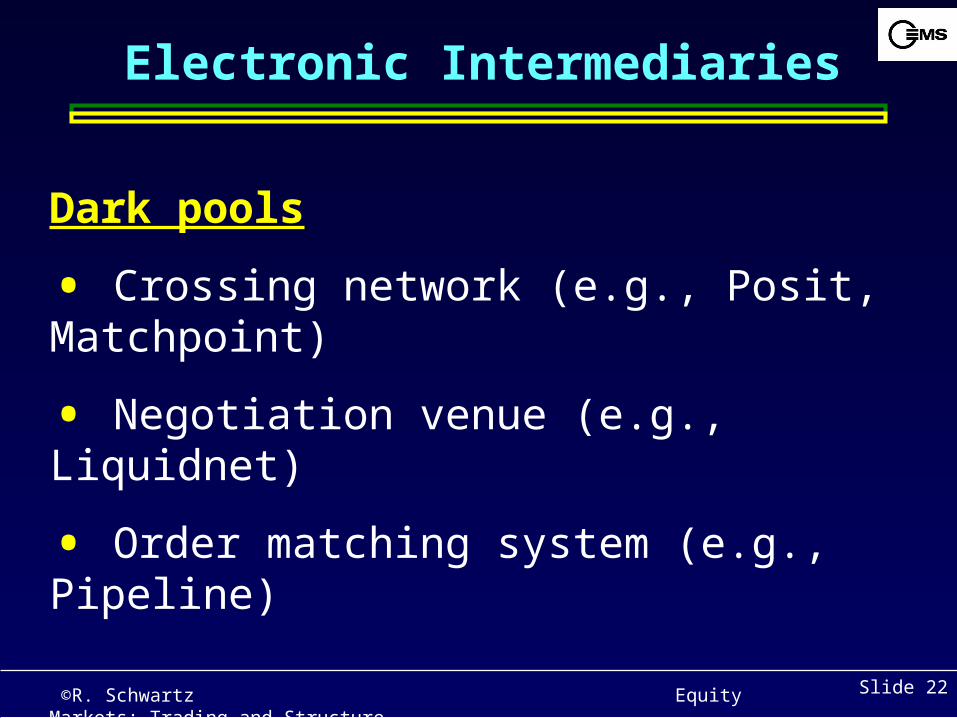
Electronic Intermediaries
Dark pools
• Crossing network (e.g., Posit, Matchpoint)
• Negotiation venue (e.g., Liquidnet)
• Order matching system (e.g., Pipeline)

Slide 23 ©R. Schwartz Equity Markets: Trading and Structure
Buyers and Sellers Can Meet in a Block Trading Facility
• Pipeline and Liquidnet customers trade in size
• Minimum order size in Pipeline for a liquid stock: 100,000 shares
• Liquidity motivated?
• Noise trading?I don’t think I don’t think
soso
• Further evidence of divergent expectations

Slide 24 ©R. Schwartz Equity Markets: Trading and Structure
Dark Pools
Free Riding On Price Discovery While OfferingQuantity Discovery
• Institutions keep their orders hidden to control their transaction costs
• How do they find each other and trade?
• The problem is called Quantity Discovery

Slide 25 ©R. Schwartz Equity Markets: Trading and Structure
Dark PoolsAnything New Under the Sun?
“Dark orders as a tool have been around for as long as people have existed. What is happening now is that it’s done in cyberspace”
Timothy Mahoney, Bids Trading, CEOSecurities Industry NewsApril 7, 2008, page 1
• The NYSE trading floor
• Upstairs dealer desks

Slide 26 ©R. Schwartz Equity Markets: Trading and Structure
Shortcomings of Dark Pools
• Lack transparency
• Low crossing rates
• Exclusivity
• Sheer numbers

Slide 27 ©R. Schwartz Equity Markets: Trading and Structure
Back To TraderEx
To think about while using a block trading facility
• When did you enter your orders?
• How did you size your orders?
• How did you price your orders?
• Did you feel at risk if a contra did not show up?
Recommended