R A P I D MA R K E R I D EN T I F IC AT IO N A N D C HA R AC T E R ISAT IO N O F E S S EN T IA L O I L S US ING A C H EMOM E T R IC A P ROAC H
Cristiana C. Leandro1, Peter Hancock1, Christian Soulier2, Françoise Aime2 1Waters Corporation, Manchester, UK. 2Argeville S.A., Domaine d’Argeville, Mougins, France.
AIM
To provide a solution for the identification of potential markers of
essential oils for the characterization of fragrances, to aid in quality
control and authentication within the flavor and fragrance market.
INT RODUCT ION
The flavor, fragrance, and aroma chemical market is said to be worth
around $15 billion worldwide, with the essential oils market seeing
significant growth backed largely by the increasing preference
among consumers for more natural products.
As commodities in the fragrance and flavor market are generally
high value items, the ability to characterize and compare raw mate-
rials, blends, and final goods has important financial implications.
As prices of natural products fluctuate widely depending on the raw
material, determining factors such as country of origin, climate,
batch, concentration, extraction method, and shelf life become
paramount for quality control and to prevent product counterfeiting.
With reports of 5 to 7% of world trade being counterfeit products,
amounting to a mammoth $500 billion annually, validation of factors
in natural products such as essential oils become even more vital.
Currently identification and characterization of fragrances is carried
out manually, a very time-consuming process that can take a trained
analytical chemist many hours, with a high risk of human error.
By implementing a GC-ToF exact mass-MS solution, a powerful;
information rich data set can be generated. Automated, chemomet-
rics based software, using a statistical interpretation of patterns in
multivariate data can be used for further analysis. This results in a
faster and more precise assessment of composition.
The advantage of using a chemometrics with GC-TOF-MS approach is
the production of a unique “fingerprint” for each essential oil. This
allows a good statistical separation and facilitates the identification
of differences or similarities between groups.
The following method describes essential oil characterization for a
range of samples from the citrus family using a GC-TOF-MS solution
complete with chemometric data analysis.
Examples of essential oil separation, marker identification, inter-
and intra-class differentiation will be illustrated as well as database
building and fragrance characterization.
Four types of essential oils from the citrus family.
EX PERIMENTAL
Samples
Four types of essential oils from the citrus family were studied
(lemon, mandarin, orange and bergamot). The essential oils
analyzed are listed in Table 1. The samples were diluted 1000:1
in ethanol prior to analysis by GCT Premier.
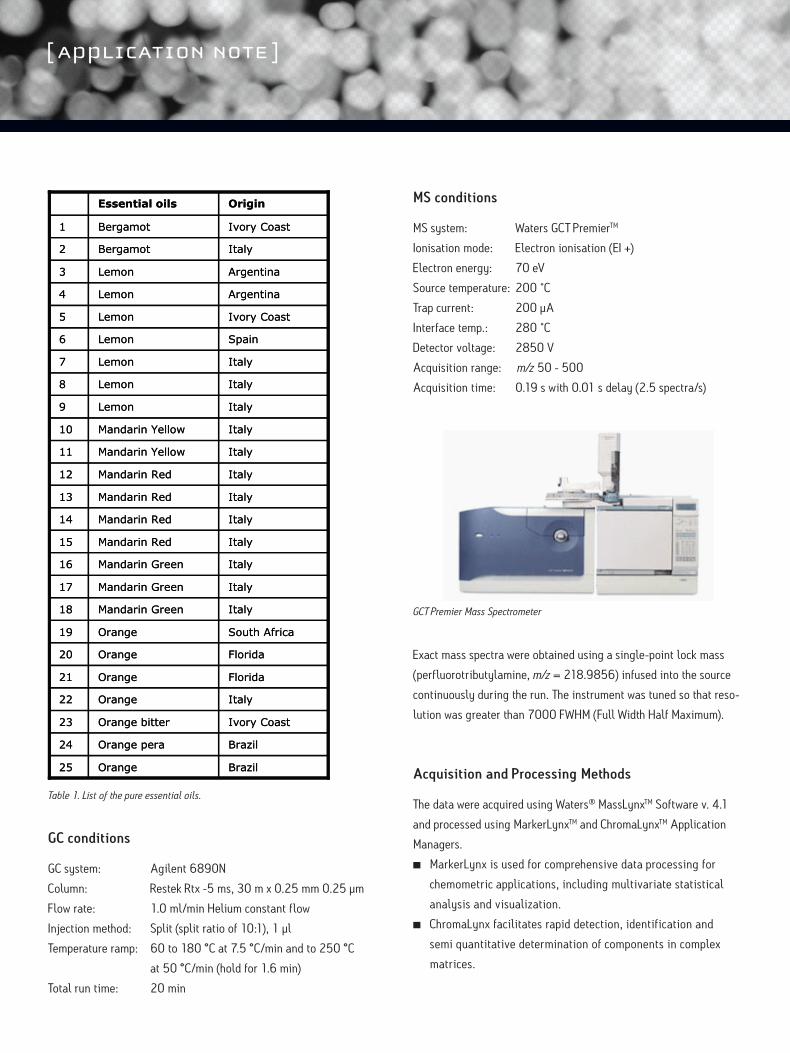
Table 1. List of the pure essential oils.
GC conditions
GC system: Agilent 6890N
Column: Restek Rtx -5 ms, 30 m x 0.25 mm 0.25 µm
Flow rate: 1.0 ml/min Helium constant flow
Injection method: Split (split ratio of 10:1), 1 µl
Temperature ramp: 60 to 180 °C at 7.5 °C/min and to 250 °C
at 50 °C/min (hold for 1.6 min)
Total run time: 20 min
MS conditions
MS system: Waters GCT PremierTM
Ionisation mode: Electron ionisation (EI +)
Electron energy: 70 eV
Source temperature: 200 ˚C
Trap current: 200 µA
Interface temp.: 280 ˚C
Detector voltage: 2850 V
Acquisition range: m/z 50 - 500
Acquisition time: 0.19 s with 0.01 s delay (2.5 spectra/s)
GCT Premier Mass Spectrometer
Exact mass spectra were obtained using a single-point lock mass
(perfluorotributylamine, m/z = 218.9856) infused into the source
continuously during the run. The instrument was tuned so that reso-
lution was greater than 7000 FWHM (Full Width Half Maximum).
Acquisition and Processing Methods
The data were acquired using Waters® MassLynxTM Software v. 4.1
and processed using MarkerLynxTM and ChromaLynxTM Application
Managers.
n MarkerLynx is used for comprehensive data processing for
chemometric applications, including multivariate statistical
analysis and visualization.
n ChromaLynx facilitates rapid detection, identification and
semi quantitative determination of components in complex
matrices.
BrazilOrange25
BrazilOrange pera24
Ivory CoastOrange bitter23
ItalyOrange22
FloridaOrange21
FloridaOrange20
South AfricaOrange19
ItalyMandarin Green18
ItalyMandarin Green17
ItalyMandarin Green16
ItalyMandarin Red15
ItalyMandarin Red14
ItalyMandarin Red13
ItalyMandarin Red12
ItalyMandarin Yellow11
ItalyMandarin Yellow10
ItalyLemon9
ItalyLemon8
ItalyLemon7
SpainLemon6
Ivory CoastLemon5
ArgentinaLemon4
ArgentinaLemon3
ItalyBergamot2
Ivory CoastBergamot1
OriginEssential oils

RESULTS AND DISCUSSION
Figure 1 shows that differences between citrus essential oils are not
easily discerned and a manual chromatogram-by-chromatogram
inspection is very labor-intensive. MarkerLynx automates this
process by rapidly characterizing essential oils, based on a PCA
data set and will generate a list consisting of tR - m/z pairs ranked in
order of statistical significance.
Figure 1. Total ion chromatograms of five citrus essential oils obtained using GC-TOF-MS.
Rapid inter-class citrus oil differentiation
Figure 2 illustrates the MarkerLynx scores plot after processing
25 essential oils. The results show that the three types of mandarin
oils are statistically similar, while divergent from orange, lemon
and bergamot. The high analytical reproducibility of the system
is demonstrated through the tight sample clustering of each class
of oil.
Figure 2. Scores plot obtained from MarkerLynx, illustrating group similarities between 25 essential oils.
The results show that the oils can be successfully separated.
However, in order to determine the reasons for this differentiation,
closer inspection of these results are required.
Figure 3 shows one of the tR - m/z pairs that contributed most
significantly to the separation of lemon from the rest of the oils.
This trend plot showing sample number versus significance of
marker to class, illustrates a potential marker for lemon oils.
Figure 3. Trend plot of the tR - m/z pair 12.89 - 93.0700, across 25 essential oils.
Time6.00 8.00 10.00 12.00 14.00 16.00
%
0
100
6.00 8.00 10.00 12.00 14.00 16.00
%
0
100
6.00 8.00 10.00 12.00 14.00 16.00
%
0
100
6.00 8.00 10.00 12.00 14.00 16.00
%
0
100
6.00 8.00 10.00
Orange, Italy
Mandarin, Italy
Lemon, Italy
Bergamot, Italy
Bergamot, Ivory Coast
12.00 14.00 16.00
%
0
100
Orange
Mandarin
Lemon
Bergamot
Orange
Mandarin
Lemon
Bergamot

Identification of potential essential oil markers
After automated processing of the data sets using ChromaLynx,
the potential marker shown in Figure 4 was identified by library
searching and exact mass. The marker was identified as b-pinene
with an exact mass of 136.1256, 0.4 mDa from the calculated
mass of C10H16.
Figure 4. Identification of b-pinene in a lemon oil using ChromaLynx.
If the potential marker does not exist in the library, exact mass will
enable the elemental composition to be determined as a useful start
point in establishing structural identification.
After potential markers have been identified, MarkerLynx can be
used to create a database of compounds to help search for markers
in subsequent analyses.
Rapid intra-class essential oil differentiation
It is also possible to find similarities within each class of oil using
multivariate analysis. These intra-class differences include country
of origin, age, quality, etc.
For example, Figure 5 illustrates the intra-class separation of
mandarin red oils obtained using MarkerLynx. Differences between
sample clusters relate to the year of harvest and quality of the
olfactory citrus notes.
Figure 5. Scores plot obtained from MarkerLynx illustrating group similarities between four Italian mandarin red oils.
Additionally, a supplementary software package, SIMCA-P from
Umetrics, can be used to search for further differences within each
class. SIMCA-P identifies differences between two samples, using
advanced statistical tools such as partial least squares discriminate
analysis (PLSDA) and orthogonal partial least squares (OPLS),
allowing researchers to visualize their data and extract more mean-
ingful information from their experimental results.
Figure 6 shows enhanced differentiation between two of the lemon
oils. The points above 80% significance (highlighted in red) were
selected and used to create an additional list of potential markers,
which can be imported back into MarkerLynx.
Figure 6. Scatter plot of lemon oil no. 7 vs. lemon oil no. 9, obtained from an OPLS model using SIMCA-P.
2006
2007Same producer
Age
Quality
2006
2007Same producer
Age
Quality

Waters Corporation 34 Maple Street Milford, MA 01757 U.S.A. T: 1 508 478 2000 F: 1 508 872 1990 www.waters.com
Identifying essential oils within a fragrance
ChromaLynx Compare offers complementary functionality that is
able to evaluate multiple samples to identify either common or
unique components between them.
Figure 7 shows the comparison between a fragrance and one lemon
oil. The results show unique components by retention time and
mass (flagged with the dark triangles). The common components
suggest that this variety of lemon oil is part of the composition of
the fragrance analyzed.
Figure 7. Comparison of a fragrance (top chromatogram) with one lemon oil (bottom chromatogram), using ChromaLynx Compare.
CONCLUSIONS
As the prices of raw materials vary greatly and product counterfeit-
ing is a rising problem, the GCT Premier with MarkerLynx and
ChromaLynx Application Managers is the ideal solution for product
authentication and quality control in the flavor and fragrance market.
With an unmatched combination of capabilities, as well as high
full scan sensitivity and rapid spectral acquisition rates, this total
Water’s solution is ideal for full characterization and profiling of
components in a wide range of sample types.
Using GC-exact mass TOF-MS on the GCT Premier enabled separa-
tion and identification of potential markers in essential oil samples
from the citrus family.
MarkerLynx with a chemometric approach to the interpretation of
data, allowed valuable detection and identification of potential
markers in these essential oils. Inter- and intra-class differentiation
between samples was also achieved using SIMCA-P software with
multivariate PLS or OPLS statistical methods.
ChromaLynx Compare is also a useful tool in the characterization
of fragrances. It enables the comparison of unique (or common)
components that have previously undergone automated library
search for identification.
The GCT Premier with MarkerLynx and ChromaLynx Application
Managers enables powerful data acquisition and analysis capabili-
ties for fragrance characterisation. Plus, the automation of manually
intensive processes will result in increased productivity and
efficiency within the lab.
Waters is a registered trademark of Waters Corporation., GCT Premier, MassLynx, ChromaLynx, MarkerLynx, and the Science of What’s Possible are trademarks of Waters Corporation. All other trademarks are the property of their respective owners.
©2008 Waters Corporation. Produced in the U.S.A.March 2008 720002563EN AG-PDF
Recommended