RECONSTRUCTING
EVOLUTIONARY TREES
Phylogeny
Evolutionary history of a group must be inferred indirectly from data we do not have any direct knowledge
about any evolutionary histories
Terminology
Phylogenetics- Study of the history of the evolution of a
species or other taxon Phylogeny-
The ancestral history of a species Phylogenetic tree
– A diagram which shows the ancestry and descent of a group of species
Terminology
Pleisiomorphy- an ancestral character trait also called
relictualrelictual Sympleisiomorphy –
shared ancestral traits Apomorphy –
a derived or descendant character trait Synapomorphy –
shared derived traits used to reveal evolutionary relationships
Terminology Cladistics-
A classification scheme based on the classification scheme based on the possible ancestral relationshipspossible ancestral relationships in a group which was built usingbuilt using relationships inferred by the presence of synapomorphiessynapomorphies
Cladogram – a phylogenetic tree based on synapomorphies.
Phenetics- classification scheme based on grouping
populations according to their similaritiesaccording to their similarities. No attempt is made to determine the derived vs. Primitive state of the characters, thus no no clear reflection of the ancestral historyclear reflection of the ancestral history is implied.
Synapomorphies Synapomorphies are the result of
genetic divergence from an ancestral speciesAre homologous because they derive
from a common ancestorMust be independent and not
correlated with other traits (linkage equilibrium)
Synapomorphies help to define closely related groups.
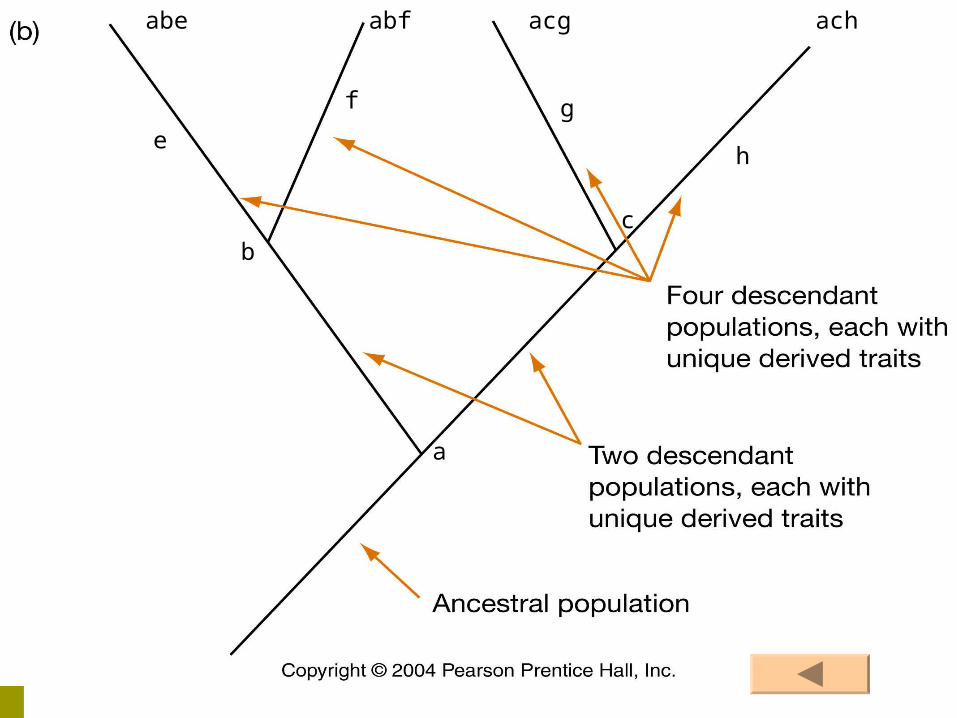
1. Synapomorphies represent evolutionary branch pointsEach branch point on a cladogram represents at
least one (possibly more) derived trait has arisen
2. Synapomorphies are nestedFigure 4.2 Page 113
Synapomorphies cont.Two key elements of synapomorphies which allow the assumption of evolutionary relationships
Cladograms
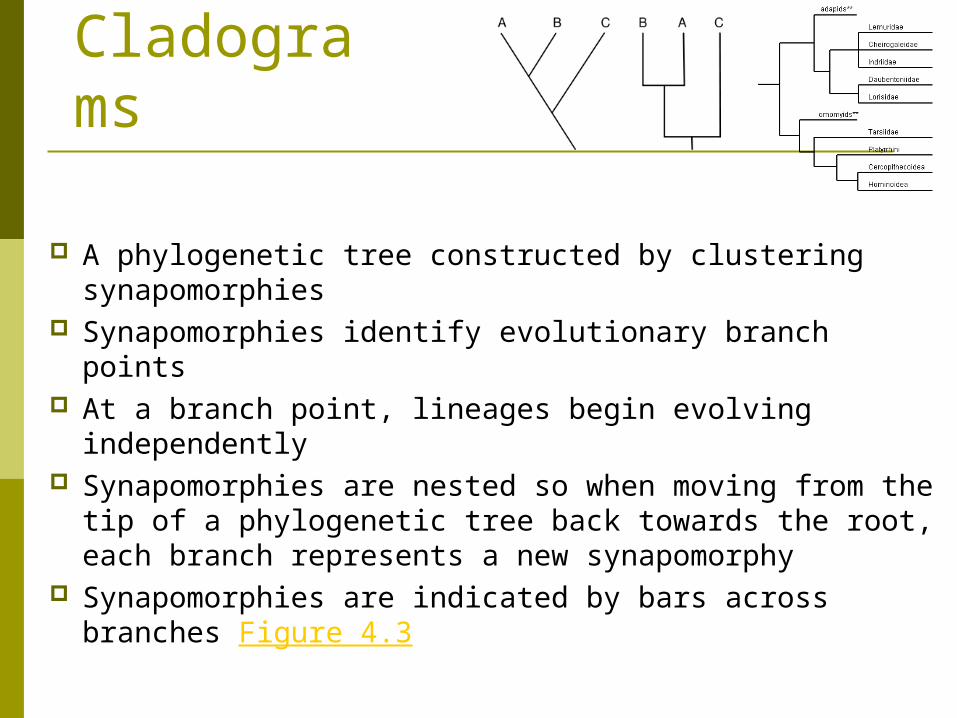
A phylogenetic tree constructed by clustering synapomorphies
Synapomorphies identify evolutionary branch points At a branch point, lineages begin evolving
independently Synapomorphies are nested so when moving from
the tip of a phylogenetic tree back towards the root, each branch represents a new synapomorphy
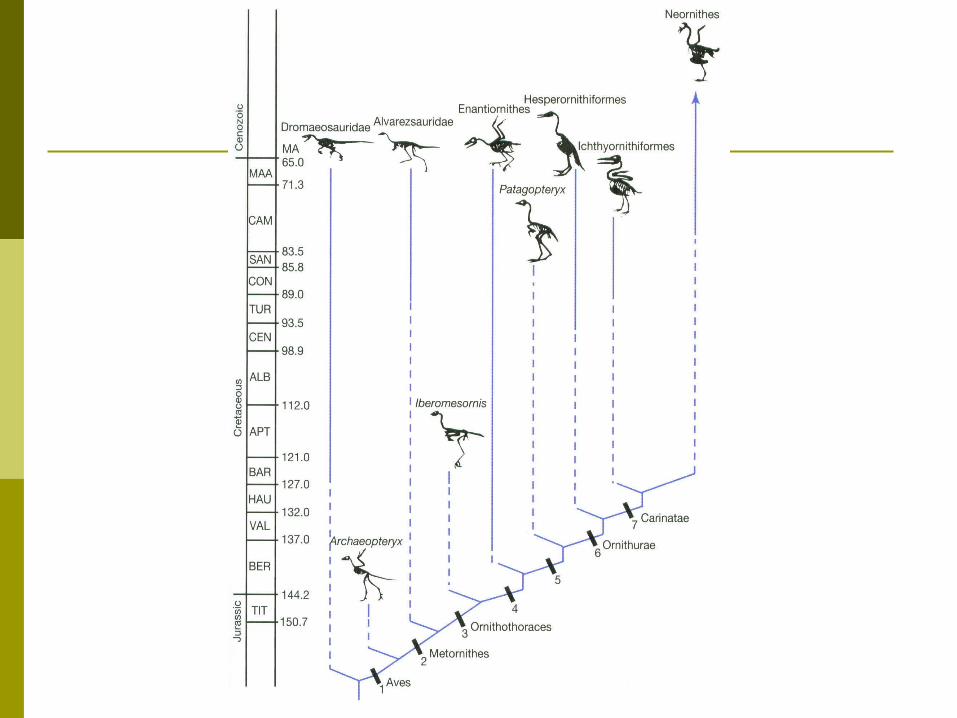
Synapomorphies are indicated by bars across branches Figure 4.3
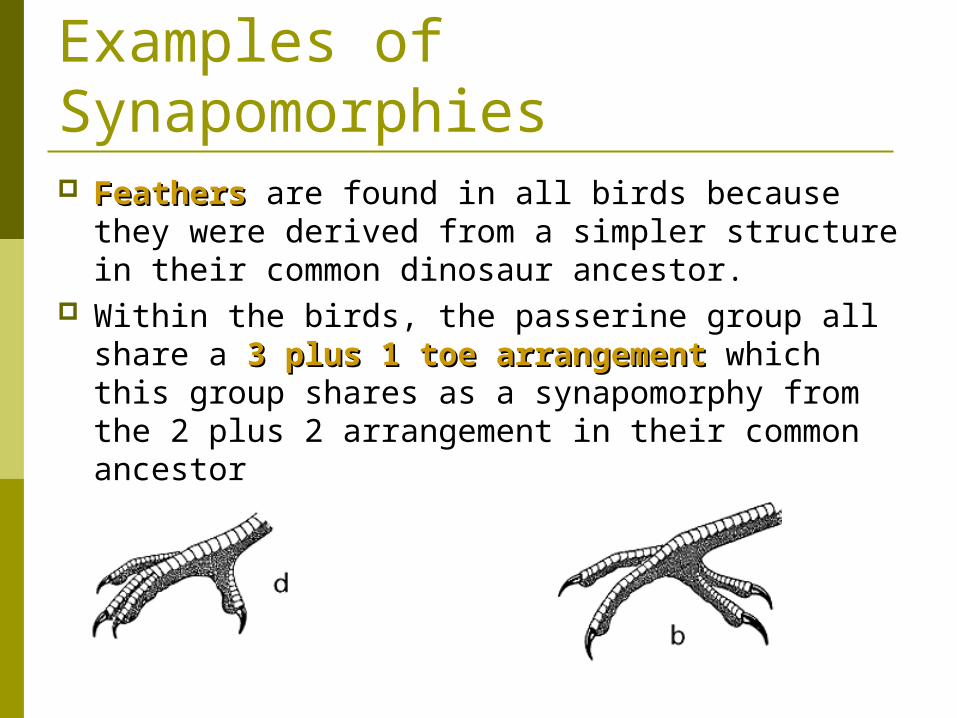
Examples of Synapomorphies FeathersFeathers are found in all birds because they
were derived from a simpler structure in their common dinosaur ancestor.
Within the birds, the passerine group all share a 3 3 plus 1 toe arrangementplus 1 toe arrangement which this group shares as a synapomorphy from the 2 plus 2 arrangement in their common ancestor
Bird exampleSynapomorphies can be identified at any
taxonomic level A given series series of synapomorphies can be
used to define phylogenetic used to define phylogenetic relationshipsrelationships
for example, in birds, synapomorphies can be used to identify trends in the changes in forelimbs, hind limbs, breastbones, tail, and pelvis Example
Identifying Synapomorphies
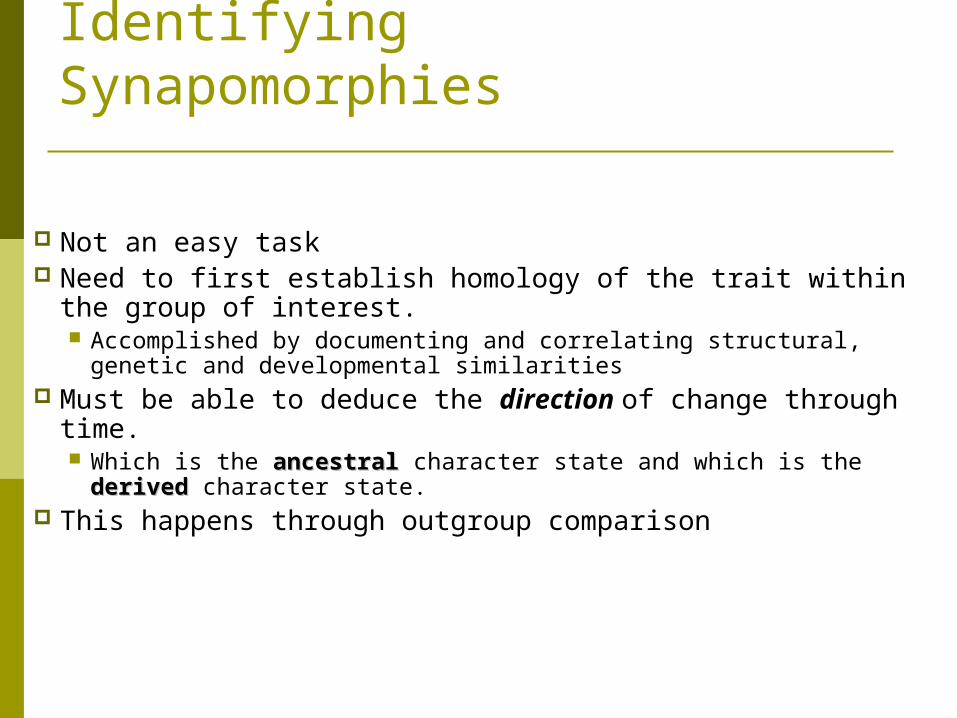
Not an easy task Need to first establish homology of the trait within the group
of interest. Accomplished by documenting and correlating structural, genetic
and developmental similarities Must be able to deduce the direction of change through
time. Which is the ancestralancestral character state and which is the derivedderived
character state. This happens through outgroup comparison
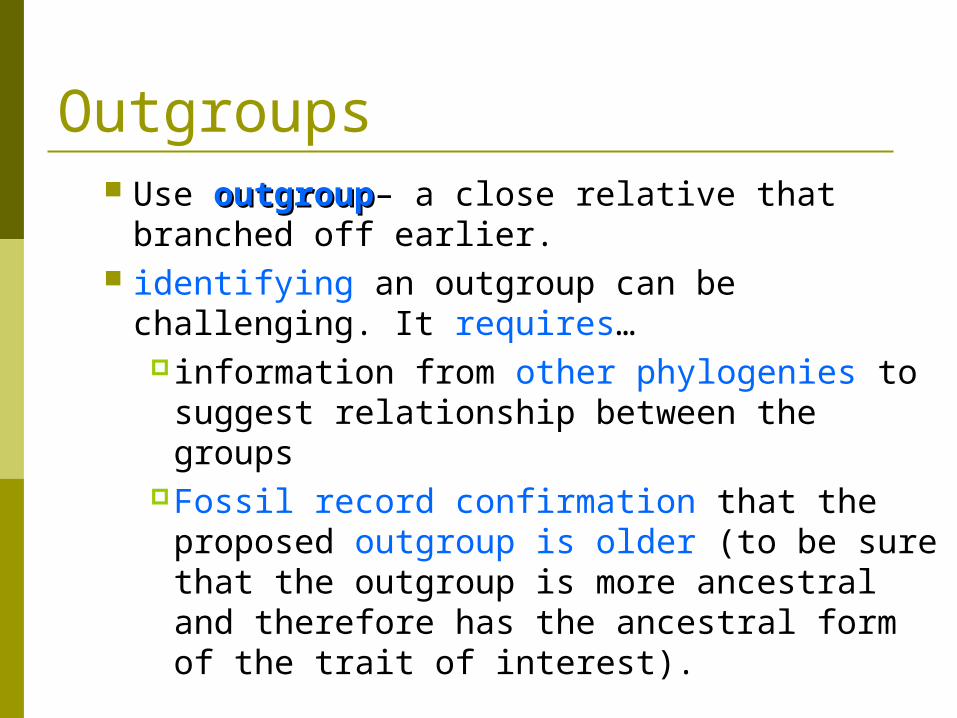
Outgroups Use outgroupoutgroup– a close relative that branched
off earlier. identifying an outgroup can be challenging. It
requires… information from other phylogenies to
suggest relationship between the groupsFossil record confirmation that the
proposed outgroup is older (to be sure that the outgroup is more ancestral and therefore has the ancestral form of the trait of interest).
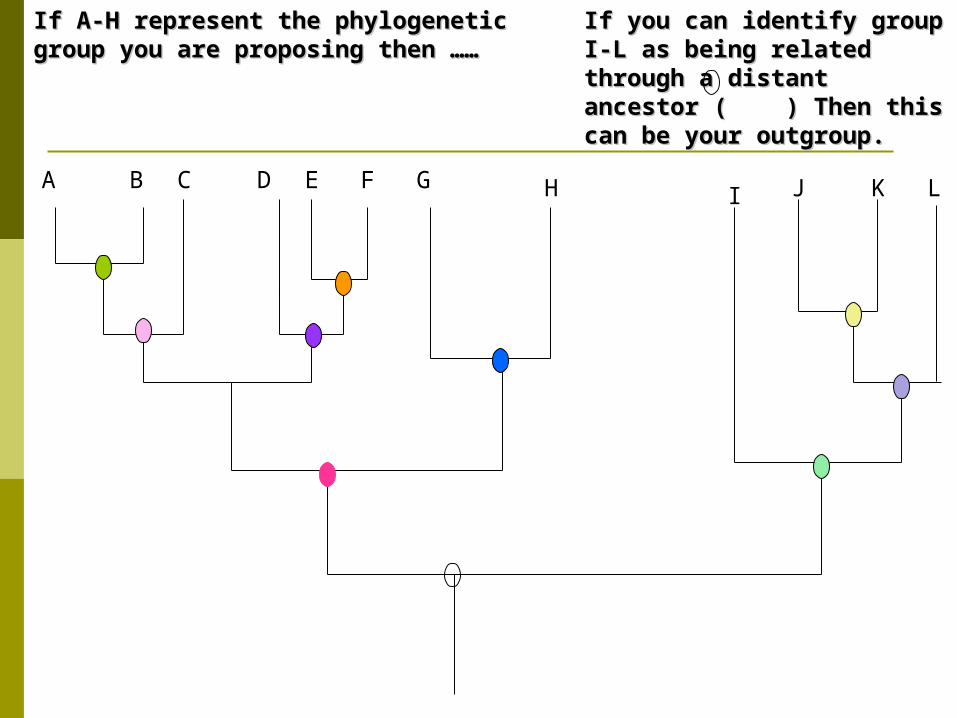
If you can identify group I-L as If you can identify group I-L as being related through a distant being related through a distant ancestor ( ) Then this can be ancestor ( ) Then this can be your outgroup. your outgroup.
If A-H represent the phylogenetic group you If A-H represent the phylogenetic group you are proposing then ……are proposing then ……
A B C D E F G H J K LI

Terminology Homoplasy- information which may cause
misinterpretation of information about the evolutionary history of an organism.
Examples Convergent evolution – similarity between species
that is due to… a character trait arising on 2 or more separate occasions in
evolutionary history. These traits are analogous may carry out similar functions but… The origin of their structure is along different evolutionary
pathways. This type of evolution is also referred to as parallel
evolution You are already familiar with the wings of insects,
birds and bats are the result of convergent evolution
Other examples
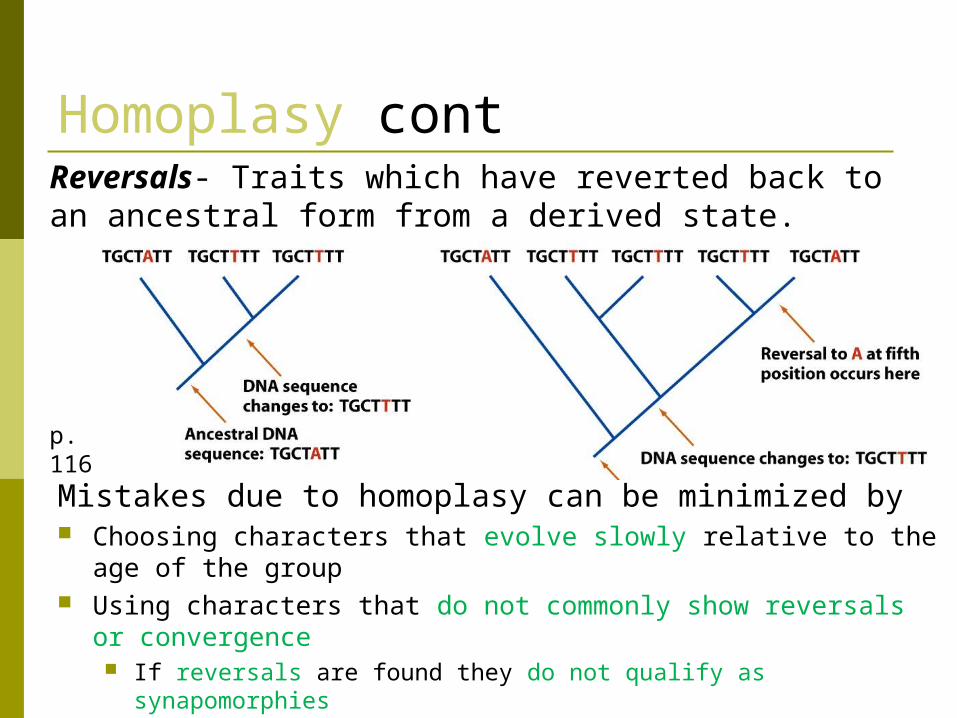
Homoplasy cont
Mistakes due to homoplasy can be minimized by Choosing characters that evolve slowly relative to the age of
the group Using characters that do not commonly show reversals or
convergence If reversals are found they do not qualify as synapomorphies
p. 116
Reversals- Traits which have reverted back to an ancestral form from a derived state.
How to identify homoplasy Use multiple synapomorphies and traits in
identifying groups. Follow the rule of parsimony which says that the
fewest number of changes needed to explain the evolutionary relationships is most likely the correct one. Example
Also, often careful analysis of the structure itself usually reveals differences at a cellular or microscopic level.
Most often, however, we do not have the material or the ancestral history needed to identify
Homoplasy so most cladistic datasets do contain hidden
homoplasious information.
Principles for constructing a phylogenetic treeUsing parsimony to resolve conflicts
in data sets Look at homologous traits across a group of
species The characteristics of traits which can be used
for scoring individuals are - Those that are variable among the taxa being studied - Those that are heritable - Characters must all be independent of one another - Use traits that are similar between groups studied because this indicates a common ancestor
Use Parsimony

Why using parsimony is valid Usually valid to assume that reversals and
convergences are rare relative to similarities when coming from a common ancestral form
Reversals and convergences always require multiple steps and so will lead to more steps in a cladistic analysis
So Homoplasious trees will not normally be the most parsimonious trees derived.
However
Some homoplasy is almost always evident in evolutionary history
this means there are several ways that a cladogram may be constructed
The accepted cladogram will be the one that has the most support from several different possible treatments of the data
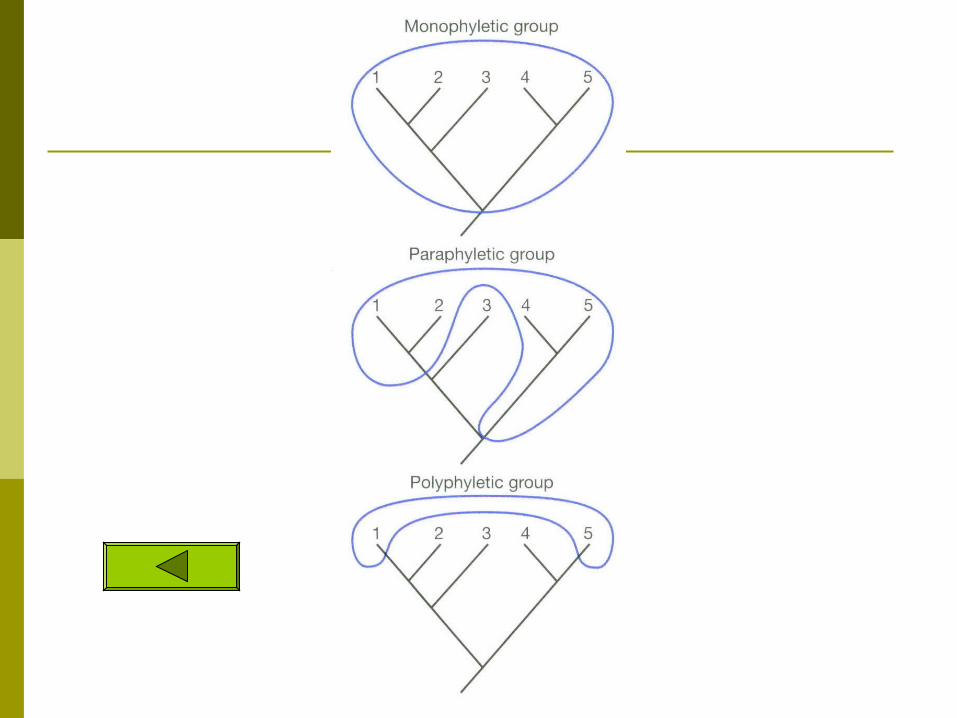
Relationships found in cladograms
MonophyleticMonophyletic – A group which contains a common ancestor and ALL of its descendants
Paraphyletic Paraphyletic – Groupings which include some but not all descendants of a common ancestor.
PolyphyleticPolyphyletic-- grouping ignores ancestry just groups them based on similar traits does not use synapomorphies and includes no ancestors. this is a more phenetic approach
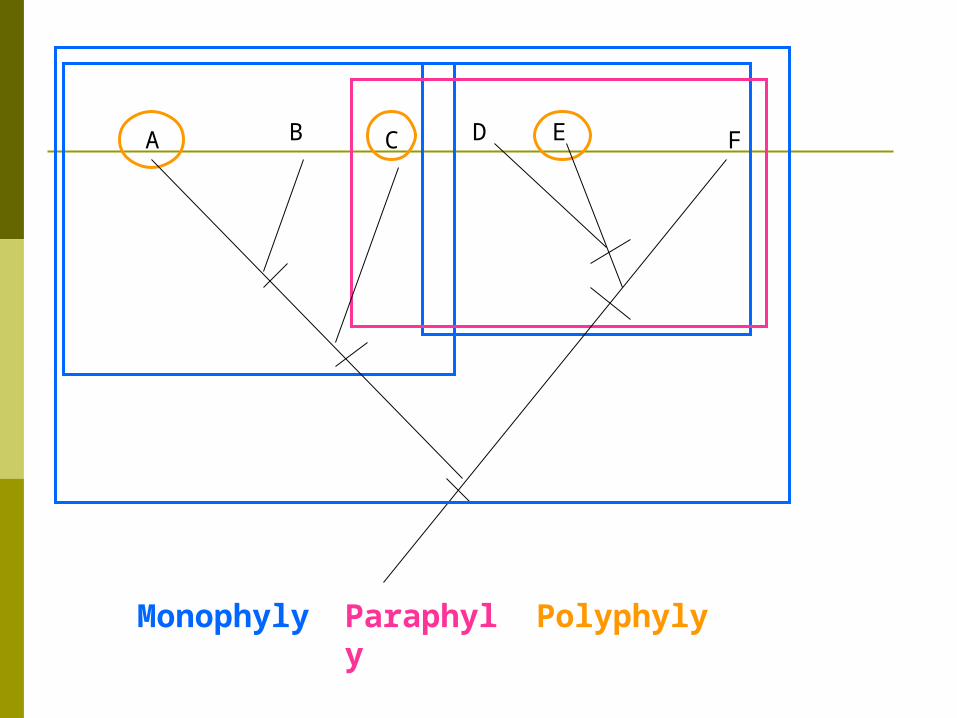
A B C D E F
Monophyly Paraphyly Polyphyly

Choosing characters for the analysis
Morphological traits Essential in the case of fossils Scoring traits on fossils is tedious and
requires expertise. Sometimes looking at embryological
development of similar structures can help identify whether traits are homologous
Molecular characters
Nucleotides may be scored rapidly and a huge number of genes are available for comparison
Models have been developed to predict how sequences change through time
However, homoplasy is difficult to identify because differences are limited to just four character states A, G, C, and T

The case of the whale
An example from a single morphological character
Ungulates are divided into two monophyletic groups Artiodactyla – hippos, cows, pigs, deer, giraffes,
antelopes and camels Perrisodactyla- horse and rhinos
This grouping is due to many structural characteristics of the skull and dentiton but mainly it is determined by the shape of an
ankle bone called the astragalus Fig 4.7

Fossil records provide evidence that suggests that whales are related to the ungulates
including horse, rhino, deer, cow, camel, and antelope
whales are most closely related to the hippo Previously it was thought that some of the
characteristics shared by whales and hippos were convergences due to their aquatic lifestyles
Problems with the former tree
If whales and hippos are sister groups then this morphological trait (astragalus) does not follow the most parsimonious route in evolution
The whales would have had to lose the character trait See Figure 4.8
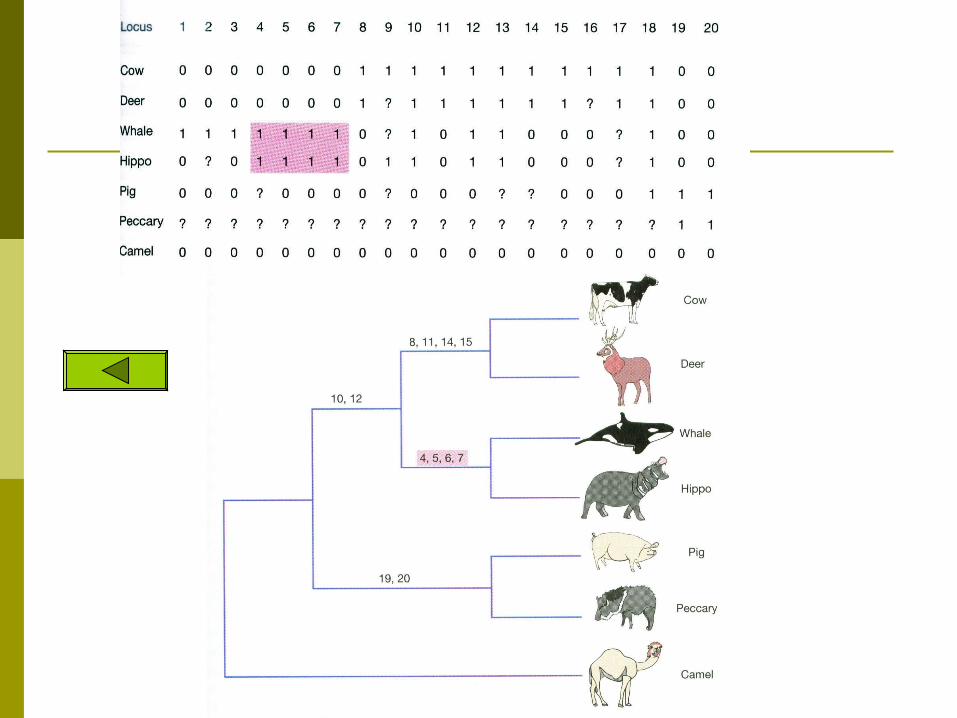
Multiple Molecular characters
Molecular data are also available for the whale/hippo hypothesis.
When multiple characters are used, each trait is treated independently and mapped onto a possible cladogram
The sum of all changes required on each possible tree is totaled and the best tree is considered to be that which is most parsimonious or has the least number of changes required

Homework exercise
Figure 4.9 shows a group of DNA characters in the sequence for the gene which encodes a milk protein
Of the sequences shown, 15 of the nucleotides group at least two taxa and separate them from the rest. All of the rest are invariant and provide no information
An exercise in constructing an evolutionary history

Let’s use this information to choose between two possible trees
First we need to find the most parsimonious reconstruction for each character that changes (we will use positions 151, 162, 166,176,177, and 194)
Then we count up the required changes and the tree with the fewest is the best choice
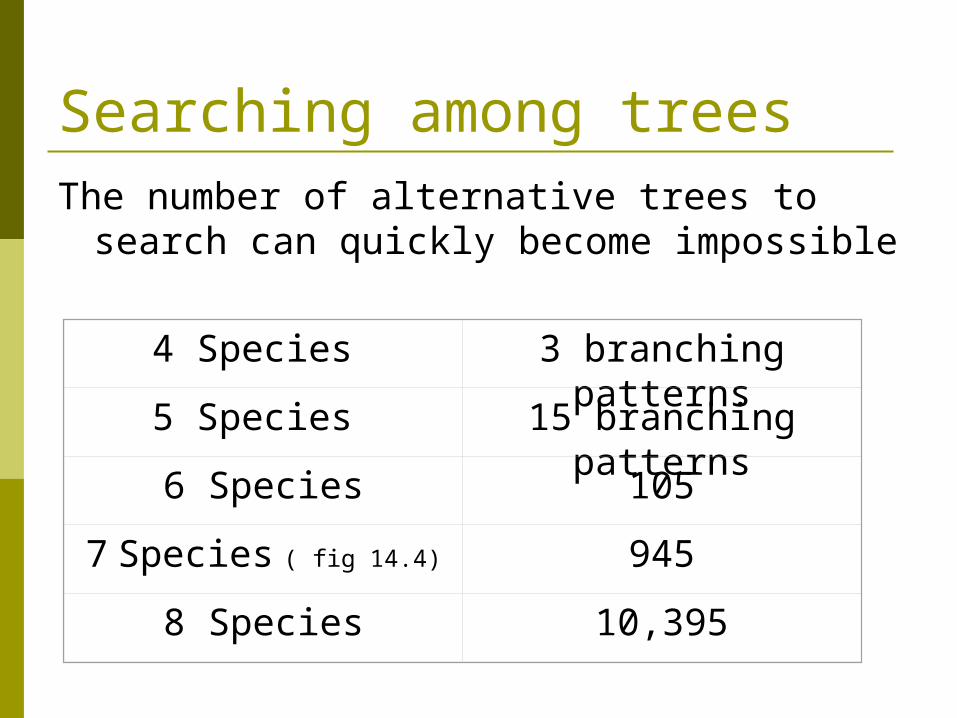
Searching among trees The number of alternative trees to search
can quickly become impossible
4 Species 3 branching patterns
5 Species 15 branching patterns
6 Species 105
7 Species ( fig 14.4) 945
8 Species 10,395

Computers can automate the task With a group of 10 or less taxa, computers
can test all possible combinations For more taxa the computer is too slow to
test allall possibilities
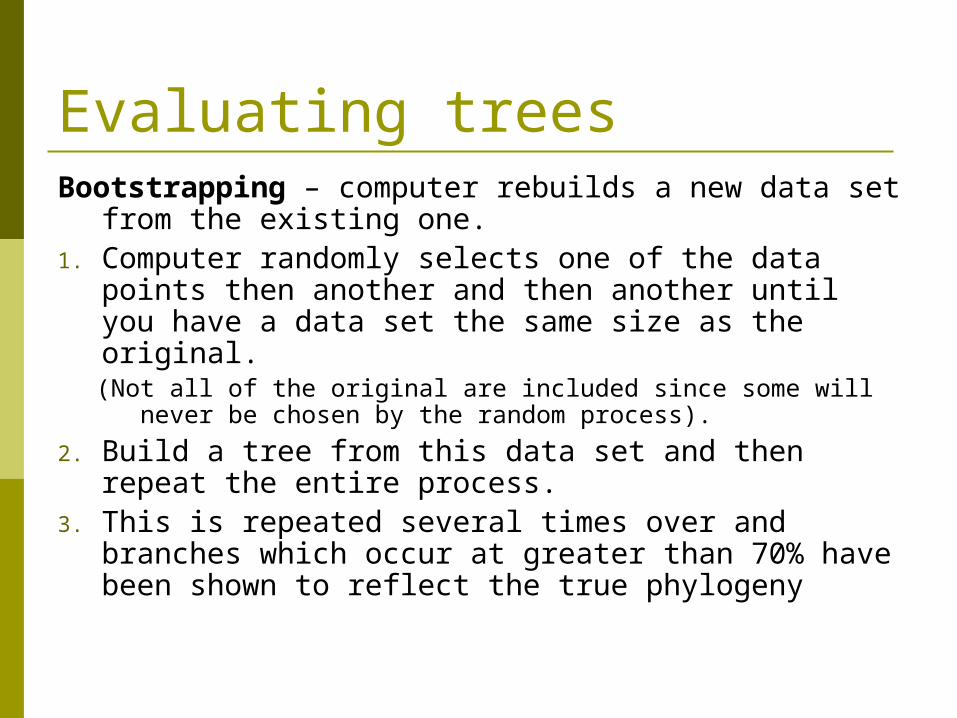
Evaluating trees Bootstrapping – computer rebuilds a new data set
from the existing one. 1. Computer randomly selects one of the data
points then another and then another until you have a data set the same size as the original.(Not all of the original are included since some will never
be chosen by the random process).
2. Build a tree from this data set and then repeat the entire process.
3. This is repeated several times over and branches which occur at greater than 70% have been shown to reflect the true phylogeny
Two other methods do not use parsimony Phylogenetic methods compute probability
or likelihood of specific trees. Maximum likelihood Bayesian Analysis
Genetic Distance (more phenetic)
Maximum likelihood Statistical analyses may be used to determine the
best tree Works from a mathematical formula that
describes the probability that a certain nucleotide substitution will occur (somehow computed by biologists and unique to the DNA
sequence being studied). Compare this model with a particular
phylogenetic tree and determine how likely it is that a particular set of DNA sequences in a particular tree will actually occur.
Maximum likelihood continued
A computer evaluates each tree and computes the probability of each arrangement occurring based on the specified model of character change
The probability is reported as the likelihood that each given tree explains the data
Can actually demonstrate that some potential trees really are more likely.
Then can do statistical analyses to decide how likely a tree really is.
Bayesian Markov Chain Monte Carlo This is a different angle of approaching the
question of maximum likelihood. It works with individual trees and attempts
to find a probability that a particular tree is correct.
The Maximum likelihood methods are believed to work better than Parsimony but they cannot always be used.
You must have a model of likely changes in DNA before they can be used.
Genetic distance (Phenetic approach)
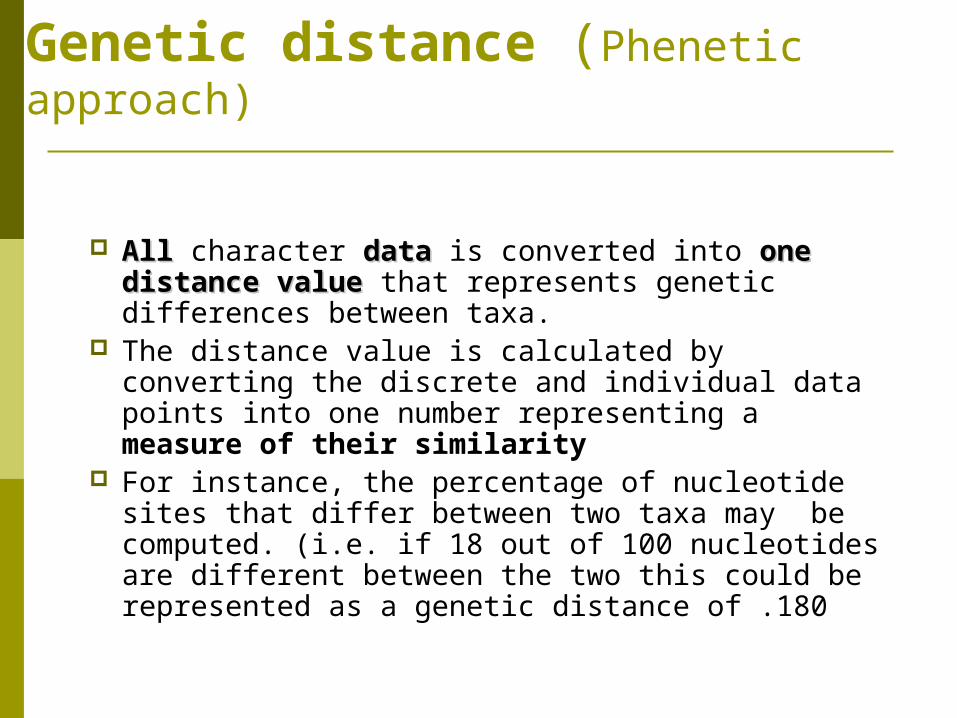
AllAll character datadata is converted into one one distance valuedistance value that represents genetic differences between taxa.
The distance value is calculated by converting the discrete and individual data points into one number representing a measure of their similarity
For instance, the percentage of nucleotide sites that differ between two taxa may be computed. (i.e. if 18 out of 100 nucleotides are different between the two this could be represented as a genetic distance of .180

Genetic distance (cont)
This method loses all specific information but can capture the overall degree of similarity between pairs of taxa
Taxa are clustered together based on their genetic distances and a tree is constructed from this which minimizes the total distance among taxa. Fig 4.10

Ways of evaluating how good a particular tree is
1. Produce a consensus tree with parsimony2. Use statistical analyses to evaluate the
best trees under ML and BMCMC3. Compare the best trees under parsimony,
ML and BMCMC to see how consistent they are.
Do all three and if consistent can be pretty confident you have the right tree.
Resolving character conflict
When conflict still exists all we can really do is wait for more data
Perhaps new techniques will arise which can help to resolve the conflict
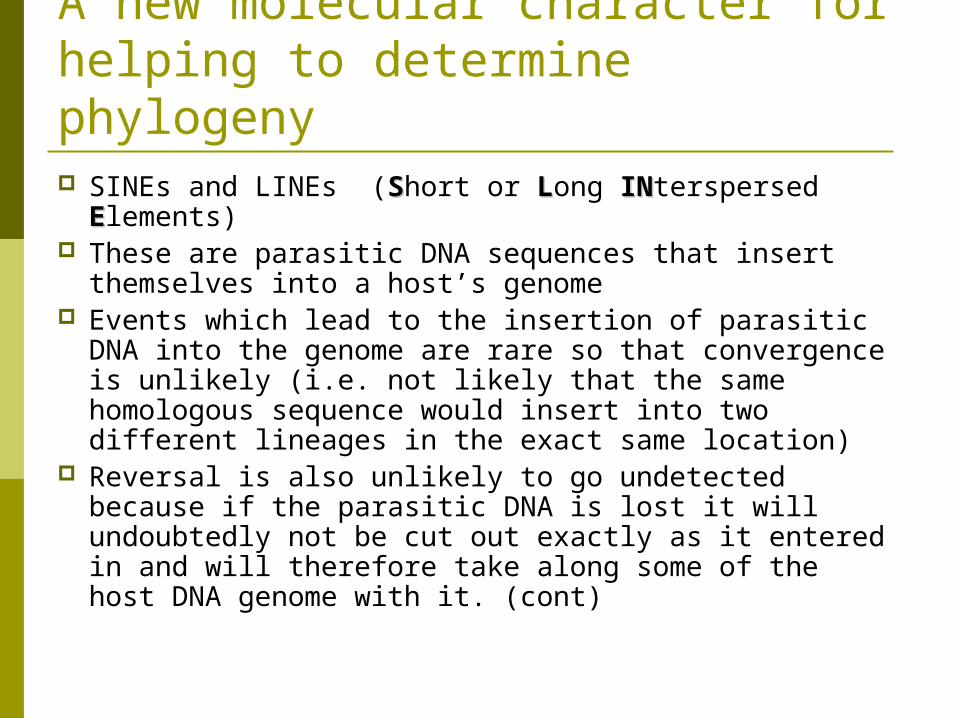
A new molecular character for helping to determine phylogeny SINEs and LINEs (SShort or LLong ININterspersed
EElements) These are parasitic DNA sequences that insert
themselves into a host’s genome Events which lead to the insertion of parasitic DNA
into the genome are rare so that convergence is unlikely (i.e. not likely that the same homologous sequence would insert into two different lineages in the exact same location)
Reversal is also unlikely to go undetected because if the parasitic DNA is lost it will undoubtedly not be cut out exactly as it entered in and will therefore take along some of the host DNA genome with it. (cont)

This allows geneticists to differentiate from those that never had the parasitic DNA inserted and those who secondarily lost it
Therefore, SINE and LINE are assumed to be free of homoplasy.
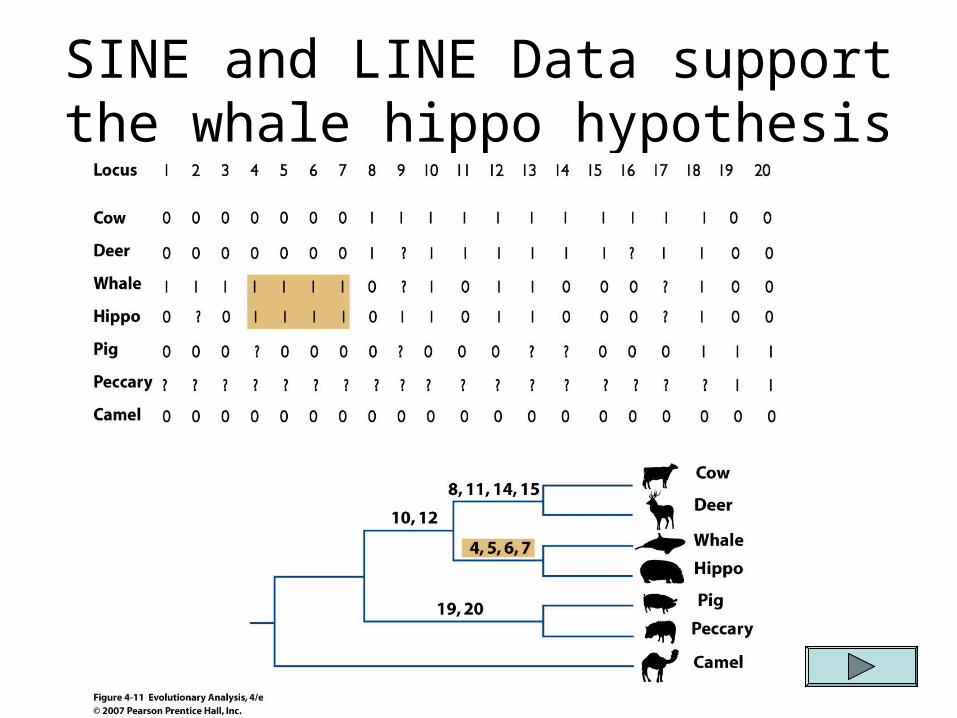
SINE and LINE Data support the whale hippo hypothesis
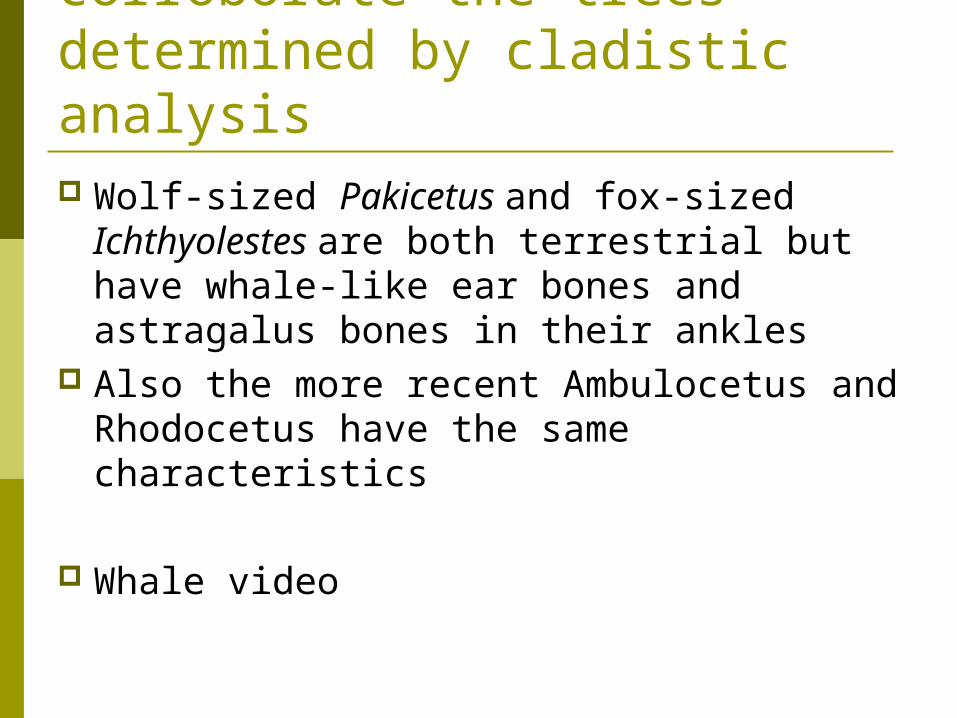
Recent fossil finds also corroborate the trees determined by cladistic analysis Wolf-sized Pakicetus and fox-sized
Ichthyolestes are both terrestrial but have whale-like ear bones and astragalus bones in their ankles
Also the more recent Ambulocetus and Rhodocetus have the same characteristics
Whale video

Homework exercise

Figure 4.9 shows a group of DNA characters in the sequence for the gene which encodes a milk protein
Of the sequences shown, 15 of the nucleotides group at least two taxa and separate them from the rest. All of the rest are invariant and provide no information
An exercise in constructing an evolutionary history
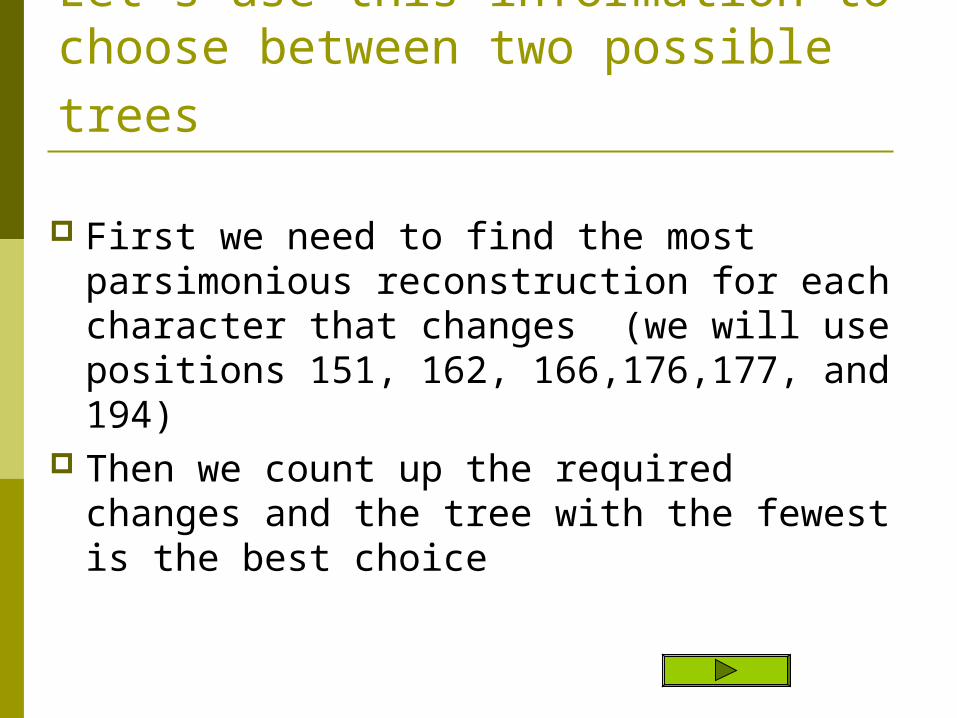
Let’s use this information to choose between two possible trees
First we need to find the most parsimonious reconstruction for each character that changes (we will use positions 151, 162, 166,176,177, and 194)
Then we count up the required changes and the tree with the fewest is the best choice
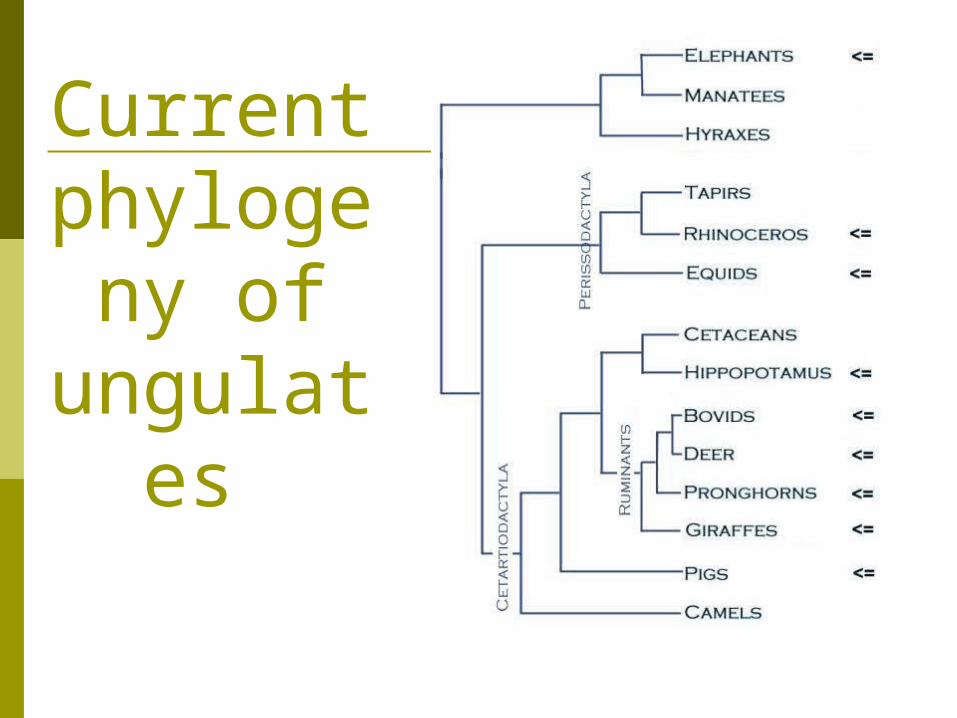
Current phyloge
ny of ungulate
s

What can phylogenies be used for?
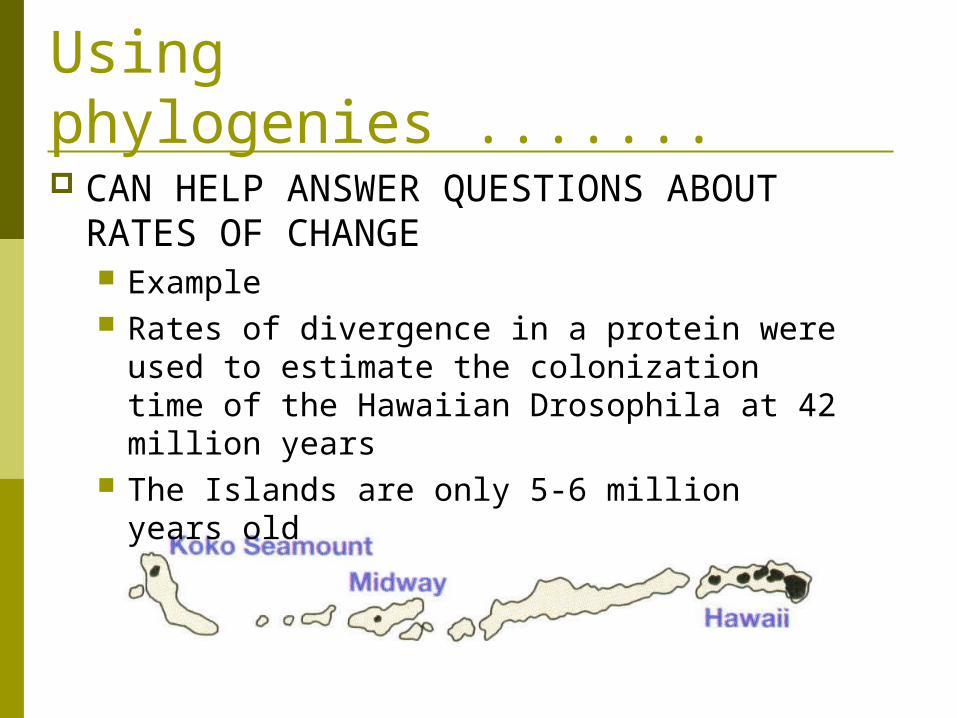
Using phylogenies ....... CAN HELP ANSWER QUESTIONS ABOUT
RATES OF CHANGE Example Rates of divergence in a protein were used
to estimate the colonization time of the Hawaiian Drosophila at 42 million years
The Islands are only 5-6 million years old
Using phylogenies can answer questions about... THE AGE OF CLADES
When the fossil record can provide documentation for a lineage it can help place a time scale on the branching points
Cladograms can then be used to make predictions about what we might find in future fossil discoveries
Using phylogenies to ...
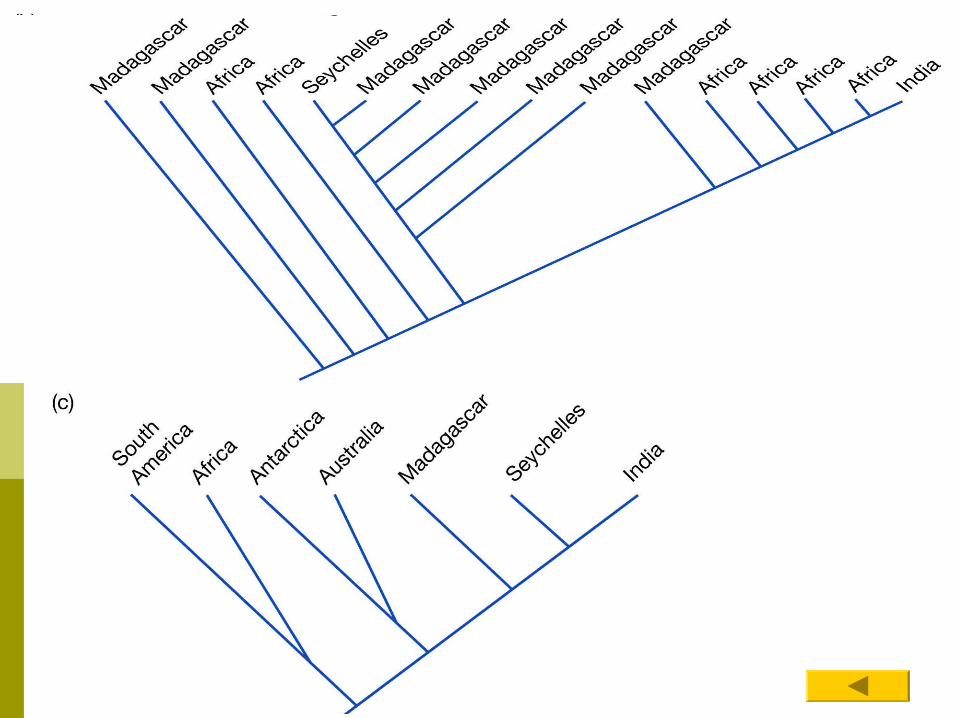
Understand how organisms came to be where they are.... BiogeographyBiogeography
For instance ...can use phylogenetic trees to help establish how some taxa radiated out to their current locations when Gondwana broke up. Chameleons example in the book.
Did Chameleon species disperse or were they separated at the time that Gondwana broke up? Figure 14.13
This field of study is called phylogeography
Using phylogenies can document coevolution
Example Ants that farm fungi or Aphids with bacterial
endosymbionts have been studied. Leaf Leaf cutter ant video.cutter ant video.
Phylogenetic analysis of the two groups which are in association may provide evidence that the species have evolved in concert.
Using phylogenies to answer questions
USED TO TRACK DOWN THE TRANSMISSION HISTORY OF COMMUNICABLE DISEASES Plague example in the book.

The End
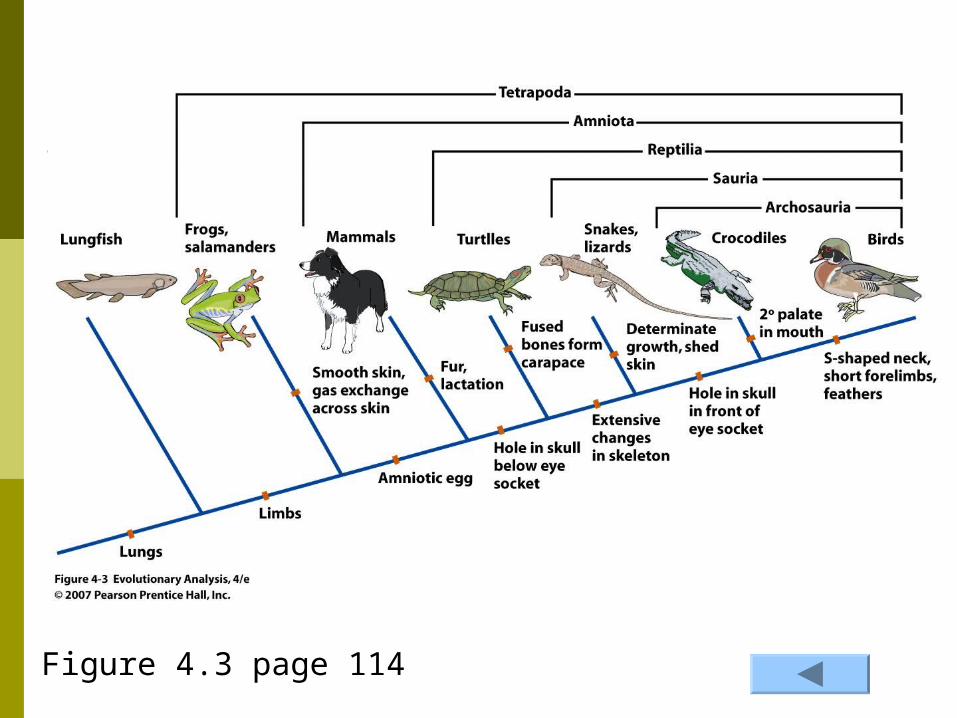
Figure 4.3 page 114
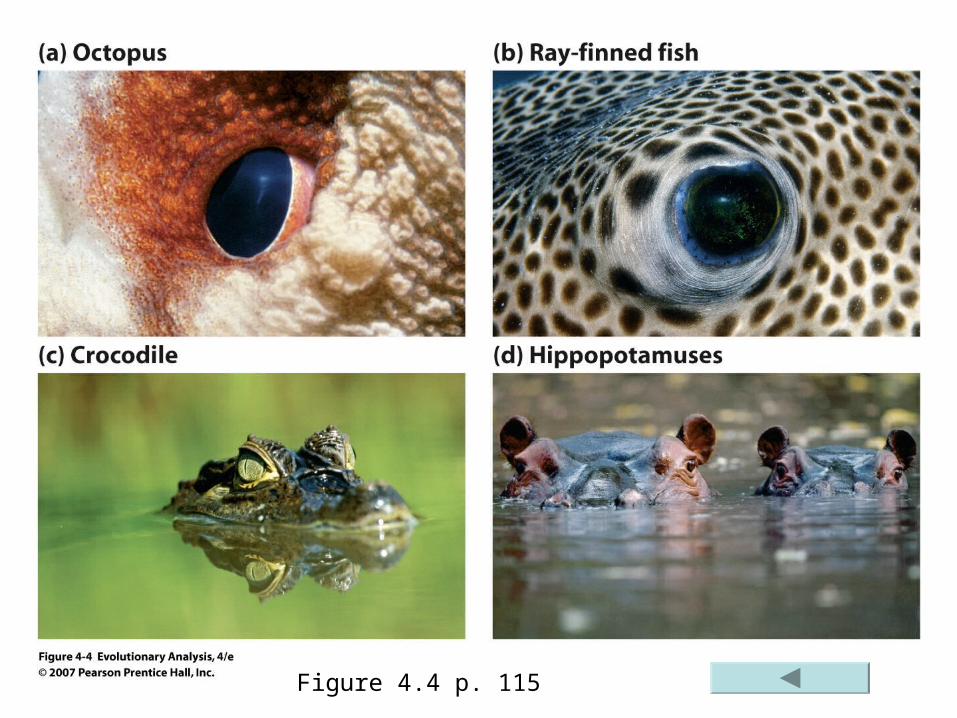
Figure 4.4 p. 115
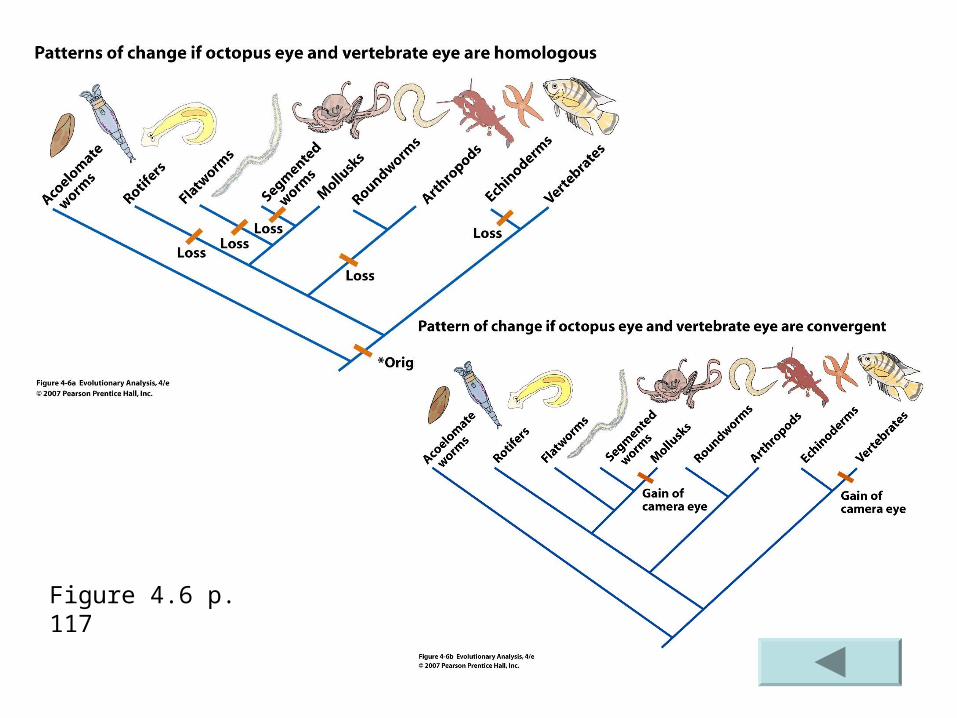
Figure 4.6 p. 117
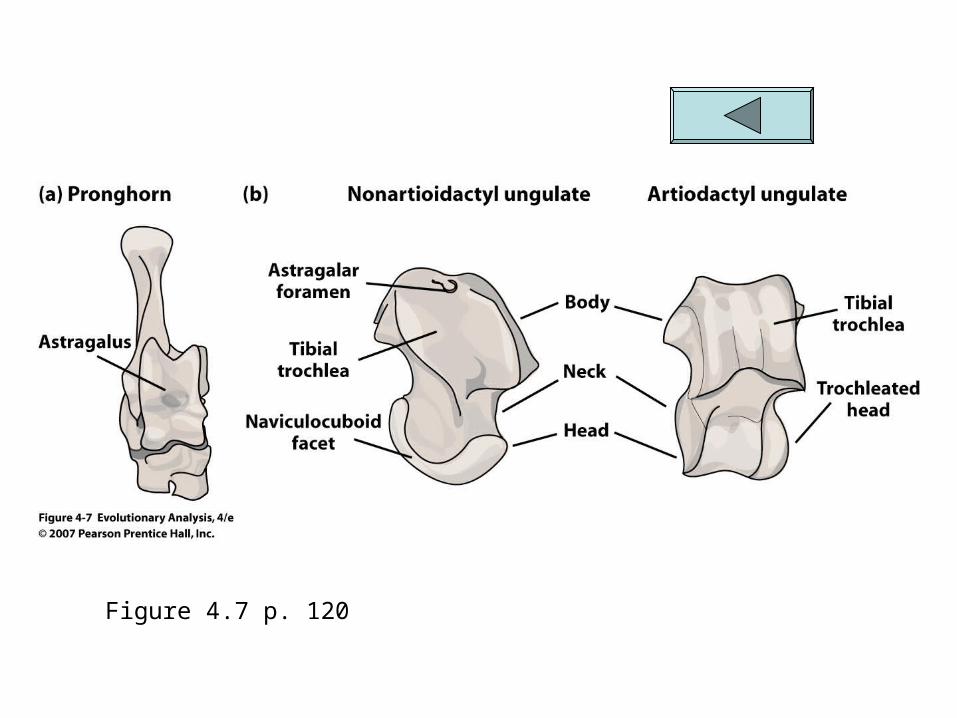
Figure 4.7 p. 120
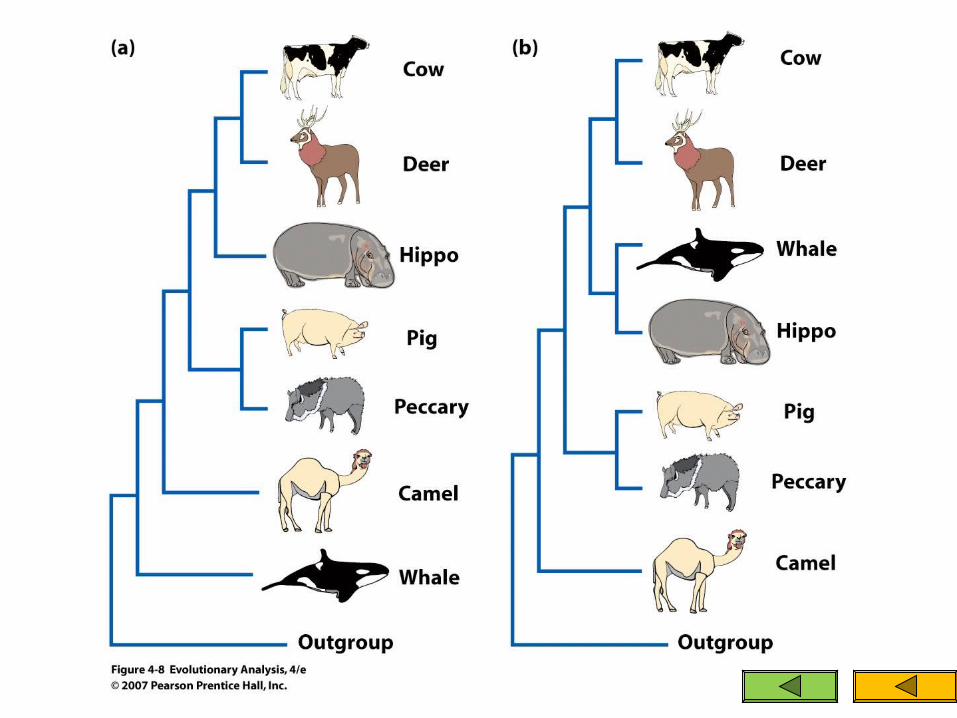
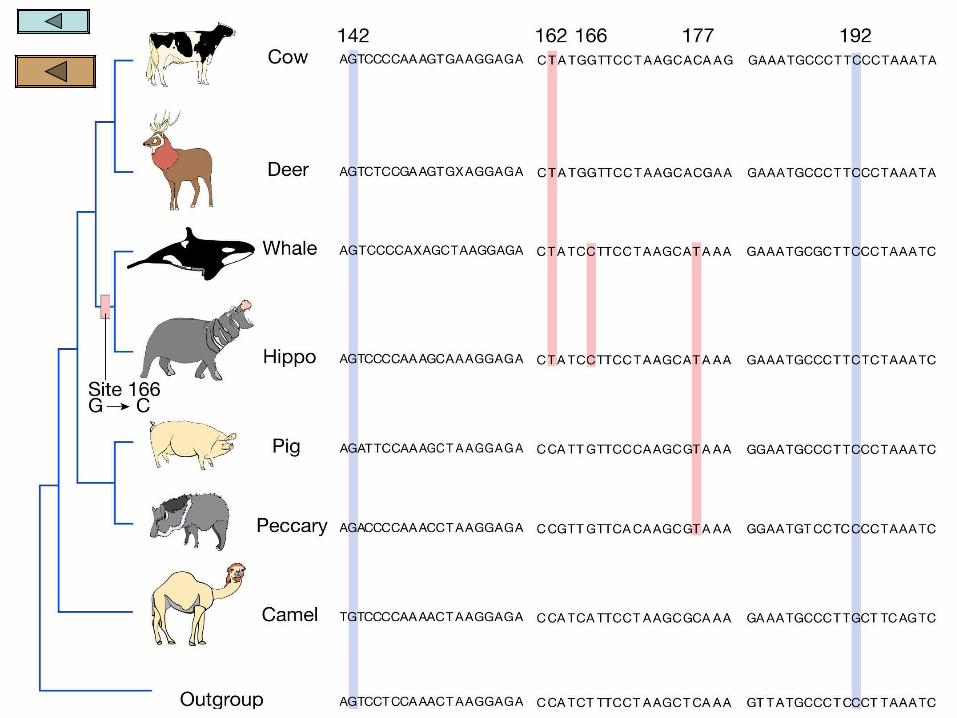
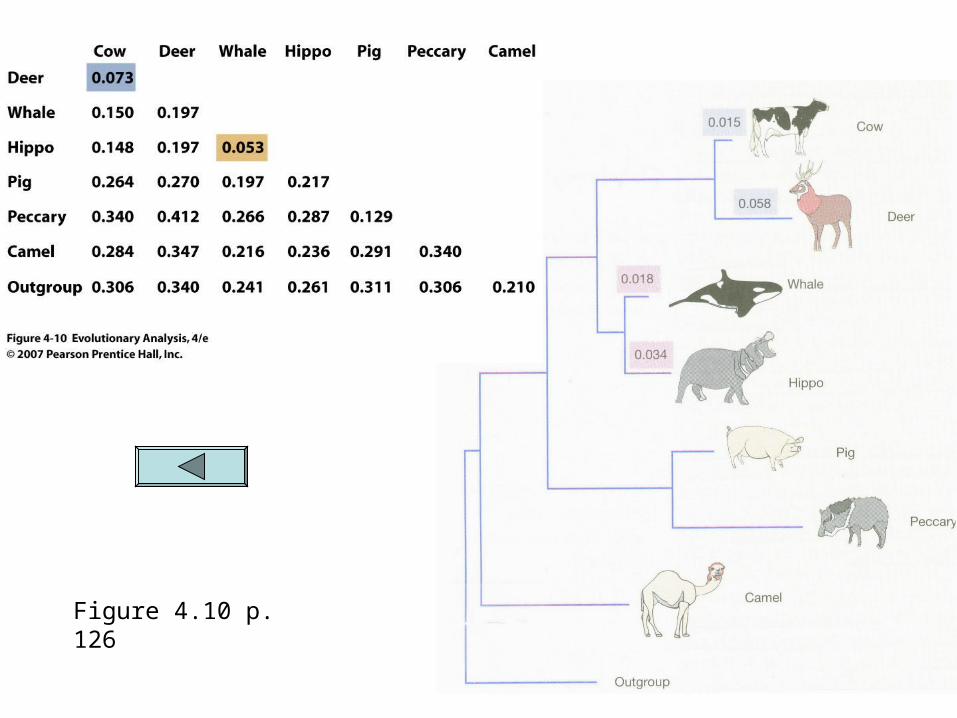
Figure 4.10 p. 126
a
bc
e
f g
h
abe abf acg ach

The End

Recommended