Digital Scholar
Webinar
September 6th, 2017
Hosted by the Southern California Clinical and Translational Science Institute (SC CTSI)
University of Southern California (USC) and Children’s Hospital Los Angeles (CHLA)
Katja Reuter, PhD,
Director of the Digital
Scholar Program
About Today’s Session
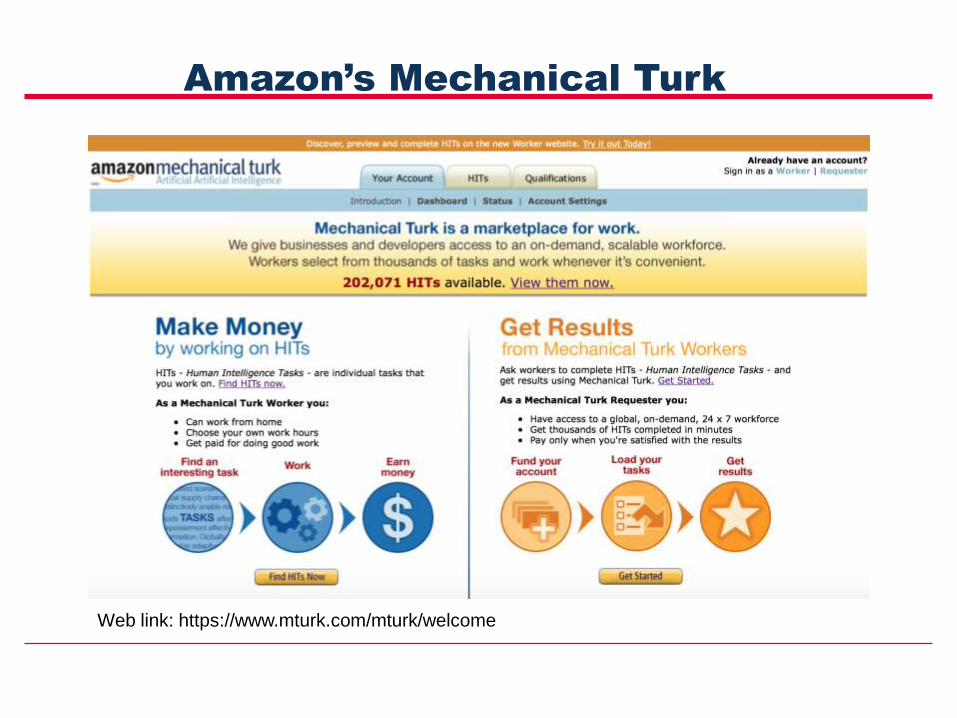
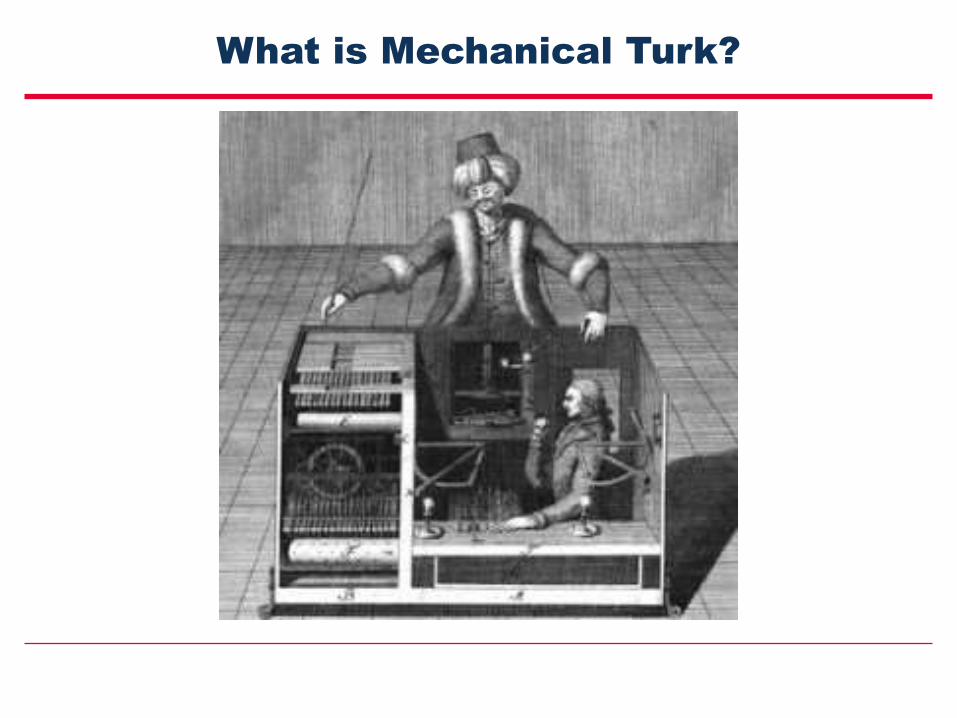
Amazon’s Mechanical Turk
Web link: https://www.mturk.com/mturk/welcome
Today’s Learning Objectives
Describe the potential and strengths of Mechanical Turk as a
complementary participant recruitment tool for clinical translational studies
Identify study types where MTurk is applicable
Describe basic features of mTurk and how they are used
Describe potential weaknesses (e.g., valid data quality, external validity of
results) of using MTurk and how to address them
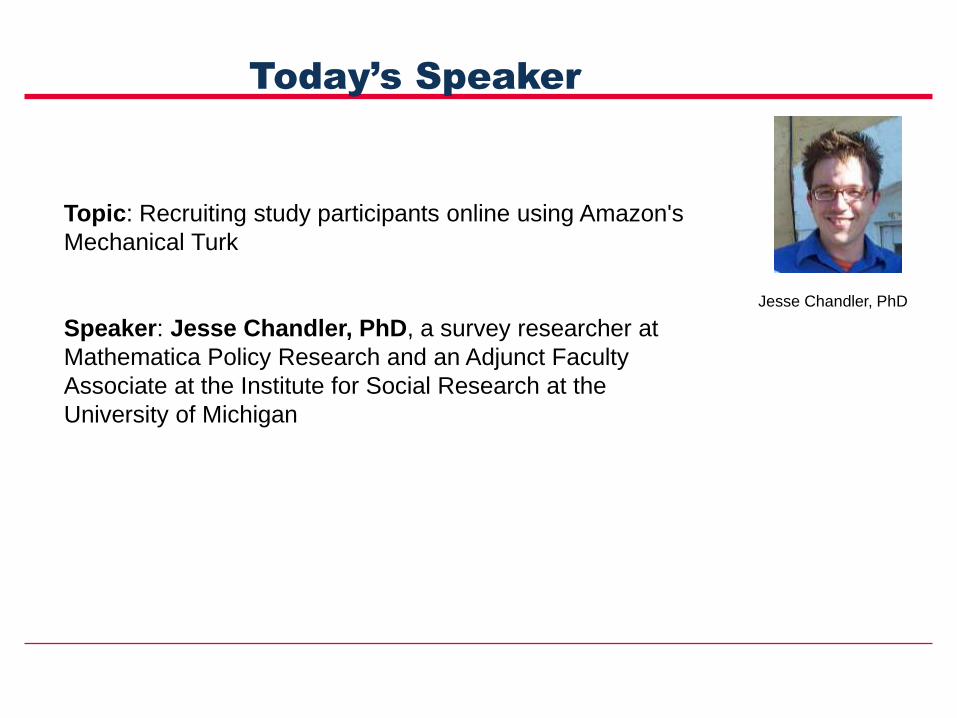
Jesse Chandler, PhD
Today’s Speaker
Topic: Recruiting study participants online using Amazon's
Mechanical Turk
Speaker: Jesse Chandler, PhD, a survey researcher at
Mathematica Policy Research and an Adjunct Faculty
Associate at the Institute for Social Research at the
University of Michigan
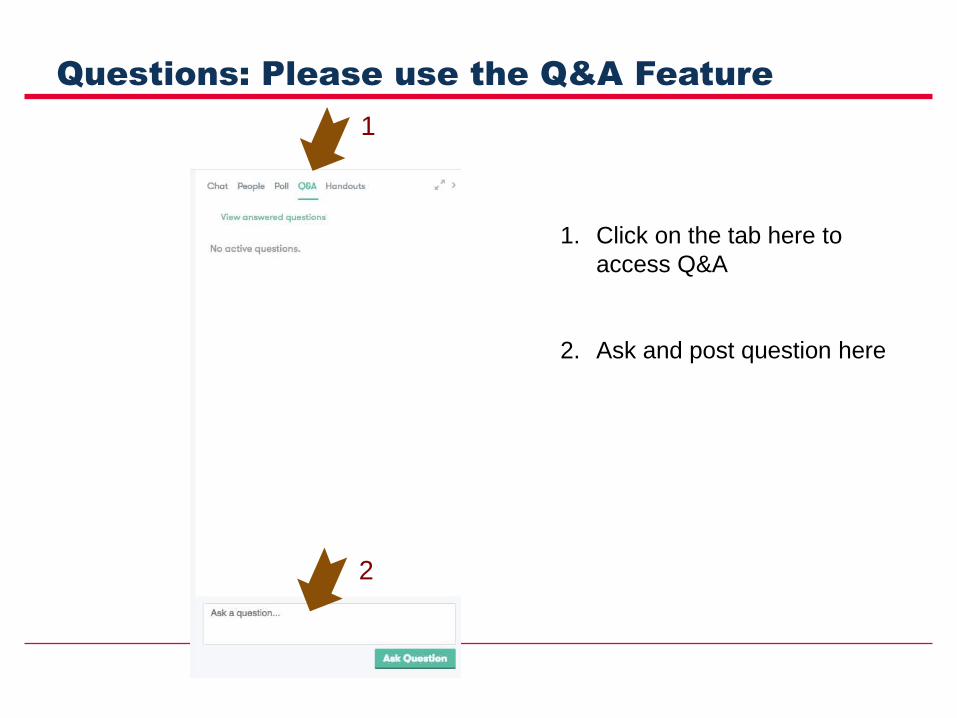
Questions: Please use the Q&A Feature
1. Click on the tab here to
access Q&A
2. Ask and post question here
1
2
Recruiting study participants online
using Amazon’s Mechanical Turk
Jesse Chandler
August 17, 2017
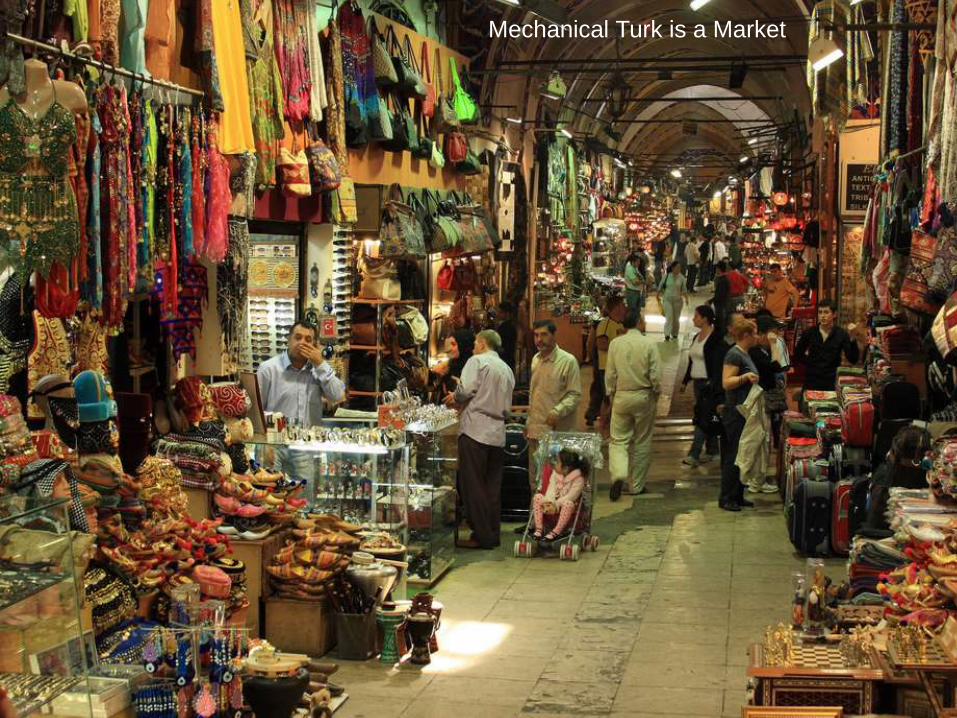
Mechanical Turk is a Market
Trust Through Reputation
Other Advantages of MTurk
• Simple: Easy to use interface. Security,
recruitment, identity verification and
payment handled by Amazon
Other Advantages of MTurk
• Simple: Easy to use interface. Security,
recruitment, identity verification and
payment handled by Amazon
• Fast: Hundreds of responses per day
Other Advantages of MTurk
• Simple: Easy to use interface. Security,
recruitment, identity verification and
payment handled by Amazon
• Fast: Hundreds of responses per day
• Cost effective: $0.10 per respondent
minute (plus fee)
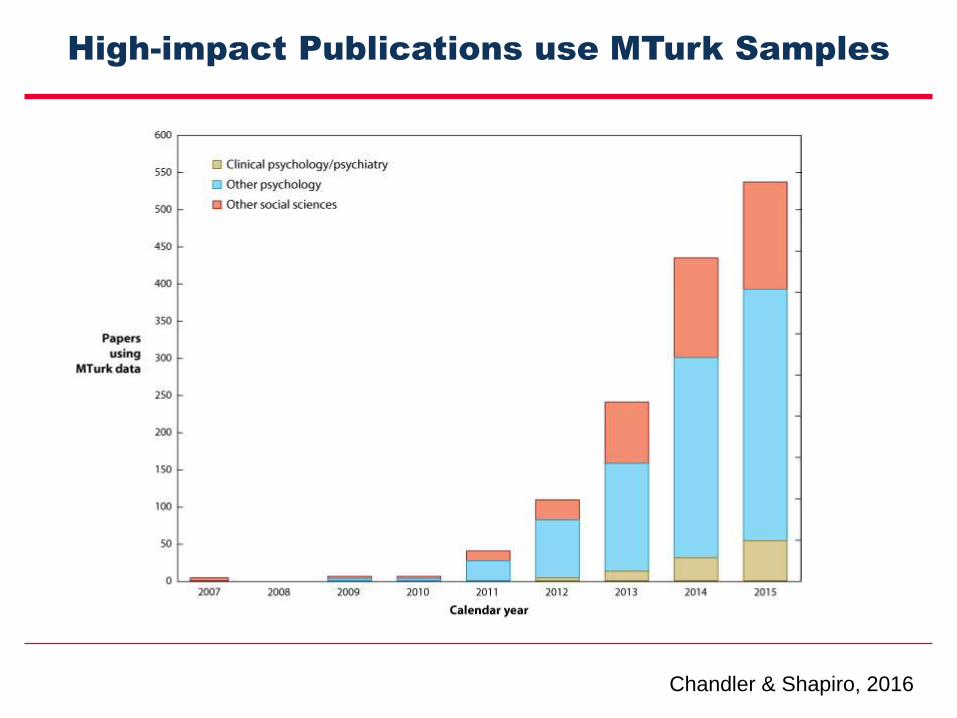
High-impact Publications use MTurk Samples
Chandler & Shapiro, 2016
Who are Mechanical Turk Workers?
• Workers are mostly Indian and American
• Most research relies heavily on American
workers
Stewart et al., 2017
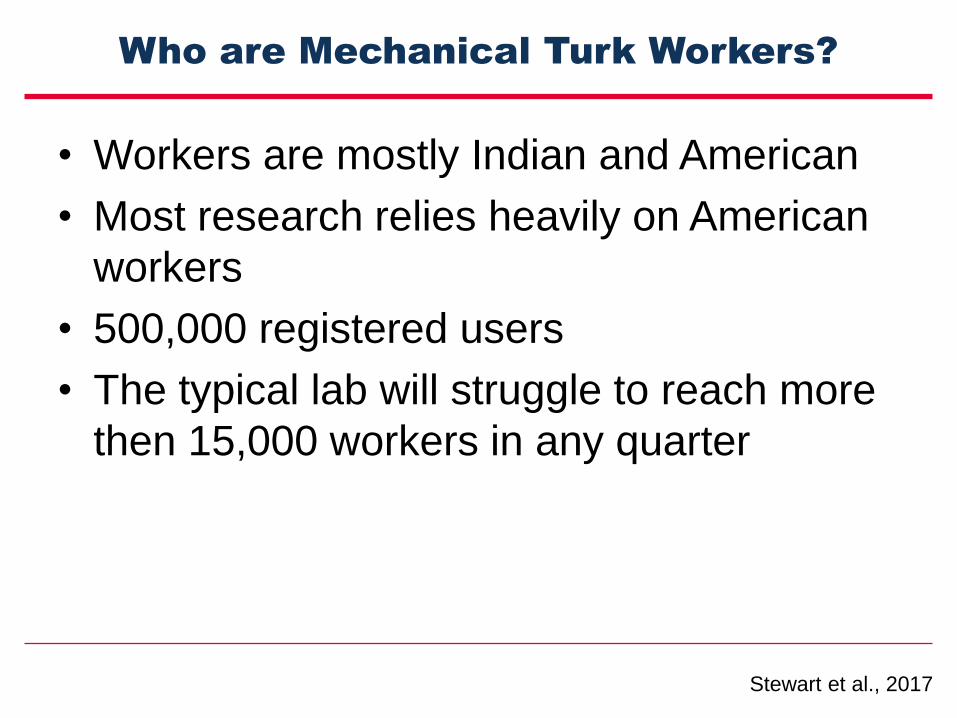
Who are Mechanical Turk Workers?
• Workers are mostly Indian and American
• Most research relies heavily on American
workers
• 500,000 registered users
• The typical lab will struggle to reach more
then 15,000 workers in any quarter
Stewart et al., 2017
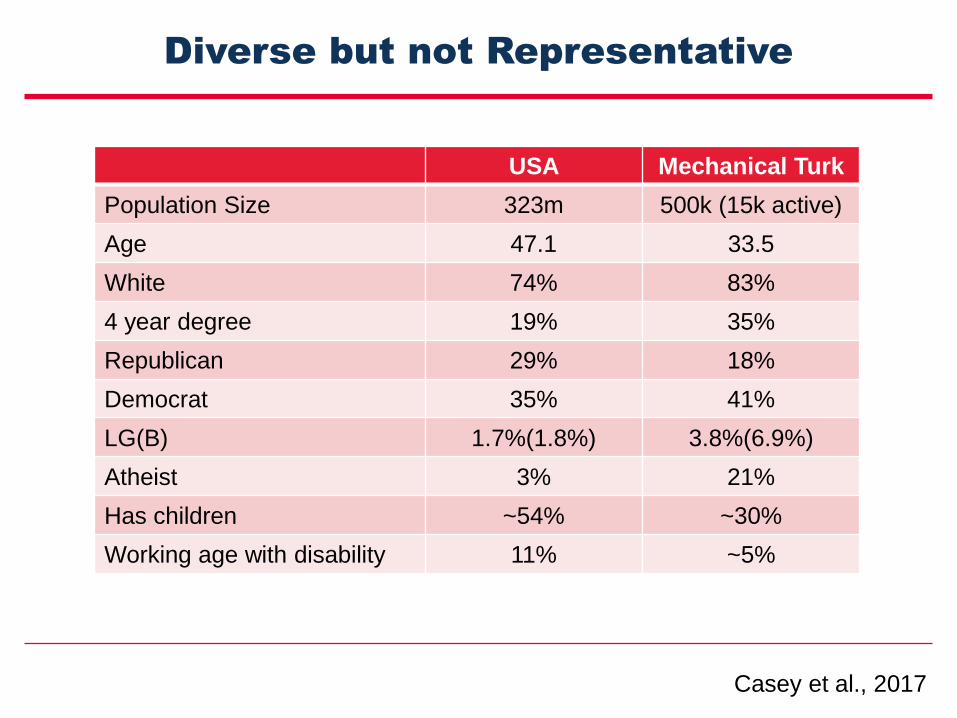
Diverse but not Representative
USA Mechanical Turk
Population Size 323m 500k (15k active)
Age 47.1 33.5
White 74% 83%
4 year degree 19% 35%
Republican 29% 18%
Democrat 35% 41%
LG(B) 1.7%(1.8%) 3.8%(6.9%)
Atheist 3% 21%
Has children ~54% ~30%
Working age with disability 11% ~5%
Casey et al., 2017
How to Use Mechanical Turk
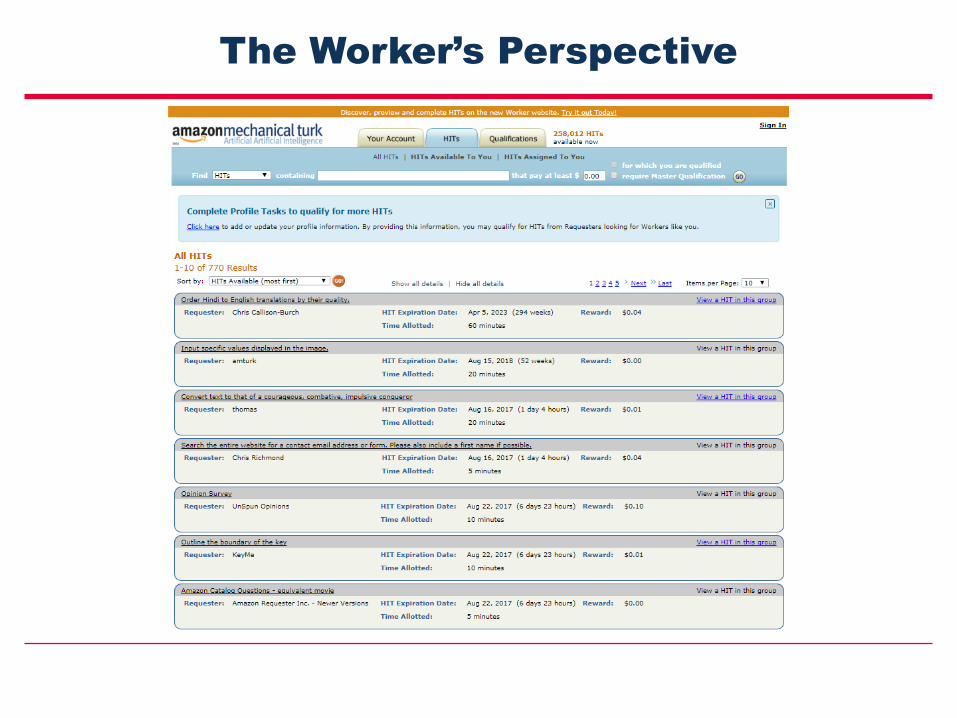
The Worker’s Perspective
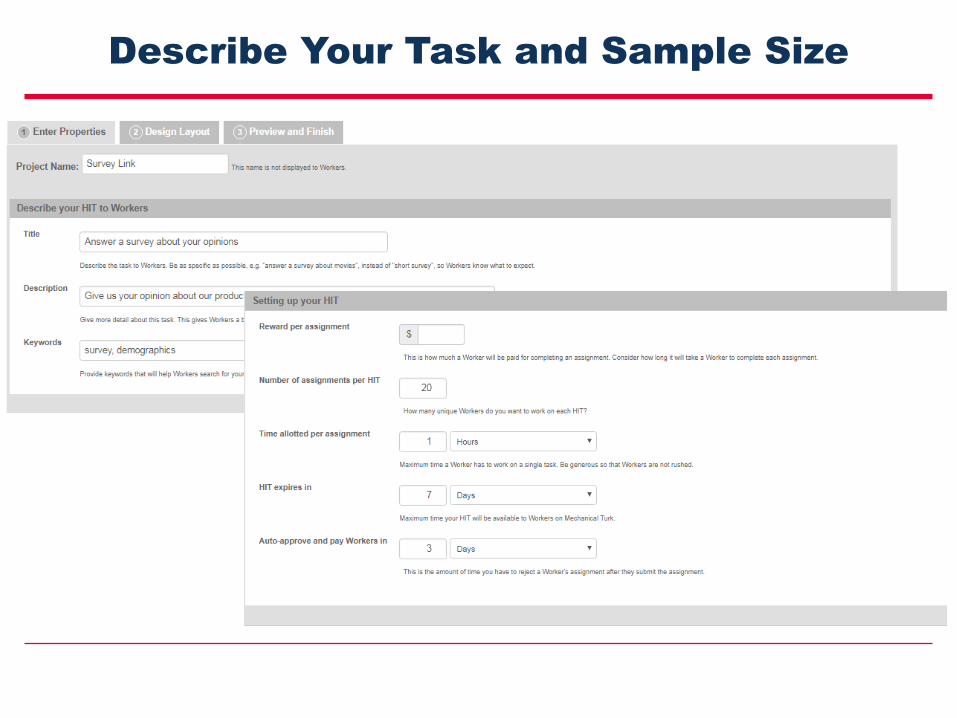
Describe Your Task and Sample Size
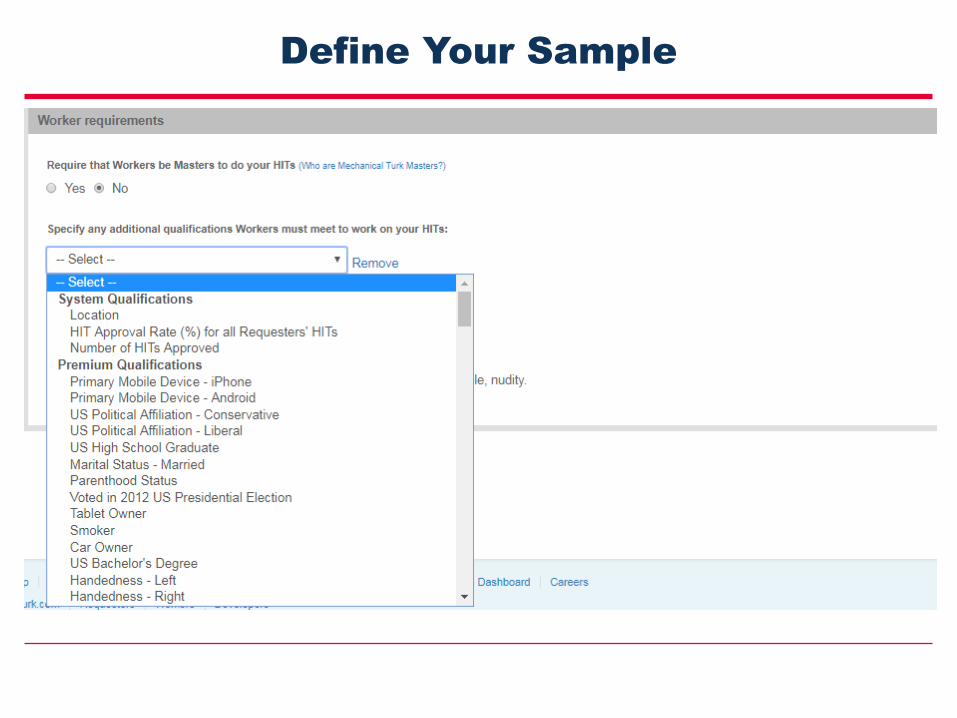
Define Your Sample
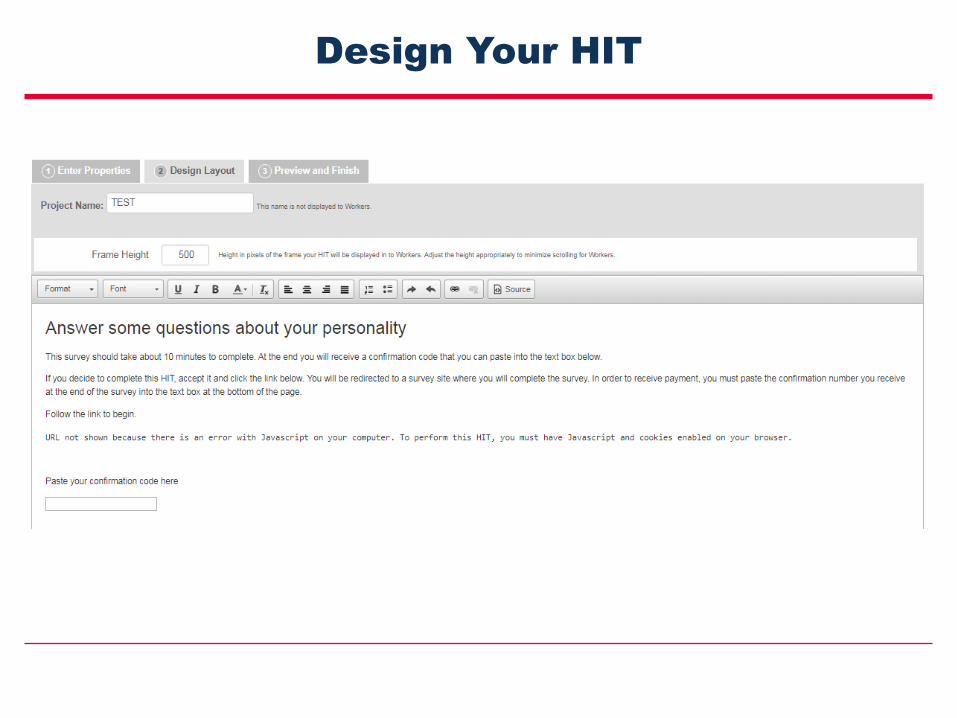
Design Your HIT
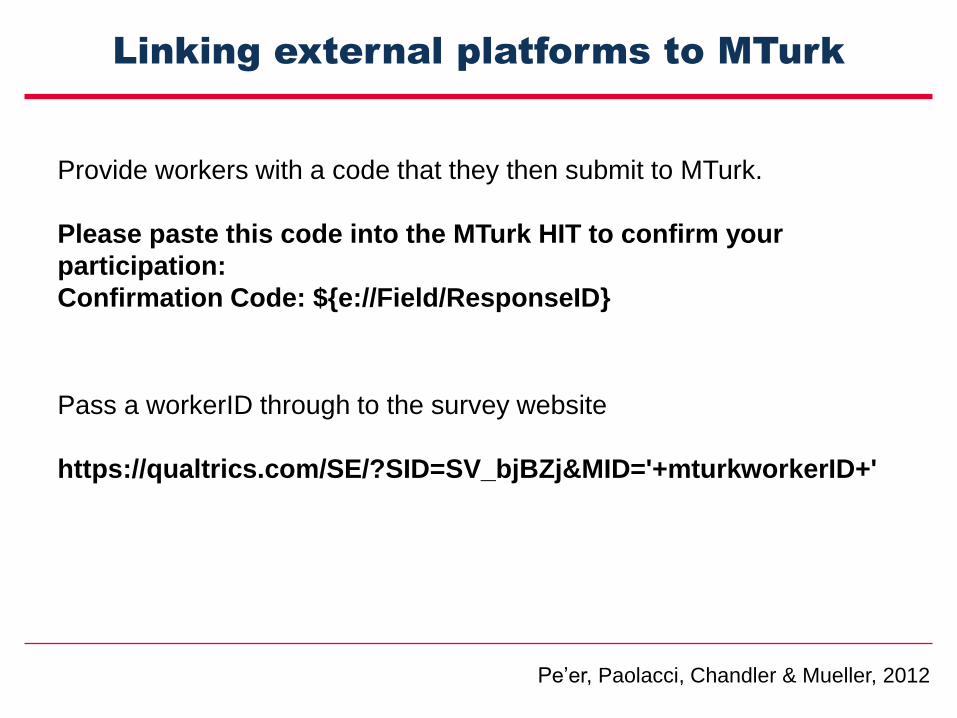
Linking external platforms to MTurk
Provide workers with a code that they then submit to MTurk.
Please paste this code into the MTurk HIT to confirm your
participation:
Confirmation Code: ${e://Field/ResponseID}
Pass a workerID through to the survey website
https://qualtrics.com/SE/?SID=SV_bjBZj&MID='+mturkworkerID+'
Pe’er, Paolacci, Chandler & Mueller, 2012
Uses of Mechanical Turk
Behavioral Science Research
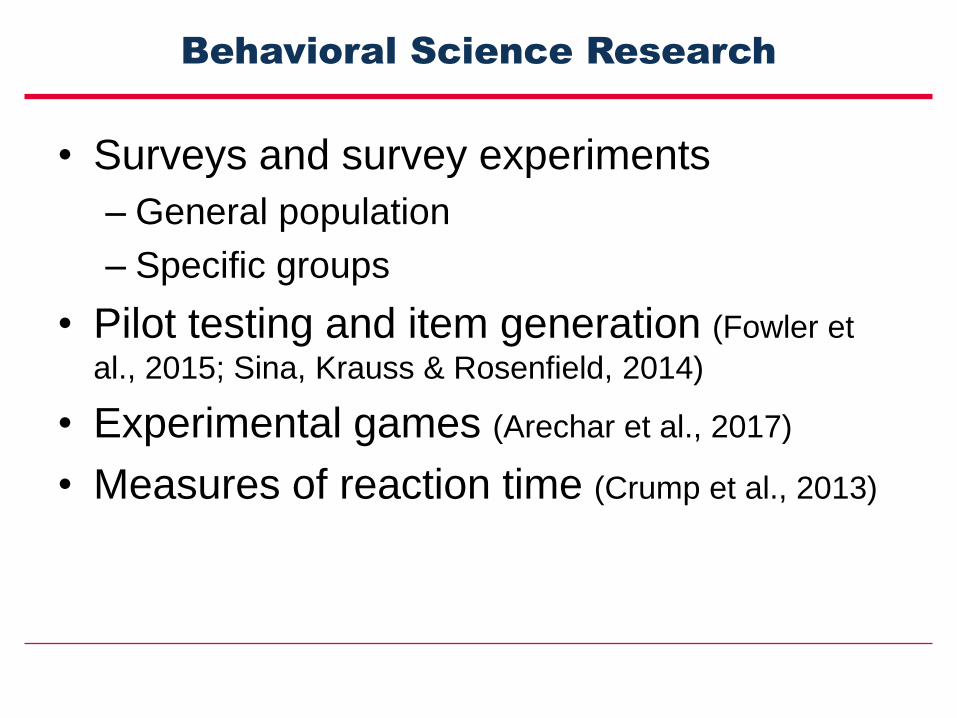
• Surveys and survey experiments
– General population
– Specific groups
Behavioral Science Research
• Surveys and survey experiments
– General population
– Specific groups
• Pilot testing and item generation (Fowler et
al., 2015; Sina, Krauss & Rosenfield, 2014)
Behavioral Science Research
• Surveys and survey experiments
– General population
– Specific groups
• Pilot testing and item generation (Fowler et
al., 2015; Sina, Krauss & Rosenfield, 2014)
• Experimental games (Arechar et al., 2017)
Behavioral Science Research
• Surveys and survey experiments
– General population
– Specific groups
• Pilot testing and item generation (Fowler et
al., 2015; Sina, Krauss & Rosenfield, 2014)
• Experimental games (Arechar et al., 2017)
• Measures of reaction time (Crump et al., 2013)
Behavioral Science Research
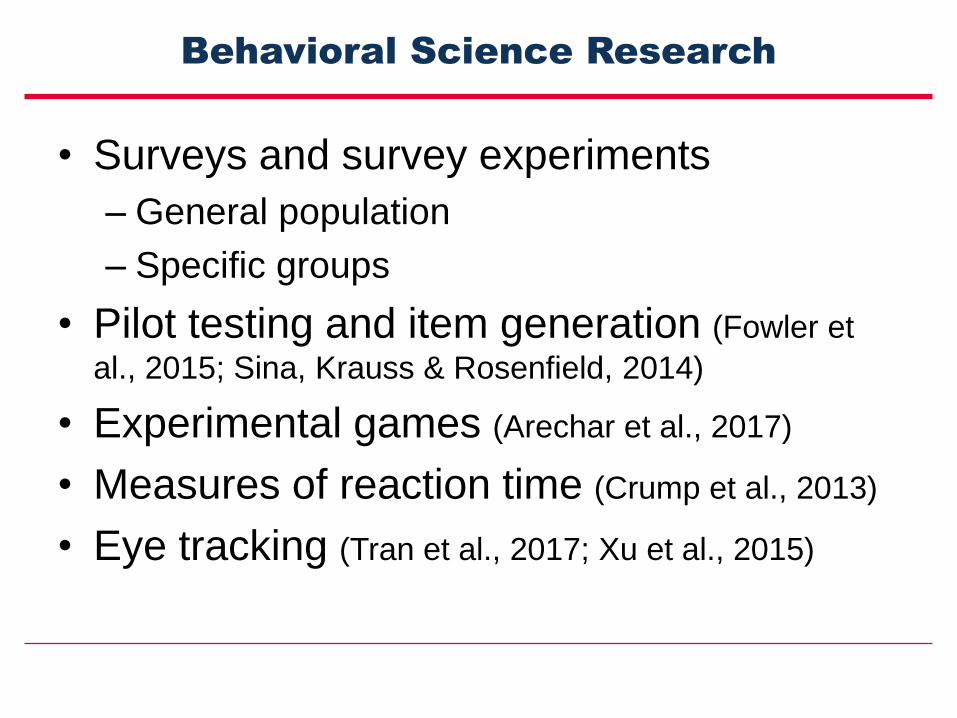
• Surveys and survey experiments
– General population
– Specific groups
• Pilot testing and item generation (Fowler et
al., 2015; Sina, Krauss & Rosenfield, 2014)
• Experimental games (Arechar et al., 2017)
• Measures of reaction time (Crump et al., 2013)
• Eye tracking (Tran et al., 2017; Xu et al., 2015)
Behavioral Health Research on MTurk
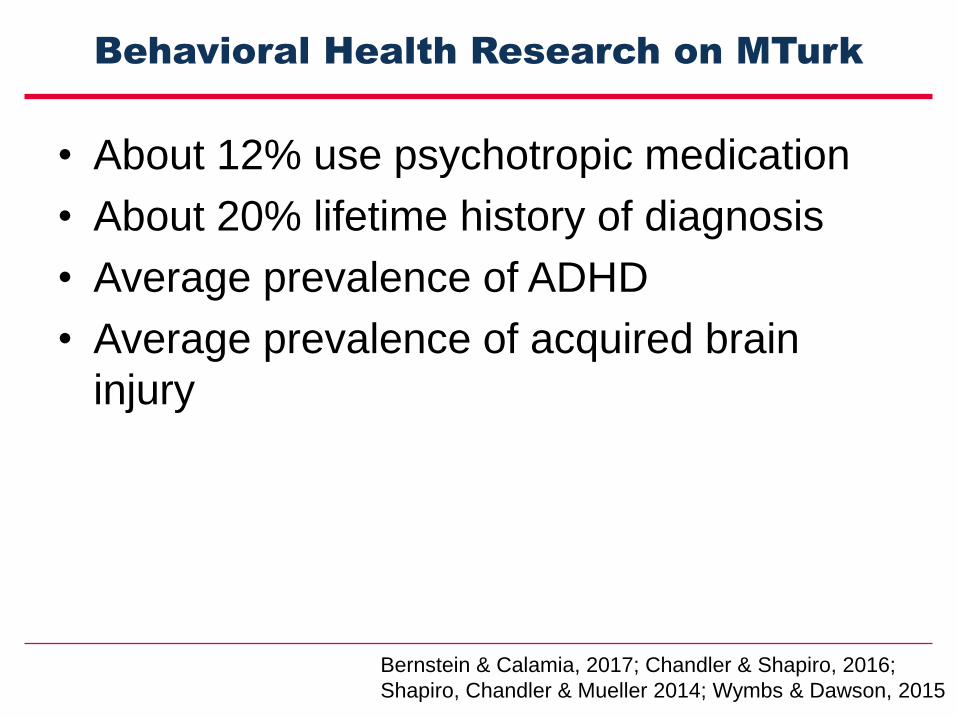
• About 12% use psychotropic medication
• About 20% lifetime history of diagnosis
• Average prevalence of ADHD
• Average prevalence of acquired brain
injury
Bernstein & Calamia, 2017; Chandler & Shapiro, 2016;
Shapiro, Chandler & Mueller 2014; Wymbs & Dawson, 2015
Behavioral Health Research on MTurk
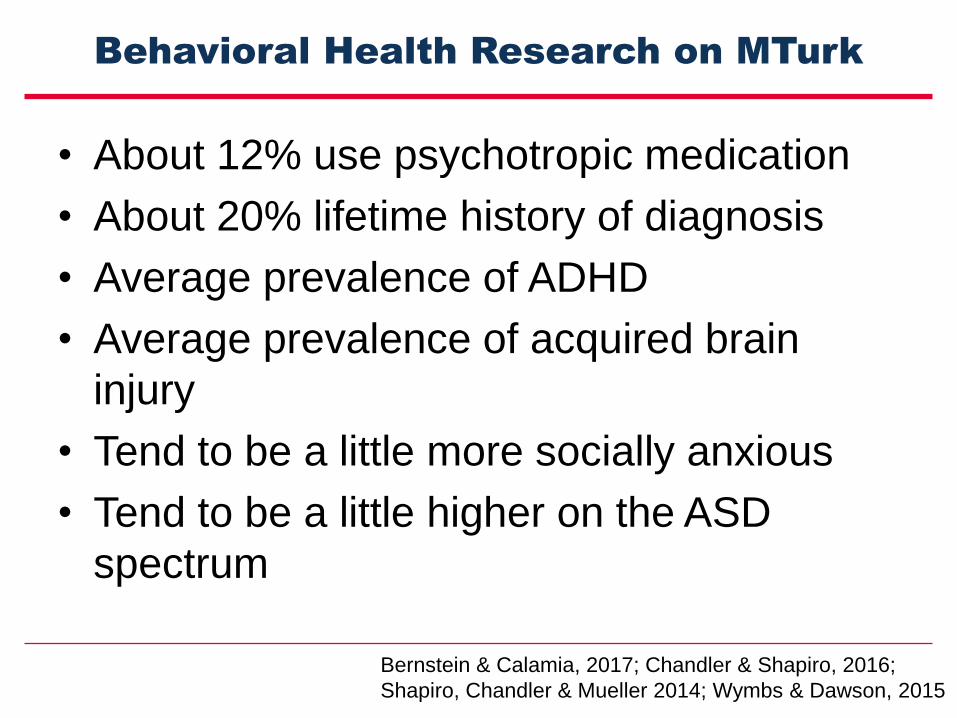
• About 12% use psychotropic medication
• About 20% lifetime history of diagnosis
• Average prevalence of ADHD
• Average prevalence of acquired brain
injury
• Tend to be a little more socially anxious
• Tend to be a little higher on the ASD
spectrum
Bernstein & Calamia, 2017; Chandler & Shapiro, 2016;
Shapiro, Chandler & Mueller 2014; Wymbs & Dawson, 2015
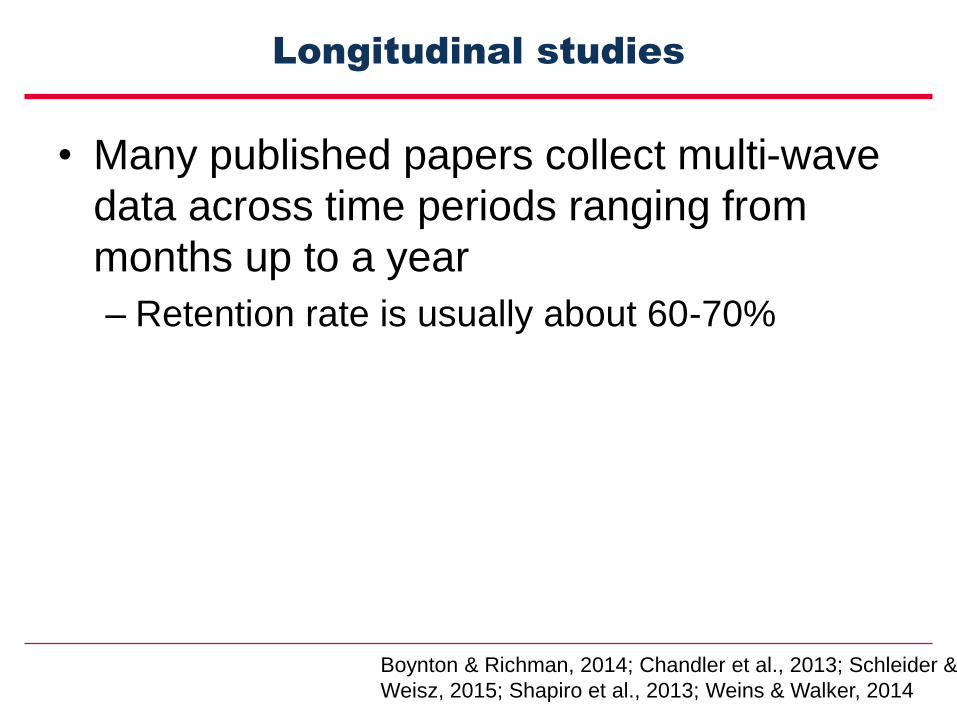
Longitudinal studies
• Many published papers collect multi-wave
data across time periods ranging from
months up to a year
– Retention rate is usually about 60-70%
Boynton & Richman, 2014; Chandler et al., 2013; Schleider &
Weisz, 2015; Shapiro et al., 2013; Weins & Walker, 2014
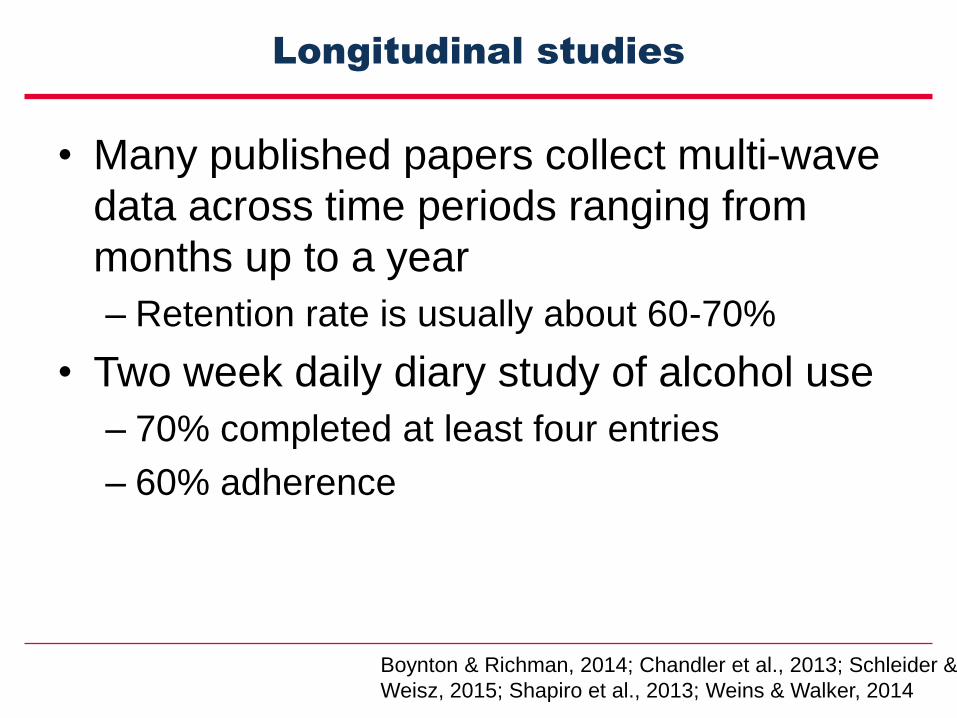
Longitudinal studies
• Many published papers collect multi-wave
data across time periods ranging from
months up to a year
– Retention rate is usually about 60-70%
• Two week daily diary study of alcohol use
– 70% completed at least four entries
– 60% adherence
Boynton & Richman, 2014; Chandler et al., 2013; Schleider &
Weisz, 2015; Shapiro et al., 2013; Weins & Walker, 2014
Content coding and judgment
• Annotation of text in forums (MacLean & Heer,
2013; Vlahovic et al., 2014)
• Speech pathology ratings (McAllister et al., 2014)
34
Workers as Research Assistants
Content coding and judgment
• Annotation of text in forums (MacLean & Heer,
2013; Vlahovic et al., 2014)
• Speech pathology ratings (McAllister et al., 2014)
Data collection
• Upload pictures of thermostats (Meier et al.,
2011)
• Upload letters about standardized testing (Chandler, unpublished data)
35
Workers as Research Assistants
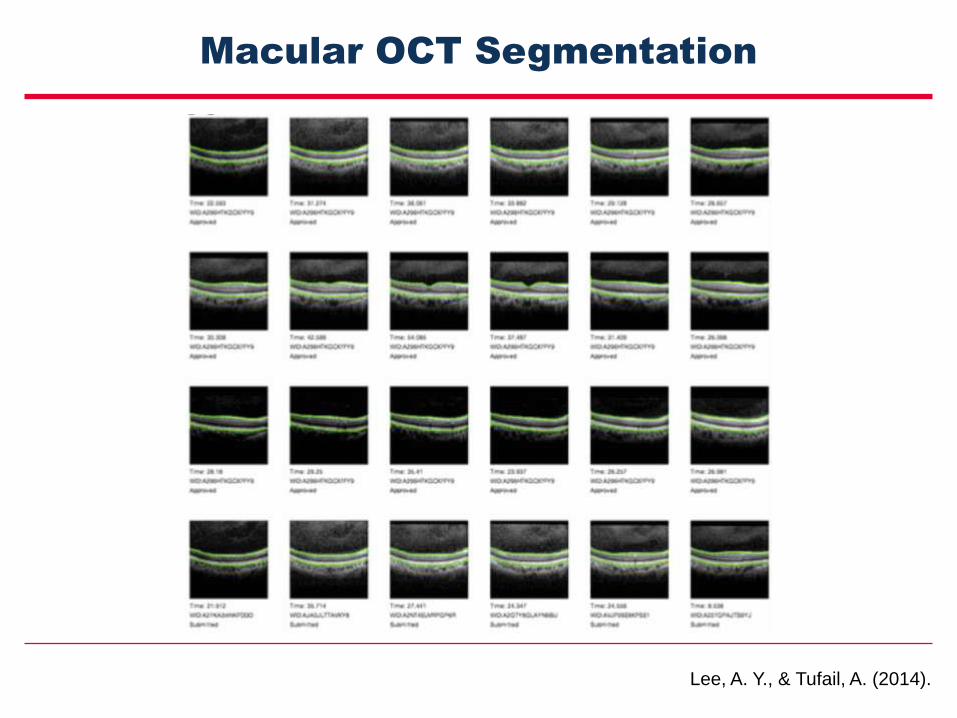
Macular OCT Segmentation
Lee, A. Y., & Tufail, A. (2014).
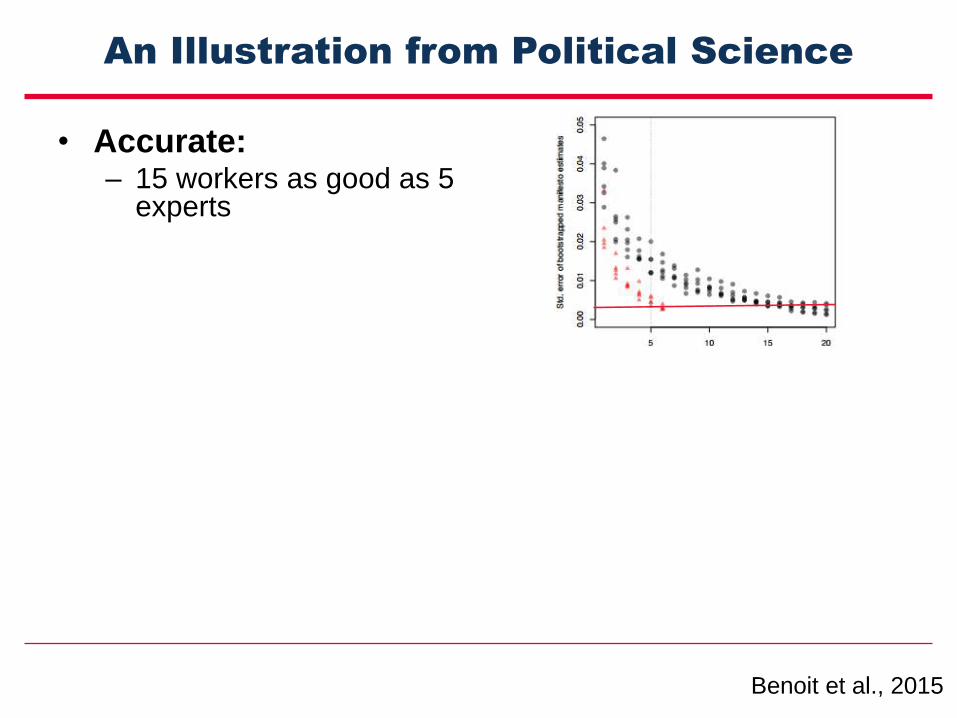
An Illustration from Political Science
• Accurate: – 15 workers as good as 5
experts
– Worker and expert ratings, r = .96
• Fast: 22,000 statements in 5hours
• Cost Effective: Total cost of $1080
• Elastic: Scaled up or down quickly
• DIY: Anybody can replicate it
Benoit et al., 2015
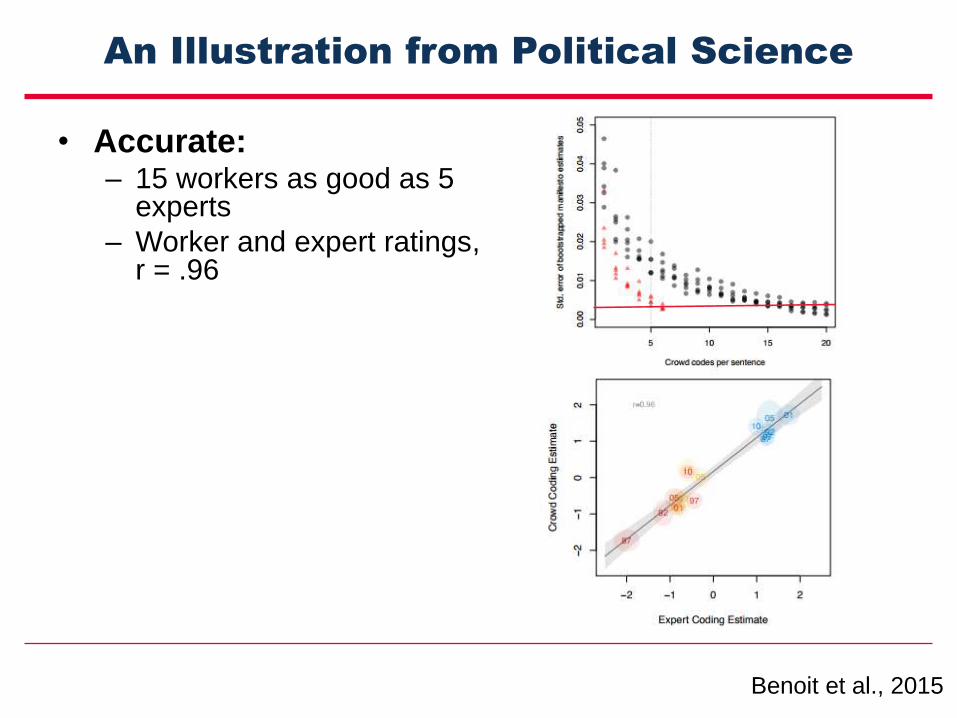
An Illustration from Political Science
• Accurate: – 15 workers as good as 5
experts
– Worker and expert ratings, r = .96
• Fast: 22,000 statements in 5hours
• Cost Effective: Total cost of $1080
• Elastic: Scaled up or down quickly
• DIY: Anybody can replicate it
Benoit et al., 2015
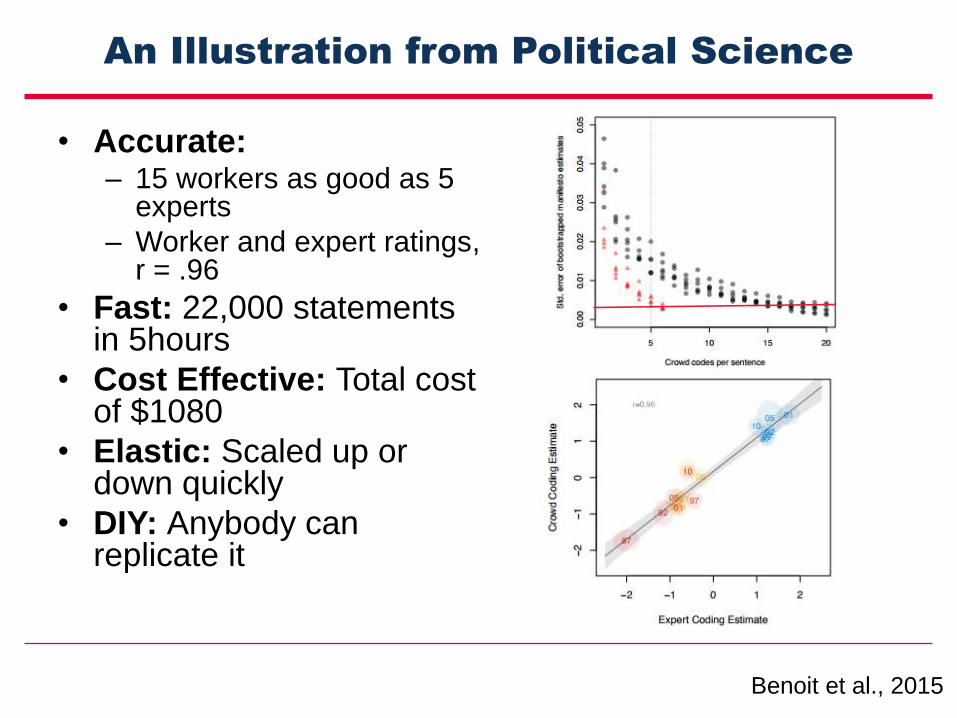
An Illustration from Political Science
• Accurate: – 15 workers as good as 5
experts
– Worker and expert ratings, r = .96
• Fast: 22,000 statements in 5hours
• Cost Effective: Total cost of $1080
• Elastic: Scaled up or down quickly
• DIY: Anybody can replicate it
Benoit et al., 2015
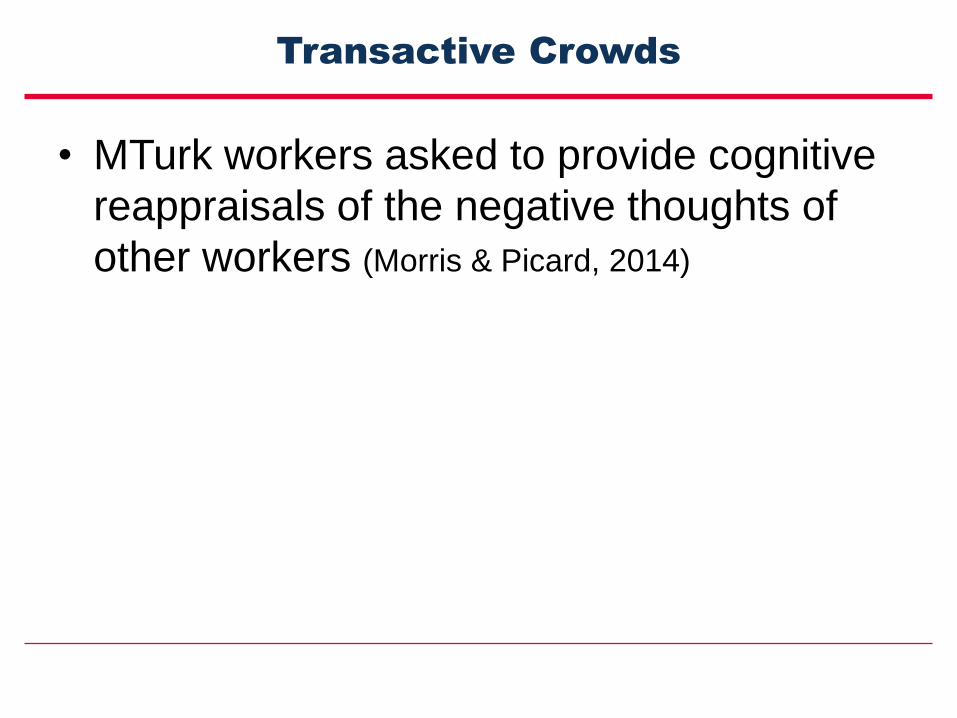
Transactive Crowds
• MTurk workers asked to provide cognitive
reappraisals of the negative thoughts of
other workers (Morris & Picard, 2014)
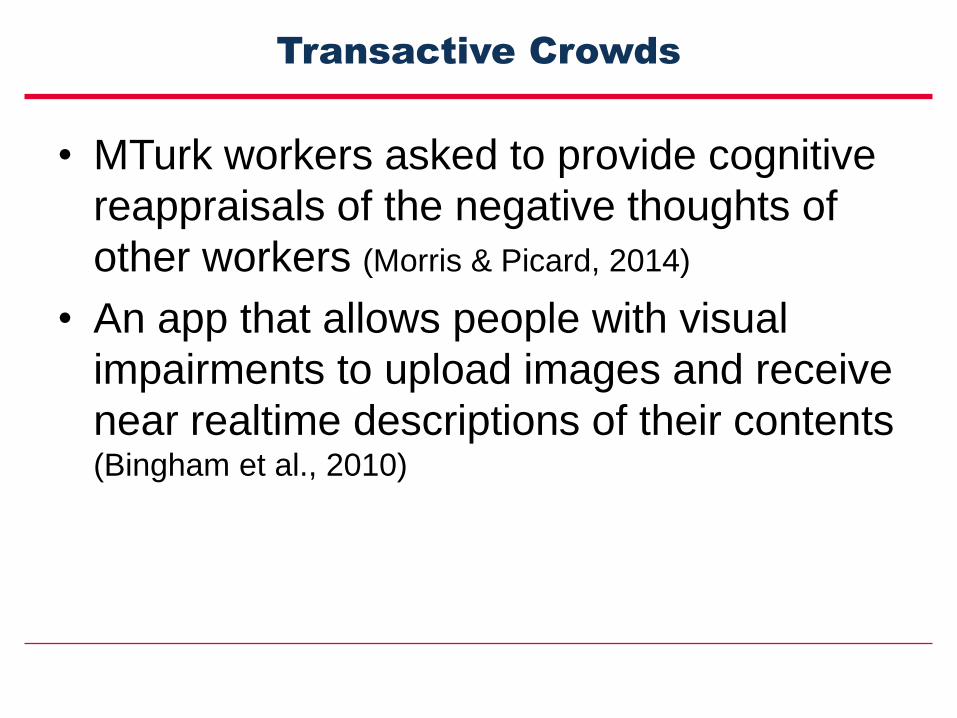
Transactive Crowds
• MTurk workers asked to provide cognitive
reappraisals of the negative thoughts of
other workers (Morris & Picard, 2014)
• An app that allows people with visual
impairments to upload images and receive
near realtime descriptions of their contents(Bingham et al., 2010)
Data Quality Issues
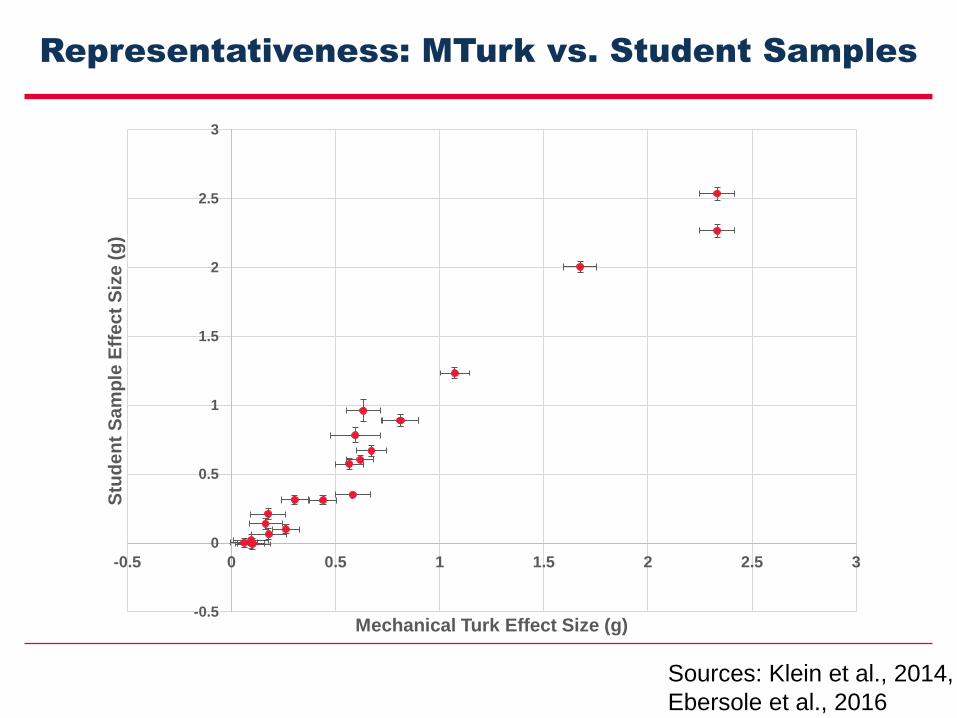
Representativeness: MTurk vs. Student Samples
-0.5
0
0.5
1
1.5
2
2.5
3
-0.5 0 0.5 1 1.5 2 2.5 3
Stu
de
nt
Sa
mp
le E
ffe
ct
Siz
e (
g)
Mechanical Turk Effect Size (g)
Sources: Klein et al., 2014,
Ebersole et al., 2016
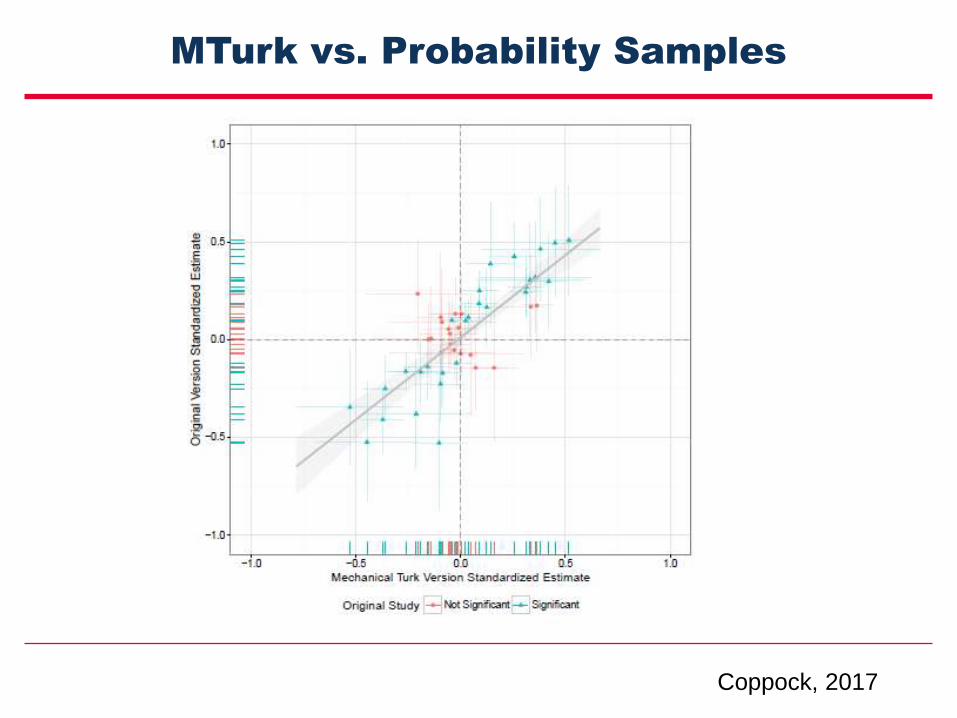
MTurk vs. Probability Samples
Coppock, 2017
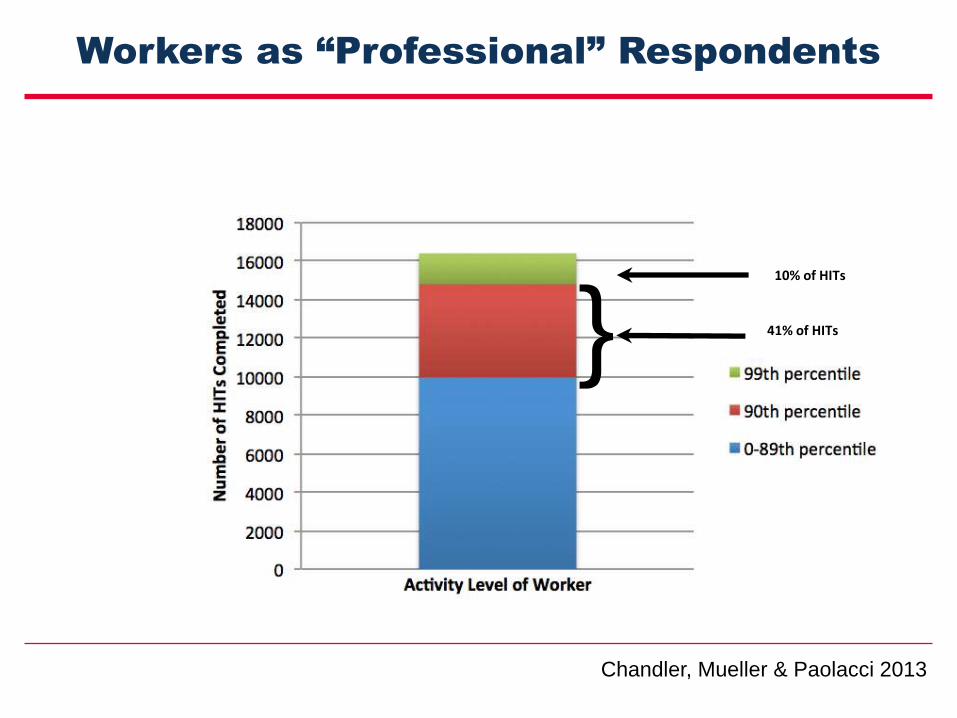
Workers as “Professional” Respondents
10% of HITs
41% of HITs}
Chandler, Mueller & Paolacci 2013
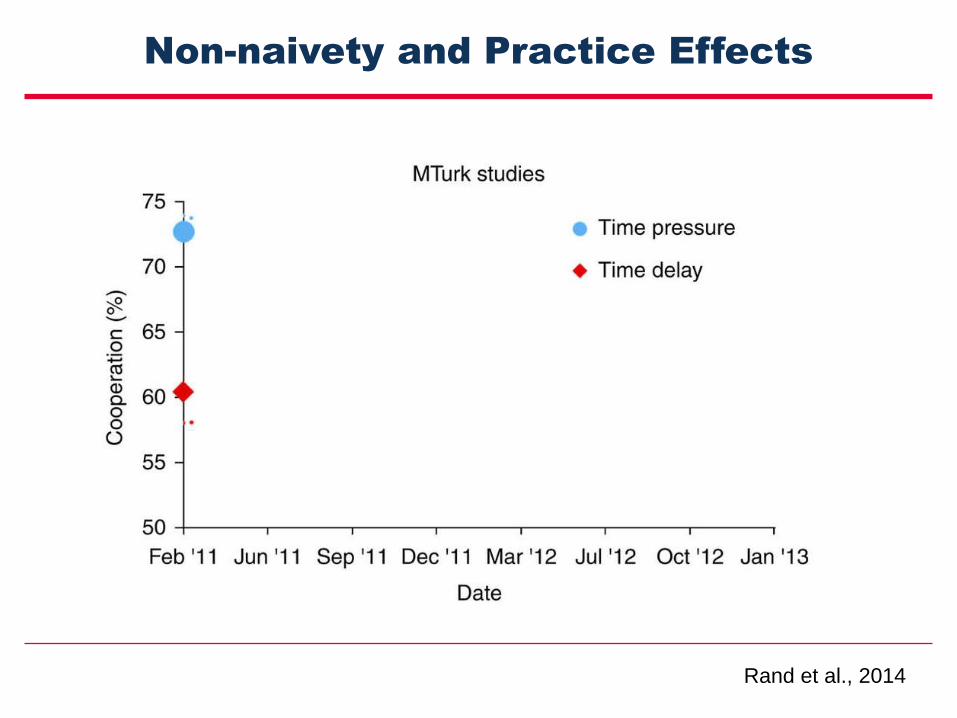
Non-naivety and Practice Effects
Rand et al., 2014
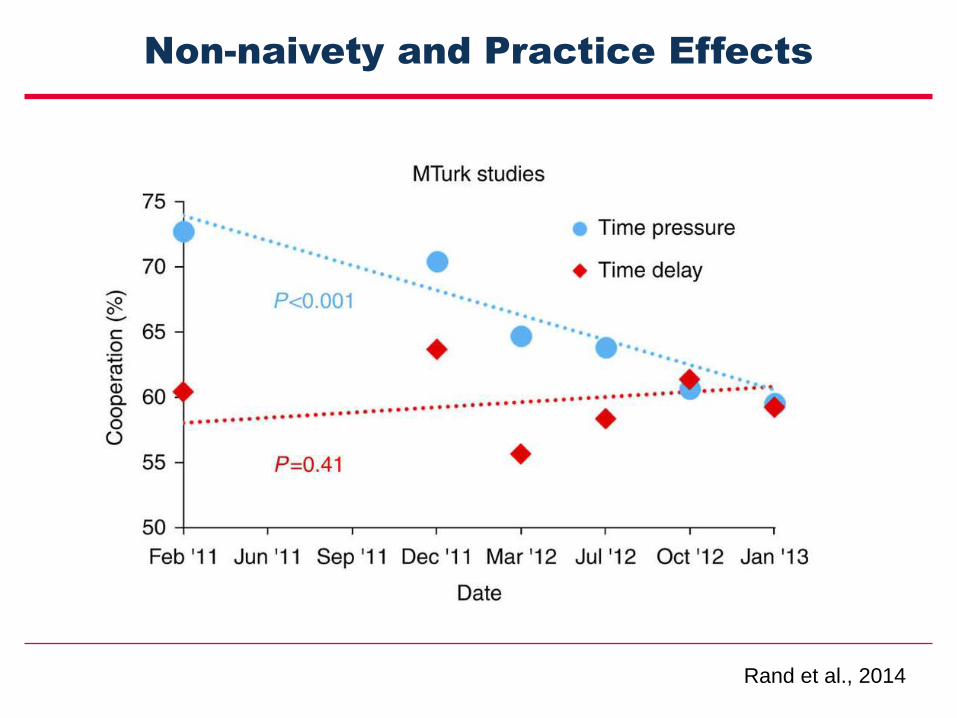
Non-naivety and Practice Effects
Rand et al., 2014
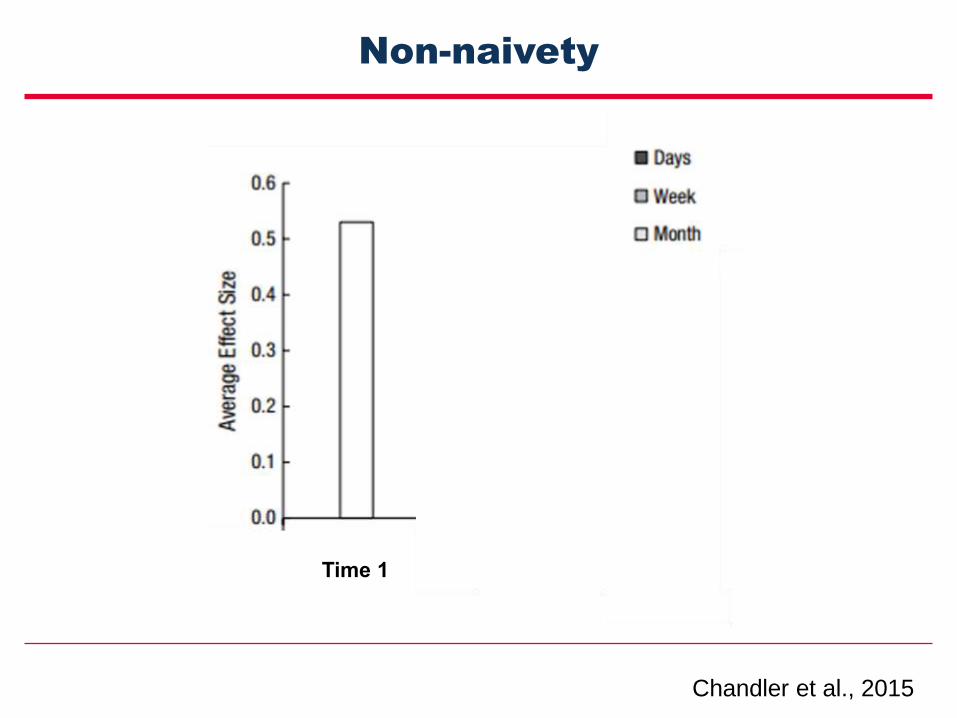
Non-naivety
Time 1
Chandler et al., 2015
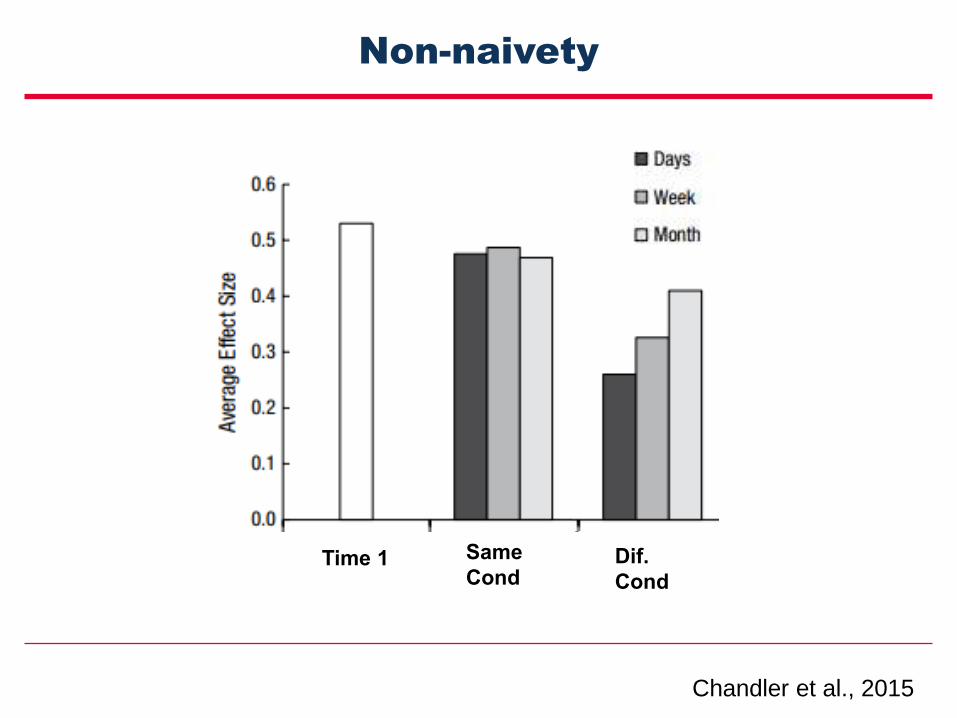
Non-naivety
Time 1 Same
CondDif.
Cond
Chandler et al., 2015
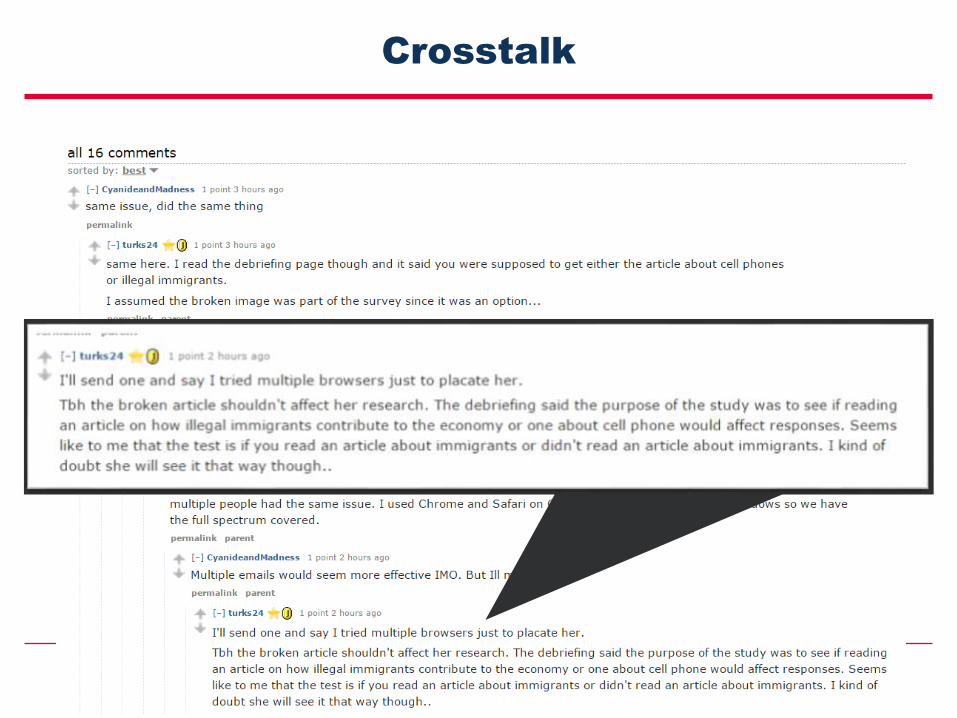
Crosstalk
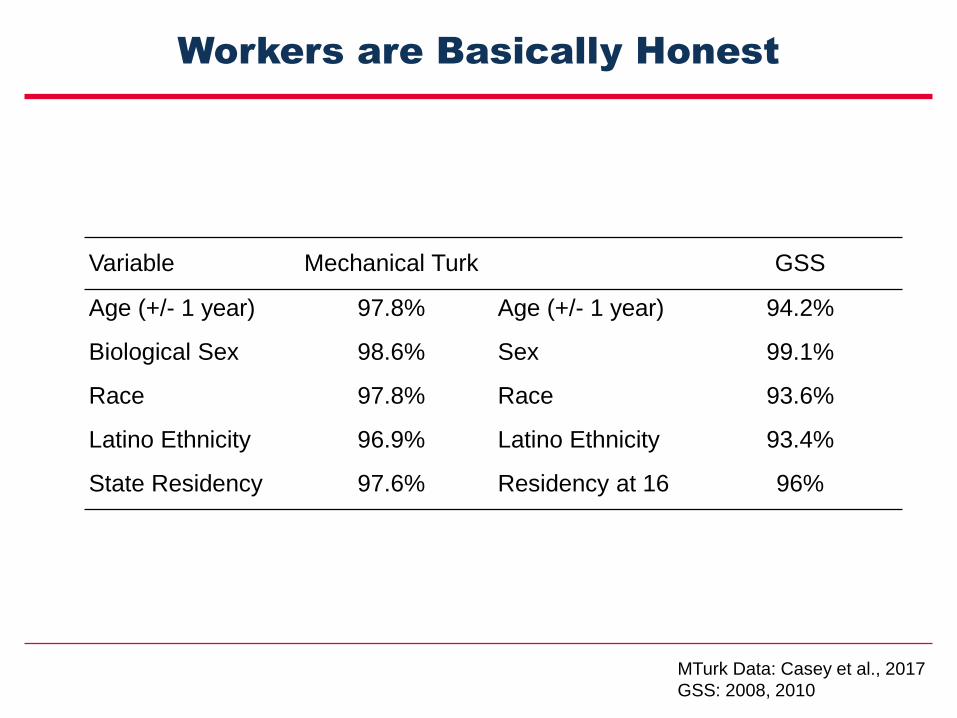
Workers are Basically Honest
Variable Mechanical Turk GSS
Age (+/- 1 year) 97.8% Age (+/- 1 year) 94.2%
Biological Sex 98.6% Sex 99.1%
Race 97.8% Race 93.6%
Latino Ethnicity 96.9% Latino Ethnicity 93.4%
State Residency 97.6% Residency at 16 96%
MTurk Data: Casey et al., 2017
GSS: 2008, 2010
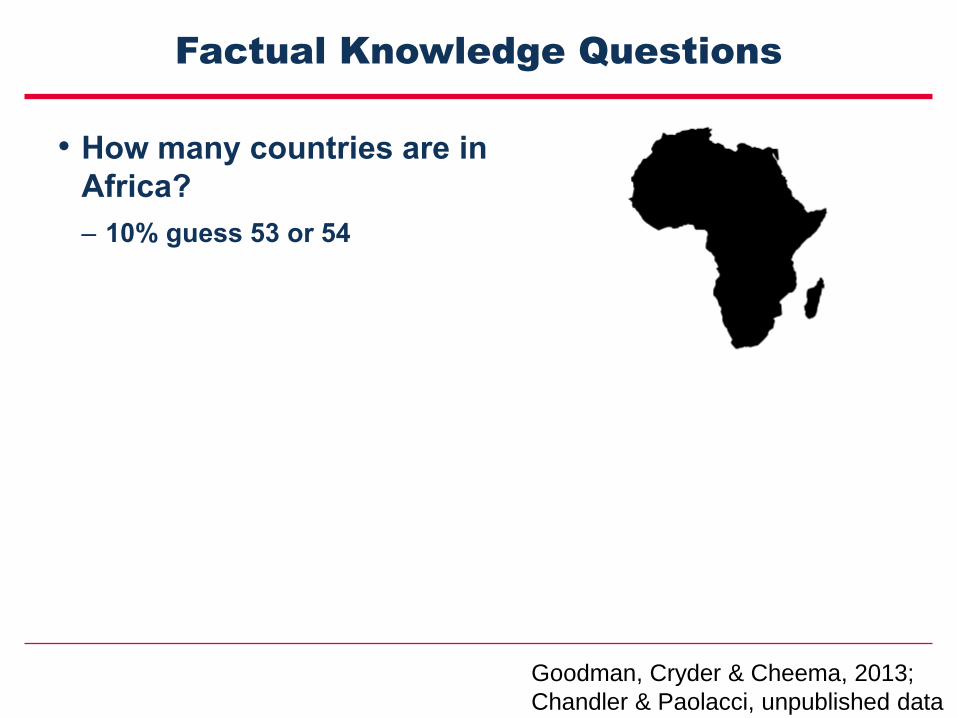
Factual Knowledge Questions
• How many countries are in
Africa?
– 10% guess 53 or 54
Goodman, Cryder & Cheema, 2013;
Chandler & Paolacci, unpublished data
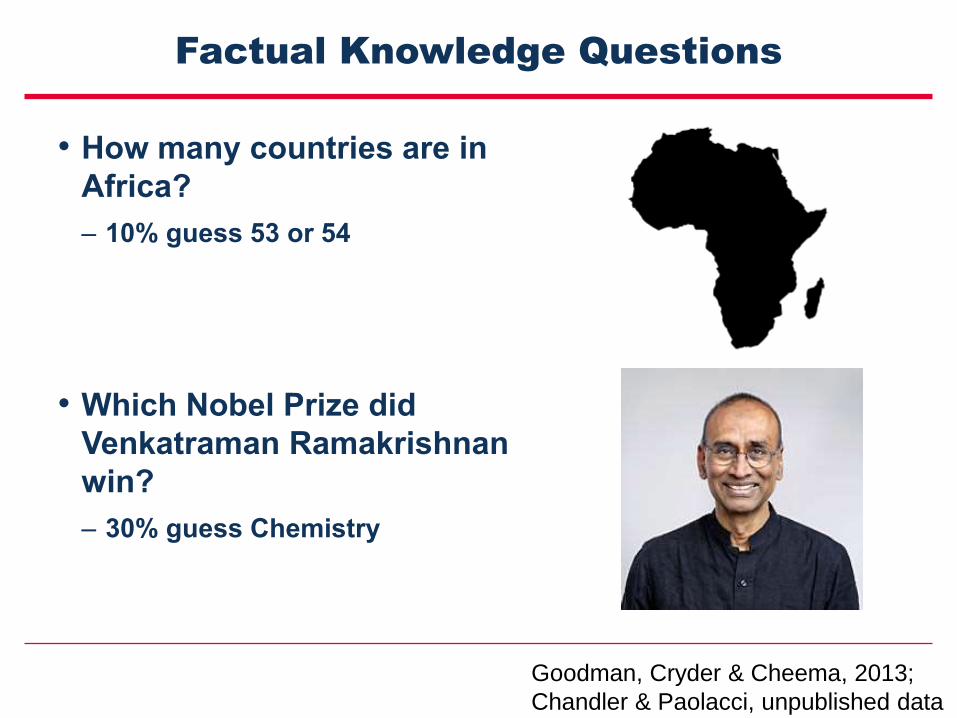
Factual Knowledge Questions
• How many countries are in
Africa?
– 10% guess 53 or 54
• Which Nobel Prize did
Venkatraman Ramakrishnan
win?
– 30% guess Chemistry
Goodman, Cryder & Cheema, 2013;
Chandler & Paolacci, unpublished data
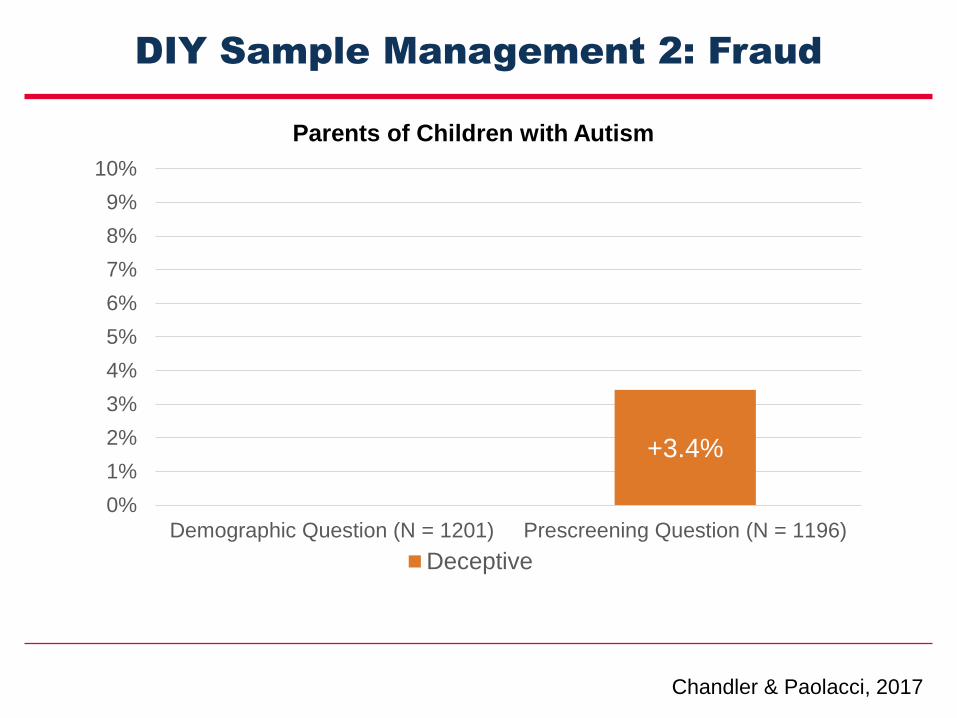
DIY Sample Management 2: Fraud
+3.4%
0%
1%
2%
3%
4%
5%
6%
7%
8%
9%
10%
Demographic Question (N = 1201) Prescreening Question (N = 1196)
Deceptive
Chandler & Paolacci, 2017
Parents of Children with Autism
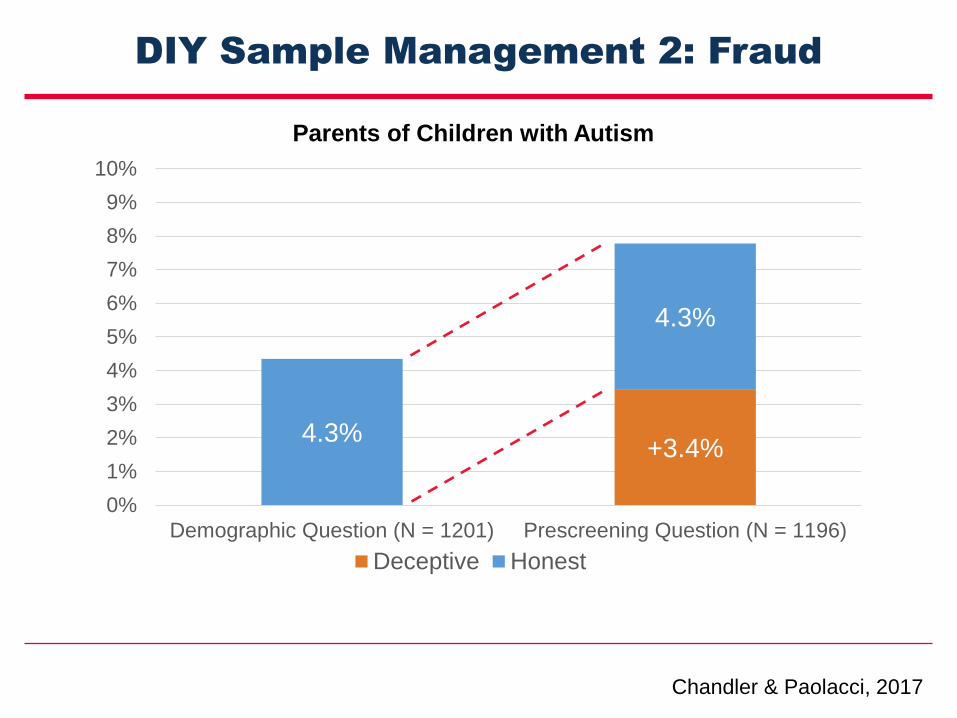
DIY Sample Management 2: Fraud
+3.4%4.3%
4.3%
0%
1%
2%
3%
4%
5%
6%
7%
8%
9%
10%
Demographic Question (N = 1201) Prescreening Question (N = 1196)
Deceptive Honest
Chandler & Paolacci, 2017
Parents of Children with Autism
Potential Consequences of Fraud
• People might respond to subsequent questions
truthfully, adding noise to any measurements
• People respond to subsequent questions using a lay
theory about how they “should” respond
Wessling-Sharpe, Huber & Netzer, 2017
Potential Consequences of Fraud
• People might respond to subsequent questions
truthfully, adding noise to any measurements
• People might respond to subsequent questions using
a lay theory about how they “should” respond
Wessling-Sharpe, Huber & Netzer, 2017
Potential Consequences of Fraud
• People might respond to subsequent questions
truthfully, adding noise to any measurements
• People might respond to subsequent questions using
a lay theory about how they “should” respond
Wessling-Sharpe, Huber & Netzer, 2017
When “Good Enough” is Good Enough
• Would I have used a non-probability sample to begin with?
• Will representative sample study design discussions be more effective if I have data?
• Do I need a way to prioritize which treatments I decide to test or not test?
• If a treatment has an impact, would I act differently if I learned that it was 15% smaller or lower than I had initially observed?
• Is there a better ROI for an answer that is +/-15% for 1/10th the cost and in 1/10th the time?
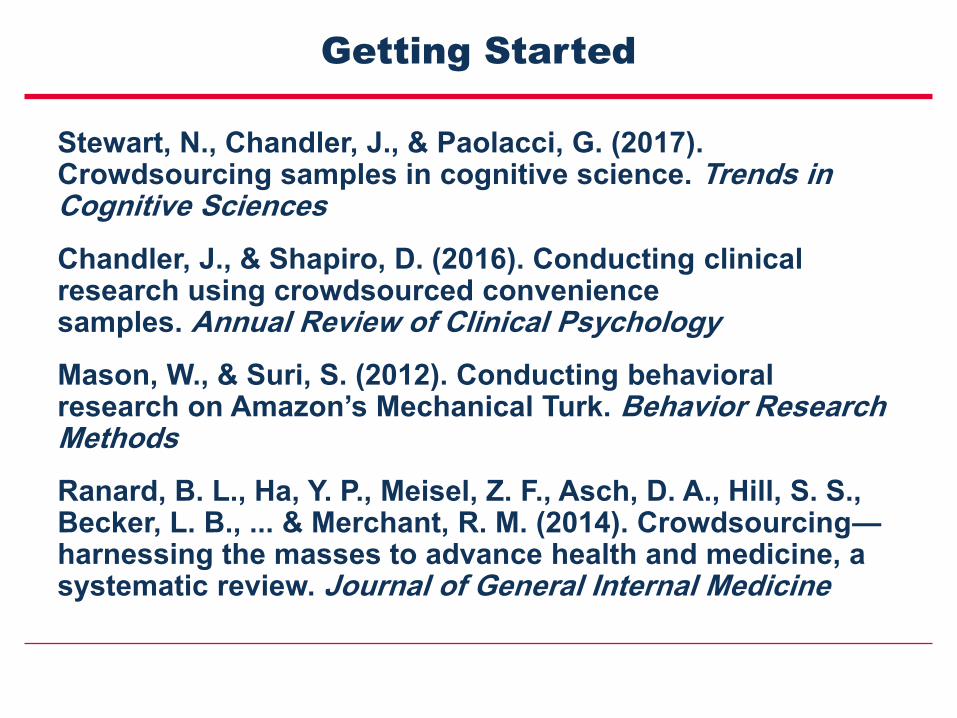
Getting Started
Stewart, N., Chandler, J., & Paolacci, G. (2017). Crowdsourcing samples in cognitive science. Trends in Cognitive Sciences
Chandler, J., & Shapiro, D. (2016). Conducting clinical research using crowdsourced convenience samples. Annual Review of Clinical Psychology
Mason, W., & Suri, S. (2012). Conducting behavioral research on Amazon’s Mechanical Turk. Behavior Research Methods
Ranard, B. L., Ha, Y. P., Meisel, Z. F., Asch, D. A., Hill, S. S., Becker, L. B., ... & Merchant, R. M. (2014). Crowdsourcing—harnessing the masses to advance health and medicine, a systematic review. Journal of General Internal Medicine
Q u e s t i o n s
Program director: Katja Reuter, PhD
Email: [email protected]
Twitter: @dmsci
Next Digital Scholar Webinar
I n f o r m a t i o n a b o u t
t h e p r o g r a m
http://sc-ctsi.org/digital-scholar/
Oct 4, 2017 | 12-1PM PST
Topic: Disseminating scientific papers via Twitter: Practical
insights and research evidence
Speaker: Stefanie Haustein, PhD, Assistant Professor, School
of Information Studies, University of Ottawa
Register at: sc-ctsi.org/digital-scholar/register
Recommended