Regulatory and Supervisory Framework
Susanta Kumar DasFebruary 27, 2017
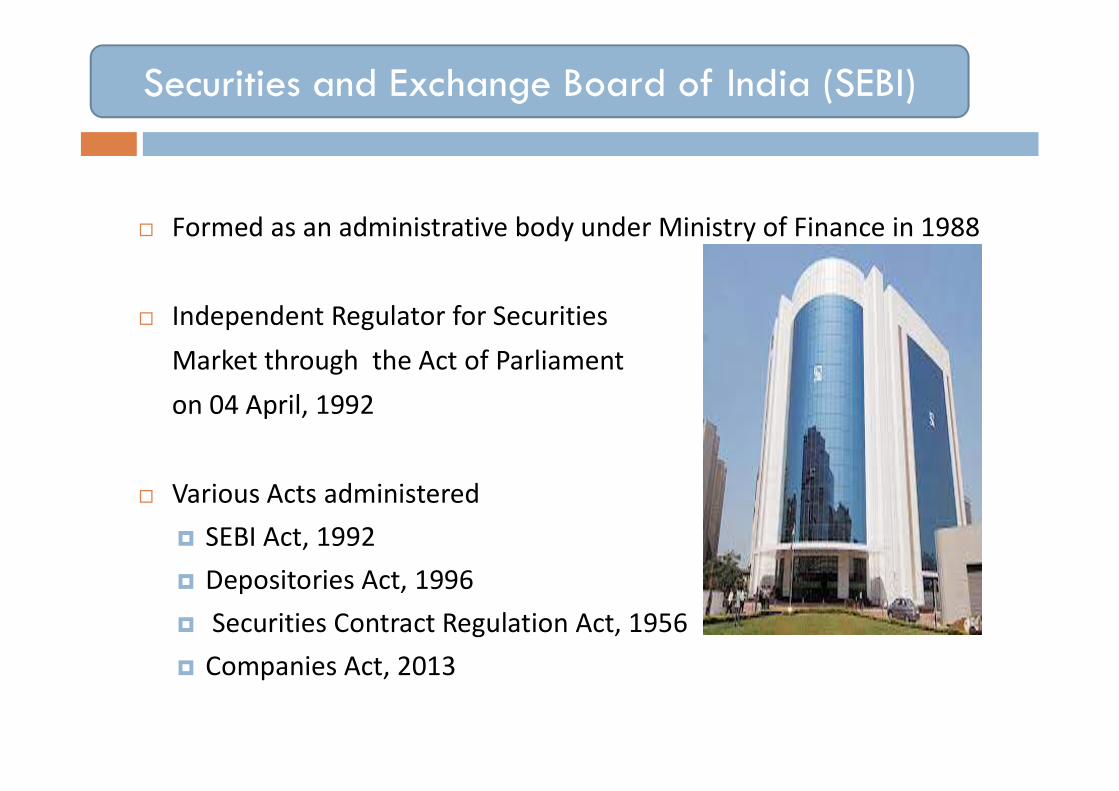
Securities and Exchange Board of India (SEBI)
Formed as an administrative body under Ministry of Finance in 1988
Independent Regulator for SecuritiesMarket through the Act of Parliamenton 04 April, 1992
Various Acts administered SEBI Act, 1992 Depositories Act, 1996 Securities Contract Regulation Act, 1956 Companies Act, 2013

Preamble to SEBI Act, 1992
Investor protection
Regulation of securities market
Development of securities market
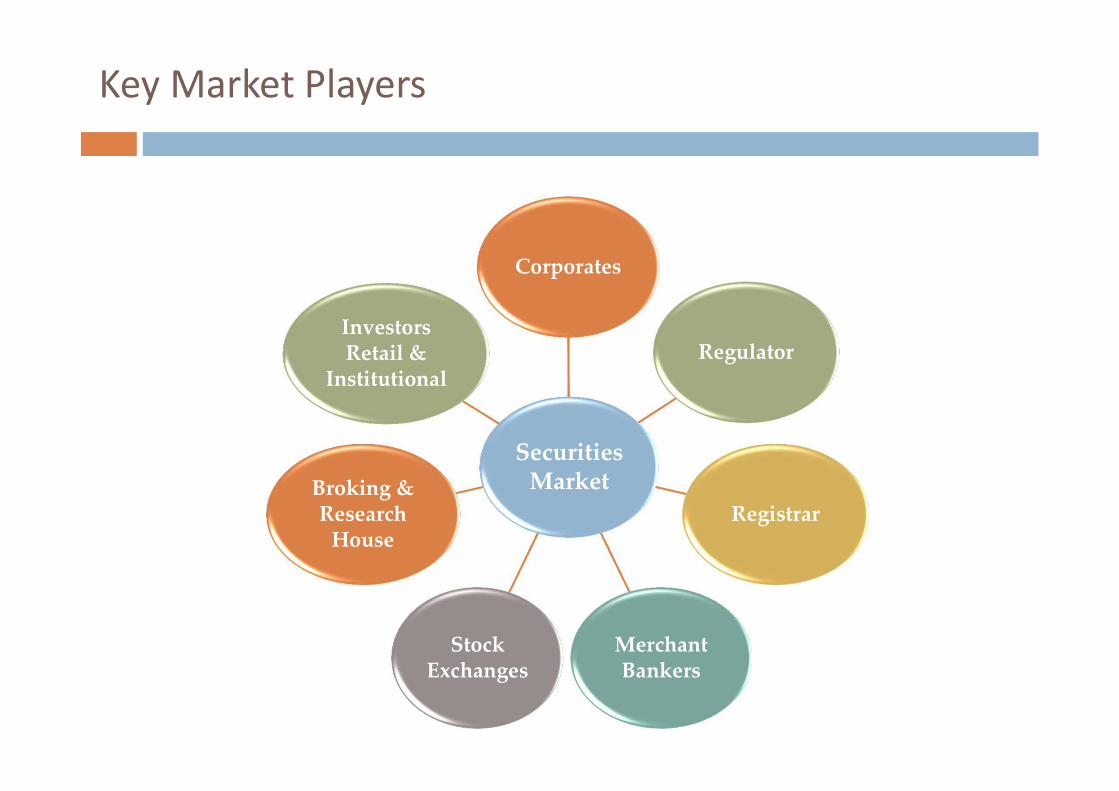
Key Market Players
4
Securities Market
Corporates
Regulator
Registrar
Merchant Bankers
Stock Exchanges
Broking & Research
House
Investors Retail &
Institutional

Key Market Players
5
Participants Numbers
Stock Exchanges 3
Registered Brokers 3200
Registered Sub-Brokers 32000
Mutual Funds 51
Depositories 2
Depository Participants 853
Clearing Corporations 3

Key Statistics
6
NSE BSE
No. of Listed Companies 1847 5102
Market Capitalization (USD in billion) (As on 31.01.2017)
1625 1655
Average daily turnover (Cash during January, 2017) (USD in billion)
3.28 0.45
Turnover (F&O during January, 2017) (USD in billion)
58.16 -
No. of Trades (Cash segment- in million) as on February 21, 2017
7.8 1.5

MARKET REGULATION DEPARTMENT

Market Regulation Department
Division of Risk Management and New Products Division of Self Regulatory Organisations (SRO) Administration-
Registration, recognition and administration of depositories and stock exchanges
Division of Market Supervision – Inspection of MIIs Investor Complaints Cell Division of Policy
Slide 8

Corporate Bond Market
Slide 9

Statistics on corporate bond market for primary issuances
Slide 10
0
500
1000
1500
2000
2500
3000
3500
0
10000
20000
30000
40000
50000
60000
70000
80000
2007-08 2008-09 2009-10 2010-11 2011-12 2012-13 2013-14 2014-15 2015-16 2016-17
in U
SD m
illio
n
Year
Statistics on Private Placement
Amount Raised through Private Placement (USDmillion)
No. of Pvt. Placement
0
5
10
15
20
25
30
35
40
0
1000
2000
3000
4000
5000
6000
7000
in U
SD m
illio
n
Year
Statistics on Public Issues
Amount Raised through Public Issue (USDmillion)
No. of Public Issues

Statistics on corporate bond market for primary issuances
Slide 11
17424
25703
3163833564
43661
55654
46829
60860
7233674403
0
10000
20000
30000
40000
50000
60000
70000
80000
2007-08 2008-09 2009-10 2010-11 2011-12 2012-13 2013-14 2014-15 2015-16 2016-17
in U
SD m
illio
n
Year
Total Amount Raised through Public Issue and Pvt. Placement (USD million)
Total Amount Raised through Public Issue and Pvt. Placement (USD million)

Corporate Bond Share in Total outstanding Debt
Slide 12
71.8% 69.7% 69.5% 66.8% 65.5%
9.4% 10.7% 11.1%12.1% 12.1%
18.7% 19.6% 19.3% 21.1% 22.4%
0%
20%
40%
60%
80%
100%
Mar-12 Mar-13 Mar-14 Mar-15 Mar-16
Bank Credit External commercial borrowings Corporate bonds and commercial papers

Corporate Bond Share in Incremental lending
Slide 13
64.6%56.9%
68.6%
45.7%52.8%
17.7%
18.1%
14.1%
19.5%12.3%
17.7%25.0%
17.3%
34.8% 34.9%
0%
20%
40%
60%
80%
100%
Mar-12 Mar-13 Mar-14 Mar-15 Mar-16
Bank Credit External commercial borrowings Corporate bonds and commercial papers

Investment in Different Category of Corporate Bond
Slide 14
0%
10%
20%
30%
40%
50%
60%
70%
80%
2011-12 2012-13 2012-13 2013-14 2014-15 2015-16 2016-17 (Sept 16)
Investment in Different Category of Corporate Bond
AAA AA+ AA AA- & Below Not Rated

Features of Corporate Bond Market
Dominated by private placements; Limited investor base; Small outstanding stock of Individual issuances; Structural incentives for borrowers to prefer bank financing
Slide 15

Recent measures to develop bond market
Market making scheme to improve market liquidity; Electronic auction platform for transparent private placements; Integrated trade repository; Introduction of corporate bond index; Credit enhancement for corporate bonds; Enhancing Credit Supply for Large Borrowers through Market
Mechanism Enactment of Bankruptcy Code
Slide 16

Measures which are in the pipeline
Repo in Corporate bonds; Rationalization of investment restrictions; Consolidation and re-issuance of corporate bonds
Slide 17

Securities Lending and Borrowing Mechanism
Slide 18

SLB- Concept
Temporary loan between lender and borrower Securitites are transferred from the borrower to the lender for a
fee. Borrower has to return the securities either on demand or at the
end of agreed term or has an option to early return Lender may recall securities at any time Promotes market efficiency and liquidity Lenders’ motivation- incremental return on an idle portfolio Borrowers’ motivation- to cover a short position- avoid settlement
failures Hedging of futures and option position
19

Participants
Lender Insurance Companies Banks HNIs Mutual Funds Retail Investors
Borrowers Borrowers Short term sellers especially long term shorts Cash and derivative arbitragers Market makers Retail Investors 20

Salient features
Automated screen based trading platform with online matching of trades based on price-time priority
Contracts upto 1 year (12 monthly contracts) Early return and recall Settlement guarantee with clearing corporations acting as Central
Counterparties (CCP).
21
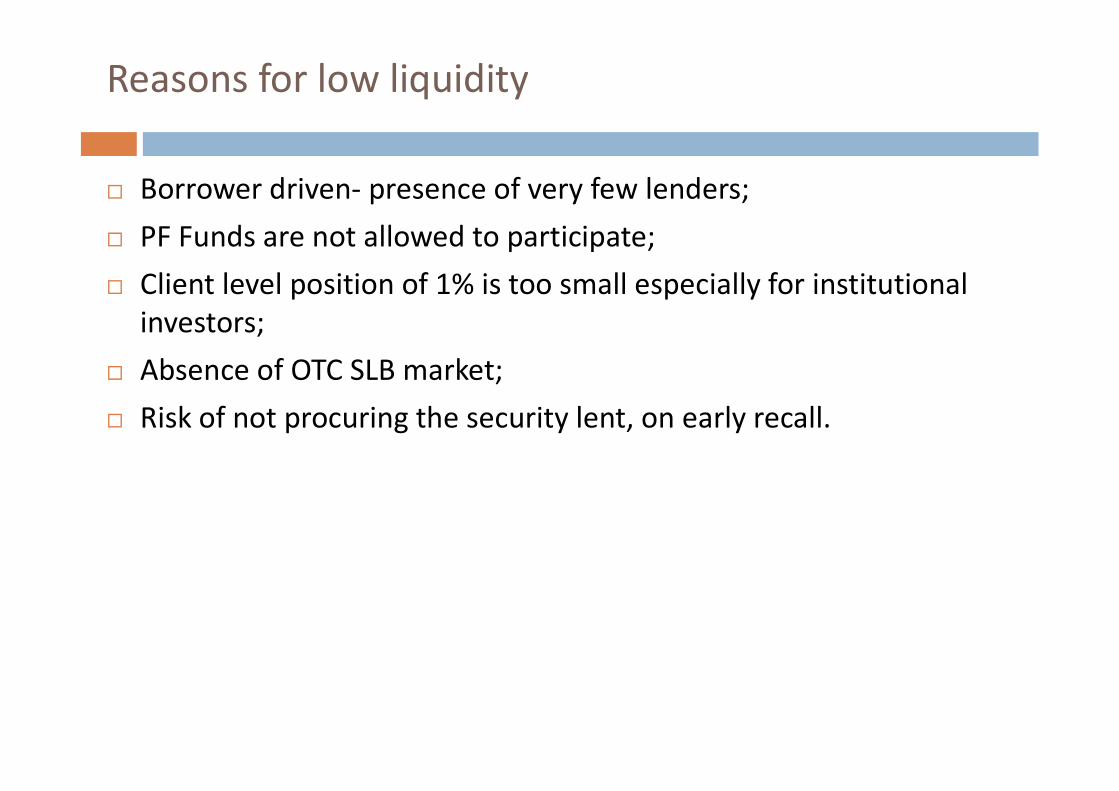
Reasons for low liquidity
Borrower driven- presence of very few lenders; PF Funds are not allowed to participate; Client level position of 1% is too small especially for institutional
investors; Absence of OTC SLB market; Risk of not procuring the security lent, on early recall.
22

Thank You
23
Recommended