Relating Winter Weather to Societal Impact
Brian Cerruti
1
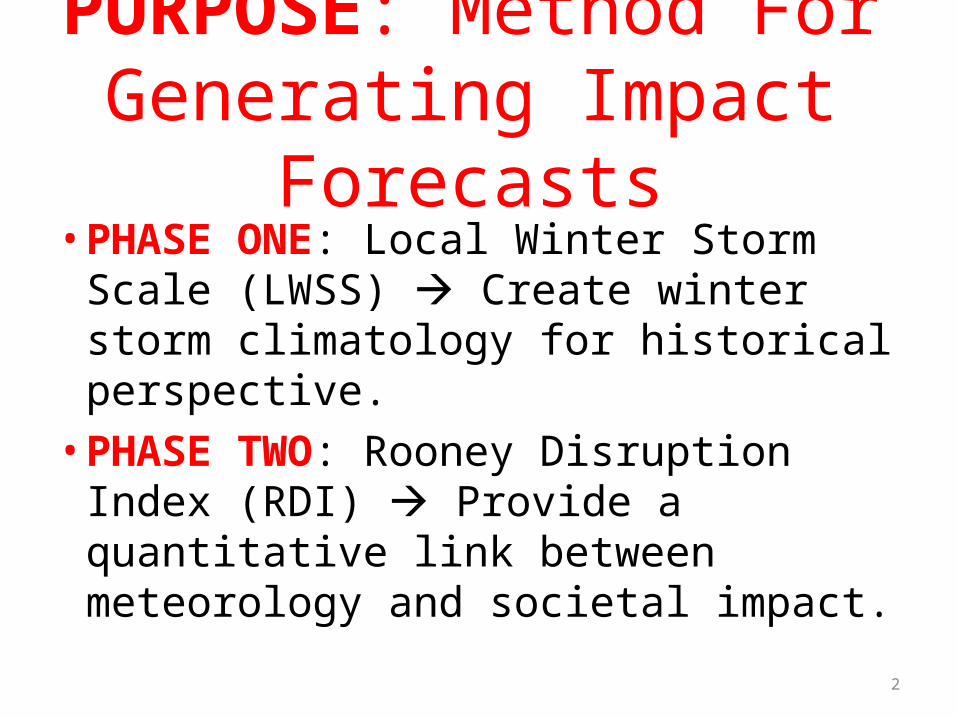
PURPOSE: Method For Generating Impact Forecasts• PHASE ONE: Local Winter Storm
Scale (LWSS) Create winter storm climatology for historical perspective.• PHASE TWO: Rooney Disruption
Index (RDI) Provide a quantitative link between meteorology and societal impact.
2
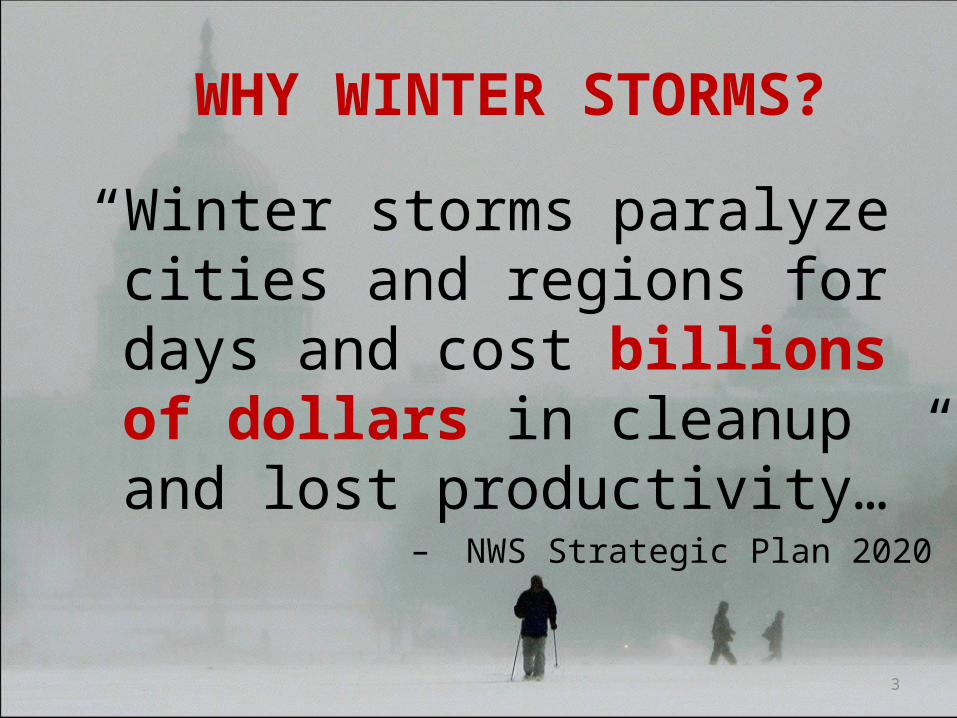
WHY WINTER STORMS?
“Winter storms paralyze cities and regions for days and cost billions of dollars in cleanup and lost productivity…”
–NWS Strategic Plan 2020
3
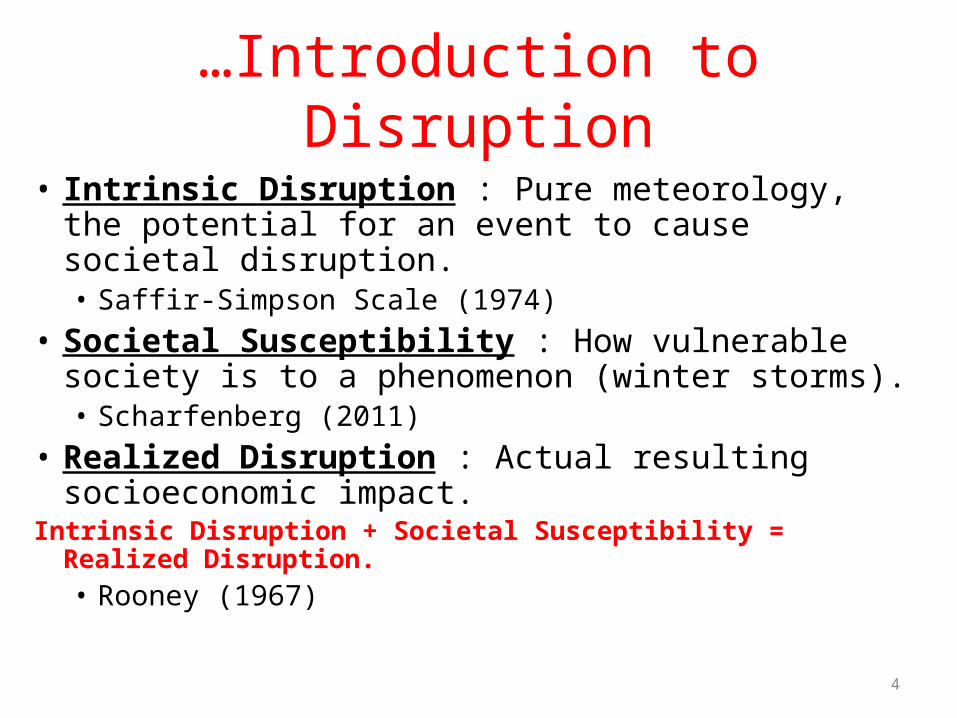
…Introduction to Disruption
• Intrinsic Disruption : Pure meteorology, the potential for an event to cause societal disruption.• Saffir-Simpson Scale (1974)
• Societal Susceptibility : How vulnerable society is to a phenomenon (winter storms).• Scharfenberg (2011)
• Realized Disruption : Actual resulting socioeconomic impact.
Intrinsic Disruption + Societal Susceptibility = Realized Disruption.• Rooney (1967)
4
National Weather Service Strategic Plan 2020 Focus: Impact-based Decision
Support Services
• Better understand the impact forecasts have on society focus NWS resources– Provide decision assistance to core partners (FAA,
DOT) during High Impact Events
• High Impact Event = A meteorological event that causes realized disruption.– Examples: Squall line, blizzard, light freezing rain
at rush hour5
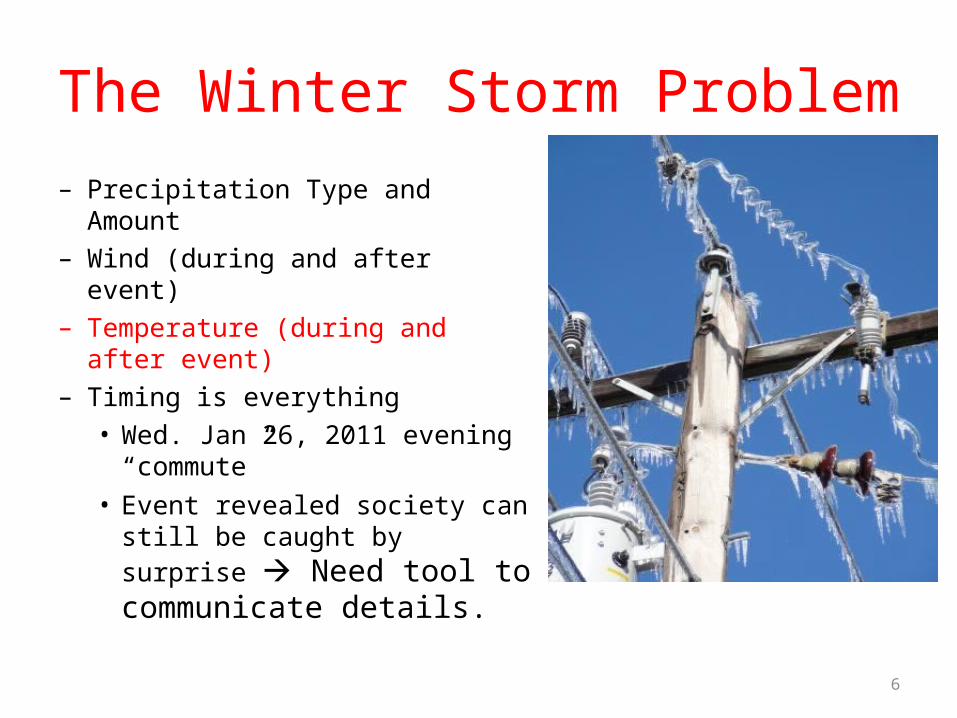
The Winter Storm Problem
– Precipitation Type and Amount– Wind (during and after event)– Temperature (during and after
event)– Timing is everything• Wed. Jan 26, 2011 evening
“commute”• Event revealed society can still
be caught by surprise Need tool to communicate details.
6
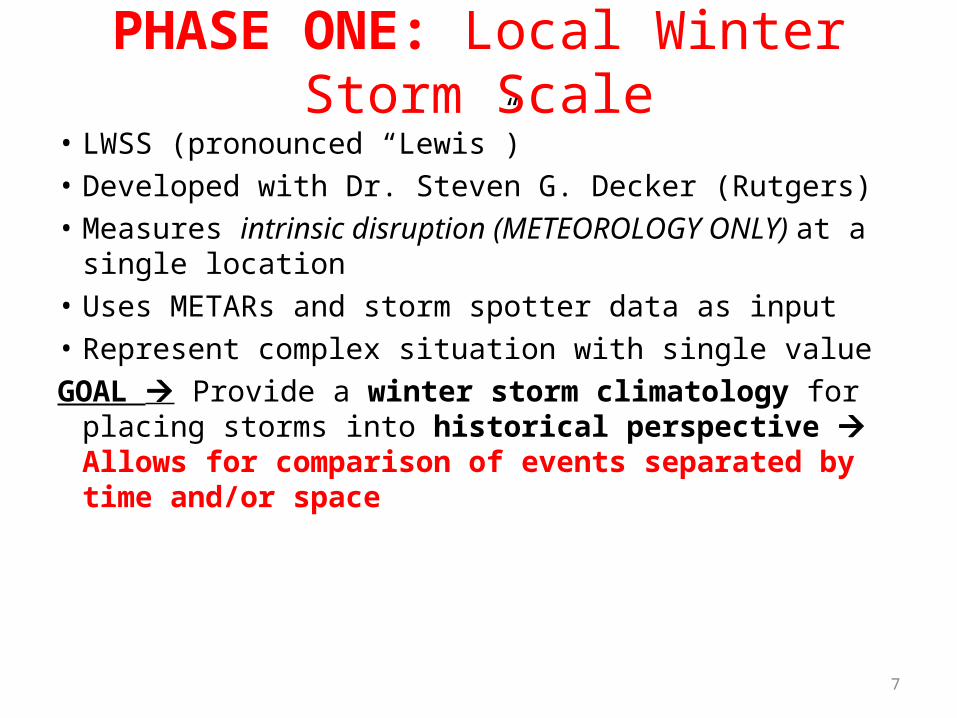
PHASE ONE: Local Winter Storm Scale• LWSS (pronounced “Lewis”)• Developed with Dr. Steven G. Decker (Rutgers)• Measures intrinsic disruption (METEOROLOGY ONLY) at
a single location• Uses METARs and storm spotter data as input• Represent complex situation with single valueGOAL Provide a winter storm climatology for placing
storms into historical perspective Allows for comparison of events separated by time and/or space
7
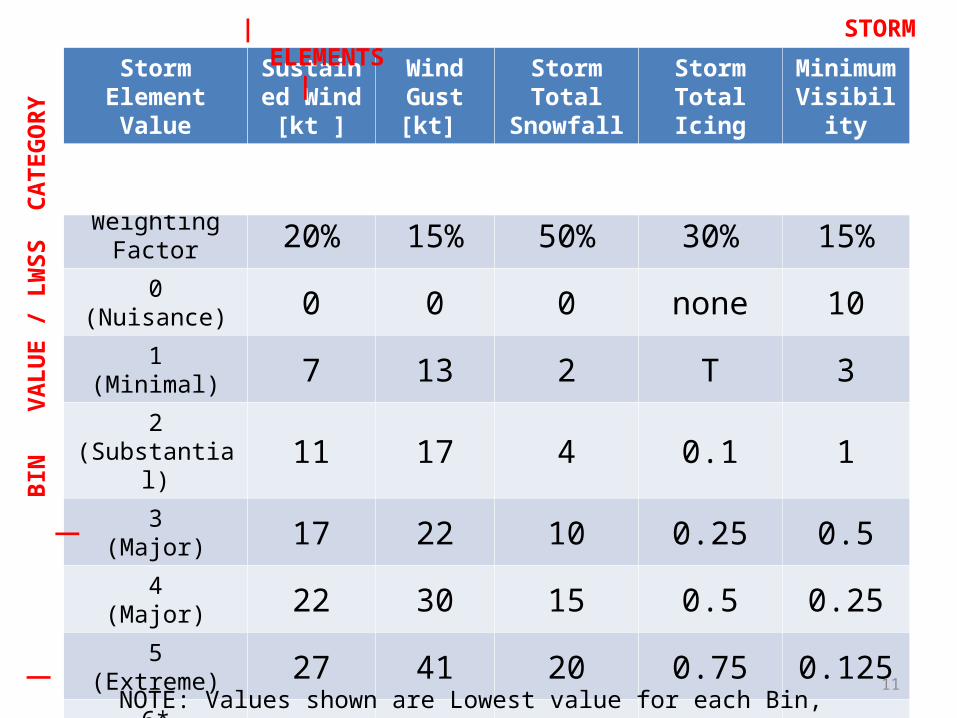
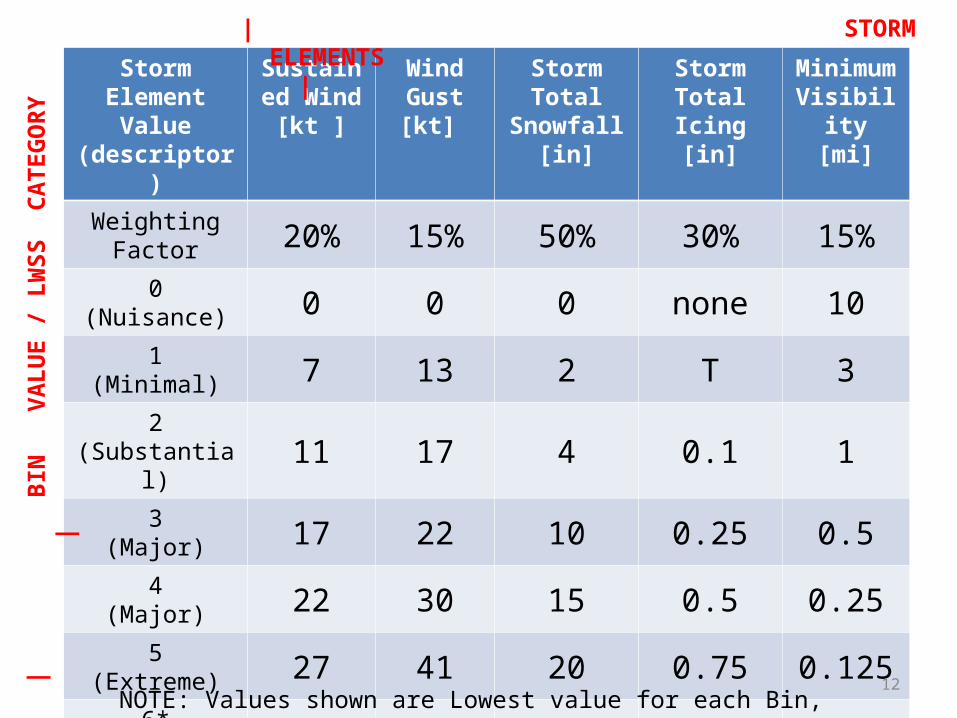
Storm Element Value
(descriptor)
Sustained Wind[kt ]
Wind Gust[kt]
Storm Total Snowfall
[in]
Storm Total Icing[in]
Minimum Visibility
[mi]
Weighting Factor 20% 15% 50% 30% 15%
0(Nuisance) 0 0 0 none 10
1(Minimal) 7 13 2 T 3
2(Substantial) 11 17 4 0.1 1
3(Major) 17 22 10 0.25 0.5
4(Major) 22 30 15 0.5 0.25
5(Extreme) 27 41 20 0.75 0.125
6(Extreme) 34 48 25 1.0 0
| STORM ELEMENTS ||
BIN
VA
LUE
|
9
Storm Element Value
(descriptor)
Sustained Wind[kt ]
Wind Gust[kt]
Storm Total Snowfall
[in]
Storm Total Icing[in]
Minimum Visibility
[mi]
Weighting Factor 20% 15% 50% 30% 15%
0(Nuisance) 0 0 0 none 10
1(Minimal) 7 13 2 T 3
2(Substantial) 11 17 4 0.1 1
3(Major) 17 22 10 0.25 0.5
4(Major) 22 30 15 0.5 0.25
5(Extreme) 27 41 20 0.75 0.125
6*(Extreme) 34 48 25 1.0 0
10|
BIN
VA
LUE
/ LW
SS C
ATEG
ORY
|
* Last bin is for extrapolation of extreme values
Storm Element Value
(descriptor)
Sustained Wind[kt ]
Wind Gust[kt]
Storm Total Snowfall
[in]
Storm Total Icing[in]
Minimum Visibility
[mi]
Weighting Factor 20% 15% 50% 30% 15%
0(Nuisance) 0 0 0 none 10
1(Minimal) 7 13 2 T 3
2(Substantial) 11 17 4 0.1 1
3(Major) 17 22 10 0.25 0.5
4(Major) 22 30 15 0.5 0.25
5(Extreme) 27 41 20 0.75 0.125
6*(Extreme) 34 48 25 1.0 0
| STORM ELEMENTS |
NOTE: Values shown are Lowest value for each Bin, except for Visibility11|
B
IN
VALU
E /
LWSS
CAT
EGO
RY
|
Storm Element Value
(descriptor)
Sustained Wind[kt ]
Wind Gust[kt]
Storm Total Snowfall
[in]
Storm Total Icing[in]
Minimum Visibility
[mi]
Weighting Factor 20% 15% 50% 30% 15%
0(Nuisance) 0 0 0 none 10
1(Minimal) 7 13 2 T 3
2(Substantial) 11 17 4 0.1 1
3(Major) 17 22 10 0.25 0.5
4(Major) 22 30 15 0.5 0.25
5(Extreme) 27 41 20 0.75 0.125
6*(Extreme) 34 48 25 1.0 0
| STORM ELEMENTS |
12NOTE: Values shown are Lowest value for each Bin, except for Visibility
|
BIN
VA
LUE
/ LW
SS C
ATEG
ORY
|
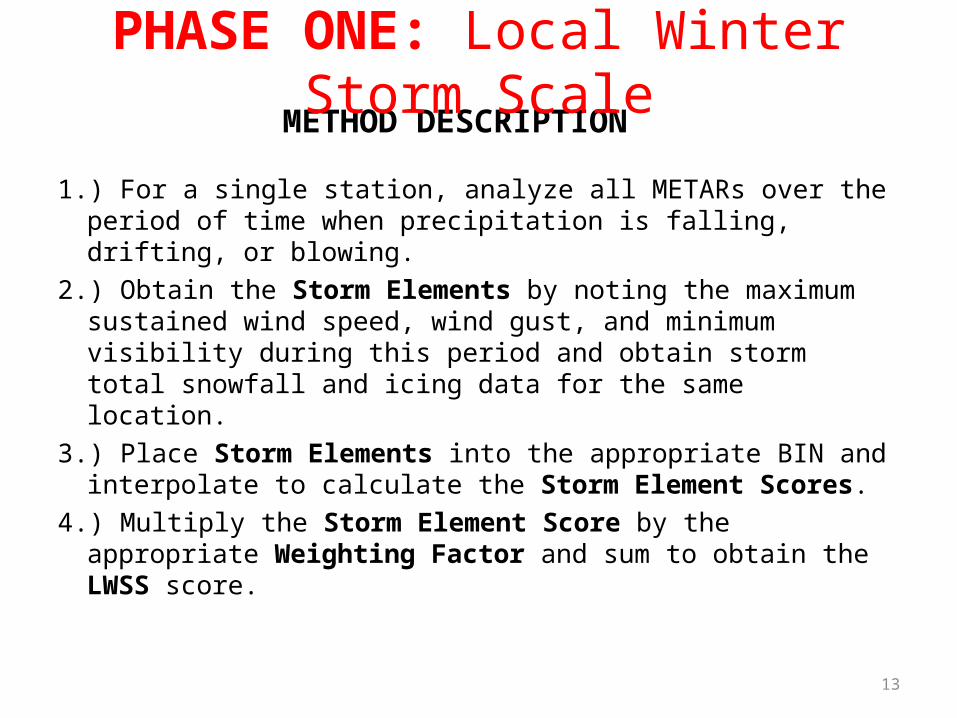
1.) For a single station, analyze all METARs over the period of time when precipitation is falling, drifting, or blowing.
2.) Obtain the Storm Elements by noting the maximum sustained wind speed, wind gust, and minimum visibility during this period and obtain storm total snowfall and icing data for the same location.
3.) Place Storm Elements into the appropriate BIN and interpolate to calculate the Storm Element Scores.
4.) Multiply the Storm Element Score by the appropriate Weighting Factor and sum to obtain the LWSS score.
13
METHOD DESCRIPTION
PHASE ONE: Local Winter Storm Scale
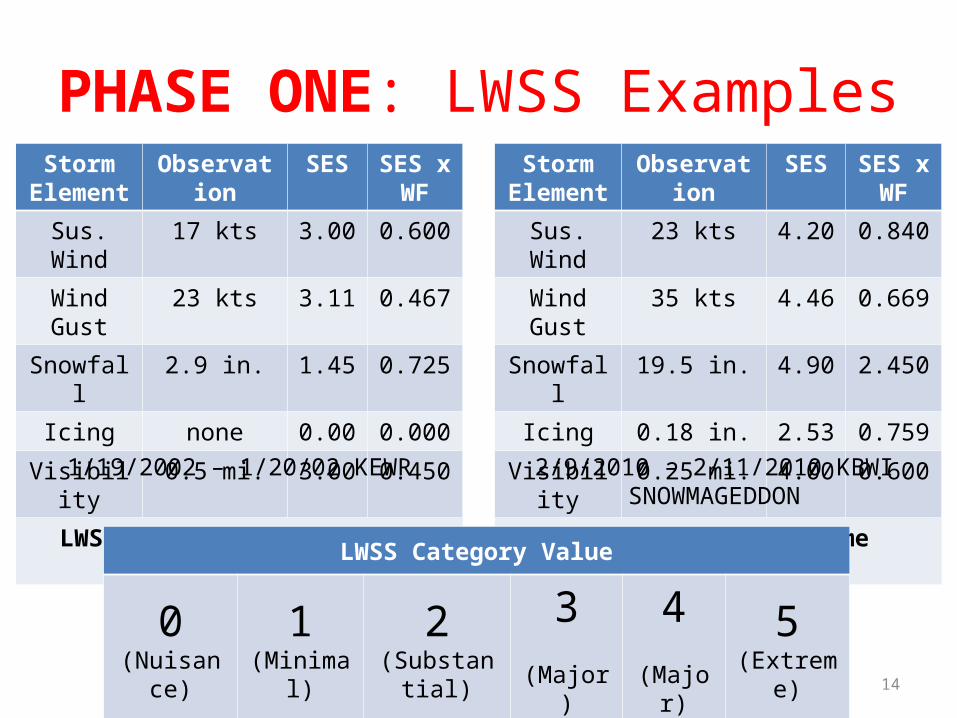
PHASE ONE: LWSS ExamplesStorm
ElementObservation SES SES x
WF
Sus. Wind 17 kts 3.00 0.600
Wind Gust 23 kts 3.11 0.467
Snowfall 2.9 in. 1.45 0.725
Icing none 0.00 0.000
Visibility 0.5 mi. 3.00 0.450
LWSS = 2.242 (Substantial Disruption)
Storm Element
Observation SES SES x WF
Sus. Wind 23 kts 4.20 0.840
Wind Gust 35 kts 4.46 0.669
Snowfall 19.5 in. 4.90 2.450
Icing 0.18 in. 2.53 0.759
Visibility 0.25 mi. 4.00 0.600
LWSS = 5.305 (Extreme Disruption)
1/19/2002 – 1/20/02 KEWR 2/9/2010 – 2/11/2010 KBWISNOWMAGEDDON
14
LWSS Category Value
0 (Nuisance)
1 (Minimal)
2 (Substantial)
3 (Major)
4 (Major)
5 (Extreme)
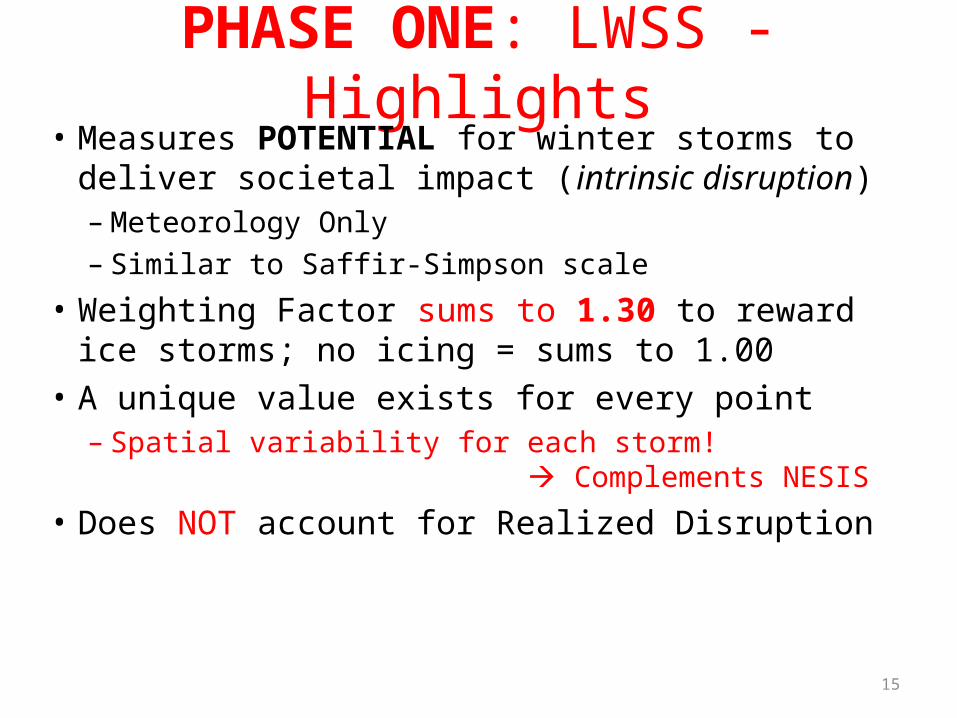
PHASE ONE: LWSS - Highlights• Measures POTENTIAL for winter storms to deliver
societal impact (intrinsic disruption) – Meteorology Only– Similar to Saffir-Simpson scale
• Weighting Factor sums to 1.30 to reward ice storms; no icing = sums to 1.00
• A unique value exists for every point– Spatial variability for each storm!
Complements NESIS
• Does NOT account for Realized Disruption
15
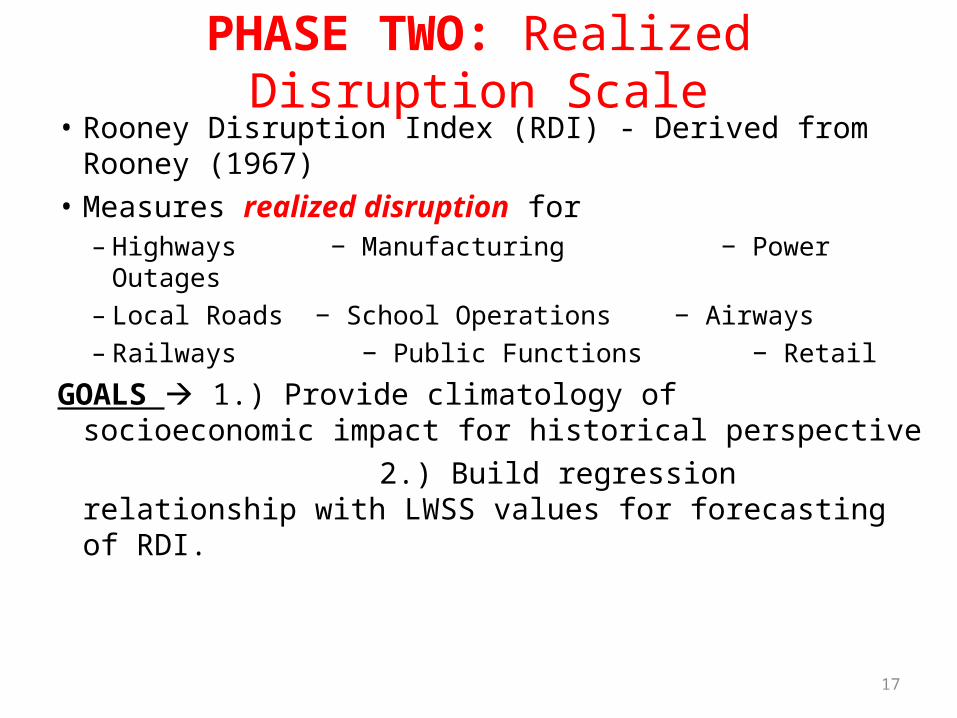
PHASE TWO: Realized Disruption Scale• Rooney Disruption Index (RDI) - Derived from Rooney
(1967)• Measures realized disruption for – Highways − Manufacturing − Power Outages– Local Roads − School Operations − Airways – Railways − Public Functions − Retail
GOALS 1.) Provide climatology of socioeconomic impact for historical perspective
2.) Build regression relationship with LWSS values for forecasting of RDI.
17
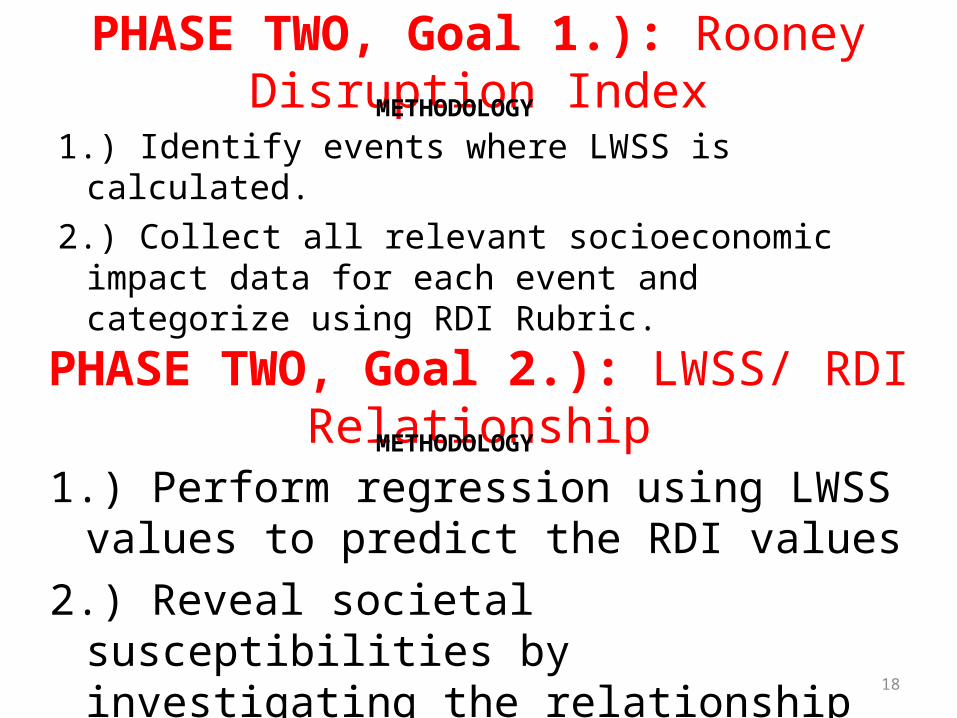
1.) Identify events where LWSS is calculated.2.) Collect all relevant socioeconomic impact
data for each event and categorize using RDI Rubric.
18
PHASE TWO, Goal 2.): LWSS/ RDI Relationship
1.) Perform regression using LWSS values to predict the RDI values
2.) Reveal societal susceptibilities by investigating the relationship under differing circumstances.
PHASE TWO, Goal 1.): Rooney Disruption IndexMETHODOLOGY
METHODOLOGY

PHASE TWO, GOAL 2.): LWSS and RDI Relationship Study Example
• Study at single location– (Newark, NJ; KEWR)– Isolate variations in societal susceptibility
• 15 cold seasons (10/1/1995 – 3/31/2010)• Resulted in database of 309 events– Apply LWSS and RDI to each
• OMIT STORMS WITH NO PRESS MENTION (RDI = 0)• Results in database of 136 events
– Investigate relationship…
19
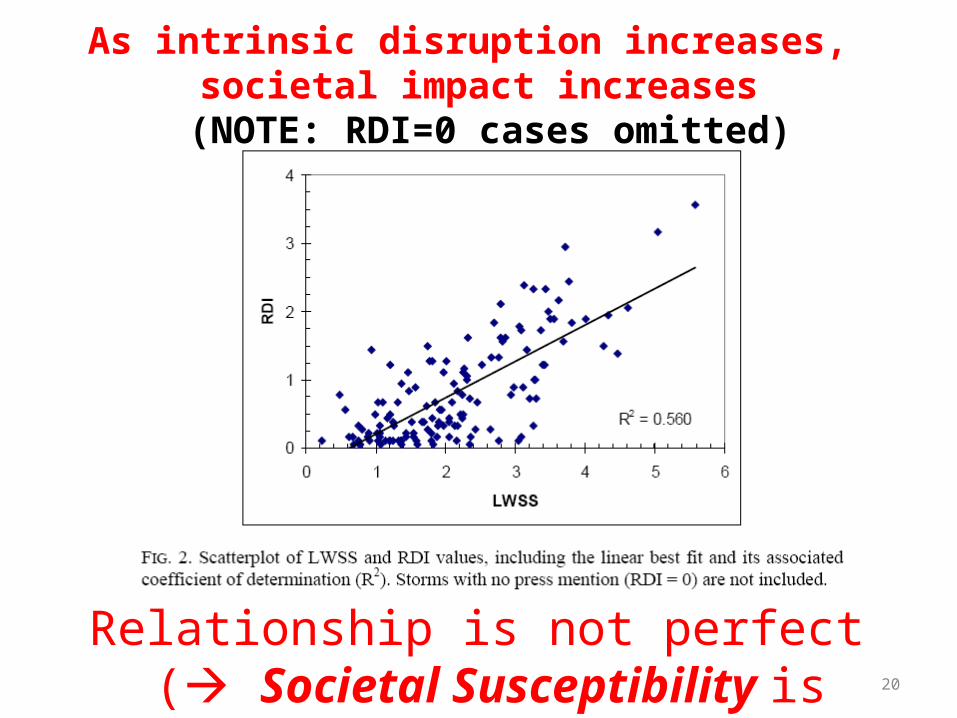
Relationship is not perfect ( Societal Susceptibility is present) 20
As intrinsic disruption increases, societal impact increases
(NOTE: RDI=0 cases omitted)
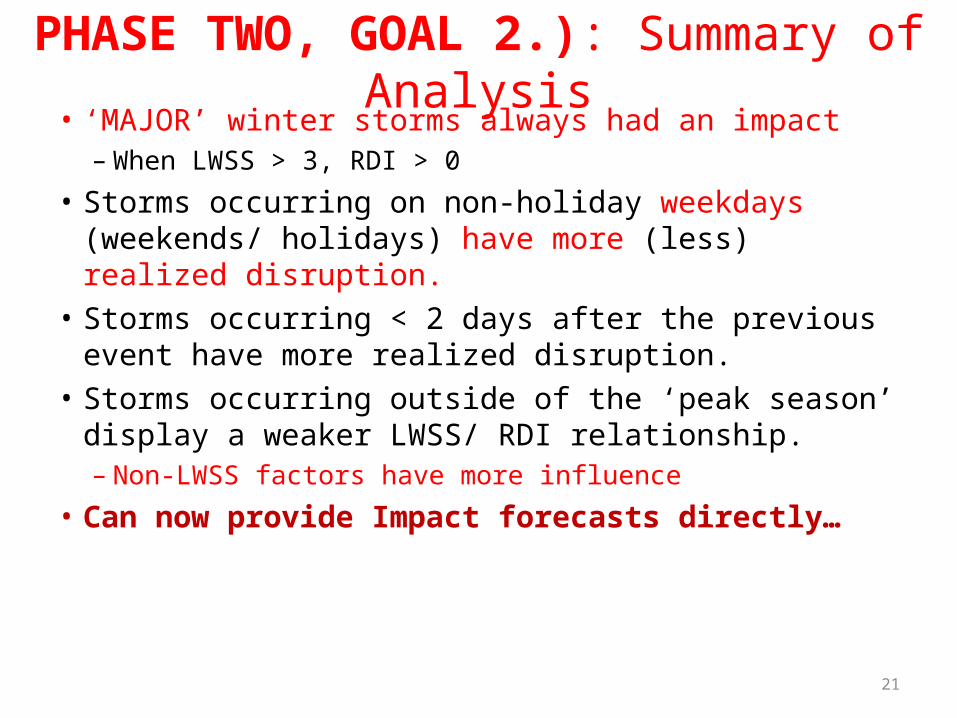
PHASE TWO, GOAL 2.): Summary of Analysis• ‘MAJOR’ winter storms always had an impact– When LWSS > 3, RDI > 0
• Storms occurring on non-holiday weekdays (weekends/ holidays) have more (less) realized disruption.
• Storms occurring < 2 days after the previous event have more realized disruption.
• Storms occurring outside of the ‘peak season’ display a weaker LWSS/ RDI relationship.– Non-LWSS factors have more influence
• Can now provide Impact forecasts directly…
21
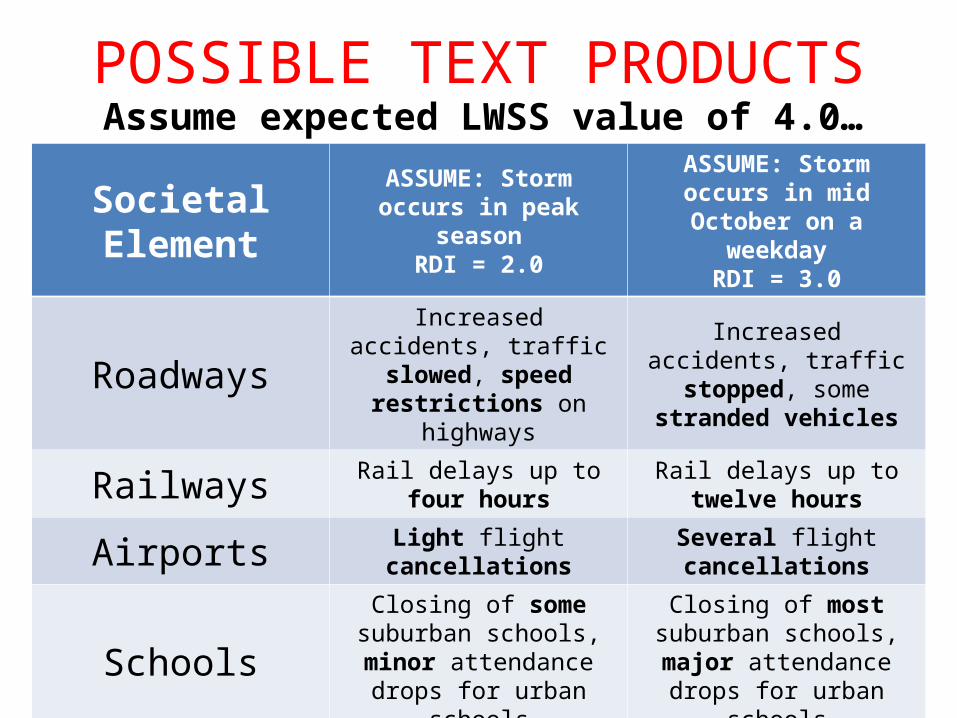
POSSIBLE TEXT PRODUCTS
22
Assume expected LWSS value of 4.0…
Societal ElementASSUME: Storm occurs in
peak seasonRDI = 2.0
ASSUME: Storm occurs in mid October on a weekday
RDI = 3.0
RoadwaysIncreased accidents, traffic slowed, speed restrictions
on highways
Increased accidents, traffic stopped, some stranded
vehicles
Railways Rail delays up to four hours Rail delays up to twelve hours
Airports Light flight cancellations Several flight cancellations
SchoolsClosing of some suburban schools, minor attendance
drops for urban schools
Closing of most suburban schools, major attendance
drops for urban schools
Electrical Utility Operations
Widespread brief power interruptions Widespread power outages
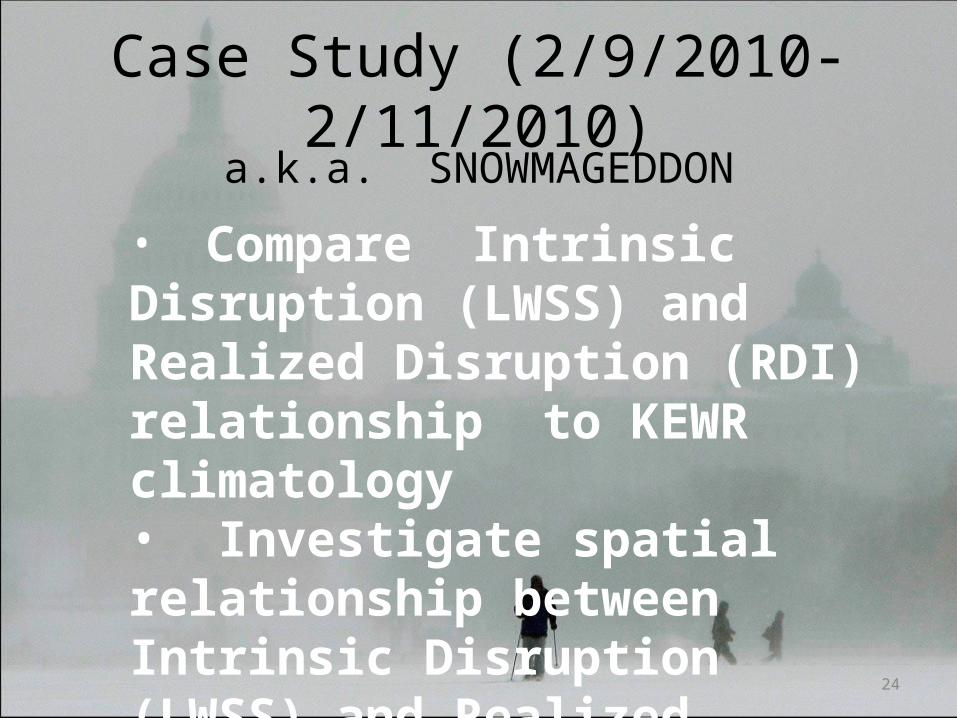
Case Study (2/9/2010- 2/11/2010)a.k.a. SNOWMAGEDDON
• Compare Intrinsic Disruption (LWSS) and Realized Disruption (RDI) relationship to KEWR climatology• Investigate spatial relationship between Intrinsic Disruption (LWSS) and Realized Disruption (RDI)
24
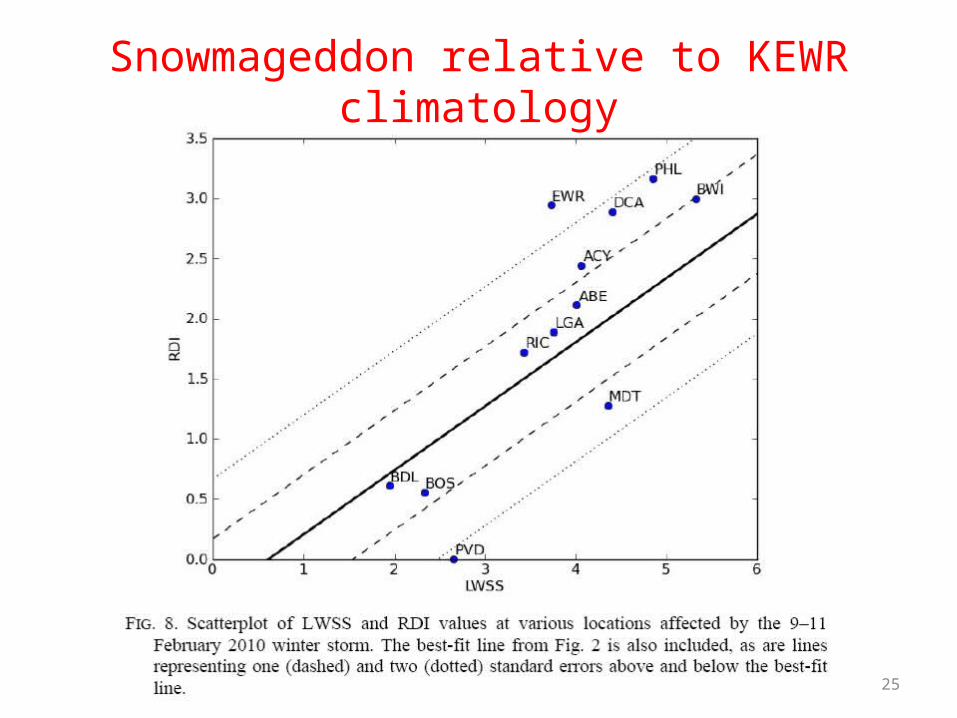
Snowmageddon relative to KEWR climatology
25
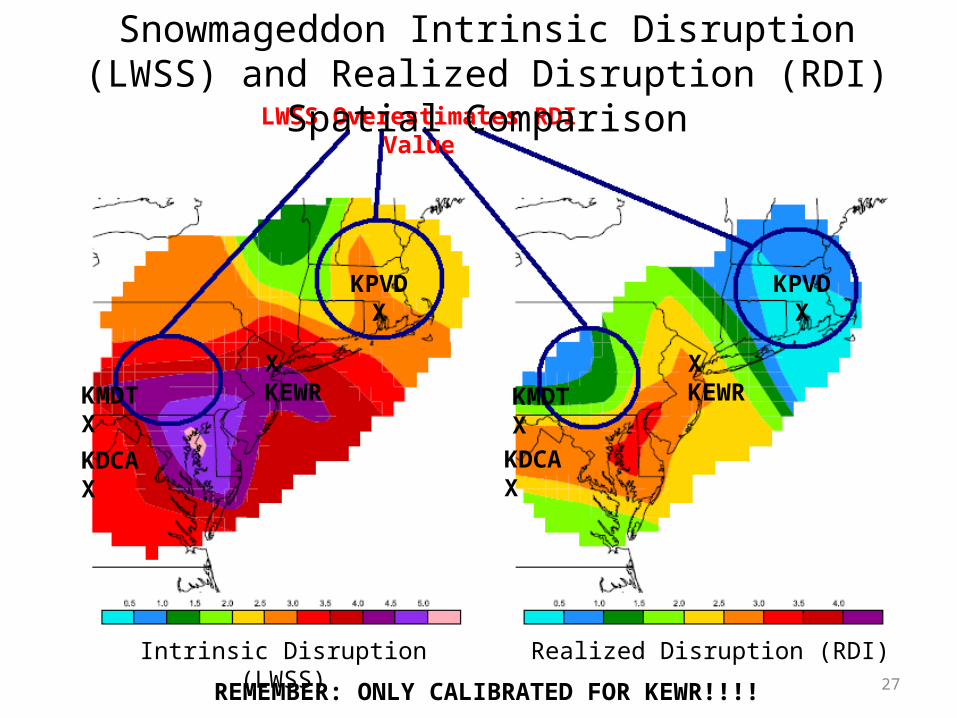
LWSS Overestimates RDI Value
Snowmageddon Intrinsic Disruption (LWSS) and Realized Disruption (RDI) Spatial Comparison
KPVDX
X KEWR
X KEWR
KPVDX
KDCA X KDCA X
KMDT X KMDT X
27
Intrinsic Disruption (LWSS) Realized Disruption (RDI)
REMEMBER: ONLY CALIBRATED FOR KEWR!!!!
Conclusions• LWSS provides estimate of intrinsic disruption
(meteorology) for a single location• RDI provides estimate for realized disruption
(socioeconomic impact) for a single location• A relationship between LWSS and RDI can be
exploited to create Impact Based forecasts• New calibration is needed for each station– Allows for intricate localized knowledge of societal
susceptibility
29
Future Work• Development of LWSS/ RDI relationship for all
locations where impact forecasts are desired– WFO Memphis, TN has agreed to carry out
development for selected stations– (Any other interested WFOs, please contact me!)
• Develop Real-time LWSS to track intrinsic disruption– Aid in short term forecasts and decision making– Already in development and experimental form– Relate RT-LWSS to ‘real time’ Realized Disruption Data
30
THANK YOU FOR LISTENING
• Questions?• Comments?• Any interested WFOs out there?– [email protected]
31

ReferencesCerruti, B. and S. G. Decker, 2011: The Local Winter Storm Scale: A measure of the intrinsic ability of winter storms to
disrupt society. Bulll. Amer. Meteor. Soc. Early Online Release.
Dolan, R., and R. E. Davis, 1992: An intensity scale for Atlantic coast northeast storms. J. Coastal Res., 8, 352–364.
Johnson, D.L., 2006: NOAA’s National Weather Service: Future in the Digital Age.
Kocin, P. J., and L. W. Uccellini, 2004: A snowfall impact scale derived from Northeast storm snowfall distributions. Bull. Amer. Meteor. Soc., 85, 177–194.
NOAA’s National Weather Service Strategic Plan 2011-2020: Draft for Public Comment.
Rooney, J. F., Jr., 1967: The urban snow hazard in the United States: An appraisal of disruption. Geogr. Rev., 57, 538–559.
Sharfenberg, K. A., K. L. Manross, K. L. Ortega, and B. P. Walawender, 2011: Real-time estimation of population exposure to weather hazards. 24th Conf .on Weather And Forecasting and 20th Conf. on Numerical Weather Prediction, Seattle, WA.
Simpson, R. H., and H. Saffir, 1974: The hurricane disaster-potential scale. Weatherwise, 27, 169.
Stern, A., 2010: 2010 Clarus/ MDSS Stakeholder Meeting
Zielinski, G. A., 2002: A classification scheme for winter storms in the eastern and central United States with an emphasis on “Nor’Easters.” Bull. Amer. Meteor. Soc., 83, 37–51.
32
Recommended