Relationships between sap-flow measurements, whole-canopy transpiration and reference evapotranspirationin field-grown papaya (Carica papaya L.)
Tiago Massi Ferraz . Alena Torres Netto . Fabrıcio De Oliveira Reis . Anderson Lopes Pecanha .
Elias Fernandes De Sousa . Jose Altino Machado Filho . Weverton Pereira Rodrigues .
David Michael Glenn . Eliemar Campostrini
Received: 3 March 2015 / Accepted: 30 November 2015
� Brazilian Society of Plant Physiology 2015
Abstract Whole-canopy gas exchange measure-
ment in papaya can provide a scientific basis to
optimize irrigation and fruit yield and quality. The
objectives of this study were to: (1) verify the
relationship between xylem sap flow measured by
the heat coefficient method, and whole canopy tran-
spiration in ‘Gran Golden’ papaya (Carica papaya L.),
(2) examine the relationship between xylem sap flow
determined from calculations based on forcing water
flow through a stem section, and whole canopy
transpiration, and (3) verify the relationship between
transpiration measured in a plant chamber and calcu-
lated reference evapotranspiration (ET0). The exper-
iment was conducted in a commercial planting at the
Caliman Agrıcola SA farm, Sooretama, ES, Brazil in
summer and winter. Whole-canopy gas exchange was
measured in custom-built, flow-through whole-canopy
Mylar� chambers. There was a correlation (r2 = 0.65)
between xylem sap flow measured with the heat
coefficient (K) method and whole-canopy transpira-
tion rate measured in the chambers. However, sap flow
methodology could not convert this correlated
response into an accurate estimate of papaya transpi-
ration measured with whole canopy chambers. The sap
flow methodologies were linearly correlated with
whole canopy transpiration but each would require
additional calibration to the crop. ET0 was correlated
with whole canopy transpiration in winter but not in
summer likely due to stomatal control of transpiration,
as a result of the high leaf temperature and ET0 in
summer. The concept of sap flow to measure transpi-
ration has value in papaya production but supplemen-
tary studies will be necessary to improve the accuracy
and estimation of the whole-canopy transpiration in
the papaya plant.
T. M. Ferraz � F. De Oliveira Reis
Department of Chemistry and Biology, CESI, State
University of Maranhao, Rua Godofredo Viana, 1300,
Imperatriz, MA 65901-480, Brazil
e-mail: [email protected]
A. T. Netto � A. L. Pecanha � W. P. Rodrigues �E. Campostrini (&)
Plant Physiology Laboratory, LMGV, Agricultural
Science and Technology Center, State University of North
Fluminense, Av. Alberto Lamego, 2000,
Campos dos Goytacazes, RJ 28013-602, Brazil
e-mail: [email protected]
E. F. De Sousa
Irrigation Sector, Agricultural Science and Technology
Center, State University of North Fluminense, Av. Alberto
Lamego, 2000, Campos dos Goytacazes, RJ 28013-602,
Brazil
J. A. M. Filho
Instituto de Pesquisa, Assistencia Tecnica e Extensao
Rural do Espırito Santo, Linhares, ES 29915-140, Brazil
D. M. Glenn
USDA-ARS, Appalachian Fruit Research Station,
2217 Wiltshire Road, Kearneysville, WV 25430, USA
123
Theor. Exp. Plant Physiol.
DOI 10.1007/s40626-015-0049-z

Keywords Gas exchange � Transpiration �Temperature � Water relations
Abbreviations
K Heat coefficient
ET0 Reference evapotranspiration
VPDleaf–air Leaf-to-air vapor pressure difference
E Transpiration
PAR Photosynthetically active radiation
1 Introduction
Papaya is one of the most important fruit crops
cultivated in tropical regions (Campostrini et al.
2010). Ripe papaya fruit plant can be consumed fresh
and non-ripe fruit is used in salads or can be cooked
(Dhekney 2004; Crane 2005). Papaya consumption in
developing countries is increasing, partly due to recent
findings of the presence of health-beneficial com-
pounds in the fruits which can have great health
benefits for the inhabitants of these countries (Evans
and Ballen 2012).
In papaya production, water is a resource requiring
considerable management because both drought and
excess water can reduce productivity (Campostrini
et al. 2010; Campostrini and Glenn 2007). The
determination of papaya water use is essential for
better irrigation and fertigation management. Efficient
water and nutrient management reduce water losses
through evaporation and drainage, and ensure
increased productivity and reduced leaching of harm-
ful chemicals into groundwater.
Drought stress in papaya affects plant growth and
sterile flower production (Bernardo et al. 1996) and for
that reason irrigation is recommended during dry
periods to assure growth and fruit production (Aiye-
laadgbe et al. 1986; Malo and Campbell 1986; Srinivas
1996). Soil water availability limits many physiolog-
ical processes in papaya (Aiyelaadgbe et al. 1986;
Marler et al. 1994; Clemente and Marler 1996; Torres
Netto 2005; Mahouachi et al. 2007; Campostrini and
Glenn 2007; Campostrini et al. 2010; Carr 2014).
On the other hand, papaya is sensitive to low oxygen
availability in the soil (hypoxia) which is commonly
caused by water logging and excessive irrigation
(Ogden et al. 1981; Malo and Campbell 1986), which
can cause extensive leaching of nutrients and problems
related to single-leaf gas exchange (Marler et al. 1994;
Khondaker and Ozawa 2007). In adittion, completely
flooded soil can cause death to papaya plants in two
days (Wolf and Lynch 1940; Rodrıguez et al. 2014) or
three to four days (Samson 1980).
Techniques to estimate plant transpiration have
been developed to improve irrigation management and
elucidate plant water relations. The xylem sap flow rate
has been related to transpiration. There are several
methods to measure xylem sap flow and with advan-
tages and limitations in terms of ease of use, cost and
size of the plant stem on which they can be used (Smith
and Allen 1996). Most methods are based on relating
temperature to sap movement in the measuring in the
stem or trunk. The Granier method (Granier 1985)
empirically calibrates probe temperature with trunk
water flow. This method has been used to establish the
relationship between sap flow and soil gravimetric
water measurements, micrometeorological factors and
soil water availability during wetting–drying cycles
(Lu et al. 2002, 2004). Reis et al. (2006) using
technique proposed by Fernandez et al. (2001) demon-
strated that forcing water through a stem section of
papaya at a constant rate was suited to sap flow
analysis. The same authors proposed a mathematical
model to evaluate the relationship between forced
water flow through the trunk and the K coefficient,
however, the forced water flow method overestimated
xylem sap flow when compared to the Granier method.
Whole-canopy transpiration may represent the
most realistic technique to calibrate xylem sap flow
using probes because it does not modify the water
soil–plant-atmosphere continuum. Contrary to single-
leaf gas exchange measurements, whole-canopy mea-
surements can provide information about net carbon
assimilation and transpiration by integrating the
response of the entire canopy (Poni et al. 1997,
2014; Baker et al. 2014). Measurement of whole-
canopy gas exchange facilitates instantaneous estima-
tion of light conversion and water use efficiencies, and
provides a tool for quantitative assessment of the
impact of soil and air water changes upon biological
processes such as gas exchange (Garcia et al. 1990).
Smith and Allen (1996) advised that the xylem sap
flow technique should be calibrated for each species
and xylem sap flow might be directly related to whole-
canopy transpiration.
Whole-canopy gas exchange measurements in
papaya plant has not been reported associating xylem
Theor. Exp. Plant Physiol.
123

sap flow with whole-canopy transpiration. Thus, the
objectives of the study were to: 1) verify the relation-
ship between xylem sap flow measured by the Granier
heat coefficient method, and whole canopy transpira-
tion in ‘Gran Golden’ papaya (Carica papaya L.); 2)
examine the relationship between xylem sap flow
determined from calculations based on forcing water
flow through a stem section, and whole canopy
transpiration, and 3) verify the relationship between
transpiration measured in a plant chamber and calcu-
lated reference evapotranspiration (ET0).
2 Materials and methods
2.1 Plant material and field conditions
The study was conducted in a commercial planting at
the Caliman Agrıcola SA farm, located in Sooretama,
ES, Brazil (19�1104900S; 40�0505200W). The site had a
low slope, with a soil classified as Haplic Lixsol (FAO
2014). Ten papaya plants ‘Gran Golden’ genotype
(Solo group), spaced 1.5 m in rows and 3.60 m apart
were used for this study. Five plants in summer and
five plants in winter were used for measuring the
whole-canopy transpiration.
Papaya seedlings were transplanted to the field in
February 2006 and July 2006 and the experiment
conducted in July (winter) and December (summer).
During the measurements, plants were 5 months-old
with an average leaf area of 3.53 ± 0.28 m2 (n = 5)
(July, winter) and 4 ± 0.5 m2 (n = 5) (December,
summer) each with 5 to 6 small green fruit per plant.
Canopy leaf area was determined immediately after
the gas exchange measurements using the model
proposed by Campostrini and Yamanishi (2001).
The crop was irrigated with a drip fertigation system
providing supplemental irrigation of 10 L (winter) and
16 L per plant per day (summer). Themonthly fertilizer
input was: 106.67 kg ha-1 Ca(NO3)2; 21.07 kg ha-1
MgSO4; 50.33 kg ha-1 KCl; 9.67 kg ha-1 MAP
(monoammonium phosphate, source of P2O5) and
0.35 kg ha-1 micronutrients. In the study area, the
plants had an average fruit yield of 44.2 t ha-1.
2.2 Environmental variables
A weather station (model 700ET, Spectrum Tech-
nologies, Illinois, USA) was installed at the study site.
The variables measured were: temperature, relative
humidity (RH), wind speed and direction, solar
radiation and rainfall (we did not observe rain during
summer and winter). The vapor pressure deficit of the
air was calculated according to the equation proposed
by Jones (1992).
The meteorological station was installed near the
experiment, and the data were used to calculate the
reference evapotranspiration (ET0) using the Penman
equation parameterized by the United Nations Food and
Agriculture Organisation (FAO) (Allen et al. 1998).
2.3 Whole-canopy gas exchange measurement
Gas exchangewasmeasured in whole plant canopies on
four days in July (winter) and three days in December
(summer) 2006 from8:00 to17:00 h and6:00 to17:00 h
to winter and summer, respectively. However, in July
(winter) the presence of dew inside the chamber
prevented measurement prior to 10:00 h. During winter
and summer, whole-canopy gas exchange was mea-
sured in five plants using an open system similar to that
described byMiller et al. (1996) adapted by Glenn et al.
(2003) (Fig. 1). The system consisted of a transparent
polyester filmMylar� (Dupont,Wilmington, DE, USA)
with 97 % transmittance of PAR into the chamber
(Corelli and Magnanini 1993; Lakso et al. 1996)
enclosing the entire canopy and attached to a centrifugal
blower. Each chamber had a volume of 3.4 m3 (diam-
eter 1.9 and height 1.2 m). Air flow rate through each
chamber was adjusted, based on canopy leaf area, to
obtain CO2 differentials within the linearity range of the
infrared gas analyzer (IRGA; Model 6200 Licor,
Fig. 1 Whole-canopy gas exchange system showing the air
supply system, location of air-blowers and the Mylar chambers
Theor. Exp. Plant Physiol.
123

Lincoln, NE) and, at the same time, to minimize air
temperature increase inside the chamber. A small
thermal differential of 2 �C was recorded at midday
between outlet and inlet dry bulb temperatures.
During the experimental days, flow rates were
monitored every hour using a flow meter (model
Velocicalc� 8345/8346; TSI Incorporated, MN, USA)
that measured the inlet air stream into the chamber.
Each blower contained six equally spaced openings
and ten measurements of the air speed were made from
the top of the blower descending to the bottom of the
blower. The average hourly air speed was calculated
from the 60 determinations within each blower,
multiplied by the cross sectional area (0.0781 m2) of
the fan to determine the average air flow volume that
was injected into the chamber (42.38 m3 min-1)
(200 L s-1 m-2 leaf area in winter and
176.5 L s-1 m-2 leaf area in summer). The average
air velocity into the chamber was 0.25 m s-1.
At the chamber’s inlet and outlet, water vapor
pressure was monitored with the IRGA adapted with
an open valve using the IRGA’s internal pump
(External Flow Switch) (LI6200, LiCor, USA). This
switch (open valve) can be mounted on the LI-6250,
and allows the LI-6200 to be quickly toggled between
open and closed modes of operation. During the
measurements the open mode was used. Each hour,
two measurements were made in each chamber, and
each measurement lasted 6 min.
The air flow (F) (L h-1) through the chambers was
calculated by Eq. 1:
F ¼ VAR � 60 � 30:5 � AVð Þ = 103Þ ð1Þ
where AV (cm2) is the cross-sectional area of output of
air-blower; VAR (ft min-1) is the air velocity.
And the air density (D) in g m-3 was calculated
with Eq. 2:
D ¼ 101300 = 287:05 � Tar þ 273:15ð Þð Þ ð2Þ
where Tar is the air temperature (�C).The whole canopy transpiration rate (E) [g (H2O)
h-1] was calculated by Eq. 3:
E ¼ D � 18=29ð Þ � D H2Oð Þ =1013ð Þ � F ð3Þ
where D H2O is the water vapor pressure in the air
output at the chamber top minus the water vapor
pressure at the air inlet.
Total daily transpiration was estimated by integrat-
ing the area under the curve of transpiration versus
time using Logger Pro (Vernier Software, Portland,
Oregon, USA).
In order to determine if plants within the chamber
were subjected to adverse temperatures, the leaf
temperature of the upper third of the plant canopy
inside and outside the chamber was measured using an
infrared thermometer (Infrarot-Thermometer, TFA,
Germany). Four plants adjacent to those with whole
canopy chambers were measured. The canopy tem-
perature at the top of each plant was measured three
times per hour with the thermometer approximately
0.3 m away from the canopy and sampling the
circumference of the canopy. The thermometer was
maintained at a 90� angle with the leaf blade. We did
not found significant differences in leaf temperature
for plants outside and inside the chambers.
2.4 Sap flow measurements
The sap flow sensors (two pairs per plant) (TDP 30,
Dynamax Co., Houston, TX, USA), 2 mm in diameter
and 30 mm in length, were inserted radially into the
node of the each papaya trunk enclosed in a whole
canopy chamber (Reis et al. 2006) at a height of 0.3 m
above the soil. The probes were vertically separated by
50 mm. The trunk and probes were covered with foam
insulation to minimize trunk temperature variation,
and the data were collected every 30 min. Using the
temperature difference between sap flow gauges, the
heat coefficient (K) was calculated by Eq. 4:
K ¼ ½ðDTmax=DTÞ� 1Þ� ð4Þ
where K is the heat coefficient; DTm the maximum
temperature difference (�C) between sensors in active
xylem (night time: 20 h), and DT is the temperature
difference (�C) between sensors in active xylem at a
specific time. The xylem active area was calculated
using dye in stems of plants with the same age as those
in the study (Reis et al. 2006). Zero flow was
confirmed at night.
2.4.1 Granier model
The Granier system consists of two sensor probes (Lu
et al. 2004). Each probe consists of a heating element
(which also represents the effective sensing part of the
probe, typically 20 mm long), wound around a steel
needle containing a T-type thermocouple (copper-
constantan), with the thermocouple tip located in the
Theor. Exp. Plant Physiol.
123

middle of the heating element. The constantan ends of
the two thermocouples are connected to measure the
temperature difference between the two probes at the
ends of the copper wires. The two probes are typically
inserted radially into the stem 100–150 mm apart, in
pre-inserted heat-distributing tubes made of alu-
minium or copper (Lu et al. 2004), previously the
tube was first fixed onto the probe (Granier 1985). The
downstream (upper) probe is continuously heated at
constant power (0.2 W) while the upstream (lower)
probe is left unheated to measure the ambient
temperature of the wood tissue and acts as a reference
probe. Temperature difference between the two probes
is influenced by the heat dissipation effect of sap flow
in the vicinity of the heated probe. Granier (1985)
showed that K was highly correlated with the sap flux
density (Fd) (Lu et al. 2004). A series of calibrations of
the sap flow probes on several sample stems of three
different tree species (Pseudotsuga menziesii, Pinus
nigra and Quercus pedunculata) provided an exper-
imental relationship between K and Fd, which was
independent of the tree species studied. The empiric
equation proposed by Granier (1985) for the relation-
ship between K and Fd was calculated by Eq. 5:
Fd ¼ 118:99� 10�6 � K1:231 ð5Þ
2.4.2 Reis model
Reis et al. (2006) constructed an experimental system
that maintained a stable water flux through a papaya
stem section with a constant pressure, simulating the
xylem sap flow through the stem (forced-flow through
a stem section) (Fernandez et al. 2001). In this work,
Reis et al. (2006) adjusted the water flux by varying
the water pressure in the stem section. They developed
a mathematical model to fit the relation between K
values and sap flow density, using the exponential
model: Fd ¼ 0:5511�K1:9104. The derived laboratory
calibration model (Reis et al. 2006) estimated larger Fdvalues than predicted by Granier (1985) for equal K
values (Reis et al. 2006).
2.4.3 ET0 methodology
The hourly reference evapotranspiration (ETo) was
calculated as described in Allen et al. (1998) and
divided by the total leaf area of the plants to estimate
the potential transpiration.
2.5 Experimental design and statistical analysis
There were five single-tree replications for whole
canopy gas exchange measurements in summer and
winter. Each day was used as a replicate over time due
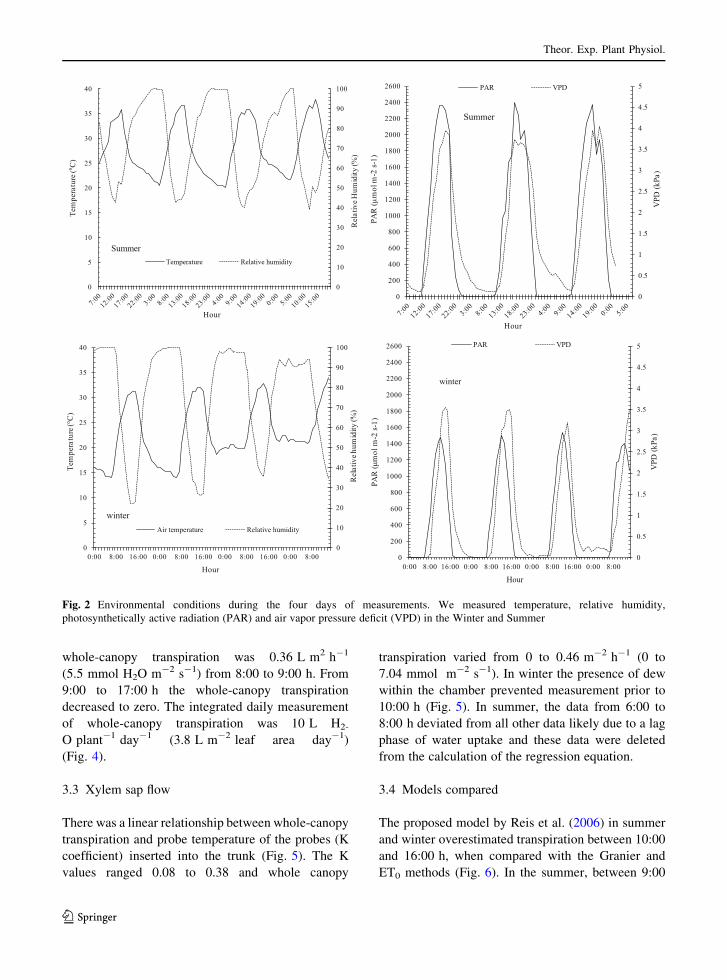
to the uniformity of environmental conditions (Fig. 2).
The treatment means were compared using the Tukey
test at 5 % probability level, with SAEG (System
Analysis and Statistics Genetic) developed by the
Federal University of Vicosa, Brazil.
3 Results
3.1 Micrometeorogical variables, and leaf
temperature
The environmental conditions were consistent during
the experiment (Fig. 2). During the four days in winter
the minimum relative humidity was 22 % and mini-
mum temperature values was 14 �C. In summer, the
minimum RH and temperature were 40 % and 21 �C,respectively. The maximum temperature was 33 �C(winter) and 38 �C (summer). The vapor pressure
deficit (VPD) had the maximum value at 2:00–15:00 h
(local time) [3.5 (winter) and 4.0 (summer)]. During
the four days in winter and three days in summer, the
sky was completely clear and the maximum PAR was
1440 and 2440 lmol m-2 s-1, for winter and sum-
mer, respectively. Maximum PAR occurred at around
13:00 h. The high summer PAR resulted in higher leaf
temperatures with a maximum value of 43.9 at
midday, while in winter the maximum value was
37.5, at 14:00 h (Fig. 3).
3.2 Whole-canopy gas exchange
Maximum whole-canopy transpiration was 0.46 L
H2O m2 h-1 (7.04 mmol H2O m-2 s-1) from 8:00 to
13:00 h in winter (Fig. 4). In winter, data were not
collected from 8:00 to 10:00 h due to dew on the mylar
chamber. From 1:00 to 17:00 h the whole-canopy
transpiration rapidly decreased to zero. The integrated
daily measurement of whole-canopy transpiration was
15 L H2O plant- day-1 (4.24 L m-2 leaf area day-1)
(Fig. 4).
In the summer, there was no dew on the mylar
chamber and measurements were made each 1 h
starting at 8:00 h and ending 17:00 h. The maximum
Theor. Exp. Plant Physiol.
123
whole-canopy transpiration was 0.36 L m2 h-1
(5.5 mmol H2O m-2 s-1) from 8:00 to 9:00 h. From
9:00 to 17:00 h the whole-canopy transpiration
decreased to zero. The integrated daily measurement
of whole-canopy transpiration was 10 L H2-
O plant-1 day-1 (3.8 L m-2 leaf area day-1)
(Fig. 4).
3.3 Xylem sap flow
There was a linear relationship between whole-canopy
transpiration and probe temperature of the probes (K
coefficient) inserted into the trunk (Fig. 5). The K
values ranged 0.08 to 0.38 and whole canopy
transpiration varied from 0 to 0.46 m-2 h-1 (0 to
7.04 mmol m-2 s-1). In winter the presence of dew
within the chamber prevented measurement prior to
10:00 h (Fig. 5). In summer, the data from 6:00 to
8:00 h deviated from all other data likely due to a lag
phase of water uptake and these data were deleted
from the calculation of the regression equation.
3.4 Models compared
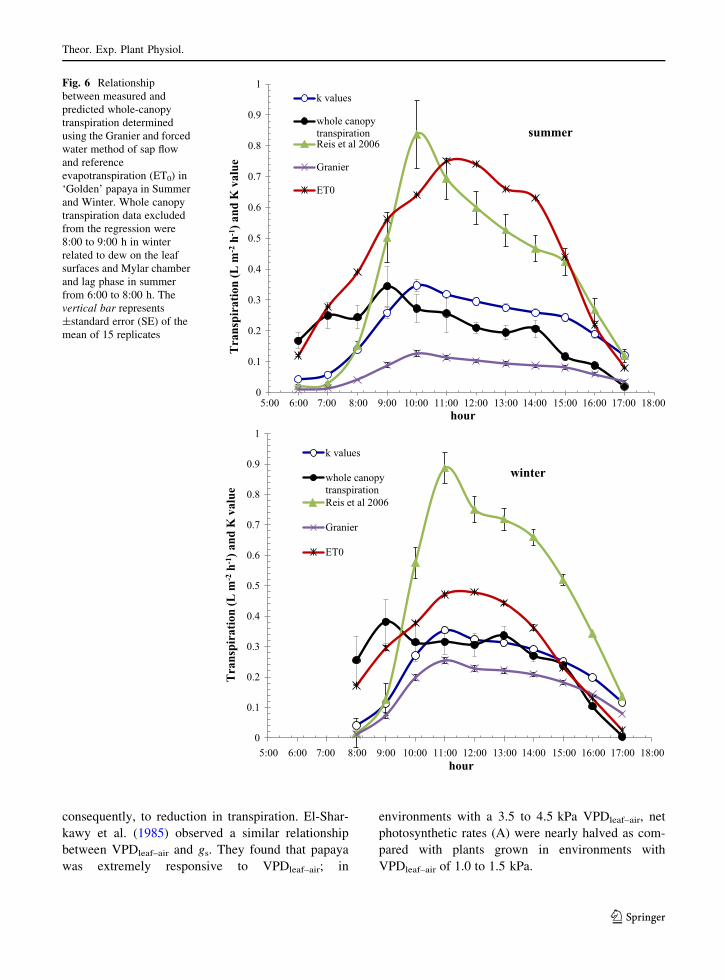
The proposed model by Reis et al. (2006) in summer
and winter overestimated transpiration between 10:00
and 16:00 h, when compared with the Granier and
ET0 methods (Fig. 6). In the summer, between 9:00
0
10
20
30
40
50
60
70
80
90
100
0
5
10
15
20
25
30
35
40
Rel
ativ
e Hum
idity
(%)
Tem
pera
ture
(°C
)
Hour
SummerTemperature Relative humidity
0
10
20
30
40
50
60
70
80
90
100
0
5
10
15
20
25
30
35
40
0:00 8:00 16:00 0:00 8:00 16:00 0:00 8:00 16:00 0:00 8:00
Rel
ativ
e hum
idity
(%)
Tem
pera
ture
(°C
)
Hour
Air temperature Relative humidity
winter
0
0.5
1
1.5
2
2.5
3
3.5
4
4.5
5
0
200
400
600
800
1000
1200
1400
1600
1800
2000
2200
2400
2600
VPD
(kPa
)
PAR
(μm
ol m
-2 s-
1)
Hour
Summer
PAR VPD
0
0.5
1
1.5
2
2.5
3
3.5
4
4.5
5
0
200
400
600
800
1000
1200
1400
1600
1800
2000
2200
2400
2600
0:00 8:00 16:00 0:00 8:00 16:00 0:00 8:00 16:00 0:00 8:00
VPD
(kPa
)
PAR
(μm
ol m
- 2 s-
1)
Hour
PAR VPD
winter
Fig. 2 Environmental conditions during the four days of measurements. We measured temperature, relative humidity,
photosynthetically active radiation (PAR) and air vapor pressure deficit (VPD) in the Winter and Summer
Theor. Exp. Plant Physiol.
123

20
22
24
26
28
30
32
34
36
38
40
42
44
8:00 9:00 10:00 11:00 12:00 13:00 14:00 15:00 16:00 17:00
Tlea
f (°C
)
Time
Winter
Summer
Fig. 3 Leaf temperature of
field-grown ‘Gran Golden’
papaya during four days
(Winter and Summer). Bars
represent standard error
(n = 15)
- 0.1
0
0.1
0.2
0.3
0.4
0.5
0.6
8:00 9:00 10:00 11:00 12:00 13:00 14:00 15:00 16:00 17:00
Tran
spirt
ion
(L m
- 2h-1
)
Hour
Summer Winter
15 L H2O plant-1 day-1
Winter10 L H2O plant-1 day-1
SummerFig. 4 Whole-canopy
transpiration (L m-2 h-1) in
‘Gran Golden’ papaya
during four days (Winter
and Summer). Bars
represent standard error
(n = 20). Data were not
collected from 8:00 to
9:00 h due to dew on the leaf
surfaces and mylar leaf
chamber. Dotted lines
represent an extrapolation to
sunrise. 10 L H2O
plant-1 day-1 (summer)
and 15 H2O plant-1 day-1
(winter) are the area below
the curves for whole-canopy
transpiration
Theor. Exp. Plant Physiol.
123

and 16:00 h, both the Reis et al. (2006) model and
ET0 overestimated transpiration while Granier under-
estimated transpiration. All of the models were
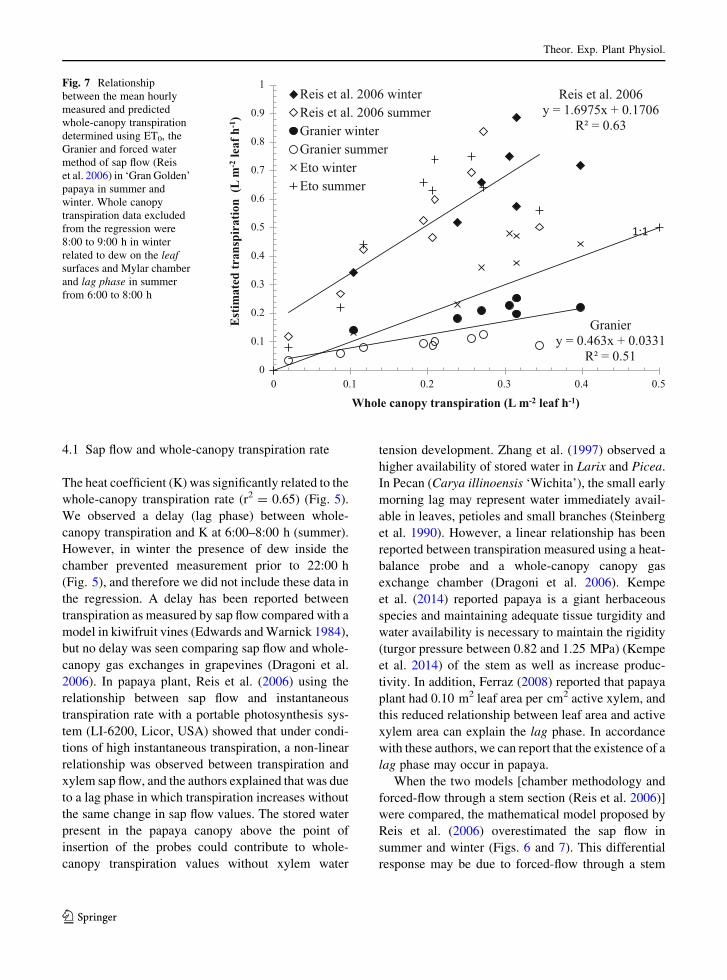
significantly different from the 1:1 relationship
between actual and predicted transpiration rates
(Fig. 7).
4 Discussion
Air temperature influences papaya physiology indi-
rectly via leaf temperature and stomatal behavior by
way of VPDleaf–air (El-Sharkawy et al. 1985; Marler
and Mickelbart 1998; Machado Filho et al. 2006; Reis
et al. 2011; Campostrini et al. 2010). In the present
study, leaf temperature inside the chamber in summer
was higher than that during winter (Fig. 3). Thus,
reduced whole canopy transpiration of papaya plants
grown under field conditions in the summer (Fig. 4)
was presumably due to stomatal closure.
The decrease of whole-plant transpiration after
1:00 h in the winter and 9:00 h in the summer (Fig. 4)
may be due in part to: 1) soil water uptake lagging
behind transpiration demand after 13:00 h (winter)
and 9:00 h (summer), creating a temporary water
stress with partial stomatal closure, 2) high and
medium VPD [3.5 kPa (winter) and 1.5 kPa (sum-
mer)] and 3) the interaction between the factors
mentioned in 1) and 2) above and PAR. The reduction
in PAR caused rapid stomatal response in tropical
regions because the intermittent clouds create large
fluctuations in PAR during the day (Clemente and
Marler 1996).
Reduced whole-canopy transpiration in papaya in
the summer was due to high leaf temperatures and high
VPDair (4.0 kPa) that caused stomatal closure. In fact,
papaya has optimal growth and development at air
temperatures between 21 and 33 �C (Knight 1980), or
according to Lassoudiere (1968), between 22 and
26 �C. This information emphasizes the role of
temperature acting indirectly on transpiration in
papaya via increases in VPDleaf–air. The VPDleaf–air
may be a fundamental factor for agricultural zoning of
papaya cultivation because it will determine the
regions with the greatest productive capacity. Several
studies (El-Sharkawy et al. 1985; Marler and Mick-
elbart 1998; Machado Filho et al. 2006; Reis et al.
2011) have shown that even with high soil water
availability, a high VPDleaf–air contributes signifi-
cantly to the reduction of stomatal conductance and,
y = 0.4774x + 0.1604R² = 0.65
0
0.05
0.1
0.15
0.2
0.25
0.3
0.35
0.4
0.45
0.5
K =
[(ΔT
max
/ΔT
min
) -1]
Whole canopy transpiration (L m-2 leaf h-1)
wintersummer
06:00 h
08:00 h
17:00 h
16:00 h
0 0.05 0.1 0.15 0.2 0.25 0.3 0.35 0.4 0.45 0.5
Fig. 5 Relationship
between mean hourly
whole-canopy transpiration
and the xylem sap flow heat
coefficient (K) in ‘Gran
Golden’ papaya during four
days in winter and summer.
Arrows indicate the
chronological progression
during the day. Whole
canopy transpiration data
excluded from the
regression were 8:00 to
9:00 h in winter related to
dew on the leaf surfaces and
Mylar chamber and lag
phase in summer from 6:00
to 8:00 h
Theor. Exp. Plant Physiol.
123
consequently, to reduction in transpiration. El-Shar-
kawy et al. (1985) observed a similar relationship
between VPDleaf–air and gs. They found that papaya
was extremely responsive to VPDleaf–air; in
environments with a 3.5 to 4.5 kPa VPDleaf–air, net
photosynthetic rates (A) were nearly halved as com-
pared with plants grown in environments with
VPDleaf–air of 1.0 to 1.5 kPa.
0
0.1
0.2
0.3
0.4
0.5
0.6
0.7
0.8
0.9
1
5:00 6:00 7:00 8:00 9:00 10:00 11:00 12:00 13:00 14:00 15:00 16:00 17:00 18:00
5:00 6:00 7:00 8:00 9:00 10:00 11:00 12:00 13:00 14:00 15:00 16:00 17:00 18:00
Tra
nspi
ratio
n (L
m-2
h- 1) a
nd K
val
ue
hour
k values
whole canopytranspirationReis et al 2006
Granier
ET0
summer
0
0.1
0.2
0.3
0.4
0.5
0.6
0.7
0.8
0.9
1
Tra
nspi
ratio
n (L
m-2
h-1) a
nd K
val
ue
hour
k values
whole canopytranspirationReis et al 2006
Granier
ET0
winter
Fig. 6 Relationship
between measured and
predicted whole-canopy
transpiration determined
using the Granier and forced
water method of sap flow
and reference
evapotranspiration (ET0) in
‘Golden’ papaya in Summer
and Winter. Whole canopy
transpiration data excluded
from the regression were
8:00 to 9:00 h in winter
related to dew on the leaf
surfaces and Mylar chamber
and lag phase in summer
from 6:00 to 8:00 h. The
vertical bar represents
±standard error (SE) of the
mean of 15 replicates
Theor. Exp. Plant Physiol.
123
4.1 Sap flow and whole-canopy transpiration rate
The heat coefficient (K) was significantly related to the
whole-canopy transpiration rate (r2 = 0.65) (Fig. 5).
We observed a delay (lag phase) between whole-
canopy transpiration and K at 6:00–8:00 h (summer).
However, in winter the presence of dew inside the
chamber prevented measurement prior to 22:00 h
(Fig. 5), and therefore we did not include these data in
the regression. A delay has been reported between
transpiration as measured by sap flow compared with a
model in kiwifruit vines (Edwards andWarnick 1984),
but no delay was seen comparing sap flow and whole-
canopy gas exchanges in grapevines (Dragoni et al.
2006). In papaya plant, Reis et al. (2006) using the
relationship between sap flow and instantaneous
transpiration rate with a portable photosynthesis sys-
tem (LI-6200, Licor, USA) showed that under condi-
tions of high instantaneous transpiration, a non-linear
relationship was observed between transpiration and
xylem sap flow, and the authors explained that was due
to a lag phase in which transpiration increases without
the same change in sap flow values. The stored water
present in the papaya canopy above the point of
insertion of the probes could contribute to whole-
canopy transpiration values without xylem water
tension development. Zhang et al. (1997) observed a
higher availability of stored water in Larix and Picea.
In Pecan (Carya illinoensis ‘Wichita’), the small early
morning lag may represent water immediately avail-
able in leaves, petioles and small branches (Steinberg
et al. 1990). However, a linear relationship has been
reported between transpiration measured using a heat-
balance probe and a whole-canopy canopy gas
exchange chamber (Dragoni et al. 2006). Kempe
et al. (2014) reported papaya is a giant herbaceous
species and maintaining adequate tissue turgidity and
water availability is necessary to maintain the rigidity
(turgor pressure between 0.82 and 1.25 MPa) (Kempe
et al. 2014) of the stem as well as increase produc-
tivity. In addition, Ferraz (2008) reported that papaya
plant had 0.10 m2 leaf area per cm2 active xylem, and
this reduced relationship between leaf area and active
xylem area can explain the lag phase. In accordance
with these authors, we can report that the existence of a
lag phase may occur in papaya.
When the two models [chamber methodology and
forced-flow through a stem section (Reis et al. 2006)]
were compared, the mathematical model proposed by
Reis et al. (2006) overestimated the sap flow in
summer and winter (Figs. 6 and 7). This differential
response may be due to forced-flow through a stem
Reis et al. 2006y = 1.6975x + 0.1706
R² = 0.63
Graniery = 0.463x + 0.0331
R² = 0.510
0.1
0.2
0.3
0.4
0.5
0.6
0.7
0.8
0.9
1
0 0.1 0.2 0.3 0.4 0.5
Est
imat
ed tr
ansp
irat
ion
(L m
-2le
af h
-1)
Whole canopy transpiration (L m-2 leaf h-1)
Reis et al. 2006 winterReis et al. 2006 summerGranier winterGranier summerEto winterEto summer
1:1
Fig. 7 Relationship
between the mean hourly
measured and predicted
whole-canopy transpiration
determined using ET0, the
Granier and forced water
method of sap flow (Reis
et al. 2006) in ‘Gran Golden’
papaya in summer and
winter. Whole canopy
transpiration data excluded
from the regression were
8:00 to 9:00 h in winter
related to dew on the leaf
surfaces and Mylar chamber
and lag phase in summer
from 6:00 to 8:00 h
Theor. Exp. Plant Physiol.
123

section promoting artificial water movement in xylem
vessels which may eliminate cavitation bubbles in the
xylem that reduce water conduction (Holtta and
Sperry 2014). We conclude that the whole plant
chamber methodology provides a more realistic
behavior of the water xylem movement through the
papaya trunk growth-field than the forced-flow
method.
ET0 overestimated whole-canopy transpiration rate
in the summer, but showed a good relationship in
winter (Figs. 6 and 7), This lack of fit in summer is
primarily due to stomatal closure due to water stress
restricting the potential transpiration rate despite full
irrigation. In contrast, the reasonable fit of ET0 in
winter indicated that the plant was able to meet the
ET0 demand and stomatal closure due to water stress
was not apparent (Fig. 7). Due to the stomatal control
of transpiration (E) versus ET0 control of E, irrigation
cannot be accurately scheduled using estimates of ET0
in summer. For this reason, sensors or other technol-
ogy are needed to accurately estimate actual
transpiration.
There was a significant and meaningful relationship
between K and whole plant transpiration (Fig. 5)
indicating that sap flow measurement was related to
transpiration. However, neither the Granier (1985) nor
the Reis et al. (2006) methodology could convert this
correlated response into an accurate measurement of
papaya transpiration measured with whole canopy
chambers (Fig. 7). Both sap flow methodologies were
linearly correlated with whole canopy transpiration
but each would require additional calibration to the
crop. Lamentably, the regression relationships for
summer and winter are significantly different, pre-
cluding the use of ET0 as a means of calibrating the sap
flow sensors during the winter when water stress and
stomatal control of E is minimal. The concept of sap
flow to measure transpiration is valuable in papaya
however, additional studies are necessary to improve a
model to accurately and consistently estimate whole-
canopy transpiration in papaya plant to schedule
irrigation in commercial fields.
Acknowledgments We acknowledge the support of Caliman
Agrıcola S/A, Financiadora de Estudos e Projetos (FINEP,
Brazil), Fundacao Carlos Chagas de Apoio a Pesquisa no Estado
do Rio de Janeiro (FAPERJ, Brazil), National Council for
Scientific and Technological Development (CNPq, Brazil) and
Coordenacao de Aperfeicoamento de Pessoal de Nıvel Superior
(CAPES, Brazil). We are also thankful to Dynamax (Houston,
Texas, USA) for providing the probes to measure the xylem sap
flow. We are also thankful to Dr. Bruce Schaffer, Tropical
Research & Education Center (TREC), University of Florida,
USA for helpful grammar corrections.
Disclaimer Mention of a trademark, proprietary product, or
vendor does not constitute a guarantee or warranty of the pro-
duct by the U.S. Dept. of Agriculture and does not imply its
approval to the exclusion of other products or vendors that also
may be suitable. USDA is an equal opportunity provider and
employer.
References
Aiyelaadgbe IOQ, Falusi MOA, Babalola O (1986) Growth,
development and yield of pawpaw (Carica papaya L.).
‘Homestead selection’ in response to soil moisture stress.
Plant Soil 93:427–435
Allen RG, Pereira LS, Raes D, Smith M, (1998) Crop evapo-
transpiration: guidelines for computing crop requirements.
Irrigation and drainage paper no. 56, FAO, Rome, pp 300
Baker JT, Gitz DC III, Lascano RJ (2014) Field evaluation of
open system chambers for measuring whole canopy gas
exchanges. Agron J 106:537–544
Bernardo S, Carvalho JA, Souza EF (1996) Papaya’s irrigation.
1st ed. Campos dos Goytacazes, Universidade Estadual do
Norte Fluminense Darcy Ribeiro, UENF, technical bulletin
no. 5, P 20
Campostrini E, Glenn DM (2007) Ecophysiology of papaya: a
review. Braz J Plant Physiol 19:413–424
Campostrini E, Yamanishi OK (2001) Estimation of papaya leaf
area using the central vein length. Sci Agricola 58:39–42
Campostrini E, Glenn DM, Yamanishi OK (2010) Papaya:
environment and crop physiology. In: da Matta F (ed)
Ecophysiology of tropical tree crops (agriculture issues and
policies), vol 1, 1st edn. Nova Science Publishers, New
York, pp 287–308
Carr MKV (2014) The water relations and irrigation require-
ments of papaya (Carica papaya L.). Expl Agric
50:270–283
Clemente HS, Marler TE (1996) Drought stress influences gas-
exchange responses of papaya leaves to rapid changes in
irradiance. J Am Soc Horicult Sci 12:292–295
Corelli GL, Magnanini E (1993) A whole-tree system for gas-
exchange studies. HortScience 28:41–45
Crane JH (2005) Papaya growing in the Florida Home Land-
scape. University of Florida, IFAS Extension, p 8
Dhekney S (2004) Molecular investigations, cryopreservation
and genetic transformation studies in papaya (Carica
papaya L.) for cold hardiness. PhD Thesis, University of
Florida, USA
Dragoni D, Lakso NA, Piccioni RM, Tarara JM (2006) Tran-
spiration of grapevines in the humid northeastern United
States. Am J Enol Viticult 57:460–467
Edwards WRN, Warwick NWM (1984) Transpiration from a
kiwifruit vine as estimated by the heat pulse technique and
the Penman–Monteith equation. N Z J Agric Res
27:537–543
Theor. Exp. Plant Physiol.
123

El-SharkawyMA, CockMJH, Hernandez ADP (1985) Stomatal
response to air humidity and its relation to stomatal density
in a wide range of warm climate species. Photosynth Res
7:137–149
Evans EA, Ballen FH (2012) An overview of global papaya
production, trade, and comsuption. University of Florida,
Cooperative Extension Service Fruits Crops Fact Sheet
FE913, Gainesville
FAO (2014) World reference base for soil resources. Interna-
tional soil classification system for naming soils and cre-
ating legends for soil maps. FAO, Roma, pp 1–181
Fernandez JE, Palomo MJ, Diaz-Espejo A, Clothier BE, Green
SR, Giron IF, Moreno F (2001) Heat-pulse measurements
of sap flow in olives for automating irrigation: tests, root
flow and diagnostics of water stress. Agric Water Manag
51:99–123
Ferraz TM (2008) Gas exchange in papaya plants on field: whole
canopy versus single leaves. Dissertation, Campos dos
Goytacazes, Universidade Estadual do Norte Fluminense
Darcy Ribeiro, UENF, p 69
Garcia R, Norman JM, McDermitt DK (1990) Measurements of
canopy gas exchange using an open chamber system.
Remote Sens Rev 5:141–162
Glenn DM, Erez A, Puterka GJ, Gundrum P (2003) Particle
films affect carbon assimilation and yield in ‘Empire’
apple. J Am Soc Horticult Sci 128:356–362
Granier A (1985) Une nouvelle methode pour la mesure du flux
de seve brute dans le tronc des arbres. Annal des Sci For
42:193–200
Holtta T, Sperry J (2014) Plant water transport and cavitation.
In: Mercury L et al (eds) Transport and reactivity of solu-
tions in confined hydrosystems. Springer, Dordrecht,
pp 173–181
Kempe A, Lautenschlager T, Lange A, Neinhuis C (2014) How
to become a tree without wood-biomechanical analysis of
the stem of Carica papaya L. Plant Biol 16:264–271
Khondaker NA, Ozawa K (2007) Papaya plant growth as
affected by soil air oxygen deficiency. Acta Hort
740:225–232
Knight RJ (1980) Origin and world importance of tropical and
subtropical fruit crops. In: Nagy S, Shaw PE (eds) Tropical
and Subtropical Fruits: composition, properties, and uses.
AVI Publishing, Westport, pp 1–120
Lakso AN, Mattii GB, Nyrop JP, Denning SS (1996) Influence
of European Red Mite on leaf and whole-canopy carbon
dioxide exchange, yield, fruit size, quality, and return
cropping in ‘Starkrimson Delicious’ apple trees. J Am Soc
Horticult Sci 121:954–958
Lassoudiere A (1968) Le papayer (Deuxieme paitie). Fruits
23:585–596
Lu P, Woo KC, Liu ZT (2002) Estimation of whole-plant
transpiration of bananas using sap flow measurements.
J Exp Bot 53:1771–1779
Lu P, Urban L, Zhao P (2004) Granier’s thermal dissipation
probe (TDP) method for measuring sap flow in trees: the-
ory and practice. Acta Botanica Sinica 46:631–646
Machado Filho JA, Campostrini E, Yamanishi OK, Fagundes
GR (2006) Seasonal variation of leaf gas exchange in
papaya plants grown under field condition. Bragantia
65:185–196
Mahouachi J, Arbona V, Gomez-Cadenas AG (2007) Hormonal
changes in papaya seedlings subjected to progressive water
stress and re-watering. Plant Growth Regul 53:43–51
Malo SE, Campbell CW (1986) The papaya. Univ. of Florida
Cooperative Extension Service Fruits Crops Fact Sheet FC-
11. Gainesville, Fla
Marler TE, Mickelbart MV (1998) Drought, leaf gas exchange,
and chlorophyll fluorescence of field grown papaya. J Am
Soc Horticult Sci 123:714–718
Marler TE, George AP, Nissen RJ, Andersen PC (1994) Mis-
cellaneous tropical fruits. In: Schaffer B, Andersen PC
(eds) Handbook of environmental physiology of fruits
crops. V.II: Sub-tropical and tropical crops. CRC Press,
Florida, pp 199–224
Miller DP, Howell GS, Flore JA (1996) A whole plant open gas
exchange system for measuring net photosynthesis of
potted woody plants. HortScience 31:944–946
Ogden MAH, Jackson LK, Campbell CW (1981) Florida trop-
ical fruit culture via master gardener. Proc Fla State Hort
Soc 94:222–225
Poni S, Magnanini E, Rebucci B (1997) An automated chamber
system for measurements of whole vine gas exchange.
HortScience 32:64–67
Poni S, Merli MC, Magnanini E, Galbignani M, Bernizzoni F,
Vercesi A, Gatti M (2014) An improved multichamber gas
exchange system for determining whole canopy water use
efficiency in the grapevine. Am J Enol Viticult 65:268–276
Reis FO, Campostrini E (2011) Water microaspersion upon tree
canopy: a study relating to gas exchange and photochem-
ical efficiency in papaya trees 17:89–105
Reis FO, Campostrini E, Sousa EF, SilvaMG (2006) Sap flow in
papaya plants: laboratory calibrations and relationships
with gas exchanges under field conditions. Sci Hortic
110:254–259
Rodrıguez, G., B. Schafferand C. Basso. 2014. Effect of floding
duration and portion of roots submerged on physiology,
growth and survival of papaya (Carica papaya L.).
HortScience 49:S293 (Abstract)
Samson JA (1980) Tropical fruits. Logman, London
Smith DM, Allen SJ (1996) Measurement of sap flow in plant
stems. J Exp Bot 305:1833–1844
Srinivas K (1996) Plant water relations, yield, and water use of
papaya (Carica papaya L.) at different evaporation-re-
plenishment rates under drip irrigation. Trinidad. Tropical
Agriculture. St. Augustine. 73:264–269
Steinberg SL, Mcfarland MJ, Worthington JW (1990) Com-
parison of trunk and branch sap flow with canopy tran-
spiration in pecan. J. Exp. Botany 227:653–659
Torres Netto A (2005) Physiological characterization and water
relations in papaya genotypes (Carica papaya L.). DSc
thesis, Campos dos Goytacazes-RJ, Universidade Estadual
do Norte Fluminense Darcy Ribeiro-UENF, 116 p
Wolf HS, Lynch SJ (1940) Papaya culture in Florida. Univ. of
Fla. Agric. Exp. Sta. Bull. 350, 35 pp
Zhang H, Simmonds LP, Morison JIL, Payne D (1997) Esti-
mation of transpiration by single trees: comparison of sap
flowmeasurements with a combination equation. Agric For
Meteorol 87:155–169
Theor. Exp. Plant Physiol.
123
Recommended
![Uncertainty in the response of transpiration to CO2 and ... · Download details: IP Address: ... and plant transpiration [1]. ... transpiration, to increase. Note, that the scaling](https://img.pdfslide.net/doc/110x75/5b4a6b6b7f8b9a403d8c3170/uncertainty-in-the-response-of-transpiration-to-co2-and-download-details.jpg)

![Untitled-1 [dynamax.com]dynamax.com/images/uploads/papers/69_Riego_Sub... · Title: Untitled-1 Author: Market-lynsey Subject: Untitled-1 Created Date: 7/10/2006 11:38:07 AM](https://img.pdfslide.net/doc/110x75/5fd1820c7120883d7a09eae0/untitled-1-title-untitled-1-author-market-lynsey-subject-untitled-1-created.jpg)