Relativizing Human Rights:
A New System for Country Ranking
By
Todd Landman
Professor of Government
Department of Government
University of Essex
Wivenhoe Park
Colchester
Essex CO4 3SQ
UNITED KINGDOM
David Kernohan
Head of Department
Department for Economics & Statistics
Middlesex University
The Burroughs
Hendon
London NW4 4BT
UNITED KINGDOM
Anita Gohdes
Researcher
Benetech Initiative
480 S. California Ave.
Suite 201
Palo Alto
California 94306-1609
UNITED STATES
Paper prepared for the Annual Meeting of the American Political Science Association,
Washington DC, 2-5 September 2010
DRAFT ONLY
Please do not cite without the authors’ permission.

Abstract
This paper proposes a method for ranking country human rights performance that takes into
account the performance of countries on a host of variables that are related to the protection
of civil and political rights. The method involves two stages. The first stage employs principal
component factor analysis to five different standards-based measures of civil and political
rights to extract a single human rights ‘factor score’. This human rights ‘factor score’ is then
regressed on a collection of explanatory variables for the protection of civil and political
rights and saves the residual as an indicator of the ‘over’ or ‘under’ performance of
countries with respect to the protection of those rights. Both the ‘factor score’ and the
residual score allow for a comparison of expected and actual human rights performance that
leads to alternative rankings that we believe will be interest to scholars and practitioners
working in the field of human rights.
1
Introduction
For over thirty years, scholars and practitioners have been measuring human rights, where
considerable progress has been made on delineating which rights should be measured, how
they should be measured, and providing a variety of measures for different categories and
dimensions of human rights (see Jabine and Claude 1992; Landman 2002, 2005a, 2005b,
2006, 2009a, 2009b; Landman and Larizza 2009; Landman and Carvalho 2009). To date,
measures have been developed that use events-based data, standards-based data, and survey-
based data, as well as socio-economic and administrative statistics (see Jabine and Claude
1992; Landman 2002; Landman and Carvalho 2009). The provision of human rights data for
global comparative analysis, however, has involved a narrow set of measures for a narrow set
of human rights, primarily the state violation of civil and political rights (although some
progress has been made in broadening the scope of rights).1 Typically, any attempt to provide
comparable measures of human rights has involved the development of standards-based data
that code annual human rights performance of countries from narrative reports such as those
provided by the US Department of State or Amnesty International. These measures code
countries against a well-defined set of human rights standards and assign scores based on a
limited scale that typically ranges from low (few violations and good performance) to high
(many violations and bad performance).2 These scales, such as the political terror scale
3,
Freedom House scale of civil liberties and political rights4, Cingranelli and Richards human
rights data5, and Oona Hathaway‟s (2002) scale of torture, are collected for large number of
countries (normally between 160 and 190) over many years of time (between 15 and 40
years) and most suitable for empirical analyses that seek to explain the variation in human
1 For example, the Cingranelli and Richards Human Rights Data Project (CIRI) includes measures for worker
rights and women‟s social and economic rights, see www.humanrightsdata.com. 2 Cingranelli and Richards reverse this logic and code good performance with a higher score.
3 www.politicalterrorscale.org
4 www.freedomhouse.org
5 www.humanrightsdata.com

2
rights protection or the relationship between human rights protection and other variables of
interest (see Landman 2005a, 2006a). There is now a large and burgeoning sub-field in
political science, international relations, and socio-legal studies that have employed these
measures.
Despite the production and use of these scales, they all rest on a fundamental problem: they
code the annual human rights performance of a country without taking into account other
prevailing conditions within the country. At one level, this makes complete sense, since
human rights performance has been singled out, well-defined, and then measured; steps that
follow the methodological advice found in such seminal publications as Adcock and Collier‟s
2001 article in the American Political Science Review and Goertz‟s (2006) Social Science
Concepts. Such measures and the variation that they depict then become the object of inquiry
that is in need of explanation through the testing of empirical theories and models of the kind
developed in political science. But at another level, their use for descriptive analysis and
country ranking, as in Freedom House reports „Freedom in the World‟ is highly problematic
and prone to the kind of criticism levelled at the UNDP in 1991 when it published a report
that compared human rights performance against the human development index (see Barsh
1993). Such ranking is also popular among donor agencies using assessment frameworks for
the allocation of overseas development assistance (ODA), such as the Millennium Challenge
Account in the United States and the World Bank‟s Country Policy and Institutional
Assessment (CPIA), where raw country scores are used as litmus tests for decisions on the
further extension of foreign aid.
In response to this problem, this paper proposes a relativized measure of human rights that
takes into account significant factors that may have an effect on annual country performance.

3
It does so through three stages. First, it combines the main standards-based scales of civil and
political rights through factor analysis to create a single human rights factor score (Landman
and Larizza 2009) that provides a common dimension, or principal component, of human
rights performance across 160 countries for the period 1980 to 2004. Second, it regresses this
factor score on a series of key explanatory variables that feature in what has become known
as the „basic model‟ of human rights protection in primarily the political science literature
(see Landman 2005a, 2005b, 2006) and then saves the residual from the regression analysis
as a measure of the unexplained variance in human rights performance (see Duvall and
Shamir 1980; Arat 1991, Foweraker and Landman 1997; Cingranelli and Richards 2007).
This unexplained variance, in our view, captures the human rights performance of a country
after having controlled for economic, political, and social conditions in the country and thus
represents a relativized measure of that performance. Third, it plots this relativized
performance across regions and time, and against predicted or expected levels of performance
to show that despite the negative commentary on human rights conditions around the world,
some regions and countries are doing much better than expected given the other prevailing
socio-economic and political conditions that exist. It also shows that some regions are not
doing as well as they should. In this way, the paper offers a new way to think about human
rights country ranking that takes into account the relative performance of human rights.
The paper is structured in five parts. Part I outlines briefly existing standards-based measures
of human rights to show how they are derived and what scales have been developed. Part II
shows the bivariate relationships between all the measures for over 160 countries for the
period 1980 to 2004, explains how the factor index has been generated, and then shows its
basic features. Part III reviews the political science on the literature on the „basic model‟ of
human rights protection to show how we selected the key explanatory variables against which

4
the factor score is regressed. Part IV shows the relativized human rights measure for each
major region in the world over time and compares it to the predicted scores given the
presence of the key explanatory variables. The final section concludes by considering the way
forward and how this system can be used for relativising other categories of human rights.
Part I: Existing scales of human rights performance
The development of standards-based measures of human rights have moved from fairly broad
conceptions of the relative „freedom‟ in a country (www.freedomhouse.org) to more
narrowly defined sets of human rights that have in some cases included worker rights,
women‟s economic rights, and women‟s social rights (see www.humanrightsdata.com), as
well as measures of the de jure commitment of states to human rights through measuring the
treaty ratification behaviour of states (Keith 1999; Landman 2005). This present paper is
primarily concerned with the measures that capture the variable protection in civil and
political rights. In each of these examples outlined here, the producers of the data have used
source material on human rights practices within countries and applied coding protocols to
the information to derive a set of standardised and comparable measures for cross-national
and time-series analysis.
Freedom House
The first and most popular time-series standards-based measures of human rights was created
by Raymond D. Gastil, which measures political rights and civil liberties on a scale of 1 (full
protection and enjoyment of rights) to 7 (no protection or enjoyment of liberties). Gastil was
primarily interested in the rights of individuals as they vary across countries. Freedom
House, a non-governmental human rights organisation primarily based in the United States
sponsored the development of the scales, and in 1989, took over the job of coding countries

5
using the original Gastil scale (Ryan 1994). In its disaggregated form, it provides a guide to
the relationship between political and civil liberties over time, while in its aggregated form, it
shows the broad patterns in regime behaviour over time. There were many criticisms of the
Gastil scale (Barsh 1993), most of which focussed on the ways in which the scores are coded
from the source material. Gastil (1990) argued that he used a „mental checklist‟ that roughly
scored political liberties such as competitive elections, and civil liberties such as freedom of
the press and freedom of expression. But these general criteria have changed over the years
and when Freedom House took over the coding, it published a complete checklist for both
political and civil liberties (Ryan 1994), which are roughly the same as those employed by
Gastil.
These checklists were last updated in 2006 and the scoring system is now based on a
checklist of 10 political rights questions and 15 civil liberties questions. The political rights
questions are grouped into the three subcategories: Electoral Process (3 questions), Political
Pluralism and Participation (4), and Functioning of Government (3). The civil liberties
questions are grouped into four subcategories: Freedom of Expression and Belief (4
questions), Associational and Organizational Rights (3), Rule of Law (4), and Personal
Autonomy and Individual Rights (4). Points are awarded to these questions on a scale from 0
(small degree of rights and liberties present) to 4 (high degree of rights and liberties present).
The resulting raw points scores thus have a maximum value of 40 for political liberties (i.e.
up to 4 points for the 10 questions) and 60 for civil liberties (i.e. up to 4 points for the 15
questions). There is an additional discretionary question with respect to political liberties that
may result in between 1 and 4 points being subtracted from the total score. These raw points
scores are then converted into the two 7-point scales. The scales are comparable and rank
countries from good protection and/or enjoyment of rights and liberties (1) to bad protection

6
and/or enjoyment of these rights and liberties (7), which correspond to general conditions of
rights and liberties in the countries.
Over the years, the Freedom House scales have been used as a measure of state
repressiveness (Muller and Seligson 1987), the level of democracy (e.g. Burkhart and Lewis-
Beck 1994; Helliwell 1994; Munck and Verkuilen 2002), the rule of law (Knack 2002), and
now feature as one of the many components in the World Bank's measures of good
governance (Kaufman, Kraay, and Zoido Lobatón 1999a, 1999b, 2000, 2002). Despite this
variety of uses for the scales, it seems that at a base level, they are measures of civil and
political rights protection, and are best utilised in their separate form since combining them
into a single index can produce biases. For example, a country with a score of 2 in its political
rights and 4 in its civil liberties is indistinguishable form a country with a score of 4 in its
political rights and 2 in its civil liberties if the analysis adds the two scores to equal 6. The
data do provide comprehensive coverage of countries and time since 1972 and thus have been
used throughout academic studies in economics, political science, and international relations.
For example, it is a simple matter to plot the trends in the scales over time for all the
countries in the data set, one country in the data set, or to compare the relative protection of
political rights and civil liberties across different regions in the world. The data can also be
subjected to more sophisticated statistical techniques, including correlation and regression
analysis, which is why it remains popular within the academic and policy analysis
communities.
Political Terror Scale and the Scale of Torture
The dominant, and in many ways, more reliable standards-based scale of human rights is the
„political terror scale‟, which also was devised initially by Raymond Gastil in 1979. It was

7
then taken up by Michael Stohl in 1983 and has since been updated by a variety of academics
(Stohl, Carleton and Johnson 1984; Stohl and Carleton 1985; Dixon and Moon 1986; Stohl,
Carleton, Lopez, Samuels 1986; Gibney and Stohl 1988; Henderson 1991, 1993; Poe 1991,
1992; Gibney Dalton, and Vockell 1992; Moon and Dixon 1992; Poe and Sirirangsi 1993,
1994; Davenport 1995, 1996; Fein 1995). The political terror scale codes country
performance (i.e. primarily human rights performance of the state) on a 1 to 5 scale using the
annual reports produced by Amnesty International and the US State Department. Others have
labelled it as a measure of the protection of 'personal integrity rights', since it focuses on the
state use of extra-judicial killings, torture, political imprisonment and exile (see Poe and Tate
1994; Poe, Tate, and Keith 1999; Zanger 2000a, 2000b). The five different levels of the scale
code country human rights practices according to the different degrees and frequency with
which political integrity rights violations are reported across both sources of information. The
US State Department typically reports on many more countries than Amnesty International,
but the scale is produced for both sources, and social science analyses that have been
conducted using the political terror scale treat them separately, although more recently, factor
analysis has been used to find a common dimension among different standard-based scales of
human rights (see Landman and Larizza 2009).
The political terror scale was originally coded by one team, but now uses multiple teams,
which enhances its reliability. The procedure involves two different teams of coders who
code the country reports separately in the first instance and then compare their scores and
resolve any differences. This method of multiple coding teams is similar to the method
employed by truth commissions that adopted the „who did what to whom‟ model for events-
based data (see Chapter 4). In approximately 80% of the cases coded by the teams working
on the political terror scale, coders have come up with the same score for the country in any

8
given year, while discrepancies between the coders are adjudicated through the use of
additional coders and the main academics in charge of the project. The coders are instructed
to ignore their own biases, prejudices, and perceptions of the countries and to limit their
coding decisions to the information that is actually contained within the country reports
provided by the State Department or Amnesty International. Every attempt is made by the
coders to remain conservative in the exercise of their judgment in ways that give countries
„the benefit of the doubt‟ and yield scores that are slightly more favourable than the report
may suggest. Finally, coders use the additional insights provided by particular adjectives and
other descriptors in making their judgements. For example „reports of torture‟ is considered
less extreme than „widespread use of‟, which in turn is less severe than „systematic patterns
in‟, etc. (see www.politicalterrorscale.org).
The methodological strengths of the political terror scale have led to its adaptation by
Hathaway (2002: 1970-1971), who applies a similar five-point scale to measure the degree to
which torture is practised across the globe. The scale is derived directly from the legal
requirements found in the 1984 Convention on Torture and codes country practices based on
the US State Department reports only. Like the political terror scale, Hathaway uses a five
point scale that moves from no (or low) instances of torture (coded as 1) to widespread
instances of torture (5). These different categories for coding the torture scale contain a
discrete set of practices, key words, and decision rules for coding the narrative reports on
torture found in the US State Department reports. Hathaway (2002: 1972) reports 80%
agreement across her coding teams (Hathaway 2002: 1972). The torture scale was originally
used in Hathaway‟s (2002) analysis of the effectiveness of the international rights regime and
has featured in other cross-national and time-series analyses of human rights (see Landman
2005; Landman and Larizza 2009).

9
The political terror scale and the torture scale are directly comparable since they adopt the
same five point scale that is ordinal and interval, which is to say, the scales are based on the
assumptions that moving from one level to another denotes a worse set of practices and that a
move from a score of 2 to 3 is the same as a move from a score from 4 to 5. In other words,
the increase in severity is the same in moving across the different levels of these scales.
Torture, however, is but one type of human rights violation captured by the political terror
scale, such that the two measures are comparable and show similar trends, but are not
perfectly correlated with one another. The overall correlation between the torture scale and
the Amnesty version of the political terror scale is .61 (p < .001) and between the torture
scale and the State Department version of the political terror scale is .69 (p < .001).
Cingranelli and Richards (CIRI) Human Rights Data
Drawing on these developments in the provision of standards-based measures of human
rights, the David Cingranelli and David Richards provided data for thirteen different human
rights for 195 countries for the period from 1980 to 2006, making this one of the most
comprehensive cross-national time-series data collection on human rights in the world. The
data comprise 0-2 scales for ten of the rights and 0-3 scales for three of the rights, where, in
contrast to our previous examples of standards-based measures of human rights, a higher
score denotes better government respect for the particular human right. Since its inception,
the CIRI data have been coded using multiple teams and the project reports the inter-coder
reliability tests as a matter of course. Some of the separate scales are then used for aggregate
indices, including a physical integrity rights index (ranging from 0 to 8) and an empowerment
rights index (ranging from 0 to 10). The physical integrity rights index comprises a sum of
scores for torture, extrajudicial killing, political imprisonment, and disappearance. This

10
selection of measures maps well onto the political terror scale, but since it aggregates
separate measures, the contours and components that comprise it are more transparent to the
analyst. Moreover, the separate indices can be examined alongside the aggregate index to see
the ways in which particular rights violations drive an overall assessment and portrayal of
physical integrity rights violations.
Part II: A factor index of human rights performance
The last section showed that since the 1970s, scholars and practitioners have sought to
develop scales of human rights performance that can be compared across many countries and
time, and can be used to build and test empirical theories on the likely explanation for the
variation in human rights protection. The section also argued that most of these scales are
tracking similar dimensions of state violation of human rights, although the Hathaway (2002)
scale is specifically devoted to the measurement of torture. The similarity in approach and
focus suggests that these scales should be highly correlated with one another. A simple bi-
variate Pearson‟s correlations matrix (see Table 1) indicates the existence of clusters of large
and significant correlation coefficients between the human rights scales. The correlations for
the torture scale is the lowest across the board, which reflects its more narrow focus on this
form of human rights abuse, but the values within the table range from .498 to .822 and are
all at 99.9% levels of statistical significance.
[Table 1 about here]
Given this degree of agreement among the different scales, we used principal components
factor analysis to reduce the group of interrelated human rights variables. The analysis
revealed five components, but only one has an eigenvalue greater than 1 (i.e. 3.295) and
11
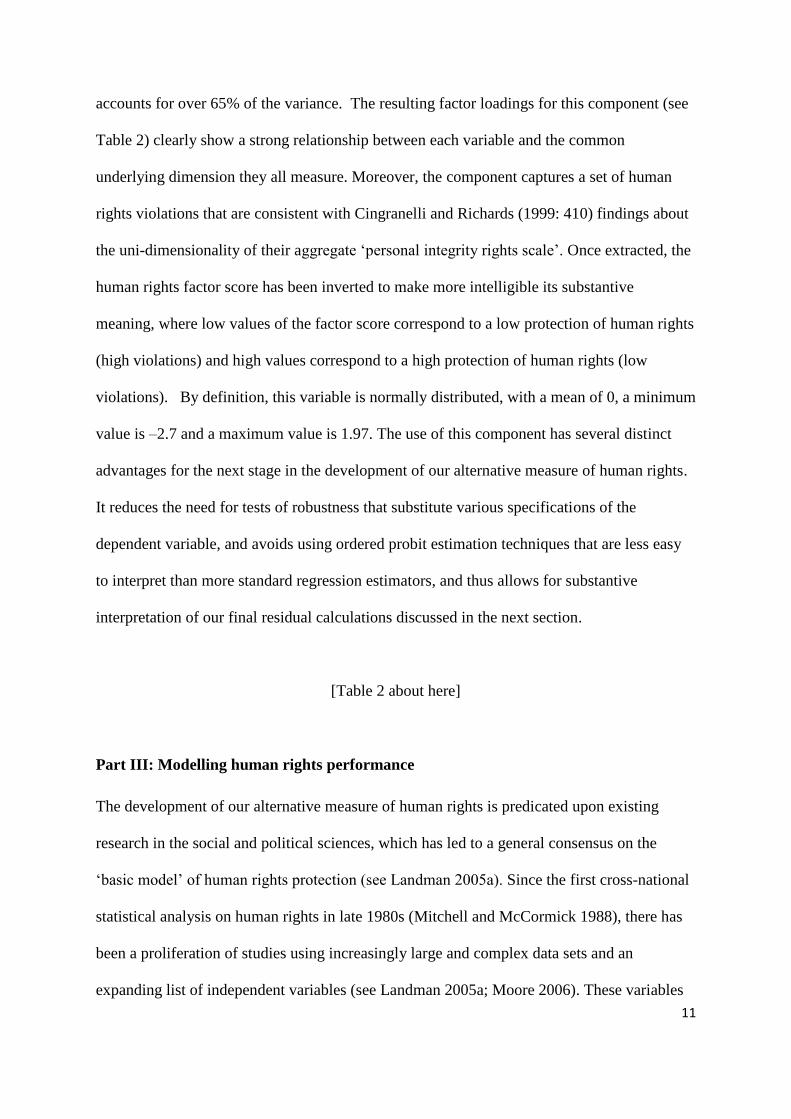
accounts for over 65% of the variance. The resulting factor loadings for this component (see
Table 2) clearly show a strong relationship between each variable and the common
underlying dimension they all measure. Moreover, the component captures a set of human
rights violations that are consistent with Cingranelli and Richards (1999: 410) findings about
the uni-dimensionality of their aggregate „personal integrity rights scale‟. Once extracted, the
human rights factor score has been inverted to make more intelligible its substantive
meaning, where low values of the factor score correspond to a low protection of human rights
(high violations) and high values correspond to a high protection of human rights (low
violations). By definition, this variable is normally distributed, with a mean of 0, a minimum
value is –2.7 and a maximum value is 1.97. The use of this component has several distinct
advantages for the next stage in the development of our alternative measure of human rights.
It reduces the need for tests of robustness that substitute various specifications of the
dependent variable, and avoids using ordered probit estimation techniques that are less easy
to interpret than more standard regression estimators, and thus allows for substantive
interpretation of our final residual calculations discussed in the next section.
[Table 2 about here]
Part III: Modelling human rights performance
The development of our alternative measure of human rights is predicated upon existing
research in the social and political sciences, which has led to a general consensus on the
„basic model‟ of human rights protection (see Landman 2005a). Since the first cross-national
statistical analysis on human rights in late 1980s (Mitchell and McCormick 1988), there has
been a proliferation of studies using increasingly large and complex data sets and an
expanding list of independent variables (see Landman 2005a; Moore 2006). These variables

12
most notably include the level, pace, and quality of economic development (e.g. Henderson
1991; Poe and Tate 1994; Poe, Tate, and Keith 1999); the level, timing, and quality of
democratization (e.g. Davenport 1999; Zanger 2000b; Davenport and Armstrong 2004;
Mesquita, Downs, Smith, and Sherif 2005); involvement in internal and external conflict (Poe
and Tate 1994; Poe, Tate, and Keith 1999); the size and growth of the population (Henderson
1993; Poe and Tate 1994; Poe Tate and Keith 1999); foreign direct investment and/or the
presence of multinationals (Meyer 1996; 1998; 1999a; 1999b; Smith, Bolyard, and Ippolito
1999); the level of global interdependence (Landman 2005b); and the growth and
effectiveness of international human rights law (Keith 1999; Hathaway 2002; Landman
2005b; Neumayer 2005; Hafner-Burton and Tsuitsui 2005, 2007; Simmons 2009).
Our goal is to regress the human rights factor score on a selection of key explanatory
variables and then save the residuals as a meaningful measure of human rights performance.
This method has been employed before in work on repression (Duvall and Shamir 1980),
democracy and human rights (Arat 1991; Coppedge 2005; Larizza 2008), citizenship rights
and social movements (Foweraker and Landman 1997), and economic and social rights
(Cingranelli and Richards 2007). The idea is simple and straightforward. It rests on the
assumption that there has been a well specified set of variables that account for the variation
in the dependent variable6, which in our case is the human rights factor score. This set of
variables explains a large degree of that variation but not all of it, and thus the unexplained
variation becomes our variable of interest, since it is that variation in human rights
performance that cannot be explained by our selection of variables. Let us consider this
6 This assumption, as it turns out, is often overlooked, where failure to provide a well-specified set of variables,
the residual is capturing a lot of „noise‟ and may not represent what it purports to represent. In retrospect the
analysis in Foweraker and Landman (1997) overlooked this problem with only one explanatory variable, and its
use in Cingranelli and Richards (2007) is also questionable since they have only two explanatory variables in
their model. We hope we overcome this problem in the present paper.

13
formally. Consider the standard regression equation for a pooled cross-section time-series
data set:
K
k
itkitkit xy1
Where, yit is the dependent variable for units i and time t (i.e. our human rights factor score
across countries and over time) and the xkit variables are that collection of variables that we
specify as accounting for variation in human rights performance that have emerged through
the last thirty years of cross-national research. The k values are the regression coefficients
that capture the relationship between each of the explanatory variables and the dependent
variable (these estimations tell us the magnitude, direction, and significance of the
relationship). The term is the intercept and the it term is the error, which in our case is the
key variable of interest, since this is the residual or unexplained variation in the dependent
variable. It is possible to illustrate this idea in simple graphical terms to capture our idea of
human rights „over‟ and „under‟ achievement in the sections that follow. Imagine a simple
bivariate relationship between our dependent variable y (human rights performance) and one
explanatory variable x (e.g. the level of economic development). We know from previous
research and our own analyses that economic development and human rights are positively
related, such that higher levels of economic development are associated with better protection
of human rights. This relationship is presented in Figure 1. The straight line comprises the
predicted values of y given the values of x. Denoted as Ŷ in standard regression notation; the
predicted values are the expected values of y for each value of x, while there are actual values
of y for each x that sit on the line, below the line, or above the line. If the actual values sit on

14
the line, there is no difference between the expected and actual values of Y; if they sit above
the line then there is a positive difference between the actual values and the expected values
(Yit – Ŷ > 0); and if they sit below the line then there is a negative difference between the
actual values and the expected values (Yjt – Ŷ < 0). In other words, for any given level of an
explanatory variable (x1 – xn), some countries have a human rights performance that is in line
with expectations, better than expected (i.e. a positive residual), or worse than expected (i.e. a
negative residual). We call countries with positive residuals „over-achievers‟ since their
human rights performance is better than expected and countries with negative residuals
„under achievers‟ since their human rights performance is worse than expected. The use of
the residuals thus captures our understanding of relativising human rights, since we are
calculating the residual in the presence of significant explanatory variables.
[Figure 1 about here]
Our selection of explanatory variables include income and land inequality, the level of
democracy, level of economic development, domestic conflict, population size, and ethnic
fractionalisation (see Landman and Larizza 2009). This collection of variables represents
those that have received the most support or generated the most consensus within the cross-
national quantitative research on human rights (see Landman 2005a, 2006, 2009 for a
summary). Each of these variables and the ways in which we operationalised them is
presented here.
Inequality
For income inequality, we use a new measure based on the „inequality project‟ (UTIP)
developed by James K. Galbraith and Hyunsub Kum at the University of Texas, Austin. In an

15
effort to overcome the well-known deficiencies of the Deininger and Squire (1996) data set
on income inequality (i.e. sparse coverage, problematic measurements, and the combination
of diverse data types into a single data set), Galbraith and Kum use the UTIP-UNIDO
measures of manufacturing pay inequality as an instrument to create a new panel data set of
Estimated Household income inequality (EHII), which covers a large panel of countries from
1963 through 1999, for nearly 3200 country-years. This new dataset provides comparable and
consistent measurements across space and through time, thus being a more valid proxy of
income inequality than the Deininger and Squire data usually employed by cross-national
empirical studies (Galbraith and Kum 2004). For our estimations, a linear interpolation of the
original EHII variable has been computed for each country-series to increase the number of
observations.
For land inequality, we use a measure that is expressed as the area of family farms as a
percentage of the total area of land holdings (Vanhanen 1997). The reasoning behind this
measure is that the higher the percentage of family farms, the more widely economic power
resources based on ownership patterns of agricultural land are distributed (Vanhanen 1997:
47). Family farms are defined as „holdings that are mainly cultivated by the holder family and
that are owned by the cultivator family or held in ownerlike possession‟ (Vanhanen 1997:
49). The data on landownership were mainly derived from the FAO World Censuses of
Agriculture (from the 1960s to the 1980s) and Vananhen‟s own estimations for the 1990s. As
with our income inequality data, these data have been interpolated to fill in missing time
points for those countries where two or more time points of data were made available. To
make this variable equivalent to income inequality in terms of its measurement of land
inequality, it has been inverted by subtracting the original percentage value from 100 such
that a low score means a more favourable distribution of land.

16
Other researchers have used different indicators to measure land inequality. The most
common alternative would have been the Gini index of land concentration (Russett et al.
1964; Muller and Seligson 1987). This type of index calculates „the difference between an
“ideal” cumulative distribution of land (where all farms are the same size) and the actual
distribution‟ (Russett et al 1964: 237-238). We prefer our measure to the Gini index for three
reasons. First, without controlling for the ownership of land, the Gini index does not
adequately capture the relative distribution of economic resources among those who cultivate
the land, and is thus insensitive to the kind of asset inequality we believe is most likely to be
related to human rights abuses. Second, Brockett‟s (1992: 172) empirical analysis clearly
demonstrates that land distribution data based on the Gini index tend to underestimate land
maldistribution in countries characterized by the prevalence of landlessness among peasants.
Third, the necessary data on the number and size of land holdings (required to compute the
Gini Index) are not available for most of the developing countries, thereby seriously
compromising the global perspective of our study (Vanhanen 1997: 50). The alternative
measure of land inequality adopted by Prosterman and Reidinger (1987) would be more in
line with our purposes, but again of limited practical utility given its small coverage.
Democracy
For the level of democracy, we use the Polity IV 20-point combined democracy score
(DEMOC – AUTOC), which ranges from -10 to + 10. The variable POLITYIV2 – which is
also used here - incorporates the authors recommendations for transforming Polity
„standardized authority codes‟ (i.e., -66, -77, and -88 for interruption, interregnum or
transition) to scaled POLITY scores so that the variable may be used consistently in time-
series analyses without losing crucial information by treating the „standardized authority
scores‟ as missing values. Give the large number of consistent findings for the positive

17
relationship between democracy and human rights (see Poe and Tate 1994; Poe Tate, and
Keith 1999; Davenport 1999; Zanger 2000; Davenport and Armstrong 2004; Mesquita,
Downs, Smith, and Sherif 2005), we also expect a positive relationship for this variable.
Ethnic fractionalization
The level of ethnolinguistic fractionalization is measured using data from Alesina et al.
(2003). The fractionalization index is computed by using the Herfindahl index of
ethnolinguistic group shares, which represents and improvement over existing measures (e.g.
La Porta 1999) by compiling a separate variable for ethnic fragmentation. Their main goal is
„to clearly distinguish between ethnic, religious and linguistic heterogeneity‟, where
„[a]lternative indicators tend to lump together ethnic and linguistic differences as part of an
“ethnolinguistic” fractionalization variable‟ (Alesina et al. 2003: 158). Since their measure is
more disaggregated it has the potential for better differentiation between the dimensions of
fractionalization, even though some of those dimensions can be overlapping. This variable is
included since several studies on ethnic conflicts have shown that multi-cultural societies are
especially prone to political instability, domestic violence, and eventually state terror, as
authorities are more likely to resort to coercive means to deal with ethnically-based
mobilizations and acts of political dissents (Walker and Poe 2002; Rabushka and Shepsle
1972). In our preliminary analysis of this variable, we discovered that its relationship with the
protection of human rights is curvilinear such that up to a point increasing fractionalisation is
negatively related to the protection of human rights, but then declines as the level of
fractionalization increases. In other words, countries with a small number of distinct lines of
ethnic cleavage tend to have worse protection of human rights, while this with a large
plurality of groups tend to have better protection of human rights. We thus specify our model
to include a squared term of this variable to take into account this particular functional form.

18
Domestic conflict
As in the research on human rights and political violence, we include a variable for internal
domestic conflict, which is specified as an independent variable alongside the other variables
in our model. We do not use the simple dummy variable for civil war from the Correlates of
War project as in much of extant work on human rights, nor do we use events-based
measures of the kind coded from single and multiple news sources found in the literature on
political violence. The civil war dummy is still a fairly crude variable that tends to absorb
quite a lot of the explanatory space in most human rights literature (see Poe and Tate 1994)
and the events-based measures have proved to be fairly insecure for the kind of cross-national
and time-series comparisons conducted here on grounds of validity and reliability. We thus
employ the International Country Risk Guide (ICRG) measure of internal conflict, which is
an aggregate 12-point scale that comprises the overall risk levels for civil war and threat of a
military coup, terrorism and political violence, and general levels of civil disorder. We feel
that this measure is superior in some respects since it provides greater variance than the civil
war dummy and perhaps greater validity than the event-based measures of conflict to date.
We expect this variable to have a negative relationship with the protection of human rights,
which is consistent with the findings in both literatures.
Other control variables
The level of economic development is measured through the natural log of the value of real
per capita income (GDP, constant 2000 US $), and is taken from the World Bank
Development Indicators. We expect this variable to have a positive relationship with the
protection of human rights. Total population size is based on de facto definition of
population, which counts all residents regardless of legal status or citizenship--except for
refugees not permanently settled in the country of asylum, which are generally considered

19
part of the population of their country of origin. The variable is taken from the World Bank
and has been logged to correct for skewed distribution. We expect this variable to have a
negative relationship with the protection of human rights, since more populous countries tend
to have greater difficulty in protecting personal integrity rights.
Methods of Estimation
Our data set follows by now what has become a standard construction of a matrix of cross-
section and time-series units, where variation in the variables and the number of observations
are maximised across time and space. Such data sets do, however present a number of
problems for estimating parameters using standard regression techniques. First, the error
terms tend to be correlated from one time period to the other (serial correlation). Second, the
error terms tend to be heteroskedastic, which means that they tend to have different variances
across units (Stimson 1985: 19; Beck and Katz 1995: 637-638). To control for serial
correlation, we model the dynamics of our data by introducing a Prais-Winsten (first order)
autoregressive transformation. To control for heteroskedasticity, we adopt a variation of
White‟s (1980) estimator of robust standard errors that adjusts for clustering across countries.
In addition to the standard problems mentioned above, our data set has the additional
problems of unit-specific effects associated with time invariant or nearly time invariant
variables (Plümper and Troeger 2007). In other words, some of our variables do not vary
much or at all over time, and we need a method for controlling for this feature of some of our
variables. When unit effects are present, but not explicitly modelled, their presence is picked
up in the error term, and consequently, if these unit effects are then correlated with one or
more explanatory variables, the error term too will be correlated with the explanatory
variables, and simple ordinary least squares (OLS) would produce biased coefficient

20
estimates. Plümper and Troeger (2007) have devised a three-stage regression technique
known as “fixed-effects-vector-decomposition” (FEVD) that „decomposes‟ the explained and
unexplained elements of the fixed effects and produces final estimates that take into account
the particular qualities of time invariant or nearly time invariant variables.
In order to identify the time invariant and nearly time invariant variables in our data set we
compared the „between-unit‟ variation to the „within-unit‟ variation (see Table A1), which is
to say, we examined the variation in a variables across different countries and within our
countries. We then used the rule of thumb that those variables for which „between variation‟
is 2.5 times larger than „within variation‟ we specify as invariant or nearly invariant. Those
variables for which this is the case include income and land inequality; per capita GDP;
population size; and both forms of the ethnic fractionalization variable. We thus adopt the
fixed effect vector decomposition method of estimation and specify these variables in the
FEVD procedure as invariant. By doing so, we successfully combine the benefits of an
increased number of observations with the ability to control for unobservable country-
specific differences, eliminating much of the omitted variable bias of cross-section data.
FEVD thus represents the most appropriate method of estimation for calculating the residuals
in the ways that capture the relative human rights performance that is the main focus of this
paper.
Part IV: Relativizing human rights and a new country ranking
The previous two sections of the paper explained how we derived the human rights factor
score by combining existing measures of human rights and how we calculated the residuals
using the FEVD method of estimation. This section shows the different ways in which the
residuals can be used to compare and contrast human rights performance across and within

21
regions of the world, and how the picture that emerges is different if only the original scores
had been used. Throughout this section of the paper, we present the time-series trends in the
residuals alongside the predicted values, which allows for an assessment of how regions are
doing in light of where they ought to be, all things being equal. Figure 2 show the global
time-series trend in predicted human rights performance and the global average for the
residuals. It is clear that for the world, countries had been doing slightly better than expected
up until the end of the Cold War, when the overall pattern in performance reversed and
countries on average started to exhibit patterns in human rights performance that were
slightly worse than expected, a trend that continues until the end of the period despite some
evidence of fluctuation in the mid-1990s.
</Figure 2 about here/>
Figure 3 shows the predicted values alongside the residuals for all regions in the world.
Comparing across the different regional graphs shows that some regions in absolute terms are
doing better than others, where the OECD countries have the highest levels of performance,
followed by Eastern Europe, Latin America, Asia, Sub-Saharan Africa, and the Middle East.
But, more importantly, the figure also shows that within regions, some regions are doing as
well as can be expected given the other underlying and prevailing factors at work. This
relative performance seems important to us, since it is often absolute levels that are used by
academics and policymakers rather than taking into consideration the underlying factors and
then looking at those levels of performance that remain unexplained. The six regions in
Figure 3 are discussed in turn with reference to specific charts for each.

22
The trends in the OECD (Figure 4), as expected, are highest in absolute terms in comparison
to the other regions in the world, but as against their own expected values (given the relative
values of all their independent variables), we can see that the region has shown a downward
trend in performance from the mid-1990s. This trend can in part be explained by the new
membership of the OECD by „transitional‟ countries, including Mexico (1994), Czech
Republic (1995), Hungary (1996), Korea (1996), Poland (1996), and Slovak Republic
(2000).7 For Eastern Europe (Figure 5), remarkable progress has been made over the period
both in expected and actual terms, but the actual performance remains consistently below that
which is expected given the trends in the other variables. For Latin America (Figure 6), the
expected level of performance shows a positive trend with variable achievement in actual
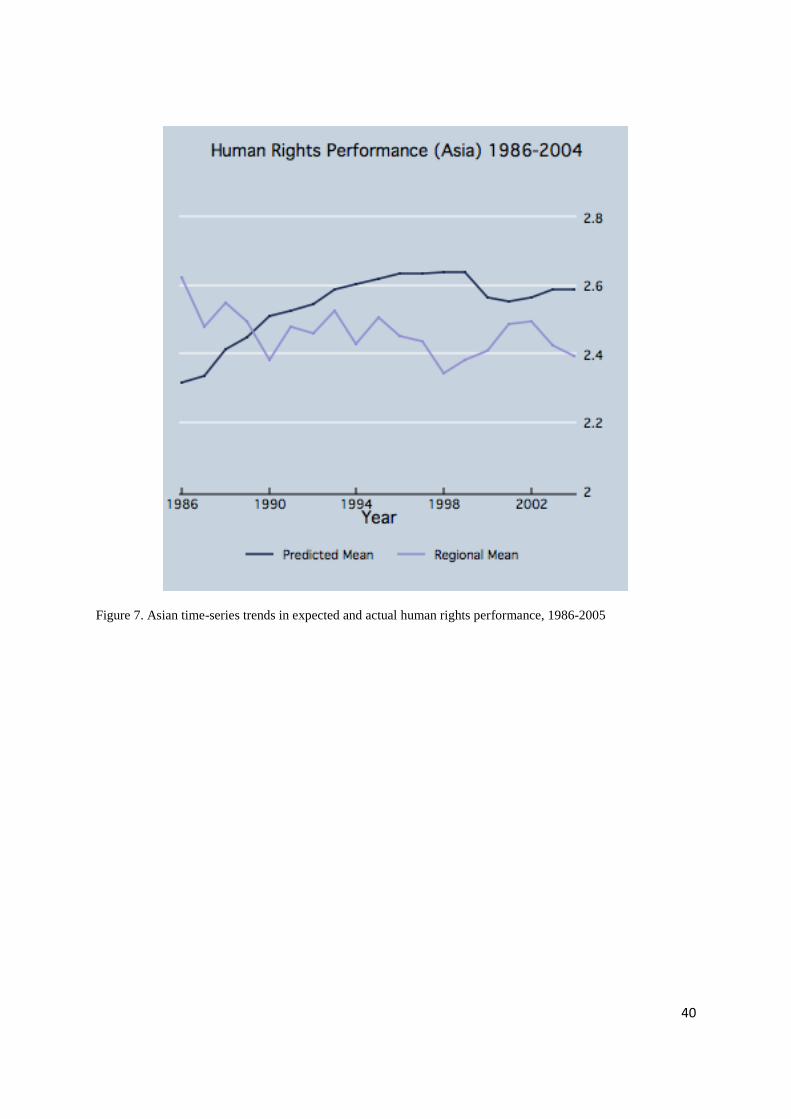
performance that becomes consistently positive towards the second half of the period. Asian
performance (Figure 7) has developed from a period of over-achievement in the 1980s to one
of under-achievement since 1990 even though the region as a whole ranks fourth out of all
the regions. The trends in Sub-Saharan Africa (Figure 8) show similar patterns of over and
under achievement as in Asia, but from the late 1990s, the actual performance has caught uop
to expected performance in ways that are not yet apparent in Asia. Finally, the Middle East
(Figure 9) has the overall lowest levels of performance among the regions, and its trends in
actual performance have exceeded expected levels in the early part of the period, fell far
below expected performance levels throughout the 1990s, and have shown improvement
toward the end of the period where actual performance once again exceeds expected
performance.
</Figures 4-9 about here/>
7 See www.oecd.org for a list of all member state ratification dates of the Convention on the Organisation for
Economic Cooperation and Development.
23
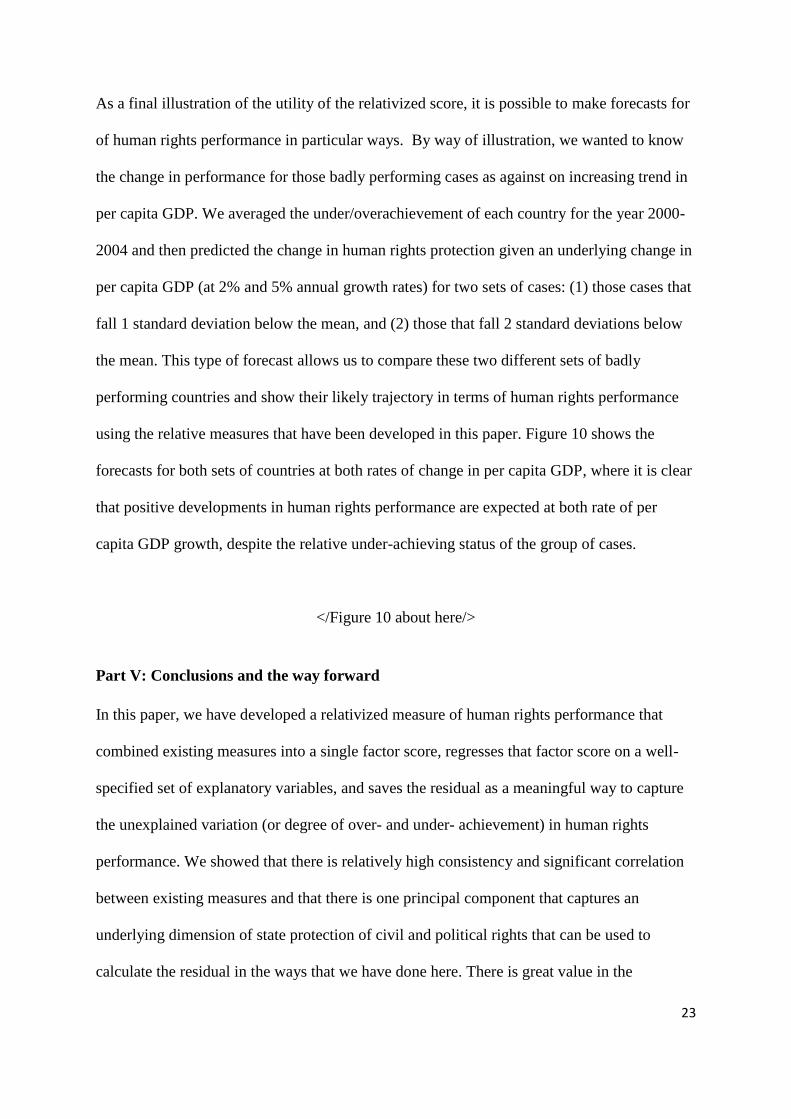
As a final illustration of the utility of the relativized score, it is possible to make forecasts for
of human rights performance in particular ways. By way of illustration, we wanted to know
the change in performance for those badly performing cases as against on increasing trend in
per capita GDP. We averaged the under/overachievement of each country for the year 2000-
2004 and then predicted the change in human rights protection given an underlying change in
per capita GDP (at 2% and 5% annual growth rates) for two sets of cases: (1) those cases that
fall 1 standard deviation below the mean, and (2) those that fall 2 standard deviations below
the mean. This type of forecast allows us to compare these two different sets of badly
performing countries and show their likely trajectory in terms of human rights performance
using the relative measures that have been developed in this paper. Figure 10 shows the
forecasts for both sets of countries at both rates of change in per capita GDP, where it is clear
that positive developments in human rights performance are expected at both rate of per
capita GDP growth, despite the relative under-achieving status of the group of cases.
</Figure 10 about here/>
Part V: Conclusions and the way forward
In this paper, we have developed a relativized measure of human rights performance that
combined existing measures into a single factor score, regresses that factor score on a well-
specified set of explanatory variables, and saves the residual as a meaningful way to capture
the unexplained variation (or degree of over- and under- achievement) in human rights
performance. We showed that there is relatively high consistency and significant correlation
between existing measures and that there is one principal component that captures an
underlying dimension of state protection of civil and political rights that can be used to
calculate the residual in the ways that we have done here. There is great value in the

24
relativized scoring system since it allows for systematic a comparison of the expected and
actual levels of performance for the whole world and separate regions over time. The scores,
in turn, allow for the comparison of absolute differences and relative differences that control
for other underlying factors that explain the variation human rights performance. Thus, it is
possible to show that one region is doing better than another, but in our view more
importantly, it is possible to show the degree of progress within a region as against where it
ought to be given the presence of other domestic variables. It also eliminates many of the
political arguments about differences in capability and capacity owing to differences, for
examples, in levels of development and democracy. Rather, it controls for those and other
factors and then allows for the comparison of human rights performance.
There is still more work to be done in extending this method to other sets of rights. For
example, we should with very little difficulty by able to replicate our model for certain sets of
economic and social rights, as found, for example, in the Cingranelli and Richards human
rights data project. We also believe that the these scores can be combined with GIS software
to produce human rights performance maps that chart the degree of over and under
achievement in an easy to understand format for policy makers and private companies
interested in the relative human rights performance of countries. Finally, the forecasting work
is of great value to examine the world‟s worst performers and to inform those interested in
some form of directed policy intervention aimed at improving the human rights conditions in
particular parts of the world. For example, the findings in this paper can be used to produce more
stylized depictions of country rankings that plot relative performance against actual performance for
given years to group countries into performance categories that would be of interest to popular
publications such as the Economist and others. We do hope that this paper and the method that it

25
develops will be of enduring value to the community of scholars and practitioners working in
this exciting field.

26
References
Alesina et al. (2003) „Fractionalization‟, Journal of Economic Growth 8, 155-194.
Amnesty International (2007) „From burning buses to caveirões‟: the search for human
security‟, London: Amnesty International, 2 May 2007; AMR 19/010/2007.
Arat, Zehra (1991) Democracy and Human Rights in Developing Countries, Boulder: Lynn
Rienner .
Barsh, R. L. (1993) „Measuring Human Rights: Problems of Methodology and Purpose‟,
Human Rights Quarterly, 15(1): 87-121.
Beck, N. and Katz, J. N. (1995) 'What to Do (And Not to Do) with Time-Series Cross-
Section Data', American Political Science Review, 89 (3): 634-47.
Brockett, Charles D. (1992) „Measuring Political Violence and Land Inequality in Central
America‟, American Political Science Review 86 (1): 169-176.
Bueno de Mesquita, B., Downs, G. W., Smith, A. and Cherif, F. M. (2005) „Thinking Inside
the Box: A Closer Look at Democracy and Human Rights‟, International Studies Quarterly,
49: 439-457.
Burkhart, R. E. and Lewis-Beck, M. (1994) „Comparative Democracy, the Economic
Development Thesis‟, American Political Science Review, 88(4): 903-10.
Claude, R. P. and Jabine, T. B. (1992) „Exploring human rights issues with statistics‟ in T. B.
Jabine and R. P. Claude (eds.) Human Rights and Statistics: Getting the Record Straight,
Philadelphia: University of Pennsylvania Press.
Coppedge, M. (2005) “Explaining Democratic Deterioration in Venezuela Through Nested
Inference,” in Frances Hagopian and Scott Mainwaring, eds., The Third Wave of
Democratization in Latin America, Cambridge: Cambridge University Press, 289-316.
Davenport, C. (1995) „Multi-dimensional threat perception and state repression‟, American
Journal of Political Science, 39(3): 683-713.
Davenport, C. (1996) „“Constitutional promises” and repressive reality: A cross-national
time-series investigation of why political and civil liberties are suppressed‟, The Journal of
Politics, 58(3): 627-54.
Davenport, C. and Armstrong, D. A. (2004) „Democracy and the violation of human rights: A
statistical analysis from 1976 to 1996‟, American Journal of Political Science, 48(3): 538-
554.
Deininger, K. and Squire, L. (1996) „A New Data Set Measuring Income Inequality‟, World
Bank Economic Review, 10, 565-591.

27
Dixon, W. J. and Moon, B. E. (1986) „The military burden and basic human-needs‟, Journal
of Conflict Resolution, 30(4): 660-684.
Duvall, R. and Shamir, M. (1980) „Indicators from Errors: Cross-National Time-Serial
Measures of the Repressive Disposition of Government,‟ in Charles Lewis Taylor (ed)
Indicator Systems for Political, Economic, and Social Analysis (Cambridge, MA:
Oegeschlager, Gunn and Hain Publishers, Inc., 155-82.
Fein, H. (1995) „More murder in the middle: Life integrity violations and democracy in the
world”, Human Rights Quarterly, 17(1): 170-91.
Foweraker, J. and Landman T. (1997) Citizenship Rights and Social Movements: A
Comparative and Statistical Analysis, Oxford: Oxford University Press.
Galbraith, J. K. and Kum, H. (2004) „Estimating the Inequality of Household Incomes: A
Statistical Approach to the Creation of a Dense and Consistent Global Data Set‟, UTIP
Working Paper N.22 (revised version), [online]
http://utip.gov.utexas.edu/papers/utip_22rv5.pdf
Gastil, R. D. (1990) „The comparative survey of freedom: Experiences and suggestions‟
Studies in Comparative International Development, 25: 25-50.
Gibney, M. and M. Dalton (1996) "The Political Terror Scale", in D. Cingranelli, Human
Rights and Developing Countries (Greenwich, CT: JAI Press, 73-84.
Gibney, M., Dalton, M.and Vockell, M. (1992) „USA refugee policy: A human rights
analysis update", Journal of Refugee Studies, 5(1): 37-46.
Gibney, M. and Stohl, M. (1988) „Human rights and US refugee policy‟ in M. Gibney (ed.)
Open Borders? Closed Societies? The Ethical and Political Issues, Westport, CT:
Greenwood Press.
Goertz, G. (2006) Social Science Concepts: A User’s Guide, Princeton and Oxford: Princeton
University Press.
Hafner-Burton, E. M. and Tsutsui, K. (2005) „Human rights practices in a globalizing world:
The paradox of empty promises‟, American Journal of Sociology, 110(5): 1373-1411.
Hafner-Burton, E. M. and Tsutsui, K. (2007) „Justice Lost! The failure of international human
rights law to matter where needed most‟, Journal of Peace Research, 44(4): 407-425.
Hathaway, O. (2002) „Do treaties make a difference? Human rights treaties and the problem
of compliance‟, Yale Law Journal, 111: 1932-2042.
Helliwell, J. F. (1994) „Empirical linkages between democracy and economic growth‟,
British Journal of Political Science, 24: 225-48.

28
Henderson, C. (1991) „Conditions affecting the use of political repression‟, Journal of
Conflict Resolution, 35(1): 120-142.
Henderson, C. (1993) „Population pressures and political repression‟, Social Science
Quarterly, 74: 322-33.
Kaufmann, D., Kraay, A. and Zoido-Lobaton, P. (1999a) „Aggregating governance
indicators", Policy Research Working Paper No. 2195, Washington DC: The World Bank.
Kaufmann, D., Kraay, A. and Zoido-Lobaton, P. (1999b) „Governance matters‟, Policy
Research Working Paper No. 2196, Washington DC: The World Bank.
Kaufmann, D., Kraay, A. and Zoido-Lobaton, P. (2000) „Governance matters: From
measurement to action‟, Finance and Development, 37(2): 10-12.
Kaufmann, D., Kraay, A. and Zoido-Lobaton, P. (2002) „Governance matters II: Updated
indicators for 2000-01‟, Policy Research Working Paper No. 2772, Washington DC: The
World Bank.
Keith, L. C. (1999) „The United Nations International Covenant on Civil and Political Rights:
Does it make a difference in human rights behaviour?‟ Journal of Peace Research, 36(1): 95-
118.
Knack, S. (2002) Governance and Growth: Measurement and Evidence, Forum Series on the
Role of Institutions in Promoting Growth, Washington DC: IRIS Center and USAID.
Landman, T. (2002) „Comparative politics and human rights‟, Human Rights Quarterly,
24(4): 890-923.
Landman, T. (2003) Issues and Methods in Comparative Politics: An Introduction, 2nd
Edition, London: Routledge.
Landman, T. (2004) „Measuring human rights: Principle, practice and policy‟, Human Rights
Quarterly, 26: 906-931.
Landman, T. (2005a) Protecting Human Rights: A Comparative Study, Washington D.C.:
Georgetown University Press.
Landman, T. (2005b) „Review article: The political science of human rights‟, British Journal
of Political Science, 35(3): 549-572.
Landman, T. (2006a) Studying Human Rights, London and New York: Routledge.
Landman, T. (2006b) Human Rights and Social Exclusion Indicators: Concepts, Best
Practices, and Methods for Implementation, Report prepared for the UK Department for
International Development (DFID), on file with authors.

29
Landman, T. (2008) Issues and Methods in Comparative Politics: An Introduction, 3rd
Edition, London: Routledge.
Landman, T. (2009a) „Measuring human rights‟ in M. Goodhart (ed) Human Rights: Politics
and Practice, Oxford: Oxford University Press, 45-58.
Landman, Todd (2009b) „Political Science and Human Rights‟, in Rhiannon Morgan and
Bryan Turner (eds) Interpreting Human Rights, London: Routledge, 23-43.
Landman, T. and Larizza, M. (2009) „Inequality and human rights: Who controls what, when,
and how‟, International Studies Quarterly, 53 (3): 715-736.
Larizza, M. (2008) The State, Democracy and Human Rights: Latin America in Comparative
Perspective, Unpublished PhD Dissertation, University of Essex, DXN 121856.
Mitchell, N. and McCormick, J. M. (1988) „Economic and political explanations of human
rights violations‟, World Politics, 40: 476-498.
Moon, B. and Dixon, W. (1985) „Politics, the state, and basic human needs: A cross-national
study‟, American Journal of Political Science, 29(4): 661-94.
Moon, B. and Dixon, W. (1992) „Basic needs and growth-welfare trade-offs‟, International
Studies Quarterly, 36(2): 191-212.
Moore, W. (2006) „Synthesis v. Purity and Large-N Studies: How Might We Assess the Gap
between Promise and Performance?‟ Human Rights and Human Welfare, 6: 89-97.
Meyer, W. (1996) „Human rights and MNCs: Theory versus quantitative analysis‟, Human
Rights Quarterly, 18(2): 368-397.
Meyer, W. (1998) Human Rights and International Political Economy in Third World
Nations, London: Praeger.
Meyer, W. (1999a) „Confirming, infirming, and "falsifying" theories of human rights:
Reflections on Smith, Bolyard, and Ippolito through the lens of Lakatos‟, Human Rights
Quarterly, 21(1): 220-228.
Meyer, W. (1999b) „Human rights and international political economy in third world nations:
Multinational corporations, foreign aid, and repression‟, Human Rights Quarterly, 21(3):
824-830.
Muller, E. N. and Seligson, M. A. (1987) „Inequality and insurgency,‟ American Political
Science Review, 81(2): 425-451.
Munck, G. and Verkuilen, J. (2002) „Conceptualizing and measuring democracy: evaluating
alternative indices‟, Comparative Political Studies, 35: 5-34.

30
Neumayer, E. (2005) „Do international human rights treaties improve respect for human
rights?‟, Journal of Conflict Resolution, 49(6): 925-953.
Plümper, T. and Troeger, V. (2007) Efficient Estimation of Time Invariant and Rarely
Changing Variables in Panel Data Analysis with Unit Effects, Political Analysis 15: 124-139.
Poe, S. and Sirirangsi, R. (1993) „Human rights and U.S. economic aid to Africa‟,
International Interactions, 18(4): 1-14.
Poe, S. and Sirirangsi, R. (1994) "Human rights and U.S. economic aid during the Reagan
years‟, Social Science Quarterly, 75: 494-509.
Poe, S. and Tate, C. N. (1994) „Repression of human rights to personal integrity in the 1980s:
A global analysis‟, American Political Science Review, 88: 853-872.
Poe, S., Tate, C. N. and Keith, L. C. (1999) „Repression of the human right to personal
integrity revisited: A global cross-national study covering the years 1976-1993‟,
International Studies Quarterly, 43: 291-313.
Prosterman, Roy L. and Jeffrey M. Riedinger (1987) Land Reform and Democratic
Development (Baltimore: John Hopkins University Press).
Rabushka, A. and Shepsle, K. A. eds. (1972) Politics in Plural Societies: A Theory Of
Democratic Instability, Columbus, Ohio: Merrill.
Russett, B. M., Alker, H.R., Deutsch, K. W. and Lasswell, H.D. (1964) World Handbook of
Political and Social Indicators, New Haven: Yale University Press.
Ryan, J. E. (1994) „Survey methodology‟, Freedom Review, 25(1): 9-13.
Simmons, Beth (2009) Mobilizing for Human Rights: International Law in Domestic Politics,
Cambridge: Cambridge University Press.
Smith, J., Bolyard, M. and Ippolito, A. (1999) „Human rights and the global economy: A
response to Meyer‟, Human Rights Quarterly, 21(1): 207-219.
Stimson, J. (1985) „Regression in Space and Time: A Statistical Essay,‟ American Political
Science Review, 29: 914-47.
Stohl, M. and Carleton, D. (1985) „The foreign policy of human rights: Rhetoric and reality
from Jimmy Carter to Ronald Regan‟, Human Rights Quarterly, 7(2): 205-229.
Stohl, M., Carleton, D. and Johnson, S. (1984) „Human rights and US foreign assistance from
Nixon to Carter‟, Journal of Peace Research, 21(3): 215-226.
Stohl, M., Carleton, D., Lopez, G. and Samuels, S. (1986) „State violations of human rights:
issues and problems of measurement‟, Human Rights Quarterly, 8: 592-606.
Vanhanen, T. (1997) The Prospects of Democracy, London: Routledge.

31
Walker, S. and Poe, S. (2002) ‘Does Cultural Diversity Affect Countries' Respect for Human
Rights?‟, Human Rights Quarterly, 24:1, pp. 237-263.
White; Halbert (1980), „A Heteroskedasticity-Consistent Covariance Matrix Estimator and a
Direct Test for Heteroskedasticity‟, Econometrica 48 (4): 817-838.
Zanger, S. C. (2000a) „Good governance and European aid: The impact of political
conditionality‟, European Union Politics, 1(3): 293-317.
Zanger, S. C. (2000b) „A global analysis of the effect of regime change on life integrity
violations, 1977-93‟, Journal of Peace Research, 37(2): 213-233.

32
Table 1: Human Rights scales correlations
Variable
PTS (AI) PTS (SD) Torture Scale Freedom
House
Civil Liberties
CIRI Physical
Integrity Index
PTS (AI) Pearson
Correlation
1 .820** .606** .512** .774**
Sig. (2-tailed) .000 .000 .000 .000
N 3362 3322 1936 3296 3058
PTS (SD) Pearson
Correlation
.820** 1 .683** .589** .822**
Sig. (2-tailed) .000 .000 .000 .000
N 3322 3647 2112 3576 3318
Torture Scale Pearson
Correlation
.606** .683** 1 .498** .685**
Sig. (2-tailed) .000 .000 .000 .000
N 1936 2112 2198 2138 2059
Freedom
House Civil
Liberties
Pearson
Correlation
.512** .589** .498** 1 .591**
Sig. (2-tailed) .000 .000 .000 .000
N 3296 3576 2138 3751 3378
CIRI Physical
Integrity Index
Pearson
Correlation
.774** .822** .685** .591** 1
Sig. (2-tailed) .000 .000 .000 .000
N 3058 3318 2059 3378 3445
** Correlation is significant at the 0.01 level (2-tailed).

33
Table 2: Component loadings
Extracted Component
PTS (AI) .845
PTS (SD) .909
Torture Scale .684
Freedom House Civil Liberties .720
CIRI Physical Integrity Index .877
Extraction Method: Principal Component Analysis (PCA)
Eigenvalue for extracted component = 3.295

34
Ŷ [expected human rights protection]
Explanatory variables(X1-Xn)
Low High
Low
HighP
rote
cti
on
of
hu
man
rig
hts
Yit
Yjt
Yit-Ŷ > 0 [human rights over achiever]
Yjt-Ŷ < 0 [human rights under achiever]
Figure 1. Human rights over achievers and underachievers

35
Figure 2. Global time series trends in expected and actual human rights performance, 1986-2005.

36
Figure 3. Regional time-series trends in expected and actual human rights performance, 1986-2005

37
Figure 4. OECD time-series trends in expected and actual human rights performance, 1986-2005

38
Figure 5. Eastern European time-series trends in expected and actual human rights performance, 1986-2005

39
Figure 6. Latin American time-series trends in expected and actual human rights performance, 1986-2005
40
Figure 7. Asian time-series trends in expected and actual human rights performance, 1986-2005

41
Figure 8. Sub-Saharan Africa time-series trends in expected and actual human rights performance, 1986-2005

42
Figure 9. Middle East time-series trends in expected and actual human rights performance, 1986-2005

43
Figure 10. Forecasting human rights performance for under-achievers against two rates of change in per capita
GDP, 2010-2020

44
Table A1: Independent variables used in the statistical analysis (summary statistics with between and within
variation)
Variable Mean St. Dv. Min Max N
Income Inequality Overall 43.48 7.16 20.07 64.75 3306
between 7 20.76 58.13
within
2.09 31.98 61.81
Land Inequality Overall 52.92 20.99 2 100 3229
between 20.14 4.12 92.44
within
.57 9.62 83.86
Level of Democracy Overall .91 7.42 -10 10 3541
between 6.37 -10 10
within
3.77 -13.63 13.03
Ethnic fragmentation Overall .46 .26 0 .93 3802
between .26 0 .93
within
0 .46 .46
Ethnic fragmentation sq. Overall .28 .24 0 .87 3802
between .24 0 .87
within
0 .28 .28
Domestic conflict Overall 3.41 2.83 0 12 2630
between 2.16 0 9.16
within
1.80 -2.29 10.08
Population size Overall 15.93 1.54 12.30 20.98 4016
between 1.54 12.47 20.86
within .16 13.52 16.68
Economic Development Overall 7.43 1.59 3.80 10.78 3568
between 1.56 4.57 10.38
within .22 5.16 8.70
Recommended