Renewable Energy Desalination:
An Emerging Solution to Close Middle
East and North Africa’s Water Gap

i
Contents
RENEWABLE ENERGY DESALINATION: ................................................................................ I
AN EMERGING SOLUTION TO CLOSE MIDDLE EAST AND NORTH AFRICA’S WATER
GAP ............................................................................................................................................ I
PREFACE ................................................................................................................................ VII
ACKNOWLEDGMENTS AND CONTRIBUTIONS ..................................................................... 1
ABBREVIATIONS AND ACRONYMS ....................................................................................... 3
EXECUTIVE SUMMARY ........................................................................................................... 5
1. INTRODUCTION ...........................................................................................................16
2. WATER DEMAND AND SUPPLY IN THE MENA REGION ..........................................19
OVERVIEW ..............................................................................................................................19
CLIMATE CHANGE WILL AFFECT MENA’S FUTURE WATER SUPPLY ..............................20
Future Water Availability .............................................................................................25
CURRENT AND FUTURE WATER DEMAND ..........................................................................27
Domestic Demand .......................................................................................................27
Industrial Demand .......................................................................................................29
Irrigation Demand ........................................................................................................29
Regional Water Balance ..............................................................................................31
Future Water Balance ..................................................................................................31
Assessment of Individual Countries ..........................................................................33
3. THE IMPERATIVE FOR DEMAND AND SUPPLY MANAGEMENT .............................36
OVERVIEW ..............................................................................................................................36
Improving Institutions .................................................................................................36
DEMAND MANAGEMENT .......................................................................................................38
ii
Agricultural Policy Reform .........................................................................................38
Improving the Efficiency of Water Allocation and Use .............................................39
Reducing Perverse Incentives ....................................................................................40
Managing Domestic Demand ......................................................................................42
SUPPLY MANAGEMENT OPTIONS ARE LIMITED ................................................................44
Groundwater ................................................................................................................45
Recycling Wastewater .................................................................................................45
Recycled Water: Lessons Learned ............................................................................46
4. POTENTIAL FOR DESALINATION AND RENEWABLE ENERGY ..............................48
OVERVIEW ..............................................................................................................................48
GROWTH OF DESALINATION IN MENA ................................................................................49
Desalination Costs ......................................................................................................52
Factors affecting technology choice ..........................................................................53
future trends in desalination ......................................................................................54
DESALINATION WILL INCREASE MENA’S ENERGY DEMAND ...........................................55
CAN ENERGY INTENSITY OF DESALINATION BE REDUCED? ...........................................56
MENA’S RENEWABLE ENERGY POTENTIAL .......................................................................56
Hydroelectric Power ....................................................................................................57
Wind Power ..................................................................................................................58
Biomass .......................................................................................................................59
Geothermal Power .......................................................................................................59
Direct Solar Energy: Photovoltaic (PV) and Concentrating Solar Power (CSP) ......60
SUMMARY OF MENA’S TOTAL RENEWABLE ENERGY POTENTIAL .................................61
Renewable Energy-Desalination Linkage ..................................................................62
CSP and Desalination Plant Design Considerations ................................................64
Typical CSP-Desalination Plant Configurations ........................................................68
Costs of CSP-Desalination .........................................................................................70
Innovation and Scaling-Up Will Lead to Cost Reductions ........................................71
Future Outlook for CSP-Desalination .........................................................................73
iii
5. CLOSING THE WATER DEMAND GAP .......................................................................74
OVERVIEW ..............................................................................................................................74
STRATEGIC APPROACH ........................................................................................................75
Unit Costs of These Options ....................................................................................76
ALLEVIATING THE DEMAND GAP .........................................................................................77
Phasing of Tactical Options Strongly Influenced by Sunk Investment ......................80 Transition from Conventional to CSP Desalination...................................................81
PHASING THE TACTICAL OPTIONS ......................................................................................81
COSTS OF ADAPTATION MEASURES ..................................................................................82
INDIVIDUAL COUNTRIES........................................................................................................82
IMPACT OF ADAPTATION ON COUNTRY ECONOMIES .......................................................83
6. ENVIRONMENTAL IMPACTS OF DESALINATION .....................................................85
OVERVIEW ..............................................................................................................................85
Desalination – Atmospheric Pollution .......................................................................85
Desalination –Marine Pollution ...................................................................................85
Environmental Management of Marine brine Disposal .............................................88
Environmental Management of Inland Brine Disposal ..............................................90
Regional Policy and Regulatory Framework Are Needed .........................................92
7. CSP DESALINATION AND REGIONAL ENERGY INITIATIVES ..................................94
OVERVIEW ..............................................................................................................................94
ENERGY CONSUMPTION IN MENA .......................................................................................94
Drivers of Energy Demand ..........................................................................................95
Water Use Also Consumes Considerable Energy .....................................................95
MANAGING THE BARRIERS TO RENEWABLE-ENERGY-BASED DESALINATION ............97
MENA CSP Initiative ....................................................................................................97
iv
Policy Challenges and Opportunities ........................................................................98 Algeria ...................................................................................................................................... 98 Egypt ........................................................................................................................................ 98 Jordan ...................................................................................................................................... 99 Morocco ................................................................................................................................... 99 Tunisia ..................................................................................................................................... 99 Kingdom of Saudi Arabia ....................................................................................................... 100
8. CONCLUSIONS .......................................................................................................... 102
Current MENA Water Shortage Will Increase 5-Fold by 2050 ................................. 102
Demand Management Must Be First Priority ........................................................... 102
Supply Management Options Are Limited ............................................................... 102
MENA Will Rely Increasingly on Desalination ......................................................... 103
Solar Energy: MENA’s Abundant Renewable Resource ......................................... 103
Costs of Inaction Will Be High .................................................................................. 104
The Solution Is At Hand ............................................................................................ 104
REFERENCES ....................................................................................................................... 105
ANNEX I. SUMMARY OF RENEWABLE ENERGY POLICIES AND LEGISLATION IN MENA
............................................................................................................................................... 114
Boxes
Box 3.1 Priorities for Reducing Nonrevenue Water ...................................................................................................... 43 Box 3.2 Recycled Water Is a Valuable Resource: Examples from Kuwait and Tunisia ............................................... 46 Box 4.1 Desalination Technologies: A Summary ......................................................................................................... 50 Box 4.2 Desalination is a Possible Option for Sana'a, Yemen, but Transport Costs Could Be Prohibitive .................. 54 Box 4.3 GemaSolar Central Receiver Plant Project, Fuentes de Andalucía, Spain ..................................................... 66 Box 5.1 Key Approaches to Meet the Water Demand Gap .......................................................................................... 74 Box 6.1 Cutting Environmental Management Costs: Brine Harvesting ........................................................................ 92 Box 7.1 How Increased Energy Intensity Can Lead to Overall Energy Savings .......................................................... 96
Figures Figure 1. Sources of New Water Supplies by 2050 (%) ............................................................................................... 10 Figure 2.1 Declining Per Capita Water Availability A Growing Threat in MENA ........................................................... 20 Figure 2.1 a Average Water Stress by Country, 2000–09 ............................................................................................ 20 Figure 2.1 b Average Water Stress by Country, 2020-30 ............................................................................................ 20 Figure 2.2 Five-Year Moving Averages of Projected Precipitation, Temperature, and Potential Evapotranspiration for
Morocco and UAE, 2010–50 ........................................................................................................................................ 22 Figure 2.3 Projected Changes in Precipitation across MENA, 2010–50 ...................................................................... 23
v
Figure 2.3 a Precipitation Current Climate [mm] .......................................................................................................... 23 Figure 2.3 b Precipitation Anomaly 2020-30 [%] .......................................................................................................... 23 Figure 2.3. c Precipitation Anomaly 2040-50 [%] ......................................................................................................... 23 Figure 2.4 Wide Range of Average Annual Precipitation among MENA Countries, 2000–09 ..................................... 24 Figure 2.5 Predicted Water Availability in the MENA Region, 2010–50 (km3).............................................................. 26 Figure 2.6 Predicted Changes in Water Availability in the MENA Region, 2010–50 .................................................... 27 Figure 2.6 a Precipitation ............................................................................................................................................. 27 Figure 2.7 Relation Between Per Capita Domestic Water Withdrawals and GDPP ..................................................... 28 Figure 2.9 Distribution of MENA Areas Equipped for Irrigation, 2009 (%).................................................................... 30 Figure 2.10 Balance of Demand and Supply in MENA under Average Climate Change Scenario, 2000–50 .............. 32 Figure 2.11 Balance of Demand and Supply in MENA under Dry Climate Change Scenario, 2000–50 ...................... 32 Figure 2.12 Large Water Demand Gap in MENA Countries under Average Climate Change Scenario, 2000–50 ..... 33 Figure 2.13 Assessment of Individual Countries .......................................................................................................... 33 Figure 3.1 High-Tech Agricultural Packages Increase Water Use Efficiency (kg production/m3 water) ...................... 40 Figure 3.2 Value of Groundwater Depletion in Selected MENA Countries as Share of GDP (%) ............................... 42
Figure 3.3 Nonrevenue Water Rates for Utilities in Selected MENA Countries and Cities .......................................... 43 Figure 3.4 UAE Groundwater Resources Are Large but Mostly Brackish (%) ............................................................. 45 Figure 3.5 Cost Range for Water Reuse (US$/m3) ...................................................................................................... 47 Figure 4.1 Distribution of Worldwide Desalination Capacity, 2007 (%) ........................................................................ 48 Figure 4.2 Share of National Water Demand in MENA Met by Desalination, 2010 (%) ............................................... 49 Figure 4.3 Growth of On-Line Desalination Capacity in MENA, 1950–2010 (MCM) .................................................... 51 Figure 4.3 a Within the GCC Countries ........................................................................................................................ 51 Figure 4.3 b MENA Excluding the GCC Countries ....................................................................................................... 51 Figure 4.4 Forecast of Annual Global Growth of Desalination by Technology ............................................................. 54 Figure 4.5 MENA Prominent among Top 15 Desalination Markets, 2007–16 .............................................................. 54 Figure 4.6 Components of Total Annual Desalination Costs (%) ................................................................................. 56 Figure 4.7 Reduction in MSF Desalination Cost, 1955–2003 (US$ per m3) ................................................................ 57 Figure 4.8 Reduction in RO Power Consumption, 1970–2008 (kWh per m3) .............................................................. 57 Figure 4.9 Gross Hydropower Potential (GWh/y) ......................................................................................................... 58 Figure 4.10 Annual Average Wind Speed at 80 m above Ground Level (m/sec) ......................................................... 59 Figure 4.11 Annual Sum of Direct Global Irradiation, 2002 (kWh/m2/y) ....................................................................... 60 Figure 4.12 Concentrating Solar Power Potential in the MENA Region, 2002 (kWh/m2/ y) ........................................ 61 Figure 4.13 Global Renewable Energy Desalination by Energy Source, 2009 (%) ...................................................... 63 Figure 4.14 Renewable Energy Production from Photovoltaics, Wind, and Concentrating Solar Power at Hurghada
Site in Egypt ................................................................................................................................................................. 64 Figure 4.16 Linking Choice of Solar Collection System to Power Generation and Desalination .................................. 68 Figure 4.17 Typical Configurations of CSP-Desalination by the Type of Renewable Energy ...................................... 70 Figure 4.18 Levelized Water Production Costs by Plant Type and Location ................................................................ 71 Figure 4.19 Electricity Cost of Concentrating Solar Power Plants Compared to Specific Cost of Peak-, Medium-, and
Base-load Plants (annualized costs) ............................................................................................................................ 72 Figure 4.20 Phased Market Introduction of CSP .......................................................................................................... 73 Figure 5.1 Schematic Representation of Marginal Water Cost Curve .......................................................................... 75 Figure 5.2 Desalination Will Play Significant Role in Filling Water Demand Gap in Most MENA Countries by 2040-50
(km3/yr) ......................................................................................................................................................................... 79 Figure 5.3 Ranking and Magnitude of Tactical Options to Fill Water Gap by 2050 Vary Considerably by Country
(MCM/yr) ...................................................................................................................................................................... 80 Figure 5.4 Typical Desalination Plant Life Curves ........................................................................................................ 81 Figure 5.4 Typical Desalination Plant Life Curves ........................................................................................................ 81
vi
Figure 5.5 Maximum Annual Capacity Additions for CSP Desalination Plants in MENA ............................................. 81 Figure 5.6 Cost-Optimized Pattern of Future Water Supply for MENA under the “Average” Climate Change Scenario,
2000–50 ....................................................................................................................................................................... 82 Figure 6.1 Desalination in the Gulf and its environmental impacts 2007...................................................................... 87 Figure 6.2 Scale-Dependent Capital Costs of Concentrate Disposal Options ............................................................. 92 Figure 7.1 Stages of Energy Use in Water Supply, Distribution, and Use.................................................................... 95
Tables
Table 1. MENA Annual Water Demand and Supply under Average Climate Change Scenario, 2000–50 (km3) ........... 7 Table 2.1 MENA Water Demand and Supply, 2000-50 (km3) ..................................................................................... 19 Table 2.2 Water Supplies will Decline in the Medium to Long-Term .............................. Error! Bookmark not defined. Table 2.3 MENA Irrigation Water Demand (km3/year and % Increase Over Current Demand)................................... 31 Table 2.4 MENA Water Demand Gap Under 3 Climate Scenarios, 2000–50 (km3/year) ............................................ 31 Table 2.5 Current and Future Water Demand and Unmet Demand Gap under Average Climate Projection (MCM) .. 34 Table 3.1 Saudi Arabia's 2009 Draft National Water Strategy Promotes Far-Reaching Water Management Reforms37 Table 4.1 Efficiency of Converting Saline to Fresh Water and Brine Effluents ............................................................. 51 Table 4.2 Capital Investment Costs of Desalinated Seawater (US$/m3/day) ............................................................... 52 Table 4.3 Operational Costs to Desalinate Seawater (US$/m3) ................................................................................... 53 Table 4.4 Total Annualized Cost of Desalinated Seawater (US$/m3) .......................................................................... 53 Table 4.5 Seawater Characteristics Vary Widely in MENA .......................................................................................... 53 Table 4.6 Estimated Installed Capacity and Primary Energy Use for Desalination in Selected MENA Countries, 2003–
10 ................................................................................................................................................................................. 55 Table 4.7 Estimated Renewable Electricity Potential for MENA Countries (TWh/year) ............................................... 62 Table 4.8 Costs of Desalinated Seawater from Renewable Energy Alternatives ......................................................... 63 Table 4.9 Comparison of Principal Features of Solar Thermal Storage Technologies ................................................. 65 Table 4.10 Comparison of Concentrating Solar Power Collecting Systems ................................................................. 69 Table 4.11 Capital Costs of the Two Main CSP- Desalination Configuration Options ................................................. 71 Table 5.1 Effect of Tactical Options under Average Climate Scenario to Reduce MENA Water Demand Gap by 2040–
50 (km3/year) ................................................................................................................................................................ 78 Table 5.2 Adaptation Costs by Country Ranked by Costs per Capita (US$) ............................................................... 83 Table 6.1 Disposal of Incremental Volume of Brines from Desalination by 2050 ......................................................... 86 Brine disposal from desalination plants is recognized as an environmental hazard. Each stage of the desalination
process either adds or concentrates chemicals, most of which are discharged in the brine at the end of the process,
table 6.2. ...................................................................................................................................................................... 88 Table 6.2 Environmental Requirements for Desalination ............................................................................................. 88 Table 6.3 The Challenges of brine disposal ................................................................................................................. 91 Table 6.4 Cost Comparison of Brine Concentrate Disposal ......................................................................................... 91 Table 7.1 Estimated MENA Electricity Generation, Installed Capacity and CO2 Emissions, 2010 ............................. 94
vii
PREFACE
This volume is the outcome of multiple intensive studies on water in the Middle East and North Africa
Region commissioned by the World Bank over the last two years. These studies were summarized under
two major reports: the ―MENA Water Outlook to 2050 and Closing the Water Demand Gap in the MENA
Region,‖ and the ―Use of Desalination and Renewable Energy to Close the Water Demand Gap in
MENA.‖ This volume also relies in part on previous studies commissioned by the Bank, including
Making the Most of Scarcity (World Bank 2007) and others in the water and energy sectors in MENA,
and other Regional reports.
This Conference Edition is an interim version produced to be shared at the 2nd
Arab Water Forum in Cairo
from November 20–23, 2011. A companion Short Summary, with the same title also has been produced
for this forum. We invite all stakeholders to review and provide written comments on these documents.
The final volume, reflecting all comments, will be published as a book by the World Bank and will be
launched at a Ministerial Meeting to be held sometime in February 2012.
Kindly address all comments and questions to Mr. Bekele Debele Negewo at
[email protected]; tel. +1 (202) 458-8891; and fax +1 (202) 477-1998. We will accept
comments until December 23, 2011.
1
ACKNOWLEDGMENTS AND CONTRIBUTIONS
This volume is the outcome of multiple intensive studies on water in the Middle East and North Africa
Region commissioned by the World Bank over the last two years. The leadership, support, and guidance
provided by Bank managers were essential to the progress of this work. The task team wishes to thank
particularly Francis Ato Brown (Water Sector Manager, MNSSD), Laszlo Lovei (Sector Director,
MNSSD), and Jonathan Walters (former Sector Manager for Energy and Transport, MNSSD, now
Director, Regional Strategy and Programs). Their strong support for the idea of conducting the series of
studies on MENA‘s water future and their support in fully funding these studies were critical.
Written comments and guidance provided by the country directors and country managers also are highly
appreciated. In particular, the task team thanks Benson Ateng (Country Manager, Yemen), A. David
Craig (Country Director, Egypt, Yemen, and Djibouti), Simon Gray (Country Director, Algeria, Morocco,
and Tunisia), Farrukh Iqbal (Country Director, Gulf Cooperation Council Countries), Eavan O'Halloran
(Country Program Coordinator, Morocco), Mariam Sherman (Country Director, West Bank and Gaza),
and Moukim Temourov (Country Manager, Algeria).
The task team also wishes to thank the governments of all 21 MENA countries included in this volume
for their interest in participating in the study and for sharing necessary information as requested. The task
team thanks particularly the Governments of Algeria, Egypt, Morocco, Oman, Saudi Arabia, and Yemen
for taking active roles in the study and for logistically supporting some workshops in their countries.
This volume has benefitted greatly from the active participation, guidance, and comments provided by
various governments and academic and policy think tanks that focus on water and energy security in the
MENA Region. Written comments provided by counterparts from Algeria, Jordan, Lebanon, Oman,
Qatar, Saudi Arabia, and Yemen are highly appreciated.
The team also thanks the Middle East Desalination Research Center (MEDRC) based in Muscat, Oman
and its energetic staff, particularly Shannon McCarty (Deputy Director, MEDRC) and Ambassador
Ronald Mollinger (Director, MEDRC) for hosting the first Regional consultation that was held in
November 22–23, 2010 in Muscat, Oman. This volume also has benefitted greatly from reviews and
critical comments provided by many colleagues inside and outside the Bank during the course of the
studies. The task team thanks them for their valuable comments and guidance that enriched the content of
this volume. For their accessibility, guidance, and encouragement during this effort, the team is grateful
to, in alphabetical order, Heba Yaken Aref Ahmed (World Bank), Maher Alodan (KA-CARE, Saudi
Arabia), Waleed Alsuraih (World Bank), Alexander Bakalian (World Bank), Caroline van den Berg
(World Bank), Jimmy Bisese (RTI International), Roger Coma Cuncil (World Bank), David Furukawa
(Chief Scientific Officer, National Center of Excellence in Desalination, Australia), Mohab Awad
Mokhtar Hallouda (World Bank), Yoshiharu Kobayashi (World Bank), Hassan Lamrani (World Bank),
Sabine Lattemann (previously at the University of Oldenberg; now at the Water Desalination and Reuse
Center, King Abdullah University of Science and Technology (KAUST) in Saudi Arabia), Tobias Marz
(Mercator Fellow), Nachida Merzouk (Algerian Centre for Renewable Energy Development, or CDER),
Fekadu Moreda (RTI International), Hani Abdel-Kader El Sadani Salem (World Bank), John Tonner
(previously at Water Consultants International; now at Consolidated Water Co., Ltd.), Vladislav Vucetic
(World Bank), and Marcus Wijnen (World Bank). The team is especially grateful to Sabine Lattemann
and John Tonner for their detailed comments and guidance on the environmental implications of
desalination, and desalination and renewable energy, respectively.
2
The internal peer reviewers were Nagaraja Rao Harshadeep (Sr. Environmental Specialist, AFTEN),
Fernanda Zermoglio (Climate Change Scientist, ENV), Nataliya Kulichenko (Sr. Energy Specialist,
SEGEN), Julia Bucknall (Sector Manager, TWIWA), Khairy Al-Jamal (Sr. Infrastructure Specialist,
EASIS), Jeffrey Delmon (Sr. Infrastructure Specialist, FEUFS), and Hocine Chalal (Safeguards Adviser).
The task team thanks them for all of their hard work and useful comments and guidance throughout.
The volume is prepared by the team led by Bekele Debele Negewo. The core team includes Chandrasekar
Govindarajalu, George Keith Pitman, Richard Fossier, Leila Ezzarqui, Kristen Huttner, Fowzia Hassan,
Magalie Pradel, Georgine Seydi, and Azeb Yideru. Walter Immerzeel and others (from FutureWater)
authored the background report on water availability and water demand assessment in MENA, including
climate change impacts and costing the various water supply options. Fulya Verdier and others (from
Fichtner and Co.) wrote the background reports on desalination and environmental implications of scaled-
up desalination in the Region‘s shared waterbodies. Franz Trieb and others (from DLR) authored the
background report on renewable energy potential in MENA and the use of concentrating solar power
(CSP) in desalination. This volume also relies in part on previous studies commissioned by the Bank,
such as Making the Most of Scarcity (2007) and others in the water and energy sectors in MENA, and
other Regional reports.
The team wishes also to acknowledge the hard work and support provided by the production team: Alicia
Hetzner for her eagle-eyed and meticulous editing; Paola Scalabrin, EXTOP, for her all too kind guidance
and support regarding communications; and Debra Naylor for her design skills. The team also expresses
appreciation to Jeffrey Lecksell, Maps Unit; Hector Hernaez, Heba Refaay and Ahmad Omar, Translation
and Interpretation team; and Adrian Feil, Printing and Graphics Unit for their skills and collaboration.
This initiative has been supported in part by the World Bank‘s Water Partnership Program (WPP)
financed by the Multi-Donor Trust Fund; the Bank‘s Energy Sector Management Assistance Program
(ESMAP); and through the Multi-Donor Trust Fund for Addressing Climate Change in the Middle East
and North Africa (MENA) Region, supported by the European Commission and Italy‗s Ministry of
Foreign Affairs. Their generous support is gratefully acknowledged.
3
ABBREVIATIONS AND ACRONYMS
AQUASTAT (Water statistics, FAO)
AT2050 Agriculture towards 2050‖
BCM Billion cubic meters
CIESIN Center for International Earth Science Information Network
CO2 Carbon dioxide
CPWC Cooperative Programme on Water and Climate (Netherlands)
CSP Concentrating solar power
CSP-MED Concentrating solar power-multiple effect distillation
CSP-RO Concentrating solar power-Reverse Osmosis
DLR Institut für Technische Thermodynamik (German Aerospace Center) (Germany)
DO Dissolved oxygen
DNI Direct normal irradiance
DSM Demand-side management
ECA Europe and Central Asia
ECMWF European Centre for Medium-Range Weather Forecasts
EIA Environmental impact assessment
EIR Environmental impact report
ET Evapotranspiration
ETo Reference evapotranspiration
EU European Union
FAO Food and Agriculture Organization of the United Nations
FDI Foreign direct investment
GCC Gulf Cooperation Council
GCM General Circulation Model, global climate change model
GDP Gross domestic product
GHG Green House Gas
GWI Global Water Intelligence
Ha Hectare
IEA International Energy Agency
IIP Irrigation Improvement Project (Egypt)
IPCC Intergovernmental Panel on Climate Change
ISET Institut für Solare Energieversorgungstechnik (Institute of Solar Energy Technology)
IUCN Union of Concerned Scientists
IWA International Water Association
IWRM Integrated water resources management
km2 Square kilometer
km3 Cubic kilometer
kWh kilowatt hour
4
KSA Kingdom of Saudi Arabia
LCOE Levelized cost of electricity
LWC Levelized water cost
MCM Million cubic meters
m3/d Cubic meter per day
MED Multiple effect distillation
MED-TVC Multiple effect distillation-Thermal vapor compression
MENA Middle East and North Africa Region
m3 Cubic meter
Mm3 Cubic millimeter
MSF Multi-stage flash distillation
mt Metric ton
MT Million tons
Mtoe million tons of oil equivalent
NASA United States National Aeronautics and Space Administration
NG Natural gas
NREL National Renewable Energy Laboratory
NRW Nonrenewable water
OECD Organization for Economic Co-operation and Development
O.J. Official Journal of the European Communities
p.a. Per annum
PPM Parts per million
PPP Purchasing power parity
ProDes PROmotion of Renewable Energy for Water Production through DESalination
PV Photovoltaics
RCM Regional climate model
RO Reverse osmosis
TWh Tera-watt hour (= 1 trillion watts/hour)
VC Vapor compression
Wh Watt-hour
WBGU Wissenschaftlicher Beirat der Bundesrepublik Globale Umweltveränderung (German
Advisory Council on Global Change)
WSS Water supply and sanitation
WWC World Water Council
5
EXECUTIVE SUMMARY
1 By 2050, the gap between MENA's renewable water supplies and demand will grow 5-fold—
from today’s 42 km3 to approximately 200 km
3. Closing such a huge water gap will be challenging and
expensive. Managing demand, particularly of agricultural water use, must be given priority. Failure to
save water and reduce uneconomic agricultural use will have severe socioeconomic repercussions
because, once renewable water resources are depleted, the most significant source of new water will be
desalination of seawater and brackish groundwater. Desalination already plays a critical role in MENA‘s
water supply, particularly for countries in the Gulf region. This role is expected to extend to most
countries in the Region by 2050. Greater reliance on desalination will cause a regional shift in the
proportion of MENA‘s energy devoted to water supply. Increased desalination also will demand greater
attention to the adverse environmental impacts associated with desalination: greenhouse gas emission
from fossil fuels and management of the brine and other chemicals produced as a result. If none of the
demand management options is implemented and if desalination is the only option available to bridge the
Region‘s water demand gap of 200 km3 by 2050, the total cost will be US$300 billion–US$420 billion per
year. However, if all viable demand and supply management measures are implemented, the total cost of
closing the water demand gap will be approximately US$104 billion a year. The Region‘s virtually
unlimited solar irradiance––several times larger than today‘s total world energy demand––allied
with proven solar energy power generation technologies will ensure an environmentally sustainable
desalinated water supply to MENA. More importantly, the omnipresence of solar irradiance will ensure
the water sector's energy security. However, to make these energy sources more competitive, actions must
be taken today to encourage investments in the continued development of renewable energy and
increasing the efficiency of desalination technologies.
Water Management Remains A Serious Problem in Most MENA Countries
2 The national fiscal impact of water development and management in any country can be
substantial. Governments and individuals across the MENA Region invest significant public resources in
the water sector. MENA governments spend 1.0 percent–3.6 percent of their GDP on the water sector.
Moreover, these figures, already large, exclude the significant private investment in construction and
maintenance of wells, and irrigation infrastructure––plus the private expenditure to pay water service
charges. Nevertheless, despite the Region‘s huge investments in water infrastructure, many countries
experience poor public health outcomes that can be traced back to water issues and economic returns to
water that are below optimum.
3 Per capita renewable water resources in MENA are among the lowest in the world. They will
continue to decline, primarily as the result of population growth and climate change. The Food and
Agriculture Organization (FAO) of the United Nations regards renewable water availability levels of less
than 1,000 cubic meters (m3) per person as a severe constraint to socioeconomic development and
environmental sustainability. In fact, at water availability levels of twice this amount, water is regarded as
a potentially serious constraint and, in drought years, as a major problem. By these criteria, reduced water
availability already is a serious constraint to socioeconomic development in all 21 MENA countries. By
2030, due primarily to growing populations and partly to a warming climate, lack of water availability
will become a severe constraint to socioeconomic development in all 21 countries. By 2050, two-thirds of
MENA countries may have less than 200 m3 per capita per year. This quantity is equivalent to
approximately 550 liters per capita per day of available water for all uses including agriculture.
4 Despite significant scarcity, water is still allocated to low-value uses, even as higher-value
needs remain unmet. Water supply service interruptions are common, even in years of normal rainfall.
People and economies remain vulnerable to droughts and floods. In some countries, over-extraction of
6
groundwater is undermining national assets by 1 percent–2 percent of GDP every year. Water-related
environmental problems cost MENA countries 0.5 percent–2.5 percent of GDP every year.
Renewable Water Supplies Will Be under Increasing Stress
5 In all MENA countries except Egypt, Iraq, and Syria, precipitation is the principal renewable
water resource. Region-wide annual rainfall variability averages approximately 30 percent, but for
several countries––Morocco, Tunisia, Oman, and Djibouti––variability is near or above 40 percent.
Countries with a high variation in precipitation require a higher adaptive capacity. Measures include more
reservoir storage, greater reliance on groundwater, or greater on-demand desalination capacity. Only three
countries in the Region are able to alleviate unreliable rainfall from external river inflows: Egypt, Iraq,
and Syria. If the storage dams in Iran and Morocco are included, these 5 countries account for almost 50
percent of the Region‘s ability to smooth out interseasonal and annual variations in precipitation through
the use of dams. However, approximately only 10 percent of MENA‘s annual precipitation is captured: 5
percent is stored behind dams, and 4 percent is stored in fresh water aquifers.
6 Water balance modeling indicates that the Region’s renewable water resources will decline
significantly as a combined effect of the changes in precipitation and evapotranspiration. Modeling
does predict a very small increase in the average flow of the River Nile into MENA as a result of likely
precipitation increases projected for the Upper Nile basin. However, this increase will be more than offset
by decreasing precipitation and increasing evapotranspiration within MENA. Thus, total renewable water
resources will contract steadily by approximately 12 percent per year—equivalent to approximately 26
km3 –by 2050. Putting this amount in perspective, the Region‘s current total urban demand is 28 km
3 a
year.
7 MENA countries vary greatly in their hydrological responses to climate change. Internal
renewable water resources show a negative trend throughout the Region––with the exception of central
Iran and Syria, the southwestern areas of Saudi Arabia and Yemen, and the area south of the Atlas
Mountains in Algeria. At a national level, the largest changes are observed in Jordan (-138 percent),
Oman (-46 percent), Saudi Arabia (-36 percent), and Morocco (-33 percent). Paradoxically, in the
southwestern Arabian Peninsula and southeastern Iran, global warming is projected to increase flood
hazard and frequency.
8 Groundwater recharge is predicted to decrease in almost all countries. The recharge decrease
generally is much stronger than the projected decrease in precipitation due to the nonlinearity of
hydrological processes. In relative terms, some of the largest changes in groundwater recharge are
predicted for the Gulf States, specifically for Oman, United Arab Emirates, and Saudi Arabia, for which
decreases of 40 percent or more are expected. Even in some of the wetter countries, the predicted changes
remain very considerable: Morocco -38 percent, Iraq -34 percent, and Iran -22 percent.
Water Shortage Will Increase 5-Fold by 2050
9 The population of the 21 MENA countries is projected to more than double from 316 million in
2010 to 697 million in 2050. Egypt and Yemen will have the largest increases. During the same period,
water demand will accelerate in response to increasing population and prosperity. Regional GDP is
expected to grow from its current US$1.6 trillion to US$6.5 trillion by 2030, and to reach US$19 trillion
in 2040–50. The combined impact of population and GDP growth will cause the total domestic water
demand to more than triple from current consumption of 28 km3 to approximately 88 km
3 during 2040–
50. Similarly, industrial water demand is projected to double from the current consumption of 20 km3 to
approximately 41 km3 during the same period.
7
10 Irrigation water demand also is projected to increase by 2050. Current irrigation serves 21
million hectares (ha) and accounts for 81 percent of all water demand in the Region. Seven countries
account for 90 percent of MENA‘s irrigated area. Two countries––Iran and Iraq––account for 50 percent
of this amount. If global warming induces a wetter and warmer climate, irrigation water demand will
increase by 15 percent over current demand. If the future climate is warmer and drier, irrigation demand
is expected to increase by 33 percent. Under the most likely average trend, agricultural demand will
increase by approximately 25 percent.
11 In the future, MENA’s water shortage will increase substantially under all climate change
scenarios due to increased demand and reduced supply. If global warming follows the projected average
trend, water demand will grow from today‘s estimated 261 km3 to approximately 393 km
3 during 2040–
50 (table 1).
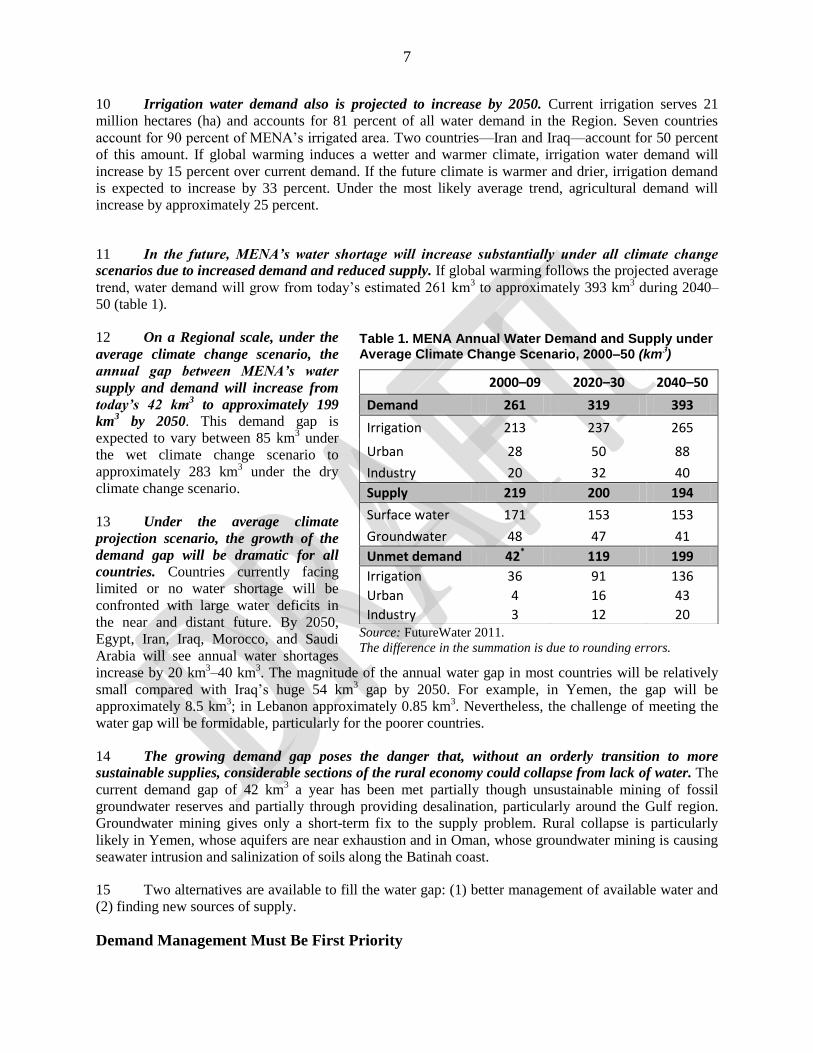
12 On a Regional scale, under the
average climate change scenario, the
annual gap between MENA’s water
supply and demand will increase from
today’s 42 km3 to approximately 199
km3 by 2050. This demand gap is
expected to vary between 85 km3 under
the wet climate change scenario to
approximately 283 km3 under the dry
climate change scenario.
13 Under the average climate
projection scenario, the growth of the
demand gap will be dramatic for all
countries. Countries currently facing
limited or no water shortage will be
confronted with large water deficits in
the near and distant future. By 2050,
Egypt, Iran, Iraq, Morocco, and Saudi
Arabia will see annual water shortages
increase by 20 km3–40 km
3. The magnitude of the annual water gap in most countries will be relatively
small compared with Iraq‘s huge 54 km3 gap by 2050. For example, in Yemen, the gap will be
approximately 8.5 km3; in Lebanon approximately 0.85 km
3. Nevertheless, the challenge of meeting the
water gap will be formidable, particularly for the poorer countries.
14 The growing demand gap poses the danger that, without an orderly transition to more
sustainable supplies, considerable sections of the rural economy could collapse from lack of water. The
current demand gap of 42 km3 a year has been met partially though unsustainable mining of fossil
groundwater reserves and partially through providing desalination, particularly around the Gulf region.
Groundwater mining gives only a short-term fix to the supply problem. Rural collapse is particularly
likely in Yemen, whose aquifers are near exhaustion and in Oman, whose groundwater mining is causing
seawater intrusion and salinization of soils along the Batinah coast.
15 Two alternatives are available to fill the water gap: (1) better management of available water and
(2) finding new sources of supply.
Demand Management Must Be First Priority
Table 1. MENA Annual Water Demand and Supply under Average Climate Change Scenario, 2000–50 (km3)
2000–09 2020–30 2040–50
Demand 261 319 393
Irrigation 213 237 265
Urban 28 50 88
Industry 20 32 40
Supply 219 200 194
Surface water 171 153 153
Groundwater 48 47 41
Unmet demand 42* 119 199
Irrigation 36 91 136
Urban 4 16 43
Industry 3 12 20
Source: FutureWater 2011.
The difference in the summation is due to rounding errors.
8
16 Increasing efficient water use should be the first line of action. On the hottest days, irrigation of
1,000 ha in MENA consumes the water equivalent of each person in a city of 2 million consuming 100
liters per day. Despite the predominance of modern irrigation systems, MENA‘s average water use
efficiency languishes at 50 percent–60 percent. Pursued vigorously, improved irrigation scheduling,
management, and technology could increase MENA‘s water use efficiency to more than the 80 percent
level of the best-managed arid areas of Australia and the United States.
17 While of smaller magnitude, MENA’s physical water losses in municipal and industrial supply
typically also are above world averages. These water losses are approximately 30 percent–50 percent in
some cities, compared to international best practice of approximately 10 percent.
18 Excess demand in all water-using sectors is stoked by pervasive and perverse subsidies. Varying levels of transparency and governance give water supply agencies and utilities few incentives to
improve service standards and promote water conservation. Given the high cost of new water supplies,
adding new and more expensive water to such inefficient systems and uses clearly is not economically
rational.
19 Progressive agricultural policy reform can provide incentives to reduce water demand. Driven
by food security concerns, low-value wheat provides an exceptionally high 44 percent of the Region's
total food supply. Most of this wheat is grown locally using scarce water. The importance of wheat not
only has driven substantial government investment in irrigation systems but also has led to subsidies on
inputs (such as pumps, irrigation technology, and electricity) and on outputs through price support
mechanisms.
20 The focus on production of staples has neglected the Region’s comparative advantage in
meeting off-season European demand for high-value fruits and vegetables, which could be traded for
staples grown in wetter climates. Changing this focus would bring about dramatic water savings because
agriculture uses 81 percent of the Region‘s water resources, much of it from scarce and dwindling
groundwater reserves. Saudi Arabia‘s reduction of price support for wheat has reduced annual agricultural
water demand from its peak of 23 km3 in the mid-1990s to an estimated 14 km
3 in 2010. In the UAE,
recent elimination of subsidies for irrigated fodder is expected to reduce agricultural water consumption
by 40 percent in the summer.
21 Reducing subsidies for wells and pumps and for energy would significantly slow groundwater
mining. Currently, groundwater users compete to use the resource before others can. Even worse, as the
resource becomes more heavily exploited, groundwater levels fall so that only the farmers able to afford
the larger pumps remain in business. As a result, groundwater in the MENA Region is severely over-
exploited, and many smaller farmers have been marginalized. Pricing electricity or diesel fuel at the levels
equivalent to cost not only would constrain the volumes pumped but also would induce farmers to regain
profitability by growing high-value crops.
22 However, even with realistic energy pricing, the cost of groundwater production does not
represent its true value to the economy. Fossil groundwater is a finite and common pool resource that is
being mined and, once gone, is irreplaceable. When farmers run out of fresh or moderately brackish
groundwater, they typically have two choices: stop farming, or use an alternative resource. The only
alternative source of water is desalinated water. In economic terms, the opportunity cost of groundwater is
the same as its substitute, desalinated water, which costs approximately US$1.5/m3–US$2.0/m
3,
depending on location in MENA and the desalination technology.
9
23 Groundwater conservation thus is an important component of reducing MENA’s future water
demand. The two alternatives––desalination or abandoning agriculture––are either very expensive or
politically challenging. Although mining groundwater may increase GDP in the short term, it undermines
the country‘s natural capital or wealth in the longer term. The World Bank estimates that the value of
national wealth consumed by over-extraction of groundwater can be as high as 2 percent of GDP.
24 Managing domestic water demand will be aimed primarily at reducing water loss on the supply
side and reducing excessive consumption on the demand side. Only a small portion of MENA‘s
population––those living around the Gulf states––has the luxury of almost unlimited water supply.
Consequently, the major emphasis of the Region‘s demand management will be to reduce losses, often
called nonrevenue water. Reducing nonrevenue water is important for three reasons: consumers are
paying for water utilities‘ inefficiencies; a precious and scarce resource is being wasted; and unnecessary
investments in production are being made. If water supply utilities in MENA could be improved to
international best-practice levels, as much as 5km3 a year could be saved.
25 Several MENA countries have had some success in reducing nonrevenue water, generally by
contracting a private utility operator to manage the water supply. The experience has been win-winfor
water conservation, the government, and the consumer. In Morocco, this approach increased water
availability to 24 hours a day and increased access in 4 large cities by 33 percent. A combination of
tripling tariffs, introducing a sanitation charge, and reducing leakage has lowered annual demand by
approximately 3 percent. As a result, demand projections are lower than previously estimated, reducing
the need for dam construction and saving the government some US$450 million. In Jordan, a
management contract with a private firm increased system efficiency in Amman, although at a slower
pace than expected. The country reduced unaccounted-for water from 55 percent in 1999 to 43 percent in
2004, and improvements continue.
Supply Management Options Are Limited
26 Rainwater harvesting and check dams in wadis generally are very small and very local. Typically, they service single households or small communities and provide drinking water and
groundwater recharge. From a regional perspective, they can make only a small contribution to supply
augmentation except in rural areas.
27 Dams to impound larger volumes of water have limited potential in the MENA Region. Rivers
in MENA Region are the most heavily dammed in the world in relation to the freshwater available, and
therefore only limited potential exists to further increase water availability through dams. More than 80
percent of the Region‘s surface freshwater resources are stored behind reservoirs. . Some potential
however exists, particularly in the more humid parts of the Region such as northwestern Iran and the
Atlas Mountains in Morocco and Algeria. Elsewhere in the more arid countries of MENA, the highly
uncertain rainfall amounts and frequency frustrates reliance on reservoirs for assured supplies, a situation
made worse by the likelihood of lower precipitation in the future.
28 Recycled wastewater is an assured resource and the only one that also is guaranteed to
increase in response to population growth. Most of the significant developments in water reclamation
and reuse have occurred in the arid regions of the world, including Australia, Mediterranean region, and
the western and southwestern United States. In the Mediterranean region, Greece, the southern provinces
of France and Italy, and Spain have been the vanguards of water reclamation and reuse. Portugal and
Tunisia also have well-established agricultural and landscape irrigation programs that use reclaimed
water. However, only a limited number of MENA countries––Israel, Jordan, Kuwait, Saudi Arabia,
Tunisia, and UAE among them––have explicitly included water reuse in their water resources planning
and have official policies calling for water reuse.
10
29 Given that actual domestic consumption of water accounts for approximately 10 percent of
household demand, the potential for reuse is large. If only 50 percent of this potential wastewater were
recycled, it could add 20 km3–40 km
3 per year to MENA‘s renewable water resources by 2050. While
growth of wastewater will be driven by population growth, wastewater will need investment to extend
collection and treatment networks. Most importantly, wastewater recycling needs to be explicitly included
in national water planning policies, and well-designed campaigns are needed to ensure peoples‘
acceptance of its use.
30 Desalination of seawater and brackish groundwater hold significant potential to bridge the
water demand gap in MENA. Seawater is effectively an infinite water resource. Brackish groundwater
reserves could be used to support salt-tolerant agriculture and/or be a source of desalinated water. While
fresh groundwater reserves in MENA are in a critical state, the same is not true of brackish groundwater.
Brackish groundwater reserves in MENA are potentially large, but extensive exploration is required to
better define the resource. Fortunately, such exploration is relatively inexpensive compared to the
alternative supply options. Desalination of brackish groundwater is usually much cheaper than
desalinating seawater––the only alternative to groundwater in most MENA countries. However, for large-
scale applications, seawater desalination provides the most obvious solution to MENA‘s water supply
shortage.
Closing the Water Gap
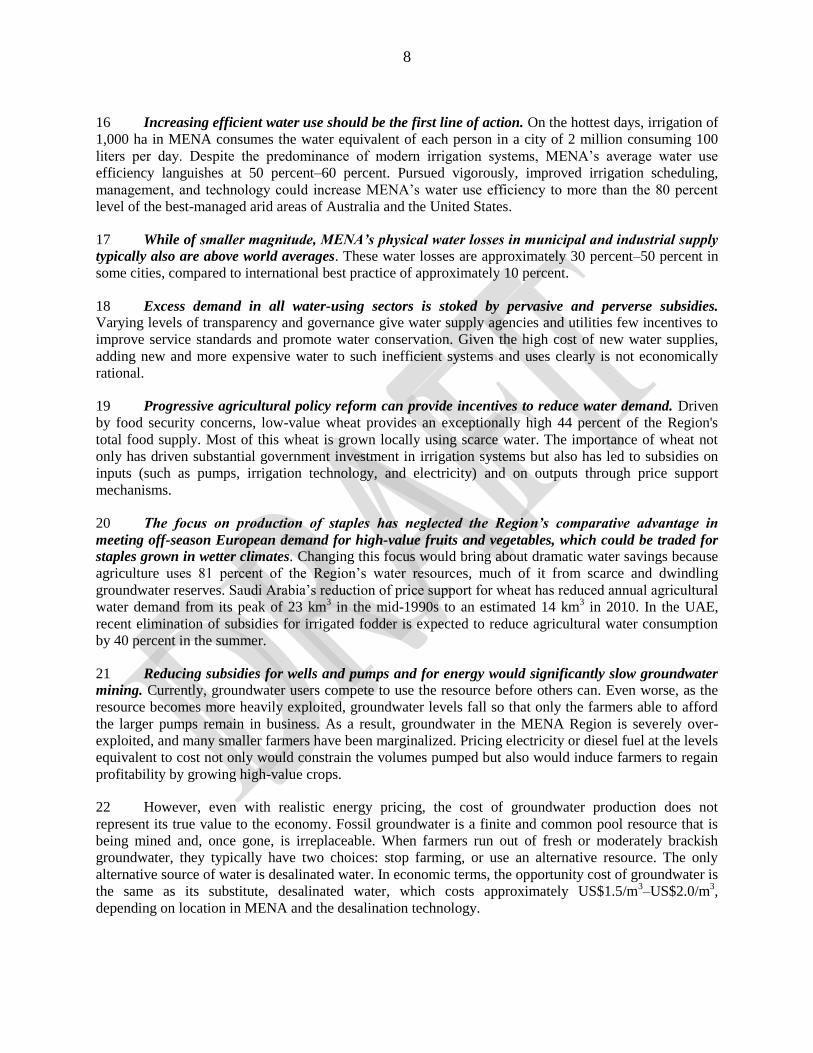
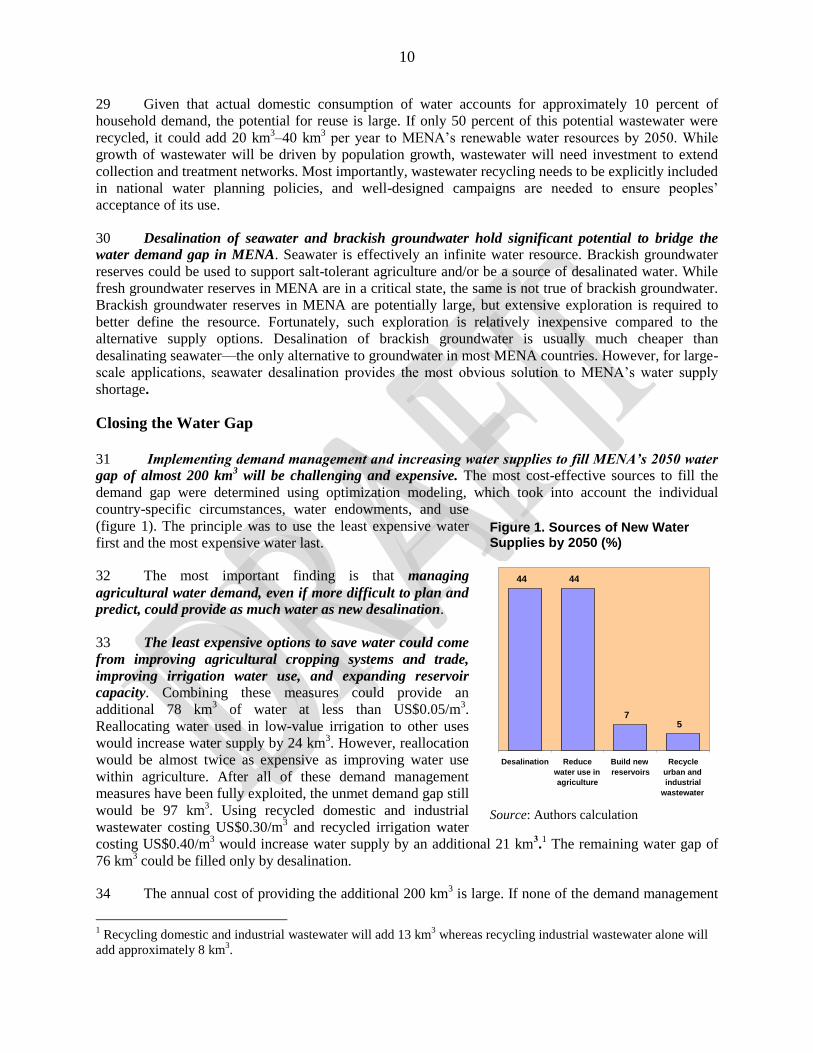
31 Implementing demand management and increasing water supplies to fill MENA’s 2050 water
gap of almost 200 km3 will be challenging and expensive. The most cost-effective sources to fill the
demand gap were determined using optimization modeling, which took into account the individual
country-specific circumstances, water endowments, and use
(figure 1). The principle was to use the least expensive water
first and the most expensive water last.
32 The most important finding is that managing
agricultural water demand, even if more difficult to plan and
predict, could provide as much water as new desalination.
33 The least expensive options to save water could come
from improving agricultural cropping systems and trade,
improving irrigation water use, and expanding reservoir
capacity. Combining these measures could provide an
additional 78 km3 of water at less than US$0.05/m
3.
Reallocating water used in low-value irrigation to other uses
would increase water supply by 24 km3. However, reallocation
would be almost twice as expensive as improving water use
within agriculture. After all of these demand management
measures have been fully exploited, the unmet demand gap still
would be 97 km3. Using recycled domestic and industrial
wastewater costing US$0.30/m3 and recycled irrigation water
costing US$0.40/m3 would increase water supply by an additional 21 km
3.1 The remaining water gap of
76 km3 could be filled only by desalination.
34 The annual cost of providing the additional 200 km3 is large. If none of the demand management
1 Recycling domestic and industrial wastewater will add 13 km
3 whereas recycling industrial wastewater alone will
add approximately 8 km3.
Figure 1. Sources of New Water Supplies by 2050 (%)
Source: Authors calculation
44 44
7 5
Desalination Reduce water use in agriculture
Build new reservoirs
Recycle urban and industrial
wastewater
11
options have been implemented and if desalination is the only option available to bridge the water
demand gap by 2050, the total cost of bridging the 200 km2 water gap will be US$300 billion–US$420
billion. However, if all of the above demand reduction measures have been implemented, the total cost of
closing the water demand gap will be approximately US$104 billion. The lower cost assumes desalination
technology will improve; conventional energy sources will be progressively replaced with renewable
energy; and renewable energy sources will become less expensive over the long term.
Desalination Can Help Close the Gap––at a Cost
35 Desalination enables communities to utilize brackish groundwater where available and a
practically inexhaustible supply of seawater. In the past, the difficulty and expense of removing salts
from water made desalination expensive. However, over the years, advances in desalination technologies
have made it an economically viable alternative source of fresh water. Subsequently, in response to
shortages of naturally renewable water supplies, many MENA countries developed desalination facilities.
By 2005, nearly three-quarters of the world‘s desalination potential was installed in MENA, mostly
around the Gulf region.
36 Desalination has proved to be a technically feasible supply solution to MENA’s water gap and
will continue to be so. Desalination currently provides slightly more than 3 percent of total Regional
water demand, but this share will increase. Under the average climate change scenario, assuming that all
viable demand and supply management measures are implemented desalination may have to provide as
much as 19 percent of Regional water demand by 2050.
37 During the 1960–80s, on a large scale, freshwater supply was distilled from seawater. Distillation
has a number of advantages, especially in the Gulf region, in which fossil fuels are abundant and cheap.
Consequently, most of the Gulf developed cogeneration infrastructure for electrical power with fresh
water as a byproduct using the multi-stage flash (MSF) distillation process. Costs were well understood
and were little affected by the salinity of the source waters. More recently, the multiple effect distillation
(MED) technology is replacing MSF because of MED‘s lower energy demand. In contrast, membrane
technologies, which effectively sieve out salt from water, had difficulty coping with the high salinity of
the Gulf water and were both small scale and costly.
38 Today, membrane technologies, especially reverse osmosis (RO), have made major advances and
are competitive with distillation. Initially, the RO membranes were expensive; pretreatment was not well
understood; and energy consumption was high. Due to advances in membrane technology and
pretreatment options, the membrane prices have fallen; their performance has improved; and pretreatment
is better understood. While RO energy use increases in proportion to the concentration of salt to be
removed, energy consumption has dropped dramatically over the last 20 years. Moreover, RO plants do
not need to be coupled with thermal power plants in cogeneration stations; RO requires only electrical
energy. As a result, outside the Gulf Region, the preferred technology is reverse osmosis.
39 Distilling seawater produces a concentrated brine waste that is 3–4 times the volume of the fresh
water produced. In contrast, RO produces brine volumes only 1.0–1.5 times the fresh water production,
and if the brine disposal problem can be managed, RO plants do not have to be located near the sea.
40 Both distillation and membrane desalination technologies require large energy inputs that account
for between one-third and one-half of fresh water production costs when fossil fuels are used.
Importantly, the current high reliance on fossil fuels power generation produces large volumes of
greenhouse gas (GHG). Thus, continued reliance on fossil fuels and the greater future demand for energy
for desalination will exacerbate global warming trends.
12
41 In comparative terms, and considering all investment, operations and maintenance costs, and a
continued reliance on fossil fuels, fresh water produced by distillation is slightly more expensive than that
produced by RO. However, much depends on the quality of source water, scale, and site conditions.
Typical annual costs per cubic meter of fresh water are US$1.5–US$1.9 for RO, and US$1.9–US$2.1 for
distillation.
42 If future desalination in MENA continues to rely on fossil fuels, energy costs will be more likely
to increase due to greater international competition for limited fossil fuel reserves. The price volatility of
fossil fuels will be another challenge. In addition, power generation technologies based on hydrocarbons
increasingly will be charged with the extra costs of CO2 sequestration as mandatory mitigation of the
effect of CO2 emissions on climate change becomes internationally institutionalized.
Fossil Fuel-Based Desalination Is Not Sustainable
43 The biggest challenges will be to reduce the cost of energy-intensive desalinated water, reduce
its reliance on fossil fuels, and ensure that it becomes an environmentally acceptable solution.
44 Costs can be reduced in several ways: (1) by technical improvements to increase the efficiency of
desalination, (2) by reducing the cost of the current technology (initial capital costs and operational costs),
(3) by lowering energy costs, and (4) by reducing environmental damage from desalination.
45 Over the last three decades, research has led to a systematic lowering of desalination costs,
primarily through better design, more efficient energy use, and post-process energy recovery. Such
improvements are expected to continue. Thus, even though it is expected that energy use for desalination
will become more efficient, the question remains of how energy costs can be reduced in the face of rising
global competition for fossil fuels.
46 Desalination will increase future energy requirements and take a large share of national energy
production. For example, in the Kingdom of Saudi Arabia, the world‘s largest oil exporter, currently
desalination alone requires burning approximately 1.5 million barrels per day of crude oil. The trend is the
same in most Gulf Cooperation Council (GCC) countries and beyond where desalination plays a
significant role in their water supply portfolio. As water demand accelerates, so will the proportion of
national energy demand that is devoted to desalinating water. In the context of Saudi Arabia, for example,
the estimate is that domestic fossil-based fuel demand is on a pace to reach over 8 million bbl/d (oil
equivalent) by 2030 if there were no improvements in energy efficiency and current trends continued.
47 Experience shows that as water demand continues to accelerate, so will the proportion of national
energy demand that is devoted to desalinating water. A recent International Energy Agency review of the
six biggest users of desalination in MENA––Algeria, Kuwait, Libya, Qatar, Saudi Arabia, and United
Arab Emirates––found that their average energy use for desalination was approximately 10 percent of
their total primary energy use. Energy used ranged from a low of 2 percent in Algeria to a high of 24
percent in the UAE. For the Region, desalination accounted for slightly more than 4 percent of the total
electricity generated in 2010. It follows that, as demand for desalination grows, the major impact will be
on the countries that currently use only a small proportion of their energy for desalination.
48 Desalination using present technology will have large environmental impacts by 2050. First, the
annual volume of brine produced will be approximately 240 km3, compared to 40 km
3 now. Second, the
incremental volume of GHG emissions will be approximately 400 million tons of carbon equivalents per
year. Comprehensive and consistent Regional and national environmental legislations are necessary to
protect groundwater and shared waterbodies from concentrate (brine plus other chemicals) pollution. This
need is especially critical for waterbodies that already have large desalination plants installed or planned,
13
such as the Gulf. For the measures to be effective, it is important for countries to jointly plan and
implement necessary measures. Joint studies and continuous monitoring also should be undertaken to
better understand the adverse impacts of brine surface water disposal on marine ecosystems and inland
disposal on groundwater aquifers.
49 The above trends in terms of energy security, fiscal burden and environmental implications of
fossil-fuel based desalination problems, associated with business-as-usual scenario, are worrisome and
should be addressed in a timely manner to maintain the Region‘s socio-economic and environmental
wellbeing. Many of these problems connected to desalination could be reduced by replacing fossil fuels
with renewable energy (RE) sources.
Renewable Energy Can Provide Win-Win Solution
50 The coupling of renewable energy (RE) sources with desalination has the potential to provide a
sustainable source of potable water. The technical and economic potential of RE resources for power
generation differs widely among MENA countries. The annual potential of wind power, biomass,
geothermal, and hydropower combined totals approximately 830 trillion watt-hours. These resources are
concentrated more or less locally and not available everywhere, but they can be distributed through the
electricity grid to meet growing electricity demand. By far, the biggest resource in MENA is solar
irradiance, which is available everywhere in the Region. MENA‘s solar energy has a potential 1,000 times
larger than its other renewable sources combined and is several orders of magnitude larger than the
current total world electricity demand. MENA‘s potential energy from solar radiation per square
kilometer per year is 1 million–2 million barrels of oil. Approximately 70 percent of renewable energy
plants operating in the world today use solar energy.
51 This copious resource can be used both in distributed photovoltaic (PV) systems and in large
central solar thermal power stations. While PV can generate only electricity, solar energy captured and
redirected by mirrors to heat fluids––called concentrating solar power (CSP)––can generate both heat and
electricity. While electricity cannot be stored as electrical energy, heat can.
52 CSP was selected for analysis in the current study for two reasons: (1) it has the potential to store
heat so it can provide base-load for desalination; and (2) it has significant potential for technological
improvement. With sufficient heat storage capacity, CSP potentially can provide base-load power 24
hours a day. The efficiency of today‘s solar collectors ranges from 8 percent–16 percent, but by 2050,
technical improvements are expected to increase efficiency to the 15 percent–25 percent range. Currently,
the solar energy collector field comprises more than half of the investment cost. Thus, improvements in
collection efficiency indicate significant potential for cost reduction.
53 The costs of fresh water produced by CSP thermal and RO membrane desalination plants vary
considerably in the Mediterranean Sea, Gulf, and Red Sea regions due primarily to differing seawater
salinity. CSP-RO provides the lowest cost water in the Mediterranean and Red Sea regions, ranging from
US$1.5–US$1.7 per cubic meter. CSP-RO costs also vary depending on coastal or inland locations.
Inland, higher solar radiation may reduce costs by as much as US$0.15/m3. With future technological
advances, CSP-RO costs are expected to decline to approximately US$1.2/m3 by 2050.
54 Currently, CSP-thermal desalination is more expensive than CSP-RO except in the Gulf, where
supplemental energy is powered by cheaper fuel. The indicative water costs at present prices for CSP-
thermal range from US$1.8/m3–US$2.1/m
3. Due to technological innovations, costs of CSP-thermal
desalination are expected to decline to approximately US$0.9/m3 by 2050. CSP adoption also will bring
considerable environmental advantages. The increased share of CSP-RO desalination allied with the more
efficient CSP-thermal desalination will reduce annual brine production by nearly half––from 240 km3 to
14
140 km3.
55 Increased RE use will significantly reduce CO2 emissions. Generating a giga-watt hour of
electricity using oil produces 700 tons of CO2; using gas produces 450 tons. In contrast, to generate the
same amount of electricity, CSP produces only 17 tons of CO2. This vast difference will apply not only to
desalination but also to MENA‘s energy sector as a whole because introduction of large scale RE-
desalination will not be done in isolation. Total MENA electricity demand is expected to increase 5-fold
between 2010 and 2050. Current CO2 emissions are 375 million tons a year. Using conventional fossil
fuels, CO2 emissions would rise to 1,500 million tons by 2050. If RE replaces fossil fuels except for
peaking power, MENA‘s annual CO2 emissions could be reduced to 265 million tons by 2050–– this is
less than current emissions.
56 CSP-desalination will take time to mainstream because many existing and currently planned
fossil fuel desalination plants will remain in operation for some years. Because most fossil-fueled
desalination plants will not be totally decommissioned until 2041–43, demand for CSP-desalination
technology will grow slowly at first, to meet growing water demand. During this period, it will be
essential that the supply of CSP-desalination technology keep pace with demand because, without this
technology, a number of countries will have to mine their groundwater reserves even more intensively to
survive in the short to medium term. Moreover, in the short and medium terms, CSP still will need to be
supplemented by fossil fuels for some base-load and peak-power generation.
MENA’s Water Crisis Is Deepening
57 While the Region has a water crisis, its severity varies considerably from one country to another.
Different countries, even in the same sub-region, face different choices and costs regarding how to close
their water gaps. The average adaptation cost in MENA for each additional cubic meter of water required
is approximately US$0.52, but this cost varies substantially among countries. Algeria‘s improved
agricultural practice can almost bridge the gap at US$0.02/cu m3. At the other extreme, in the UAE, the
gap will be bridged primarily by desalination at US$0.98 cu m3. Even with adaptation measures, Iraq,
Morocco, and the UAE will not be able to economically close their water gaps without additional
decreases of irrigated area and/or consumption. Eight of the most water-short countries will carry most of
the financial burden of closing the gap: Iraq will bear most of the cost, followed by Egypt, Iran, Israel,
Morocco, Saudi Arabia, UAE, and Yemen. The remaining 13 MENA countries combined will bear less
than 10 percent of the total financial burden. In per capita terms at current costs, average annual
adaptation costs will be approximately US$148 by 2050.
58 By 2050, filling the water gap will cost approximately 6 percent of current Regional GDP. Given
that Regional GDP will grow by 2050, the actual average share of GDP devoted to providing water
supply will be lower. However, countries differ markedly based on the severity of their water shortages
and projected GDP. In the future, Iraq, Jordan, Morocco, and Yemen must be prepared to spend a
substantial amount of their GDP on overcoming their water shortages. In Yemen, for example, this
amount may be as much as 4 percent of its GDP.
Costs of Inaction Will Be High
59 Managing demand, particularly of agricultural water use, will be key to reduce the high costs of
filling the water gap. In the near term, prior to the widespread use of RE, failure to save water and to
reduce uneconomic use will have severe socioeconomic and environmental repercussions––because the
only alternative will be desalination using expensive fossil fuels.
60 Desalination will continue to play an ever-increasing role in MENA‘s water supply portfolio.
15
However, if the current trend of using fossil fuel for desalination continues in the future, many countries
in MENA will face serious energy security problems in general and economic problems for oil exporting
countries in particular.
61 Similarly, the environmental implications of scaled up desalination cannot be ignored.
Comprehensive and consistent Regional and national environmental legislations are necessary to protect
groundwater and shared water bodies from pollution. This need is especially critical for waterbodies that
already have large desalination plants installed or planned, such as the Gulf. For the measures to be
effective, it is important for countries to jointly plan and implement necessary measures. Joint studies and
continuous monitoring also should be undertaken to better understand the adverse impacts of brine
surface water disposal on marine ecosystems and inland disposal on groundwater aquifers.
62 MENA will reap three major benefits from coupling desalination with renewable energy sources,
particularly the Region‘s virtually unlimited solar irradiance: (1) a sustainable water supply, (2) an
energy-secure water sector, and (3) environmental sustainability. However, to make these sources more
competitive, actions must be taken today to encourage investments in renewable energy technologies and
improvements in desalination efficiency.
16
1. INTRODUCTION
63 The Middle East and North Africa (MENA) Region is considered the most water-scarce region in
the world. Large-scale water management problems already are apparent in the Region. Aquifers are over
pumped; water quality is deteriorating; and water supply and irrigation services often are rationed. Each
of these conditions has consequences that impair human health, agricultural productivity, and the
environment. Disputes over water lead to tension within communities. Moreover, unreliable water
services are prompting people to migrate in search of better opportunities. Water investments absorb large
amounts of public funds, which often could be used more efficiently elsewhere. These challenges appear
likely to escalate. As the Region‘s population continues to grow, per capita water availability will decline.
If climate change affects weather and precipitation patterns as predicted, the MENA Region may see
more frequent and severe droughts and floods.
64 One of MENA‘s major challenges is to manage water to sustainably increase agricultural
production as required by its fast-growing population, while increasing trade in agricultural products. The
United Nations Food and Agriculture Organization (FAO) 2006 study, ―Agriculture toward 2030/2050,‖
shows that global agricultural demand will slow because the population growth rates are stabilizing and
many countries have reached fairly high levels of per capita food consumption. Globally, FAO expects
that agricultural production can grow in line with agricultural demand. However, MENA‘s situation
differs because high population growth rates are expected and water already is a crucial constraint.
65 The 4th Assessment Report of the International Panel on Climate Change (IPCC 2007) projects
strong changes in climate across the MENA Region for this century. Temperature increases combined
with substantially decreasing precipitation are projected. Because the elevated temperature will result in a
higher ET demand, the higher temperature, in combination with the decreased precipitation, will severely
stress the Region‘s water resources.
66 The 2007 World Bank study, Making the Most of Scarcity: Accountability for Better Water
Management Results in the Middle East and North Africa, asks whether MENA countries can adapt to
meet these combined challenges. The study argues that they must, because if they do not, the social,
economic, and budgetary consequences will be enormous. Drinking water services will become more
erratic than they already are. Cities will come to rely more and more on expensive desalination and on
emergency supplies brought by tanker or barge. Service outages stress expensive water network and
distribution infrastructure. In irrigated agriculture, unreliable water services will depress farmers‘ incomes
and lower productivity. The economic and physical dislocations associated with the depletion of aquifers
or unreliability of supplies will increase. All of these developments will have short- and long-term effects
on economic growth and poverty and will put increasing pressure on public budgets. The 2007 study
concludes that the MENA countries have made considerable progress in dealing with the water problems,
but that their efforts have focused on reducing physical water scarcity and improving organizational
capacity. To further overcome the Region‘s water challenges, additional basic economic and institutional
reforms must be implemented. At the same time, a longer term vision of the MENA Region‘s water future
must be developed. Only through such a vision can the type and magnitude of demand be determined and
relevant infrastructure investments made.
67 The MENA Region has a fairly broad range of available water resource and technology options.
These options can be grouped by approach, such as reducing demand, transferring between and among
sectors, transferring within sectors, increasing storage, and increasing supply. As renewable water
resources become fully utilized, an important option for the MENA Region includes increased reliance on
desalination.
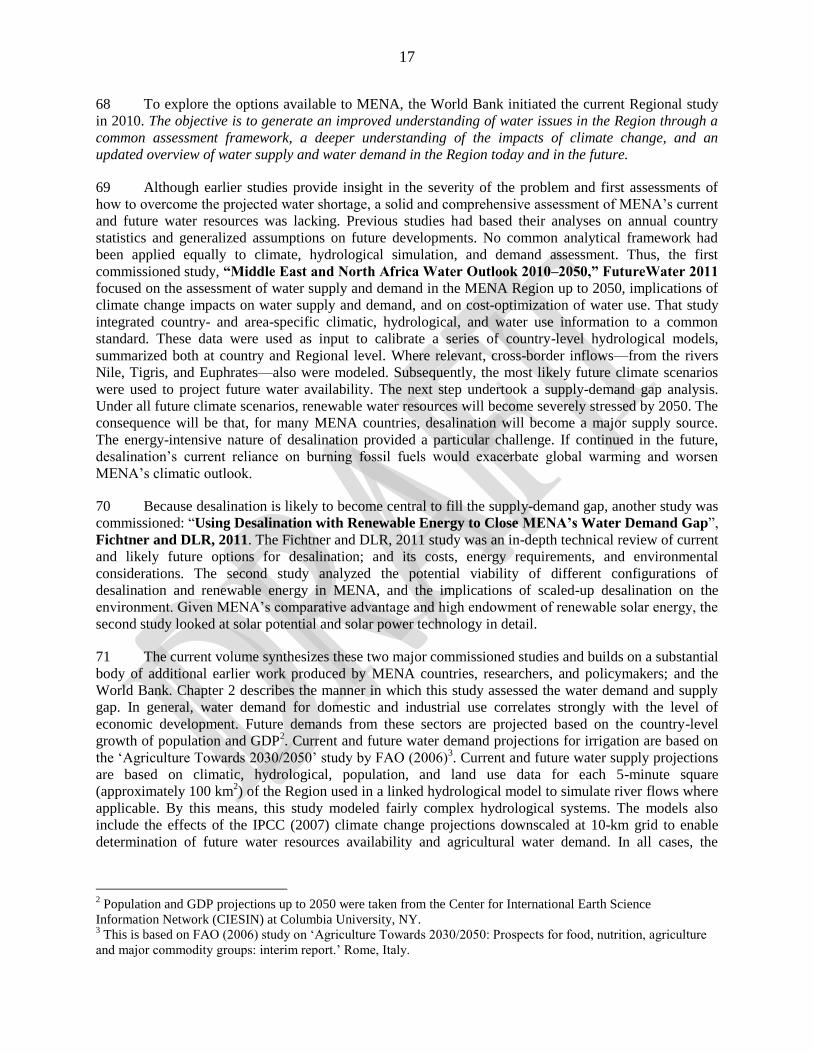
17
68 To explore the options available to MENA, the World Bank initiated the current Regional study
in 2010. The objective is to generate an improved understanding of water issues in the Region through a
common assessment framework, a deeper understanding of the impacts of climate change, and an
updated overview of water supply and water demand in the Region today and in the future.
69 Although earlier studies provide insight in the severity of the problem and first assessments of
how to overcome the projected water shortage, a solid and comprehensive assessment of MENA‘s current
and future water resources was lacking. Previous studies had based their analyses on annual country
statistics and generalized assumptions on future developments. No common analytical framework had
been applied equally to climate, hydrological simulation, and demand assessment. Thus, the first
commissioned study, “Middle East and North Africa Water Outlook 2010–2050,” FutureWater 2011
focused on the assessment of water supply and demand in the MENA Region up to 2050, implications of
climate change impacts on water supply and demand, and on cost-optimization of water use. That study
integrated country- and area-specific climatic, hydrological, and water use information to a common
standard. These data were used as input to calibrate a series of country-level hydrological models,
summarized both at country and Regional level. Where relevant, cross-border inflows—from the rivers
Nile, Tigris, and Euphrates––also were modeled. Subsequently, the most likely future climate scenarios
were used to project future water availability. The next step undertook a supply-demand gap analysis.
Under all future climate scenarios, renewable water resources will become severely stressed by 2050. The
consequence will be that, for many MENA countries, desalination will become a major supply source.
The energy-intensive nature of desalination provided a particular challenge. If continued in the future,
desalination‘s current reliance on burning fossil fuels would exacerbate global warming and worsen
MENA‘s climatic outlook.
70 Because desalination is likely to become central to fill the supply-demand gap, another study was
commissioned: ―Using Desalination with Renewable Energy to Close MENA’s Water Demand Gap‖,
Fichtner and DLR, 2011. The Fichtner and DLR, 2011 study was an in-depth technical review of current
and likely future options for desalination; and its costs, energy requirements, and environmental
considerations. The second study analyzed the potential viability of different configurations of
desalination and renewable energy in MENA, and the implications of scaled-up desalination on the
environment. Given MENA‘s comparative advantage and high endowment of renewable solar energy, the
second study looked at solar potential and solar power technology in detail.
71 The current volume synthesizes these two major commissioned studies and builds on a substantial
body of additional earlier work produced by MENA countries, researchers, and policymakers; and the
World Bank. Chapter 2 describes the manner in which this study assessed the water demand and supply
gap. In general, water demand for domestic and industrial use correlates strongly with the level of
economic development. Future demands from these sectors are projected based on the country-level
growth of population and GDP2. Current and future water demand projections for irrigation are based on
the ‗Agriculture Towards 2030/2050‘ study by FAO (2006)3. Current and future water supply projections
are based on climatic, hydrological, population, and land use data for each 5-minute square
(approximately 100 km2) of the Region used in a linked hydrological model to simulate river flows where
applicable. By this means, this study modeled fairly complex hydrological systems. The models also
include the effects of the IPCC (2007) climate change projections downscaled at 10-km grid to enable
determination of future water resources availability and agricultural water demand. In all cases, the
2 Population and GDP projections up to 2050 were taken from the Center for International Earth Science
Information Network (CIESIN) at Columbia University, NY. 3 This is based on FAO (2006) study on ‗Agriculture Towards 2030/2050: Prospects for food, nutrition, agriculture
and major commodity groups: interim report.‘ Rome, Italy.
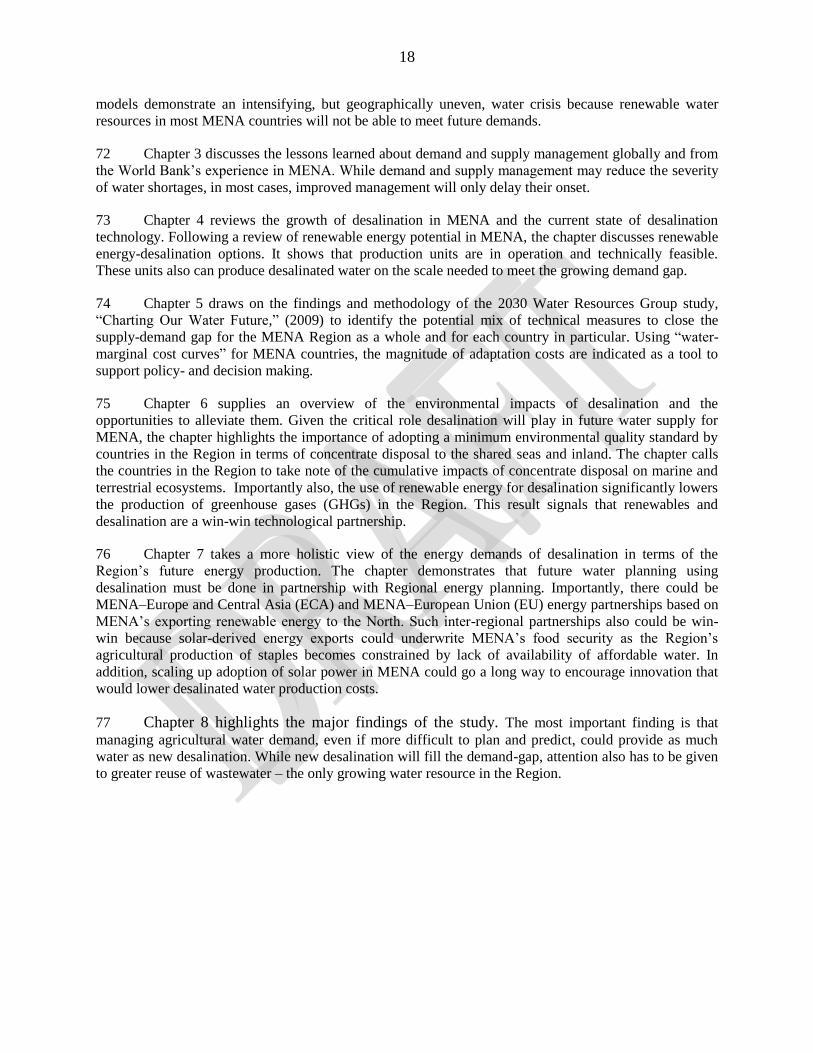
18
models demonstrate an intensifying, but geographically uneven, water crisis because renewable water
resources in most MENA countries will not be able to meet future demands.
72 Chapter 3 discusses the lessons learned about demand and supply management globally and from
the World Bank‘s experience in MENA. While demand and supply management may reduce the severity
of water shortages, in most cases, improved management will only delay their onset.
73 Chapter 4 reviews the growth of desalination in MENA and the current state of desalination
technology. Following a review of renewable energy potential in MENA, the chapter discusses renewable
energy-desalination options. It shows that production units are in operation and technically feasible.
These units also can produce desalinated water on the scale needed to meet the growing demand gap.
74 Chapter 5 draws on the findings and methodology of the 2030 Water Resources Group study,
―Charting Our Water Future,‖ (2009) to identify the potential mix of technical measures to close the
supply-demand gap for the MENA Region as a whole and for each country in particular. Using ―water-
marginal cost curves‖ for MENA countries, the magnitude of adaptation costs are indicated as a tool to
support policy- and decision making.
75 Chapter 6 supplies an overview of the environmental impacts of desalination and the
opportunities to alleviate them. Given the critical role desalination will play in future water supply for
MENA, the chapter highlights the importance of adopting a minimum environmental quality standard by
countries in the Region in terms of concentrate disposal to the shared seas and inland. The chapter calls
the countries in the Region to take note of the cumulative impacts of concentrate disposal on marine and
terrestrial ecosystems. Importantly also, the use of renewable energy for desalination significantly lowers
the production of greenhouse gases (GHGs) in the Region. This result signals that renewables and
desalination are a win-win technological partnership.
76 Chapter 7 takes a more holistic view of the energy demands of desalination in terms of the
Region‘s future energy production. The chapter demonstrates that future water planning using
desalination must be done in partnership with Regional energy planning. Importantly, there could be
MENA–Europe and Central Asia (ECA) and MENA–European Union (EU) energy partnerships based on
MENA‘s exporting renewable energy to the North. Such inter-regional partnerships also could be win-
win because solar-derived energy exports could underwrite MENA‘s food security as the Region‘s
agricultural production of staples becomes constrained by lack of availability of affordable water. In
addition, scaling up adoption of solar power in MENA could go a long way to encourage innovation that
would lower desalinated water production costs.
77 Chapter 8 highlights the major findings of the study. The most important finding is that
managing agricultural water demand, even if more difficult to plan and predict, could provide as much
water as new desalination. While new desalination will fill the demand-gap, attention also has to be given
to greater reuse of wastewater – the only growing water resource in the Region.
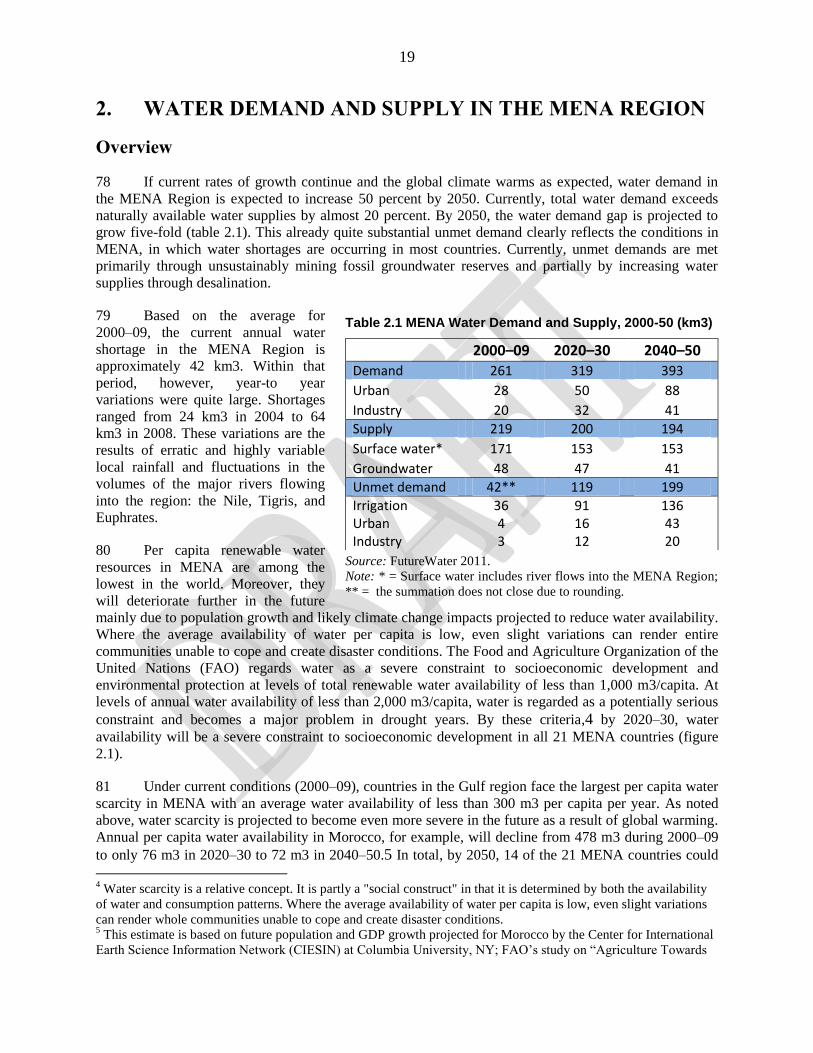
19
2. WATER DEMAND AND SUPPLY IN THE MENA REGION
Overview
78 If current rates of growth continue and the global climate warms as expected, water demand in
the MENA Region is expected to increase 50 percent by 2050. Currently, total water demand exceeds
naturally available water supplies by almost 20 percent. By 2050, the water demand gap is projected to
grow five-fold (table 2.1). This already quite substantial unmet demand clearly reflects the conditions in
MENA, in which water shortages are occurring in most countries. Currently, unmet demands are met
primarily through unsustainably mining fossil groundwater reserves and partially by increasing water
supplies through desalination.
79 Based on the average for
2000–09, the current annual water
shortage in the MENA Region is
approximately 42 km3. Within that
period, however, year-to year
variations were quite large. Shortages
ranged from 24 km3 in 2004 to 64
km3 in 2008. These variations are the
results of erratic and highly variable
local rainfall and fluctuations in the
volumes of the major rivers flowing
into the region: the Nile, Tigris, and
Euphrates.
80 Per capita renewable water
resources in MENA are among the
lowest in the world. Moreover, they
will deteriorate further in the future
mainly due to population growth and likely climate change impacts projected to reduce water availability.
Where the average availability of water per capita is low, even slight variations can render entire
communities unable to cope and create disaster conditions. The Food and Agriculture Organization of the
United Nations (FAO) regards water as a severe constraint to socioeconomic development and
environmental protection at levels of total renewable water availability of less than 1,000 m3/capita. At
levels of annual water availability of less than 2,000 m3/capita, water is regarded as a potentially serious
constraint and becomes a major problem in drought years. By these criteria,4 by 2020–30, water
availability will be a severe constraint to socioeconomic development in all 21 MENA countries (figure
2.1).
81 Under current conditions (2000–09), countries in the Gulf region face the largest per capita water
scarcity in MENA with an average water availability of less than 300 m3 per capita per year. As noted
above, water scarcity is projected to become even more severe in the future as a result of global warming.
Annual per capita water availability in Morocco, for example, will decline from 478 m3 during 2000–09
to only 76 m3 in 2020–30 to 72 m3 in 2040–50.5 In total, by 2050, 14 of the 21 MENA countries could
4 Water scarcity is a relative concept. It is partly a "social construct" in that it is determined by both the availability
of water and consumption patterns. Where the average availability of water per capita is low, even slight variations
can render whole communities unable to cope and create disaster conditions. 5 This estimate is based on future population and GDP growth projected for Morocco by the Center for International
Earth Science Information Network (CIESIN) at Columbia University, NY; FAO‘s study on ―Agriculture Towards
Table 2.1 MENA Water Demand and Supply, 2000-50 (km3)
2000–09 2020–30 2040–50
Demand 261 319 393
Urban 28 50 88
Industry 20 32 41
Supply 219 200 194
Surface water* 171 153 153
Groundwater 48 47 41
Unmet demand 42** 119 199
Irrigation 36 91 136 Urban 4 16 43 Industry 3 12 20
Source: FutureWater 2011.
Note: * = Surface water includes river flows into the MENA Region;
** = the summation does not close due to rounding.
20
have less than 200 m3 of renewable water resources per capita per year.
Figure 2.1 Declining Per Capita Water Availability A Growing Threat in MENA
Figure 2.1 a Average Water Stress by Country, 2000–09
Source: FutureWater 2011.
Figure 2.1 b Average Water Stress by Country, 2020-30
Climate Change Will Affect MENA’s Future Water Supply
82 According to the Intergovernmental Panel on Climate Change (IPCC),6 there is high agreement
and evidence that with current climate change mitigation policies and related sustainable development
2030/2050‖; and the 4
th IPCC‘s climate change projection, estimating a decrease in water availability by about 33
percent by 2050. 6 The IPCC uses four scenarios to explore alternative development pathways, covering a wide range of
demographic, economic, and technological drivers and their resulting GHG emissions. The four scenarios are
subdivided into a number of groups that describe alternative directions depending on the assumed changes in the
demographics, economic factors, and technologies.
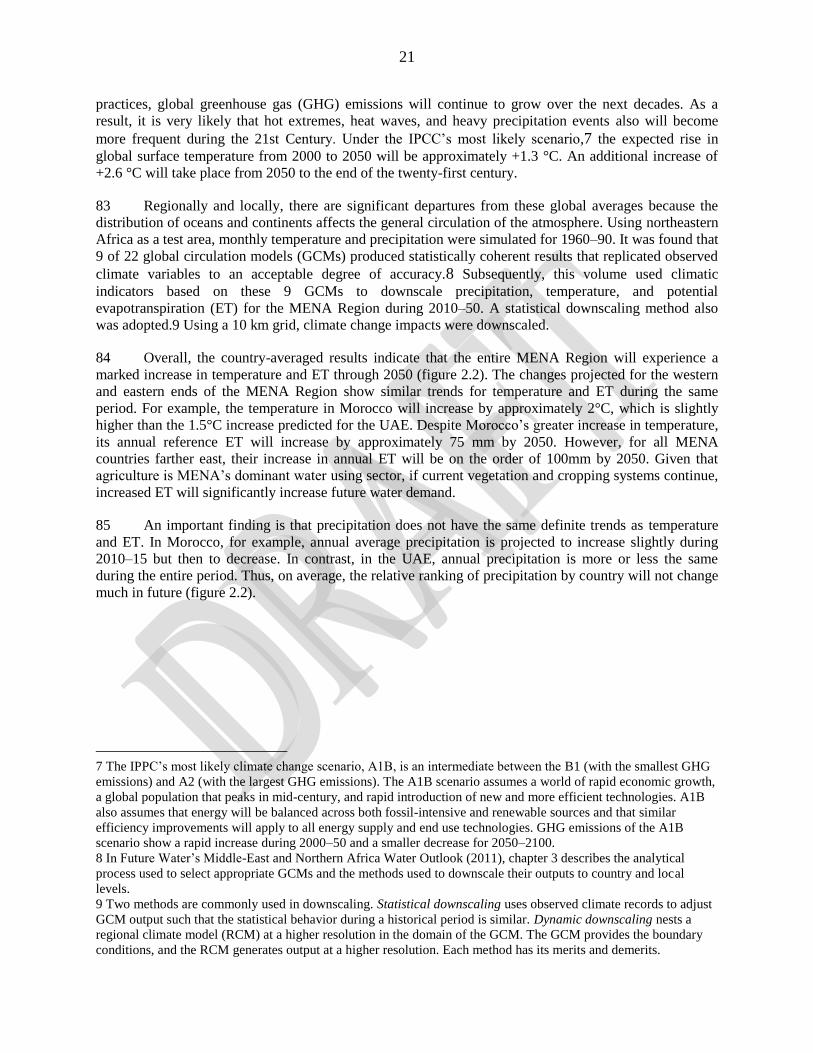
21
practices, global greenhouse gas (GHG) emissions will continue to grow over the next decades. As a
result, it is very likely that hot extremes, heat waves, and heavy precipitation events also will become
more frequent during the 21st Century. Under the IPCC‘s most likely scenario,7 the expected rise in
global surface temperature from 2000 to 2050 will be approximately +1.3 °C. An additional increase of
+2.6 °C will take place from 2050 to the end of the twenty-first century.
83 Regionally and locally, there are significant departures from these global averages because the
distribution of oceans and continents affects the general circulation of the atmosphere. Using northeastern
Africa as a test area, monthly temperature and precipitation were simulated for 1960–90. It was found that
9 of 22 global circulation models (GCMs) produced statistically coherent results that replicated observed
climate variables to an acceptable degree of accuracy.8 Subsequently, this volume used climatic
indicators based on these 9 GCMs to downscale precipitation, temperature, and potential
evapotranspiration (ET) for the MENA Region during 2010–50. A statistical downscaling method also
was adopted.9 Using a 10 km grid, climate change impacts were downscaled.
84 Overall, the country-averaged results indicate that the entire MENA Region will experience a
marked increase in temperature and ET through 2050 (figure 2.2). The changes projected for the western
and eastern ends of the MENA Region show similar trends for temperature and ET during the same
period. For example, the temperature in Morocco will increase by approximately 2°C, which is slightly
higher than the 1.5°C increase predicted for the UAE. Despite Morocco‘s greater increase in temperature,
its annual reference ET will increase by approximately 75 mm by 2050. However, for all MENA
countries farther east, their increase in annual ET will be on the order of 100mm by 2050. Given that
agriculture is MENA‘s dominant water using sector, if current vegetation and cropping systems continue,
increased ET will significantly increase future water demand.
85 An important finding is that precipitation does not have the same definite trends as temperature
and ET. In Morocco, for example, annual average precipitation is projected to increase slightly during
2010–15 but then to decrease. In contrast, in the UAE, annual precipitation is more or less the same
during the entire period. Thus, on average, the relative ranking of precipitation by country will not change
much in future (figure 2.2).
7 The IPPC‘s most likely climate change scenario, A1B, is an intermediate between the B1 (with the smallest GHG
emissions) and A2 (with the largest GHG emissions). The A1B scenario assumes a world of rapid economic growth,
a global population that peaks in mid-century, and rapid introduction of new and more efficient technologies. A1B
also assumes that energy will be balanced across both fossil-intensive and renewable sources and that similar
efficiency improvements will apply to all energy supply and end use technologies. GHG emissions of the A1B
scenario show a rapid increase during 2000–50 and a smaller decrease for 2050–2100.
8 In Future Water‘s Middle-East and Northern Africa Water Outlook (2011), chapter 3 describes the analytical
process used to select appropriate GCMs and the methods used to downscale their outputs to country and local
levels.
9 Two methods are commonly used in downscaling. Statistical downscaling uses observed climate records to adjust
GCM output such that the statistical behavior during a historical period is similar. Dynamic downscaling nests a
regional climate model (RCM) at a higher resolution in the domain of the GCM. The GCM provides the boundary
conditions, and the RCM generates output at a higher resolution. Each method has its merits and demerits.
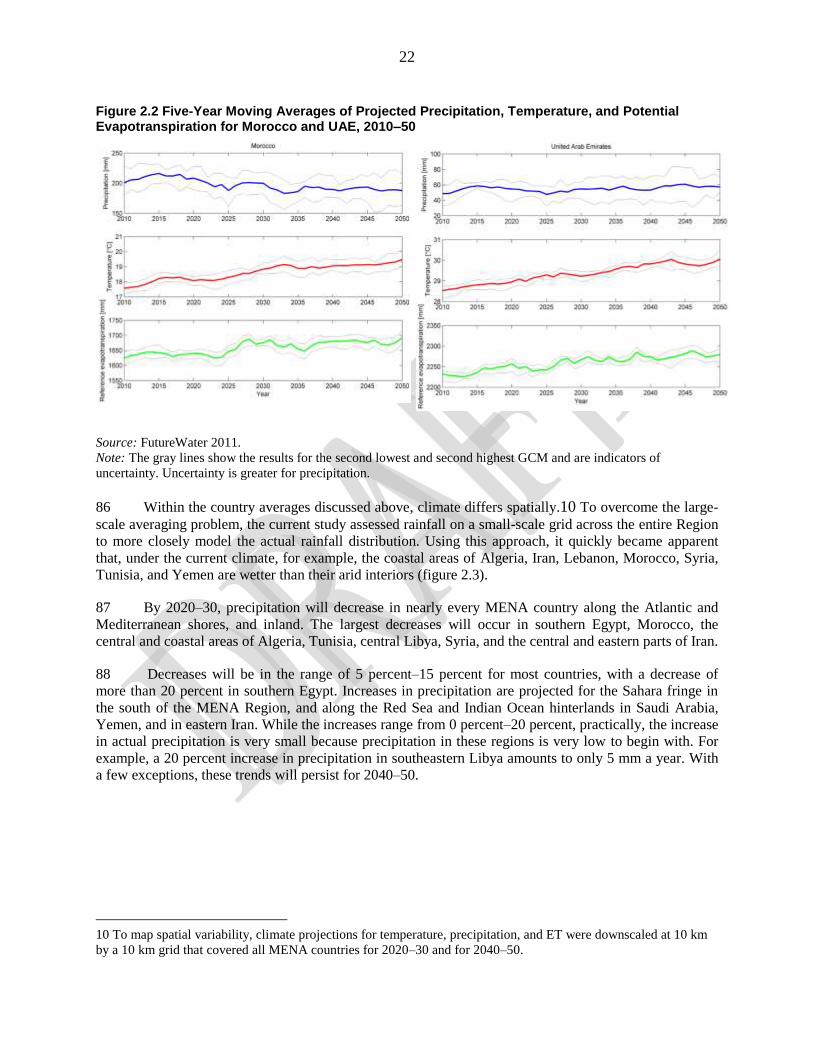
22
Figure 2.2 Five-Year Moving Averages of Projected Precipitation, Temperature, and Potential Evapotranspiration for Morocco and UAE, 2010–50
Source: FutureWater 2011.
Note: The gray lines show the results for the second lowest and second highest GCM and are indicators of
uncertainty. Uncertainty is greater for precipitation.
86 Within the country averages discussed above, climate differs spatially.10 To overcome the large-
scale averaging problem, the current study assessed rainfall on a small-scale grid across the entire Region
to more closely model the actual rainfall distribution. Using this approach, it quickly became apparent
that, under the current climate, for example, the coastal areas of Algeria, Iran, Lebanon, Morocco, Syria,
Tunisia, and Yemen are wetter than their arid interiors (figure 2.3).
87 By 2020–30, precipitation will decrease in nearly every MENA country along the Atlantic and
Mediterranean shores, and inland. The largest decreases will occur in southern Egypt, Morocco, the
central and coastal areas of Algeria, Tunisia, central Libya, Syria, and the central and eastern parts of Iran.
88 Decreases will be in the range of 5 percent–15 percent for most countries, with a decrease of
more than 20 percent in southern Egypt. Increases in precipitation are projected for the Sahara fringe in
the south of the MENA Region, and along the Red Sea and Indian Ocean hinterlands in Saudi Arabia,
Yemen, and in eastern Iran. While the increases range from 0 percent–20 percent, practically, the increase
in actual precipitation is very small because precipitation in these regions is very low to begin with. For
example, a 20 percent increase in precipitation in southeastern Libya amounts to only 5 mm a year. With
a few exceptions, these trends will persist for 2040–50.
10 To map spatial variability, climate projections for temperature, precipitation, and ET were downscaled at 10 km
by a 10 km grid that covered all MENA countries for 2020–30 and for 2040–50.
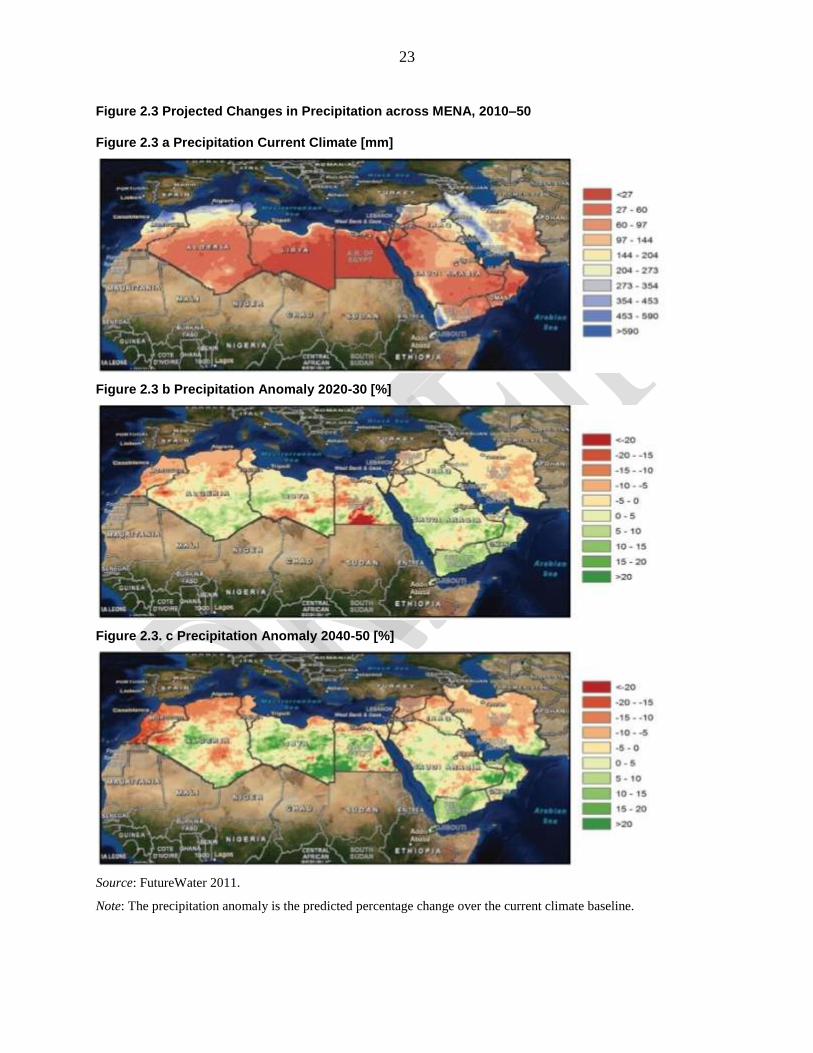
23
Figure 2.3 Projected Changes in Precipitation across MENA, 2010–50
Figure 2.3 a Precipitation Current Climate [mm]
Figure 2.3 b Precipitation Anomaly 2020-30 [%]
Figure 2.3. c Precipitation Anomaly 2040-50 [%]
Source: FutureWater 2011.
Note: The precipitation anomaly is the predicted percentage change over the current climate baseline.
24
89 Temperature and ET follow similar spatial trends. However, temperature changes in coastal areas
tend to be smaller than temperature changes in the arid interiors such as the Sahara regions. The smallest
increases in temperature (<0.15 °C) occur in North Libya, North Egypt, Israel, Lebanon, Jordan, and West
Syria. The largest temperature increases (>0.65 °C) are found in northern Morocco, northern and southern
Algeria, southern Saudi Arabia, southern Iran, and
central and northern Yemen and Oman.
90 Throughout the Region, annual ET
increases from the coasts inland. For 2020–30, the
annual ET is projected to increase in western and
eastern MENA countries and in coastal areas by as
much as 2 percent–9 percent. However, inland
regions of some MENA countries, including
Algeria, Libya, Egypt, and Jordan, will see a small
decrease in annual ET. As the Region continues to
warm, ET will further increase.
91 Precipitation. Based on the period 2000–
09, rainfall in the MENA Region currently
provides an average of 1,122 km3 a year. Seventy-
five percent of this rain falls on only 4 countries:
Iran (31 percent), Algeria (19 percent), Saudi
Arabia (13 percent), and Morocco (8 percent). An
important point is that when precipitation is
expressed in km3, as it is in the current study to
estimate the MENA water balance, the overall
total is strongly biased by the largest countries
(figure 2.4).
92 In all MENA countries except Egypt,
Iraq, and Syria, precipitation is the principal
renewable water resource.11 Annual rainfall
variability for the Region averages approximately
30 percent. However, some countries such as
Djibouti, Morocco, Oman, and Tunisia show
exceptional annual variability of approximately or
above 40 percent. Countries with a high variation
in precipitation require a higher adaptive capacity, which may include more reservoir storage, a greater
reliance on groundwater, or greater on-demand desalination capacity.
93 Precipitation feeds some perennial rivers, but few flow to the sea. The exceptions are in Morocco,
Algeria, and Tunisia in the west and Iran in the east. Rarely, exceptionally heavy storms in the northern
UAE, Oman, Lebanon, Yemen, and Algeria cause floods that reach the seas. Precipitation not lost to the
sea or to evaporation will be stored in reservoirs, and underground, in either the soil profile or deeper
aquifers.
94 The exact amount of precipitation stored by reservoirs in MENA at any one point is difficult to
11
Egypt, Iraq, and Syria rely on transboundary inflow to provide the bulk of their renewable water supplies.
Figure 2.4 Wide Range of Average Annual Precipitation among MENA Countries, 2000–09
Source: FutureWater 2011.
0 100 200 300 400 500 600
Egypt
Libya
Oman
UAE
Jordan
Saudi Arabia
Bahrain
Algeria
Qatar
Yemen
Kuwait
Iran
Isreal
Iraq
WBG
Syria
Tunisia
Morocco
West Bank
Djibouti
Malta
Lebanon
mm km3
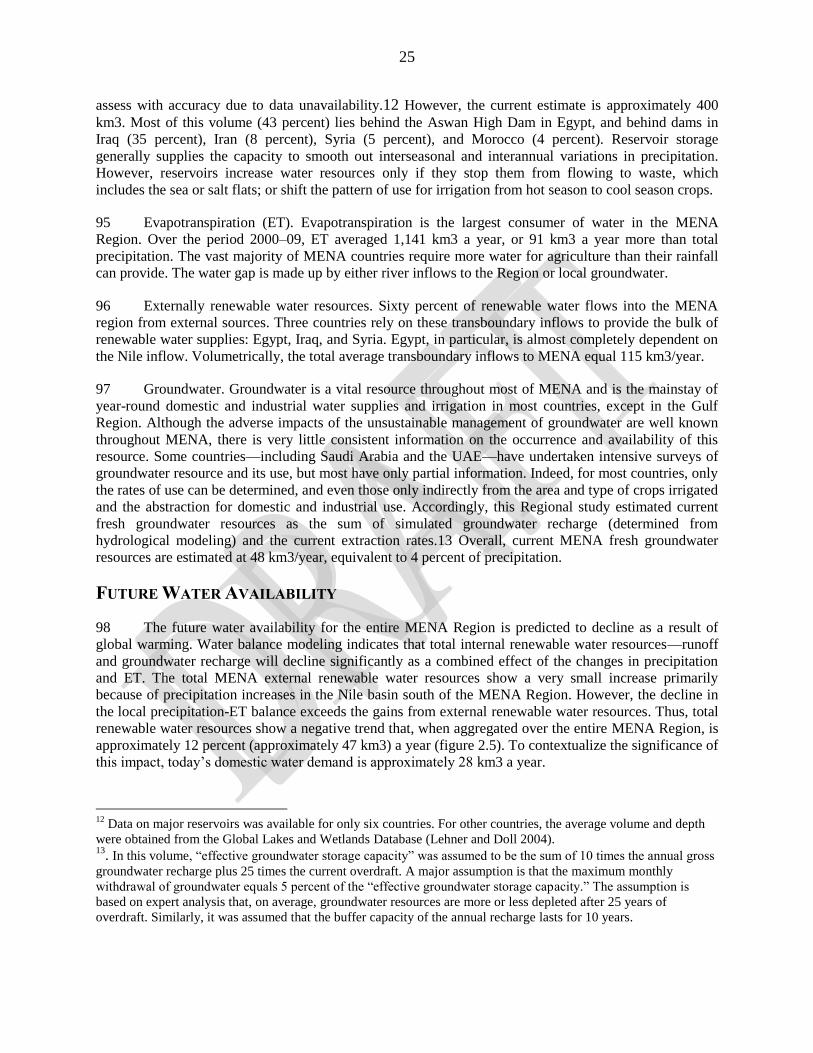
25
assess with accuracy due to data unavailability.12 However, the current estimate is approximately 400
km3. Most of this volume (43 percent) lies behind the Aswan High Dam in Egypt, and behind dams in
Iraq (35 percent), Iran (8 percent), Syria (5 percent), and Morocco (4 percent). Reservoir storage
generally supplies the capacity to smooth out interseasonal and interannual variations in precipitation.
However, reservoirs increase water resources only if they stop them from flowing to waste, which
includes the sea or salt flats; or shift the pattern of use for irrigation from hot season to cool season crops.
95 Evapotranspiration (ET). Evapotranspiration is the largest consumer of water in the MENA
Region. Over the period 2000–09, ET averaged 1,141 km3 a year, or 91 km3 a year more than total
precipitation. The vast majority of MENA countries require more water for agriculture than their rainfall
can provide. The water gap is made up by either river inflows to the Region or local groundwater.
96 Externally renewable water resources. Sixty percent of renewable water flows into the MENA
region from external sources. Three countries rely on these transboundary inflows to provide the bulk of
renewable water supplies: Egypt, Iraq, and Syria. Egypt, in particular, is almost completely dependent on
the Nile inflow. Volumetrically, the total average transboundary inflows to MENA equal 115 km3/year.
97 Groundwater. Groundwater is a vital resource throughout most of MENA and is the mainstay of
year-round domestic and industrial water supplies and irrigation in most countries, except in the Gulf
Region. Although the adverse impacts of the unsustainable management of groundwater are well known
throughout MENA, there is very little consistent information on the occurrence and availability of this
resource. Some countries––including Saudi Arabia and the UAE––have undertaken intensive surveys of
groundwater resource and its use, but most have only partial information. Indeed, for most countries, only
the rates of use can be determined, and even those only indirectly from the area and type of crops irrigated
and the abstraction for domestic and industrial use. Accordingly, this Regional study estimated current
fresh groundwater resources as the sum of simulated groundwater recharge (determined from
hydrological modeling) and the current extraction rates.13 Overall, current MENA fresh groundwater
resources are estimated at 48 km3/year, equivalent to 4 percent of precipitation.
FUTURE WATER AVAILABILITY
98 The future water availability for the entire MENA Region is predicted to decline as a result of
global warming. Water balance modeling indicates that total internal renewable water resources––runoff
and groundwater recharge will decline significantly as a combined effect of the changes in precipitation
and ET. The total MENA external renewable water resources show a very small increase primarily
because of precipitation increases in the Nile basin south of the MENA Region. However, the decline in
the local precipitation-ET balance exceeds the gains from external renewable water resources. Thus, total
renewable water resources show a negative trend that, when aggregated over the entire MENA Region, is
approximately 12 percent (approximately 47 km3) a year (figure 2.5). To contextualize the significance of
this impact, today‘s domestic water demand is approximately 28 km3 a year.
12
Data on major reservoirs was available for only six countries. For other countries, the average volume and depth
were obtained from the Global Lakes and Wetlands Database (Lehner and Doll 2004). 13
. In this volume, ―effective groundwater storage capacity‖ was assumed to be the sum of 10 times the annual gross
groundwater recharge plus 25 times the current overdraft. A major assumption is that the maximum monthly
withdrawal of groundwater equals 5 percent of the ―effective groundwater storage capacity.‖ The assumption is based on expert analysis that, on average, groundwater resources are more or less depleted after 25 years of
overdraft. Similarly, it was assumed that the buffer capacity of the annual recharge lasts for 10 years.
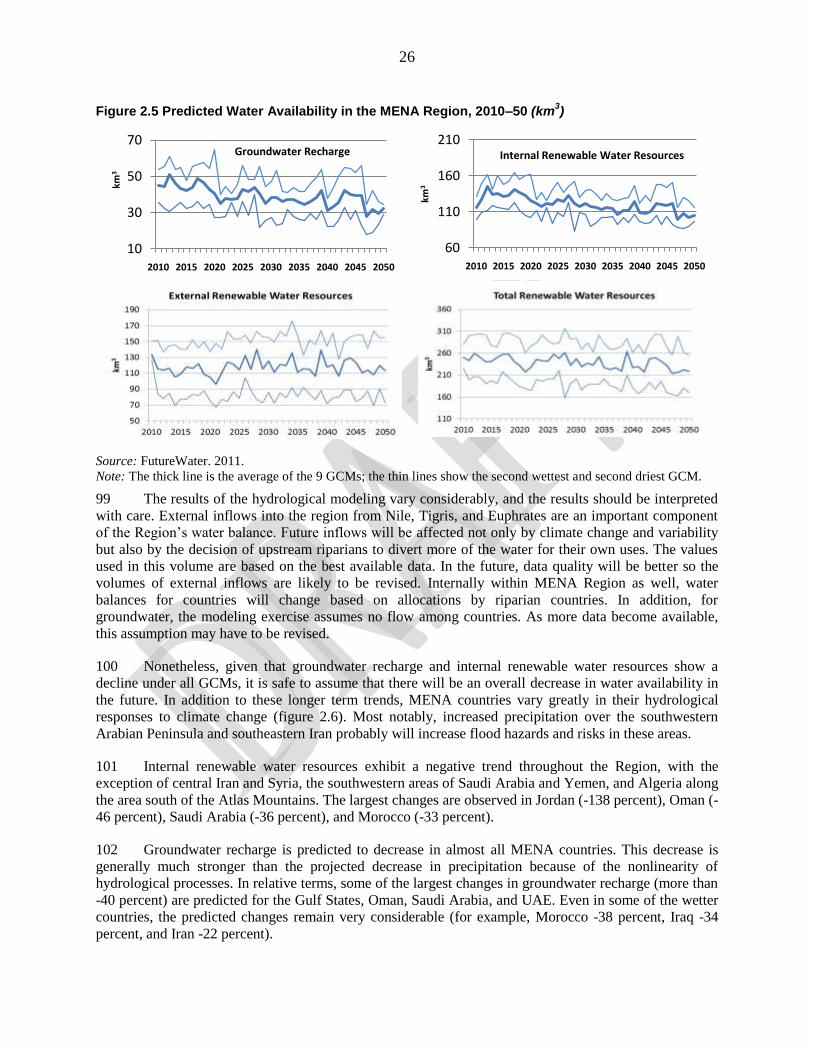
26
Figure 2.5 Predicted Water Availability in the MENA Region, 2010–50 (km3)
Source: FutureWater. 2011.
Note: The thick line is the average of the 9 GCMs; the thin lines show the second wettest and second driest GCM.
99 The results of the hydrological modeling vary considerably, and the results should be interpreted
with care. External inflows into the region from Nile, Tigris, and Euphrates are an important component
of the Region‘s water balance. Future inflows will be affected not only by climate change and variability
but also by the decision of upstream riparians to divert more of the water for their own uses. The values
used in this volume are based on the best available data. In the future, data quality will be better so the
volumes of external inflows are likely to be revised. Internally within MENA Region as well, water
balances for countries will change based on allocations by riparian countries. In addition, for
groundwater, the modeling exercise assumes no flow among countries. As more data become available,
this assumption may have to be revised.
100 Nonetheless, given that groundwater recharge and internal renewable water resources show a
decline under all GCMs, it is safe to assume that there will be an overall decrease in water availability in
the future. In addition to these longer term trends, MENA countries vary greatly in their hydrological
responses to climate change (figure 2.6). Most notably, increased precipitation over the southwestern
Arabian Peninsula and southeastern Iran probably will increase flood hazards and risks in these areas.
101 Internal renewable water resources exhibit a negative trend throughout the Region, with the
exception of central Iran and Syria, the southwestern areas of Saudi Arabia and Yemen, and Algeria along
the area south of the Atlas Mountains. The largest changes are observed in Jordan (-138 percent), Oman (-
46 percent), Saudi Arabia (-36 percent), and Morocco (-33 percent).
102 Groundwater recharge is predicted to decrease in almost all MENA countries. This decrease is
generally much stronger than the projected decrease in precipitation because of the nonlinearity of
hydrological processes. In relative terms, some of the largest changes in groundwater recharge (more than
-40 percent) are predicted for the Gulf States, Oman, Saudi Arabia, and UAE. Even in some of the wetter
countries, the predicted changes remain very considerable (for example, Morocco -38 percent, Iraq -34
percent, and Iran -22 percent).
10
30
50
70
2010 2015 2020 2025 2030 2035 2040 2045 2050
km3
Groundwater Recharge
60
110
160
210
2010 2015 2020 2025 2030 2035 2040 2045 2050
km3
Internal Renewable Water Resources
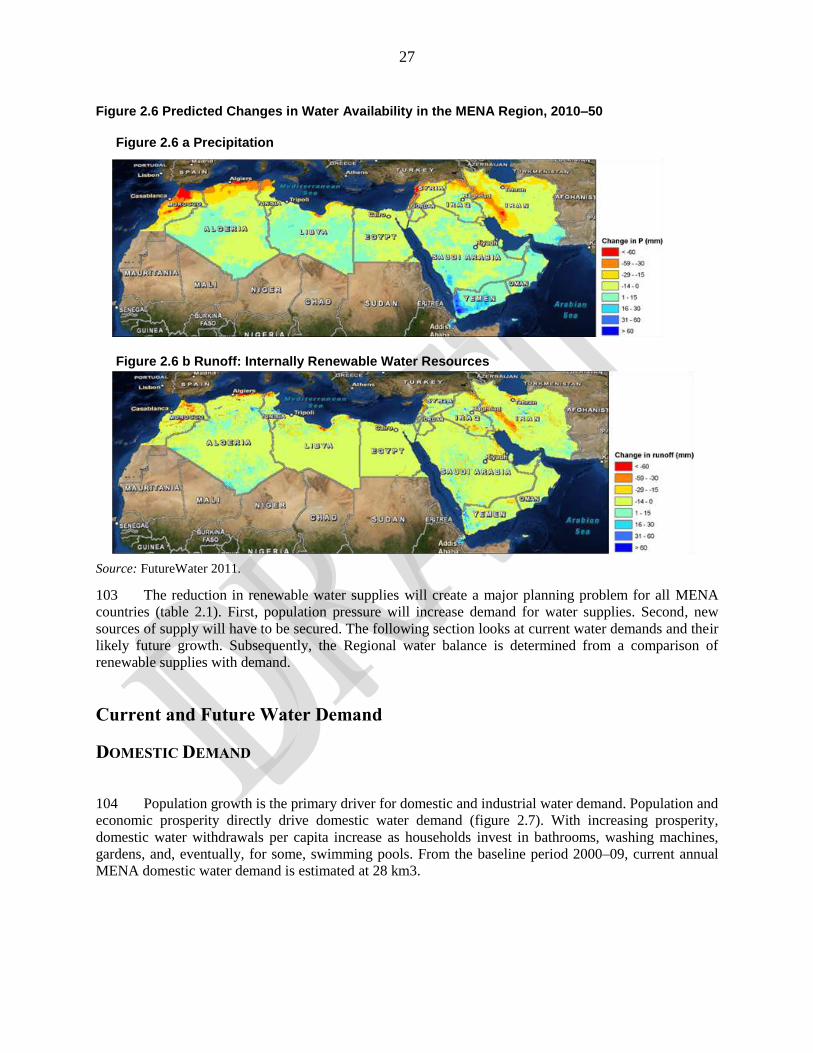
27
Figure 2.6 Predicted Changes in Water Availability in the MENA Region, 2010–50
Figure 2.6 a Precipitation
Figure 2.6 b Runoff: Internally Renewable Water Resources
Source: FutureWater 2011.
103 The reduction in renewable water supplies will create a major planning problem for all MENA
countries (table 2.1). First, population pressure will increase demand for water supplies. Second, new
sources of supply will have to be secured. The following section looks at current water demands and their
likely future growth. Subsequently, the Regional water balance is determined from a comparison of
renewable supplies with demand.
Current and Future Water Demand
DOMESTIC DEMAND
104 Population growth is the primary driver for domestic and industrial water demand. Population and
economic prosperity directly drive domestic water demand (figure 2.7). With increasing prosperity,
domestic water withdrawals per capita increase as households invest in bathrooms, washing machines,
gardens, and, eventually, for some, swimming pools. From the baseline period 2000–09, current annual
MENA domestic water demand is estimated at 28 km3.
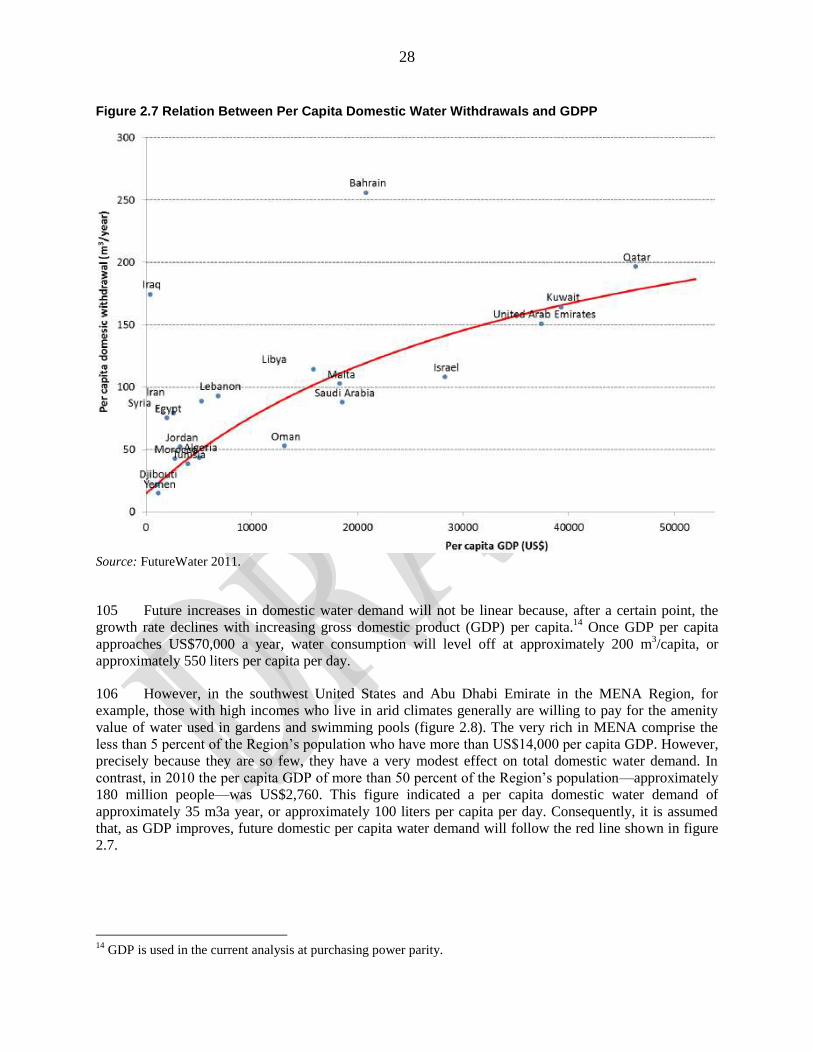
28
Figure 2.7 Relation Between Per Capita Domestic Water Withdrawals and GDPP
Source: FutureWater 2011.
105 Future increases in domestic water demand will not be linear because, after a certain point, the
growth rate declines with increasing gross domestic product (GDP) per capita.14
Once GDP per capita
approaches US$70,000 a year, water consumption will level off at approximately 200 m3/capita, or
approximately 550 liters per capita per day.
106 However, in the southwest United States and Abu Dhabi Emirate in the MENA Region, for
example, those with high incomes who live in arid climates generally are willing to pay for the amenity
value of water used in gardens and swimming pools (figure 2.8). The very rich in MENA comprise the
less than 5 percent of the Region‘s population who have more than US$14,000 per capita GDP. However,
precisely because they are so few, they have a very modest effect on total domestic water demand. In
contrast, in 2010 the per capita GDP of more than 50 percent of the Region‘s population––approximately
180 million people––was US$2,760. This figure indicated a per capita domestic water demand of
approximately 35 m3a year, or approximately 100 liters per capita per day. Consequently, it is assumed
that, as GDP improves, future domestic per capita water demand will follow the red line shown in figure
2.7.
14
GDP is used in the current analysis at purchasing power parity.
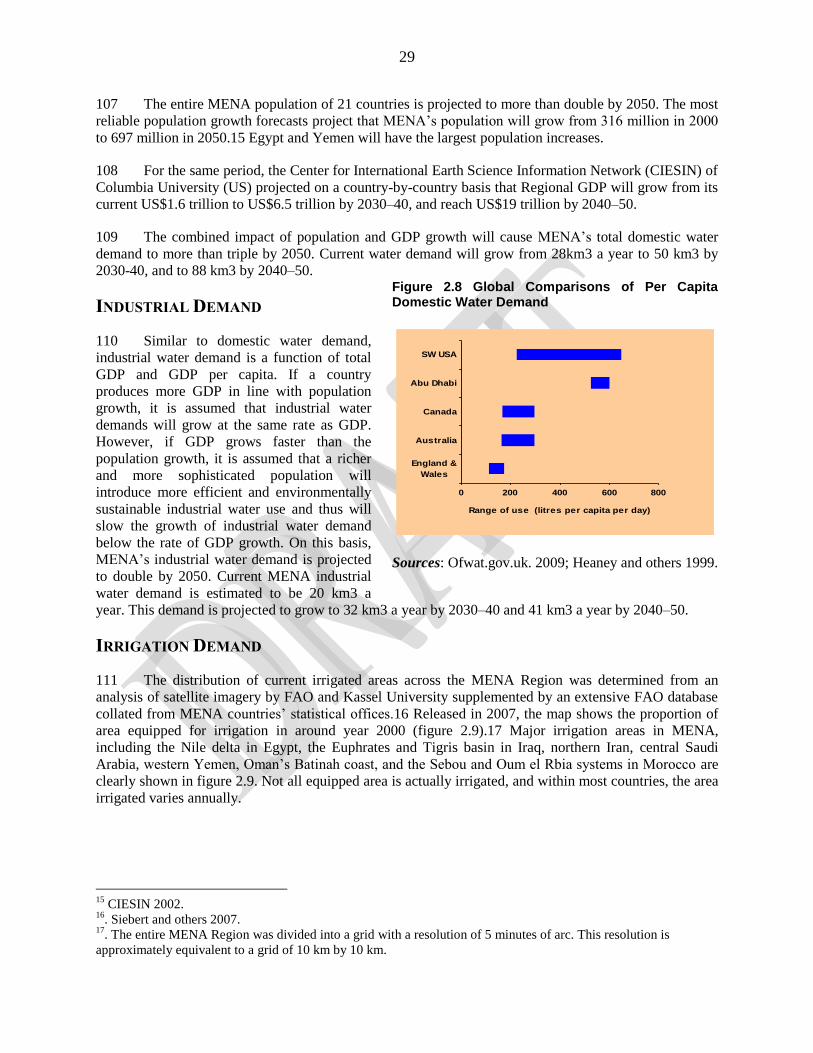
29
107 The entire MENA population of 21 countries is projected to more than double by 2050. The most
reliable population growth forecasts project that MENA‘s population will grow from 316 million in 2000
to 697 million in 2050.15 Egypt and Yemen will have the largest population increases.
108 For the same period, the Center for International Earth Science Information Network (CIESIN) of
Columbia University (US) projected on a country-by-country basis that Regional GDP will grow from its
current US$1.6 trillion to US$6.5 trillion by 2030–40, and reach US$19 trillion by 2040–50.
109 The combined impact of population and GDP growth will cause MENA‘s total domestic water
demand to more than triple by 2050. Current water demand will grow from 28km3 a year to 50 km3 by
2030-40, and to 88 km3 by 2040–50.
INDUSTRIAL DEMAND
110 Similar to domestic water demand,
industrial water demand is a function of total
GDP and GDP per capita. If a country
produces more GDP in line with population
growth, it is assumed that industrial water
demands will grow at the same rate as GDP.
However, if GDP grows faster than the
population growth, it is assumed that a richer
and more sophisticated population will
introduce more efficient and environmentally
sustainable industrial water use and thus will
slow the growth of industrial water demand
below the rate of GDP growth. On this basis,
MENA‘s industrial water demand is projected
to double by 2050. Current MENA industrial
water demand is estimated to be 20 km3 a
year. This demand is projected to grow to 32 km3 a year by 2030–40 and 41 km3 a year by 2040–50.
IRRIGATION DEMAND
111 The distribution of current irrigated areas across the MENA Region was determined from an
analysis of satellite imagery by FAO and Kassel University supplemented by an extensive FAO database
collated from MENA countries‘ statistical offices.16 Released in 2007, the map shows the proportion of
area equipped for irrigation in around year 2000 (figure 2.9).17 Major irrigation areas in MENA,
including the Nile delta in Egypt, the Euphrates and Tigris basin in Iraq, northern Iran, central Saudi
Arabia, western Yemen, Oman‘s Batinah coast, and the Sebou and Oum el Rbia systems in Morocco are
clearly shown in figure 2.9. Not all equipped area is actually irrigated, and within most countries, the area
irrigated varies annually.
15
CIESIN 2002. 16
. Siebert and others 2007. 17
. The entire MENA Region was divided into a grid with a resolution of 5 minutes of arc. This resolution is
approximately equivalent to a grid of 10 km by 10 km.
Figure 2.8 Global Comparisons of Per Capita Domestic Water Demand
Sources: Ofwat.gov.uk. 2009; Heaney and others 1999.
0 200 400 600 800
Range of use (litres per capita per day)
England &
Wales
Australia
Canada
Abu Dhabi
SW USA
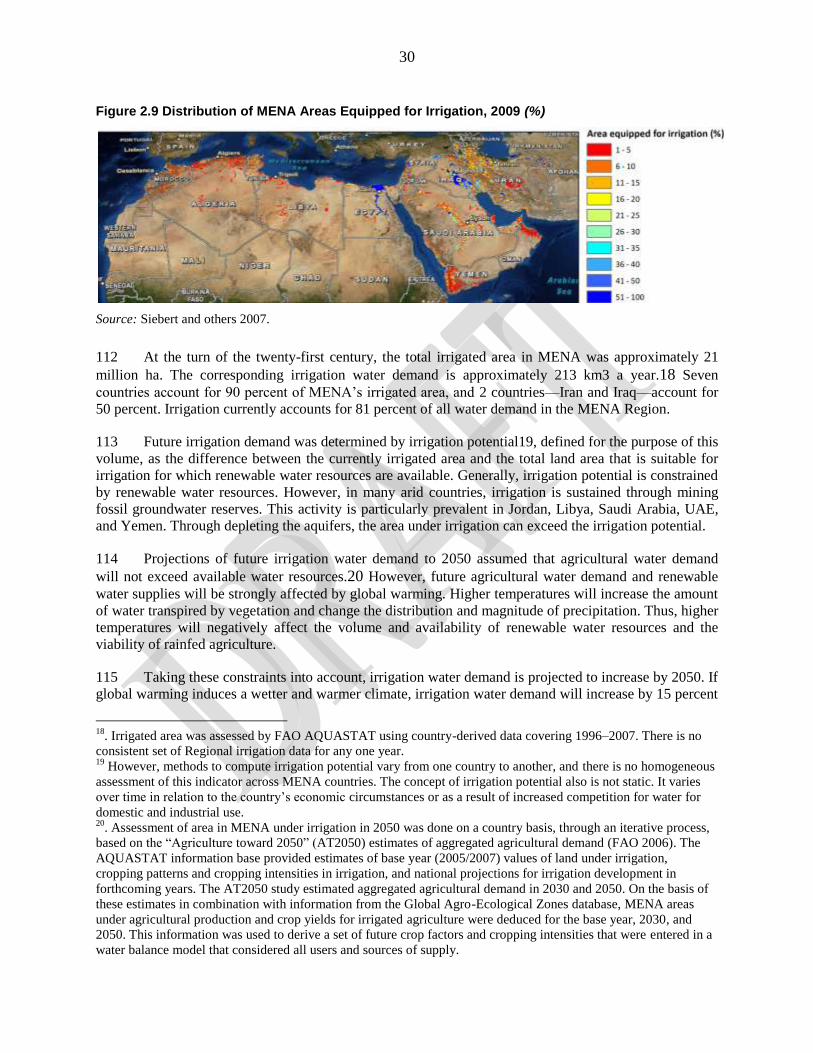
30
Figure 2.9 Distribution of MENA Areas Equipped for Irrigation, 2009 (%)
Source: Siebert and others 2007.
112 At the turn of the twenty-first century, the total irrigated area in MENA was approximately 21
million ha. The corresponding irrigation water demand is approximately 213 km3 a year.18 Seven
countries account for 90 percent of MENA‘s irrigated area, and 2 countries––Iran and Iraq––account for
50 percent. Irrigation currently accounts for 81 percent of all water demand in the MENA Region.
113 Future irrigation demand was determined by irrigation potential19, defined for the purpose of this
volume, as the difference between the currently irrigated area and the total land area that is suitable for
irrigation for which renewable water resources are available. Generally, irrigation potential is constrained
by renewable water resources. However, in many arid countries, irrigation is sustained through mining
fossil groundwater reserves. This activity is particularly prevalent in Jordan, Libya, Saudi Arabia, UAE,
and Yemen. Through depleting the aquifers, the area under irrigation can exceed the irrigation potential.
114 Projections of future irrigation water demand to 2050 assumed that agricultural water demand
will not exceed available water resources.20 However, future agricultural water demand and renewable
water supplies will be strongly affected by global warming. Higher temperatures will increase the amount
of water transpired by vegetation and change the distribution and magnitude of precipitation. Thus, higher
temperatures will negatively affect the volume and availability of renewable water resources and the
viability of rainfed agriculture.
115 Taking these constraints into account, irrigation water demand is projected to increase by 2050. If
global warming induces a wetter and warmer climate, irrigation water demand will increase by 15 percent
18
. Irrigated area was assessed by FAO AQUASTAT using country-derived data covering 1996–2007. There is no
consistent set of Regional irrigation data for any one year. 19
However, methods to compute irrigation potential vary from one country to another, and there is no homogeneous
assessment of this indicator across MENA countries. The concept of irrigation potential also is not static. It varies
over time in relation to the country‘s economic circumstances or as a result of increased competition for water for
domestic and industrial use. 20
. Assessment of area in MENA under irrigation in 2050 was done on a country basis, through an iterative process,
based on the ―Agriculture toward 2050‖ (AT2050) estimates of aggregated agricultural demand (FAO 2006). The
AQUASTAT information base provided estimates of base year (2005/2007) values of land under irrigation,
cropping patterns and cropping intensities in irrigation, and national projections for irrigation development in
forthcoming years. The AT2050 study estimated aggregated agricultural demand in 2030 and 2050. On the basis of
these estimates in combination with information from the Global Agro-Ecological Zones database, MENA areas
under agricultural production and crop yields for irrigated agriculture were deduced for the base year, 2030, and
2050. This information was used to derive a set of future crop factors and cropping intensities that were entered in a
water balance model that considered all users and sources of supply.
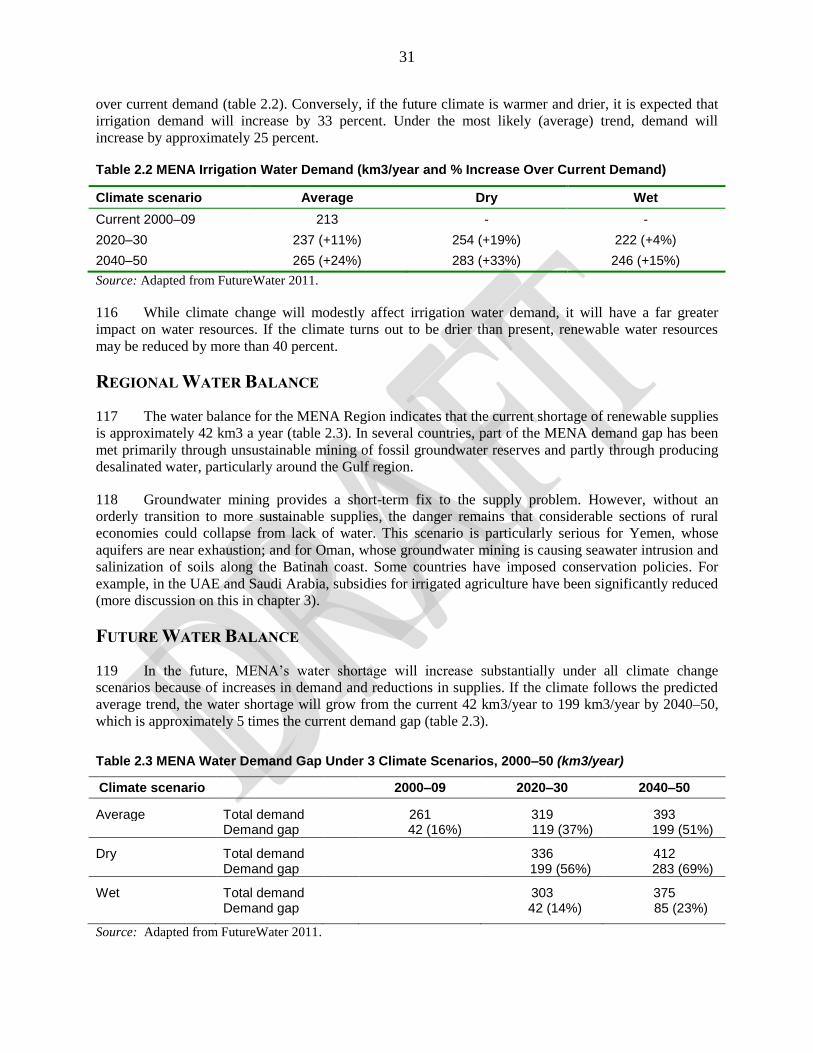
31
over current demand (table 2.2). Conversely, if the future climate is warmer and drier, it is expected that
irrigation demand will increase by 33 percent. Under the most likely (average) trend, demand will
increase by approximately 25 percent.
Table 2.2 MENA Irrigation Water Demand (km3/year and % Increase Over Current Demand)
Climate scenario Average Dry Wet
Current 2000–09 213 - -
2020–30 237 (+11%) 254 (+19%) 222 (+4%)
2040–50 265 (+24%) 283 (+33%) 246 (+15%)
Source: Adapted from FutureWater 2011.
116 While climate change will modestly affect irrigation water demand, it will have a far greater
impact on water resources. If the climate turns out to be drier than present, renewable water resources
may be reduced by more than 40 percent.
REGIONAL WATER BALANCE
117 The water balance for the MENA Region indicates that the current shortage of renewable supplies
is approximately 42 km3 a year (table 2.3). In several countries, part of the MENA demand gap has been
met primarily through unsustainable mining of fossil groundwater reserves and partly through producing
desalinated water, particularly around the Gulf region.
118 Groundwater mining provides a short-term fix to the supply problem. However, without an
orderly transition to more sustainable supplies, the danger remains that considerable sections of rural
economies could collapse from lack of water. This scenario is particularly serious for Yemen, whose
aquifers are near exhaustion; and for Oman, whose groundwater mining is causing seawater intrusion and
salinization of soils along the Batinah coast. Some countries have imposed conservation policies. For
example, in the UAE and Saudi Arabia, subsidies for irrigated agriculture have been significantly reduced
(more discussion on this in chapter 3).
FUTURE WATER BALANCE
119 In the future, MENA‘s water shortage will increase substantially under all climate change
scenarios because of increases in demand and reductions in supplies. If the climate follows the predicted
average trend, the water shortage will grow from the current 42 km3/year to 199 km3/year by 2040–50,
which is approximately 5 times the current demand gap (table 2.3).
Table 2.3 MENA Water Demand Gap Under 3 Climate Scenarios, 2000–50 (km3/year)
Climate scenario 2000–09 2020–30 2040–50
Average Total demand 261 319 393 Demand gap 42 (16%) 119 (37%) 199 (51%)
Dry Total demand 336 412 Demand gap 199 (56%) 283 (69%)
Wet Total demand 303 375
Demand gap 42 (14%) 85 (23%)
Source: Adapted from FutureWater 2011.
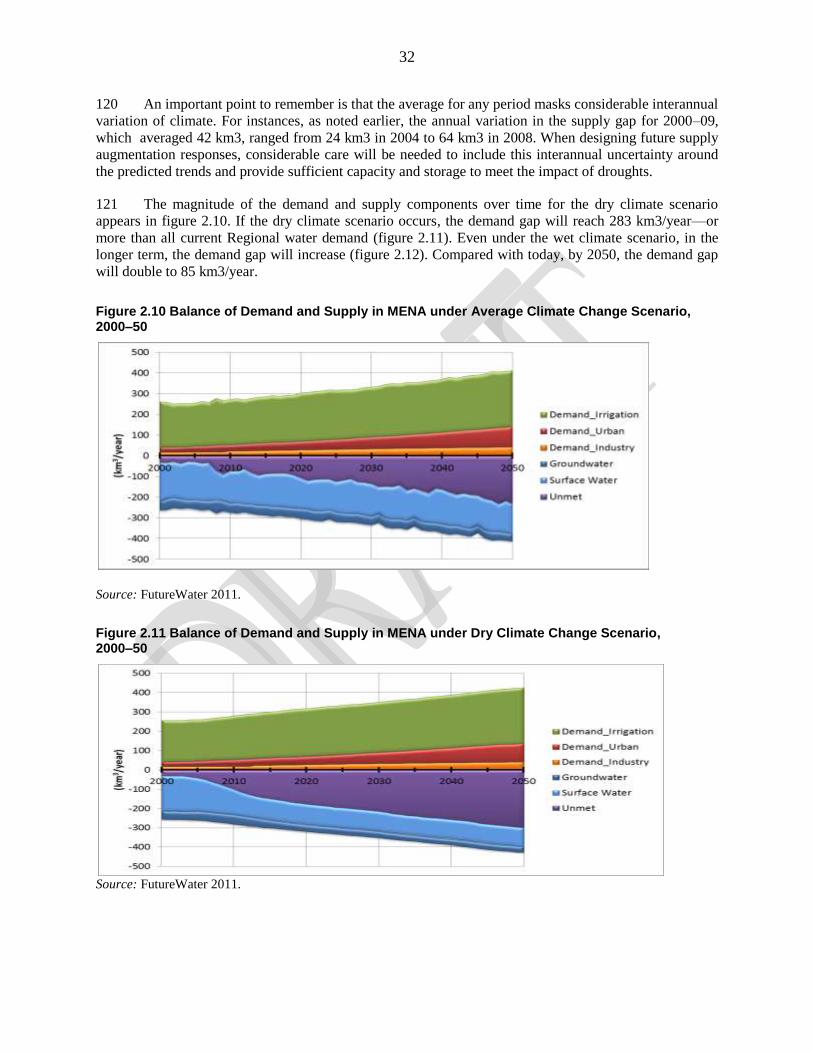
32
120 An important point to remember is that the average for any period masks considerable interannual
variation of climate. For instances, as noted earlier, the annual variation in the supply gap for 2000–09,
which averaged 42 km3, ranged from 24 km3 in 2004 to 64 km3 in 2008. When designing future supply
augmentation responses, considerable care will be needed to include this interannual uncertainty around
the predicted trends and provide sufficient capacity and storage to meet the impact of droughts.
121 The magnitude of the demand and supply components over time for the dry climate scenario
appears in figure 2.10. If the dry climate scenario occurs, the demand gap will reach 283 km3/year––or
more than all current Regional water demand (figure 2.11). Even under the wet climate scenario, in the
longer term, the demand gap will increase (figure 2.12). Compared with today, by 2050, the demand gap
will double to 85 km3/year.
Figure 2.10 Balance of Demand and Supply in MENA under Average Climate Change Scenario, 2000–50
Source: FutureWater 2011.
Figure 2.11 Balance of Demand and Supply in MENA under Dry Climate Change Scenario, 2000–50
Source: FutureWater 2011.
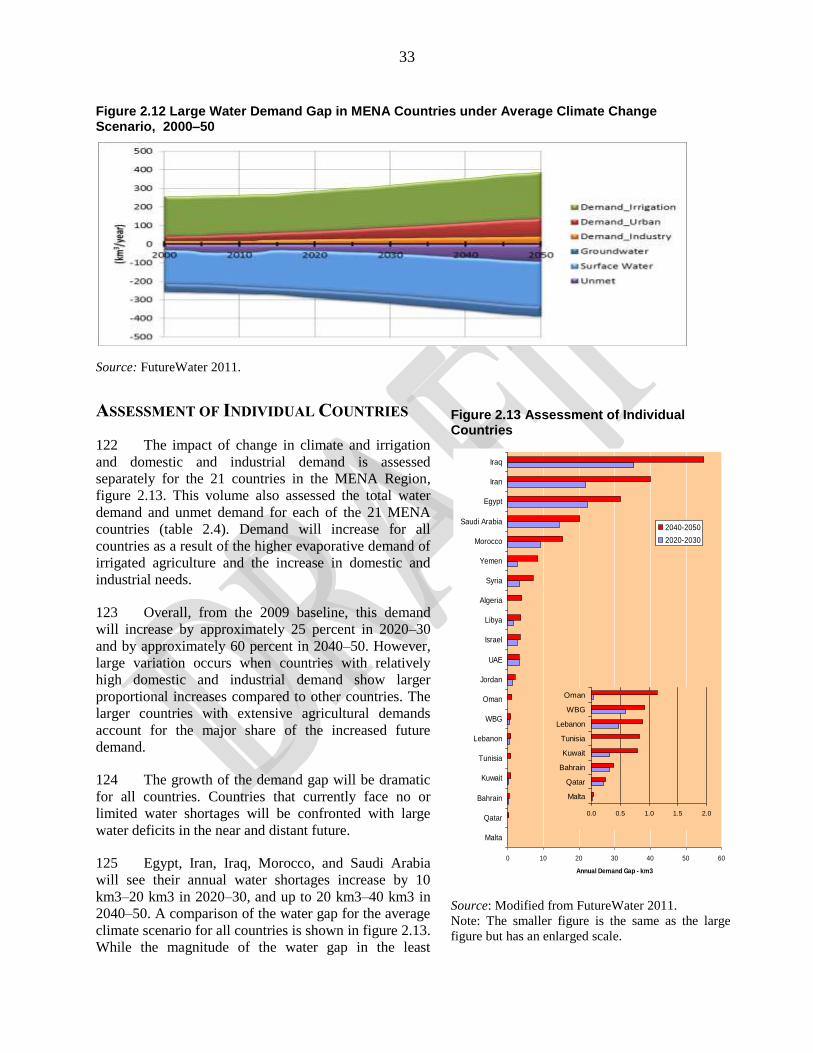
33
Figure 2.12 Large Water Demand Gap in MENA Countries under Average Climate Change Scenario, 2000–50
Source: FutureWater 2011.
ASSESSMENT OF INDIVIDUAL COUNTRIES
122 The impact of change in climate and irrigation
and domestic and industrial demand is assessed
separately for the 21 countries in the MENA Region,
figure 2.13. This volume also assessed the total water
demand and unmet demand for each of the 21 MENA
countries (table 2.4). Demand will increase for all
countries as a result of the higher evaporative demand of
irrigated agriculture and the increase in domestic and
industrial needs.
123 Overall, from the 2009 baseline, this demand
will increase by approximately 25 percent in 2020–30
and by approximately 60 percent in 2040–50. However,
large variation occurs when countries with relatively
high domestic and industrial demand show larger
proportional increases compared to other countries. The
larger countries with extensive agricultural demands
account for the major share of the increased future
demand.
124 The growth of the demand gap will be dramatic
for all countries. Countries that currently face no or
limited water shortages will be confronted with large
water deficits in the near and distant future.
125 Egypt, Iran, Iraq, Morocco, and Saudi Arabia
will see their annual water shortages increase by 10
km3–20 km3 in 2020–30, and up to 20 km3–40 km3 in
2040–50. A comparison of the water gap for the average
climate scenario for all countries is shown in figure 2.13.
While the magnitude of the water gap in the least
Figure 2.13 Assessment of Individual Countries
Source: Modified from FutureWater 2011.
Note: The smaller figure is the same as the large
figure but has an enlarged scale.
0 10 20 30 40 50 60
Malta
Qatar
Bahrain
Kuwait
Tunisia
Lebanon
WBG
Oman
Jordan
UAE
Israel
Libya
Algeria
Syria
Yemen
Morocco
Saudi Arabia
Egypt
Iran
Iraq
Annual Demand Gap - km3
2040-2050
2020-2030
0.0 0.5 1.0 1.5 2.0
Malta
Qatar
Bahrain
Kuwait
Tunisia
Lebanon
WBG
Oman
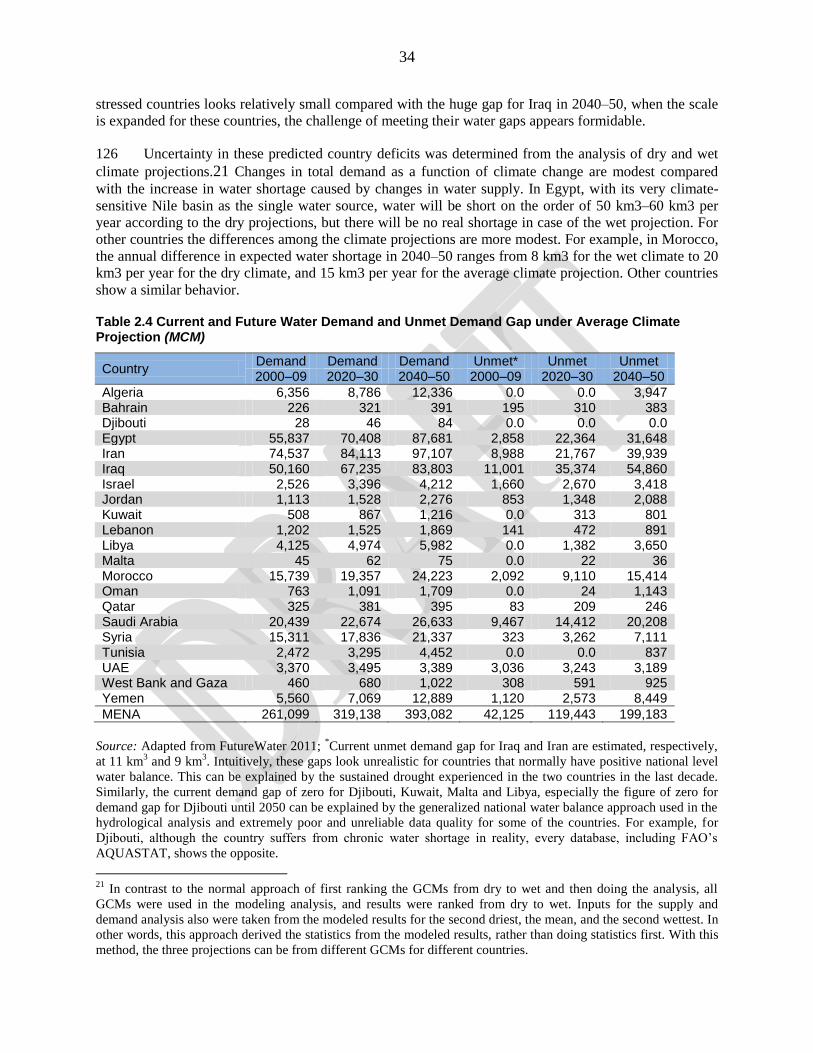
34
stressed countries looks relatively small compared with the huge gap for Iraq in 2040–50, when the scale
is expanded for these countries, the challenge of meeting their water gaps appears formidable.
126 Uncertainty in these predicted country deficits was determined from the analysis of dry and wet
climate projections.21 Changes in total demand as a function of climate change are modest compared
with the increase in water shortage caused by changes in water supply. In Egypt, with its very climate-
sensitive Nile basin as the single water source, water will be short on the order of 50 km3–60 km3 per
year according to the dry projections, but there will be no real shortage in case of the wet projection. For
other countries the differences among the climate projections are more modest. For example, in Morocco,
the annual difference in expected water shortage in 2040–50 ranges from 8 km3 for the wet climate to 20
km3 per year for the dry climate, and 15 km3 per year for the average climate projection. Other countries
show a similar behavior.
Table 2.4 Current and Future Water Demand and Unmet Demand Gap under Average Climate Projection (MCM)
Country Demand Demand Demand Unmet* Unmet Unmet 2000–09 2020–30 2040–50 2000–09 2020–30 2040–50
Algeria 6,356 8,786 12,336 0.0 0.0 3,947 Bahrain 226 321 391 195 310 383 Djibouti 28 46 84 0.0 0.0 0.0 Egypt 55,837 70,408 87,681 2,858 22,364 31,648 Iran 74,537 84,113 97,107 8,988 21,767 39,939 Iraq 50,160 67,235 83,803 11,001 35,374 54,860 Israel 2,526 3,396 4,212 1,660 2,670 3,418 Jordan 1,113 1,528 2,276 853 1,348 2,088 Kuwait 508 867 1,216 0.0 313 801 Lebanon 1,202 1,525 1,869 141 472 891 Libya 4,125 4,974 5,982 0.0 1,382 3,650 Malta 45 62 75 0.0 22 36 Morocco 15,739 19,357 24,223 2,092 9,110 15,414 Oman 763 1,091 1,709 0.0 24 1,143 Qatar 325 381 395 83 209 246 Saudi Arabia 20,439 22,674 26,633 9,467 14,412 20,208 Syria 15,311 17,836 21,337 323 3,262 7,111 Tunisia 2,472 3,295 4,452 0.0 0.0 837 UAE 3,370 3,495 3,389 3,036 3,243 3,189 West Bank and Gaza 460 680 1,022 308 591 925 Yemen 5,560 7,069 12,889 1,120 2,573 8,449
MENA 261,099 319,138 393,082 42,125 119,443 199,183
Source: Adapted from FutureWater 2011; *Current unmet demand gap for Iraq and Iran are estimated, respectively,
at 11 km3 and 9 km
3. Intuitively, these gaps look unrealistic for countries that normally have positive national level
water balance. This can be explained by the sustained drought experienced in the two countries in the last decade.
Similarly, the current demand gap of zero for Djibouti, Kuwait, Malta and Libya, especially the figure of zero for
demand gap for Djibouti until 2050 can be explained by the generalized national water balance approach used in the
hydrological analysis and extremely poor and unreliable data quality for some of the countries. For example, for
Djibouti, although the country suffers from chronic water shortage in reality, every database, including FAO‘s
AQUASTAT, shows the opposite.
21
In contrast to the normal approach of first ranking the GCMs from dry to wet and then doing the analysis, all
GCMs were used in the modeling analysis, and results were ranked from dry to wet. Inputs for the supply and
demand analysis also were taken from the modeled results for the second driest, the mean, and the second wettest. In
other words, this approach derived the statistics from the modeled results, rather than doing statistics first. With this
method, the three projections can be from different GCMs for different countries.

35
127 The only alternative options to close the growing water demand gap are better management of
available water and finding new sources of supply. The next chapter discusses options for demand
management. Desalination of seawater and brackish water, increased reservoir capacity, and reuse of
wastewater, among others, constitute supply-side management options. The following chapter also
discusses the potential of these resources in the MENA Region.
36
3. THE IMPERATIVE FOR DEMAND AND SUPPLY
MANAGEMENT
Overview
128 Despite the ever-increasing water scarcity, most water in MENA continues to be used to grow
low-value crops in response to countries‘ concerns about food security. Irrigated agriculture accounts for
approximately 81 percent of Regional water use. Despite the predominance of modern irrigation systems,
only 50 percent–60 percent of this water use is efficient. Municipal and industrial water supplies similarly
are used inefficiently. In some cities, losses from these supplies reach 30 percent–50 percent, compared
to a global best practice benchmark of approximately 10 percent. Excess demand in all water-using
sectors is stoked by pervasive and perverse subsidies. In addition, varying levels of transparency and
governance give water agencies and utilities few incentives to improve service standards and promote
water conservation. Given the high cost of new water supplies, adding new and more expensive water to
such inefficient systems and uses clearly is not economically rational. As water supplies become more
limited, there also is the question of water use allocation choices. On the hottest days, irrigation of 1,000
hectares (ha) in MENA consumes the equivalent of the water consumption in a city of 2 million
people!22 Thus, demand management should be the first line of action in any water resources
management action plan.
129 Yet, due to its absolute water scarcity, demand management alone will not solve the water
scarcity in MENA. Even after all demand management options have been fully implemented, there still
will be gaps that need to be filled with supply augmentation options. Therefore, supply augmentation
should be part of the solution. However, supply management options are limited.
IMPROVING INSTITUTIONS
130 In most MENA countries, water policy, whether explicit or implicit, has undergone three phases
(World Bank 2007). The first phase evolved over millennia. As societies grew, they adapted to the
variability and scarcity of water. They developed elaborate water institutions and complex structures that
helped the Region spawn some of the world‘s oldest and most accomplished civilizations.
131 The second phase emerged in the twentieth century. As their populations and economies grew,
governments focused increasingly on securing water supply and expanding services. The public sector
took the lead in managing huge investment programs. To capture available fresh water, the Region‘s
rivers are the most heavily dammed in the world; water supply and sanitation services are relatively
widespread; and irrigation networks are extensive. In the 1960s, when low-cost drilling technology
became available, individuals began tapping into aquifers on a scale that overwhelmed the capacity of
regulators to control the extraction. As a consequence, MENA not only is using a greater share of its
renewable water resources than any other region but also is using more water than it receives each year.
132 Initiated a couple of decades ago, the third phase is slowly introducing a series of technical and
policy changes in the Region‘s water sector to avoid the economic and social hardships that could occur
as a result of water shortages. In many MENA countries, supply options are reaching their physical and
financial limits so improved water management is needed. This necessity is forcing a transition from
focusing on augmenting supply and providing direct service to concentrating on water management and
22
Ministry of Agriculture and Hydraulic Resources 2006. Assuming ET of 10 mm/day, this is equivalent to 100,000
m3/day. However, since water use efficiency is only 50 percent, the required volume is 200,000 m3/day. If the
average domestic consumer uses 100 liters/day, this is equal to the total demand of 2 million people.
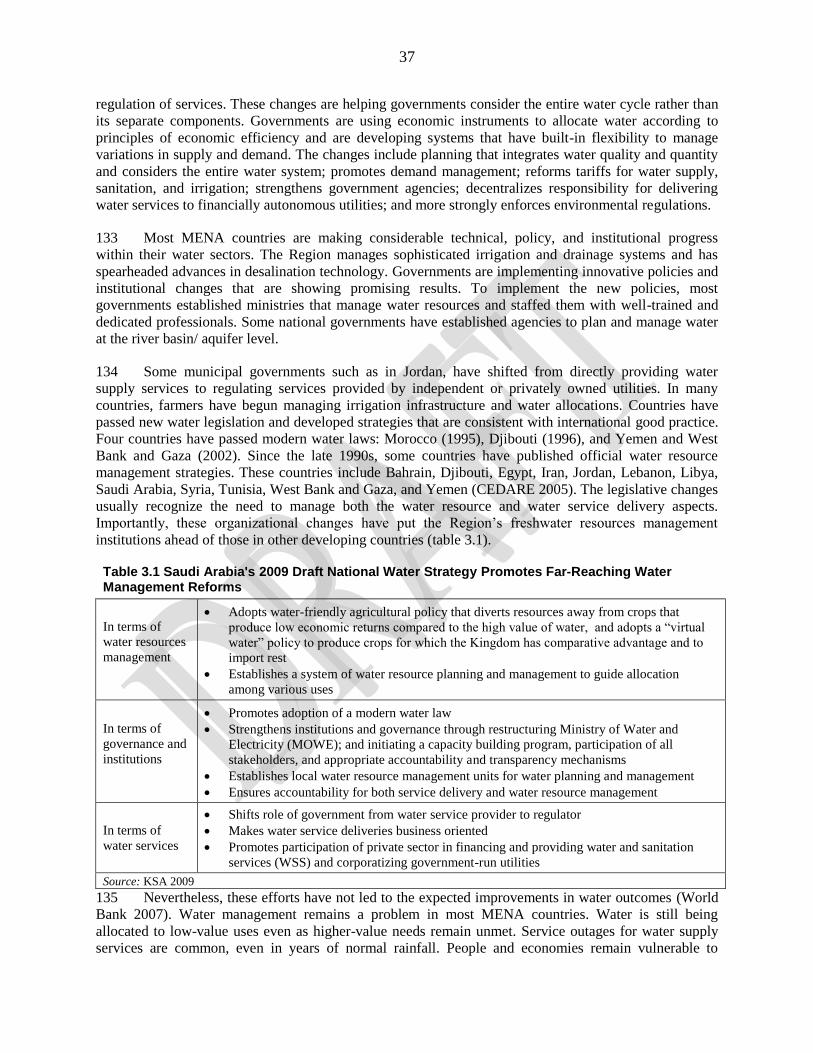
37
regulation of services. These changes are helping governments consider the entire water cycle rather than
its separate components. Governments are using economic instruments to allocate water according to
principles of economic efficiency and are developing systems that have built-in flexibility to manage
variations in supply and demand. The changes include planning that integrates water quality and quantity
and considers the entire water system; promotes demand management; reforms tariffs for water supply,
sanitation, and irrigation; strengthens government agencies; decentralizes responsibility for delivering
water services to financially autonomous utilities; and more strongly enforces environmental regulations.
133 Most MENA countries are making considerable technical, policy, and institutional progress
within their water sectors. The Region manages sophisticated irrigation and drainage systems and has
spearheaded advances in desalination technology. Governments are implementing innovative policies and
institutional changes that are showing promising results. To implement the new policies, most
governments established ministries that manage water resources and staffed them with well-trained and
dedicated professionals. Some national governments have established agencies to plan and manage water
at the river basin/ aquifer level.
134 Some municipal governments such as in Jordan, have shifted from directly providing water
supply services to regulating services provided by independent or privately owned utilities. In many
countries, farmers have begun managing irrigation infrastructure and water allocations. Countries have
passed new water legislation and developed strategies that are consistent with international good practice.
Four countries have passed modern water laws: Morocco (1995), Djibouti (1996), and Yemen and West
Bank and Gaza (2002). Since the late 1990s, some countries have published official water resource
management strategies. These countries include Bahrain, Djibouti, Egypt, Iran, Jordan, Lebanon, Libya,
Saudi Arabia, Syria, Tunisia, West Bank and Gaza, and Yemen (CEDARE 2005). The legislative changes
usually recognize the need to manage both the water resource and water service delivery aspects.
Importantly, these organizational changes have put the Region‘s freshwater resources management
institutions ahead of those in other developing countries (table 3.1).
Table 3.1 Saudi Arabia's 2009 Draft National Water Strategy Promotes Far-Reaching Water Management Reforms
In terms of
water resources
management
Adopts water-friendly agricultural policy that diverts resources away from crops that
produce low economic returns compared to the high value of water, and adopts a ―virtual
water‖ policy to produce crops for which the Kingdom has comparative advantage and to
import rest
Establishes a system of water resource planning and management to guide allocation
among various uses
In terms of
governance and
institutions
Promotes adoption of a modern water law
Strengthens institutions and governance through restructuring Ministry of Water and
Electricity (MOWE); and initiating a capacity building program, participation of all
stakeholders, and appropriate accountability and transparency mechanisms
Establishes local water resource management units for water planning and management
Ensures accountability for both service delivery and water resource management
In terms of
water services
Shifts role of government from water service provider to regulator
Makes water service deliveries business oriented
Promotes participation of private sector in financing and providing water and sanitation
services (WSS) and corporatizing government-run utilities
Source: KSA 2009
135 Nevertheless, these efforts have not led to the expected improvements in water outcomes (World
Bank 2007). Water management remains a problem in most MENA countries. Water is still being
allocated to low-value uses even as higher-value needs remain unmet. Service outages for water supply
services are common, even in years of normal rainfall. People and economies remain vulnerable to
38
droughts and floods. Despite the Region‘s huge investments in piped water supply, many countries
experience poor public health outcomes. Over-extraction of groundwater is undermining national assets at
rates equivalent to 1 percent–2 percent of GDP every year in some countries, and water-related
environmental problems costs the Region 0.5–2.5 percent of GDP every year.
136 The slow improvement rate of water outcomes in MENA persists for two reasons.
1) Changes and reform have been slow due partially to the difficulties in modifying the complex
traditional socioeconomic and political factors affecting water management. The subsidy regime
does not encourage growth of organizational capacity or innovation. Water organizations are
unable to attract and retain staff with the range of skills required for efficient service delivery.
Reliance on public budgets and on unclear accountability structures and resource and
performance management systems offer poor incentives for good outcomes. Legislation often
lacks the essential implementing rules and regulations, and enforcement tends to be weak.
Renewed attention to these institutional issues is necessary to ensure that demand and supply
management are commensurate to the challenge posed by increasing water shortages. Only
determination at the highest political levels can make such a transformation.
2) Although many of the important issues in water resources management, irrigation, and WSS are
being tackled, water allocation and use are strongly affected by agricultural, trade, and energy
policies outside the water sector. The criticality of good water management to economic
development in much of the Region requires more integrated national approaches to policies that
affect all economic activities that rely on water inputs.
137 The national fiscal impact of water development and management can be substantial.
Governments and individuals across the Region invest significant public resources in the water sector. In
the MENA countries for which data are available, governments are spending between 1.0 percent–3.6
percent of GDP on the water sector (World Bank 2007). These figures, already large, exclude the
significant private investment in well construction and maintenance and irrigation infrastructure, and
private expenditure to pay charges on water services. In recent years, water represented 20 percent–30
percent of government expenditures in Algeria, Egypt, and Yemen (World Bank 2005, 2006). These large
expenditures indicate why accountability and other governance structures are so important and why water
investments have a strong political dimension.
Demand Management
AGRICULTURAL POLICY REFORM
138 In most MENA countries, food security has been a major concern, particularly for staples, such as
wheat. Wheat comprises an exceptionally high 44 percent of the Region's total food supply.23 This desire
for food security not only has driven substantial government investment in irrigation systems but also has
led to subsidies of inputs (such as pumps, irrigation technology, and electricity) and of outputs through
price support mechanisms.
139 Given the increasing populations who depend on a fixed amount of water, in the future, trade will
become even more important for water management. Due to geopolitical tensions, rural employment, and
food security concerns, countries will aim to increase their food self-sufficiency. At present, they achieve
food security only when local production is supplemented through trade. Fortunately, most MENA
countries are geographically near enough to meet European demand for off-season fruits and vegetables.
23
CGIAR 2011
39
If they devise progressive agricultural policies, countries could grow more of the crops that are their
comparative advantage to export, while increasing imports of lower-value staples. In effect, the countries
would be ―exporting‖ high-value virtual water and ―importing‖ larger quantities of virtual water
associated with low-value commodities from countries with more abundant water supplies (Hoekstra and
Hung 2002; Chapagain and Hoekstra 2003). Thus, importing staples to substitute for home-grown low-
value crops could significantly close the water gap in MENA.
140 Saudi Arabia is one of the most striking examples of how reforming agricultural policies can
significantly reduce water demand. In the 1970s, based on using nonrenewable groundwater, KSA started
subsidizing wheat production. By the late 1980s, wheat production was high enough to make Saudi
Arabia the world‘s sixth largest exporter. Meanwhile, its crops grown using fossil water were competing
in the international market against rain-fed wheat (Wichelns 2005). In 1993 the government reduced the
area of wheat cultivation eligible for price support by 75 percent, saving an estimated 7.4 km3 of fresh
groundwater per year. Subsequently, the country‘s annual agricultural water demand continued its decline
from its peak of 23 km3 in the mid-1990s to an estimated 14 km3 in 2010. It is anticipated that, by 2014,
annual groundwater demand will drop below 10 km3. Even so, irrigated fodder production that has
similarly low returns to water, still uses 25 percent of the groundwater resources. The UAE had similar
groundwater mining problems caused by irrigated fodder crops. In 2010 UAE eliminated subsidies for
irrigated Rhodes grass (grown for animal feed). The government estimates this change will reduce its
annual agricultural water consumption by 40 percent between April and September, the hottest months of
the year.24
IMPROVING THE EFFICIENCY OF WATER ALLOCATION AND USE
141 In dry years, due to poor intersectoral allocation and low water use efficiency, some countries do
not have enough water to service export agriculture. For example, in dry years, Morocco, a country with
superior conditions for growing olives, is obliged to import olive oil because domestic production is not
of consistently good quality and because irrigation systems are not set up to provide backup irrigation for
olives. This poor management leads to dramatic drops in production during dry periods (Humpal and
Jacques 2003). Thus, improving unreliable water supply through improved scheduling, management, and
technology would make better use of sunk investments, which then could be used more productively.
142 Currently, MENA‘s average agricultural water use efficiency languishes at 50 percent–60
percent. Pursued vigorously, improved scheduling, management, and technology could increase its
efficiency to the level of the best managed areas of arid Australia and the US that have water use
efficiencies higher than 80 percent.
143 Introduction of high-technology irrigation will save more water if it is accompanied by measures
to develop protected greenhouse agriculture and agricultural extension. When all three are applied, the
potential increase in water productivity (―income-per-drop of water‖) can be large (figure 3.1). Increased
water productivity also is likely to increase farmers‘ profits using less water––a win-win outcome.
24
The National 2010.
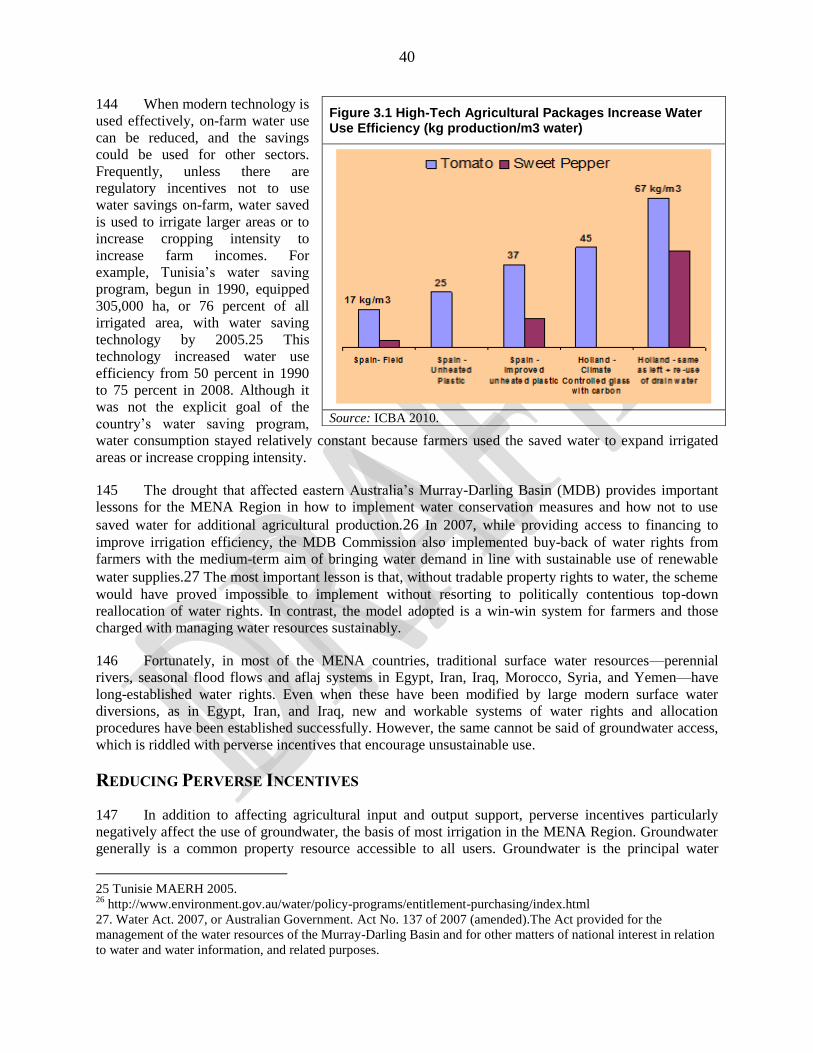
40
144 When modern technology is
used effectively, on-farm water use
can be reduced, and the savings
could be used for other sectors.
Frequently, unless there are
regulatory incentives not to use
water savings on-farm, water saved
is used to irrigate larger areas or to
increase cropping intensity to
increase farm incomes. For
example, Tunisia‘s water saving
program, begun in 1990, equipped
305,000 ha, or 76 percent of all
irrigated area, with water saving
technology by 2005.25 This
technology increased water use
efficiency from 50 percent in 1990
to 75 percent in 2008. Although it
was not the explicit goal of the
country‘s water saving program,
water consumption stayed relatively constant because farmers used the saved water to expand irrigated
areas or increase cropping intensity.
145 The drought that affected eastern Australia‘s Murray-Darling Basin (MDB) provides important
lessons for the MENA Region in how to implement water conservation measures and how not to use
saved water for additional agricultural production.26 In 2007, while providing access to financing to
improve irrigation efficiency, the MDB Commission also implemented buy-back of water rights from
farmers with the medium-term aim of bringing water demand in line with sustainable use of renewable
water supplies.27 The most important lesson is that, without tradable property rights to water, the scheme
would have proved impossible to implement without resorting to politically contentious top-down
reallocation of water rights. In contrast, the model adopted is a win-win system for farmers and those
charged with managing water resources sustainably.
146 Fortunately, in most of the MENA countries, traditional surface water resources––perennial
rivers, seasonal flood flows and aflaj systems in Egypt, Iran, Iraq, Morocco, Syria, and Yemen––have
long-established water rights. Even when these have been modified by large modern surface water
diversions, as in Egypt, Iran, and Iraq, new and workable systems of water rights and allocation
procedures have been established successfully. However, the same cannot be said of groundwater access,
which is riddled with perverse incentives that encourage unsustainable use.
REDUCING PERVERSE INCENTIVES
147 In addition to affecting agricultural input and output support, perverse incentives particularly
negatively affect the use of groundwater, the basis of most irrigation in the MENA Region. Groundwater
generally is a common property resource accessible to all users. Groundwater is the principal water
25 Tunisie MAERH 2005. 26
http://www.environment.gov.au/water/policy-programs/entitlement-purchasing/index.html
27. Water Act. 2007, or Australian Government. Act No. 137 of 2007 (amended).The Act provided for the
management of the water resources of the Murray-Darling Basin and for other matters of national interest in relation
to water and water information, and related purposes.
Figure 3.1 High-Tech Agricultural Packages Increase Water Use Efficiency (kg production/m3 water)
Source: ICBA 2010.
41
resource for Bahrain, Jordan, Kuwait, Libya, Oman, Qatar, Saudi Arabia, the United Arab Emirates, West
Bank and Gaza, and Yemen. However, the demand management challenges differ between countries with
relatively high per capita incomes (the Gulf countries, Israel, and Libya) and those with lower incomes
(Jordan, West Bank and Gaza, and Yemen). The former group can afford alternative sources of water,
such as desalination, a technology usually too expensive for the latter group. The particular challenge for
the lower income countries is managing groundwater extraction to avoid exhausting the resource and
managing agricultural trade. As with crude oil and gas, extracting nonrenewable groundwater involves
trade-offs between current and future use of the limited resource.
148 Almost all groundwater production for agriculture is private. Moreover, until recently, most of the
initial capital investment in agricultural wells and pumping equipment was heavily subsidized by the
Region‘s governments. As noted above, groundwater generally is free and accessible to the public, but
users must bear the production cost. Even then, most agricultural users receive highly subsidized
electricity (or, in the case of Yemen, diesel fuel) to produce it. Thus, operating costs tend to be very low.
In addition, most electricity tariffs tend to be flat rate. Consequently, the global experience has been a
―race to the bottom‖ as users compete to use the resource before others can. Even worse, as the resource
becomes more heavily exploited, groundwater levels fall, and only those farmers able to afford the larger
pumps remain in business. As a result, groundwater in the MENA Region is severely over exploited, and
many smaller farmers have been marginalized. If electricity were priced at the levels equivalent to cost
and thereafter by an increasing block tariff, these measures would constrain somewhat the volumes
pumped.
149 Nevertheless, even with realistic energy pricing, the cost of groundwater production does not
represent its actual value to society. Fresh groundwater is a finite resource that is being mined, and it is
irreplaceable once gone. When farmers run out of fresh or moderately brackish groundwater, they
typically have two choices: stop using water, or using an alternative resource. The only viable alternative
source of water is desalinated water. Generally, switching to desalinated water means hooking up a small
reverse osmosis (RO) plant to a well that produces salty water or tapping a desalinated water supply from
one of the commercial producers. Thus at the margin, desalinated water is the alternative to fresh
groundwater. In other words, in economic terms, the opportunity cost of groundwater is the same as its
substitute, desalinated water. Consequently, the marginal cost of fresh or moderately brackish
groundwater is US1.5–US$2.1 per cubic meter (more on this in chapter 4) depending on the location in
MENA and the desalination technology adopted.
150 Groundwater priced near these levels would provide a strong incentive to use fresh water
efficiently and use it only on high-value crops. Recent studies show that carefully thought-out pricing
policies can yield substantial social benefits.28 In Hawaii, for example, when the choice was between
groundwater and desalination, raising the price of groundwater induced conservation such that the
desalination alternative will not be needed for 90 years.29 Without higher pricing, it would be needed in
60 years.
151 In MENA, however, in practice, groundwater pricing has proved extremely difficult to implement
due to the political difficulty of giving individual ownership or water rights to individuals and allowing
these rights to become tradable. This task is made even more difficult by the generally poor ability to
quantify groundwater resources and sustainable levels of use. The scale of individual actions to tap into
groundwater also often overwhelms the ability of governments to control them, even with such
approaches as licensing new wells. Yemen is a particularly egregious example. The result is that, across
the Region, aquifers are being used beyond sustainable levels. Experience in MENA suggests that, in
28
Brown and Rogers 2010. 29
Pitafi and Roumasse 2004.
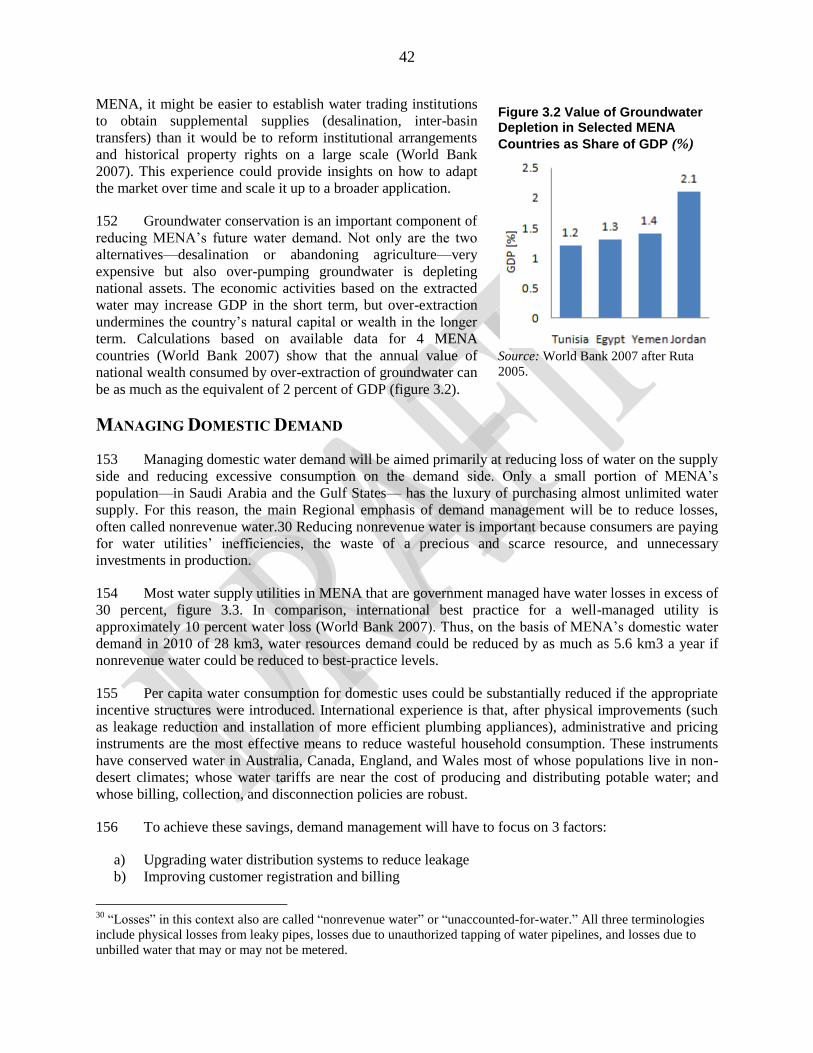
42
MENA, it might be easier to establish water trading institutions
to obtain supplemental supplies (desalination, inter-basin
transfers) than it would be to reform institutional arrangements
and historical property rights on a large scale (World Bank
2007). This experience could provide insights on how to adapt
the market over time and scale it up to a broader application.
152 Groundwater conservation is an important component of
reducing MENA‘s future water demand. Not only are the two
alternatives––desalination or abandoning agriculture––very
expensive but also over-pumping groundwater is depleting
national assets. The economic activities based on the extracted
water may increase GDP in the short term, but over-extraction
undermines the country‘s natural capital or wealth in the longer
term. Calculations based on available data for 4 MENA
countries (World Bank 2007) show that the annual value of
national wealth consumed by over-extraction of groundwater can
be as much as the equivalent of 2 percent of GDP (figure 3.2).
MANAGING DOMESTIC DEMAND
153 Managing domestic water demand will be aimed primarily at reducing loss of water on the supply
side and reducing excessive consumption on the demand side. Only a small portion of MENA‘s
population––in Saudi Arabia and the Gulf States–– has the luxury of purchasing almost unlimited water
supply. For this reason, the main Regional emphasis of demand management will be to reduce losses,
often called nonrevenue water.30 Reducing nonrevenue water is important because consumers are paying
for water utilities‘ inefficiencies, the waste of a precious and scarce resource, and unnecessary
investments in production.
154 Most water supply utilities in MENA that are government managed have water losses in excess of
30 percent, figure 3.3. In comparison, international best practice for a well-managed utility is
approximately 10 percent water loss (World Bank 2007). Thus, on the basis of MENA‘s domestic water
demand in 2010 of 28 km3, water resources demand could be reduced by as much as 5.6 km3 a year if
nonrevenue water could be reduced to best-practice levels.
155 Per capita water consumption for domestic uses could be substantially reduced if the appropriate
incentive structures were introduced. International experience is that, after physical improvements (such
as leakage reduction and installation of more efficient plumbing appliances), administrative and pricing
instruments are the most effective means to reduce wasteful household consumption. These instruments
have conserved water in Australia, Canada, England, and Wales most of whose populations live in non-
desert climates; whose water tariffs are near the cost of producing and distributing potable water; and
whose billing, collection, and disconnection policies are robust.
156 To achieve these savings, demand management will have to focus on 3 factors:
a) Upgrading water distribution systems to reduce leakage
b) Improving customer registration and billing
30
―Losses‖ in this context also are called ―nonrevenue water‖ or ―unaccounted-for-water.‖ All three terminologies
include physical losses from leaky pipes, losses due to unauthorized tapping of water pipelines, and losses due to
unbilled water that may or may not be metered.
Figure 3.2 Value of Groundwater Depletion in Selected MENA
Countries as Share of GDP (%)
Source: World Bank 2007 after Ruta
2005.
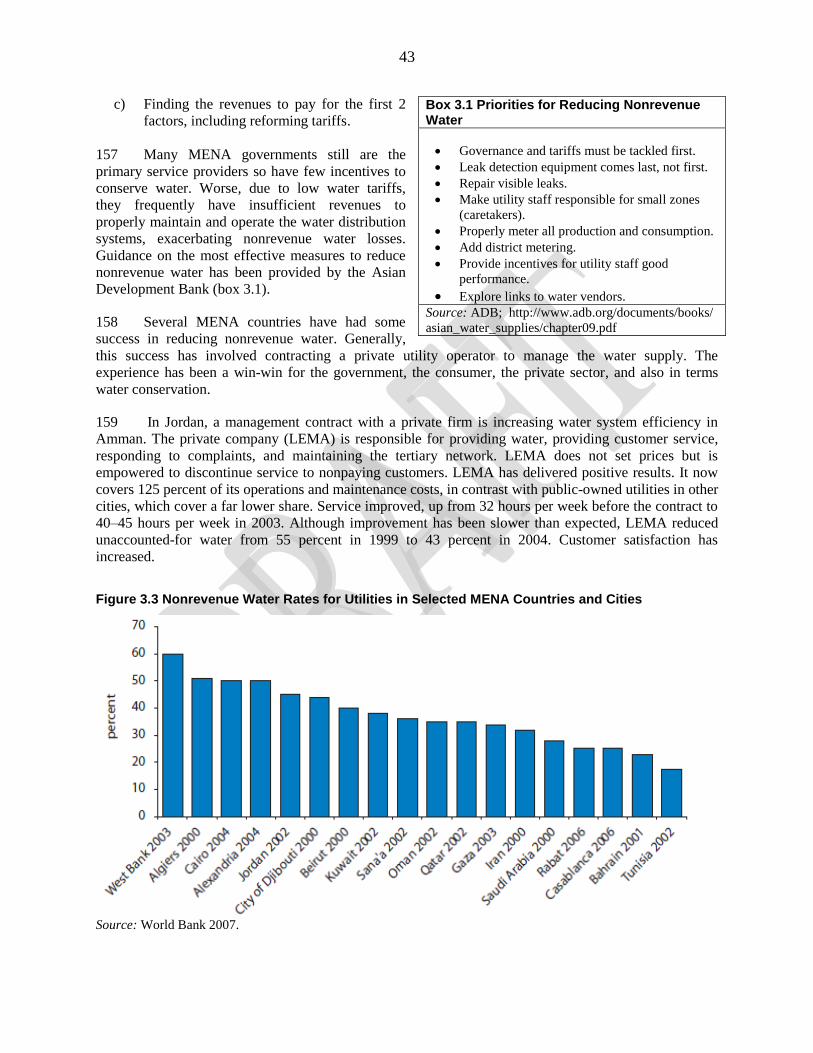
43
c) Finding the revenues to pay for the first 2
factors, including reforming tariffs.
157 Many MENA governments still are the
primary service providers so have few incentives to
conserve water. Worse, due to low water tariffs,
they frequently have insufficient revenues to
properly maintain and operate the water distribution
systems, exacerbating nonrevenue water losses.
Guidance on the most effective measures to reduce
nonrevenue water has been provided by the Asian
Development Bank (box 3.1).
158 Several MENA countries have had some
success in reducing nonrevenue water. Generally,
this success has involved contracting a private utility operator to manage the water supply. The
experience has been a win-win for the government, the consumer, the private sector, and also in terms
water conservation.
159 In Jordan, a management contract with a private firm is increasing water system efficiency in
Amman. The private company (LEMA) is responsible for providing water, providing customer service,
responding to complaints, and maintaining the tertiary network. LEMA does not set prices but is
empowered to discontinue service to nonpaying customers. LEMA has delivered positive results. It now
covers 125 percent of its operations and maintenance costs, in contrast with public-owned utilities in other
cities, which cover a far lower share. Service improved, up from 32 hours per week before the contract to
40–45 hours per week in 2003. Although improvement has been slower than expected, LEMA reduced
unaccounted-for water from 55 percent in 1999 to 43 percent in 2004. Customer satisfaction has
increased.
Box 3.1 Priorities for Reducing Nonrevenue Water
Governance and tariffs must be tackled first.
Leak detection equipment comes last, not first.
Repair visible leaks.
Make utility staff responsible for small zones
(caretakers).
Properly meter all production and consumption.
Add district metering.
Provide incentives for utility staff good
performance.
Explore links to water vendors. Source: ADB; http://www.adb.org/documents/books/
asian_water_supplies/chapter09.pdf
Figure 3.3 Nonrevenue Water Rates for Utilities in Selected MENA Countries and Cities
Source: World Bank 2007.
44
160 In Morocco, concession of water supply and sanitation services to the private sector in four large
cities has provided incentives for improved performance (Bouhamidi 2005).The government regulates the
concessions through the Delegating Authority, which determines tariff caps, service standards, priority
projects, and investment obligations. The contracts stipulate investments of almost US$4 billion over 30
years. Rules and guidelines for adjusting tariffs are flexible. In Rabat, Tangiers, and Tetouan, a price cap
requires that any tariff increase of more than 3 percent be made in agreement with the municipal
government. The government also retains the ability to make unilateral changes to tariffs for ―reasons of
public interest‖ so long as the government compensates the private operators for any losses. These rules
on tariff adjustment, coupled with the fact that the contracts enable private operators to keep a large share
of their profits, provide incentives for the private operators to control costs and improve efficiency, to the
benefit of the customers. The investments as well as operational improvements have improved service.
Water is now available 24 hours a day in these 4 cities, and water supply connections have increased by
almost 33 percent since the concession began. Between 1997 and 2001, private investments in sanitation
alone amounted to €97 million (US$94 million).31
Since 1997, a combination of tariffs that increased 3-
fold, introduction of a sanitation charge, and reduced leakage has reduced demand by approximately 3
percent per year. As a result, demand projections are lower than previously estimated, reducing the need
for dam construction and saving the government some US$450 million in new investment.
Supply Management Options Are Limited
161 Rainwater harvesting and check dams in wadis generally are very small scale and very local in
application.32
Typically, they provide drinking water and groundwater recharge to single households or
small communities. From a Regional perspective, these two sources can only slightly augment supply,
except in rural areas.
162 Dams to impound larger volumes of water have limited potential in the MENA Region. Rivers in
MENA Region are the most heavily dammed in the world in relation to the freshwater available, and
therefore only limited potential exists to further increase water availability through construction of new
dams. More than 80 percent of the Region‘s surface freshwater resources are stored behind reservoirs
(World Bank, 2007). Some potential however exists, particularly in the more humid parts of the Region
such as northwestern Iran and the Atlas Mountains in Morocco and Algeria. Elsewhere in the more arid
countries of MENA, the highly uncertain rainfall amounts and frequency frustrates reliance on reservoirs
for assured supplies, a situation made worse by the likelihood of lower precipitation in the future.
163 Wastewater reuse, including irrigation water reuse, desalination of brackish groundwater and
seawater hold significant potential to bridge water demand gap in MENA. Some countries in MENA have
significantly large brackish groundwater reserves. They could be used to support salt-tolerant agriculture
and/or be a source of desalinated water. Recycled wastewater is an assured resource and the only one that
is guaranteed to increase in response to population growth. Finally, desalinated seawater (or brackish
water) is available near most of MENA‘s population centers. The constraints are its relatively high cost
and dependence on high energy inputs. The following sections briefly discuss potential groundwater
supplies and the opportunities for utilizing recycled water. Due to the relatively complex technological
and energy considerations, desalination is discussed in more detail in chapter 4.
31
Based on average 1997–2001 exchange rate 32
A wadi is a dry valley, gully, or streambed. During the rainy season, the same name is given to the stream that
runs through the wadi.
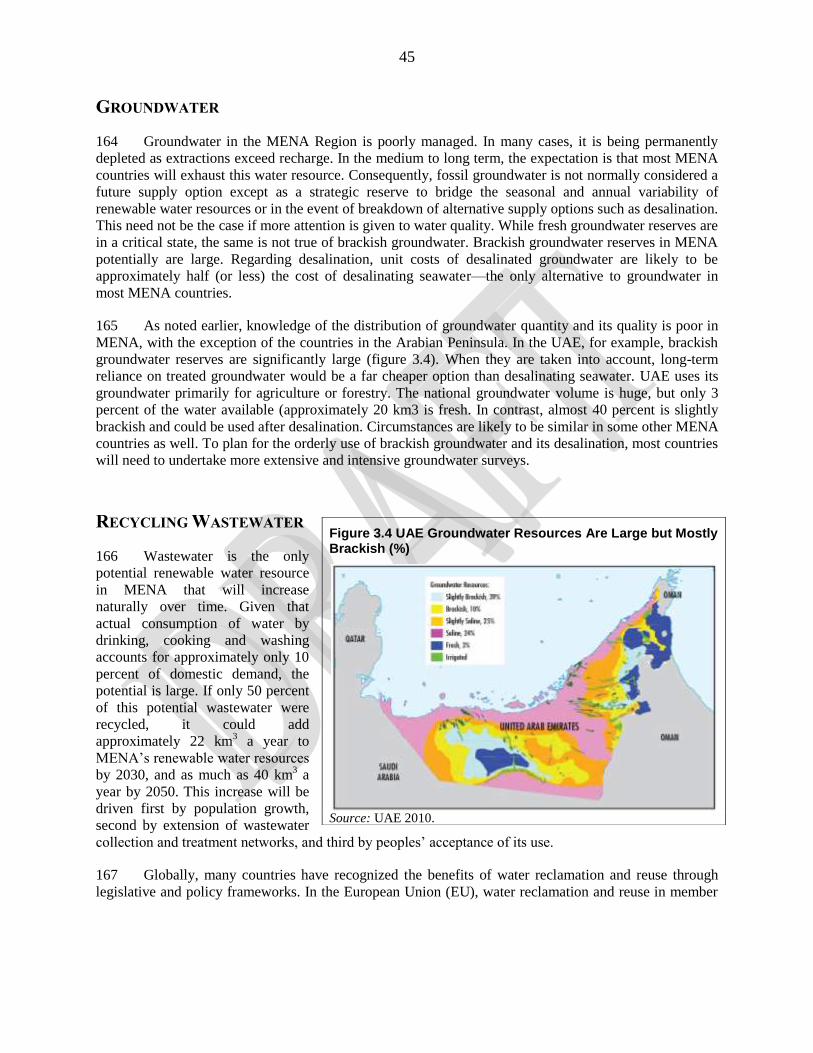
45
GROUNDWATER
164 Groundwater in the MENA Region is poorly managed. In many cases, it is being permanently
depleted as extractions exceed recharge. In the medium to long term, the expectation is that most MENA
countries will exhaust this water resource. Consequently, fossil groundwater is not normally considered a
future supply option except as a strategic reserve to bridge the seasonal and annual variability of
renewable water resources or in the event of breakdown of alternative supply options such as desalination.
This need not be the case if more attention is given to water quality. While fresh groundwater reserves are
in a critical state, the same is not true of brackish groundwater. Brackish groundwater reserves in MENA
potentially are large. Regarding desalination, unit costs of desalinated groundwater are likely to be
approximately half (or less) the cost of desalinating seawater––the only alternative to groundwater in
most MENA countries.
165 As noted earlier, knowledge of the distribution of groundwater quantity and its quality is poor in
MENA, with the exception of the countries in the Arabian Peninsula. In the UAE, for example, brackish
groundwater reserves are significantly large (figure 3.4). When they are taken into account, long-term
reliance on treated groundwater would be a far cheaper option than desalinating seawater. UAE uses its
groundwater primarily for agriculture or forestry. The national groundwater volume is huge, but only 3
percent of the water available (approximately 20 km3 is fresh. In contrast, almost 40 percent is slightly
brackish and could be used after desalination. Circumstances are likely to be similar in some other MENA
countries as well. To plan for the orderly use of brackish groundwater and its desalination, most countries
will need to undertake more extensive and intensive groundwater surveys.
RECYCLING WASTEWATER
166 Wastewater is the only
potential renewable water resource
in MENA that will increase
naturally over time. Given that
actual consumption of water by
drinking, cooking and washing
accounts for approximately only 10
percent of domestic demand, the
potential is large. If only 50 percent
of this potential wastewater were
recycled, it could add
approximately 22 km3 a year to
MENA‘s renewable water resources
by 2030, and as much as 40 km3 a
year by 2050. This increase will be
driven first by population growth,
second by extension of wastewater
collection and treatment networks, and third by peoples‘ acceptance of its use.
167 Globally, many countries have recognized the benefits of water reclamation and reuse through
legislative and policy frameworks. In the European Union (EU), water reclamation and reuse in member
Figure 3.4 UAE Groundwater Resources Are Large but Mostly Brackish (%)
Source: UAE 2010.
46
countries are guided by the EU Water Framework Directive, which was passed in 2000.33 In 2006 the
World Health Organization (WHO) updated its global guidelines for the use of wastewater in agriculture.
168 Most of the significant developments in water reclamation and reuse have occurred in the arid
regions of the world, including Australia and the Mediterranean region as well as the western and
southwestern United States. In the Mediterranean region, Greece, Spain, and the southern provinces of
France and Italy have been the vanguards of water reclamation and reuse. Portugal and Tunisia also have
well-established agricultural and landscape irrigation programs that use reclaimed water. However, in
MENA, only a few countries––Israel, Jordan, Oman, UAE, and Tunisia among them––have explicitly
included water reuse in their water resources planning and have official policies calling for water reuse.
169 The majority of global water reuse is for non-potable applications, such as agricultural and
landscape irrigation and industrial recycling and reuse. Indeed, reclaimed water long has been recognized
as a valuable resource for use in irrigation (UNDP and others 1992). It is applied through different
irrigation systems depending on, among other conditions, the crop to be irrigated. Kuwait and Tunisia
provide good examples of current practice (box 3.2).
Box 3.2 Recycled Water Is a Valuable Resource: Examples from Kuwait and Tunisia
Kuwait
For the past few decades, Kuwait has practiced water reclamation and reuse to extend its limited natural water
supply. During 2000–10, the country‘s annual quantity of wastewater produced ranged from 206 Mm3–254 Mm
3.
The Ministry of Public Works established strict effluent quality standards for water reuse. Irrigation of food crops
eaten raw requires tertiary treatment, with strict water quality limits. Most reclaimed water is used for agricultural
irrigation. Some of this water is used to grow vegetables in soil-less aquaponic growing systems in greenhouses. In
1997 reclaimed water irrigated 4,470 ha of agricultural land, or 25 percent of Kuwait‘s total irrigated area.
Reclaimed water irrigates 1,680 ha of afforestation projects in the country, and the plans are to expand this to 3,300
ha. In urban areas, the use of reclaimed water for landscape irrigation is growing, particularly for trees and the
development of green areas. A small amount goes to recharge groundwater via surface percolation basins. Some
industrial wastewater also is recycled after treatment.
Tunisia
Tunisia has long experience (since 1965) in using treated wastewater to irrigate the citrus orchards and olive trees
of the Soukra irrigation scheme (8 km North East of Tunis) covering an area of 600 hectares (Bahri, 2008a). In
2008, the number of wastewater treatment plants operating in Tunisia were 61, collecting 240 MCM of wastewater,
of which less than 30 percent is reused to irrigate vineyards, citrus, trees (olives, peaches, pears, apples,
pomegranates), fodder crops (alfalfa, sorghum), industrial crops (cotton, tobacco), cereals, and golf courses in
Tunis, Hammamet, Sousse, and Monastir. The wastewater effluent is treated to secondary levels and farmers pay
subsidized prices for the treated wastewater they use to irrigate their fields (Bahri, 2008a).
RECYCLED WATER: LESSONS LEARNED
170 Building public acceptance is essential. The success of water reuse depends in part on public
approval. International experience suggests that the public often accepts the use of reclaimed water to
irrigate recreational areas or to recharge groundwater. However, reuse in agriculture tends to raise
concerns. There also are strong views about which type of organization is better able to manage treated
33
Nine years earlier, the European Communities Commission Directive (91/271/EEC) had specified that ―treated
wastewater shall be reused whenever appropriate‖ and that ―disposal routes shall minimize the adverse effects on the
environment‖ (European Economic Community 1991).
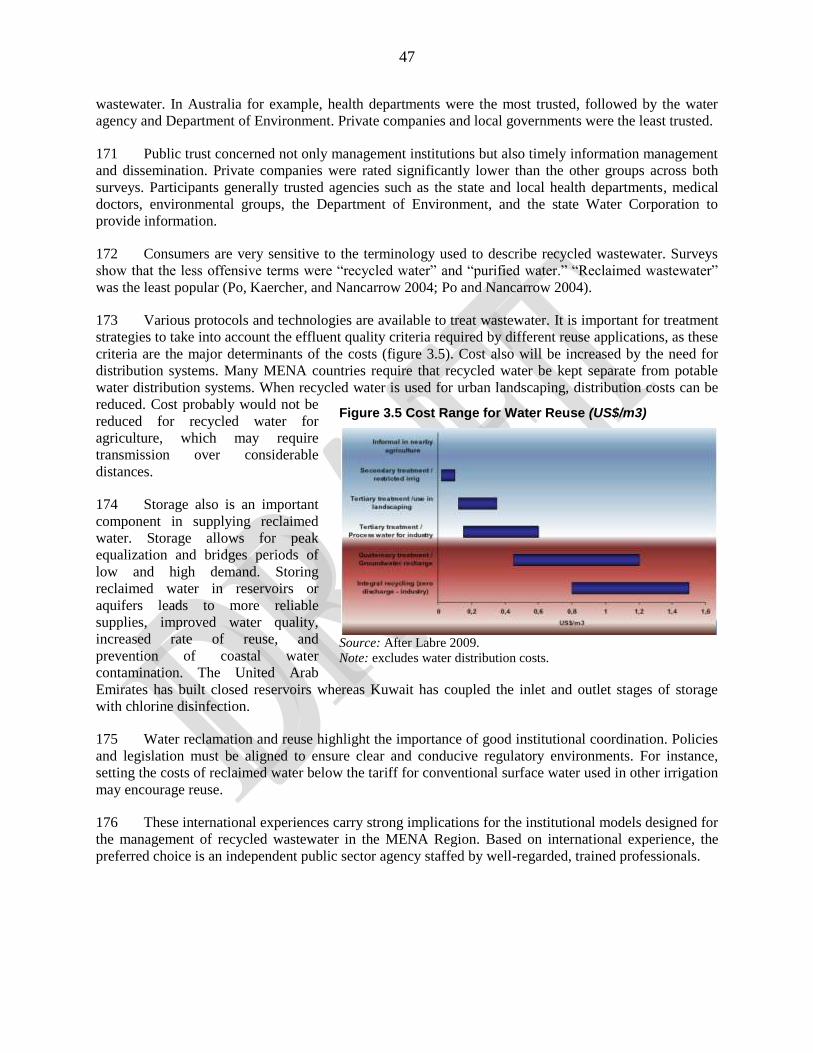
47
wastewater. In Australia for example, health departments were the most trusted, followed by the water
agency and Department of Environment. Private companies and local governments were the least trusted.
171 Public trust concerned not only management institutions but also timely information management
and dissemination. Private companies were rated significantly lower than the other groups across both
surveys. Participants generally trusted agencies such as the state and local health departments, medical
doctors, environmental groups, the Department of Environment, and the state Water Corporation to
provide information.
172 Consumers are very sensitive to the terminology used to describe recycled wastewater. Surveys
show that the less offensive terms were ―recycled water‖ and ―purified water.‖ ―Reclaimed wastewater‖
was the least popular (Po, Kaercher, and Nancarrow 2004; Po and Nancarrow 2004).
173 Various protocols and technologies are available to treat wastewater. It is important for treatment
strategies to take into account the effluent quality criteria required by different reuse applications, as these
criteria are the major determinants of the costs (figure 3.5). Cost also will be increased by the need for
distribution systems. Many MENA countries require that recycled water be kept separate from potable
water distribution systems. When recycled water is used for urban landscaping, distribution costs can be
reduced. Cost probably would not be
reduced for recycled water for
agriculture, which may require
transmission over considerable
distances.
174 Storage also is an important
component in supplying reclaimed
water. Storage allows for peak
equalization and bridges periods of
low and high demand. Storing
reclaimed water in reservoirs or
aquifers leads to more reliable
supplies, improved water quality,
increased rate of reuse, and
prevention of coastal water
contamination. The United Arab
Emirates has built closed reservoirs whereas Kuwait has coupled the inlet and outlet stages of storage
with chlorine disinfection.
175 Water reclamation and reuse highlight the importance of good institutional coordination. Policies
and legislation must be aligned to ensure clear and conducive regulatory environments. For instance,
setting the costs of reclaimed water below the tariff for conventional surface water used in other irrigation
may encourage reuse.
176 These international experiences carry strong implications for the institutional models designed for
the management of recycled wastewater in the MENA Region. Based on international experience, the
preferred choice is an independent public sector agency staffed by well-regarded, trained professionals.
Figure 3.5 Cost Range for Water Reuse (US$/m3)
Source: After Labre 2009.
Note: excludes water distribution costs.
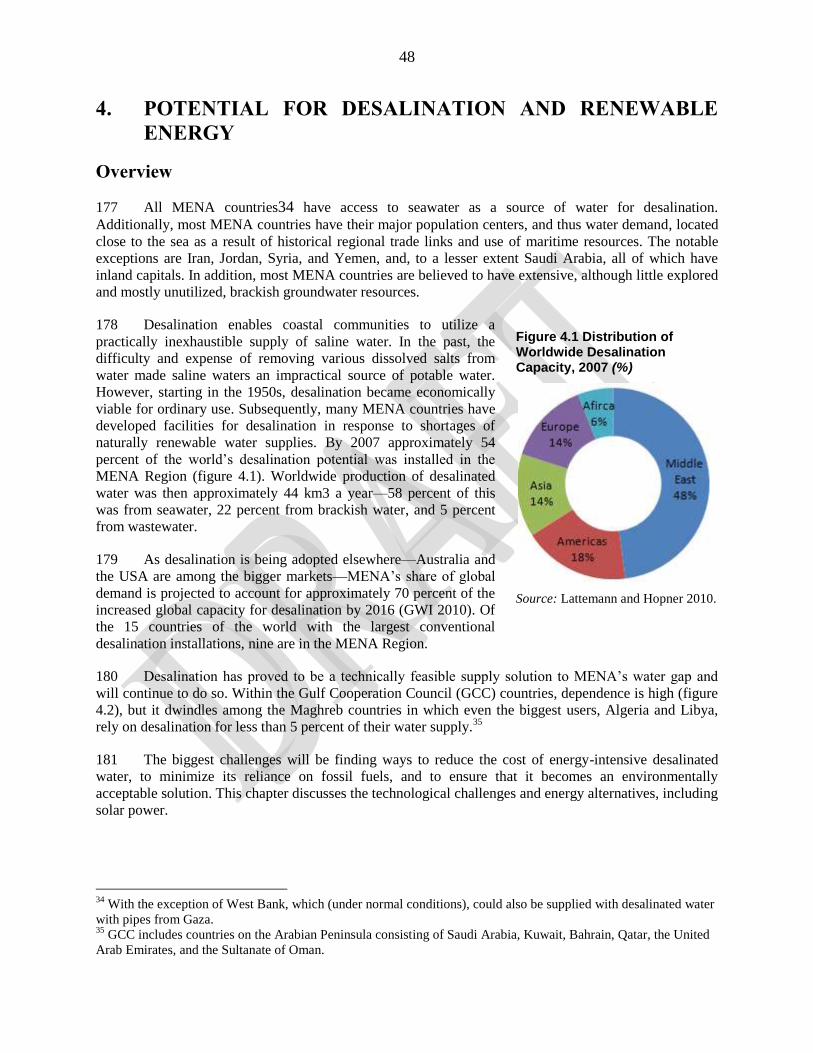
48
4. POTENTIAL FOR DESALINATION AND RENEWABLE
ENERGY
Overview
177 All MENA countries34 have access to seawater as a source of water for desalination.
Additionally, most MENA countries have their major population centers, and thus water demand, located
close to the sea as a result of historical regional trade links and use of maritime resources. The notable
exceptions are Iran, Jordan, Syria, and Yemen, and, to a lesser extent Saudi Arabia, all of which have
inland capitals. In addition, most MENA countries are believed to have extensive, although little explored
and mostly unutilized, brackish groundwater resources.
178 Desalination enables coastal communities to utilize a
practically inexhaustible supply of saline water. In the past, the
difficulty and expense of removing various dissolved salts from
water made saline waters an impractical source of potable water.
However, starting in the 1950s, desalination became economically
viable for ordinary use. Subsequently, many MENA countries have
developed facilities for desalination in response to shortages of
naturally renewable water supplies. By 2007 approximately 54
percent of the world‘s desalination potential was installed in the
MENA Region (figure 4.1). Worldwide production of desalinated
water was then approximately 44 km3 a year––58 percent of this
was from seawater, 22 percent from brackish water, and 5 percent
from wastewater.
179 As desalination is being adopted elsewhere––Australia and
the USA are among the bigger markets––MENA‘s share of global
demand is projected to account for approximately 70 percent of the
increased global capacity for desalination by 2016 (GWI 2010). Of
the 15 countries of the world with the largest conventional
desalination installations, nine are in the MENA Region.
180 Desalination has proved to be a technically feasible supply solution to MENA‘s water gap and
will continue to do so. Within the Gulf Cooperation Council (GCC) countries, dependence is high (figure
4.2), but it dwindles among the Maghreb countries in which even the biggest users, Algeria and Libya,
rely on desalination for less than 5 percent of their water supply.35
181 The biggest challenges will be finding ways to reduce the cost of energy-intensive desalinated
water, to minimize its reliance on fossil fuels, and to ensure that it becomes an environmentally
acceptable solution. This chapter discusses the technological challenges and energy alternatives, including
solar power.
34
With the exception of West Bank, which (under normal conditions), could also be supplied with desalinated water
with pipes from Gaza. 35
GCC includes countries on the Arabian Peninsula consisting of Saudi Arabia, Kuwait, Bahrain, Qatar, the United
Arab Emirates, and the Sultanate of Oman.
Figure 4.1 Distribution of Worldwide Desalination Capacity, 2007 (%)
Source: Lattemann and Hopner 2010.
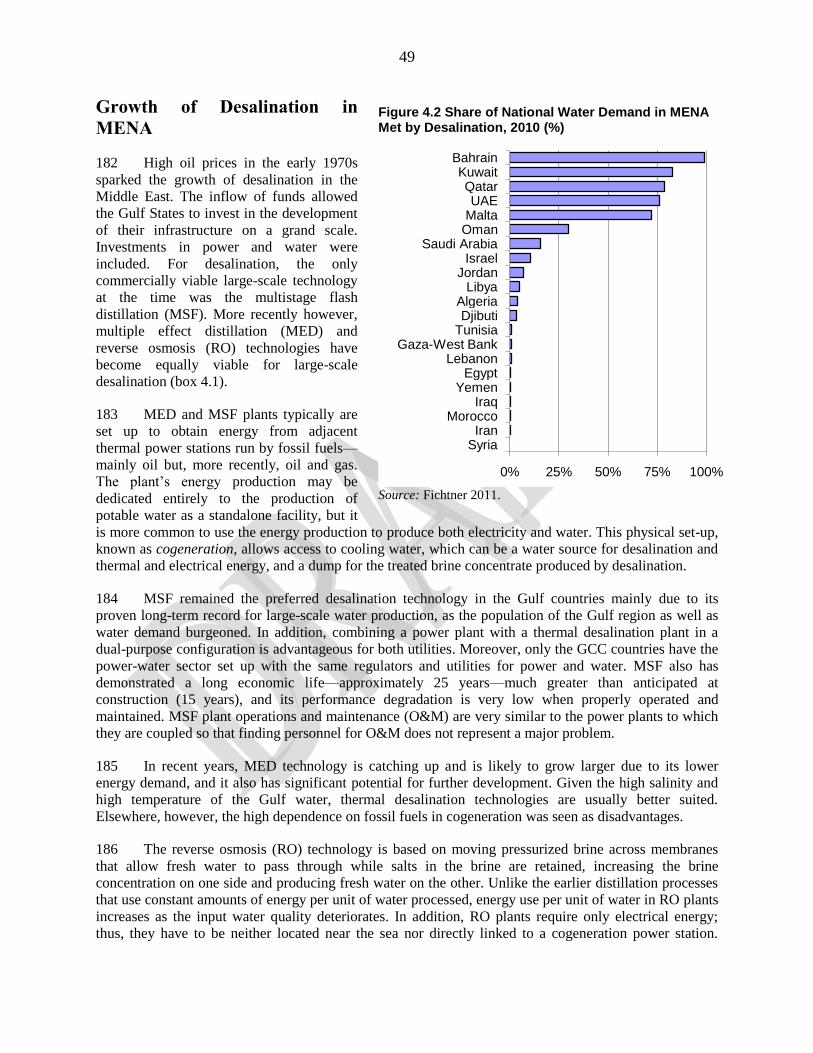
49
Growth of Desalination in
MENA
182 High oil prices in the early 1970s
sparked the growth of desalination in the
Middle East. The inflow of funds allowed
the Gulf States to invest in the development
of their infrastructure on a grand scale.
Investments in power and water were
included. For desalination, the only
commercially viable large-scale technology
at the time was the multistage flash
distillation (MSF). More recently however,
multiple effect distillation (MED) and
reverse osmosis (RO) technologies have
become equally viable for large-scale
desalination (box 4.1).
183 MED and MSF plants typically are
set up to obtain energy from adjacent
thermal power stations run by fossil fuels––
mainly oil but, more recently, oil and gas.
The plant‘s energy production may be
dedicated entirely to the production of
potable water as a standalone facility, but it
is more common to use the energy production to produce both electricity and water. This physical set-up,
known as cogeneration, allows access to cooling water, which can be a water source for desalination and
thermal and electrical energy, and a dump for the treated brine concentrate produced by desalination.
184 MSF remained the preferred desalination technology in the Gulf countries mainly due to its
proven long-term record for large-scale water production, as the population of the Gulf region as well as
water demand burgeoned. In addition, combining a power plant with a thermal desalination plant in a
dual-purpose configuration is advantageous for both utilities. Moreover, only the GCC countries have the
power-water sector set up with the same regulators and utilities for power and water. MSF also has
demonstrated a long economic life––approximately 25 years––much greater than anticipated at
construction (15 years), and its performance degradation is very low when properly operated and
maintained. MSF plant operations and maintenance (O&M) are very similar to the power plants to which
they are coupled so that finding personnel for O&M does not represent a major problem.
185 In recent years, MED technology is catching up and is likely to grow larger due to its lower
energy demand, and it also has significant potential for further development. Given the high salinity and
high temperature of the Gulf water, thermal desalination technologies are usually better suited.
Elsewhere, however, the high dependence on fossil fuels in cogeneration was seen as disadvantages.
186 The reverse osmosis (RO) technology is based on moving pressurized brine across membranes
that allow fresh water to pass through while salts in the brine are retained, increasing the brine
concentration on one side and producing fresh water on the other. Unlike the earlier distillation processes
that use constant amounts of energy per unit of water processed, energy use per unit of water in RO plants
increases as the input water quality deteriorates. In addition, RO plants require only electrical energy;
thus, they have to be neither located near the sea nor directly linked to a cogeneration power station.
Figure 4.2 Share of National Water Demand in MENA Met by Desalination, 2010 (%)
Source: Fichtner 2011.
0% 25% 50% 75% 100%
SyriaIran
MoroccoIraq
YemenEgypt
LebanonGaza-West Bank
TunisiaDjibuti
AlgeriaLibya
JordanIsrael
Saudi ArabiaOmanMaltaUAE
QatarKuwait
Bahrain
50
Initially, the RO membranes were expensive; pretreatment was not well understood; and energy
consumption was high. Since then, membrane prices have fallen; their performance has improved;
pretreatment is better understood; and energy consumption has dropped dramatically. Hybrid
configurations of different desalination technologies are also being used to optimize the benefits from
each technology. For example, the Fujairah power and desalination plant in UAE is a hybrid of MSF and
RO desalination technologies, producing a total of about 455,000 m3 a day.
Box 4.1 Desalination Technologies: A Summary
Desalination is the process of removing dissolved salts and other chemicals from seawater, brackish groundwater,
or surface water. Seawater desalination enables countries to access the abundant water resources of the oceans and
to provide a reliable independent source of drinking water. The widely used desalination technologies can be
divided in two process groups: (a) thermal distillation process, which uses heat to evaporate water, leaving the
salts behind in the brine; and (b) membrane process, which uses pressure to force water through a semi-permeable
membrane that blocks salts and other dissolved solids.
The most common thermal processes are Multi-Stage Flash (MSF), Multi-Effect Distillation (MED), and Vapor
Compression (VC). The MSF technology has one of the largest market shares worldwide although MED is
catching up given its lower energy demand and potential for further development.
Reverse osmosis (RO) is the main membrane technology, which has approximately the same market share as the
MSF worldwide. However, in MENA, especially in the GCC countries, MSF accounts for the highest market
share, equal to approximately 80 percent. Irrespective of the dominance of the MSF in GCC countries, both RO
and MED are projected to grow 5- to 6-fold in the present decade.
Multiple Effect Distillation (MED)
• Current modular capacity up to 38,000 m3/d
• Can be operated between 0%–100% capacity
while MED unit is kept under vacuum and cold
circulation; suitable to combine with RE
sources that supply intermittent energy
• Very high efficiency: 1.5 kWh/m3 to 2.5
kWh/m3 electricity and 233 MJ*/m
3 to 258
MJ/m3 heat
• Special needs: Antiscalents required to stop
scale build-up on evaporating surfaces
Reverse Osmosis (RO)
• Energy need directly proportional to salt
content; best under brackish water or low
salinity seawater
• Energy consumption can be reduced to
3kWh/m3 electricity
• Special needs: Inflow water needs extensive
pretreatment to stop bio-fouling and scaling of
membranes
MED-TVC (Thermal Vapor Compression)
• Helps reduce number of effects
• Adapts MED design to a broad range of pressures
• Cannot operate at below 60% capacity
Not suitable to combine with RE that has intermittent
energy supply
• Special needs, such as MED
Multiple Stage Flash (MSF)
• Current modular capacity up to 90,000 m3/d
• Can treat very salty water up to 70,000 milligrams per
liter (mg/l)
• Cannot operate at below 60% capacity
• Usually configured as cogeneration with power plants
• Not suitable to combine with renewable energies that
have intermittent energy supplies
• High energy use: From 3 kWh/m3 to 5 kWh/m
3
electricity and 233 MJ*/m3 to 258 MJ/m
3 heat required
Vapor Compression (VC)
• Built for capacities of approximately 3,000 m3/d
• Energy consumption approx. 7kWh/m3 to 12kWh/m
3
Source: Adapted from Fichtner 2011 and others.
Note: MJ = megajoule.
187 Commercialization of RO for seawater desalination plants in MENA started with the installation
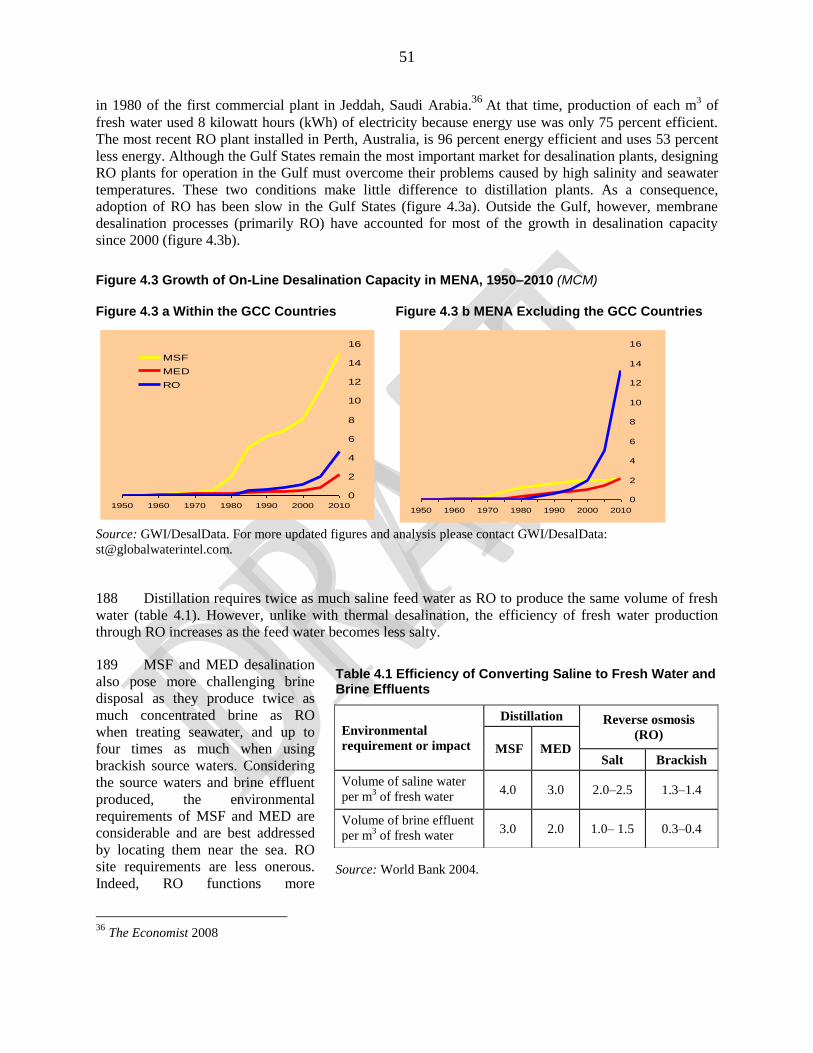
51
in 1980 of the first commercial plant in Jeddah, Saudi Arabia.36
At that time, production of each m3 of
fresh water used 8 kilowatt hours (kWh) of electricity because energy use was only 75 percent efficient.
The most recent RO plant installed in Perth, Australia, is 96 percent energy efficient and uses 53 percent
less energy. Although the Gulf States remain the most important market for desalination plants, designing
RO plants for operation in the Gulf must overcome their problems caused by high salinity and seawater
temperatures. These two conditions make little difference to distillation plants. As a consequence,
adoption of RO has been slow in the Gulf States (figure 4.3a). Outside the Gulf, however, membrane
desalination processes (primarily RO) have accounted for most of the growth in desalination capacity
since 2000 (figure 4.3b).
Figure 4.3 Growth of On-Line Desalination Capacity in MENA, 1950–2010 (MCM)
Figure 4.3 a Within the GCC Countries Figure 4.3 b MENA Excluding the GCC Countries
Source: GWI/DesalData. For more updated figures and analysis please contact GWI/DesalData:
188 Distillation requires twice as much saline feed water as RO to produce the same volume of fresh
water (table 4.1). However, unlike with thermal desalination, the efficiency of fresh water production
through RO increases as the feed water becomes less salty.
189 MSF and MED desalination
also pose more challenging brine
disposal as they produce twice as
much concentrated brine as RO
when treating seawater, and up to
four times as much when using
brackish source waters. Considering
the source waters and brine effluent
produced, the environmental
requirements of MSF and MED are
considerable and are best addressed
by locating them near the sea. RO
site requirements are less onerous.
Indeed, RO functions more
36
The Economist 2008
0
2
4
6
8
10
12
14
16
1950 1960 1970 1980 1990 2000 2010
MSF
MED
RO
0
2
4
6
8
10
12
14
16
1950 1960 1970 1980 1990 2000 2010
Table 4.1 Efficiency of Converting Saline to Fresh Water and Brine Effluents
Environmental
requirement or impact
Distillation Reverse osmosis
(RO) MSF MED
Salt Brackish
Volume of saline water
per m3 of fresh water
4.0 3.0 2.0–2.5 1.3–1.4
Volume of brine effluent
per m3 of fresh water
3.0 2.0 1.0– 1.5 0.3–0.4
Source: World Bank 2004.
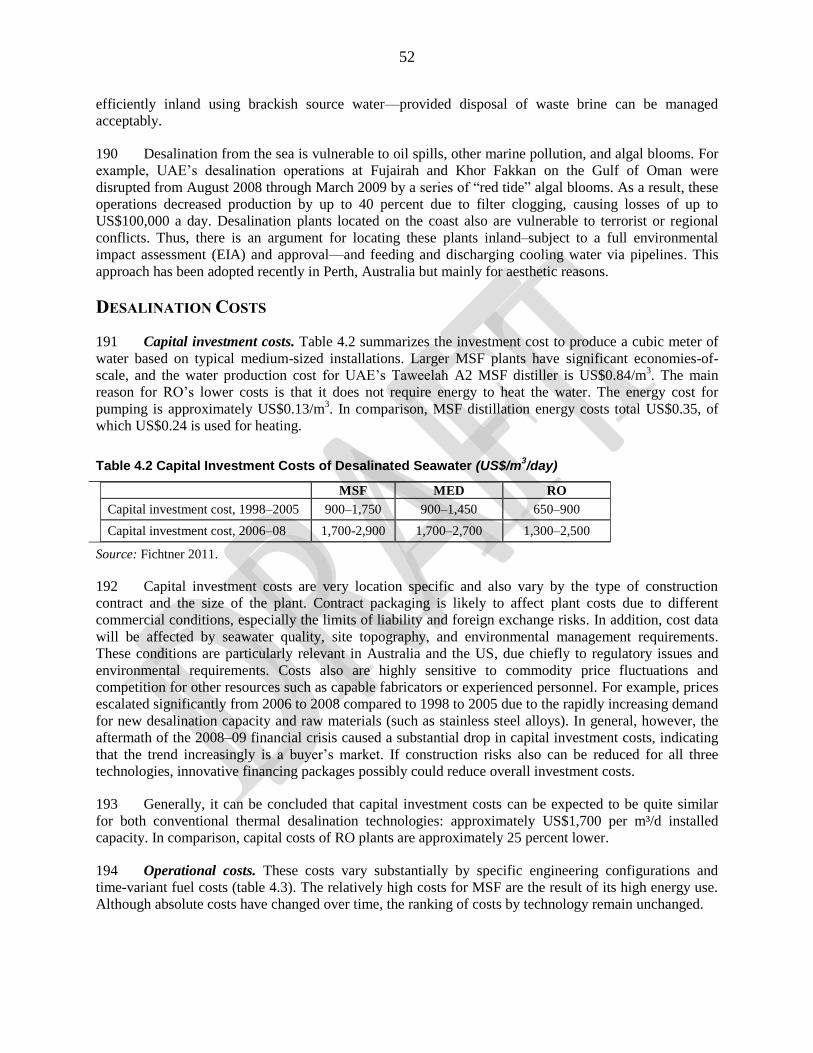
52
efficiently inland using brackish source water––provided disposal of waste brine can be managed
acceptably.
190 Desalination from the sea is vulnerable to oil spills, other marine pollution, and algal blooms. For
example, UAE‘s desalination operations at Fujairah and Khor Fakkan on the Gulf of Oman were
disrupted from August 2008 through March 2009 by a series of ―red tide‖ algal blooms. As a result, these
operations decreased production by up to 40 percent due to filter clogging, causing losses of up to
US$100,000 a day. Desalination plants located on the coast also are vulnerable to terrorist or regional
conflicts. Thus, there is an argument for locating these plants inland–subject to a full environmental
impact assessment (EIA) and approval––and feeding and discharging cooling water via pipelines. This
approach has been adopted recently in Perth, Australia but mainly for aesthetic reasons.
DESALINATION COSTS
191 Capital investment costs. Table 4.2 summarizes the investment cost to produce a cubic meter of
water based on typical medium-sized installations. Larger MSF plants have significant economies-of-
scale, and the water production cost for UAE‘s Taweelah A2 MSF distiller is US$0.84/m3. The main
reason for RO‘s lower costs is that it does not require energy to heat the water. The energy cost for
pumping is approximately US$0.13/m3. In comparison, MSF distillation energy costs total US$0.35, of
which US$0.24 is used for heating.
Table 4.2 Capital Investment Costs of Desalinated Seawater (US$/m3/day)
MSF MED RO
Capital investment cost, 1998–2005 900–1,750 900–1,450 650–900
Capital investment cost, 2006–08 1,700-2,900 1,700–2,700 1,300–2,500
Source: Fichtner 2011.
192 Capital investment costs are very location specific and also vary by the type of construction
contract and the size of the plant. Contract packaging is likely to affect plant costs due to different
commercial conditions, especially the limits of liability and foreign exchange risks. In addition, cost data
will be affected by seawater quality, site topography, and environmental management requirements.
These conditions are particularly relevant in Australia and the US, due chiefly to regulatory issues and
environmental requirements. Costs also are highly sensitive to commodity price fluctuations and
competition for other resources such as capable fabricators or experienced personnel. For example, prices
escalated significantly from 2006 to 2008 compared to 1998 to 2005 due to the rapidly increasing demand
for new desalination capacity and raw materials (such as stainless steel alloys). In general, however, the
aftermath of the 2008–09 financial crisis caused a substantial drop in capital investment costs, indicating
that the trend increasingly is a buyer‘s market. If construction risks also can be reduced for all three
technologies, innovative financing packages possibly could reduce overall investment costs.
193 Generally, it can be concluded that capital investment costs can be expected to be quite similar
for both conventional thermal desalination technologies: approximately US$1,700 per m³/d installed
capacity. In comparison, capital costs of RO plants are approximately 25 percent lower.
194 Operational costs. These costs vary substantially by specific engineering configurations and
time-variant fuel costs (table 4.3). The relatively high costs for MSF are the result of its high energy use.
Although absolute costs have changed over time, the ranking of costs by technology remain unchanged.
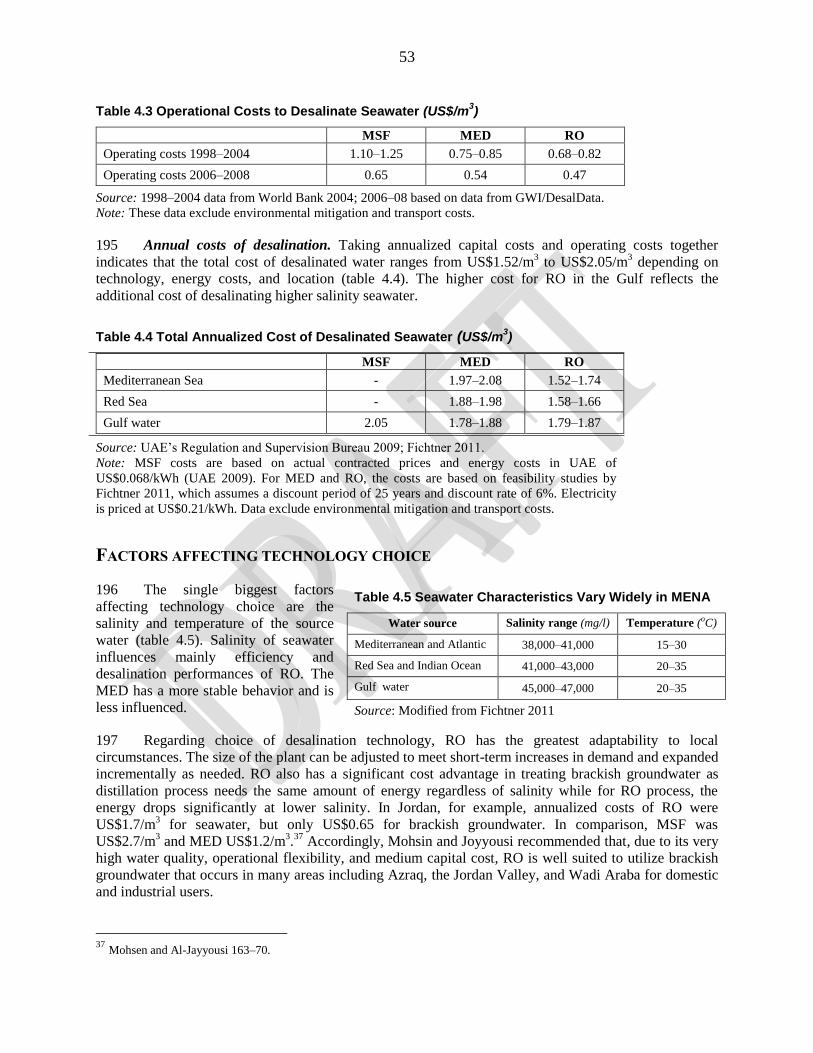
53
Table 4.3 Operational Costs to Desalinate Seawater (US$/m3)
MSF MED RO
Operating costs 1998–2004 1.10–1.25 0.75–0.85 0.68–0.82
Operating costs 2006–2008 0.65 0.54 0.47
Source: 1998–2004 data from World Bank 2004; 2006–08 based on data from GWI/DesalData.
Note: These data exclude environmental mitigation and transport costs.
195 Annual costs of desalination. Taking annualized capital costs and operating costs together
indicates that the total cost of desalinated water ranges from US$1.52/m3 to US$2.05/m
3 depending on
technology, energy costs, and location (table 4.4). The higher cost for RO in the Gulf reflects the
additional cost of desalinating higher salinity seawater.
Table 4.4 Total Annualized Cost of Desalinated Seawater (US$/m3)
MSF MED RO
Mediterranean Sea - 1.97–2.08 1.52–1.74
Red Sea - 1.88–1.98 1.58–1.66
Gulf water 2.05 1.78–1.88 1.79–1.87
Source: UAE‘s Regulation and Supervision Bureau 2009; Fichtner 2011.
Note: MSF costs are based on actual contracted prices and energy costs in UAE of
US$0.068/kWh (UAE 2009). For MED and RO, the costs are based on feasibility studies by
Fichtner 2011, which assumes a discount period of 25 years and discount rate of 6%. Electricity
is priced at US$0.21/kWh. Data exclude environmental mitigation and transport costs.
FACTORS AFFECTING TECHNOLOGY CHOICE
196 The single biggest factors
affecting technology choice are the
salinity and temperature of the source
water (table 4.5). Salinity of seawater
influences mainly efficiency and
desalination performances of RO. The
MED has a more stable behavior and is
less influenced.
197 Regarding choice of desalination technology, RO has the greatest adaptability to local
circumstances. The size of the plant can be adjusted to meet short-term increases in demand and expanded
incrementally as needed. RO also has a significant cost advantage in treating brackish groundwater as
distillation process needs the same amount of energy regardless of salinity while for RO process, the
energy drops significantly at lower salinity. In Jordan, for example, annualized costs of RO were
US$1.7/m3 for seawater, but only US$0.65 for brackish groundwater. In comparison, MSF was
US$2.7/m3 and MED US$1.2/m
3.37
Accordingly, Mohsin and Joyyousi recommended that, due to its very
high water quality, operational flexibility, and medium capital cost, RO is well suited to utilize brackish
groundwater that occurs in many areas including Azraq, the Jordan Valley, and Wadi Araba for domestic
and industrial users.
37
Mohsen and Al-Jayyousi 163–70.
Table 4.5 Seawater Characteristics Vary Widely in MENA
Water source Salinity range (mg/l) Temperature (oC)
Mediterranean and Atlantic 38,000–41,000 15–30
Red Sea and Indian Ocean 41,000–43,000 20–35
Gulf water 45,000–47,000 20–35
Source: Modified from Fichtner 2011
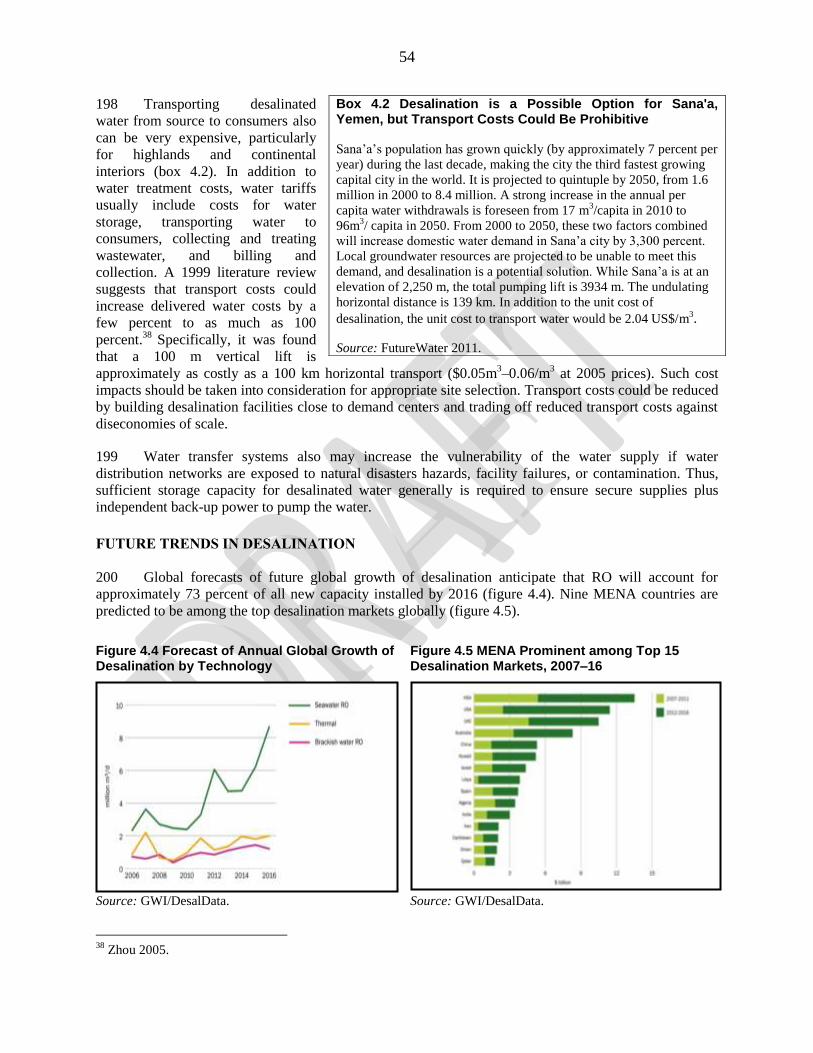
54
198 Transporting desalinated
water from source to consumers also
can be very expensive, particularly
for highlands and continental
interiors (box 4.2). In addition to
water treatment costs, water tariffs
usually include costs for water
storage, transporting water to
consumers, collecting and treating
wastewater, and billing and
collection. A 1999 literature review
suggests that transport costs could
increase delivered water costs by a
few percent to as much as 100
percent.38
Specifically, it was found
that a 100 m vertical lift is
approximately as costly as a 100 km horizontal transport ($0.05m3–0.06/m
3 at 2005 prices). Such cost
impacts should be taken into consideration for appropriate site selection. Transport costs could be reduced
by building desalination facilities close to demand centers and trading off reduced transport costs against
diseconomies of scale.
199 Water transfer systems also may increase the vulnerability of the water supply if water
distribution networks are exposed to natural disasters hazards, facility failures, or contamination. Thus,
sufficient storage capacity for desalinated water generally is required to ensure secure supplies plus
independent back-up power to pump the water.
FUTURE TRENDS IN DESALINATION
200 Global forecasts of future global growth of desalination anticipate that RO will account for
approximately 73 percent of all new capacity installed by 2016 (figure 4.4). Nine MENA countries are
predicted to be among the top desalination markets globally (figure 4.5).
Figure 4.4 Forecast of Annual Global Growth of Desalination by Technology
Figure 4.5 MENA Prominent among Top 15 Desalination Markets, 2007–16
Source: GWI/DesalData. Source: GWI/DesalData.
38
Zhou 2005.
Box 4.2 Desalination is a Possible Option for Sana'a, Yemen, but Transport Costs Could Be Prohibitive
Sana‘a‘s population has grown quickly (by approximately 7 percent per
year) during the last decade, making the city the third fastest growing
capital city in the world. It is projected to quintuple by 2050, from 1.6
million in 2000 to 8.4 million. A strong increase in the annual per
capita water withdrawals is foreseen from 17 m3/capita in 2010 to
96m3/ capita in 2050. From 2000 to 2050, these two factors combined
will increase domestic water demand in Sana‘a city by 3,300 percent.
Local groundwater resources are projected to be unable to meet this
demand, and desalination is a potential solution. While Sana‘a is at an
elevation of 2,250 m, the total pumping lift is 3934 m. The undulating
horizontal distance is 139 km. In addition to the unit cost of
desalination, the unit cost to transport water would be 2.04 US$/m3.
Source: FutureWater 2011.
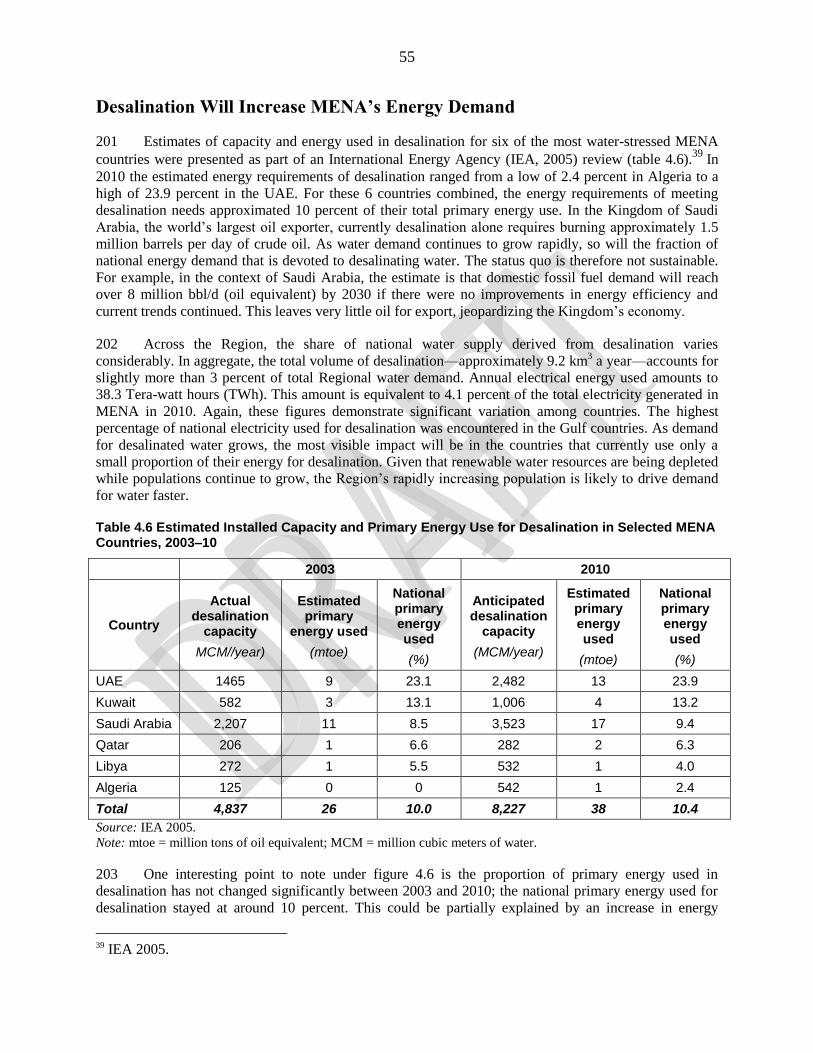
55
Desalination Will Increase MENA’s Energy Demand
201 Estimates of capacity and energy used in desalination for six of the most water-stressed MENA
countries were presented as part of an International Energy Agency (IEA, 2005) review (table 4.6).39
In
2010 the estimated energy requirements of desalination ranged from a low of 2.4 percent in Algeria to a
high of 23.9 percent in the UAE. For these 6 countries combined, the energy requirements of meeting
desalination needs approximated 10 percent of their total primary energy use. In the Kingdom of Saudi
Arabia, the world‘s largest oil exporter, currently desalination alone requires burning approximately 1.5
million barrels per day of crude oil. As water demand continues to grow rapidly, so will the fraction of
national energy demand that is devoted to desalinating water. The status quo is therefore not sustainable.
For example, in the context of Saudi Arabia, the estimate is that domestic fossil fuel demand will reach
over 8 million bbl/d (oil equivalent) by 2030 if there were no improvements in energy efficiency and
current trends continued. This leaves very little oil for export, jeopardizing the Kingdom‘s economy.
202 Across the Region, the share of national water supply derived from desalination varies
considerably. In aggregate, the total volume of desalination––approximately 9.2 km3 a year––accounts for
slightly more than 3 percent of total Regional water demand. Annual electrical energy used amounts to
38.3 Tera-watt hours (TWh). This amount is equivalent to 4.1 percent of the total electricity generated in
MENA in 2010. Again, these figures demonstrate significant variation among countries. The highest
percentage of national electricity used for desalination was encountered in the Gulf countries. As demand
for desalinated water grows, the most visible impact will be in the countries that currently use only a
small proportion of their energy for desalination. Given that renewable water resources are being depleted
while populations continue to grow, the Region‘s rapidly increasing population is likely to drive demand
for water faster.
Table 4.6 Estimated Installed Capacity and Primary Energy Use for Desalination in Selected MENA Countries, 2003–10
2003 2010
Country
Actual desalination
capacity
MCM//year)
Estimated primary
energy used
(mtoe)
National primary energy used
(%)
Anticipated desalination
capacity
(MCM/year)
Estimated primary energy used
(mtoe)
National primary energy used
(%)
UAE 1465 9 23.1 2,482 13 23.9
Kuwait 582 3 13.1 1,006 4 13.2
Saudi Arabia 2,207 11 8.5 3,523 17 9.4
Qatar 206 1 6.6 282 2 6.3
Libya 272 1 5.5 532 1 4.0
Algeria 125 0 0 542 1 2.4
Total 4,837 26 10.0 8,227 38 10.4
Source: IEA 2005.
Note: mtoe = million tons of oil equivalent; MCM = million cubic meters of water.
203 One interesting point to note under figure 4.6 is the proportion of primary energy used in
desalination has not changed significantly between 2003 and 2010; the national primary energy used for
desalination stayed at around 10 percent. This could be partially explained by an increase in energy
39 IEA 2005.
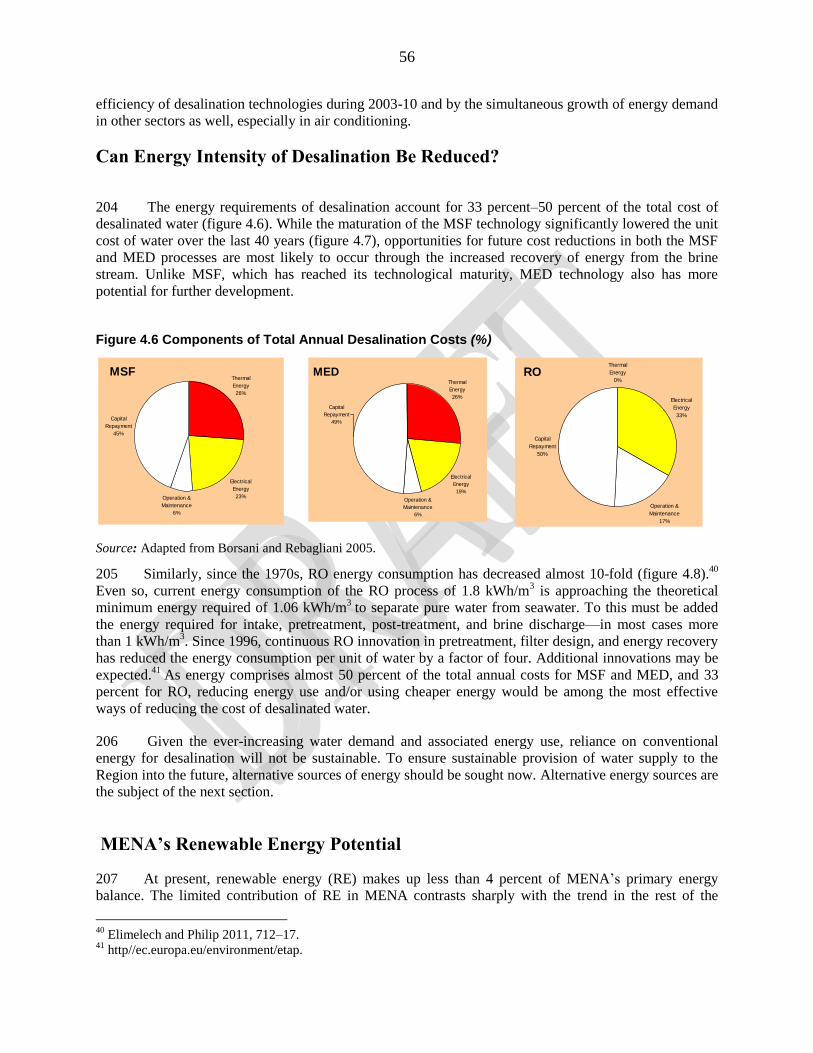
56
efficiency of desalination technologies during 2003-10 and by the simultaneous growth of energy demand
in other sectors as well, especially in air conditioning.
Can Energy Intensity of Desalination Be Reduced?
204 The energy requirements of desalination account for 33 percent–50 percent of the total cost of
desalinated water (figure 4.6). While the maturation of the MSF technology significantly lowered the unit
cost of water over the last 40 years (figure 4.7), opportunities for future cost reductions in both the MSF
and MED processes are most likely to occur through the increased recovery of energy from the brine
stream. Unlike MSF, which has reached its technological maturity, MED technology also has more
potential for further development.
205 Similarly, since the 1970s, RO energy consumption has decreased almost 10-fold (figure 4.8).40
Even so, current energy consumption of the RO process of 1.8 kWh/m3 is approaching the theoretical
minimum energy required of 1.06 kWh/m3
to separate pure water from seawater. To this must be added
the energy required for intake, pretreatment, post-treatment, and brine discharge––in most cases more
than 1 kWh/m3. Since 1996, continuous RO innovation in pretreatment, filter design, and energy recovery
has reduced the energy consumption per unit of water by a factor of four. Additional innovations may be
expected.41
As energy comprises almost 50 percent of the total annual costs for MSF and MED, and 33
percent for RO, reducing energy use and/or using cheaper energy would be among the most effective
ways of reducing the cost of desalinated water.
206 Given the ever-increasing water demand and associated energy use, reliance on conventional
energy for desalination will not be sustainable. To ensure sustainable provision of water supply to the
Region into the future, alternative sources of energy should be sought now. Alternative energy sources are
the subject of the next section.
MENA’s Renewable Energy Potential
207 At present, renewable energy (RE) makes up less than 4 percent of MENA‘s primary energy
balance. The limited contribution of RE in MENA contrasts sharply with the trend in the rest of the
40
Elimelech and Philip 2011, 712–17. 41
http//ec.europa.eu/environment/etap.
Figure 4.6 Components of Total Annual Desalination Costs (%)
Source: Adapted from Borsani and Rebagliani 2005.
MSFThermal
Energy
26%
Electrical
Energy
23%Operation &
Maintenance
6%
Capital
Repayment
45%
MEDThermal
Energy
26%
Electrical
Energy
19%
Operation &
Maintenance
6%
Capital
Repayment
49%
ROThermal
Energy
0%
Electrical
Energy
33%
Operation &
Maintenance
17%
Capital
Repayment
50%
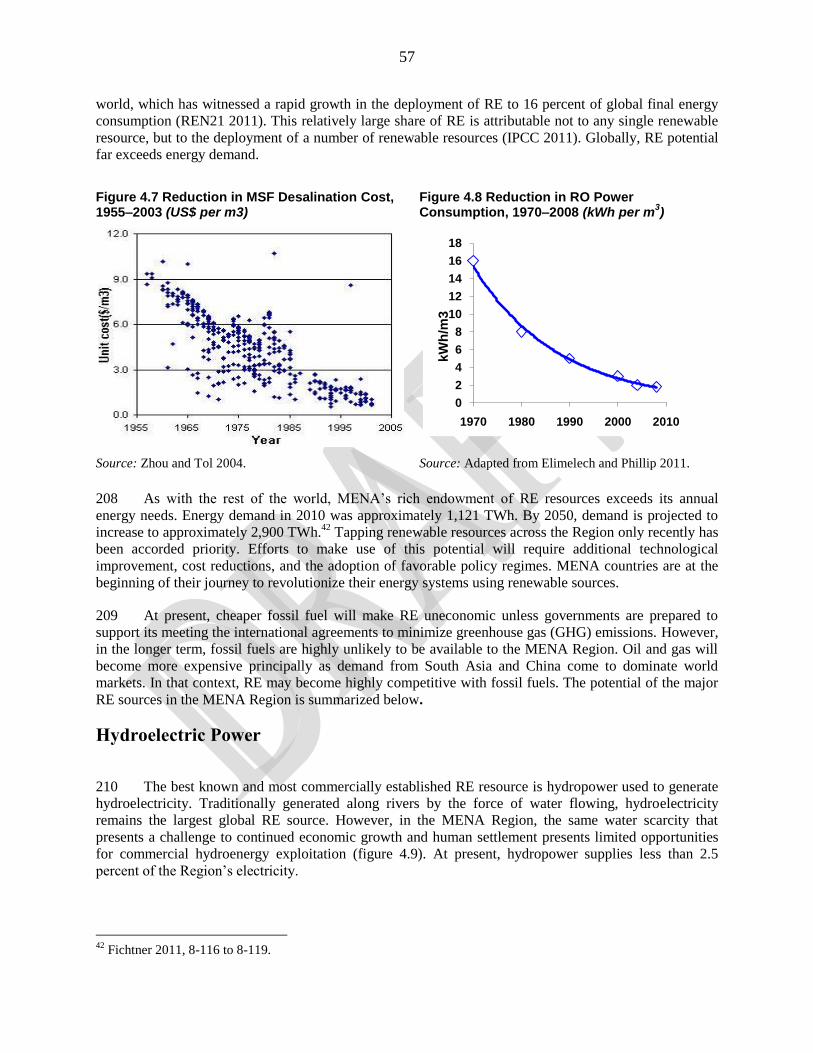
57
world, which has witnessed a rapid growth in the deployment of RE to 16 percent of global final energy
consumption (REN21 2011). This relatively large share of RE is attributable not to any single renewable
resource, but to the deployment of a number of renewable resources (IPCC 2011). Globally, RE potential
far exceeds energy demand.
208 As with the rest of the world, MENA‘s rich endowment of RE resources exceeds its annual
energy needs. Energy demand in 2010 was approximately 1,121 TWh. By 2050, demand is projected to
increase to approximately 2,900 TWh.42
Tapping renewable resources across the Region only recently has
been accorded priority. Efforts to make use of this potential will require additional technological
improvement, cost reductions, and the adoption of favorable policy regimes. MENA countries are at the
beginning of their journey to revolutionize their energy systems using renewable sources.
209 At present, cheaper fossil fuel will make RE uneconomic unless governments are prepared to
support its meeting the international agreements to minimize greenhouse gas (GHG) emissions. However,
in the longer term, fossil fuels are highly unlikely to be available to the MENA Region. Oil and gas will
become more expensive principally as demand from South Asia and China come to dominate world
markets. In that context, RE may become highly competitive with fossil fuels. The potential of the major
RE sources in the MENA Region is summarized below.
Hydroelectric Power
210 The best known and most commercially established RE resource is hydropower used to generate
hydroelectricity. Traditionally generated along rivers by the force of water flowing, hydroelectricity
remains the largest global RE source. However, in the MENA Region, the same water scarcity that
presents a challenge to continued economic growth and human settlement presents limited opportunities
for commercial hydroenergy exploitation (figure 4.9). At present, hydropower supplies less than 2.5
percent of the Region‘s electricity.
42
Fichtner 2011, 8-116 to 8-119.
Figure 4.7 Reduction in MSF Desalination Cost, 1955–2003 (US$ per m3)
Figure 4.8 Reduction in RO Power Consumption, 1970–2008 (kWh per m
3)
Source: Zhou and Tol 2004. Source: Adapted from Elimelech and Phillip 2011.
0
2
4
6
8
10
12
14
16
18
1970 1980 1990 2000 2010
kW
h/m
3
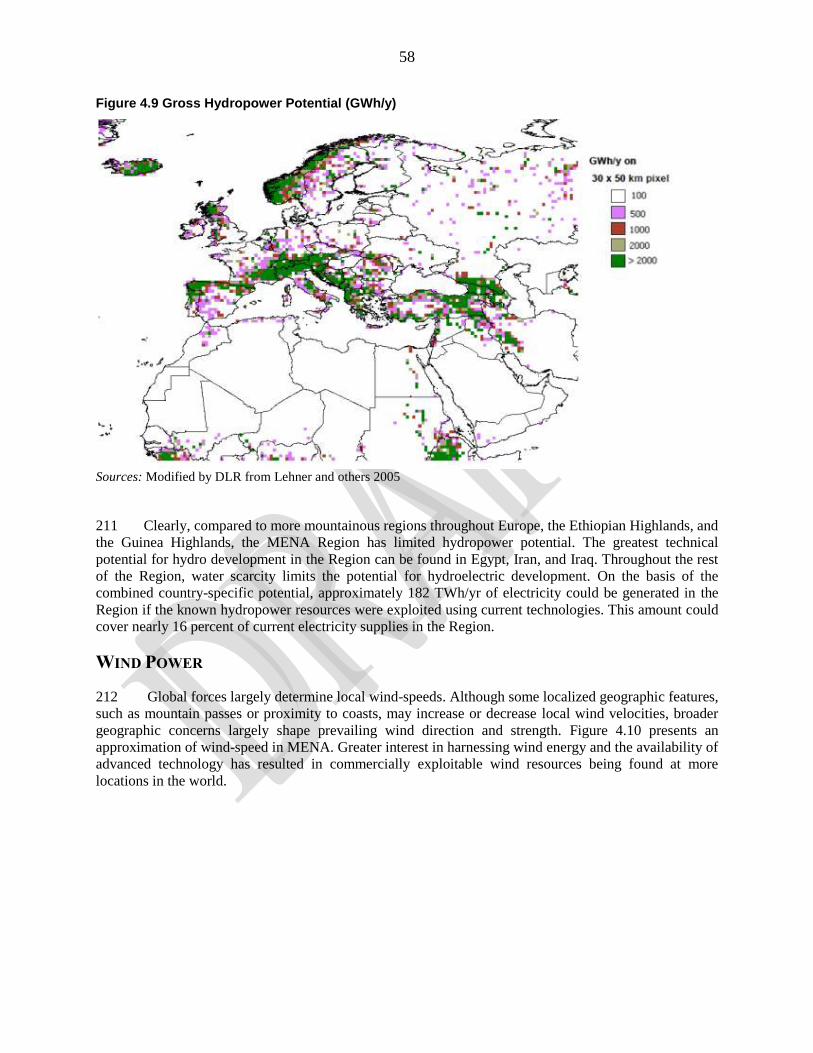
58
Figure 4.9 Gross Hydropower Potential (GWh/y)
Sources: Modified by DLR from Lehner and others 2005
211 Clearly, compared to more mountainous regions throughout Europe, the Ethiopian Highlands, and
the Guinea Highlands, the MENA Region has limited hydropower potential. The greatest technical
potential for hydro development in the Region can be found in Egypt, Iran, and Iraq. Throughout the rest
of the Region, water scarcity limits the potential for hydroelectric development. On the basis of the
combined country-specific potential, approximately 182 TWh/yr of electricity could be generated in the
Region if the known hydropower resources were exploited using current technologies. This amount could
cover nearly 16 percent of current electricity supplies in the Region.
WIND POWER
212 Global forces largely determine local wind-speeds. Although some localized geographic features,
such as mountain passes or proximity to coasts, may increase or decrease local wind velocities, broader
geographic concerns largely shape prevailing wind direction and strength. Figure 4.10 presents an
approximation of wind-speed in MENA. Greater interest in harnessing wind energy and the availability of
advanced technology has resulted in commercially exploitable wind resources being found at more
locations in the world.
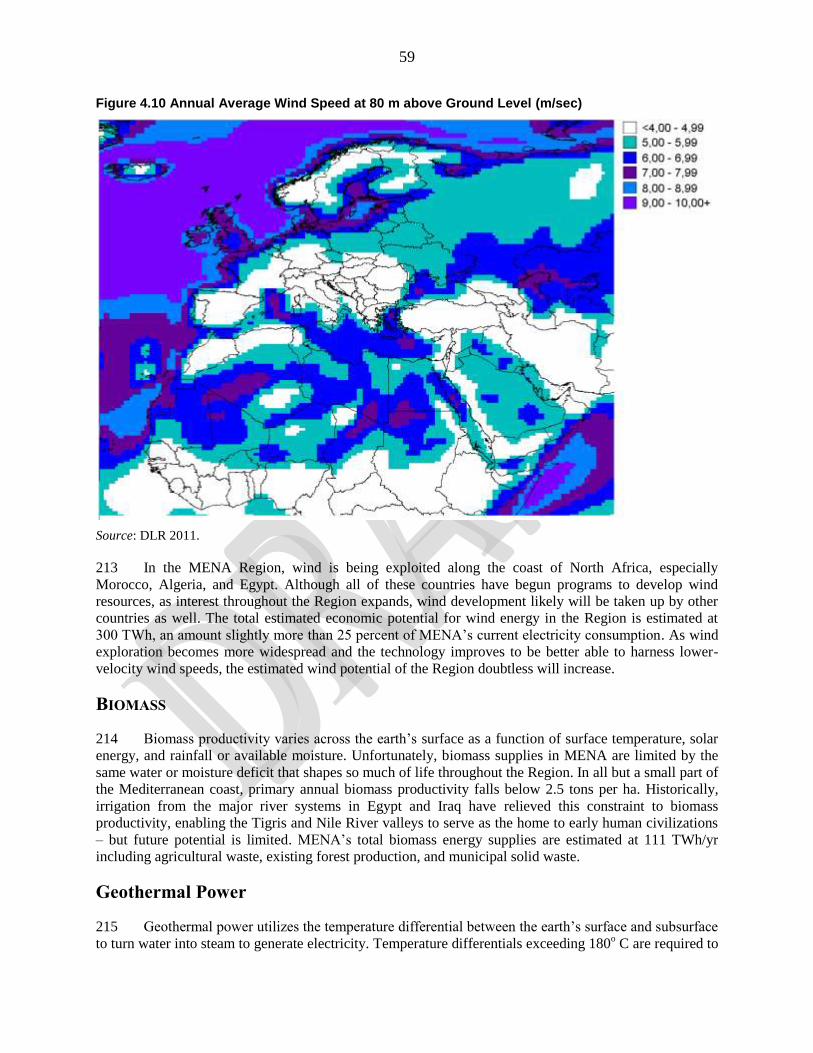
59
Figure 4.10 Annual Average Wind Speed at 80 m above Ground Level (m/sec)
Source: DLR 2011.
213 In the MENA Region, wind is being exploited along the coast of North Africa, especially
Morocco, Algeria, and Egypt. Although all of these countries have begun programs to develop wind
resources, as interest throughout the Region expands, wind development likely will be taken up by other
countries as well. The total estimated economic potential for wind energy in the Region is estimated at
300 TWh, an amount slightly more than 25 percent of MENA‘s current electricity consumption. As wind
exploration becomes more widespread and the technology improves to be better able to harness lower-
velocity wind speeds, the estimated wind potential of the Region doubtless will increase.
BIOMASS
214 Biomass productivity varies across the earth‘s surface as a function of surface temperature, solar
energy, and rainfall or available moisture. Unfortunately, biomass supplies in MENA are limited by the
same water or moisture deficit that shapes so much of life throughout the Region. In all but a small part of
the Mediterranean coast, primary annual biomass productivity falls below 2.5 tons per ha. Historically,
irrigation from the major river systems in Egypt and Iraq have relieved this constraint to biomass
productivity, enabling the Tigris and Nile River valleys to serve as the home to early human civilizations
– but future potential is limited. MENA‘s total biomass energy supplies are estimated at 111 TWh/yr
including agricultural waste, existing forest production, and municipal solid waste.
Geothermal Power
215 Geothermal power utilizes the temperature differential between the earth‘s surface and subsurface
to turn water into steam to generate electricity. Temperature differentials exceeding 180o C are required to
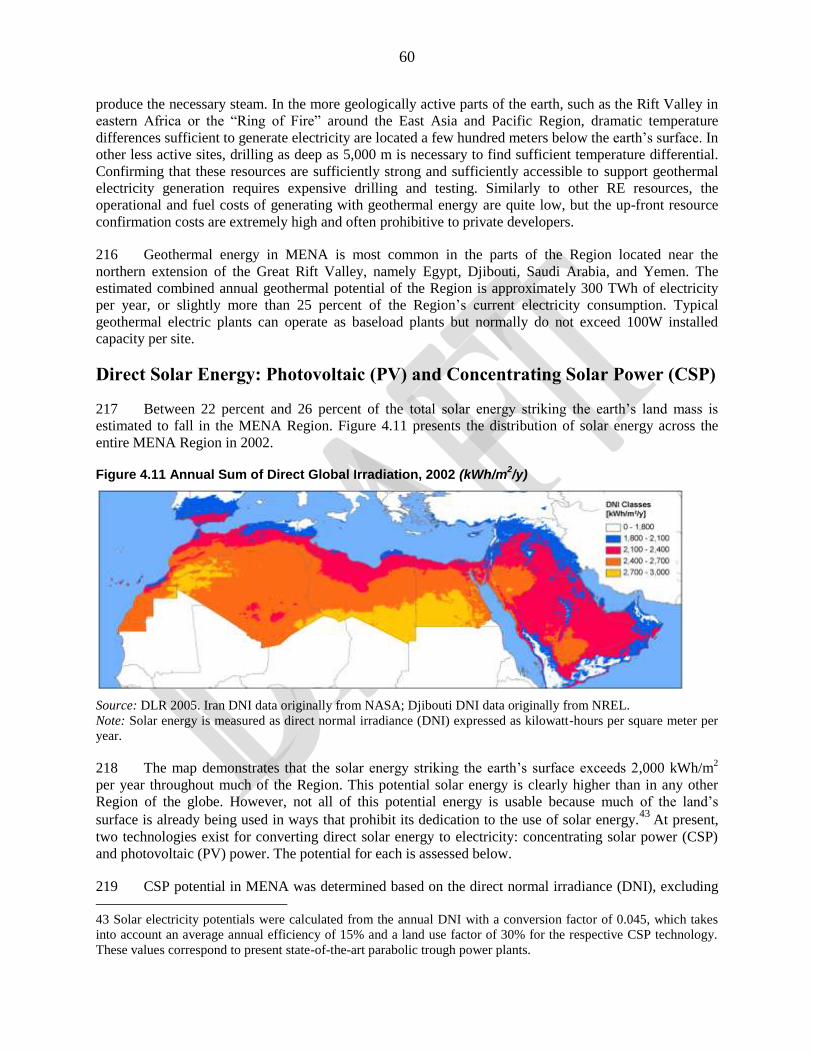
60
produce the necessary steam. In the more geologically active parts of the earth, such as the Rift Valley in
eastern Africa or the ―Ring of Fire‖ around the East Asia and Pacific Region, dramatic temperature
differences sufficient to generate electricity are located a few hundred meters below the earth‘s surface. In
other less active sites, drilling as deep as 5,000 m is necessary to find sufficient temperature differential.
Confirming that these resources are sufficiently strong and sufficiently accessible to support geothermal
electricity generation requires expensive drilling and testing. Similarly to other RE resources, the
operational and fuel costs of generating with geothermal energy are quite low, but the up-front resource
confirmation costs are extremely high and often prohibitive to private developers.
216 Geothermal energy in MENA is most common in the parts of the Region located near the
northern extension of the Great Rift Valley, namely Egypt, Djibouti, Saudi Arabia, and Yemen. The
estimated combined annual geothermal potential of the Region is approximately 300 TWh of electricity
per year, or slightly more than 25 percent of the Region‘s current electricity consumption. Typical
geothermal electric plants can operate as baseload plants but normally do not exceed 100W installed
capacity per site.
Direct Solar Energy: Photovoltaic (PV) and Concentrating Solar Power (CSP)
217 Between 22 percent and 26 percent of the total solar energy striking the earth‘s land mass is
estimated to fall in the MENA Region. Figure 4.11 presents the distribution of solar energy across the
entire MENA Region in 2002.
Figure 4.11 Annual Sum of Direct Global Irradiation, 2002 (kWh/m2/y)
Source: DLR 2005. Iran DNI data originally from NASA; Djibouti DNI data originally from NREL.
Note: Solar energy is measured as direct normal irradiance (DNI) expressed as kilowatt-hours per square meter per
year.
218 The map demonstrates that the solar energy striking the earth‘s surface exceeds 2,000 kWh/m2
per year throughout much of the Region. This potential solar energy is clearly higher than in any other
Region of the globe. However, not all of this potential energy is usable because much of the land‘s
surface is already being used in ways that prohibit its dedication to the use of solar energy.43
At present,
two technologies exist for converting direct solar energy to electricity: concentrating solar power (CSP)
and photovoltaic (PV) power. The potential for each is assessed below.
219 CSP potential in MENA was determined based on the direct normal irradiance (DNI), excluding
43 Solar electricity potentials were calculated from the annual DNI with a conversion factor of 0.045, which takes
into account an average annual efficiency of 15% and a land use factor of 30% for the respective CSP technology.
These values correspond to present state-of-the-art parabolic trough power plants.
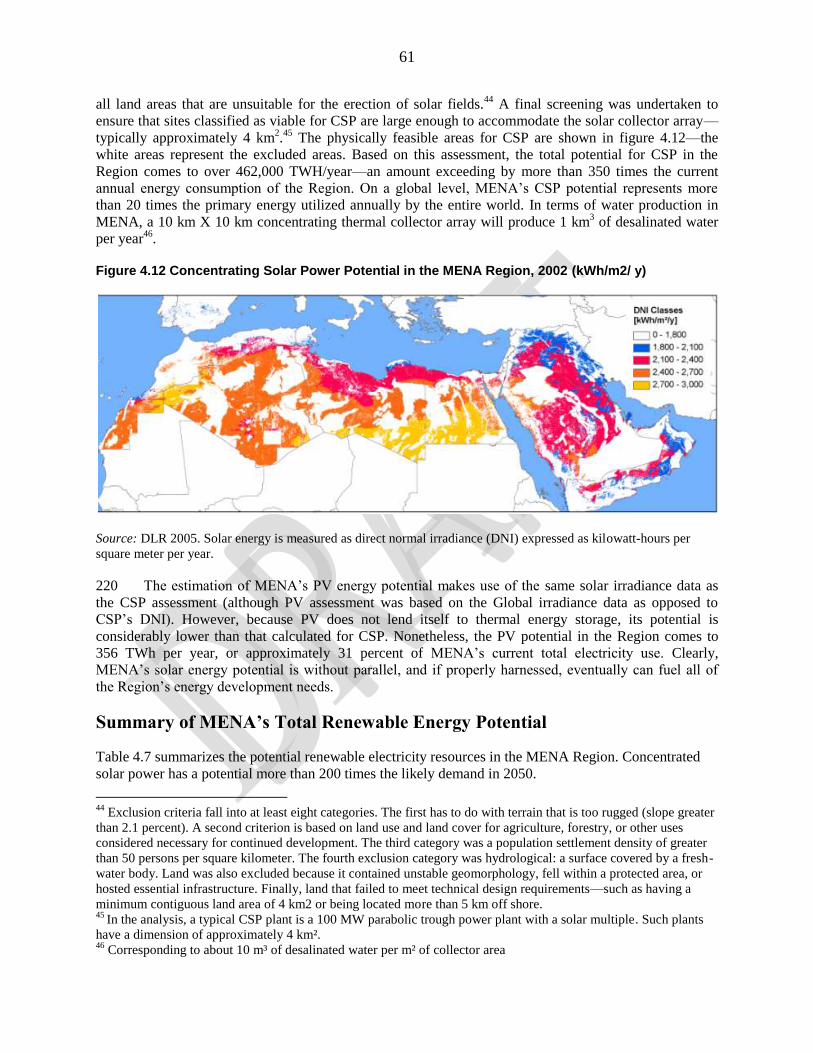
61
all land areas that are unsuitable for the erection of solar fields.44
A final screening was undertaken to
ensure that sites classified as viable for CSP are large enough to accommodate the solar collector array––
typically approximately 4 km2.45
The physically feasible areas for CSP are shown in figure 4.12––the
white areas represent the excluded areas. Based on this assessment, the total potential for CSP in the
Region comes to over 462,000 TWH/year—an amount exceeding by more than 350 times the current
annual energy consumption of the Region. On a global level, MENA‘s CSP potential represents more
than 20 times the primary energy utilized annually by the entire world. In terms of water production in
MENA, a 10 km X 10 km concentrating thermal collector array will produce 1 km3 of desalinated water
per year46
.
Figure 4.12 Concentrating Solar Power Potential in the MENA Region, 2002 (kWh/m2/ y)
Source: DLR 2005. Solar energy is measured as direct normal irradiance (DNI) expressed as kilowatt-hours per
square meter per year.
220 The estimation of MENA‘s PV energy potential makes use of the same solar irradiance data as
the CSP assessment (although PV assessment was based on the Global irradiance data as opposed to
CSP‘s DNI). However, because PV does not lend itself to thermal energy storage, its potential is
considerably lower than that calculated for CSP. Nonetheless, the PV potential in the Region comes to
356 TWh per year, or approximately 31 percent of MENA‘s current total electricity use. Clearly,
MENA‘s solar energy potential is without parallel, and if properly harnessed, eventually can fuel all of
the Region‘s energy development needs.
Summary of MENA’s Total Renewable Energy Potential
Table 4.7 summarizes the potential renewable electricity resources in the MENA Region. Concentrated
solar power has a potential more than 200 times the likely demand in 2050.
44
Exclusion criteria fall into at least eight categories. The first has to do with terrain that is too rugged (slope greater
than 2.1 percent). A second criterion is based on land use and land cover for agriculture, forestry, or other uses
considered necessary for continued development. The third category was a population settlement density of greater
than 50 persons per square kilometer. The fourth exclusion category was hydrological: a surface covered by a fresh-
water body. Land was also excluded because it contained unstable geomorphology, fell within a protected area, or
hosted essential infrastructure. Finally, land that failed to meet technical design requirements—such as having a
minimum contiguous land area of 4 km2 or being located more than 5 km off shore. 45
In the analysis, a typical CSP plant is a 100 MW parabolic trough power plant with a solar multiple. Such plants
have a dimension of approximately 4 km². 46
Corresponding to about 10 m³ of desalinated water per m² of collector area
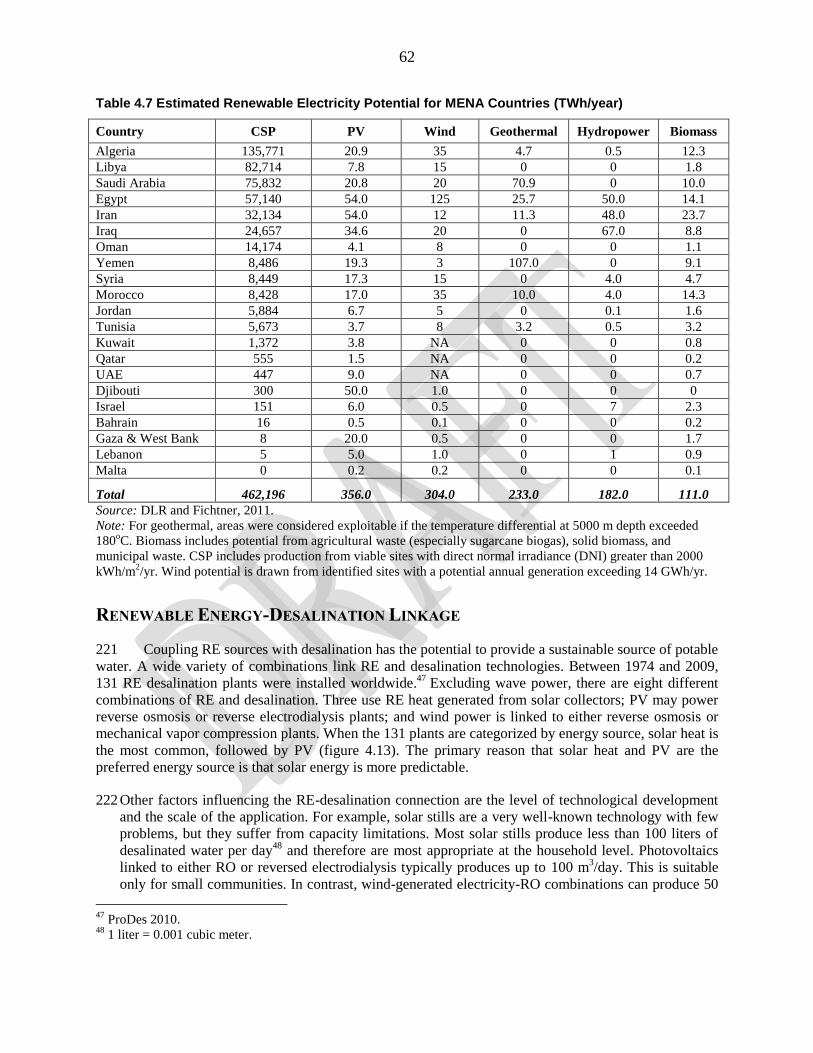
62
Table 4.7 Estimated Renewable Electricity Potential for MENA Countries (TWh/year)
Country CSP PV Wind Geothermal Hydropower Biomass
Algeria 135,771 20.9 35 4.7 0.5 12.3
Libya 82,714 7.8 15 0 0 1.8
Saudi Arabia 75,832 20.8 20 70.9 0 10.0
Egypt 57,140 54.0 125 25.7 50.0 14.1
Iran 32,134 54.0 12 11.3 48.0 23.7
Iraq 24,657 34.6 20 0 67.0 8.8
Oman 14,174 4.1 8 0 0 1.1
Yemen 8,486 19.3 3 107.0 0 9.1
Syria 8,449 17.3 15 0 4.0 4.7
Morocco 8,428 17.0 35 10.0 4.0 14.3
Jordan 5,884 6.7 5 0 0.1 1.6
Tunisia 5,673 3.7 8 3.2 0.5 3.2
Kuwait 1,372 3.8 NA 0 0 0.8
Qatar 555 1.5 NA 0 0 0.2
UAE 447 9.0 NA 0 0 0.7
Djibouti 300 50.0 1.0 0 0 0
Israel 151 6.0 0.5 0 7 2.3
Bahrain 16 0.5 0.1 0 0 0.2
Gaza & West Bank 8 20.0 0.5 0 0 1.7
Lebanon 5 5.0 1.0 0 1 0.9
Malta 0 0.2 0.2 0 0 0.1
Total 462,196 356.0 304.0 233.0 182.0 111.0
Source: DLR and Fichtner, 2011.
Note: For geothermal, areas were considered exploitable if the temperature differential at 5000 m depth exceeded
180oC. Biomass includes potential from agricultural waste (especially sugarcane biogas), solid biomass, and
municipal waste. CSP includes production from viable sites with direct normal irradiance (DNI) greater than 2000
kWh/m2/yr. Wind potential is drawn from identified sites with a potential annual generation exceeding 14 GWh/yr.
RENEWABLE ENERGY-DESALINATION LINKAGE
221 Coupling RE sources with desalination has the potential to provide a sustainable source of potable
water. A wide variety of combinations link RE and desalination technologies. Between 1974 and 2009,
131 RE desalination plants were installed worldwide.47
Excluding wave power, there are eight different
combinations of RE and desalination. Three use RE heat generated from solar collectors; PV may power
reverse osmosis or reverse electrodialysis plants; and wind power is linked to either reverse osmosis or
mechanical vapor compression plants. When the 131 plants are categorized by energy source, solar heat is
the most common, followed by PV (figure 4.13). The primary reason that solar heat and PV are the
preferred energy source is that solar energy is more predictable.
222 Other factors influencing the RE-desalination connection are the level of technological development
and the scale of the application. For example, solar stills are a very well-known technology with few
problems, but they suffer from capacity limitations. Most solar stills produce less than 100 liters of
desalinated water per day48
and therefore are most appropriate at the household level. Photovoltaics
linked to either RO or reversed electrodialysis typically produces up to 100 m3/day. This is suitable
only for small communities. In contrast, wind-generated electricity-RO combinations can produce 50
47
ProDes 2010. 48
1 liter = 0.001 cubic meter.
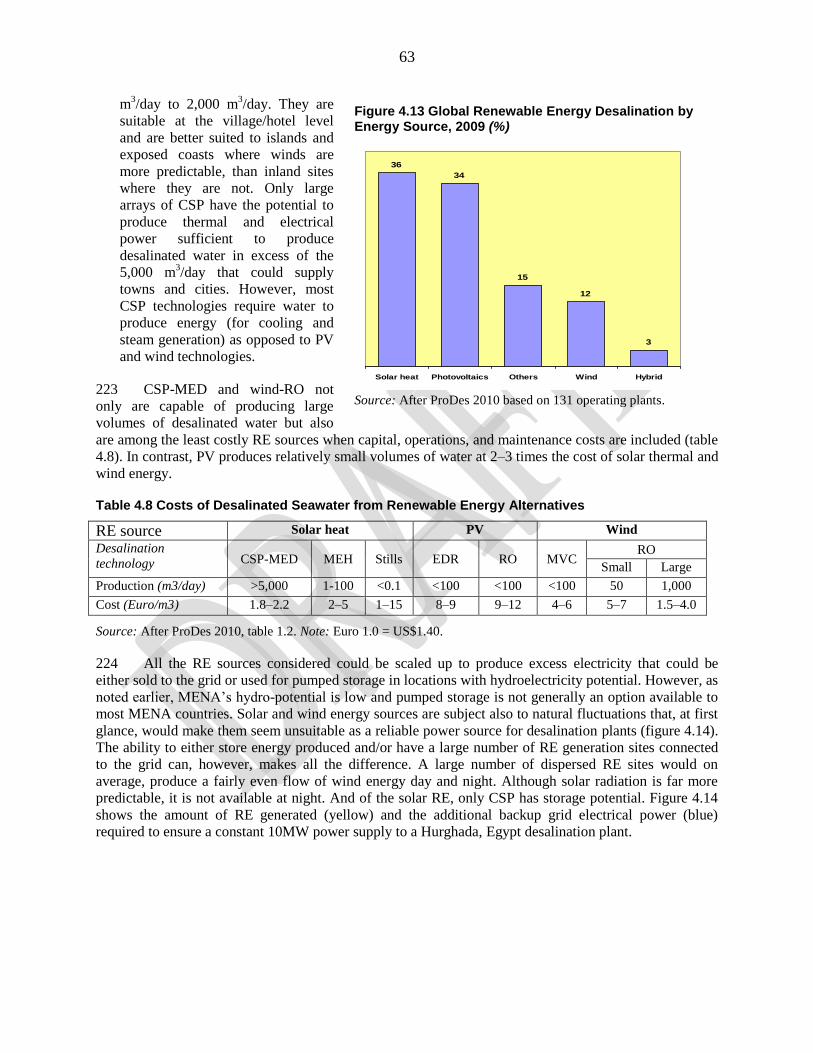
63
m3/day to 2,000 m
3/day. They are
suitable at the village/hotel level
and are better suited to islands and
exposed coasts where winds are
more predictable, than inland sites
where they are not. Only large
arrays of CSP have the potential to
produce thermal and electrical
power sufficient to produce
desalinated water in excess of the
5,000 m3/day that could supply
towns and cities. However, most
CSP technologies require water to
produce energy (for cooling and
steam generation) as opposed to PV
and wind technologies.
223 CSP-MED and wind-RO not
only are capable of producing large
volumes of desalinated water but also
are among the least costly RE sources when capital, operations, and maintenance costs are included (table
4.8). In contrast, PV produces relatively small volumes of water at 2–3 times the cost of solar thermal and
wind energy.
Table 4.8 Costs of Desalinated Seawater from Renewable Energy Alternatives
RE source Solar heat PV Wind
Desalination
technology CSP-MED MEH Stills EDR RO MVC RO
Small Large
Production (m3/day) >5,000 1-100 <0.1 <100 <100 <100 50 1,000
Cost (Euro/m3) 1.8–2.2 2–5 1–15 8–9 9–12 4–6 5–7 1.5–4.0
Source: After ProDes 2010, table 1.2. Note: Euro 1.0 = US$1.40.
224 All the RE sources considered could be scaled up to produce excess electricity that could be
either sold to the grid or used for pumped storage in locations with hydroelectricity potential. However, as
noted earlier, MENA‘s hydro-potential is low and pumped storage is not generally an option available to
most MENA countries. Solar and wind energy sources are subject also to natural fluctuations that, at first
glance, would make them seem unsuitable as a reliable power source for desalination plants (figure 4.14).
The ability to either store energy produced and/or have a large number of RE generation sites connected
to the grid can, however, makes all the difference. A large number of dispersed RE sites would on
average, produce a fairly even flow of wind energy day and night. Although solar radiation is far more
predictable, it is not available at night. And of the solar RE, only CSP has storage potential. Figure 4.14
shows the amount of RE generated (yellow) and the additional backup grid electrical power (blue)
required to ensure a constant 10MW power supply to a Hurghada, Egypt desalination plant.
Figure 4.13 Global Renewable Energy Desalination by Energy Source, 2009 (%)
Source: After ProDes 2010 based on 131 operating plants.
36
34
15
12
3
Solar heat Photovoltaics Others Wind Hybrid
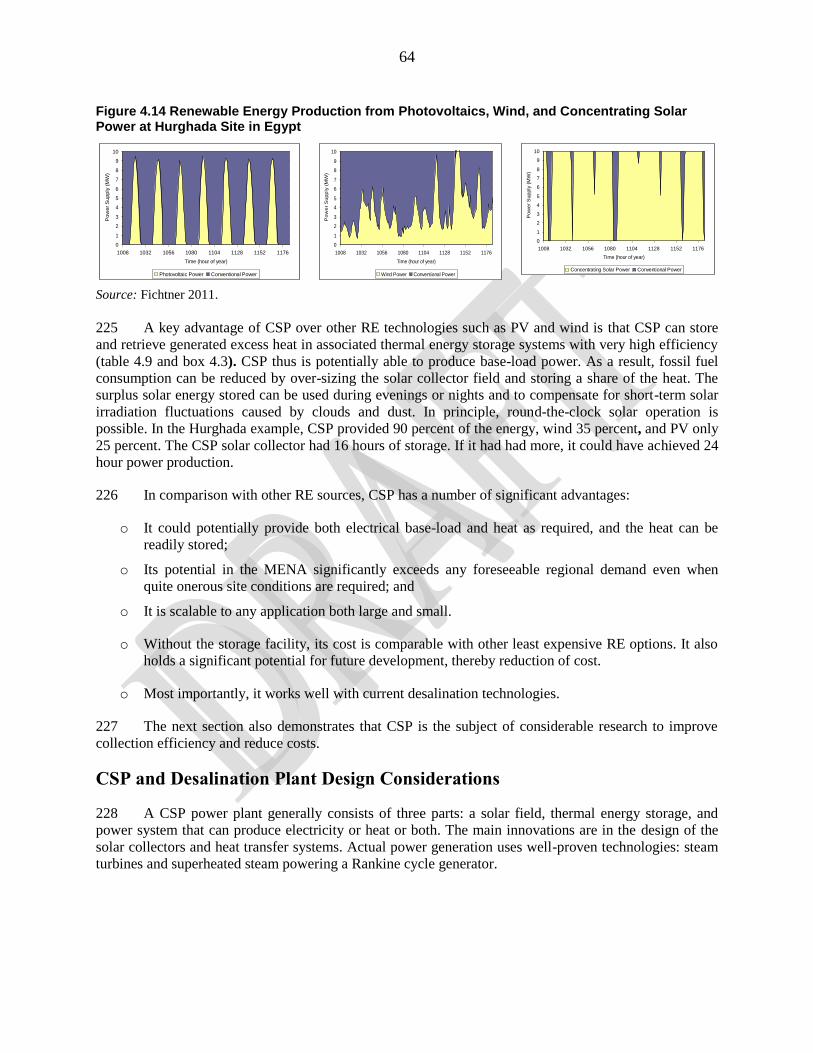
64
Figure 4.14 Renewable Energy Production from Photovoltaics, Wind, and Concentrating Solar Power at Hurghada Site in Egypt
Source: Fichtner 2011.
225 A key advantage of CSP over other RE technologies such as PV and wind is that CSP can store
and retrieve generated excess heat in associated thermal energy storage systems with very high efficiency
(table 4.9 and box 4.3). CSP thus is potentially able to produce base-load power. As a result, fossil fuel
consumption can be reduced by over-sizing the solar collector field and storing a share of the heat. The
surplus solar energy stored can be used during evenings or nights and to compensate for short-term solar
irradiation fluctuations caused by clouds and dust. In principle, round-the-clock solar operation is
possible. In the Hurghada example, CSP provided 90 percent of the energy, wind 35 percent, and PV only
25 percent. The CSP solar collector had 16 hours of storage. If it had had more, it could have achieved 24
hour power production.
226 In comparison with other RE sources, CSP has a number of significant advantages:
o It could potentially provide both electrical base-load and heat as required, and the heat can be
readily stored;
o Its potential in the MENA significantly exceeds any foreseeable regional demand even when
quite onerous site conditions are required; and
o It is scalable to any application both large and small.
o Without the storage facility, its cost is comparable with other least expensive RE options. It also
holds a significant potential for future development, thereby reduction of cost.
o Most importantly, it works well with current desalination technologies.
227 The next section also demonstrates that CSP is the subject of considerable research to improve
collection efficiency and reduce costs.
CSP and Desalination Plant Design Considerations
228 A CSP power plant generally consists of three parts: a solar field, thermal energy storage, and
power system that can produce electricity or heat or both. The main innovations are in the design of the
solar collectors and heat transfer systems. Actual power generation uses well-proven technologies: steam
turbines and superheated steam powering a Rankine cycle generator.
0
1
2
3
4
5
6
7
8
9
10
1008 1032 1056 1080 1104 1128 1152 1176
Time (hour of year)
Po
we
r S
up
ply
(M
W)
Photovoltaic Power Conventional Power
0
1
2
3
4
5
6
7
8
9
10
1008 1032 1056 1080 1104 1128 1152 1176
Time (hour of year)
Po
we
r S
up
ply
(M
W)
Wind Power Conventional Power
0
1
2
3
4
5
6
7
8
9
10
1008 1032 1056 1080 1104 1128 1152 1176
Time (hour of year)
Po
we
r S
up
ply
(M
W)
Concentrating Solar Power Conventional Power
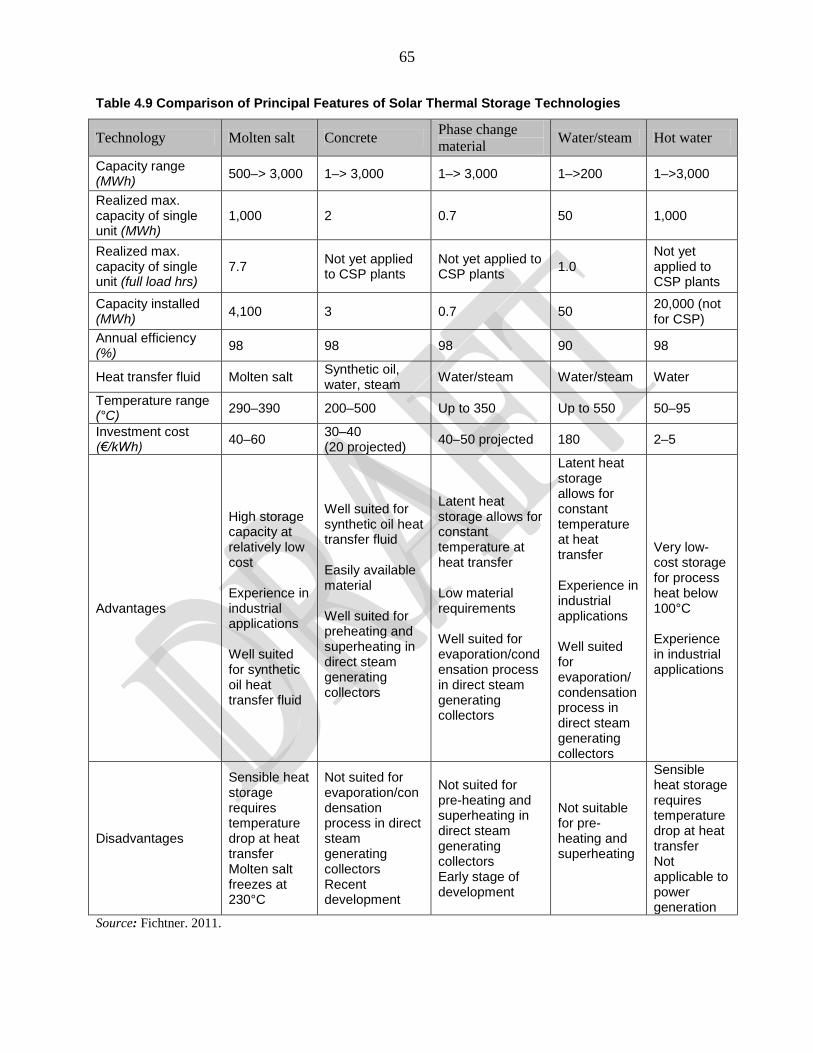
65
Table 4.9 Comparison of Principal Features of Solar Thermal Storage Technologies
Technology Molten salt Concrete Phase change
material Water/steam Hot water
Capacity range (MWh)
500–> 3,000 1–> 3,000 1–> 3,000 1–>200 1–>3,000
Realized max. capacity of single unit (MWh)
1,000 2 0.7 50 1,000
Realized max. capacity of single unit (full load hrs)
7.7 Not yet applied to CSP plants
Not yet applied to CSP plants
1.0 Not yet applied to CSP plants
Capacity installed (MWh)
4,100 3 0.7 50 20,000 (not for CSP)
Annual efficiency (%)
98 98 98 90 98
Heat transfer fluid Molten salt Synthetic oil, water, steam
Water/steam Water/steam Water
Temperature range (°C)
290–390 200–500 Up to 350 Up to 550 50–95
Investment cost (€/kWh)
40–60 30–40 (20 projected)
40–50 projected 180 2–5
Advantages
High storage capacity at relatively low cost Experience in industrial applications Well suited for synthetic oil heat transfer fluid
Well suited for synthetic oil heat transfer fluid Easily available material Well suited for preheating and superheating in direct steam generating collectors
Latent heat storage allows for constant temperature at heat transfer Low material requirements Well suited for evaporation/condensation process in direct steam generating collectors
Latent heat storage allows for constant temperature at heat transfer Experience in industrial applications Well suited for evaporation/ condensation process in direct steam generating collectors
Very low-cost storage for process heat below 100°C Experience in industrial applications
Disadvantages
Sensible heat storage requires temperature drop at heat transfer Molten salt freezes at 230°C
Not suited for evaporation/condensation process in direct steam generating collectors Recent development
Not suited for pre-heating and superheating in direct steam generating collectors Early stage of development
Not suitable for pre-heating and superheating
Sensible heat storage requires temperature drop at heat transfer Not applicable to power generation
Source: Fichtner. 2011.
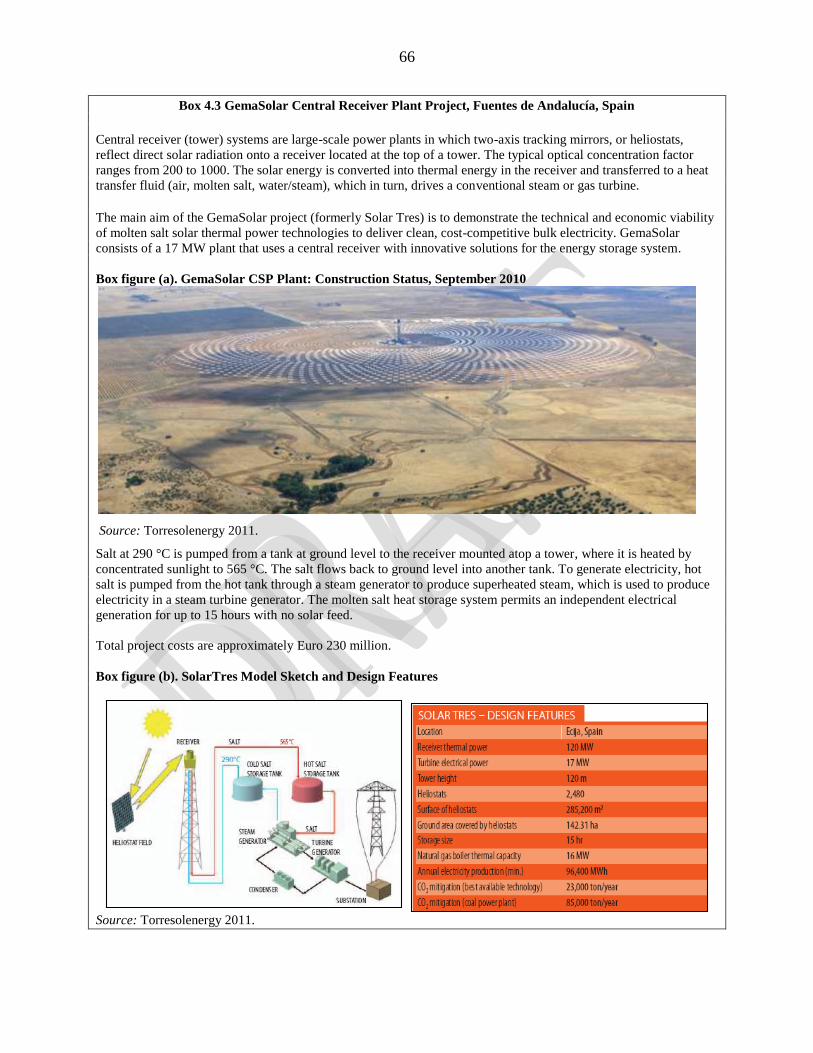
66
Box 4.3 GemaSolar Central Receiver Plant Project, Fuentes de Andalucía, Spain
Central receiver (tower) systems are large-scale power plants in which two-axis tracking mirrors, or heliostats,
reflect direct solar radiation onto a receiver located at the top of a tower. The typical optical concentration factor
ranges from 200 to 1000. The solar energy is converted into thermal energy in the receiver and transferred to a heat
transfer fluid (air, molten salt, water/steam), which in turn, drives a conventional steam or gas turbine.
The main aim of the GemaSolar project (formerly Solar Tres) is to demonstrate the technical and economic viability
of molten salt solar thermal power technologies to deliver clean, cost-competitive bulk electricity. GemaSolar
consists of a 17 MW plant that uses a central receiver with innovative solutions for the energy storage system.
Box figure (a). GemaSolar CSP Plant: Construction Status, September 2010
Source: Torresolenergy 2011.
Salt at 290 °C is pumped from a tank at ground level to the receiver mounted atop a tower, where it is heated by
concentrated sunlight to 565 °C. The salt flows back to ground level into another tank. To generate electricity, hot
salt is pumped from the hot tank through a steam generator to produce superheated steam, which is used to produce
electricity in a steam turbine generator. The molten salt heat storage system permits an independent electrical
generation for up to 15 hours with no solar feed.
Total project costs are approximately Euro 230 million.
Box figure (b). SolarTres Model Sketch and Design Features
Source: Torresolenergy 2011.
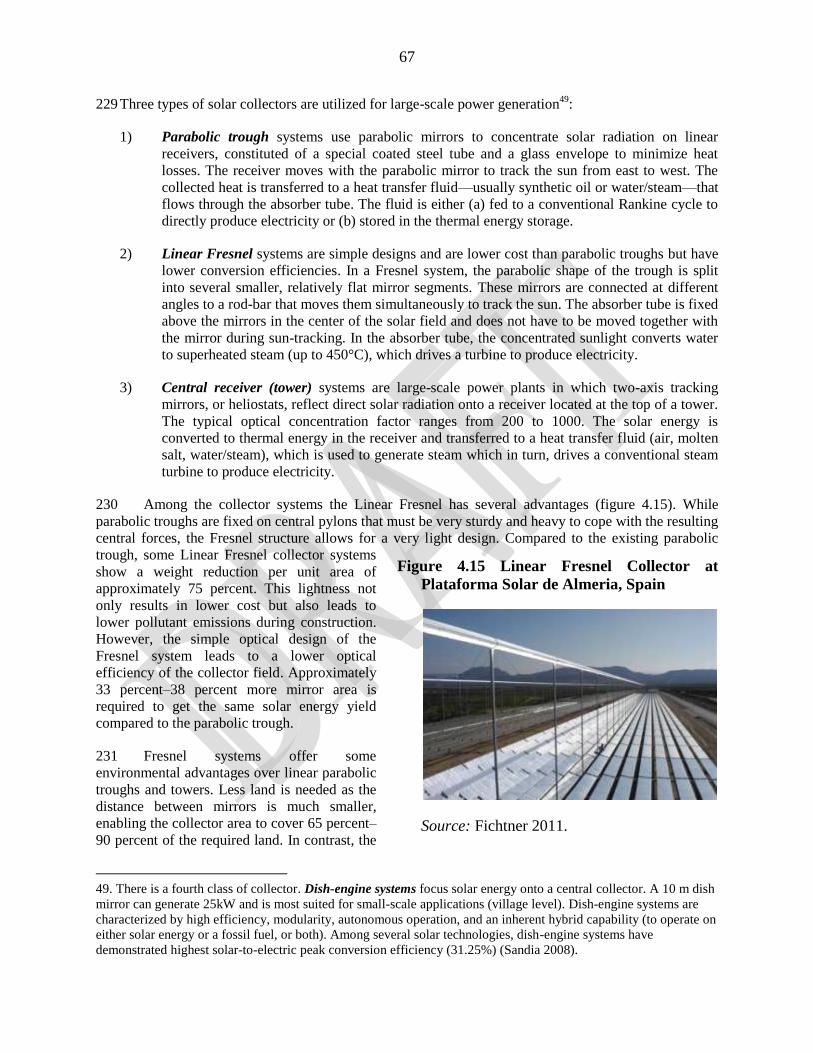
67
229 Three types of solar collectors are utilized for large-scale power generation49
:
1) Parabolic trough systems use parabolic mirrors to concentrate solar radiation on linear
receivers, constituted of a special coated steel tube and a glass envelope to minimize heat
losses. The receiver moves with the parabolic mirror to track the sun from east to west. The
collected heat is transferred to a heat transfer fluid––usually synthetic oil or water/steam––that
flows through the absorber tube. The fluid is either (a) fed to a conventional Rankine cycle to
directly produce electricity or (b) stored in the thermal energy storage.
2) Linear Fresnel systems are simple designs and are lower cost than parabolic troughs but have
lower conversion efficiencies. In a Fresnel system, the parabolic shape of the trough is split
into several smaller, relatively flat mirror segments. These mirrors are connected at different
angles to a rod-bar that moves them simultaneously to track the sun. The absorber tube is fixed
above the mirrors in the center of the solar field and does not have to be moved together with
the mirror during sun-tracking. In the absorber tube, the concentrated sunlight converts water
to superheated steam (up to 450°C), which drives a turbine to produce electricity.
3) Central receiver (tower) systems are large-scale power plants in which two-axis tracking
mirrors, or heliostats, reflect direct solar radiation onto a receiver located at the top of a tower.
The typical optical concentration factor ranges from 200 to 1000. The solar energy is
converted to thermal energy in the receiver and transferred to a heat transfer fluid (air, molten
salt, water/steam), which is used to generate steam which in turn, drives a conventional steam
turbine to produce electricity.
230 Among the collector systems the Linear Fresnel has several advantages (figure 4.15). While
parabolic troughs are fixed on central pylons that must be very sturdy and heavy to cope with the resulting
central forces, the Fresnel structure allows for a very light design. Compared to the existing parabolic
trough, some Linear Fresnel collector systems
show a weight reduction per unit area of
approximately 75 percent. This lightness not
only results in lower cost but also leads to
lower pollutant emissions during construction.
However, the simple optical design of the
Fresnel system leads to a lower optical
efficiency of the collector field. Approximately
33 percent–38 percent more mirror area is
required to get the same solar energy yield
compared to the parabolic trough.
231 Fresnel systems offer some
environmental advantages over linear parabolic
troughs and towers. Less land is needed as the
distance between mirrors is much smaller,
enabling the collector area to cover 65 percent–
90 percent of the required land. In contrast, the
49. There is a fourth class of collector. Dish-engine systems focus solar energy onto a central collector. A 10 m dish
mirror can generate 25kW and is most suited for small-scale applications (village level). Dish-engine systems are
characterized by high efficiency, modularity, autonomous operation, and an inherent hybrid capability (to operate on
either solar energy or a fossil fuel, or both). Among several solar technologies, dish-engine systems have
demonstrated highest solar-to-electric peak conversion efficiency (31.25%) (Sandia 2008).
Figure 4.15 Linear Fresnel Collector at
Plataforma Solar de Almeria, Spain
Source: Fichtner 2011.
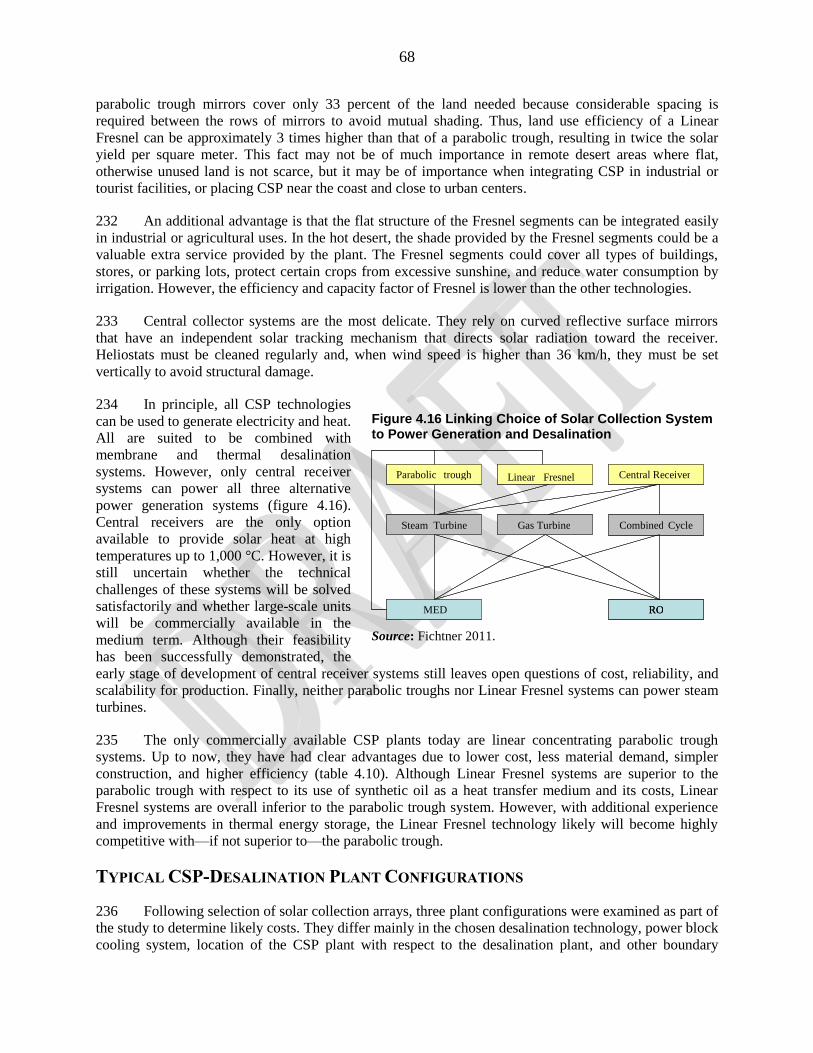
68
parabolic trough mirrors cover only 33 percent of the land needed because considerable spacing is
required between the rows of mirrors to avoid mutual shading. Thus, land use efficiency of a Linear
Fresnel can be approximately 3 times higher than that of a parabolic trough, resulting in twice the solar
yield per square meter. This fact may not be of much importance in remote desert areas where flat,
otherwise unused land is not scarce, but it may be of importance when integrating CSP in industrial or
tourist facilities, or placing CSP near the coast and close to urban centers.
232 An additional advantage is that the flat structure of the Fresnel segments can be integrated easily
in industrial or agricultural uses. In the hot desert, the shade provided by the Fresnel segments could be a
valuable extra service provided by the plant. The Fresnel segments could cover all types of buildings,
stores, or parking lots, protect certain crops from excessive sunshine, and reduce water consumption by
irrigation. However, the efficiency and capacity factor of Fresnel is lower than the other technologies.
233 Central collector systems are the most delicate. They rely on curved reflective surface mirrors
that have an independent solar tracking mechanism that directs solar radiation toward the receiver.
Heliostats must be cleaned regularly and, when wind speed is higher than 36 km/h, they must be set
vertically to avoid structural damage.
234 In principle, all CSP technologies
can be used to generate electricity and heat.
All are suited to be combined with
membrane and thermal desalination
systems. However, only central receiver
systems can power all three alternative
power generation systems (figure 4.16).
Central receivers are the only option
available to provide solar heat at high
temperatures up to 1,000 °C. However, it is
still uncertain whether the technical
challenges of these systems will be solved
satisfactorily and whether large-scale units
will be commercially available in the
medium term. Although their feasibility
has been successfully demonstrated, the
early stage of development of central receiver systems still leaves open questions of cost, reliability, and
scalability for production. Finally, neither parabolic troughs nor Linear Fresnel systems can power steam
turbines.
235 The only commercially available CSP plants today are linear concentrating parabolic trough
systems. Up to now, they have had clear advantages due to lower cost, less material demand, simpler
construction, and higher efficiency (table 4.10). Although Linear Fresnel systems are superior to the
parabolic trough with respect to its use of synthetic oil as a heat transfer medium and its costs, Linear
Fresnel systems are overall inferior to the parabolic trough system. However, with additional experience
and improvements in thermal energy storage, the Linear Fresnel technology likely will become highly
competitive with—if not superior to––the parabolic trough.
TYPICAL CSP-DESALINATION PLANT CONFIGURATIONS
236 Following selection of solar collection arrays, three plant configurations were examined as part of
the study to determine likely costs. They differ mainly in the chosen desalination technology, power block
cooling system, location of the CSP plant with respect to the desalination plant, and other boundary
Figure 4.16 Linking Choice of Solar Collection System to Power Generation and Desalination
Source: Fichtner 2011.
MED RO
Parabolic Trough Central Receiver Linear Fresnel
Steam Turbine Gas Turbine Combined Cycle
MED RO
Parabolic trough Central Receiver Linear Fresnel
Steam Turbine Gas Turbine Combined Cycle
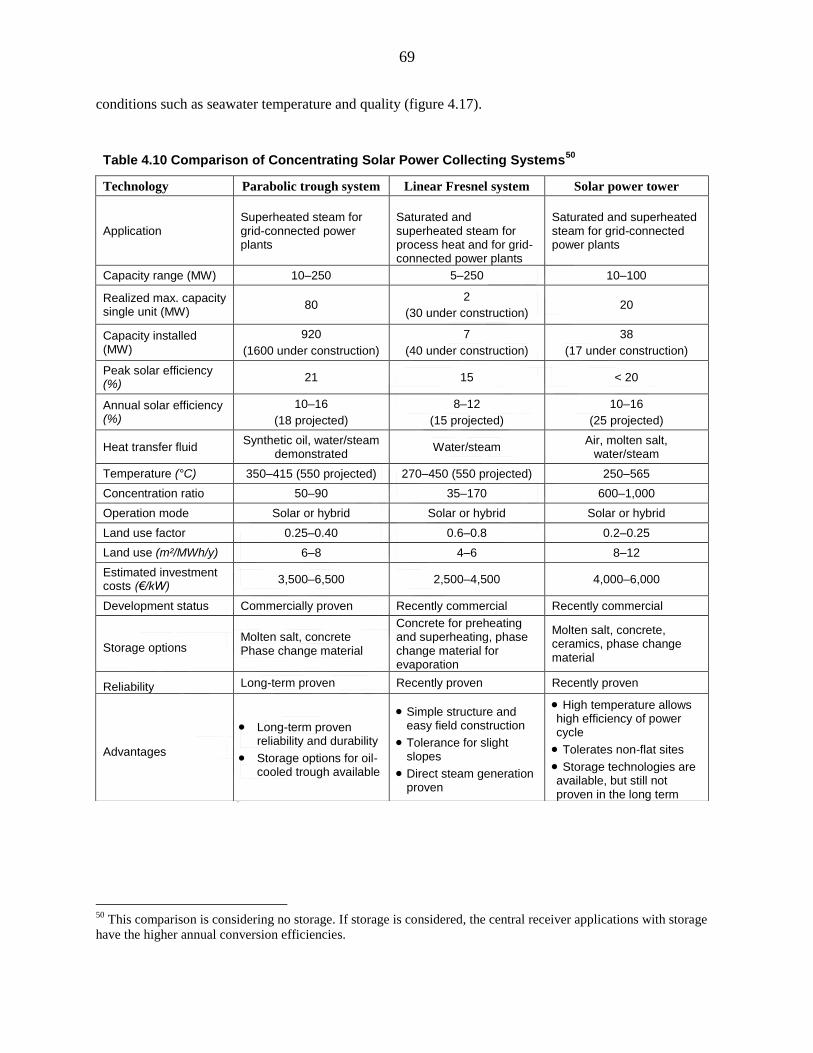
69
conditions such as seawater temperature and quality (figure 4.17).
50
This comparison is considering no storage. If storage is considered, the central receiver applications with storage
have the higher annual conversion efficiencies.
Table 4.10 Comparison of Concentrating Solar Power Collecting Systems50
Technology Parabolic trough system Linear Fresnel system Solar power tower
Application Superheated steam for grid-connected power plants
Saturated and superheated steam for process heat and for grid-connected power plants
Saturated and superheated steam for grid-connected power plants
Capacity range (MW) 10–250 5–250 10–100
Realized max. capacity single unit (MW)
80 2
(30 under construction) 20
Capacity installed (MW)
920
(1600 under construction)
7
(40 under construction)
38
(17 under construction)
Peak solar efficiency (%)
21 15 < 20
Annual solar efficiency (%)
10–16
(18 projected)
8–12
(15 projected)
10–16
(25 projected)
Heat transfer fluid Synthetic oil, water/steam
demonstrated Water/steam
Air, molten salt, water/steam
Temperature (°C) 350–415 (550 projected) 270–450 (550 projected) 250–565
Concentration ratio 50–90 35–170 600–1,000
Operation mode Solar or hybrid Solar or hybrid Solar or hybrid
Land use factor 0.25–0.40 0.6–0.8 0.2–0.25
Land use (m²/MWh/y) 6–8 4–6 8–12
Estimated investment costs (€/kW)
3,500–6,500 2,500–4,500 4,000–6,000
Development status Commercially proven Recently commercial Recently commercial
Storage options Molten salt, concrete Phase change material
Concrete for preheating and superheating, phase change material for evaporation
Molten salt, concrete, ceramics, phase change material
Reliability Long-term proven Recently proven Recently proven
Advantages
Long-term proven reliability and durability
Storage options for oil-cooled trough available
Simple structure and easy field construction
Tolerance for slight slopes
Direct steam generation proven
High temperature allows high efficiency of power cycle
Tolerates non-flat sites
Storage technologies are available, but still not proven in the long term
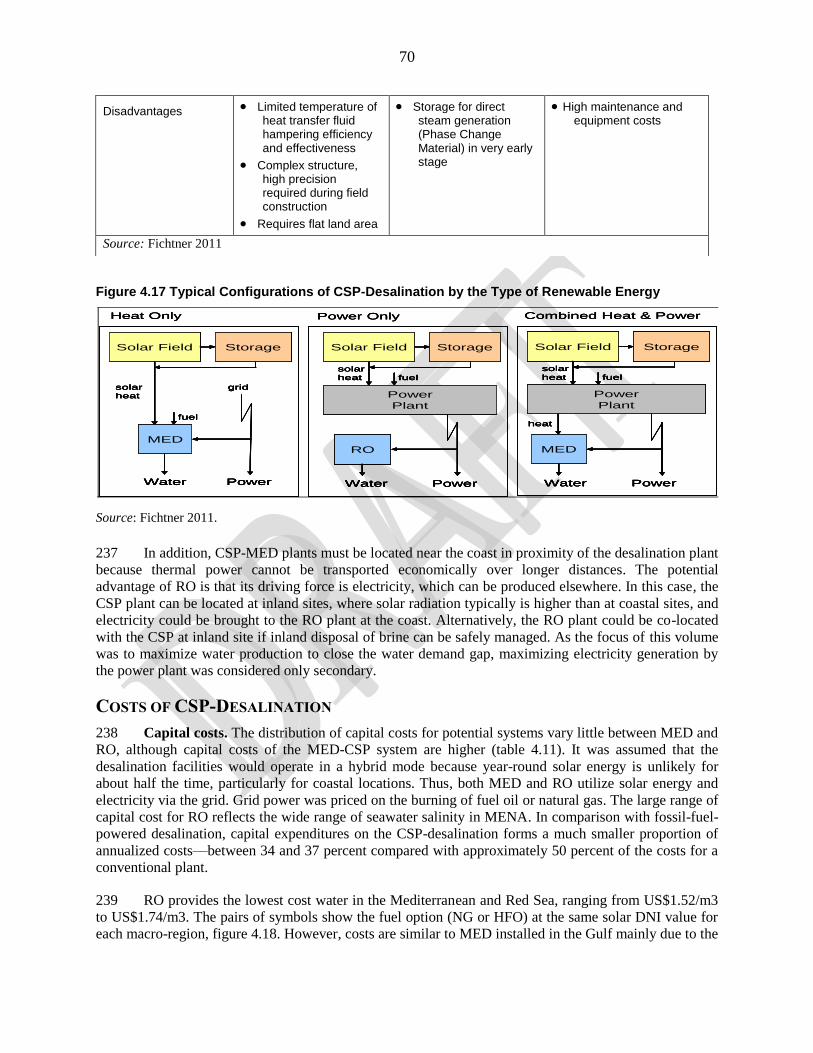
70
237 In addition, CSP-MED plants must be located near the coast in proximity of the desalination plant
because thermal power cannot be transported economically over longer distances. The potential
advantage of RO is that its driving force is electricity, which can be produced elsewhere. In this case, the
CSP plant can be located at inland sites, where solar radiation typically is higher than at coastal sites, and
electricity could be brought to the RO plant at the coast. Alternatively, the RO plant could be co-located
with the CSP at inland site if inland disposal of brine can be safely managed. As the focus of this volume
was to maximize water production to close the water demand gap, maximizing electricity generation by
the power plant was considered only secondary.
COSTS OF CSP-DESALINATION
238 Capital costs. The distribution of capital costs for potential systems vary little between MED and
RO, although capital costs of the MED-CSP system are higher (table 4.11). It was assumed that the
desalination facilities would operate in a hybrid mode because year-round solar energy is unlikely for
about half the time, particularly for coastal locations. Thus, both MED and RO utilize solar energy and
electricity via the grid. Grid power was priced on the burning of fuel oil or natural gas. The large range of
capital cost for RO reflects the wide range of seawater salinity in MENA. In comparison with fossil-fuel-
powered desalination, capital expenditures on the CSP-desalination forms a much smaller proportion of
annualized costs––between 34 and 37 percent compared with approximately 50 percent of the costs for a
conventional plant.
239 RO provides the lowest cost water in the Mediterranean and Red Sea, ranging from US$1.52/m3
to US$1.74/m3. The pairs of symbols show the fuel option (NG or HFO) at the same solar DNI value for
each macro-region, figure 4.18. However, costs are similar to MED installed in the Gulf mainly due to the
Disadvantages Limited temperature of heat transfer fluid hampering efficiency and effectiveness
Complex structure, high precision required during field construction
Requires flat land area
Storage for direct steam generation (Phase Change Material) in very early stage
High maintenance and equipment costs
Source: Fichtner 2011
Figure 4.17 Typical Configurations of CSP-Desalination by the Type of Renewable Energy
Source: Fichtner 2011.
MED
Solar Field Storage
Power
Plant
Water Power
fuel
solar
heat
heat
Combined Heat & Power
RO
Solar Field Storage
Power
Plant
Water Power
fuel
solar
heat
Power Only
Solar Field Storage
MED
fuel
solar
heat
Water Power
grid
Heat Only
MED
Solar Field Storage
Power
Plant
Water Power
fuel
solar
heat
heat
Combined Heat & Power
MED
Solar Field Storage
Power
Plant
Water Power
fuel
solar
heat
heat
MED
Solar Field Storage
Power
Plant
Water Power
fuel
solar
heat
heat
Combined Heat & Power
RO
Solar Field Storage
Power
Plant
Water Power
fuel
solar
heat
Power Only
RO
Solar Field Storage
Power
Plant
Water Power
fuel
solar
heat
RO
Solar Field Storage
Power
Plant
Water Power
fuel
solar
heat
Power Only
Solar Field Storage
MED
fuel
solar
heat
Water Power
grid
Heat Only
Solar Field Storage
MED
fuel
solar
heat
Water Power
grid
Solar Field Storage
MED
fuel
solar
heat
Water Power
grid
Heat Only
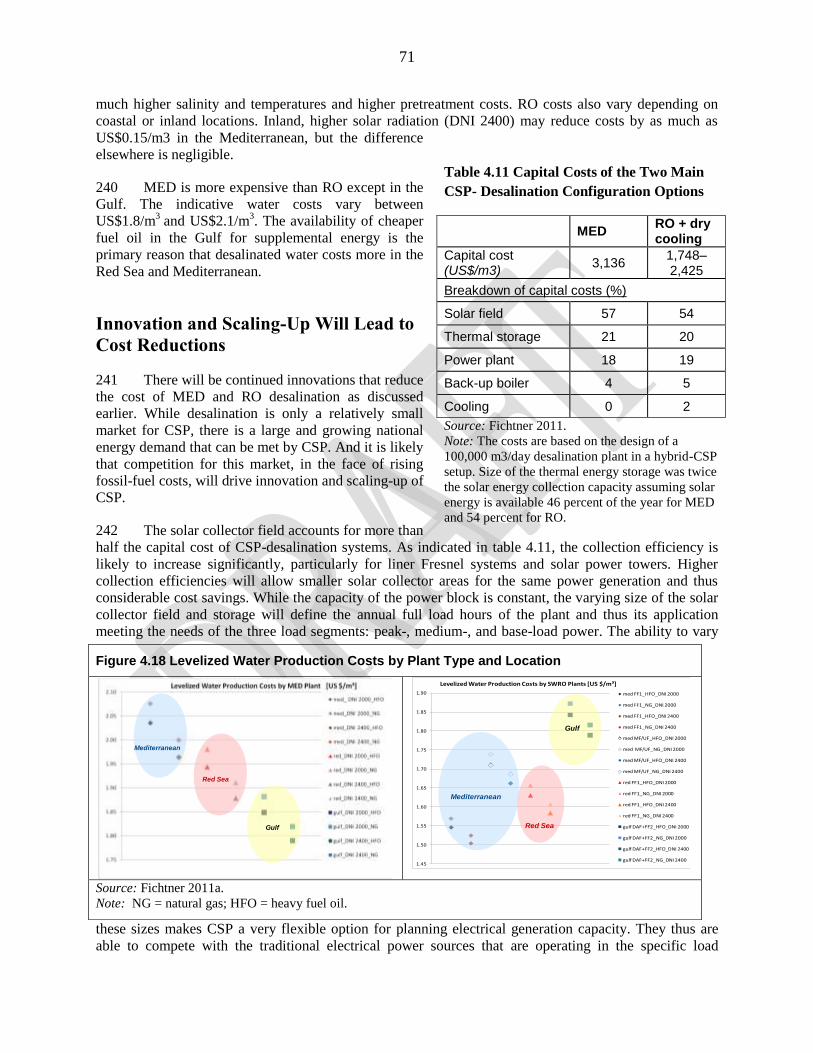
71
much higher salinity and temperatures and higher pretreatment costs. RO costs also vary depending on
coastal or inland locations. Inland, higher solar radiation (DNI 2400) may reduce costs by as much as
US$0.15/m3 in the Mediterranean, but the difference
elsewhere is negligible.
240 MED is more expensive than RO except in the
Gulf. The indicative water costs vary between
US$1.8/m3
and US$2.1/m3. The availability of cheaper
fuel oil in the Gulf for supplemental energy is the
primary reason that desalinated water costs more in the
Red Sea and Mediterranean.
Innovation and Scaling-Up Will Lead to
Cost Reductions
241 There will be continued innovations that reduce
the cost of MED and RO desalination as discussed
earlier. While desalination is only a relatively small
market for CSP, there is a large and growing national
energy demand that can be met by CSP. And it is likely
that competition for this market, in the face of rising
fossil-fuel costs, will drive innovation and scaling-up of
CSP.
242 The solar collector field accounts for more than
half the capital cost of CSP-desalination systems. As indicated in table 4.11, the collection efficiency is
likely to increase significantly, particularly for liner Fresnel systems and solar power towers. Higher
collection efficiencies will allow smaller solar collector areas for the same power generation and thus
considerable cost savings. While the capacity of the power block is constant, the varying size of the solar
collector field and storage will define the annual full load hours of the plant and thus its application
meeting the needs of the three load segments: peak-, medium-, and base-load power. The ability to vary
these sizes makes CSP a very flexible option for planning electrical generation capacity. They thus are
able to compete with the traditional electrical power sources that are operating in the specific load
Table 4.11 Capital Costs of the Two Main
CSP- Desalination Configuration Options
MED
RO + dry cooling
Capital cost (US$/m3)
3,136 1,748–2,425
Breakdown of capital costs (%)
Solar field 57 54
Thermal storage 21 20
Power plant 18 19
Back-up boiler 4 5
Cooling 0 2
Source: Fichtner 2011.
Note: The costs are based on the design of a
100,000 m3/day desalination plant in a hybrid-CSP
setup. Size of the thermal energy storage was twice
the solar energy collection capacity assuming solar
energy is available 46 percent of the year for MED
and 54 percent for RO.
Figure 4.18 Levelized Water Production Costs by Plant Type and Location
Source: Fichtner 2011a.
Note: NG = natural gas; HFO = heavy fuel oil.
Mediterranean
Red Sea
Gulf
1.45
1.50
1.55
1.60
1.65
1.70
1.75
1.80
1.85
1.90
Levelized Water Production Costs by SWRO Plants [US $/m³]
med FF1_HFO_DNI 2000
med FF1_NG_DNI 2000
med FF1_HFO_DNI 2400
med FF1_NG_DNI 2400
med MF/UF_HFO_DNI 2000
med MF/UF_NG_DNI 2000
med MF/UF_HFO_DNI 2400
med MF/UF_NG_DNI 2400
red FF1_HFO_DNI 2000
red FF1_NG_DNI 2000
red FF1_HFO_DNI 2400
red FF1_NG_DNI 2400
gulf DAF+FF2_HFO_DNI 2000
gulf DAF+FF2_NG_DNI 2000
gulf DAF+FF2_HFO_DNI 2400
gulf DAF+FF2_NG_DNI 2400
Red Sea
Mediterranean
Gulf
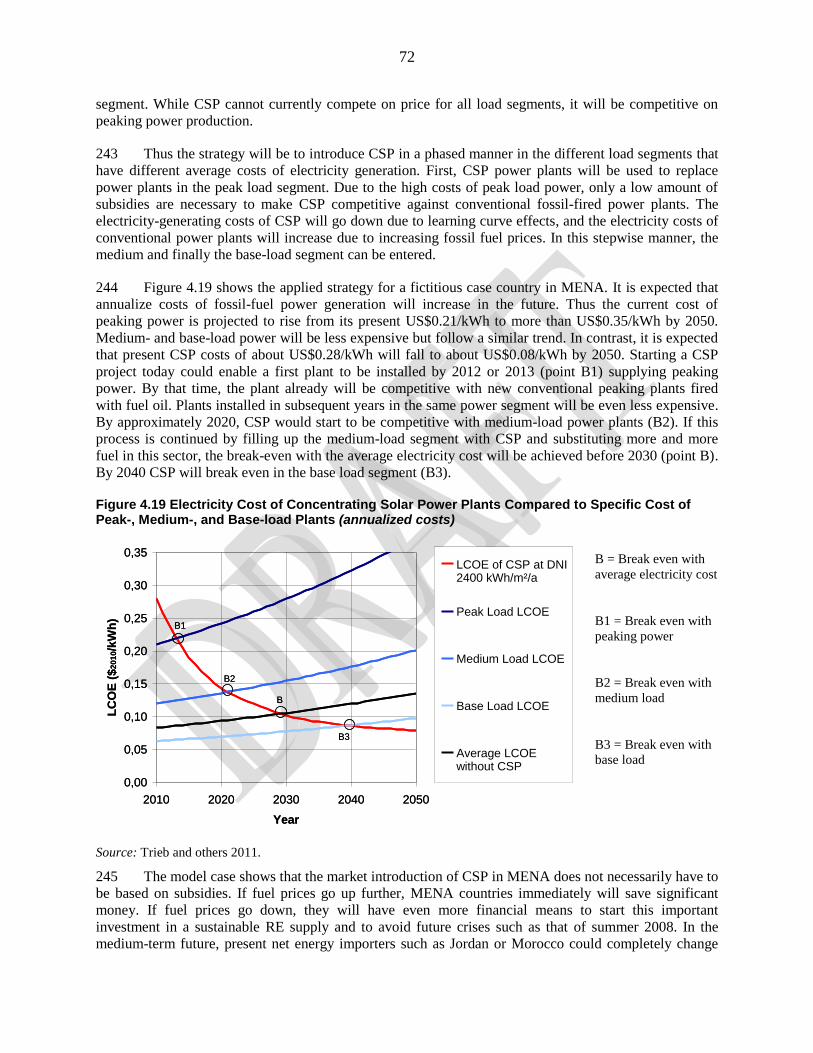
72
segment. While CSP cannot currently compete on price for all load segments, it will be competitive on
peaking power production.
243 Thus the strategy will be to introduce CSP in a phased manner in the different load segments that
have different average costs of electricity generation. First, CSP power plants will be used to replace
power plants in the peak load segment. Due to the high costs of peak load power, only a low amount of
subsidies are necessary to make CSP competitive against conventional fossil-fired power plants. The
electricity-generating costs of CSP will go down due to learning curve effects, and the electricity costs of
conventional power plants will increase due to increasing fossil fuel prices. In this stepwise manner, the
medium and finally the base-load segment can be entered.
244 Figure 4.19 shows the applied strategy for a fictitious case country in MENA. It is expected that
annualize costs of fossil-fuel power generation will increase in the future. Thus the current cost of
peaking power is projected to rise from its present US$0.21/kWh to more than US$0.35/kWh by 2050.
Medium- and base-load power will be less expensive but follow a similar trend. In contrast, it is expected
that present CSP costs of about US$0.28/kWh will fall to about US$0.08/kWh by 2050. Starting a CSP
project today could enable a first plant to be installed by 2012 or 2013 (point B1) supplying peaking
power. By that time, the plant already will be competitive with new conventional peaking plants fired
with fuel oil. Plants installed in subsequent years in the same power segment will be even less expensive.
By approximately 2020, CSP would start to be competitive with medium-load power plants (B2). If this
process is continued by filling up the medium-load segment with CSP and substituting more and more
fuel in this sector, the break-even with the average electricity cost will be achieved before 2030 (point B).
By 2040 CSP will break even in the base load segment (B3).
Figure 4.19 Electricity Cost of Concentrating Solar Power Plants Compared to Specific Cost of Peak-, Medium-, and Base-load Plants (annualized costs)
B = Break even with
average electricity cost
B1 = Break even with
peaking power
B2 = Break even with
medium load
B3 = Break even with
base load
Source: Trieb and others 2011.
245 The model case shows that the market introduction of CSP in MENA does not necessarily have to
be based on subsidies. If fuel prices go up further, MENA countries immediately will save significant
money. If fuel prices go down, they will have even more financial means to start this important
investment in a sustainable RE supply and to avoid future crises such as that of summer 2008. In the
medium-term future, present net energy importers such as Jordan or Morocco could completely change
0,00
0,05
0,10
0,15
0,20
0,25
0,30
0,35
2010 2020 2030 2040 2050
Year
LC
OE
($
20
10/k
Wh
)
LCOE of CSP at DNI2400 kWh/m²/a
Peak Load LCOE
Medium Load LCOE
Base Load LCOE
Average LCOEwithout CSP
B
B1
B2
B3
0,00
0,05
0,10
0,15
0,20
0,25
0,30
0,35
2010 2020 2030 2040 2050
Year
LC
OE
($
20
10/k
Wh
)
LCOE of CSP at DNI2400 kWh/m²/a
Peak Load LCOE
Medium Load LCOE
Base Load LCOE
Average LCOEwithout CSP
B
B1
B2
B3
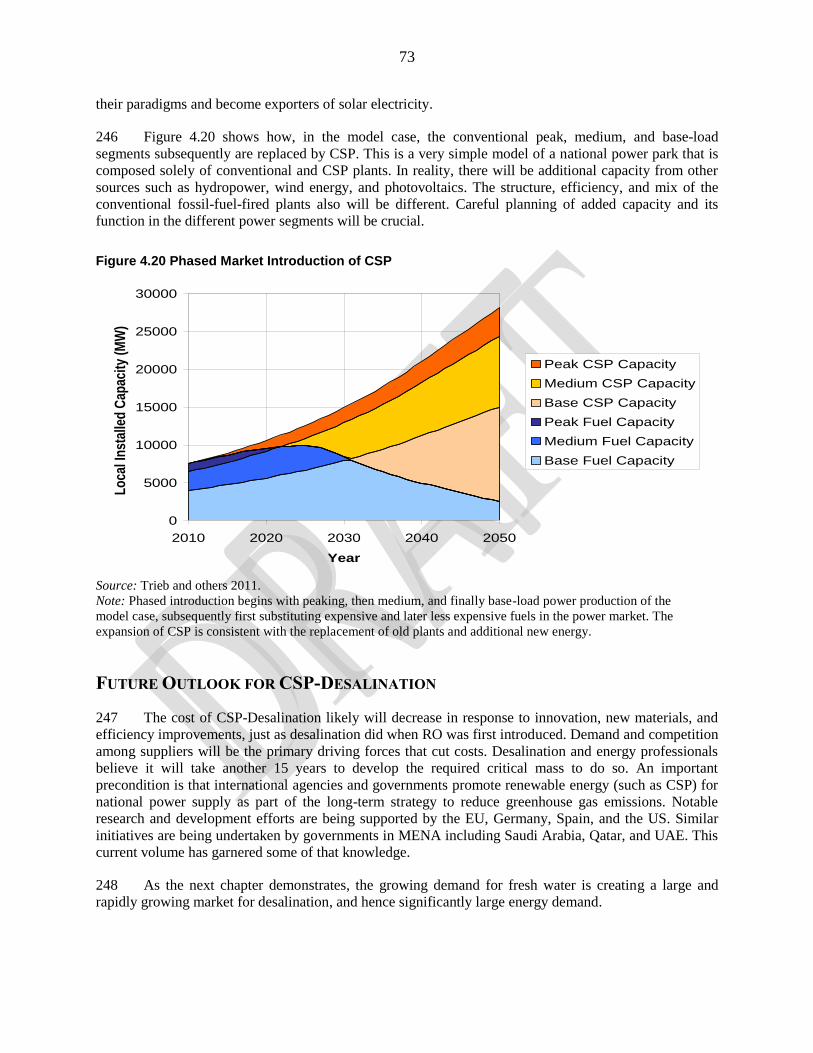
73
their paradigms and become exporters of solar electricity.
246 Figure 4.20 shows how, in the model case, the conventional peak, medium, and base-load
segments subsequently are replaced by CSP. This is a very simple model of a national power park that is
composed solely of conventional and CSP plants. In reality, there will be additional capacity from other
sources such as hydropower, wind energy, and photovoltaics. The structure, efficiency, and mix of the
conventional fossil-fuel-fired plants also will be different. Careful planning of added capacity and its
function in the different power segments will be crucial.
Figure 4.20 Phased Market Introduction of CSP
Source: Trieb and others 2011.
Note: Phased introduction begins with peaking, then medium, and finally base-load power production of the
model case, subsequently first substituting expensive and later less expensive fuels in the power market. The
expansion of CSP is consistent with the replacement of old plants and additional new energy.
FUTURE OUTLOOK FOR CSP-DESALINATION
247 The cost of CSP-Desalination likely will decrease in response to innovation, new materials, and
efficiency improvements, just as desalination did when RO was first introduced. Demand and competition
among suppliers will be the primary driving forces that cut costs. Desalination and energy professionals
believe it will take another 15 years to develop the required critical mass to do so. An important
precondition is that international agencies and governments promote renewable energy (such as CSP) for
national power supply as part of the long-term strategy to reduce greenhouse gas emissions. Notable
research and development efforts are being supported by the EU, Germany, Spain, and the US. Similar
initiatives are being undertaken by governments in MENA including Saudi Arabia, Qatar, and UAE. This
current volume has garnered some of that knowledge.
248 As the next chapter demonstrates, the growing demand for fresh water is creating a large and
rapidly growing market for desalination, and hence significantly large energy demand.
0
5000
10000
15000
20000
25000
30000
2010 2020 2030 2040 2050
Year
Lo
cal I
nst
alle
d C
apac
ity
(MW
) .
Peak CSP Capacity
Medium CSP Capacity
Base CSP Capacity
Peak Fuel Capacity
Medium Fuel Capacity
Base Fuel Capacity
74
5. CLOSING THE WATER DEMAND GAP
Overview
249 The widening gap between the demand and supply of water poses a serious threat to the
sustainable growth of the MENA Region. Lack of water of sufficient quantity and quality affects
economic growth, food security, employment opportunities, and overall quality of life in urban and rural
areas. Inadequate potable water supplies also can contribute to or cause conflicts over water. To maintain
healthy and sustainable growth, the burgeoning water demand gap in the Region must be bridged.
250 Key approaches to meeting the water scarcity challenge include rational management and use of
available water resources and augmentation of water supplies (box 5.1). Best practices combine both
elements in an integrated approach to water resources management. However, solutions to deal with water
scarcity for each country or city will vary due to different local circumstances.
Box 5.1 Key Approaches to Meet the Water Demand Gap
Demand Management Every drop of water saved is a drop of water added to the supply. Rationalization of tariffs and subsidies in the
provision of water services, and improving sector regulation and their enforcement are elements critical to improve
the efficient use of scarce resources. Such rationalization of demand also will reduce the need to use scarce public
funds. For example, if Cairo could reduce losses of its domestic water supply to best practice levels, the current cost
of serving its population would fall from US$150 million to US$60 (World Bank 2007). Enhancing the enabling
environment to support a move toward more efficient water use will require governments to take four actions. They
are to (1) address the current institutional fragmentation, (2) improve planning procedures, (3) increase capacity to
systematically collect and analyze data to guide planning and decision making in the water sector, and (4) increase
awareness among their populations about the long-term consequences of water scarcity. Strengthening enabling
environments also will require a concerted effort to address systemic issues that promote overuse of water resources
such as energy subsidies and lack of incentives to conserve water and use it to generate maximum economic benefits
for the society.
Supply Management
Given the Region‘s widening water demand gap and dwindling resource base, additional ―new‖ water needs to be
part of the strategic water supply portfolio. Addressing water scarcity also will require an increase in the supply of
water resources through introducing and/or scaling up technologies to enhance the quantity and quality of water
supply. Improved water supply can be achieved through desalination and implementing wastewater reuse. Reducing
environmental degradation through improved wastewater collection and treatment and other pollution control
measures also will increase the quality and usability of existing water resources.
251 Ideally, demand and supply management decisions are based on the planning objective of
maximizing the net economic, environmental and social benefits to the society as a whole. While this
objective can be readily applied for single countries, it is exceedingly difficult to apply for all 21 MENA
countries combined because there are widely divergent views on which environmental and social benefits
should be given priority in planning water resources development. Consequently, this volume adopts the
least cost principle as the first step to identify which demand and supply management options could be
adopted in the Regional water strategy. The study also placed a high priority on reducing unsustainable
groundwater mining. It will be the task of later detailed follow-up studies at the country level to include
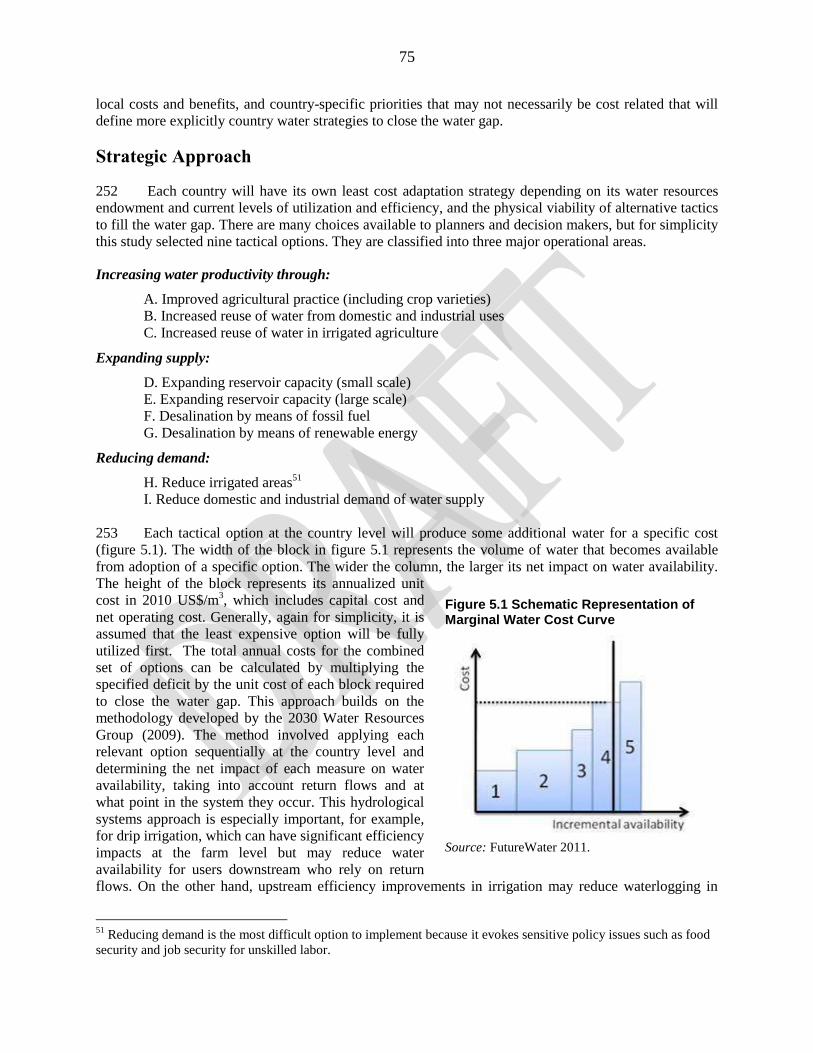
75
local costs and benefits, and country-specific priorities that may not necessarily be cost related that will
define more explicitly country water strategies to close the water gap.
Strategic Approach
252 Each country will have its own least cost adaptation strategy depending on its water resources
endowment and current levels of utilization and efficiency, and the physical viability of alternative tactics
to fill the water gap. There are many choices available to planners and decision makers, but for simplicity
this study selected nine tactical options. They are classified into three major operational areas.
Increasing water productivity through:
A. Improved agricultural practice (including crop varieties)
B. Increased reuse of water from domestic and industrial uses
C. Increased reuse of water in irrigated agriculture
Expanding supply:
D. Expanding reservoir capacity (small scale)
E. Expanding reservoir capacity (large scale)
F. Desalination by means of fossil fuel
G. Desalination by means of renewable energy
Reducing demand:
H. Reduce irrigated areas51
I. Reduce domestic and industrial demand of water supply
253 Each tactical option at the country level will produce some additional water for a specific cost
(figure 5.1). The width of the block in figure 5.1 represents the volume of water that becomes available
from adoption of a specific option. The wider the column, the larger its net impact on water availability.
The height of the block represents its annualized unit
cost in 2010 US$/m3, which includes capital cost and
net operating cost. Generally, again for simplicity, it is
assumed that the least expensive option will be fully
utilized first. The total annual costs for the combined
set of options can be calculated by multiplying the
specified deficit by the unit cost of each block required
to close the water gap. This approach builds on the
methodology developed by the 2030 Water Resources
Group (2009). The method involved applying each
relevant option sequentially at the country level and
determining the net impact of each measure on water
availability, taking into account return flows and at
what point in the system they occur. This hydrological
systems approach is especially important, for example,
for drip irrigation, which can have significant efficiency
impacts at the farm level but may reduce water
availability for users downstream who rely on return
flows. On the other hand, upstream efficiency improvements in irrigation may reduce waterlogging in
51
Reducing demand is the most difficult option to implement because it evokes sensitive policy issues such as food
security and job security for unskilled labor.
Figure 5.1 Schematic Representation of Marginal Water Cost Curve
Source: FutureWater 2011.
76
downstream areas of irrigation schemes.
254 The marginal cost-curve approach provides information on what the potential cost would be of
adopting a set of tactical options that comprise the strategy to close the demand gap, which in turn could
be used to inform policy design. The tactical approach does not include or evaluate policies that would be
used to enable, incentivize, or enforce the adoption of these measures such as pricing, standards, and
behavioral changes. In practice, cost is not the only basis on which choices are made.
255 The least costly alternative may not be used first because of the need for extensive consultation or
other considerations. For example, water from a new dam may be relatively inexpensive, but the long lead
time to meet environmental management concerns may preclude its effectiveness for several years.
Similarly, building local water user institutions to implement improved water use efficiency interventions
may take several years. Finally, the least cost approach to securing water supply does not seek to
decommission environmentally unfriendly water supply infrastructure. If large traditional fossil-fuel-
powered desalination plants have considerable economic life remaining, few governments would abandon
them for cheaper and more environmentally friendly technology.
256 Bearing these limitations in mind, shedding light on the cost and technical potential of tactical
options enables these measures to be compared and evaluated in a common context. The cost curve, then,
is not prescriptive: it does not represent a fixed plan for closing the supply-demand gap. Rather, it is a tool
to help decision makers understand and compare different options to close the unmet gap under a given
demand scenario.
UNIT COSTS OF THESE OPTIONS
257 The unit cost of each measure in the future is uncertain, and they are likely to differ by country.
These difficulties are discussed in more detail below.
A. Improved agricultural practices. Unit cost: US$0.02 per m3. There are various kinds of improved
agricultural practices, such as drip and sprinkler irrigation, no-till farming and improved drainage,
utilization of the best available germplasm or other seed development, optimization of fertilizer
use, innovative crop protection technologies, and extension services. Costs of such measures vary
but, compared to the water supply measures, are relatively inexpensive. Some productivity
measures even result in a net cost savings when operating savings of the measures outweigh
annualized capital costs. The majority of unit costs of such measures range from US$0.02/m3–
US$0.03 m3
(2030 Water Resources Group 2009). Converting this range to costs per ha
(assuming, approximately 10,000 m3 of water consumption per ha) results in US$200–US$300
per ha per year. Obviously, these costs can vary and are measure dependent. For example, for the
Irrigation Improvement Project (IIP) in Egypt, the average improvement costs exceeded LE 6,000
per Feddan, or approximately US$2,500 per ha.52
Taking into account depreciation costs on
investment of 25 years gives annualized capital costs of approximately US$100 per ha.
B. Increased reuse of domestic and industrial water. Unit cost: US$0.30 per m3. Cost depends on
the treatment level. The unit cost of municipal and industrial wastewater reuse is on average
US$0.30/m3 (2030 Water Resources Group, 77, Exhibit 24).
C. Increased reuse of irrigation water. Unit cost: US$0.04/m3. These costs are relatively low as it
was assumed that this water is reused only for agricultural purposes so that no additional
treatment is necessary (2030 Water Resources Group, 75, Exhibit 23).53
The estimated cost is
based on the reuse of 50 mm (equivalent to 500 m3 per ha/year). Reuse will require an investment
52
One Feddan equals 4200 m2; one LE equals US$0.17.
53 If the quality of return flow is much poorer and needs additional treatment to be reused in irrigation, the cost of
reuse will be much higher.
77
cost of US$1,000 /ha equivalent to an annualized cost over 10 years of US$0.02/m3 plus annual
operational costs for maintenance and pumping of US$0.02/m3.
D. Expanding reservoir capacity––small scale. Unit cost: US$0.03 per m3. Obviously, these costs
can vary among Regions. For example, according to Di Prima (2007), who reviewed experience
with sand dams in Kitui District, Kenya, their construction cost is relatively high: currently
approximately US$10,000 for each dam to provide an average of 5,000–8,000 m3 of water each
season for (potentially) 50 years or more. The cost in this case was US$0.04/m3.
E. Expanding reservoir capacity––large scale. Unit cost: US$
0.05 per m3 for large-scale
infrastructure (2030 Water Resource Group, 48, Exhibit 7). The Aslantas Dam in Turkey is an
example of a large dam. The annual recovery charge on investment in the Aslantas Dam is
estimated at US$350 per ha per year. Assuming 1000 mm per year additional water storage per ha
(10,000 m3 per ha) results in US$0.035/m
3 (World Commission on Dams 2000).
F. Desalination using conventional energy. Unit cost: US$1.00 per m3 in 2010, to increase to
US$1.20 in 2050. Approximately half of the costs of desalination consist of energy costs (Trieb
and others 2011). However, due to the volatility of crude oil prices and development of
technological breakthroughs for conventional energy sources, there is uncertainty about, among
others, both future energy prices and energy requirements.
G. Desalination using renewable energy. Unit cost: Initially US$1.5 per m3; by 2050, expected to
fall to US$0.9 per m3 (Trieb and Muller-Steinhagen 2008; Trieb and others 2011). Renewable
energies (such as CSP) could be used as substitutes to generate energy. The volatility of the oil
market and projected future increases in oil prices, accompanied by the rapid advances in
renewable energy technology, is expected to make RE economically viable. It is assumed that,
over time, a major portion of desalination using conventional energy will be replaced by RE.
Notwithstanding, due to its high initial cost, the current volume considered CSP-powered
desalination plants as the last supply option to eliminate unmet water demand. Thus, installed
desalination capacity powered by RE is assumed to be sufficient only for domestic water supply
in 2030, but to expand to meet additional domestic and industrial water supply needs by 2050.
H. Reduced irrigated areas. Unit cost: US$0.10 per m3. The value of irrigation water normally
ranges from US$0.05 per m3 to US$0.15 per m
3 (Hellegers 2006). Forgone benefits can be
considered unit costs. This value is, of course, strongly dependent on the prices of agricultural
products, which in turn are strongly affected by interventions of governments and trading blocs.
I. Reduced domestic and industrial demand. Unit cost, including distribution costs: US$2.00 per
m3. Because drinking water is a necessity, its value can be expected to be very high. The other
uses of water within households that make life more comfortable and within industry can be
expected to have lower values (Young 2005). For instance, the forgone benefits of moving toward
less water-intensive industries can be considered as unit costs of reduced industrial demand.
Alleviating the Demand Gap
258 Application at the country level of each of the nine adaptation options for the average climate
scenario indicates that improved agricultural practice and desalination are the preferred technical
options. They significantly increase annual water supplies (table 5.1). Unmet demand can be reduced by
55 km3 through improved agricultural practice (option A). Desalination could increase supplies and thus
reduce the demand gap by 63 km3 using option F; and reduce it an additional 53 km
3 using option G.
Conversely, increasing reservoir capacity is not a very effective adaptation option for the Region because
reduced precipitation would make additional storage capacity redundant in many countries. Consequently,
expanding reservoir capacity would add only approximately 18 km3 of additional water (4km
3 thorough
small scale reservoirs and another 14km3 through large scale reservoirs)
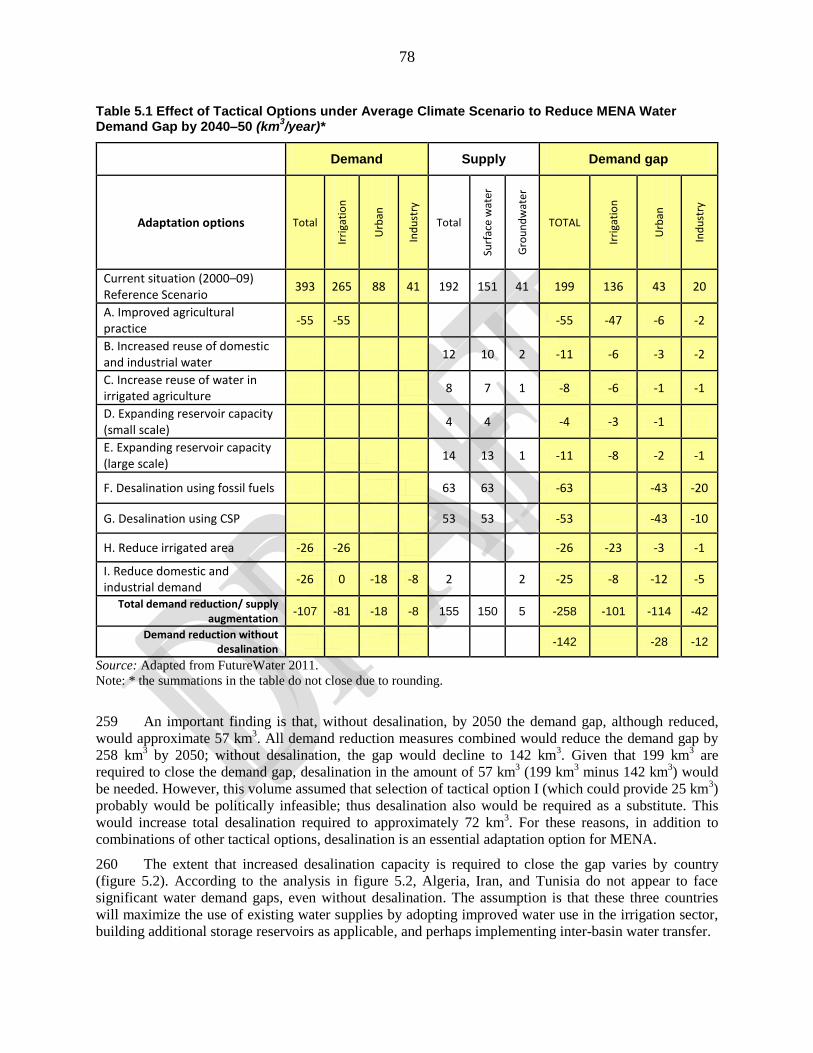
78
Table 5.1 Effect of Tactical Options under Average Climate Scenario to Reduce MENA Water Demand Gap by 2040–50 (km
3/year)*
Demand Supply Demand gap
Adaptation options Total
Irri
gati
on
Urb
an
Ind
ust
ry
Total
Surf
ace
wat
er
Gro
un
dw
ater
TOTAL
Irri
gati
on
Urb
an
Ind
ust
ry
Current situation (2000–09) Reference Scenario
393 265 88 41 192 151 41 199 136 43 20
A. Improved agricultural practice
-55 -55 -55 -47 -6 -2
B. Increased reuse of domestic and industrial water
12 10 2 -11 -6 -3 -2
C. Increase reuse of water in irrigated agriculture
8 7 1 -8 -6 -1 -1
D. Expanding reservoir capacity (small scale)
4 4 -4 -3 -1
E. Expanding reservoir capacity (large scale)
14 13 1 -11 -8 -2 -1
F. Desalination using fossil fuels 63 63 -63 -43 -20
G. Desalination using CSP 53 53 -53 -43 -10
H. Reduce irrigated area -26 -26 -26 -23 -3 -1
I. Reduce domestic and industrial demand
-26 0 -18 -8 2 2 -25 -8 -12 -5
Total demand reduction/ supply augmentation
-107 -81 -18 -8 155 150 5 -258 -101 -114 -42
Demand reduction without desalination
-142 -28 -12
Source: Adapted from FutureWater 2011.
Note: * the summations in the table do not close due to rounding.
259 An important finding is that, without desalination, by 2050 the demand gap, although reduced,
would approximate 57 km3. All demand reduction measures combined would reduce the demand gap by
258 km3 by 2050; without desalination, the gap would decline to 142 km
3. Given that 199 km
3 are
required to close the demand gap, desalination in the amount of 57 km3 (199 km
3 minus 142 km
3) would
be needed. However, this volume assumed that selection of tactical option I (which could provide 25 km3)
probably would be politically infeasible; thus desalination also would be required as a substitute. This
would increase total desalination required to approximately 72 km3. For these reasons, in addition to
combinations of other tactical options, desalination is an essential adaptation option for MENA.
260 The extent that increased desalination capacity is required to close the gap varies by country
(figure 5.2). According to the analysis in figure 5.2, Algeria, Iran, and Tunisia do not appear to face
significant water demand gaps, even without desalination. The assumption is that these three countries
will maximize the use of existing water supplies by adopting improved water use in the irrigation sector,
building additional storage reservoirs as applicable, and perhaps implementing inter-basin water transfer.
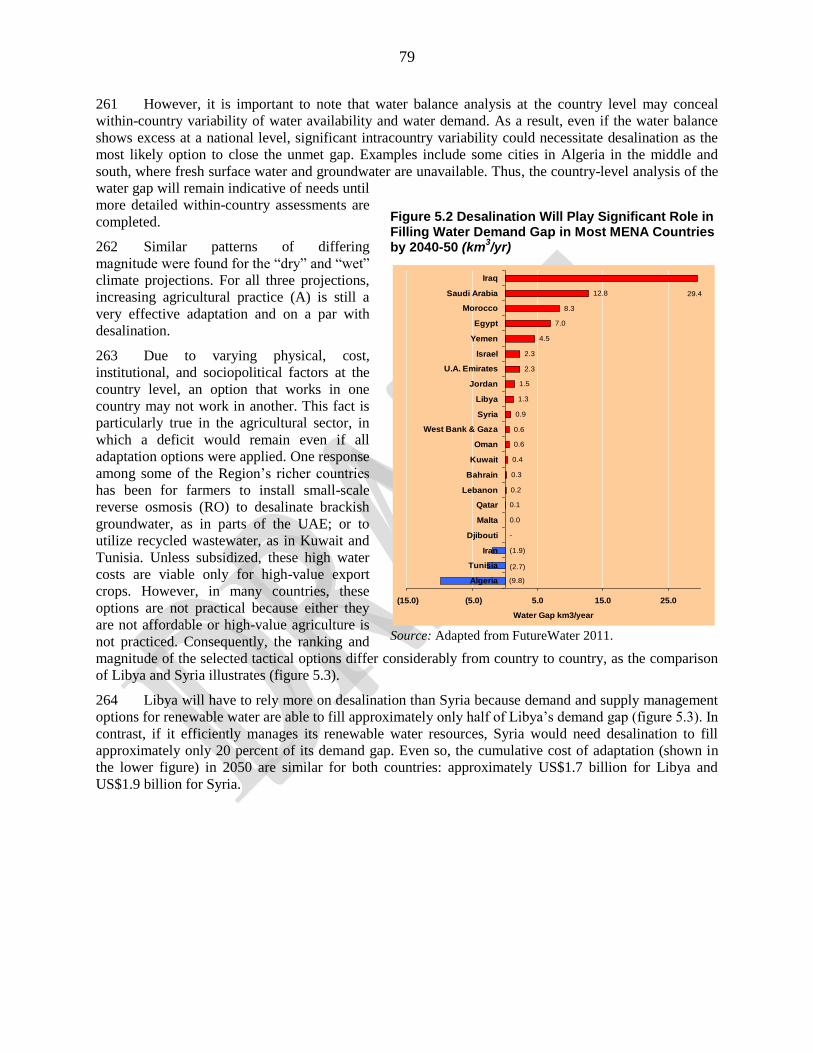
79
261 However, it is important to note that water balance analysis at the country level may conceal
within-country variability of water availability and water demand. As a result, even if the water balance
shows excess at a national level, significant intracountry variability could necessitate desalination as the
most likely option to close the unmet gap. Examples include some cities in Algeria in the middle and
south, where fresh surface water and groundwater are unavailable. Thus, the country-level analysis of the
water gap will remain indicative of needs until
more detailed within-country assessments are
completed.
262 Similar patterns of differing
magnitude were found for the ―dry‖ and ―wet‖
climate projections. For all three projections,
increasing agricultural practice (A) is still a
very effective adaptation and on a par with
desalination.
263 Due to varying physical, cost,
institutional, and sociopolitical factors at the
country level, an option that works in one
country may not work in another. This fact is
particularly true in the agricultural sector, in
which a deficit would remain even if all
adaptation options were applied. One response
among some of the Region‘s richer countries
has been for farmers to install small-scale
reverse osmosis (RO) to desalinate brackish
groundwater, as in parts of the UAE; or to
utilize recycled wastewater, as in Kuwait and
Tunisia. Unless subsidized, these high water
costs are viable only for high-value export
crops. However, in many countries, these
options are not practical because either they
are not affordable or high-value agriculture is
not practiced. Consequently, the ranking and
magnitude of the selected tactical options differ considerably from country to country, as the comparison
of Libya and Syria illustrates (figure 5.3).
264 Libya will have to rely more on desalination than Syria because demand and supply management
options for renewable water are able to fill approximately only half of Libya‘s demand gap (figure 5.3). In
contrast, if it efficiently manages its renewable water resources, Syria would need desalination to fill
approximately only 20 percent of its demand gap. Even so, the cumulative cost of adaptation (shown in
the lower figure) in 2050 are similar for both countries: approximately US$1.7 billion for Libya and
US$1.9 billion for Syria.
Figure 5.2 Desalination Will Play Significant Role in Filling Water Demand Gap in Most MENA Countries by 2040-50 (km
3/yr)
Source: Adapted from FutureWater 2011.
-
0.0
0.1
0.2
0.3
0.4
0.6
0.6
0.9
1.3
1.5
2.3
2.3
4.5
7.0
8.3
12.8
(9.8)
(1.9)
(2.7)
29.4
(15.0) (5.0) 5.0 15.0 25.0
Algeria
Tunisia
Iran
Djibouti
Malta
Qatar
Lebanon
Bahrain
Kuwait
Oman
West Bank & Gaza
Syria
Libya
Jordan
U.A. Emirates
Israel
Yemen
Egypt
Morocco
Saudi Arabia
Iraq
Water Gap km3/year
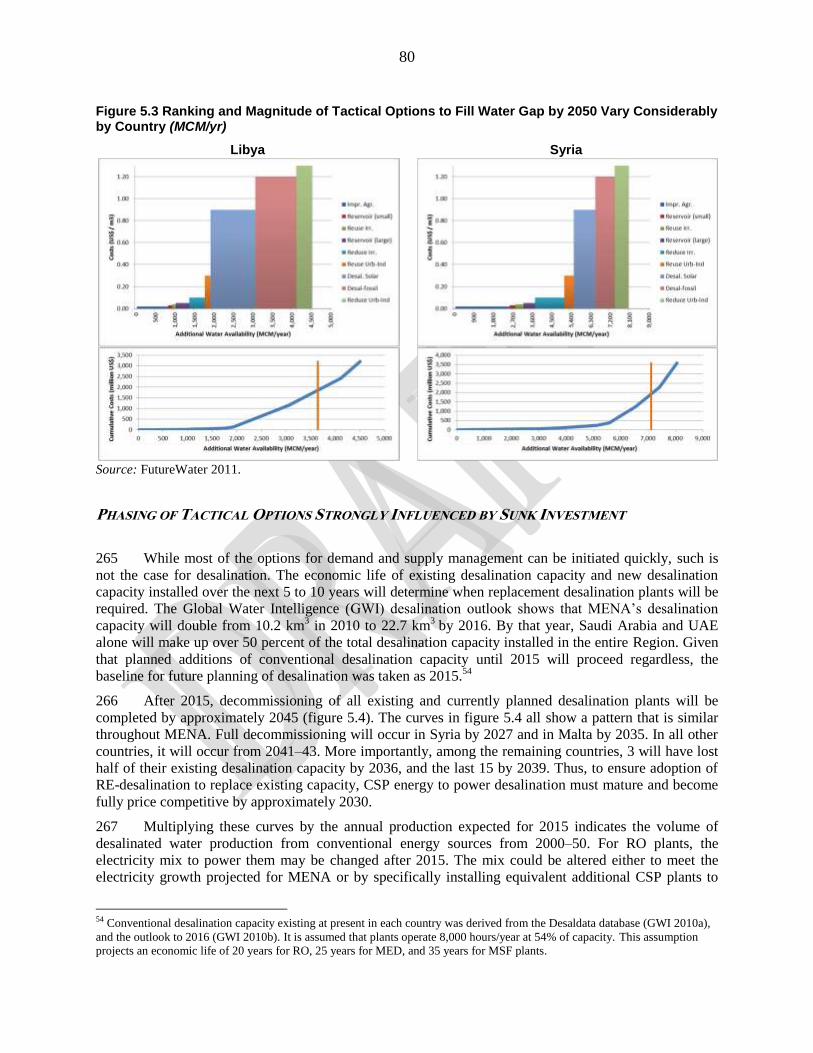
80
Figure 5.3 Ranking and Magnitude of Tactical Options to Fill Water Gap by 2050 Vary Considerably by Country (MCM/yr)
Libya Syria
Source: FutureWater 2011.
PHASING OF TACTICAL OPTIONS STRONGLY INFLUENCED BY SUNK INVESTMENT
265 While most of the options for demand and supply management can be initiated quickly, such is
not the case for desalination. The economic life of existing desalination capacity and new desalination
capacity installed over the next 5 to 10 years will determine when replacement desalination plants will be
required. The Global Water Intelligence (GWI) desalination outlook shows that MENA‘s desalination
capacity will double from 10.2 km3 in 2010 to 22.7 km
3 by 2016. By that year, Saudi Arabia and UAE
alone will make up over 50 percent of the total desalination capacity installed in the entire Region. Given
that planned additions of conventional desalination capacity until 2015 will proceed regardless, the
baseline for future planning of desalination was taken as 2015.54
266 After 2015, decommissioning of all existing and currently planned desalination plants will be
completed by approximately 2045 (figure 5.4). The curves in figure 5.4 all show a pattern that is similar
throughout MENA. Full decommissioning will occur in Syria by 2027 and in Malta by 2035. In all other
countries, it will occur from 2041–43. More importantly, among the remaining countries, 3 will have lost
half of their existing desalination capacity by 2036, and the last 15 by 2039. Thus, to ensure adoption of
RE-desalination to replace existing capacity, CSP energy to power desalination must mature and become
fully price competitive by approximately 2030.
267 Multiplying these curves by the annual production expected for 2015 indicates the volume of
desalinated water production from conventional energy sources from 2000–50. For RO plants, the
electricity mix to power them may be changed after 2015. The mix could be altered either to meet the
electricity growth projected for MENA or by specifically installing equivalent additional CSP plants to
54 Conventional desalination capacity existing at present in each country was derived from the Desaldata database (GWI 2010a),
and the outlook to 2016 (GWI 2010b). It is assumed that plants operate 8,000 hours/year at 54% of capacity. This assumption
projects an economic life of 20 years for RO, 25 years for MED, and 35 years for MSF plants.
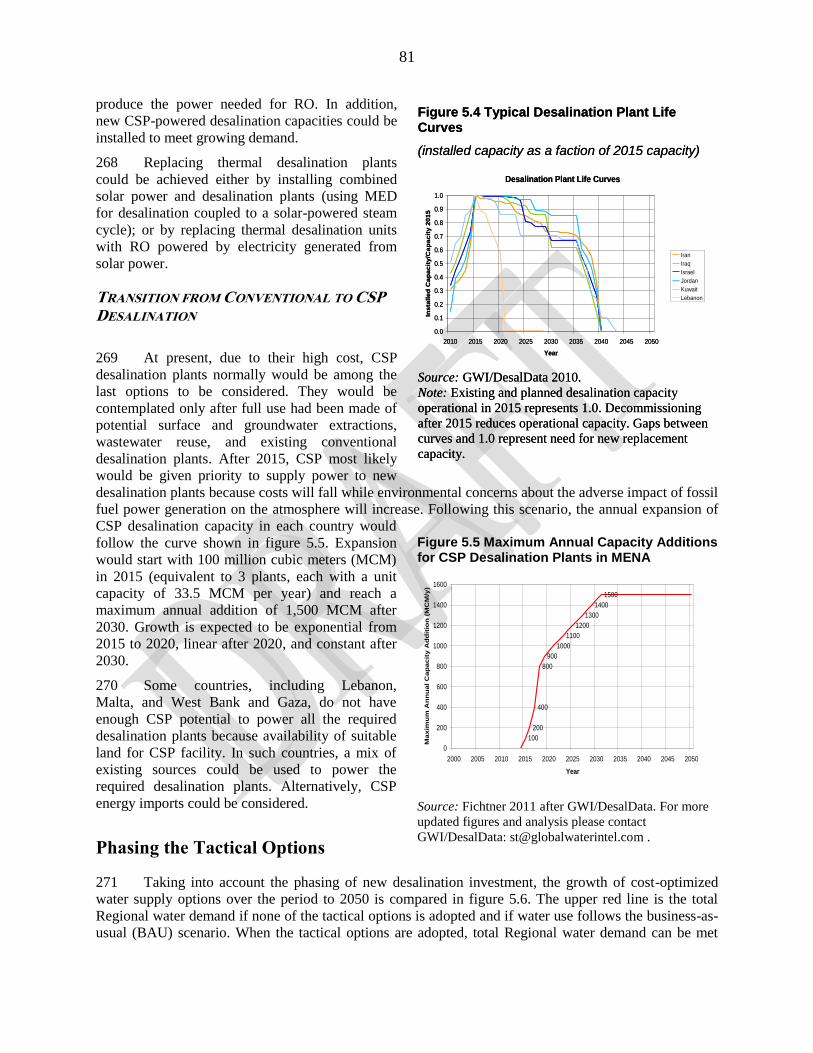
81
produce the power needed for RO. In addition,
new CSP-powered desalination capacities could be
installed to meet growing demand.
268 Replacing thermal desalination plants
could be achieved either by installing combined
solar power and desalination plants (using MED
for desalination coupled to a solar-powered steam
cycle); or by replacing thermal desalination units
with RO powered by electricity generated from
solar power.
TRANSITION FROM CONVENTIONAL TO CSP
DESALINATION
269 At present, due to their high cost, CSP
desalination plants normally would be among the
last options to be considered. They would be
contemplated only after full use had been made of
potential surface and groundwater extractions,
wastewater reuse, and existing conventional
desalination plants. After 2015, CSP most likely
would be given priority to supply power to new
desalination plants because costs will fall while environmental concerns about the adverse impact of fossil
fuel power generation on the atmosphere will increase. Following this scenario, the annual expansion of
CSP desalination capacity in each country would
follow the curve shown in figure 5.5. Expansion
would start with 100 million cubic meters (MCM)
in 2015 (equivalent to 3 plants, each with a unit
capacity of 33.5 MCM per year) and reach a
maximum annual addition of 1,500 MCM after
2030. Growth is expected to be exponential from
2015 to 2020, linear after 2020, and constant after
2030.
270 Some countries, including Lebanon,
Malta, and West Bank and Gaza, do not have
enough CSP potential to power all the required
desalination plants because availability of suitable
land for CSP facility. In such countries, a mix of
existing sources could be used to power the
required desalination plants. Alternatively, CSP
energy imports could be considered.
Phasing the Tactical Options
271 Taking into account the phasing of new desalination investment, the growth of cost-optimized
water supply options over the period to 2050 is compared in figure 5.6. The upper red line is the total
Regional water demand if none of the tactical options is adopted and if water use follows the business-as-
usual (BAU) scenario. When the tactical options are adopted, total Regional water demand can be met
Figure 5.4 Typical Desalination Plant Life Curves
(installed capacity as a faction of 2015 capacity)
Source: GWI/DesalData 2010.
Note: Existing and planned desalination capacity
operational in 2015 represents 1.0. Decommissioning
after 2015 reduces operational capacity. Gaps between
curves and 1.0 represent need for new replacement
capacity.
Figure 5.5 Maximum Annual Capacity Additions for CSP Desalination Plants in MENA
Source: Fichtner 2011 after GWI/DesalData. For more
updated figures and analysis please contact
GWI/DesalData: [email protected] .
Desalination Plant Life Curves
0.0
0.1
0.2
0.3
0.4
0.5
0.6
0.7
0.8
0.9
1.0
2010 2015 2020 2025 2030 2035 2040 2045 2050
Year
Insta
lled
Cap
acit
y/C
ap
acit
y 2
01
5
Iran
Iraq
Israel
Jordan
Kuwait
Lebanon
Desalination Plant Life Curves
0.0
0.1
0.2
0.3
0.4
0.5
0.6
0.7
0.8
0.9
1.0
2010 2015 2020 2025 2030 2035 2040 2045 2050
Year
Insta
lled
Cap
acit
y/C
ap
acit
y 2
01
5
Iran
Iraq
Israel
Jordan
Kuwait
Lebanon
100
200
400
800
900
1000
1100
1200
1300
1400
1500
0
200
400
600
800
1000
1200
1400
1600
2000 2005 2010 2015 2020 2025 2030 2035 2040 2045 2050
Year
Ma
xim
um
An
nu
al
Ca
pa
cit
y A
dd
itio
n (
MC
M/y
)
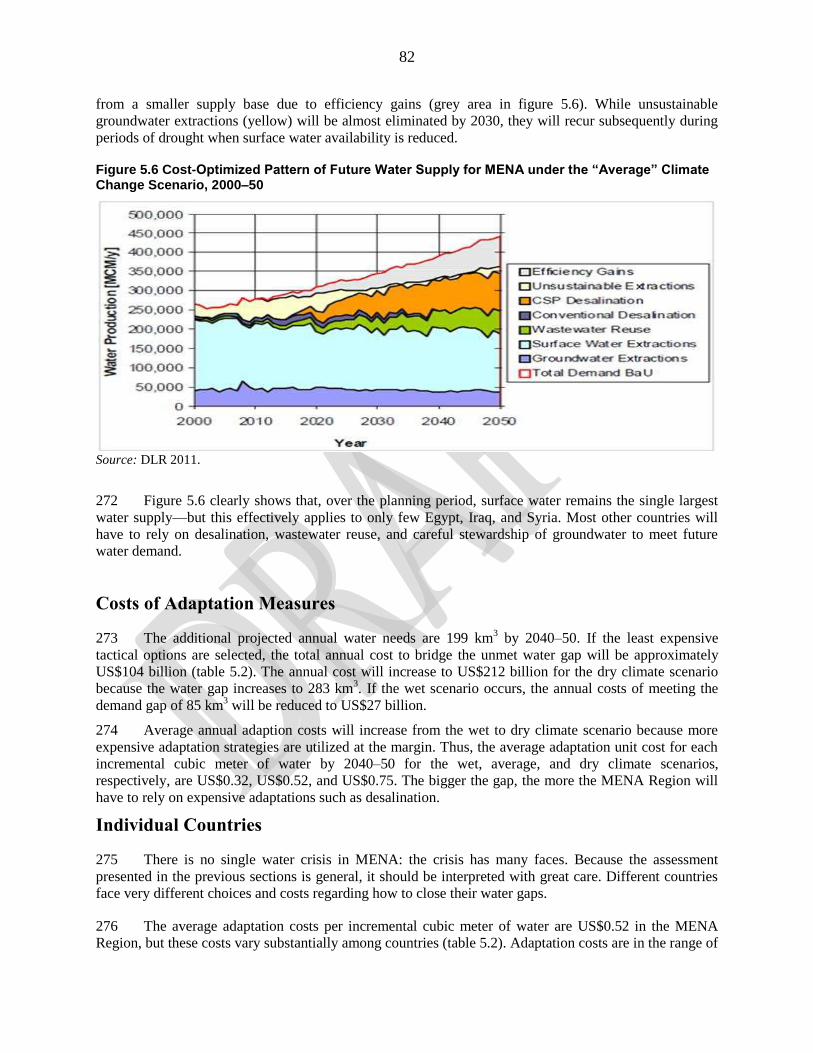
82
from a smaller supply base due to efficiency gains (grey area in figure 5.6). While unsustainable
groundwater extractions (yellow) will be almost eliminated by 2030, they will recur subsequently during
periods of drought when surface water availability is reduced.
Figure 5.6 Cost-Optimized Pattern of Future Water Supply for MENA under the “Average” Climate Change Scenario, 2000–50
Source: DLR 2011.
272 Figure 5.6 clearly shows that, over the planning period, surface water remains the single largest
water supply––but this effectively applies to only few Egypt, Iraq, and Syria. Most other countries will
have to rely on desalination, wastewater reuse, and careful stewardship of groundwater to meet future
water demand.
Costs of Adaptation Measures
273 The additional projected annual water needs are 199 km3 by 2040–50. If the least expensive
tactical options are selected, the total annual cost to bridge the unmet water gap will be approximately
US$104 billion (table 5.2). The annual cost will increase to US$212 billion for the dry climate scenario
because the water gap increases to 283 km3. If the wet scenario occurs, the annual costs of meeting the
demand gap of 85 km3 will be reduced to US$27 billion.
274 Average annual adaption costs will increase from the wet to dry climate scenario because more
expensive adaptation strategies are utilized at the margin. Thus, the average adaptation unit cost for each
incremental cubic meter of water by 2040–50 for the wet, average, and dry climate scenarios,
respectively, are US$0.32, US$0.52, and US$0.75. The bigger the gap, the more the MENA Region will
have to rely on expensive adaptations such as desalination.
Individual Countries
275 There is no single water crisis in MENA: the crisis has many faces. Because the assessment
presented in the previous sections is general, it should be interpreted with great care. Different countries
face very different choices and costs regarding how to close their water gaps.
276 The average adaptation costs per incremental cubic meter of water are US$0.52 in the MENA
Region, but these costs vary substantially among countries (table 5.2). Adaptation costs are in the range of
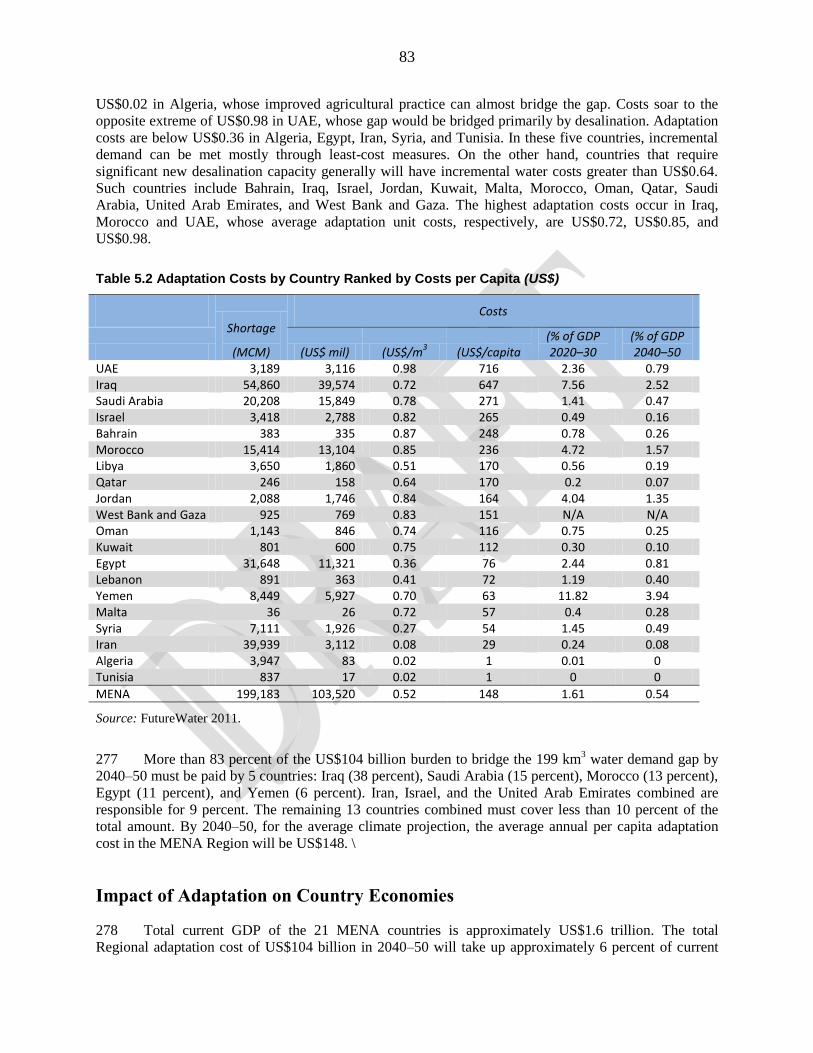
83
US$0.02 in Algeria, whose improved agricultural practice can almost bridge the gap. Costs soar to the
opposite extreme of US$0.98 in UAE, whose gap would be bridged primarily by desalination. Adaptation
costs are below US$0.36 in Algeria, Egypt, Iran, Syria, and Tunisia. In these five countries, incremental
demand can be met mostly through least-cost measures. On the other hand, countries that require
significant new desalination capacity generally will have incremental water costs greater than US$0.64.
Such countries include Bahrain, Iraq, Israel, Jordan, Kuwait, Malta, Morocco, Oman, Qatar, Saudi
Arabia, United Arab Emirates, and West Bank and Gaza. The highest adaptation costs occur in Iraq,
Morocco and UAE, whose average adaptation unit costs, respectively, are US$0.72, US$0.85, and
US$0.98.
Table 5.2 Adaptation Costs by Country Ranked by Costs per Capita (US$)
Shortage
(MCM)
Costs
(US$ mil) (US$/m3 (US$/capita
(% of GDP 2020–30
(% of GDP 2040–50
UAE 3,189 3,116 0.98 716 2.36 0.79 Iraq 54,860 39,574 0.72 647 7.56 2.52 Saudi Arabia 20,208 15,849 0.78 271 1.41 0.47 Israel 3,418 2,788 0.82 265 0.49 0.16 Bahrain 383 335 0.87 248 0.78 0.26 Morocco 15,414 13,104 0.85 236 4.72 1.57 Libya 3,650 1,860 0.51 170 0.56 0.19 Qatar 246 158 0.64 170 0.2 0.07 Jordan 2,088 1,746 0.84 164 4.04 1.35 West Bank and Gaza 925 769 0.83 151 N/A N/A Oman 1,143 846 0.74 116 0.75 0.25 Kuwait 801 600 0.75 112 0.30 0.10 Egypt 31,648 11,321 0.36 76 2.44 0.81 Lebanon 891 363 0.41 72 1.19 0.40 Yemen 8,449 5,927 0.70 63 11.82 3.94 Malta 36 26 0.72 57 0.4 0.28 Syria 7,111 1,926 0.27 54 1.45 0.49 Iran 39,939 3,112 0.08 29 0.24 0.08 Algeria 3,947 83 0.02 1 0.01 0 Tunisia 837 17 0.02 1 0 0
MENA 199,183 103,520 0.52 148 1.61 0.54
Source: FutureWater 2011.
277 More than 83 percent of the US$104 billion burden to bridge the 199 km3 water demand gap by
2040–50 must be paid by 5 countries: Iraq (38 percent), Saudi Arabia (15 percent), Morocco (13 percent),
Egypt (11 percent), and Yemen (6 percent). Iran, Israel, and the United Arab Emirates combined are
responsible for 9 percent. The remaining 13 countries combined must cover less than 10 percent of the
total amount. By 2040–50, for the average climate projection, the average annual per capita adaptation
cost in the MENA Region will be US$148. \
Impact of Adaptation on Country Economies
278 Total current GDP of the 21 MENA countries is approximately US$1.6 trillion. The total
Regional adaptation cost of US$104 billion in 2040–50 will take up approximately 6 percent of current
84
Regional GDP. Future GDP will be higher, however, and adaptation costs will be less onerous. The well-
accepted CIESIN GDP projections55
show an increase in the MENA GDP to approximately US$6.5
trillion by 2030–40, and to US$19 trillion by 2040–50.56
On this basis, in 2040–50, the cost of closing the
MENA Region‘s water gap under the average climate scenario will vary from 0.5 percent–1.6 percent of
GDP.
279 However, substantial differences can be observed among individual countries arising from the
severity of their water shortages and projected GDP per country (table 5.2). In the future, countries such
as Egypt, Iraq, Jordan, Morocco, and Yemen must be prepared to spend a substantial portion of their GDP
on overcoming their large water shortfalls. In the short- to medium-term, Yemen has the highest coping
cost because its groundwater resources––the primary source for potable water supplies––are near
exhaustion.
55
CIESIN 2002. 56
As stated earlier, all costs are converted to US$2010 prices.
85
6. ENVIRONMENTAL IMPACTS OF DESALINATION
Overview
280 Each desalination technology makes considerable demands on the environment. Given the large
share of desalination capacities already installed and the expected growth in the future, the necessity of
addressing these environmental issues becomes indispensible for MENA. This chapter provides an
overview of the main environmental management issues related to desalination and makes general
recommendations for the future.
281 Desalination has very large environmental impacts that affect both the atmosphere and the source
waters. The high demand for heat and electrical energy from the desalination process produces secondary
atmospheric impacts in the form of CO2 emissions. Whatever the power source, desalination generates
concentrated brine that requires safe disposal. While thermal distillation produces three times more brine
per unit of fresh water generated than reverse osmosis (RO), both types of desalination generally return
the polluted water to the source sea. But where RO is used inland to desalinate brackish water, the
disposal of brine is a far more complex issue.
DESALINATION – ATMOSPHERIC POLLUTION
282 Currently the energy used in thermal and RO processes is provided from fossil fuels. Whatever
the source of energy, be it electrical or thermal, substantial volumes of CO2 and other gases are produced
and emitted to the atmosphere. By 2050 MENA‘s incremental annual desalination requirements are
projected to be approximately 90 km3. If this volume of desalinated water were produced by a 50:50 oil-
gas mix using MED distillation––effectively business as usual––CO2 equivalent emissions would range
from 270 million tons (MT)–360 MT per year.57
Under the optimized water supply scenario discussed in
Chapter 5, the actual mix of desalination technology would be approximately 60 km3 per year from CSP-
MED and 30 km3 per year from CSP-RO (mainly for brackish groundwater desalination). Using this
combination, CO2 equivalent emissions would be 3.4 MT–3.8 MT per year.58
In sum, choice of RE
would substantially benefit the environment by reducing GHG emissions.
DESALINATION –MARINE POLLUTION
283 The impacts of feed water abstraction and brine disposal on the marine ecosystem in the near-
shore environment are potentially large. The main hazards are entrapment of marine life on the intake side
and the effects of direct discharge of high-temperature, chemical-laden brine from desalination plants on
marine organisms and environments. Although the Gulf of Arabia, the Red Sea, and the Mediterranean
Sea effectively are closed basins, the likely impacts of brine disposal will vary considerably across the
MENA Region because these seas are notably different (table 6.1).
284 The Gulf is a particularly sensitive environment as it is very shallow and has a slower rate of
inversion and mixing with the Indian Ocean. The Gulf is home to over 700 species of fish, most of which
are native to it. Of these 700 species, more than 80 percent are coral reef associated, and directly or
indirectly depend on the reefs for their survival. Mangroves provide important inshore habitats,
particularly along parts of the southern shores. Sea-grass colonies are a vital habitat for much of the
marine fauna.59
Different coastal and marine ecosystems are likely to vary in their sensitivities to
57
Oil produces 700 tons of CO2 equivalent for each GWh of energy produced, and gas produces 450 tons. 58
CSP produces 17 tons of CO2 equivalent for each GWH of energy produced. 59
Al Jahani 2008.
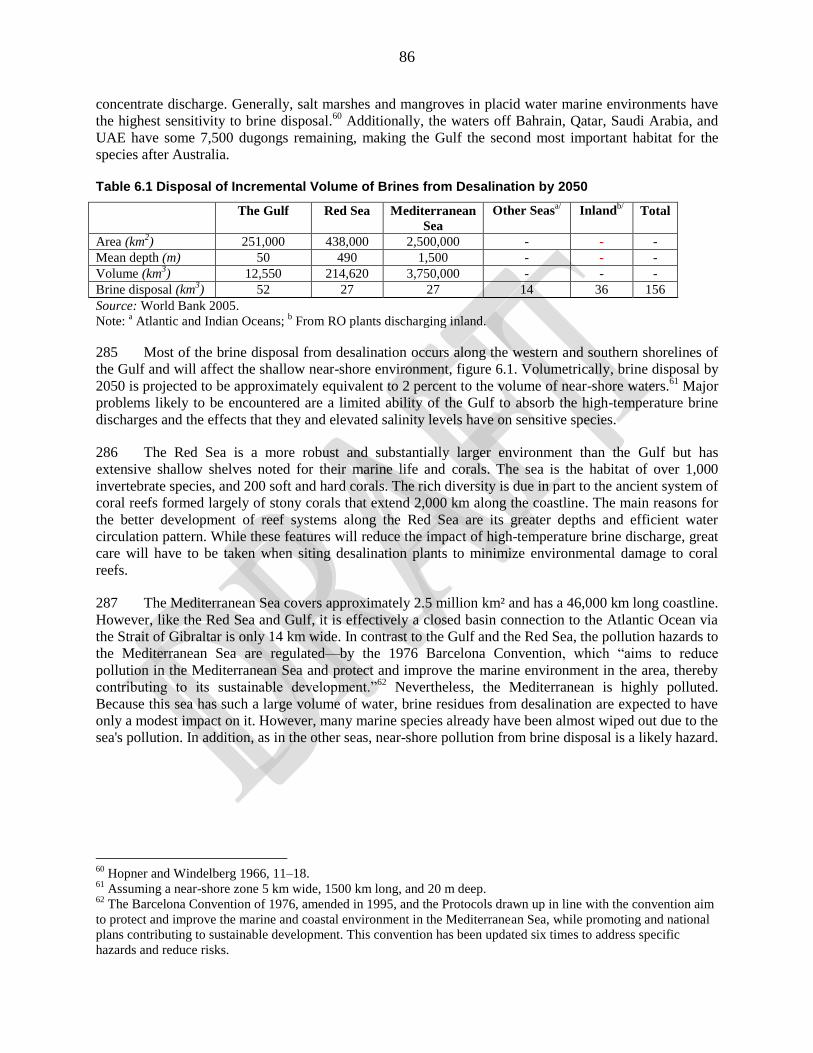
86
concentrate discharge. Generally, salt marshes and mangroves in placid water marine environments have
the highest sensitivity to brine disposal.60
Additionally, the waters off Bahrain, Qatar, Saudi Arabia, and
UAE have some 7,500 dugongs remaining, making the Gulf the second most important habitat for the
species after Australia.
Table 6.1 Disposal of Incremental Volume of Brines from Desalination by 2050
The Gulf Red Sea Mediterranean
Sea
Other Seasa/ Inland
b/ Total
Area (km2) 251,000 438,000 2,500,000 - - -
Mean depth (m) 50 490 1,500 - - -
Volume (km3) 12,550 214,620 3,750,000 - - -
Brine disposal (km3) 52 27 27 14 36 156
Source: World Bank 2005.
Note: a Atlantic and Indian Oceans;
b From RO plants discharging inland.
285 Most of the brine disposal from desalination occurs along the western and southern shorelines of
the Gulf and will affect the shallow near-shore environment, figure 6.1. Volumetrically, brine disposal by
2050 is projected to be approximately equivalent to 2 percent to the volume of near-shore waters.61
Major
problems likely to be encountered are a limited ability of the Gulf to absorb the high-temperature brine
discharges and the effects that they and elevated salinity levels have on sensitive species.
286 The Red Sea is a more robust and substantially larger environment than the Gulf but has
extensive shallow shelves noted for their marine life and corals. The sea is the habitat of over 1,000
invertebrate species, and 200 soft and hard corals. The rich diversity is due in part to the ancient system of
coral reefs formed largely of stony corals that extend 2,000 km along the coastline. The main reasons for
the better development of reef systems along the Red Sea are its greater depths and efficient water
circulation pattern. While these features will reduce the impact of high-temperature brine discharge, great
care will have to be taken when siting desalination plants to minimize environmental damage to coral
reefs.
287 The Mediterranean Sea covers approximately 2.5 million km² and has a 46,000 km long coastline.
However, like the Red Sea and Gulf, it is effectively a closed basin connection to the Atlantic Ocean via
the Strait of Gibraltar is only 14 km wide. In contrast to the Gulf and the Red Sea, the pollution hazards to
the Mediterranean Sea are regulated––by the 1976 Barcelona Convention, which ―aims to reduce
pollution in the Mediterranean Sea and protect and improve the marine environment in the area, thereby
contributing to its sustainable development.‖62
Nevertheless, the Mediterranean is highly polluted.
Because this sea has such a large volume of water, brine residues from desalination are expected to have
only a modest impact on it. However, many marine species already have been almost wiped out due to the
sea's pollution. In addition, as in the other seas, near-shore pollution from brine disposal is a likely hazard.
60
Hopner and Windelberg 1966, 11–18. 61
Assuming a near-shore zone 5 km wide, 1500 km long, and 20 m deep. 62
The Barcelona Convention of 1976, amended in 1995, and the Protocols drawn up in line with the convention aim
to protect and improve the marine and coastal environment in the Mediterranean Sea, while promoting and national
plans contributing to sustainable development. This convention has been updated six times to address specific
hazards and reduce risks.
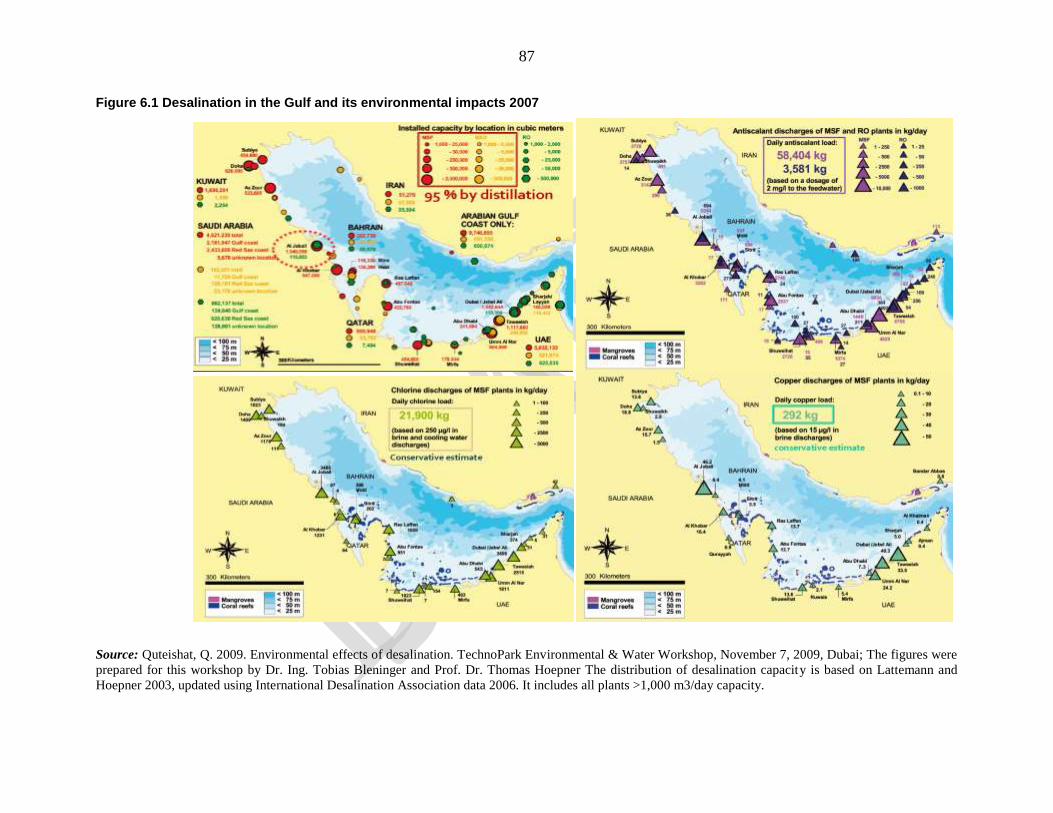
87
Figure 6.1 Desalination in the Gulf and its environmental impacts 2007
Source: Quteishat, Q. 2009. Environmental effects of desalination. TechnoPark Environmental & Water Workshop, November 7, 2009, Dubai; The figures were
prepared for this workshop by Dr. Ing. Tobias Bleninger and Prof. Dr. Thomas Hoepner The distribution of desalination capacity is based on Lattemann and
Hoepner 2003, updated using International Desalination Association data 2006. It includes all plants >1,000 m3/day capacity.
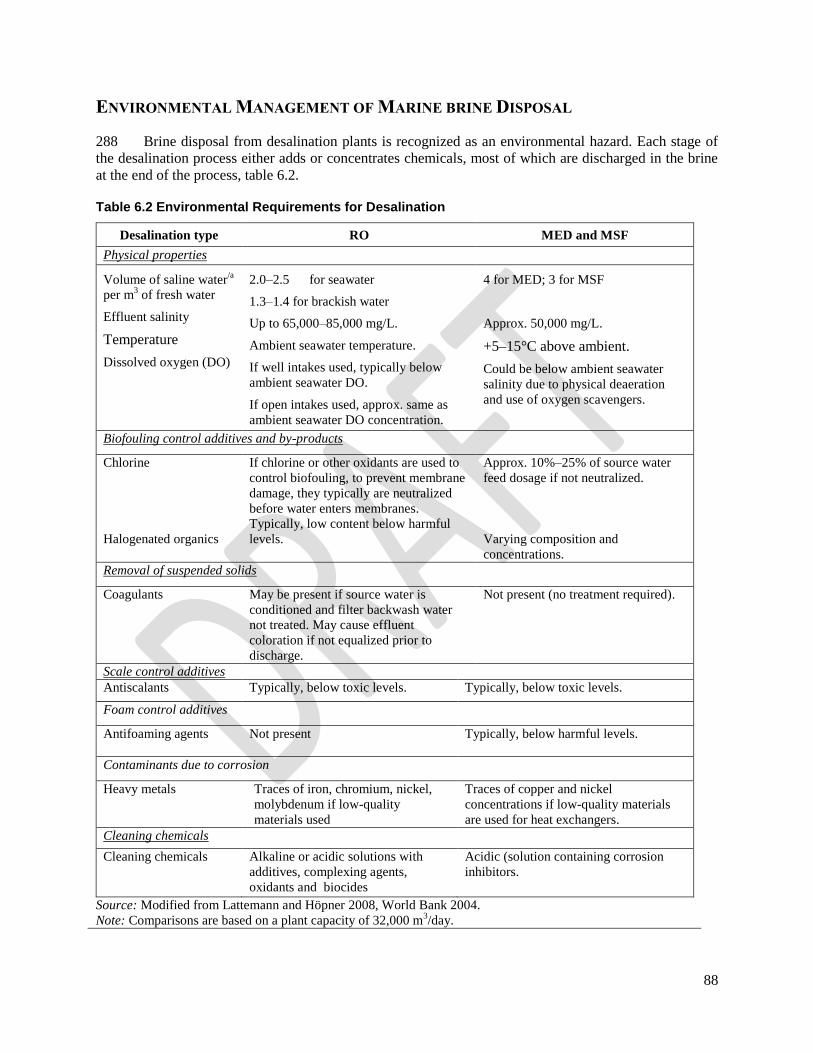
88
ENVIRONMENTAL MANAGEMENT OF MARINE BRINE DISPOSAL
288 Brine disposal from desalination plants is recognized as an environmental hazard. Each stage of
the desalination process either adds or concentrates chemicals, most of which are discharged in the brine
at the end of the process, table 6.2.
Table 6.2 Environmental Requirements for Desalination
Desalination type RO MED and MSF
Physical properties
Volume of saline water/a
per m3 of fresh water
Effluent salinity
Temperature
Dissolved oxygen (DO)
2.0–2.5 for seawater
1.3–1.4 for brackish water
Up to 65,000–85,000 mg/L.
Ambient seawater temperature.
If well intakes used, typically below
ambient seawater DO.
If open intakes used, approx. same as
ambient seawater DO concentration.
4 for MED; 3 for MSF
Approx. 50,000 mg/L.
+5–15°C above ambient.
Could be below ambient seawater
salinity due to physical deaeration
and use of oxygen scavengers.
Biofouling control additives and by-products
Chlorine
Halogenated organics
If chlorine or other oxidants are used to
control biofouling, to prevent membrane
damage, they typically are neutralized
before water enters membranes.
Typically, low content below harmful
levels.
Approx. 10%–25% of source water
feed dosage if not neutralized.
Varying composition and
concentrations.
Removal of suspended solids
Coagulants
May be present if source water is
conditioned and filter backwash water
not treated. May cause effluent
coloration if not equalized prior to
discharge.
Not present (no treatment required).
Scale control additives
Antiscalants Typically, below toxic levels. Typically, below toxic levels.
Foam control additives
Antifoaming agents
Not present Typically, below harmful levels.
Contaminants due to corrosion
Heavy metals
Traces of iron, chromium, nickel,
molybdenum if low-quality
materials used
Traces of copper and nickel
concentrations if low-quality materials
are used for heat exchangers.
Cleaning chemicals
Cleaning chemicals Alkaline or acidic solutions with
additives, complexing agents,
oxidants and biocides
Acidic (solution containing corrosion
inhibitors.
Source: Modified from Lattemann and Höpner 2008, World Bank 2004.
Note: Comparisons are based on a plant capacity of 32,000 m3/day.
89
289 Chemicals frequently used to control marine growth, particularly mollusks around the intake
structures supplying the desalination plant. Within the plant, seawater or brackish/saline groundwater
again is subjected to chemical and mechanical treatment to remove suspended solids and control
biological growth. During the application of energy to the treated seawater, brine is concentrated and
returned to its source carrying all of the chemicals added during the treatment process. After treatment,
the desalinated water is further treated with chemicals to prevent corrosion of the downstream
infrastructure and water distribution network. In addition to the additives, the desalinated water is of a
much higher density due to the large increase in total dissolved solids.
290 The salinity of the brine discharge from desalination plants may be more than twice the salinity
of, and of a significantly higher temperature than, the sea water (table 6.2). Salinity of effluents from
thermal desalination plants typically ranges from 46,000–80,000 parts per million. In addition the
combined effects of higher temperatures, salinity, and chemical additives reduce the oxygen in the water
and make it less soluble. Without proper dilution and aeration, a plume of elevated salinity and low
oxygen discharge may extend over a significant area and may harm the near-shore ecosystem.
291 Overall, copper, and chlorine are the most serious environmental threats from seawater
concentrate discharge. Chlorine is one of the major pollutants added to the feed water to prevent
biofouling on heat exchange surfaces in MSF plants; it is little used in RO plants. Chlorine is a strong
oxidant and a highly effective biocide. However, it also leads to oxidation byproducts such as halogenated
organics. Consequently, residual levels of chlorine from the effluent discharge may be toxic to marine life
at the discharge site. The US Environmental Protection Agency (EPA) places the chlorine exposure limit
at 13 and 7.5 micrograms per liter for short- and long-term exposure, respectively. In Kuwait,
concentrations of up to 100 micrograms––10 times the toxic levels for humans––were found 1 km from
cogeneration plants outfalls.63
It is believed these levels pose high risks to some marine phytoplankton,
invertebrates, and vertebrates. Halogenated compounds generally persist in the marine environment, and
some are carcinogenic to animals.
292 As a plant‘s internal surfaces corrode, heavy metals enter the brine stream. Copper contamination
is the major problem in MSF distillation plants but is almost absent in RO plants due to the use of
nonmetallic materials and stainless steel. Nevertheless, RO brine generally contains trace levels of iron,
nickel, chromium, and molybdenum. Heavy metals tend to enrich in suspended materials and sediments
and affect soft bottom habitats such as those found in the Gulf. Many benthic invertebrates feed on this
suspended or deposited material with the risk that the metals are enriched in their bodies and passed up
the food chain.64
293 There is only modest information on the effect of brine discharge on the fauna of the MENA
Region‘s seas. Spain experienced major impacts on seafloor communities from brine discharges that
raised near-shore salinity to over 39,000 parts per million (ppm).65
Specifically, nematodes (worm)
prevalence increased from 68 percent to 96 percent in 2 years, while other species declined. Studies in
Spain on sea grass habitats showed that even brief exposure––15 days––to salinities in excess of 40,000
ppm caused a 27 percent mortality of plants.66
Generally, research indicates that the 38,000-40,000 ppm
zone represents a tolerance threshold for marine organisms.67
Clearly, brine discharge from desalinization
plants has the potential to significantly impact near-shore ecology. Research results elsewhere have
produced a range of findings. A comprehensive study of a thermal desalination plant in Key West, Florida
63
Lattemann and Höpner 2007. 64
Lattemann 2005. 65
Ruso and others 2007, 492–503. 66
Latorre 2005, 517–24. 67
Jenkins and Graham 2006.
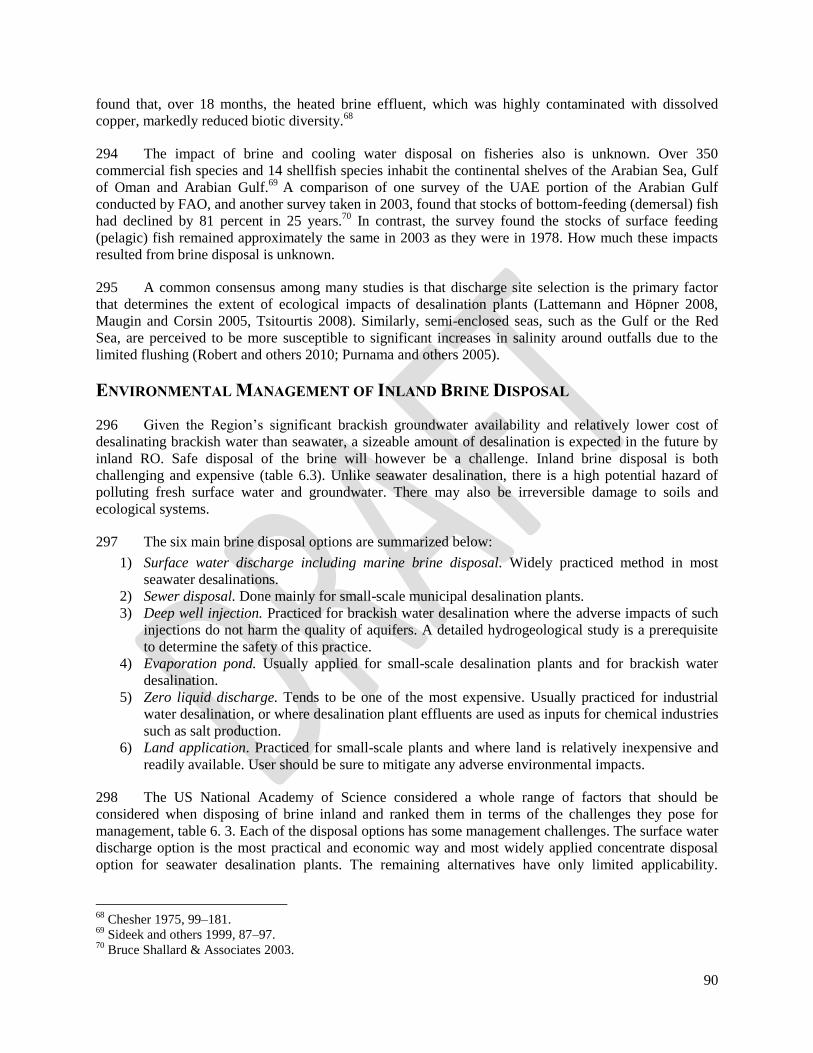
90
found that, over 18 months, the heated brine effluent, which was highly contaminated with dissolved
copper, markedly reduced biotic diversity.68
294 The impact of brine and cooling water disposal on fisheries also is unknown. Over 350
commercial fish species and 14 shellfish species inhabit the continental shelves of the Arabian Sea, Gulf
of Oman and Arabian Gulf.69
A comparison of one survey of the UAE portion of the Arabian Gulf
conducted by FAO, and another survey taken in 2003, found that stocks of bottom-feeding (demersal) fish
had declined by 81 percent in 25 years.70
In contrast, the survey found the stocks of surface feeding
(pelagic) fish remained approximately the same in 2003 as they were in 1978. How much these impacts
resulted from brine disposal is unknown.
295 A common consensus among many studies is that discharge site selection is the primary factor
that determines the extent of ecological impacts of desalination plants (Lattemann and Höpner 2008,
Maugin and Corsin 2005, Tsitourtis 2008). Similarly, semi-enclosed seas, such as the Gulf or the Red
Sea, are perceived to be more susceptible to significant increases in salinity around outfalls due to the
limited flushing (Robert and others 2010; Purnama and others 2005).
ENVIRONMENTAL MANAGEMENT OF INLAND BRINE DISPOSAL
296 Given the Region‘s significant brackish groundwater availability and relatively lower cost of
desalinating brackish water than seawater, a sizeable amount of desalination is expected in the future by
inland RO. Safe disposal of the brine will however be a challenge. Inland brine disposal is both
challenging and expensive (table 6.3). Unlike seawater desalination, there is a high potential hazard of
polluting fresh surface water and groundwater. There may also be irreversible damage to soils and
ecological systems.
297 The six main brine disposal options are summarized below:
1) Surface water discharge including marine brine disposal. Widely practiced method in most
seawater desalinations.
2) Sewer disposal. Done mainly for small-scale municipal desalination plants.
3) Deep well injection. Practiced for brackish water desalination where the adverse impacts of such
injections do not harm the quality of aquifers. A detailed hydrogeological study is a prerequisite
to determine the safety of this practice.
4) Evaporation pond. Usually applied for small-scale desalination plants and for brackish water
desalination.
5) Zero liquid discharge. Tends to be one of the most expensive. Usually practiced for industrial
water desalination, or where desalination plant effluents are used as inputs for chemical industries
such as salt production.
6) Land application. Practiced for small-scale plants and where land is relatively inexpensive and
readily available. User should be sure to mitigate any adverse environmental impacts.
298 The US National Academy of Science considered a whole range of factors that should be
considered when disposing of brine inland and ranked them in terms of the challenges they pose for
management, table 6. 3. Each of the disposal options has some management challenges. The surface water
discharge option is the most practical and economic way and most widely applied concentrate disposal
option for seawater desalination plants. The remaining alternatives have only limited applicability.
68
Chesher 1975, 99–181. 69
Sideek and others 1999, 87–97. 70
Bruce Shallard & Associates 2003.
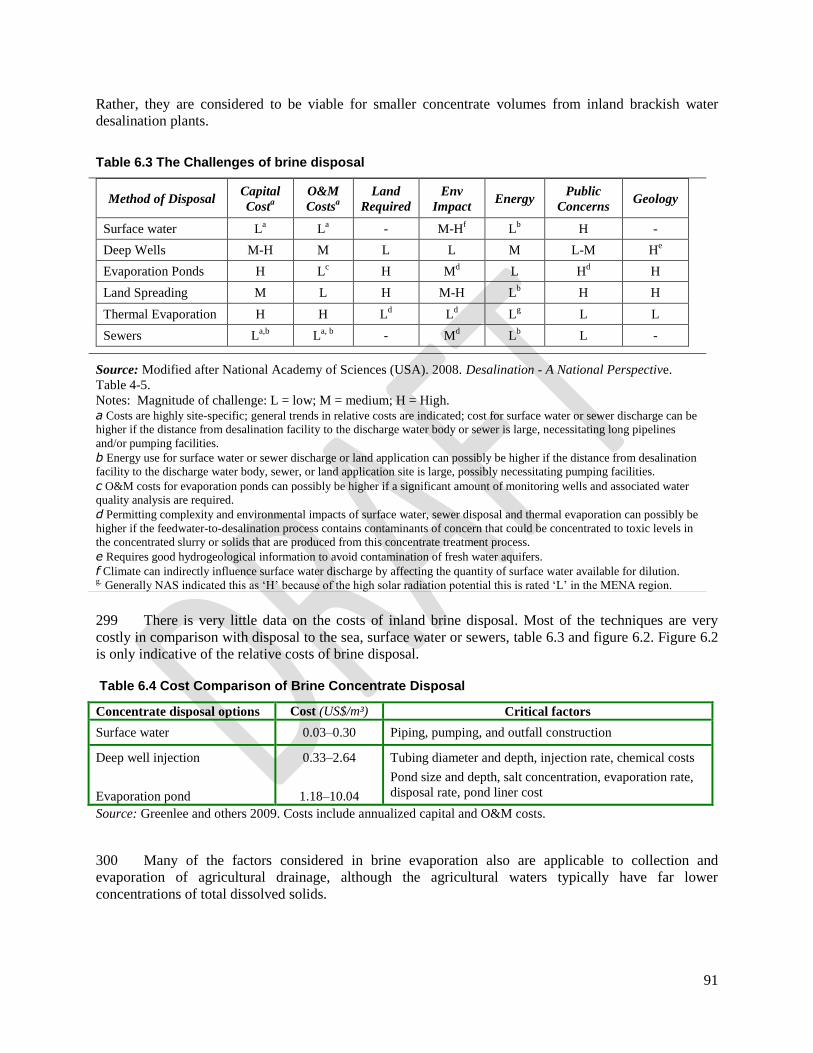
91
Rather, they are considered to be viable for smaller concentrate volumes from inland brackish water
desalination plants.
299 There is very little data on the costs of inland brine disposal. Most of the techniques are very
costly in comparison with disposal to the sea, surface water or sewers, table 6.3 and figure 6.2. Figure 6.2
is only indicative of the relative costs of brine disposal.
Table 6.4 Cost Comparison of Brine Concentrate Disposal
Concentrate disposal options Cost (US$/m³) Critical factors
Surface water 0.03–0.30 Piping, pumping, and outfall construction
Deep well injection
Evaporation pond
0.33–2.64
1.18–10.04
Tubing diameter and depth, injection rate, chemical costs
Pond size and depth, salt concentration, evaporation rate,
disposal rate, pond liner cost
Source: Greenlee and others 2009. Costs include annualized capital and O&M costs.
300 Many of the factors considered in brine evaporation also are applicable to collection and
evaporation of agricultural drainage, although the agricultural waters typically have far lower
concentrations of total dissolved solids.
Table 6.3 The Challenges of brine disposal
Method of Disposal Capital
Costa
O&M
Costsa
Land
Required
Env
Impact Energy
Public
Concerns Geology
Surface water La L
a - M-H
f L
b H -
Deep Wells M-H M L L M L-M He
Evaporation Ponds H Lc H M
d L H
d H
Land Spreading M L H M-H Lb H H
Thermal Evaporation H H Ld L
d L
g L L
Sewers La,b
La, b
- Md L
b L -
Source: Modified after National Academy of Sciences (USA). 2008. Desalination - A National Perspective.
Table 4-5.
Notes: Magnitude of challenge: L = low; M = medium; H = High. a Costs are highly site-specific; general trends in relative costs are indicated; cost for surface water or sewer discharge can be
higher if the distance from desalination facility to the discharge water body or sewer is large, necessitating long pipelines
and/or pumping facilities.
b Energy use for surface water or sewer discharge or land application can possibly be higher if the distance from desalination
facility to the discharge water body, sewer, or land application site is large, possibly necessitating pumping facilities.
c O&M costs for evaporation ponds can possibly be higher if a significant amount of monitoring wells and associated water
quality analysis are required.
d Permitting complexity and environmental impacts of surface water, sewer disposal and thermal evaporation can possibly be
higher if the feedwater-to-desalination process contains contaminants of concern that could be concentrated to toxic levels in
the concentrated slurry or solids that are produced from this concentrate treatment process.
e Requires good hydrogeological information to avoid contamination of fresh water aquifers.
f Climate can indirectly influence surface water discharge by affecting the quantity of surface water available for dilution. g. Generally NAS indicated this as ‗H‘ because of the high solar radiation potential this is rated ‗L‘ in the MENA region.
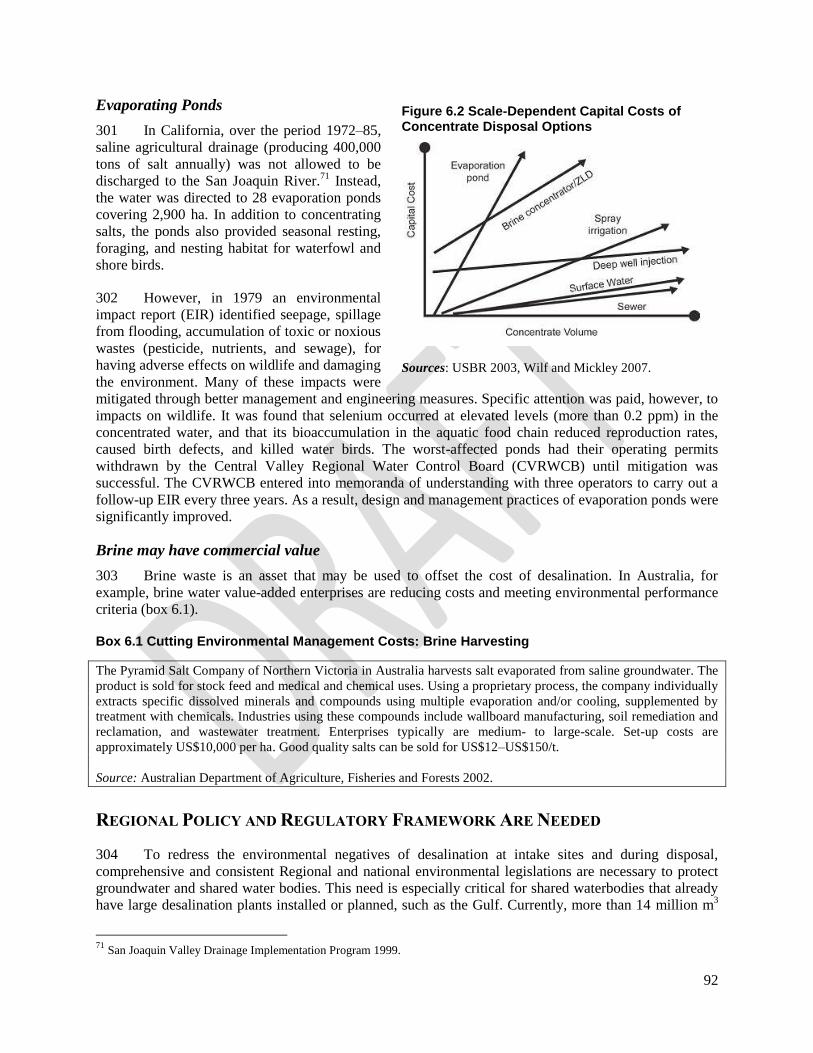
92
Evaporating Ponds
301 In California, over the period 1972–85,
saline agricultural drainage (producing 400,000
tons of salt annually) was not allowed to be
discharged to the San Joaquin River.71
Instead,
the water was directed to 28 evaporation ponds
covering 2,900 ha. In addition to concentrating
salts, the ponds also provided seasonal resting,
foraging, and nesting habitat for waterfowl and
shore birds.
302 However, in 1979 an environmental
impact report (EIR) identified seepage, spillage
from flooding, accumulation of toxic or noxious
wastes (pesticide, nutrients, and sewage), for
having adverse effects on wildlife and damaging
the environment. Many of these impacts were
mitigated through better management and engineering measures. Specific attention was paid, however, to
impacts on wildlife. It was found that selenium occurred at elevated levels (more than 0.2 ppm) in the
concentrated water, and that its bioaccumulation in the aquatic food chain reduced reproduction rates,
caused birth defects, and killed water birds. The worst-affected ponds had their operating permits
withdrawn by the Central Valley Regional Water Control Board (CVRWCB) until mitigation was
successful. The CVRWCB entered into memoranda of understanding with three operators to carry out a
follow-up EIR every three years. As a result, design and management practices of evaporation ponds were
significantly improved.
Brine may have commercial value
303 Brine waste is an asset that may be used to offset the cost of desalination. In Australia, for
example, brine water value-added enterprises are reducing costs and meeting environmental performance
criteria (box 6.1).
Box 6.1 Cutting Environmental Management Costs: Brine Harvesting
The Pyramid Salt Company of Northern Victoria in Australia harvests salt evaporated from saline groundwater. The
product is sold for stock feed and medical and chemical uses. Using a proprietary process, the company individually
extracts specific dissolved minerals and compounds using multiple evaporation and/or cooling, supplemented by
treatment with chemicals. Industries using these compounds include wallboard manufacturing, soil remediation and
reclamation, and wastewater treatment. Enterprises typically are medium- to large-scale. Set-up costs are
approximately US$10,000 per ha. Good quality salts can be sold for US$12–US$150/t.
Source: Australian Department of Agriculture, Fisheries and Forests 2002.
REGIONAL POLICY AND REGULATORY FRAMEWORK ARE NEEDED
304 To redress the environmental negatives of desalination at intake sites and during disposal,
comprehensive and consistent Regional and national environmental legislations are necessary to protect
groundwater and shared water bodies. This need is especially critical for shared waterbodies that already
have large desalination plants installed or planned, such as the Gulf. Currently, more than 14 million m3
71
San Joaquin Valley Drainage Implementation Program 1999.
Figure 6.2 Scale-Dependent Capital Costs of Concentrate Disposal Options
Sources: USBR 2003, Wilf and Mickley 2007.
93
of fresh water per day is produced from the Gulf. Countries along the Gulf are projected to expand their
desalination capacity, tapping from the same water and disposing of the waste water (brine) back to the
same waterbody. Serious care should be taken to safeguard the health of a shared waterbody. Moreover,
for the measures to be effective, all countries that use water from, and/or discharge wastewater to, the
shared seas should jointly plan and implement necessary measures.
305 Except for the 1976 the Barcelona Convention on the Mediterranean both the Red Sea and the
Gulf have no agreed environmental regulatory framework within which beneficiary countries can
coordinate monitoring, planning and implementation of mitigation measures. To ensure implementation
of agreed mitigation measures, it is critical that the countries that share the same seas initiate and agree
common environmental planning and regulatory frameworks.
306 Joint studies and continuous monitoring also should be undertaken by scientists from all countries
involved. It is especially important for the countries to better understand the adverse impacts of brine
surface water disposal on marine ecosystems and inland disposal on groundwater aquifers. Reports from
such studies should be published openly and used for planning purposes as well. Countries also may pool
their resources (for example, in the form of a multi-donor trust fund) to finance continuous scientific
studies and monitoring, and to finance preparation of projects that comply with agreed environmental
standards.
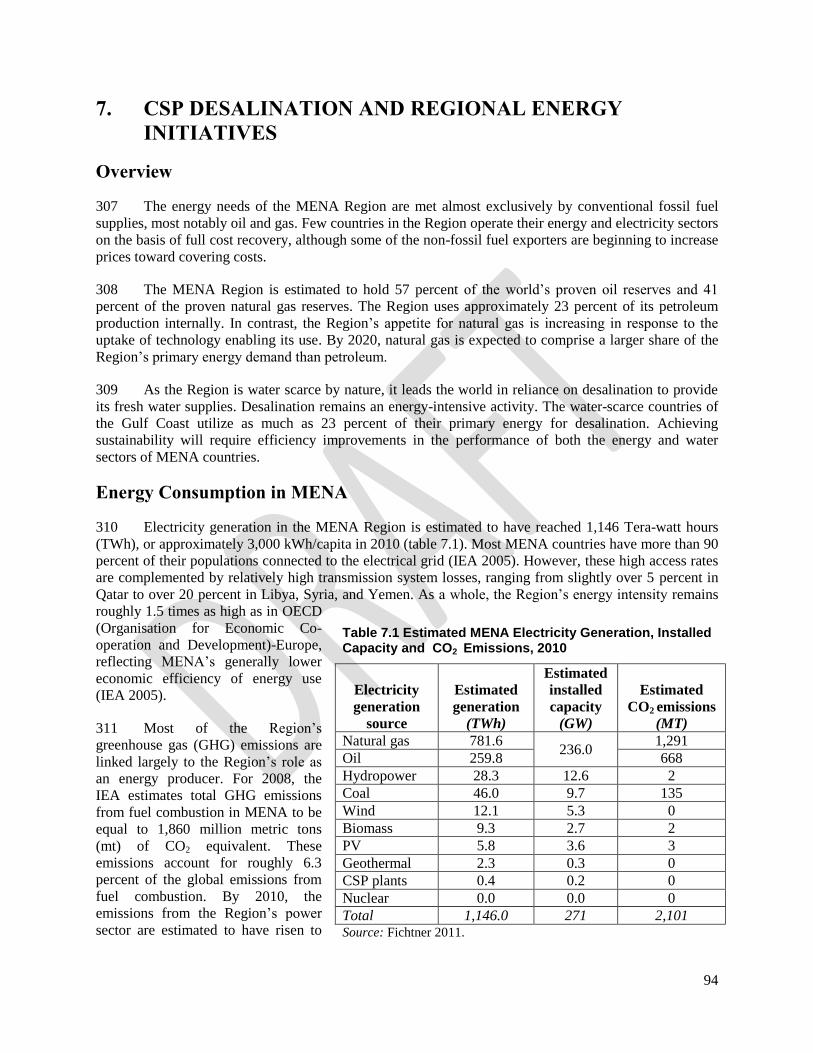
94
7. CSP DESALINATION AND REGIONAL ENERGY
INITIATIVES
Overview
307 The energy needs of the MENA Region are met almost exclusively by conventional fossil fuel
supplies, most notably oil and gas. Few countries in the Region operate their energy and electricity sectors
on the basis of full cost recovery, although some of the non-fossil fuel exporters are beginning to increase
prices toward covering costs.
308 The MENA Region is estimated to hold 57 percent of the world‘s proven oil reserves and 41
percent of the proven natural gas reserves. The Region uses approximately 23 percent of its petroleum
production internally. In contrast, the Region‘s appetite for natural gas is increasing in response to the
uptake of technology enabling its use. By 2020, natural gas is expected to comprise a larger share of the
Region‘s primary energy demand than petroleum.
309 As the Region is water scarce by nature, it leads the world in reliance on desalination to provide
its fresh water supplies. Desalination remains an energy-intensive activity. The water-scarce countries of
the Gulf Coast utilize as much as 23 percent of their primary energy for desalination. Achieving
sustainability will require efficiency improvements in the performance of both the energy and water
sectors of MENA countries.
Energy Consumption in MENA
310 Electricity generation in the MENA Region is estimated to have reached 1,146 Tera-watt hours
(TWh), or approximately 3,000 kWh/capita in 2010 (table 7.1). Most MENA countries have more than 90
percent of their populations connected to the electrical grid (IEA 2005). However, these high access rates
are complemented by relatively high transmission system losses, ranging from slightly over 5 percent in
Qatar to over 20 percent in Libya, Syria, and Yemen. As a whole, the Region‘s energy intensity remains
roughly 1.5 times as high as in OECD
(Organisation for Economic Co-
operation and Development)-Europe,
reflecting MENA‘s generally lower
economic efficiency of energy use
(IEA 2005).
311 Most of the Region‘s
greenhouse gas (GHG) emissions are
linked largely to the Region‘s role as
an energy producer. For 2008, the
IEA estimates total GHG emissions
from fuel combustion in MENA to be
equal to 1,860 million metric tons
(mt) of CO2 equivalent. These
emissions account for roughly 6.3
percent of the global emissions from
fuel combustion. By 2010, the
emissions from the Region‘s power
sector are estimated to have risen to
Table 7.1 Estimated MENA Electricity Generation, Installed Capacity and CO2 Emissions, 2010
Electricity
generation
source
Estimated
generation
(TWh)
Estimated
installed
capacity
(GW)
Estimated
CO2 emissions
(MT)
Natural gas 781.6 236.0
1,291
Oil 259.8 668
Hydropower 28.3 12.6 2
Coal 46.0 9.7 135
Wind 12.1 5.3 0
Biomass 9.3 2.7 2
PV 5.8 3.6 3
Geothermal 2.3 0.3 0
CSP plants 0.4 0.2 0
Nuclear 0.0 0.0 0
Total 1,146.0 271 2,101 Source: Fichtner 2011.
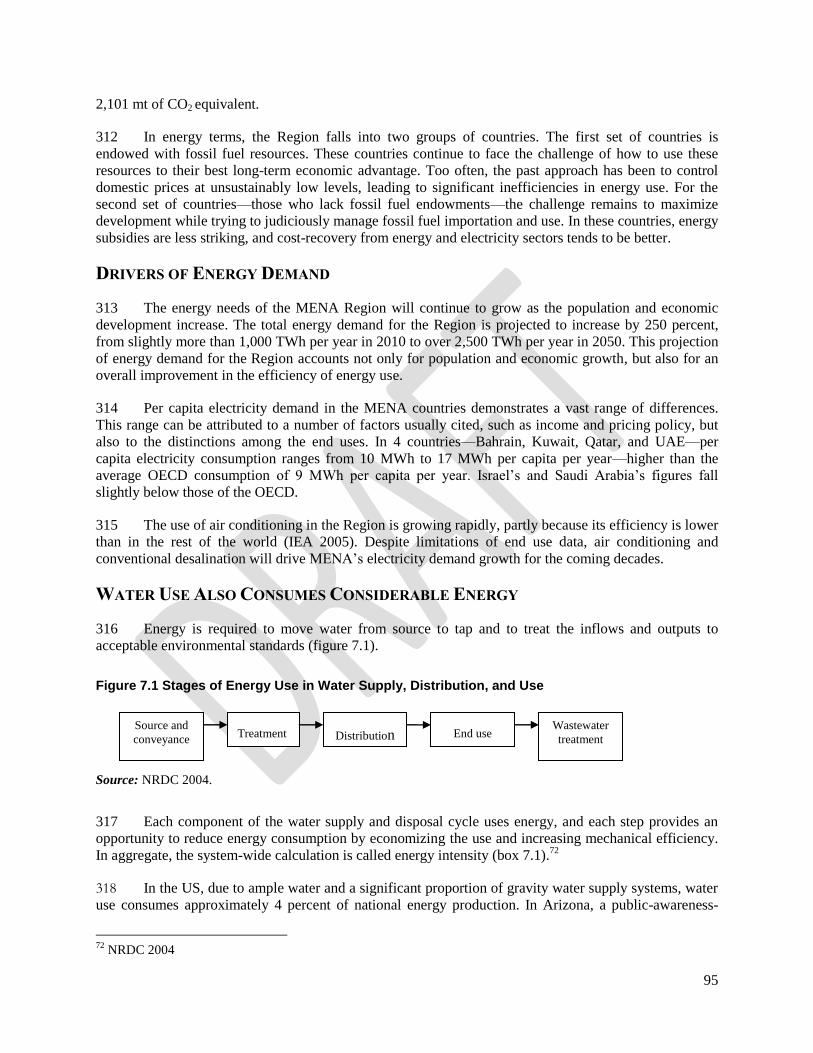
95
2,101 mt of CO2 equivalent.
312 In energy terms, the Region falls into two groups of countries. The first set of countries is
endowed with fossil fuel resources. These countries continue to face the challenge of how to use these
resources to their best long-term economic advantage. Too often, the past approach has been to control
domestic prices at unsustainably low levels, leading to significant inefficiencies in energy use. For the
second set of countries––those who lack fossil fuel endowments––the challenge remains to maximize
development while trying to judiciously manage fossil fuel importation and use. In these countries, energy
subsidies are less striking, and cost-recovery from energy and electricity sectors tends to be better.
DRIVERS OF ENERGY DEMAND
313 The energy needs of the MENA Region will continue to grow as the population and economic
development increase. The total energy demand for the Region is projected to increase by 250 percent,
from slightly more than 1,000 TWh per year in 2010 to over 2,500 TWh per year in 2050. This projection
of energy demand for the Region accounts not only for population and economic growth, but also for an
overall improvement in the efficiency of energy use.
314 Per capita electricity demand in the MENA countries demonstrates a vast range of differences.
This range can be attributed to a number of factors usually cited, such as income and pricing policy, but
also to the distinctions among the end uses. In 4 countries—Bahrain, Kuwait, Qatar, and UAE––per
capita electricity consumption ranges from 10 MWh to 17 MWh per capita per year—higher than the
average OECD consumption of 9 MWh per capita per year. Israel‘s and Saudi Arabia‘s figures fall
slightly below those of the OECD.
315 The use of air conditioning in the Region is growing rapidly, partly because its efficiency is lower
than in the rest of the world (IEA 2005). Despite limitations of end use data, air conditioning and
conventional desalination will drive MENA‘s electricity demand growth for the coming decades.
WATER USE ALSO CONSUMES CONSIDERABLE ENERGY
316 Energy is required to move water from source to tap and to treat the inflows and outputs to
acceptable environmental standards (figure 7.1).
Figure 7.1 Stages of Energy Use in Water Supply, Distribution, and Use
Source: NRDC 2004.
317 Each component of the water supply and disposal cycle uses energy, and each step provides an
opportunity to reduce energy consumption by economizing the use and increasing mechanical efficiency.
In aggregate, the system-wide calculation is called energy intensity (box 7.1).72
318 In the US, due to ample water and a significant proportion of gravity water supply systems, water
use consumes approximately 4 percent of national energy production. In Arizona, a public-awareness-
72
NRDC 2004
Source and
conveyance Treatment Distribution End use
Wastewater
treatment
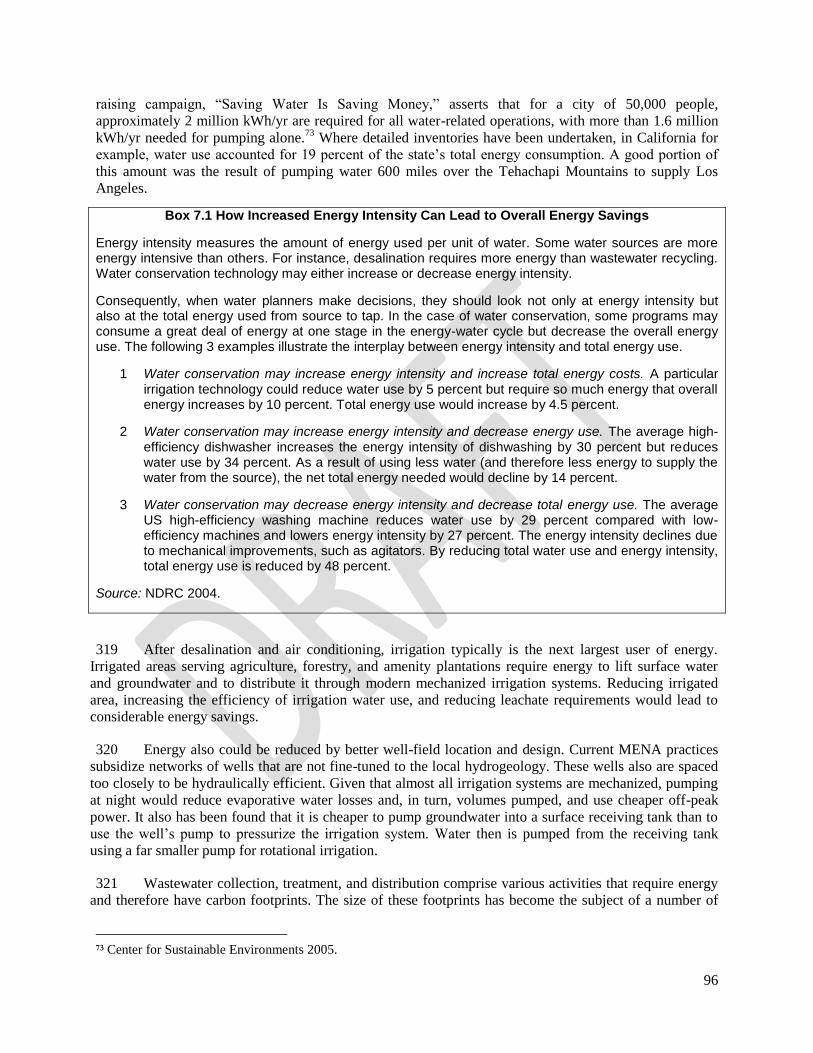
96
raising campaign, ―Saving Water Is Saving Money,‖ asserts that for a city of 50,000 people,
approximately 2 million kWh/yr are required for all water-related operations, with more than 1.6 million
kWh/yr needed for pumping alone.73
Where detailed inventories have been undertaken, in California for
example, water use accounted for 19 percent of the state‘s total energy consumption. A good portion of
this amount was the result of pumping water 600 miles over the Tehachapi Mountains to supply Los
Angeles.
Box 7.1 How Increased Energy Intensity Can Lead to Overall Energy Savings
Energy intensity measures the amount of energy used per unit of water. Some water sources are more energy intensive than others. For instance, desalination requires more energy than wastewater recycling. Water conservation technology may either increase or decrease energy intensity.
Consequently, when water planners make decisions, they should look not only at energy intensity but also at the total energy used from source to tap. In the case of water conservation, some programs may consume a great deal of energy at one stage in the energy-water cycle but decrease the overall energy use. The following 3 examples illustrate the interplay between energy intensity and total energy use.
1 Water conservation may increase energy intensity and increase total energy costs. A particular irrigation technology could reduce water use by 5 percent but require so much energy that overall energy increases by 10 percent. Total energy use would increase by 4.5 percent.
2 Water conservation may increase energy intensity and decrease energy use. The average high-efficiency dishwasher increases the energy intensity of dishwashing by 30 percent but reduces water use by 34 percent. As a result of using less water (and therefore less energy to supply the water from the source), the net total energy needed would decline by 14 percent.
3 Water conservation may decrease energy intensity and decrease total energy use. The average US high-efficiency washing machine reduces water use by 29 percent compared with low-efficiency machines and lowers energy intensity by 27 percent. The energy intensity declines due to mechanical improvements, such as agitators. By reducing total water use and energy intensity, total energy use is reduced by 48 percent.
Source: NDRC 2004.
319 After desalination and air conditioning, irrigation typically is the next largest user of energy.
Irrigated areas serving agriculture, forestry, and amenity plantations require energy to lift surface water
and groundwater and to distribute it through modern mechanized irrigation systems. Reducing irrigated
area, increasing the efficiency of irrigation water use, and reducing leachate requirements would lead to
considerable energy savings.
320 Energy also could be reduced by better well-field location and design. Current MENA practices
subsidize networks of wells that are not fine-tuned to the local hydrogeology. These wells also are spaced
too closely to be hydraulically efficient. Given that almost all irrigation systems are mechanized, pumping
at night would reduce evaporative water losses and, in turn, volumes pumped, and use cheaper off-peak
power. It also has been found that it is cheaper to pump groundwater into a surface receiving tank than to
use the well‘s pump to pressurize the irrigation system. Water then is pumped from the receiving tank
using a far smaller pump for rotational irrigation.
321 Wastewater collection, treatment, and distribution comprise various activities that require energy
and therefore have carbon footprints. The size of these footprints has become the subject of a number of
73 Center for Sustainable Environments 2005.
97
investigations in the world. The results vary according to the treatment processing and distribution
systems. In Abu Dhabi, for example, the annual consumption of electricity from processing wastewater in
2007 approximated 95,000 MWh. Using the estimated carbon emission of 380g equivalent per Wh results
in a carbon footprint of 36,100 tons per year.
Managing the Barriers to Renewable-Energy-Based Desalination
MENA CSP INITIATIVE
322 To keep up with demand, installed electricity-generating capacity in the Region will almost
double by 2050. In addition, most of the existing installed capacity will need to be replaced. The future
market for new electricity-generating capacity is both large and assured. These circumstances represent an
ideal opportunity to reduce dependence on fossil fuels and to introduce RE alternatives, including CSP.
323 The MENA CSP initiative aims to accelerate CSP expansion through a 1.0 GW program
comprising 11 commercial-scale power plants and 2 regional transmission projects: the Tunisia-Italy
transmission project and the Mashreq CSP transmission project. These projects will contribute to
Mediterranean grid enhancement and exports. The initiative aims at mobilizing $5.6 billion to accelerate
deployment of CSP projects in Algeria, Egypt, Jordan, Morocco, and Tunisia. The initiative already has
been awarded $750 million from the Clean Technology Fund––part of the World-Bank-managed Climate
Investment Funds––in recognition of the initiative‘s important role in promoting clean energy and low
carbon growth in developing countries.
324 The MENA Region is the least expensive place globally to reduce costs for CSP through
manufacturing economies of scale. These result from the physical attributes of the Region combined with
potential access to the high-paying EU green electricity markets enhanced by the Union for the
Mediterranean and the eligibility for financing under international climate change instruments. Since the
launch of the Union for Mediterranean in 2008, the two following premises that underpin the
Mediterranean Solar Plan have been widely discussed and recognized:
a. Europe can meet its decarbonization objectives more efficiently by tapping resources in
neighboring countries, particularly the Southern Mediterranean countries.
b. Exports are essential to scale up RE in the Region, and such exports would be mutually
beneficial.
325 In view of the economic development impacts and cost reduction possibilities, MENA countries
also are especially keen to increase local manufacturing capacity for CSP. A preliminary assessment
shows that the potential of MENA countries to manufacture components of the CSP plants is high. All
construction works at the plant site, including the basic infrastructure works, installation of the solar field,
and construction of the power blocks and storage systems, could be undertaken by local companies. Thus,
local work could account for roughly 17 percent of the total CSP investment. Similarly, the mounting
structure could be supplied locally if local companies could adapt manufacturing processes to produce
steel or aluminum components with the required accuracy. For the more complex components, local
industry development would depend largely on the anticipated growth in the size of the regional and
global solar electricity markets. Such components would require joint ventures or foreign direct
investment (FDI) to install new production facilities in MENA. The current investment scale-up of 1.0
GW already offers multiple opportunities to be explored.
326 Already in Egypt, the solar field of the 20 MW Kureymat project was tendered to a local
company, Orascom Construction. The company‘s bid was based on its capability to locally manufacture
the frame of the solar parabolic trough in its subsidiary company, National Steel Manufacturing (NSM).
98
Orascom had to subcontract for both the mirrors and the tubes; nevertheless, the company has gained
huge experience in assembling and testing both components. Orascom also implemented the civil and
electrical works. The local component represented 50 percent of the total solar field work.
POLICY CHALLENGES AND OPPORTUNITIES
327 To position themselves as technology and market leaders in the CSP industry, MENA countries
are taking steps that demonstrate their commitment to reforms in the electricity sector, particularly in
regard to favoring greater integration of renewable energies in their energy systems. These steps include,
notably:
1) Gradually removing subsidies on fossil fuels to provide price signals to consumers. These signals
will encourage energy efficiency on the demand side and create a level playing field on the
generation side to make their RE technologies competitive.
2) Limiting electricity demand growth through demand-side management (DSM) and other
measures. Demand is growing at 6 percent–9 percent p.a. in most MENA countries, partly due to
inefficient use of electricity. Given that CSP and other renewable energy technologies have high
capital costs, capacity additions are to be undertaken in an optimal manner that duly considers the
rational use of energy to limit demand growth.
3) Creating a transitional incentive scheme until cost reduction in CSP is achieved, exports are
possible, and fossil fuel subsidies are removed.
328 Several of the MENA countries are taking key steps to promote RE as discussed below. A more
complete list of initiatives taken by each MENA countries is included in Annex I:
ALGERIA
329 Algeria heavily subsidizes energy prices. The country thus functions as a key driver of promoting
inefficient use of energy and the resulting high energy intensity. In view of the increasing energy
intensity, the government has emphasized energy efficiency and RE options while considering energy
pricing issues as appropriate and creating funding mechanisms. The resources of the fund include taxes on
natural gas and electricity, and an initial government contribution. Additional resources may include taxes
on energy intensive equipments, penalties, loan reimbursements, and government or other contributions.
330 The government also has taken steps to support renewables and CSP in particular. Under a 2004
Decree, premiums are granted for electricity produced from RE resources. For hybrid solar-gas power
plants (when solar accounts for at least 25 percent of the plant‘s production), the Decree states that the
premium will be 200 percent of the average system price. For pure solar plants, the premium will be 300
percent of the average system price. The actual premium level will be updated based on data from the
plants that become operational.
EGYPT
331 The prices for energy products in Egypt generally are below economic cost. The resulting implicit
subsidies to the economy are quite large: in 2009, energy subsidies came to US$11 billion. To bring
sector finances and energy consumption onto a more sustainable path and to reduce the fiscal burden of
energy consumption, in 2004 the government initiated a series of energy price increases. Due to the
political uncertainties, the future pace of these adjustments remains uncertain. In addition to the steps on
reforms, the government is facilitating RE development through specific policy interventions. In March
2010, the Supreme Energy Council approved key policy steps related to scaling up wind and CSP. These
99
steps were proposed under the new electricity law but have yet to be submitted to Parliament. They
include:
a. Approval of the need to cover additional costs for RE projects through tariffs
b. Approval of zero customs duty on wind and CSP equipment
c. Finalization of the land use policy for wind and CSP developers
d. Acceptance of foreign-currency-denominated power purchase agreements (PPAs) and
confirmation of central bank guarantees for all build-own-operate (BOO) projects
e. Permitting support for developers with respect to environmental, social, and defense permits.
JORDAN
332 Jordan is one of the first countries in the Region to initiate fundamental reforms in the electricity
sector. The country has made significant progress in carrying out these reforms including phasing out
subsidies and introducing the private sector. Currently, although electricity tariffs are largely cost
reflective, some cross-subsidies remain embedded in the tariff structure. After the relevant studies are
completed to ensure end-user tariffs are appropriately cost reflective, the regulatory commission plans to
integrate an automatic fuel price adjustment mechanism to tariff calculations.
333 In addition to these reforms, which will help level the playing field for competing energy
technologies, the government is taking steps to create a favorable policy environment for renewables. In
February 2010, a Renewable Energy and Energy Efficiency Law (REEE Law) was ratified. The REEE
Law established a Jordan Renewable Energy and Energy Efficiency Fund (Jordan REEF), which will help
mobilize financial and technical support for RE and energy efficiency efforts, including from the
government‘s budgetary contribution. Among others, the REEE Law commits to introduce a minimum of
500 MW of RE-generated power and a registry of land available for use based on resources maps and
measurements, the purchase of all renewable power, and interconnection benefits. Moreover, the
Government of Jordan has granted an import tax exemption for RE equipment. Currently, the government
is preparing a RE transaction strategy that is expected to be approved by the cabinet by the end of the
year.
MOROCCO
334 Both petroleum products and electricity are sold to consumers at below the cost of supply through
a compensation system. In the case of petroleum products, the system is administered by the state. In the
case of electricity, state support goes to the national electricity company, ONE. To lessen the burden on
state finances, a reform of the energy price system is becoming an imperative, especially at a time when
the government committed to financing solar energy from 2009 onwards.
335 On November 2, 2009, HM King Mohammed VI announced a landmark US$9 billion Solar Plan.
The plan intends to install 2,000 MW of solar power generation capacity by 2020. Installation will begin
with the ambitious Ouarzazate 500 MW CSP project, which is being developed based on a public-private
business model. In addition to fostering low-carbon development of the energy sector and enhancing
energy security, the implementation of this plan will stimulate large investments and enhance Morocco‘s
competitiveness. The legal, regulatory, and institutional framework is being set up with several laws
enacted in early 2010, including the renewable energy law, the law creating the Solar Agency to
implement the Solar Plan, and the law setting up the Energy Efficiency Agency.
TUNISIA
336 Tunisia subsidizes electricity prices as there is a significant gap between Société Tunisienne de
l’Electricité et du Gaz (STEG‘s) average selling price and the company‘s supply cost (20 percent–30
100
percent in the last 4 years). The company receives a subsidy to make up for the difference. In addition,
power prices are indirectly subsidized through low gas transfer prices. Petroleum product prices are
indexed with caps and floors to limit the extent of price fluctuations.
337 A rational use of energy always has been a priority in Tunisia. A presidential program covering
the period 2010–14 recently reinforced the objectives. Its targets for 2014 are a 10 percent reduction in
energy intensity, the addition of 430 MW of renewable power generation capacity (a 5-fold increase in
installed capacity), and complete elimination of fluorescent lamps by 2014.
338 The Tunisian Solar Plan (TSP) was launched in December 2009 for the period 2010–16 and aims
to increase the share of RE and energy efficiency. 40 projects have been identified (in solar, wind, and
biomass), for a total investment amount of EUR 2 billion, 1.4 of which is to be provided by the private
sector. Over the period 2010–30, Tunisia expects to save 10 mtoe of fossil fuels through its energy
conservation efforts, 80 percent from energy efficiency, and 20 percent from RE. Interconnection with
Europe to facilitate exports is a key element of the TSP, as is the development of a local equipment
industry to contribute to economic growth and job creation.
KINGDOM OF SAUDI ARABIA
339 The Kingdom of Saudi Arabia (KSA) is well endowed with primary energy resources. It
has the largest proven oil reserves in the world as well as significant gas resources. Saudi Arabia
exports approximately 2.7 billion barrels of oil per year (EIA, January 2011). Due to increasing
population and growing economy, the Kingdom‘s domestic consumption of electricity has been
on the rise in the past few decades. The demand for electricity in the Kingdom is projected to
triple in the next 20 years. It is estimated that domestic fossil-based fuel demand in the Kingdom
will reach over 8 million bbl/d (oil equivalent) by 2030 if there were no improvements in energy
efficiency and current trends continued. This is not sustainable and will jeopardize the
Kingdom‘s oil export revenues if current trends continue.
340 It this growing recognition of the ever increasing domestic energy demand and the huge
potential for solar energy in the Kingdom that, for sustainable and long-term development,
integration of renewable energy will be important. As a result, the government has established
the King Abdullah City for Atomic and Renewable Energy (KA-CARE) to lead renewable
energy development in the country, and position the Kingdom as an energy exporter and not just
an oil exporter over a medium and long-term. Despite its significant potential, renewable energy
has yet to play a significant role beyond the level of research and pilot projects up to now in
KSA. Given the favorable conditions for solar and wind energy in the Region and the long-term
need for the OPEC countries to develop income generation independent from oil exports, KA-
CARE has been created with a mandate to contribute to sustainable development in the Kingdom
and to help meet Saudi Arabia's future electricity demand as well as to assist transition the
Kingdom to a balanced energy mix, and strengthening Saudi Arabia's ability to meet future
international demand for oil.
341 KA-CARE is looking into exploring and developing the Kingdoms solar, wind and
geothermal resources. The Kingdom is also investing significantly to develop the technology and
human capacity required to build an important new economic sector focused on alternative
energy. This sector will create new business and job opportunities for the Kingdom's citizens,
which will help diversify the economy, improve quality of life, and make Saudi Arabia a world
leader in alternative energy.
101
342 Similarly, the Kingdom is actively developing renewable energy desalination as an
alternative to conventional energy desalination that is increasingly consuming significant portion
of the nation‘s domestic oil production. For example, the King Abdulaziz City for Science and
Technology (KACST) is building the world's largest solar-powered desalination plant in the city of Al-
Khafji to produce 30,000 cubic meters of desalinated water per day (under phase-1) to meet the needs of
100,000 people. The plant will use a concentrated solar photovoltaic (PV) technology and new water-
filtration technology, which KACST developed with IBM. The plant is expected to be operational the end
of 2012.
343 In terms of energy policy, the Kingdom is looking at providing incentives to encourage
investment in the field through feed in tariffs and central procurement approach.
102
8. CONCLUSIONS
CURRENT MENA WATER SHORTAGE WILL INCREASE 5-FOLD BY 2050
344 The ever-growing water gap in the MENA Region has two solutions: better demand
management, and new sources of water.
DEMAND MANAGEMENT MUST BE FIRST PRIORITY
345 Toward 2050, managing demand, particularly of agricultural water use, will be the key to reduce
the high costs of closing the MENA Region‘s water gap. Not only does current demand exceed renewable
supplies but also global warming likely will reduce water supplies below even current levels. Failure to
save water and reduce uneconomic agricultural use will have severe socio-economic repercussions
because, once renewable water resources are used up, the only effective source of new water will be
desalination of seawater and brackish groundwater.
346 Implementing demand management and increasing water supplies to fill MENA‘s 2050 water gap
of almost 200 km3 will be challenging and expensive. The most important finding is that managing
agricultural water demand, even if more difficult to plan and predict, could provide as much water as new
desalination.
347 Using the principle of cost optimization—to use the least expensive water first and the most
expensive water last, as much as 78 km3 of water could be saved at less than US$0.05/m
3. The least
expensive options to save water could come from improving agricultural cropping systems and trade,
improving irrigation water use, and expanding reservoir capacity. Reallocating water used in low-value
irrigation to other uses would increase water supply by additional 24 km3. However, reallocation would
be almost twice as expensive as improving water use within agriculture. After all these demand
management measures have been fully exploited, the unmet demand gap still would be approximately 97
km3. Using recycled domestic and industrial wastewater costing US$0.30/m
3 and recycled irrigation water
costs US$0.40/m3 would increase water supply by an additional 21 km
3. 74
The remaining water gap of 76
km3 could be filled only by expensive desalination.
SUPPLY MANAGEMENT OPTIONS ARE LIMITED
348 Given that rivers in MENA are the most dammed in the world, and given the likely negative
impacts of global warming on the Region‘s water availability, additional reservoirs to increase water
supply will have only limited potential. Wastewater reuse and desalination hold the most potential to add
new water to the system.
349 Given that actual domestic consumption of water accounts for approximately 10 percent of
household demand in the Region, the potential for reuse is large. If only 50 percent of this potential
wastewater were recycled, it could add 20 km3–40 km
3 per year to MENA‘s renewable water resources by
2050. Although growth of wastewater will be driven by population growth, wastewater will need
investment to extend collection and treatment networks. Most importantly, wastewater recycling needs to
be explicitly included in national water planning policies, and well-designed campaigns are needed to
ensure peoples‘ acceptance of its use.
74
Recycling domestic and industrial wastewater will add 13 km3 whereas recycling industrial wastewater alone will
add approximately 8 km3.
103
MENA WILL RELY INCREASINGLY ON DESALINATION
350 Desalination has proved to be a technically feasible supply solution to MENA‘s water gap and
will continue to be so.
351 Both distillation and membrane desalination technologies require large energy inputs. When
fossil fuels are used, these energy sources account for between one-third and one-half of fresh water
production costs and will exacerbate global warming.
352 The expected greater reliance on desalination will cause a regional shift in the proportion of
MENA‘s energy devoted to water supply. It will also demand greater attention to the adverse
environmental impacts associated with desalination: greenhouse gas emission from fossil fuels and
management of brine concentrate by-products. While the brine management problem will increase,
greenhouse gas emission can be very significantly reduced using RE alternatives.
SOLAR ENERGY: MENA’S ABUNDANT RENEWABLE RESOURCE
353 The Region‘s virtually unlimited solar irradiance––several times larger than current world energy
demand––and proven solar energy power generation technologies will ensure an environmentally
sustainable desalinated water supply to MENA and ensure energy security to the water sector. However,
to make these energy sources more competitive and viable for use by most of MENA‘s population,
actions must be taken today to encourage investments in the continued development of renewable energy
and increasing the efficiency of desalination technologies. Of the various renewable energy (RE)
technologies available, concentrating solar power (CSP) is the best match because it is scalable to
demand, can provide both peak and base-load electricity and, with heat storage and oversized solar
collectors, it can provide firm power 24 hours a day.
354 If RE replaces fossil fuels except for peaking power, MENA‘s annual CO2 emissions could be
reduced to 265 million tons by 2050––which is less than the current emissions.
355 CSP-desalination will take time to mainstream because most fossil-fueled desalination plants will
not be totally decommissioned until 2041–43. During this period, it will be essential that the supply of
CSP-desalination technology keep pace with demand because, without this technology, a number of
countries will have to mine their groundwater reserves even more intensively to survive in the short to
medium term. Moreover, in this interim period, CSP still will need to be supplemented by fossil fuels for
some base-load and peak-power generation.
356 Desalination through renewable energy can benefit from renewable energy momentum in MENA
countries, as evidenced by the range of policies and targets being set. In particular, synergies can be built
with the vision of ―green energy‖ exports to Europe from the MENA countries. The MENA CSP
initiative also is likely to leverage access to markets and financing for CSP. The key barrier to CSP
deployment is its present high cost. However, the potential to lower costs is high. Strategic commitment
from countries, linked to green energy exports to Europe, and local manufacturing show great promise
and need to be pursued proactively.
357 Similarly, countries in the Region, especially the GCC countries to increase their share of RE in
the overall energy share is encouraging. Notable examples are from UAE‘s MASDAR, Qatar‘s Qatar
National Food Security Program (QNFSP), and Saudi Arabia‘s King Abdullah City for Atomic and
Renewable Energy (KA-CARE).
104
COSTS OF INACTION WILL BE HIGH
358 Desalination will continue to play an ever-increasing role in MENA‘s water supply portfolio.
However, if the current trend of using fossil fuel for desalination continues in the future, many countries
in MENA will face serious energy security problems in general and economic problems for oil exporting
countries in particular.
359 By 2050, filling the water gap will cost approximately 6 percent of current regional GDP. Given
that regional GDP will grow by 2050, the actual average share of GDP devoted to providing water supply
will be lower. Countries will differ markedly based on the severity of their water shortages and projected
GDP. In the future, Iraq, Jordan, Morocco, and Yemen must be prepared to spend a substantial amount of
their GDP on overcoming their water shortages––in Yemen, for example, this may be as much as 4
percent of its GDP.
360 Environmental implications of desalination in terms of carbon footprint and safe brine disposal
are also going to be significant by 2050. Comprehensive and consistent Regional and national
environmental legislations are necessary to protect groundwater and shared water bodies from pollution.
For the measures to be effective, it is important for countries to jointly plan and implement necessary
measures. Joint studies and continuous monitoring also should be undertaken to better understand the
adverse impacts of brine surface water disposal on marine ecosystems and inland disposal on groundwater
aquifers.
THE SOLUTION IS AT HAND
361 MENA will reap major benefits from coupling desalination with renewable energy sources.
Doing so will ensure a sustainable water supply, energy security to the water sector, and environmental
sustainability.
362 However, to make these sources more competitive, actions must be taken today to encourage
investments in renewable energy technologies and improvements in desalination efficiency.
105
REFERENCES
Abderrahman, W.A. 2001. ―Water Demand Management in Saudi Arabia.‖ In Water Management in
Islam, ed. N.I. Faruqui, A.K. Biswas and M.J. Bino, 68–78. Ottowa: IDRC (International
Development Research Centre); Tokyo: UNU Press (United Nations University Press).
http://web.idrc.ca/es/ev-93954-201-1-DO_TOPIC.html
Al Jahani, A.A. 2008. ―Dugong‘s Waning Populace in Arabian Gulf: A Chronicle.‖ MoEW (Ministry of
Environment and Water), Abu Dhabi, Dubai.
http://uaeagricent.moew.gov.ae/fisheries/Dugong_e.stm
Al-Mogrin, S. 2003. ―Saudi Arabia Country Paper.‖ In Proceedings: Expert Consultation for Launching
the Regional Network on Wastewater Re-use in the Near East. FAO (Food and Agriculture
Organization of the United Nations, Regional Office for the Near East); WHO (World Health
Organization, Regional Office for the Easter Mediterranean), 94–105. Cairo.
ftp://ftp.fao.org/docrep/fao/008/y5186e/y5186e00.pdf
Bahri, A. (2008a). ―Case Studies in Middle Eastern and North African countries.‖ In Water Reuse: An
international Survey of Current Practice, Issues and Needs (eds. B. Jimenez and T. Asano). IWA
Publishing, London.
Borsani, R., and S. Rebagliati. 2005. ―Fundamentals and Costing of MSF Desalination Plants and
Comparisons with Other Technologies.‖ Desalination 182: 29–37. Presented at the Conference on
Desalination and the Environment, Santa Margherita, Italy, May 22–26.
http://www.desline.com/articoli/6641.pdf
Bouhamidi, R. 2005. ―Morocco Water Concessions Case Study.‖ Background paper to Making the Most
of Scarcity: Accountability for Better Water Management Results in the Middle East and North
Africa. World Bank, Washington, D.C.
Brown, C., and P. Rogers. 2006. “Effect of Forecast-Based Pricing on Irrigated Agriculture: A
Simulation.‖ Journal of Water Resources Planning and Management 132 (6): 403–14.
http://ascelibrary.org/wro/resource/1/jwrmd5/v132/i6/p403_s1?isAuthorized=no
Bruce Shallard & Associates. 2003. ―Fish Resource Assessment Survey Project of Abu Dhabi and UAE
Waters.‖ Project Report presented to the Environmental Research and Wildlife Development
Agency (ERWDA), Abu Dhabi, March.
CEDARE (Center for Environment and Development for the Arab Region and Europe). 2005. ―Status of
Integrated Water Resource Management (IWRM) Plans in the Arab Region.‖ Review undertaken
by CEDARE in its capacity as AWC (Arab Water Council) Interim Technical Secretariat in
cooperation with UNDP (United Nations Development Programme), Cairo, December.
http://water.cedare.int/cedare.int/files15%5CFile2298.pdf
CGIAR (Consultative Group on International Agricultural Research). 2011. ―Research and Impact: Areas
of Research: Wheat.‖ Washington D.C. http://www.cgiar.org/impact/research/wheat.html
Chapagain, A.K., and A.Y. Hoekstra. 2003. ―Virtual Water Flows Between Nations in Relation to Trade
in Livestock and Livestock Products.‖ Value of Water Research Report Series No. 13, UNESCO-
IHE, Institute for Water Education.
106
http://www.unesco-ihe.org/Project-activities/Project-Portfolio/Virtual-Water-Trade-Research-
Programme/Chapagain-A.K.-Hoekstra-A.Y.-2003-.-Virtual-water-flows-between-nations-in-
relation-to-trade-in-livestock-and-livestock-products-Value-of-Water-Research-Report-Series-No.-
13-UNESCO-IHE
Chesher, R.H. 1975. ―Biological Impact of a Large-Scale Desalination Plant at Key West, Florida.‖ In
Tropical Marine Pollution, ed. E.J. Ferugson Wood and R.E. Johannes, 99–181. New York:
Elsevier Scientific.
CIESIN (Center for International Earth Science Information Network), YCELP (Yale Center for
Environmental Law and Policy). 2002. ―2002 Environmental Sustainability Index: An Initiative of
the Global Leaders of Tomorrow Environmental Task Force, World Economic Forum.‖ Annual
Meeting 2002, Main Report, New York: Columbia University, New Haven: Yale University,
March. http://sedac.ciesin.columbia.edu/es/esi/ESI2002_21MAR02tot.pdf
Cintrón, G., W. Maddux, and P.R. Burkholder. 1970. ―Some Consequences of Brine Pollution in the
Bahía Fosforescente, Puerto Rico.‖ Limnology and Oceanography 15 (2): 246–49.
Cohen, R., B. Nelsen, and G. Wolff. 2004. ―Energy down the Drain: The Hidden Costs of California‘s
Water Supply.‖ NRDC (National Resources Defense Council), Pacific Institute Oakland, Ca.,
August. http://www.nrdc.org/water/conservation/edrain/edrain.pdf
Commonwealth of Australia. 2002. ―Summary Report: Introduction to Desalination Technologies in
Australia.‖ Department of Agriculture, Fisheries and Forestry, Canberra, September 2.
http://www.environment.gov.au/water/publications/urban/pubs/desalination-summary.pdf
––––––. Water Act 2007, No. 137 ComLaw C2011C00621.
––––––. 2011. ―Restoring the Balance in the Murray-Darling Basin.‖ Department of Sustainability,
Environment, Water, Population and Communities, Canberra, September 26.
http://www.environment.gov.au/water/policy-programs/entitlement-purchasing/index.html
Del Pilar Ruso, Y., J.A. De la Ossa Carretero, F. Giménez Casaduero, and J. L. Sánchez Lizaso. 2007.
―Spatial and Temporal Changes in Infaunal Communities Inhabiting Soft-Bottoms Affected by
Brine Discharge.‖ Marine Environmental Research 64(4): 492–503.
Di Prima. 2007. In FutureWater 2011. ―Middle-East Northern Africa Water Outlook, Final Report.‖
Future Water Report: 98, commissioned by the World Bank. Immerzeel, W., P. Droogers, W.
Terink, J. Hoogeveen, P. Hellegers, and M. Bierkens (auth.). Wageningen, Netherlands, April.
http://www.futurewater.nl/wp-content/uploads/2011/04/Final_Report_v11.pdf
DLR (Deutsches Zentrum für Luft- und Raumfahrt e.V.). 2005. ―MED-CSP: Concentrating Solar Power
for the Mediterranean Region.‖ Final Report, study commissioned by Federal Ministry for the
Environment, Nature Conservation and Nuclear Safety, Germany, Stuttgart, April 2005.
www.dlr.de/tt/med-csp
EAD (Environmental Agency-Abu Dhabi). 2009. ―Abu Dhabi Water Resources Master Plan.‖ Abu
Dhabi, United Arab Emirates, January.
http://www.ead.ae/_data/global/abu%20dhabi%20water%20resources%20master%20plan%20-
%20english%20reduced%20file%20size.pdf
107
EIO (Eco-Innovation Observatory). 2011. ―The Eco-Innovation Challenge: Pathways to A Resource-
Efficient Europe.‖ Funded by the European Commission, Directorate General Environment,
Brussels. http://www.eco-innovation.eu/media/ECO_report_2011.pdf
Elimelech, M., and W.A. Phillip. 2011. ―The Future of Seawater Desalination: Energy, Technology, and
the Environment.‖ Science 5 (333): 712–17.
European Union. 1977. Council Decision of 25 July 1977 concluding the Convention for the Protection
of the Mediterranean Sea against Pollution and the Protocol for the Prevention of the Pollution of
the Mediterranean Sea by Dumping from Ships and Aircraft (Barcelona Convention). 77/585/EEC
of September 19, 1977, O.J. L 240.
European Union. 2011. European Commission High Representative of the European Union for Foreign
Affairs and Security Policy, Brussels, 25/05/2011 SEC (2011) 648; Joint Staff Working Paper;
Implementation of the European Neighborhood Policy in 2010; Country Report: Jordan; COM
(2011) 303‖ http://ec.europa.eu/world/enp/pdf/progress2011/sec_11_641_en.pdf
––––––. 1991. Council Directive Concerning Urban Wastewater Treatment. 91/271 EEC of May 21,
1991, O.J. NO L135/40 of May 30, 1991.
FAO (Food and Agriculture Organization of the United Nations). 1978. ―Fisheries Studies for the
Countries of the Gulf States and Arabian Peninsular: Three Studies in One Volume.‖ RNEA
(Regional Office for the Near East), Cairo, FAO Online Catalogues. http://www4.fao.org/cgi-
bin/faobib.exe?rec_id=142107&database=faobib&search_type=link&table=mona&back_path=/fa
obib/mona&lang=eng&format_name=EFMON
––––––. 2006. ―World Agriculture: Towards 2030/2050: Prospects for Food, Nuitrition, Agriculture and
Major Commodity Groups.‖ Interim report, global perspectives studies unit, Rome, June.
http://www.fao.org/fileadmin/user_upload/esag/docs/Interim_report_AT2050web.pdf
Fichtner (Fichtner GmbH & Co. KG) and DLR (Deutsches Zentrum für Luft- und Raumfahrt e.V.) 2011.
―MENA Regional Water Outlook, Part II, Desalination Using Renewable Energy, Task 1 –
Desalination Potential.‖ Stuttgart, Germany, March.
http://www.dlr.de/tt/Portaldata/41/Resources/dokumente/institut/system/projects/MENA_REGIO
NAL_WATER_OUTLOOK.pdf
––––––. 2011. ―MENA Regional Water Outlook, Part II, Desalination Using Renewable Energy, Task 2
– Energy Requirements‖. Stuttgart, Germany, March.
––––––. 2011. ―MENA Regional Water Outlook, Part II, Desalination Using Renewable Energy, Task 3
– Concentrate Management‖. Stuttgart, Germany, March.
FutureWater 2011. ―Middle-East Northern Africa Water Outlook, Final Report.‖ Future Water Report:
98, commissioned by the World Bank. Immerzeel, W., P. Droogers, W. Terink, J. Hoogeveen, P.
Hellegers, and M. Bierkens (auth.). Wageningen, Netherlands, April.
http://www.futurewater.nl/wp-content/uploads/2011/04/Final_Report_v11.pdf
108
GAEZ (Global Agro-Ecological Zones) database, CD-ROM FAO/IIASA, 2000, accessed October 21,
2011, http://www.iiasa.ac.at/Research/LUC/GAEZ/index.htm
Glueckstern, P., and M. Priel. 2003. ―Optimization of Boron Removal in Old and New SWRO Systems.‖
Desalination 156: 219–28. Paper presented at the European Conference on ―Desalination and the
Environment: Fresh Water for All,‖ Malta, May 4–8.
Greenlee, L.F., D.F. Lawler, B.D. Freeman, B. Marrot, and P. Moulin. 2009. ―Reverse Osmosis
Desalination: Water Sources, Technology, and Today‘s Challenges.‖ Water Research 43: 2317–
48.
GWI (Global Water Intelligence). 2009. ―Water Tariff Survey.‖ Oxford.
http://www.globalwaterintel.com/tariff-survey/
––––––. 2010. ―GWI Desalination Database, Country Profiles.‖ Oxford. http://desaldata.com/
––––––. 2010. ―Desalination Markets 2010.‖ Presented by Christopher Gasson at webinar, Oxford,
September 8. http://www.globalwaterintel.com/desalmarkets/introductary-webinar/
––––––. 2010. ―Desal Shocks.‖ Global Water Intelligence 11 (9).
http://www.globalwaterintel.com/archive/11/9/need-to-know/desal-shocks.html.
––––––. 2010. ―GWI Desalination Market Forecast March 2010: DesalForecastMarch2010.xls.‖ Oxford.
––––––. 2010. ―23rd
Inventory 2010‖. Excel File containing the updated desalination plant inventory,
received on October 26, 2010. Oxford.
Hashemite Kingdom of Jordan. 2010. Renewable Energy and Energy Efficiency Law (REEE). Law No. 3
of 2010, authorized translation.
http://www.memr.gov.jo/Portals/0/Renewable%20Energy%20Law%20Translation.pdf
Heaney, J., M. Martin, and M. Morales. 2009. ―Methods for Estimating Commercial, Industrial, and
Institutional Water Use.‖ Proc. Florida Section of AWWA Fall Conference, Orlando, December.
http://library.conservefloridawater.org/publications/10327351.pdf
Hellegers, P.J.G.J. 2006. ―The Role of Economics in Irrigation Water Management.‖ Irrigation and
Drainage 55: 157–63.
Hoekstra, A.Y., and P.Q. Hung. 2002. ―Virtual Water Trade: A Quantification of Virtual Water Flows
Between Nations in Relation to International Crop Trade.‖ Value of Water Research Report Series
No. 11, UNESCO-IHE, Delft, Netherlands, September. http://www.unesco-ihe.org/Project-
activities/Project-Portfolio/Virtual-Water-Trade-Research-Programme/Hoekstra-A.Y.-Hung-P.Q.-
2002-.-Virtual-water-trade-A-quantification-of-virtual-water-flows-between-nations-in-relation-to-
international-crop-trade-Value-of-Water-Research-Series-No.-11-UNESCO-IHE
Höpner, T., and J. Windelberg. 1996. ―Elements of Environmental Impact Studies on Coastal
Desalination Plants.‖ Desalination 108: 11–18.
Humpal, D., and K. Jacques. 2003. ―Draft Report on Bumpers and Import Sensitivity Analysis for
Moroccan Table Olives and Olive Oil,‖ prepared for USAID under the raise sanitary and
109
phytosanitary services (SPS) contract with financing from the Middle East Partnership Initiative
(MEPI), November. http://pdf.usaid.gov/pdf_docs/PNACX907.pdf
IEA (International Energy Agency), and OECD (Organisation for Economic Cooperation and
Development). 2005. ―World Energy Outlook 2005, Middle East and North Africa Insights.‖
Paris. http://www.iea.org/weo/docs/weo2005/WEO2005.pdf
IPCC (Intergovernmental Panel on Climate Change). 2007. ―Climate Change 2007: Synthesis Report.‖
Contribution to Working Groups I, II and III to the Fourth Assessment Report of the IPCC,
Geneva, Switzerland. http://www.ipcc.ch/pdf/assessment-report/ar4/syr/ar4_syr.pdf
––––––. 2011. Special Report on Renewable Energy Sources and Climate Change Mitigation. Final
Release, Working Group III – Mitigation of Climate Change, ed. O. Edenhofer, R. Pichs-Madruga,
Y. Sokona, K. Seyboth, P. Matschoss, S. Kadner, T. Zwickel, P. Eickemeier, G. Hansen, S.
Schlömer, C. von Stechow. Cambridge; New York: Cambridge University Press. http://srren.ipcc-
wg3.de/report/IPCC_SRREN_Full_Report.pdf
Jenkins, S.A., and J.B. Graham. 2006. ―Oceanographic Considerations for Desalination Plants in
Southern Californian Coastal Waters,‖ Part 1 and 2, presentation given at meeting of National
Research Council Committee on Advancing Desalination Technology, Irvine, Ca.
http://escholarship.org/uc/item/9br897dx
Kingdom of Morocco. Moroccan Agency for Solar Energy. Moroccan Solar Plan, presented on
November 2, 2009. http://www.masen.org.ma/index.php?Id=42&lang=en#/_
Kingdom of Saudi Arabia (KSA). 2009. Draft Water Strategy for the Kingdom of Saudi Arabia, prepared
by the World Bank.
Labre, J. 2009. Quoting a report on ―Water reuse markets 2005–2015‖, published by GWI (Global Water
Intelligence).
Latorre, M. 2005. ―Environmental Impact of Brine Disposal on Posidonia Seagrasses.‖ Desalination 182:
517–24.
Lattemann, S., and T. Höpner. 2003. Seawater Desalination Impacts of Brine and Chemical Discharges
on the Marine Environment. Rome, Italy: Balaban Desalination Publications.
––––––. 2008. ―Impacts of Seawater Desalination Plants on the Marine Environment of the Gulf.‖ In
Protecting the Gulf’s Marine Ecosystems from Pollution, ed. A. Abuzinada, H.-J. Barth, F. Krupp,
B. Böer and T. Abdelsalaam, 191–205. Basel, Switzerland: Birkhäuser Verlag.
Lehner, B., G. Czisch, and S. Vassolo. 2005. ―The Impact of Global Change on the Hydropower
Potential of Europe: A Model-Based Analysis.‖ Energy Policy 33: 839–55.
Lehner, B., and P. Döll. 2004. ―GLWD (Global Lakes and Wetlands Database).‖ GLWD Documentation,
July, 2004
http://www.worldwildlife.org/science/data/GLWD_Data_Documentation.pdf
Mauguin, G., and P. Corsin. 2005. ―Concentrate and Other Waste Disposals from SWRO Plants:
Characterization and Reduction of Their Environmental Impact.‖ Desalination 182: 355–64.
110
McIntosh, A.C. 2003. ―Asian Water Supplies: Reaching the Poor. A Guide and Sourcebook on Urban
Water Supplies in Asia for Governments, Utilities, Consultants, Development Agencies, and
Nongovernmental Organizations.‖ Asian Development Bank and International Water Association,
London, August.
http://www.adb.org/Documents/Books/Asian_Water_Supplies/asian_water_supplies.pdf
Mickley, M. 2007. ―RO Concentrate Management.‖ In The Guidebook to Membrane Desalination
Technology, Reverse Osmosis, Nanofiltration and Hybrid Systems Process, Design, Applications
and Economics, ed. M. Wilf. Rome, Italy: Balaban Desalination Publications.
Mohsen, M.S., and O.R. Al-Jayyousi. 1999. ―Brackish Water Desalination: An Alternative for Water
Supply Enhancement in Jordan.‖ Desalination 124: 163–74.
NAS (National Academy of Sciences). 2008. Desalination: A National Perspective. Committee on
Advancing Desalination Technology, Water Science and Technology Board, Division of Life and
Earth Studies, National Research Council of the National Academies. Washington, D.C.: The
National Academies Press.
Ofwat (The Water Services Regulation Authority). 2009. ―Price Review.‖
http://www.ofwat.gov.uk/pricereview/pr09faqs/
Papapetrou, M., M. Wieghaus, and C. Biercamp. 2010. Roadmap for the Development of Desalination
Powered by Renewable Energy. PRODES (Promotion of Renewable Energy for Water Production
Through Desalination). Stuttgart, Germany: Fraunhofer Verlag.
http://www.prodes-project.org/fileadmin/Files/ProDes_Road_map_on_line_version.pdf
Pitafi, B.A., and J.A. Roumasset. 2004. ―Watershed Conservation and Efficient Groundwater Pricing.‖
Paper prepared for the AAEA (American Agricultural Economics Association) Annual Meeting,
Denver, Co., August 1–4. http://ageconsearch.umn.edu/bitstream/20133/1/sp04pi02.pdf
Po, M., Kaercher, J. D., and Nancarrow, B. E. 2004. ―Literature Review of Factors Influencing Public
Perceptions of Water Reuse.‖ CSIRO Land and Water, Australian Water Conservation and Reuse
Research Program. http://www.clw.csiro.au/publications/technical2003/tr54-03.pdf
Po, M., and B.E. Nancarrow. 2004. ―Consumer Perceptions of the Use of Reclaimed Water for
Horticultural Irrigation: A Literature Review for Land and Water Australia.‖ CSIRO Land and
Water Consultancy Report, Perth, February.
Purnama, A., H.H. Al-Barwani, and S. Smith. 2005. ―Calculating the Environmental Cost of Seawater
Desalination in the Arabian Marginal Seas.‖ Desalination 185: 79–86.
REMix 2010. SRU (Sachverständigenrat für Umweltfragen). 2010. „Möglichkeiten und Grenzen der
Integration verschiedener regenerativer Energiequellen zu einer 100% regenerativen
Stromversorgung der Bundesrepublik Deutschland bis zum Jahr 2050.― DLR (Deutsches Zentrum
für Luft- und Raumfahrt). Nr. 42 Materialien zur Umweltforschung.
http://www.umweltrat.de/SharedDocs/Downloads/DE/03_Materialien/2010_MAT42_DZLR_Integ
ration_Energiequellen_2050.html?nn=395728
République Tunisienne, Ministère de l‘Industrie et de la Technologie. 2009. ―Plan Solaire Tunisien.‖
December. http://www.industrie.gov.tn/fr/
111
Reuters. 2008. ―Saudi Arabia Scraps Wheat Growing to Save Water.‖ January 8.
http://www.reuters.com/article/2008/01/08/idUSL08699206
Roberts, D.A., E.-L. Johnston, and N.A. Knott. 2010. ―Impacts of Desalination Plant Discharges on the
Marine Environment: A Critical Review of Published Studies.‖ Water Research 44: 5117–28.
Ruta, G. 2005. ―Deep Wells and Shallow Savings: The Economic Aspect of Groundwater Depletion in
MENA Countries.‖ Background paper to ―Making the Most of Scarcity: Accountability for Better
Water Management Results in the Middle East and North Africa,‖ World Bank, Washington, D.C.
Sandia. 2008. ―Stirling Energy Systems Set New World Record for Solar-To-Grid Conversion
Efficiency.‖ February 12. https://share.sandia.gov/news/resources/releases/2008/solargrid.html
Sideek, M. S. M., M.M. Fouda, and G.V. Hermosa. 1997. ―Demersal Fisheries of the Arabian Sea, the
Gulf of Oman and the Arabian Gulf.‖ Paper presented at the ―International Conference on the
Biology of Coastal Environments‖, Bahrain, June 4. Estuarine, Coastal and Shelf Science 1999
(49): 87–97.
Siebert, S., P. Doll, S. Feick, J. Hoogeveen, and K. Frenken. 2007. Global Map of Irrigation Areas
version 4.0.1. Land and Water Digital Media, Series 34. Johann Wolfgang Goethe University,
Frankfurt am Main, Germany: Food and Agriculture Organization of the United Nations, Rome,
Italy. http://www.fao.org/nr/water/aquastat/irrigationmap/index10.stm
The Economist. 2008. ―Tapping the Oceans. Environmental Technology: Desalination Turns Salty Water
into Fresh Water. As Concern Over Water‘s Scarcity Grows, Can It Offer a Quick Technological
Fix?‖ Technology Quarterly. June 5. http://www.economist.com/node/11484059
The National. 2010. ―End to Subsidy for Farmers‘ Rhodes Grass.‖ Abu Dhabi, September 28.
http://www.thenational.ae/news/uae-news/environment/end-to-subsidy-for-farmers-rhodes-grass
––––––. 2010. ―Potential Answer to Scourge of Red Tide.‖ Abu Dhabi, May 28.
http://www.thenational.ae/news/uae-news/environment/potential-answer-to-scourge-of-red-tide
The San Joaquin Valley Drainage Implementation Program. 1999. ―Task 4, Evaporation Ponds, Final
Report.‖ Evaporation Ponds Technical Committee, University of California Salinity/Drainage
Program. Ca., February.
http://www.water.ca.gov/pubs/groundwater/evaporation_ponds_final_report__san_joaquin_valley
_drainage_implementation_program/06-evapponds.pdf
The 2030 Water Resources Group. 2009. ―Charting Our Water Future: Economic Frameworks to Inform
Decision-Making.‖
http://www.2030waterresourcesgroup.com/water_full/Charting_Our_Water_Future_Final.pdf
Torresol Energy. 2011. Newspaper library. ―Gemasolar will be the main project presented by Torresol
Energy in Solar Power International 2011.‖
September.http://www.torresolenergy.com/TORRESOL/Press/gemasolar-will-be-the-main-
project-presented-by-torresol-energy-in-solar-power-international-2011
Torzewski, A., and J. Müller. 2009. ―Is the Multi Stage Flash Evaporator Obsolescent?‖ Conference
paper presented at the EDS (European Desalination Society) conference ―Desalination for the
Environment‖, Baden-Baden, Germany, May 17-20.
112
Trieb, F., et al. 2005. ―Concentrating Solar Power for the Mediterranean Region (MED-CSP).‖ Final
Report of the DLRITT (DLR Institute of Technical Thermodynamics), commissioned by the
Federal Ministry for the Environment, Nature Conservation and Nuclear Safety (BMU), Stuttgart,
Germany. http://www.dlr.de/tt/med-csp
Trieb, F., and H. Müller-Steinhagen. 2008. ―Concentrating Solar Power for Seawater Desalination in the
Middle East and North Africa.‖ Desalination 220 (1–3): 165–83.
Trieb, F., H. Müller-Steinhagen, and J. Kern. 2011. ―Financing Concentrating Solar Power in the Middle
East and North Africa: Subsidy or Investment?‖ Energy Policy 39: 307–17.
Tsitourtis, N. 2008. ―Criteria and Procedure for Selecting a Site for a Desalination Plant.‖ Desalination
221 (1–3): 114–25.
Tunisian Republic. MAERH (Ministry of Agriculture, Environment and Water Resources). 2005.
―Rapport d‘avancement du PISEAU.‖ Tunis, Tunisia.
––––––. Ministry of Agriculture and Hydraulic Resources. 2006. Presentation to a Seminar on
―Integrated Water Resources Management,‖ Rabat, Morocco, January.
UNDP (United Nations Development Programme), FAO (Food and Agriculture Organization of the
United Nations), The World Bank, WHO (World Health Organization). 1992. ―Wastewater
Treatment and Reuse in the Middle East and North Africa Region: Unlocking the Potential.‖
Review Draft. Report of a joint mission to Cyprus, Egypt, Jordan, Kuwait, Morocco, Saudi Arabia,
Syria, Tunisia, Turkey and Yemen. Project RAB/88/009. July.
United Arab Emirates. The Abu Dhabi Regulation and Supervision Bureau. 2009. ―Switched on.‖ Annual
Report for the Water, Wastewater and Electricity Sector in the Emirate of Abu Dhabi.
http://www.rsb.gov.ae/uploads/AnnualReport2009.pdf
––––––. Ministry of Environment and Water. 2010. United Arab Emirates Water Conservation Strategy.
United States Bureau of Reclamation (USBR). 2003. ―Desalination and Water Purification Technology
Roadmap: A Report to Executive Committee‖ Discussion facilitated by Sandia National
Laboratories and the U.S. Department of Interior, Bureau of Reclamation, Denver, January.
http://www.usbr.gov/pmts/water/media/pdfs/report095.pdf
WCD (World Commission on Dams). 2000. Dams and Development: A New Framework for Decision-
Making. The report of the World Commission on Dams. London: Eastern Publication Limited.
http://www.internationalrivers.org/files/world_commission_on_dams_final_report.pdf
WHO (World Health Organization). 2006. Guidelines for Drinking-Water Quality, 3rd
ed. Incorporating
the first and second addenda, Vol. 1, Recommendation. Geneva.
http://www.who.int/water_sanitation_health/dwq/fulltext.pdf
Wichelns, D. 2005. ―The Virtual Water Metaphor Enhances Policy Discussions Regarding Scarce
Resources.‖ Water International 30 (4): 428–37.
World Bank. 2004. ―Seawater and Brackish Water Desalination in the Middle East, North Africa and
Central Asia: A Review of Key Issues and Experiences in Six Countries.‖ Final and Main Report,
113
prepared by a consortium of consultants, consisting of DHV Water BV, Amersfoort, the
Netherlands, and BRL Ingénierie, Nimes, France, December 2004.
http://siteresources.worldbank.org/INTWSS/Resources/Desal_mainreport-Final2.pdf
———. 2004b. Country Water Resources Assistance Strategy for the Islamic Republic of Iran.
Washington, D.C.: World Bank.
———. 2005. ―Republic of Yemen: Country Water Resource Assistance Strategy.‖ Report No. 31779-
YEM. World Bank, Washington, DC.
———. 2006. ―People‘s Democratic Republic of Algeria, Making Best Use of the Oil Windfall with
High Standards for Public Investment. A Public Expenditure Review.‖ Draft Report No. 36270–
DZ. World Bank, Washington, DC.
––––––. 2007. Making the Most of Scarcity: Accountability for Better Water Management Results in the
Middle East and North Africa. Mena Development Report. Washington: World Bank
Publications.http://siteresources.worldbank.org/INTMENA/Resources/Water_Scarcity_Full.pdf
Young, R.A. 2005. Determining the Economic Value of Water: Concepts and Methods. Washington,
D.C.: Resources for the Future. Zhou, Y., and R.S.J. Tol. 2005. ―Evaluating the Costs of
Desalination And Water Transport.‖ Water Resources Research 41, W03003, doi:
10.1029/2004WR003749. http://www.agu.org/pubs/crossref/2005/2004WR003749.shtml
114
ANNEX I. SUMMARY OF RENEWABLE ENERGY POLICIES
AND LEGISLATION IN MENA
1. The energy policies and legislation in MENA countries can be clustered into four main
categories:
(1) Countries that have neither set a target for the promotion of renewable energy sources nor
introduced a renewable energy policy or legislation,
(2) Countries that have to some extent set a target for renewable energy, but have not yet focused on
the introduction of renewable energy policies;
(3) Countries that have set a target for renewable energy and have already established a renewable
energy policy and binding legislation;
(4) Countries that have set a target for renewable energy and are in the course of drafting a renewable
energy law.
2. Countries like Iraq, Djibouti or Oman fall into the first category of countries. Although no energy
target is set, some countries, such as Oman, have initiated steps to promote renewable energy. Oman,
currently implements small scale renewable energy projects within the existing framework.
3. The second category applies mostly to the Gulf Cooperation Council (GCC) countries. Even
though most of these countries have set a target for the promotion of renewable energy, those are often
rather low, between 5-10 percent by 2020. Furthermore, binding renewable energy legislation as well as a
clear and consistent policy framework for renewable energies and energy efficiencies is missing at a
national level in these countries. Instead of an establishment of a legislative or regulatory energy
framework, those countries often focus rather on specific projects. For example, the Masdar City Project
of the United Arab Emirates or the Qatar National Food Security Program, both of which aim to foster the
development and promotion of sustainable energy sources on a project-based approach.
4. Contrary to the GCC countries, most of the Northern African countries have set ambitious targets
for the deployment of renewable energies and have already introduced new energy legislation that
promotes the generation of electricity from renewable energy sources. Morocco, with 42 percent RE mix
in its national energy portfolio, has the most ambitious plan in MENA. Algeria on the other hand has a
comprehensive and far-reaching energy policy, as it is – with Israel – the only MENA country that
incentivizes the deployment of renewable energies by means of feed-in tariffs. Other country legislation,
such as of Egypt, Jordan, Morocco or Tunisia, contain different supportive incentives, for example, public
competitive bidding, tax reductions or dispatching priority. The framework conditions in Morocco,
Algeria and Tunisia also serve the implementation of reference projects of the Desertec initiative.
5. The last category applies to countries such as, for example, to Yemen, Syria and Libya. These
countries have set themselves rather ambitious targets as to the percentage of renewable energy power in
the energy mix and have already started to work on a new energy law that aims to foster the use and
deployment of renewable energy sources. However, the policies and draft legislation of these countries is
often not yet as comprehensive and far-reaching as of the countries that have already enacted a binding
and enforceable law, as it rarely contains provisions on financial mechanisms such as feed-in tariffs or
other incentives.
6. On a regional level, the GCC Supreme Council with the objective to highlight the importance of
joint environmental policies and laws, the GCC common power grid, that is in the course of being
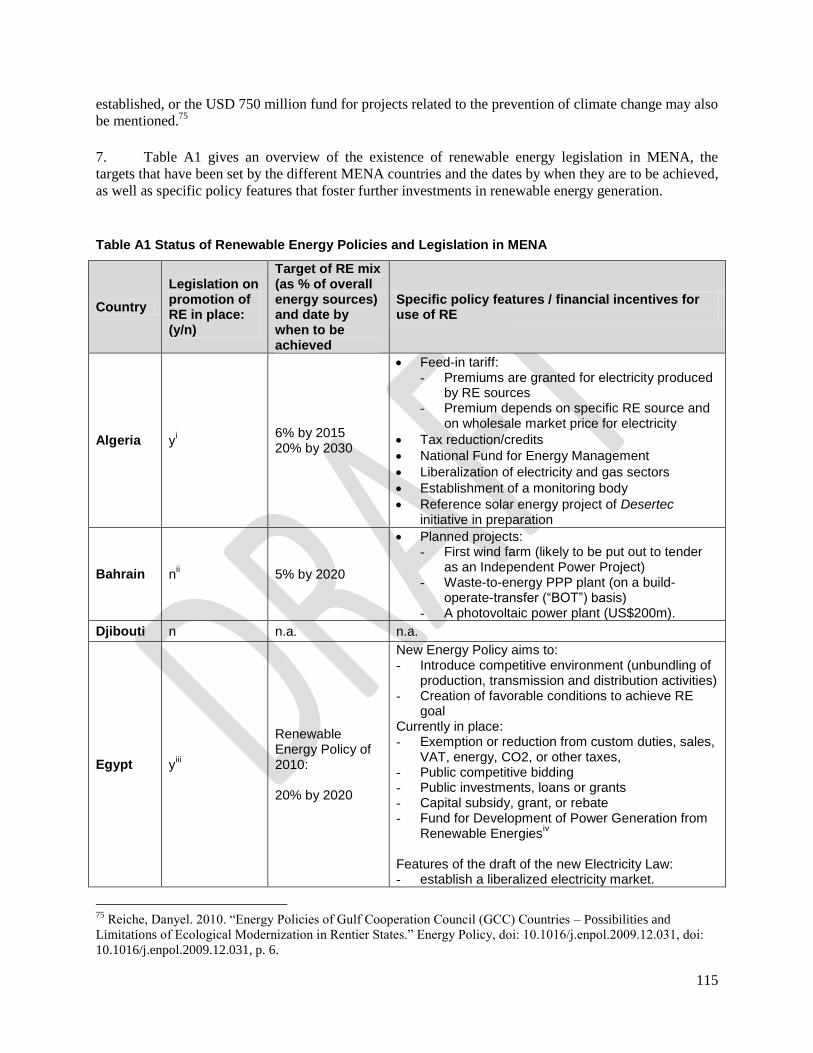
115
established, or the USD 750 million fund for projects related to the prevention of climate change may also
be mentioned.75
7. Table A1 gives an overview of the existence of renewable energy legislation in MENA, the
targets that have been set by the different MENA countries and the dates by when they are to be achieved,
as well as specific policy features that foster further investments in renewable energy generation.
Table A1 Status of Renewable Energy Policies and Legislation in MENA
Country
Legislation on promotion of RE in place: (y/n)
Target of RE mix (as % of overall energy sources) and date by when to be achieved
Specific policy features / financial incentives for use of RE
Algeria yi
6% by 2015 20% by 2030
Feed-in tariff: - Premiums are granted for electricity produced
by RE sources - Premium depends on specific RE source and
on wholesale market price for electricity
Tax reduction/credits
National Fund for Energy Management
Liberalization of electricity and gas sectors
Establishment of a monitoring body
Reference solar energy project of Desertec initiative in preparation
Bahrain nii 5% by 2020
Planned projects: - First wind farm (likely to be put out to tender
as an Independent Power Project) - Waste-to-energy PPP plant (on a build-
operate-transfer (“BOT”) basis) - A photovoltaic power plant (US$200m).
Djibouti n n.a. n.a.
Egypt yiii
Renewable Energy Policy of 2010: 20% by 2020
New Energy Policy aims to: - Introduce competitive environment (unbundling of
production, transmission and distribution activities) - Creation of favorable conditions to achieve RE
goal Currently in place: - Exemption or reduction from custom duties, sales,
VAT, energy, CO2, or other taxes, - Public competitive bidding - Public investments, loans or grants - Capital subsidy, grant, or rebate - Fund for Development of Power Generation from
Renewable Energiesiv
Features of the draft of the new Electricity Law: - establish a liberalized electricity market.
75
Reiche, Danyel. 2010. ―Energy Policies of Gulf Cooperation Council (GCC) Countries – Possibilities and
Limitations of Ecological Modernization in Rentier States.‖ Energy Policy, doi: 10.1016/j.enpol.2009.12.031, doi:
10.1016/j.enpol.2009.12.031, p. 6.
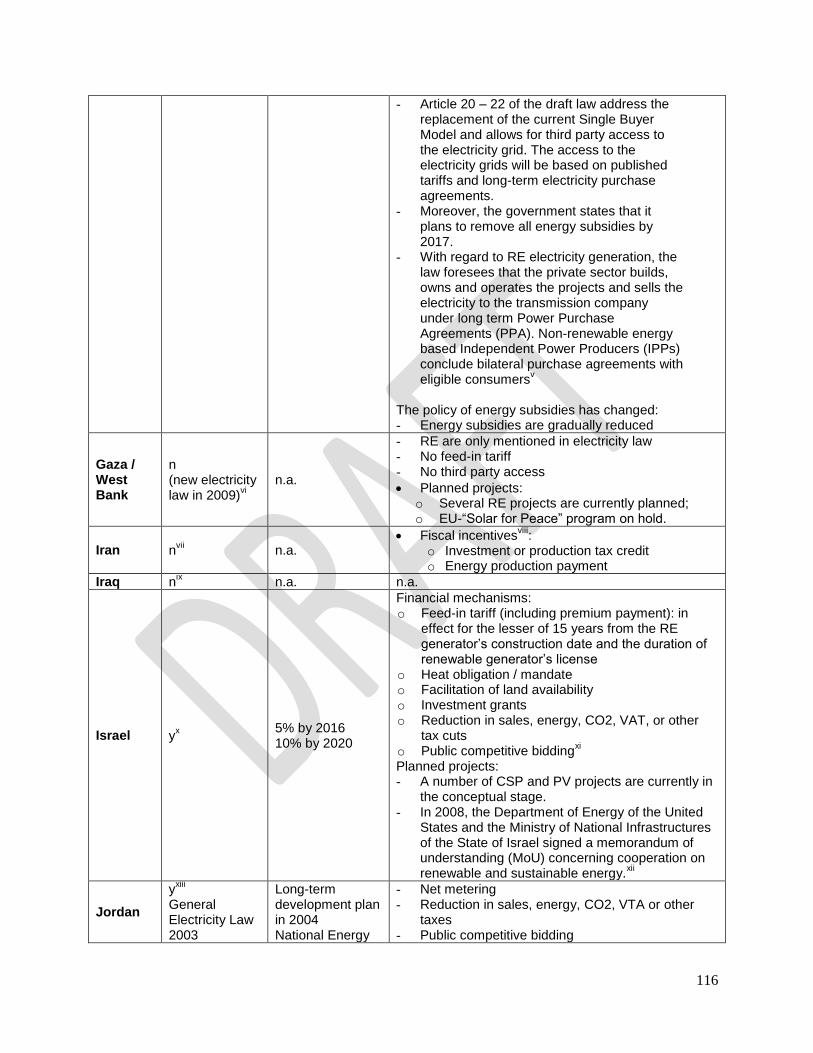
116
- Article 20 – 22 of the draft law address the replacement of the current Single Buyer Model and allows for third party access to the electricity grid. The access to the electricity grids will be based on published tariffs and long-term electricity purchase agreements.
- Moreover, the government states that it plans to remove all energy subsidies by 2017.
- With regard to RE electricity generation, the law foresees that the private sector builds, owns and operates the projects and sells the electricity to the transmission company under long term Power Purchase Agreements (PPA). Non-renewable energy based Independent Power Producers (IPPs) conclude bilateral purchase agreements with eligible consumers
v
The policy of energy subsidies has changed: - Energy subsidies are gradually reduced
Gaza / West Bank
n (new electricity law in 2009)
vi
n.a.
- RE are only mentioned in electricity law - No feed-in tariff - No third party access
Planned projects: o Several RE projects are currently planned; o EU-“Solar for Peace” program on hold.
Iran nvii
n.a. Fiscal incentives
viii:
o Investment or production tax credit o Energy production payment
Iraq nix n.a. n.a.
Israel yx
5% by 2016 10% by 2020
Financial mechanisms: o Feed-in tariff (including premium payment): in
effect for the lesser of 15 years from the RE generator’s construction date and the duration of renewable generator’s license
o Heat obligation / mandate o Facilitation of land availability o Investment grants o Reduction in sales, energy, CO2, VAT, or other
tax cuts o Public competitive bidding
xi
Planned projects: - A number of CSP and PV projects are currently in
the conceptual stage. - In 2008, the Department of Energy of the United
States and the Ministry of National Infrastructures of the State of Israel signed a memorandum of understanding (MoU) concerning cooperation on renewable and sustainable energy.
xii
Jordan
yxiii
General Electricity Law 2003
Long-term development plan in 2004 National Energy
- Net metering - Reduction in sales, energy, CO2, VTA or other
taxes - Public competitive bidding
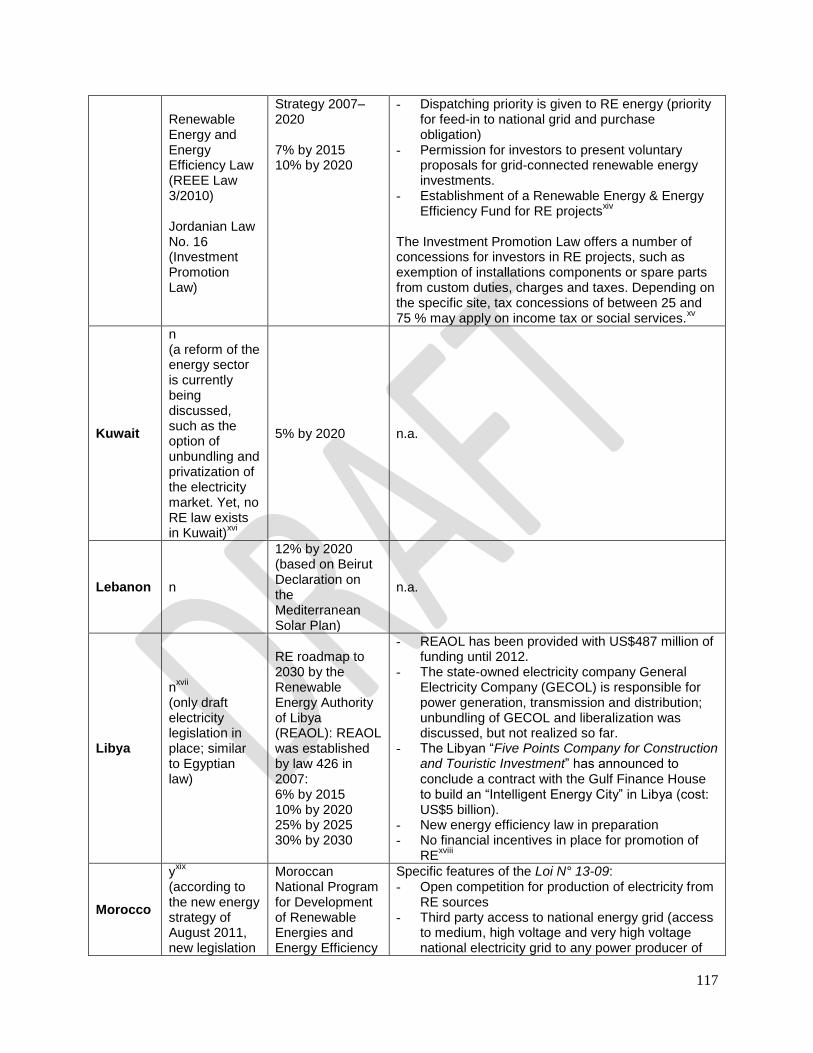
117
Renewable Energy and Energy Efficiency Law (REEE Law 3/2010) Jordanian Law No. 16 (Investment Promotion Law)
Strategy 2007–2020 7% by 2015 10% by 2020
- Dispatching priority is given to RE energy (priority for feed-in to national grid and purchase obligation)
- Permission for investors to present voluntary proposals for grid-connected renewable energy investments.
- Establishment of a Renewable Energy & Energy Efficiency Fund for RE projects
xiv
The Investment Promotion Law offers a number of concessions for investors in RE projects, such as exemption of installations components or spare parts from custom duties, charges and taxes. Depending on the specific site, tax concessions of between 25 and 75 % may apply on income tax or social services.
xv
Kuwait
n (a reform of the energy sector is currently being discussed, such as the option of unbundling and privatization of the electricity market. Yet, no RE law exists in Kuwait)
xvi
5% by 2020 n.a.
Lebanon n
12% by 2020 (based on Beirut Declaration on the Mediterranean Solar Plan)
n.a.
Libya
nxvii
(only draft electricity legislation in place; similar to Egyptian law)
RE roadmap to 2030 by the Renewable Energy Authority of Libya (REAOL): REAOL was established by law 426 in 2007: 6% by 2015 10% by 2020 25% by 2025 30% by 2030
- REAOL has been provided with US$487 million of funding until 2012.
- The state-owned electricity company General Electricity Company (GECOL) is responsible for power generation, transmission and distribution; unbundling of GECOL and liberalization was discussed, but not realized so far.
- The Libyan “Five Points Company for Construction and Touristic Investment” has announced to conclude a contract with the Gulf Finance House to build an “Intelligent Energy City” in Libya (cost: US$5 billion).
- New energy efficiency law in preparation - No financial incentives in place for promotion of
RExviii
Morocco
yxix
(according to the new energy strategy of August 2011, new legislation
Moroccan National Program for Development of Renewable Energies and Energy Efficiency
Specific features of the Loi N° 13-09: - Open competition for production of electricity from
RE sources - Third party access to national energy grid (access
to medium, high voltage and very high voltage national electricity grid to any power producer of
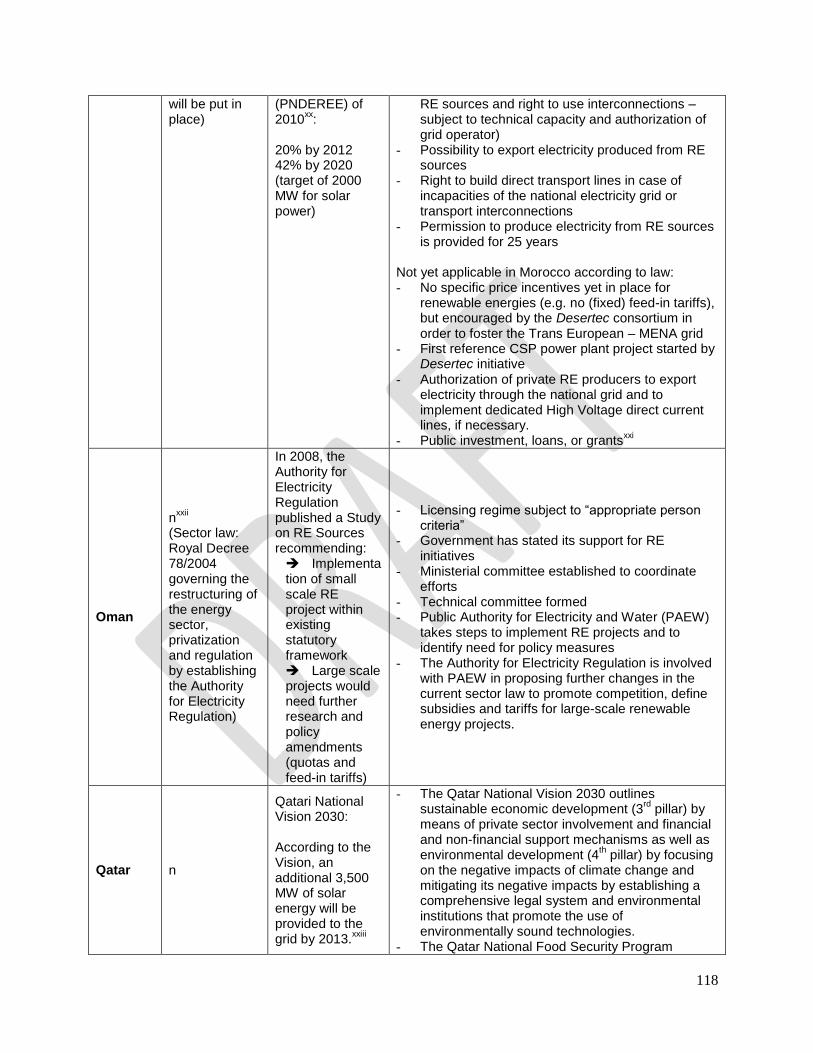
118
will be put in place)
(PNDEREE) of 2010
xx:
20% by 2012 42% by 2020 (target of 2000 MW for solar power)
RE sources and right to use interconnections – subject to technical capacity and authorization of grid operator)
- Possibility to export electricity produced from RE sources
- Right to build direct transport lines in case of incapacities of the national electricity grid or transport interconnections
- Permission to produce electricity from RE sources is provided for 25 years
Not yet applicable in Morocco according to law: - No specific price incentives yet in place for
renewable energies (e.g. no (fixed) feed-in tariffs), but encouraged by the Desertec consortium in order to foster the Trans European – MENA grid
- First reference CSP power plant project started by Desertec initiative
- Authorization of private RE producers to export electricity through the national grid and to implement dedicated High Voltage direct current lines, if necessary.
- Public investment, loans, or grantsxxi
Oman
nxxii
(Sector law: Royal Decree 78/2004 governing the restructuring of the energy sector, privatization and regulation by establishing the Authority for Electricity Regulation)
In 2008, the Authority for Electricity Regulation published a Study on RE Sources recommending: Implementation of small scale RE project within existing statutory framework Large scale projects would need further research and policy amendments (quotas and feed-in tariffs)
- Licensing regime subject to “appropriate person criteria”
- Government has stated its support for RE initiatives
- Ministerial committee established to coordinate efforts
- Technical committee formed - Public Authority for Electricity and Water (PAEW)
takes steps to implement RE projects and to identify need for policy measures
- The Authority for Electricity Regulation is involved with PAEW in proposing further changes in the current sector law to promote competition, define subsidies and tariffs for large-scale renewable energy projects.
Qatar n
Qatari National Vision 2030: According to the Vision, an additional 3,500 MW of solar energy will be provided to the grid by 2013.
xxiii
- The Qatar National Vision 2030 outlines sustainable economic development (3
rd pillar) by
means of private sector involvement and financial and non-financial support mechanisms as well as environmental development (4
th pillar) by focusing
on the negative impacts of climate change and mitigating its negative impacts by establishing a comprehensive legal system and environmental institutions that promote the use of environmentally sound technologies.
- The Qatar National Food Security Program
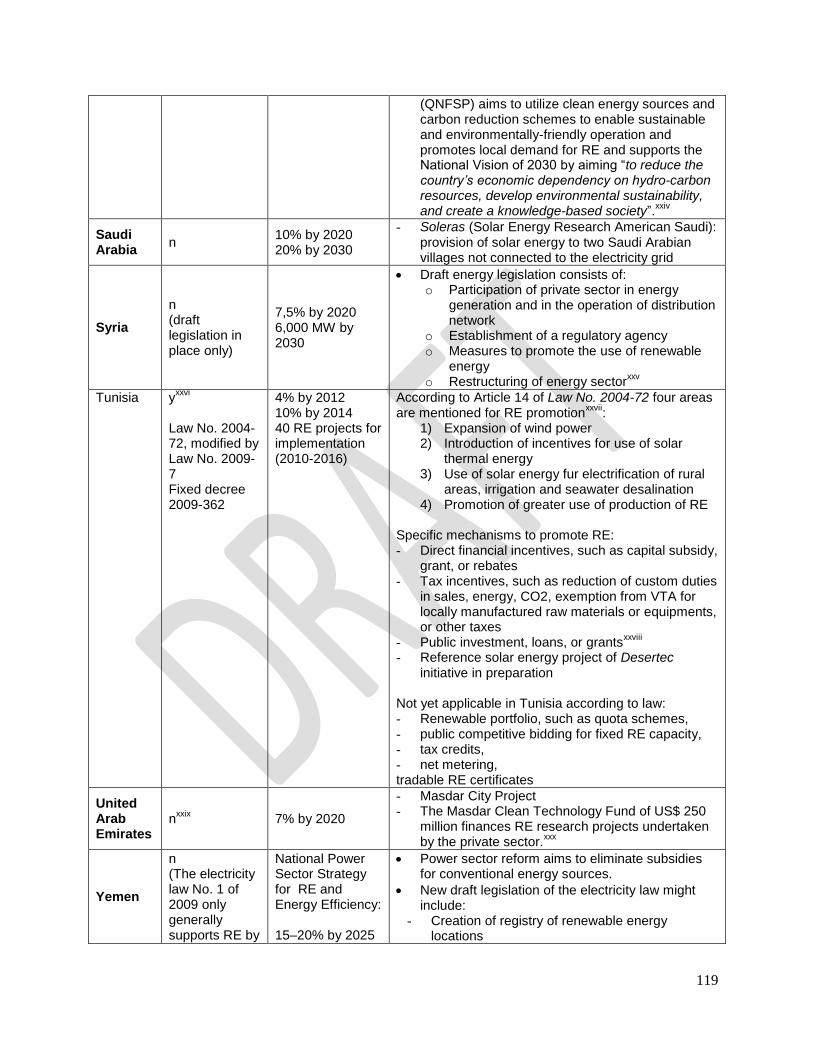
119
(QNFSP) aims to utilize clean energy sources and carbon reduction schemes to enable sustainable and environmentally-friendly operation and promotes local demand for RE and supports the National Vision of 2030 by aiming “to reduce the country’s economic dependency on hydro-carbon resources, develop environmental sustainability, and create a knowledge-based society”.
xxiv
Saudi Arabia
n 10% by 2020 20% by 2030
- Soleras (Solar Energy Research American Saudi): provision of solar energy to two Saudi Arabian villages not connected to the electricity grid
Syria
n (draft legislation in place only)
7,5% by 2020 6,000 MW by 2030
Draft energy legislation consists of: o Participation of private sector in energy
generation and in the operation of distribution network
o Establishment of a regulatory agency o Measures to promote the use of renewable
energy o Restructuring of energy sector
xxv
Tunisia yxxvi
Law No. 2004-72, modified by Law No. 2009-7 Fixed decree 2009-362
4% by 2012 10% by 2014 40 RE projects for implementation (2010-2016)
According to Article 14 of Law No. 2004-72 four areas are mentioned for RE promotion
xxvii:
1) Expansion of wind power 2) Introduction of incentives for use of solar
thermal energy 3) Use of solar energy fur electrification of rural
areas, irrigation and seawater desalination 4) Promotion of greater use of production of RE
Specific mechanisms to promote RE: - Direct financial incentives, such as capital subsidy,
grant, or rebates - Tax incentives, such as reduction of custom duties
in sales, energy, CO2, exemption from VTA for locally manufactured raw materials or equipments, or other taxes
- Public investment, loans, or grantsxxviii
- Reference solar energy project of Desertec
initiative in preparation Not yet applicable in Tunisia according to law: - Renewable portfolio, such as quota schemes, - public competitive bidding for fixed RE capacity, - tax credits, - net metering, tradable RE certificates
United Arab Emirates
nxxix
7% by 2020
- Masdar City Project - The Masdar Clean Technology Fund of US$ 250
million finances RE research projects undertaken by the private sector.
xxx
Yemen
n (The electricity law No. 1 of 2009 only generally supports RE by
National Power Sector Strategy for RE and Energy Efficiency: 15–20% by 2025
Power sector reform aims to eliminate subsidies for conventional energy sources.
New draft legislation of the electricity law might include:
- Creation of registry of renewable energy locations
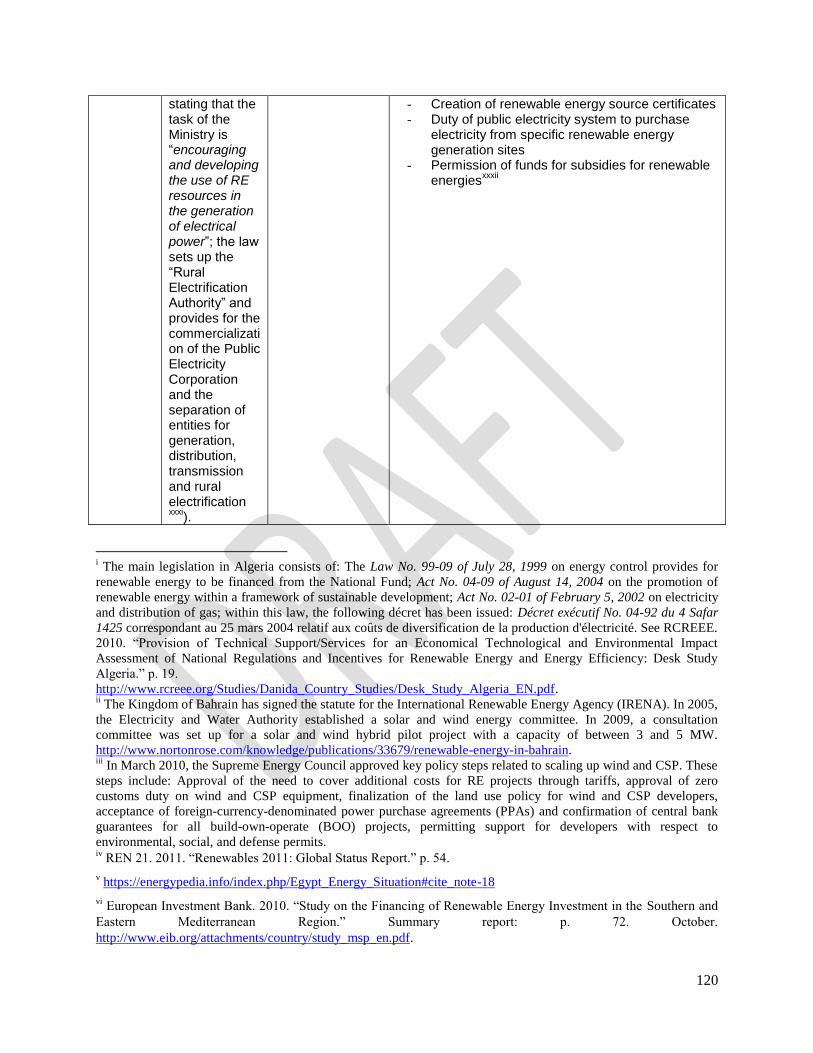
120
stating that the task of the Ministry is “encouraging and developing the use of RE resources in the generation of electrical power”; the law sets up the “Rural Electrification Authority” and provides for the commercialization of the Public Electricity Corporation and the separation of entities for generation, distribution, transmission and rural electrificationxxxi
).
- Creation of renewable energy source certificates - Duty of public electricity system to purchase
electricity from specific renewable energy generation sites
- Permission of funds for subsidies for renewable energies
xxxii
i The main legislation in Algeria consists of: The Law No. 99-09 of July 28, 1999 on energy control provides for
renewable energy to be financed from the National Fund; Act No. 04-09 of August 14, 2004 on the promotion of
renewable energy within a framework of sustainable development; Act No. 02-01 of February 5, 2002 on electricity
and distribution of gas; within this law, the following décret has been issued: Décret exécutif No. 04-92 du 4 Safar
1425 correspondant au 25 mars 2004 relatif aux coûts de diversification de la production d'électricité. See RCREEE.
2010. ―Provision of Technical Support/Services for an Economical Technological and Environmental Impact
Assessment of National Regulations and Incentives for Renewable Energy and Energy Efficiency: Desk Study
Algeria.‖ p. 19.
http://www.rcreee.org/Studies/Danida_Country_Studies/Desk_Study_Algeria_EN.pdf. ii The Kingdom of Bahrain has signed the statute for the International Renewable Energy Agency (IRENA). In 2005,
the Electricity and Water Authority established a solar and wind energy committee. In 2009, a consultation
committee was set up for a solar and wind hybrid pilot project with a capacity of between 3 and 5 MW.
http://www.nortonrose.com/knowledge/publications/33679/renewable-energy-in-bahrain. iii
In March 2010, the Supreme Energy Council approved key policy steps related to scaling up wind and CSP. These
steps include: Approval of the need to cover additional costs for RE projects through tariffs, approval of zero
customs duty on wind and CSP equipment, finalization of the land use policy for wind and CSP developers,
acceptance of foreign-currency-denominated power purchase agreements (PPAs) and confirmation of central bank
guarantees for all build-own-operate (BOO) projects, permitting support for developers with respect to
environmental, social, and defense permits. iv REN 21. 2011. ―Renewables 2011: Global Status Report.‖ p. 54.
v https://energypedia.info/index.php/Egypt_Energy_Situation#cite_note-18
vi European Investment Bank. 2010. ―Study on the Financing of Renewable Energy Investment in the Southern and
Eastern Mediterranean Region.‖ Summary report: p. 72. October.
http://www.eib.org/attachments/country/study_msp_en.pdf.
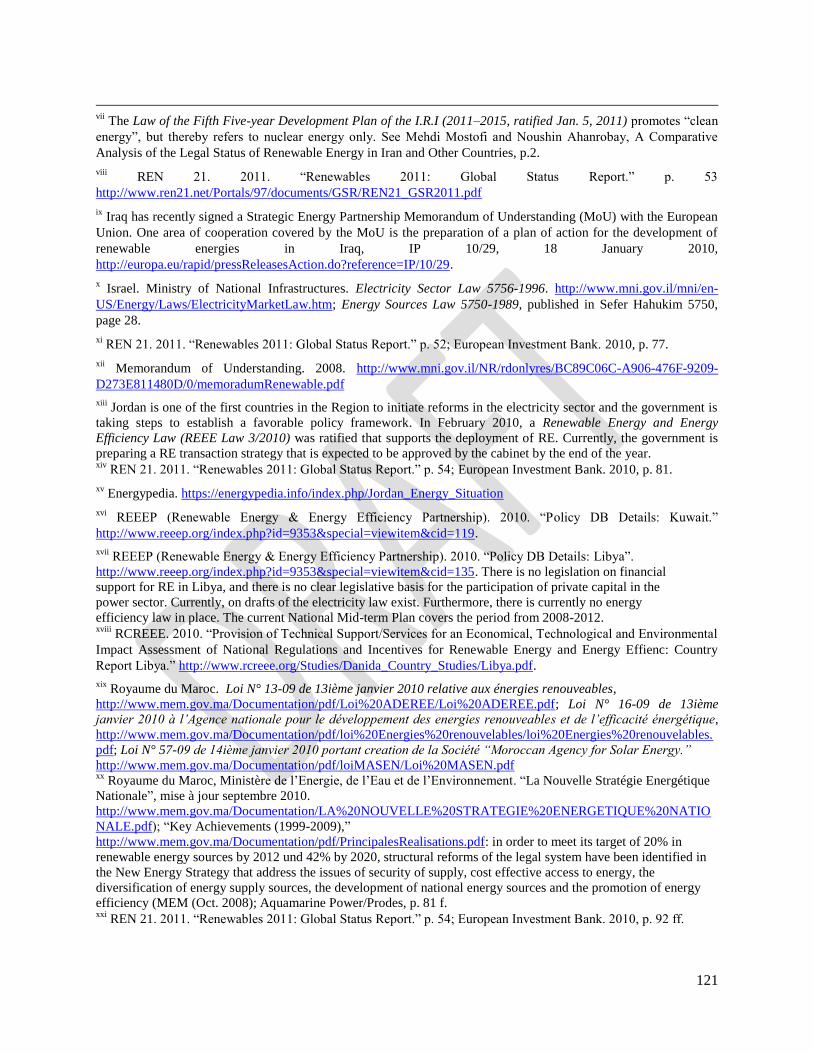
121
vii
The Law of the Fifth Five-year Development Plan of the I.R.I (2011–2015, ratified Jan. 5, 2011) promotes ―clean
energy‖, but thereby refers to nuclear energy only. See Mehdi Mostofi and Noushin Ahanrobay, A Comparative
Analysis of the Legal Status of Renewable Energy in Iran and Other Countries, p.2.
viii REN 21. 2011. ―Renewables 2011: Global Status Report.‖ p. 53
http://www.ren21.net/Portals/97/documents/GSR/REN21_GSR2011.pdf
ix Iraq has recently signed a Strategic Energy Partnership Memorandum of Understanding (MoU) with the European
Union. One area of cooperation covered by the MoU is the preparation of a plan of action for the development of
renewable energies in Iraq, IP 10/29, 18 January 2010,
http://europa.eu/rapid/pressReleasesAction.do?reference=IP/10/29.
x Israel. Ministry of National Infrastructures. Electricity Sector Law 5756-1996. http://www.mni.gov.il/mni/en-
US/Energy/Laws/ElectricityMarketLaw.htm; Energy Sources Law 5750-1989, published in Sefer Hahukim 5750,
page 28.
xi REN 21. 2011. ―Renewables 2011: Global Status Report.‖ p. 52; European Investment Bank. 2010, p. 77.
xii Memorandum of Understanding. 2008. http://www.mni.gov.il/NR/rdonlyres/BC89C06C-A906-476F-9209-
D273E811480D/0/memoradumRenewable.pdf
xiii Jordan is one of the first countries in the Region to initiate reforms in the electricity sector and the government is
taking steps to establish a favorable policy framework. In February 2010, a Renewable Energy and Energy
Efficiency Law (REEE Law 3/2010) was ratified that supports the deployment of RE. Currently, the government is
preparing a RE transaction strategy that is expected to be approved by the cabinet by the end of the year. xiv
REN 21. 2011. ―Renewables 2011: Global Status Report.‖ p. 54; European Investment Bank. 2010, p. 81.
xv Energypedia. https://energypedia.info/index.php/Jordan_Energy_Situation
xvi REEEP (Renewable Energy & Energy Efficiency Partnership). 2010. ―Policy DB Details: Kuwait.‖
http://www.reeep.org/index.php?id=9353&special=viewitem&cid=119.
xvii REEEP (Renewable Energy & Energy Efficiency Partnership). 2010. ―Policy DB Details: Libya‖.
http://www.reeep.org/index.php?id=9353&special=viewitem&cid=135. There is no legislation on financial
support for RE in Libya, and there is no clear legislative basis for the participation of private capital in the
power sector. Currently, on drafts of the electricity law exist. Furthermore, there is currently no energy
efficiency law in place. The current National Mid-term Plan covers the period from 2008-2012. xviii
RCREEE. 2010. ―Provision of Technical Support/Services for an Economical, Technological and Environmental
Impact Assessment of National Regulations and Incentives for Renewable Energy and Energy Effienc: Country
Report Libya.‖ http://www.rcreee.org/Studies/Danida_Country_Studies/Libya.pdf.
xix Royaume du Maroc. Loi N° 13-09 de 13ième janvier 2010 relative aux énergies renouveables,
http://www.mem.gov.ma/Documentation/pdf/Loi%20ADEREE/Loi%20ADEREE.pdf; Loi N° 16-09 de 13ième
janvier 2010 à l’Agence nationale pour le développement des energies renouveables et de l’efficacité énergétique,
http://www.mem.gov.ma/Documentation/pdf/loi%20Energies%20renouvelables/loi%20Energies%20renouvelables.
pdf; Loi N° 57-09 de 14ième janvier 2010 portant creation de la Société “Moroccan Agency for Solar Energy.”
http://www.mem.gov.ma/Documentation/pdf/loiMASEN/Loi%20MASEN.pdf xx
Royaume du Maroc, Ministère de l‘Energie, de l‘Eau et de l‘Environnement. ―La Nouvelle Stratégie Energétique
Nationale‖, mise à jour septembre 2010.
http://www.mem.gov.ma/Documentation/LA%20NOUVELLE%20STRATEGIE%20ENERGETIQUE%20NATIO
NALE.pdf); ―Key Achievements (1999-2009),‖
http://www.mem.gov.ma/Documentation/pdf/PrincipalesRealisations.pdf: in order to meet its target of 20% in
renewable energy sources by 2012 und 42% by 2020, structural reforms of the legal system have been identified in
the New Energy Strategy that address the issues of security of supply, cost effective access to energy, the
diversification of energy supply sources, the development of national energy sources and the promotion of energy
efficiency (MEM (Oct. 2008); Aquamarine Power/Prodes, p. 81 f. xxi
REN 21. 2011. ―Renewables 2011: Global Status Report.‖ p. 54; European Investment Bank. 2010, p. 92 ff.
122
xxii
Sultanate of Oman. Ministry of National Economy. Royal Decree 78/2004. The Law for the Regulation and
Privatisation of the Electricity and Related Water Sector http://www.mone.gov.om/documents/Regulation_and_Privatisation.pdf.
xxiiiJones/Molan/Vinson & Elkins LLP, ―Chapter 27: Renewable Energy‖, p. 306f. in Investing in the GCC: New
Opportunities in a Changing Landscape, March 2010; General Secretariat for Development Planning. ―Qatar
National Vision 2030.‖
http://www.qu.edu.qa/pharmacy/components/upcoming_events_material/Qatar_National_Vision_2030.pdf
xxiv QNFSP (Qatar National Food Security Program). http://www.qnfsp.gov.qa/programme/renewable-energy
xxv European Investment Bank. 2010, p. 101.
xxvi The Tunisian Solar Plan (TSP) was launched in December 2009 for the period 2010–16 and aims to increase the
share of RE and energy efficiency.
xxvii La loi No. 2004-72 du 02 aout 2004 relative a la maitrise de d‘energie. http://www.aes-
tunisie.com/userfiles/file/loi%20n%C2%B02004_72.pdf
xxviii REN 21. 2011. ―Renewables 2011: Global Status Report.‖ p. 54.
xxix According to the Plan Abu Dhabi 2030: Urban Structure Framework Plan
(http://gsec.abudhabi.ae/Sites/GSEC/Navigation/EN/publications,did=90378.html) and the policy framework of the
government, the Masdar Initiative is one of the key elements to foster the development, commercialization and
deployment of renewable and alternative energy technologies in the UAE; besides, the Green Dubai initiative also
focuses on reducing the carbon emissions footprint of UAE. See Country Profile: United Arab Emirates.
http://www.reegle.info/countries/AE
xxx REEGLE. ―Country Energy Profile: United Arab Emirates‖. http://www.reegle.info/countries/AE.
xxxi The country‘s new Electricity Law No. 1 of 2009 aims to ensure the electricity generation security. The law
includes provisions for the development of new power systems, improving the quality of electrical services, and
encouraging local and foreign private investments in the sector. Law No. 3 of 2009 was issued to settle a loan
agreement signed between Yemen and the Islamic Tadamon Fund for Development, totaling $11.2 million.
http://www.yobserver.com/local-news/10015931.html;
RCREEE. 2010. ―Provision of Technical Support/Services for an Economical, Technological and Environmental
Impact Assessment of National Regulations and Incentives for Renewable Energy and Energy Efficiency: Country
Report Yemen.‖ p. 16f. http://www.rcreee.org/Studies/Danida_Country_Studies/Yemen.pdf.
xxxii RCREEE. 2010. ―Provision of Technical Support/Services for an Economical, Technological and Environmental
Impact Assessment of National Regulations and Incentives for Renewable Energy and Energy Efficiency: Country
Report Yemen.‖ p. 17f. http://www.rcreee.org/Studies/Danida_Country_Studies/Yemen.pdf.
Recommended