REPORT AND CONSOLIDATED
ACCOUNTS
2016

CONDURILREPORT AND CONSOLIDATED
ACCOUNTS
2016

TABLE OF CONTENTS
2016
01CONDURIL 4
02CORPORATE INFORMATION 10
03CONSOLIDATED MANAGEMENT REPORT 14
04CONSOLIDATED FINANCIAL
STATEMENTS AND NOTES 22
05REPORT AND OPINION OF THE STATUTORY
AUDIT BOARD 56
06LEGAL CERTIFICATION OF CONSOLIDATED
ACCOUNTS 60

01
CONDURILREPORT AND CONSOLIDATED
ACCOUNTS2016
REPORT AND CONSOLIDATED ACCOUNTS 2016CONDURIL6
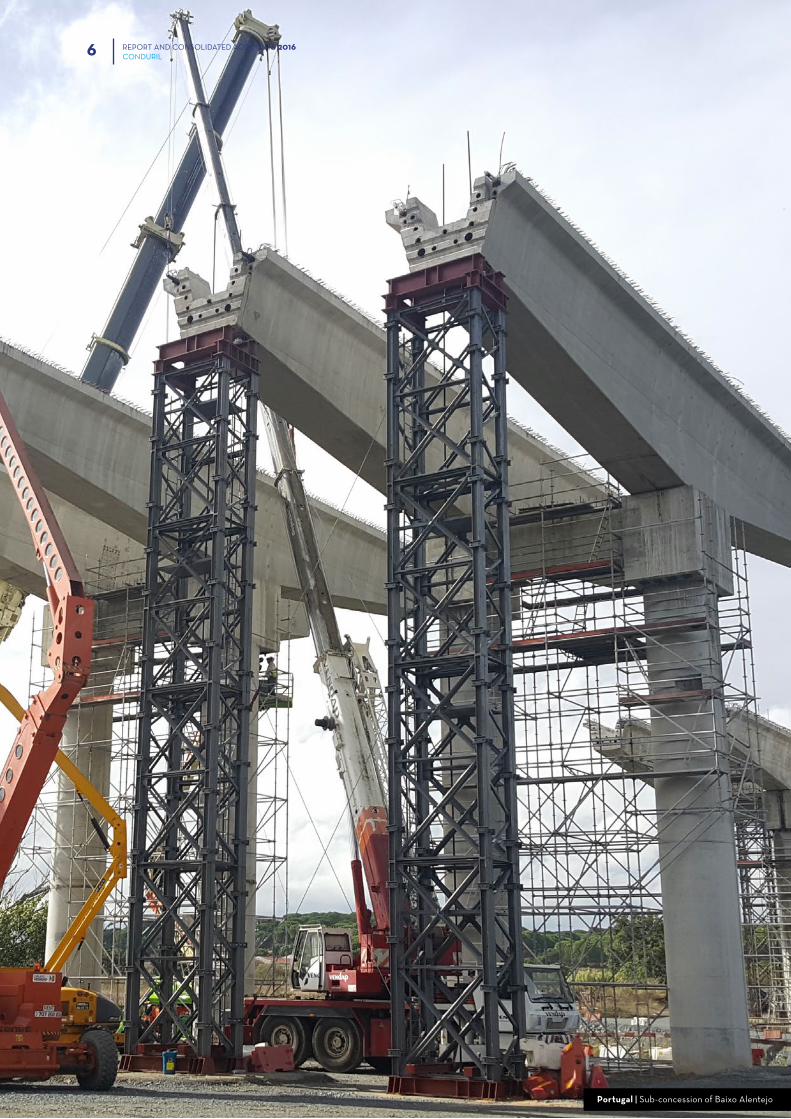
Portugal | Sub-concession of Baixo Alentejo
REPORT AND CONSOLIDATED ACCOUNTS 2016CONDURIL 7
Vision |Conduril develops its activity in the field of Civil Engineering
and its main objective, in both technical and economic
terms, is to become one of the best Portuguese engineering
companies (and to be recognised by the market as such), and,
at the same time, to possess the following characteristics:
• To be a great company at a national scale, both in technical
and economic terms, capable of responding to any work of
civil engineering both in the domestic market and abroad.
• To be, in terms of the total number of active people, at a
national level, a medium sized company, flexible and capable
to respond to different market demands, with a great
technical ability able to, above all else, become a solid base of
support for its activities abroad.
“THERE ARE NO FAVOURABLE WINDS FOR
THOSE WHO DO NOT KNOW WHERE THEY ARE
GOING”Seneca
Mission |Our mission is to create lasting wealth for our shareholders
and the sustainability of the best working conditions for our
employees, as well as their satisfaction, as the first vector of
our social responsibility.
Values |We believe that we can only create value and wealth, that
is, win, acting the right way. In order words: with honesty,
confidence and accountability based on a culture of Integrity,
which means: Honesty, Transparency, Justice and a strict
adherence to the rules and regulations; these are our values.
Commercial Registry
Office of Valongo
Share Capital: 10,000,000 euros
Tax ID Number: 500 070 210
Building Permit No. 568
Portugal | Sub-concession of Baixo Alentejo
REPORT AND CONSOLIDATED ACCOUNTS 2016CONDURIL8
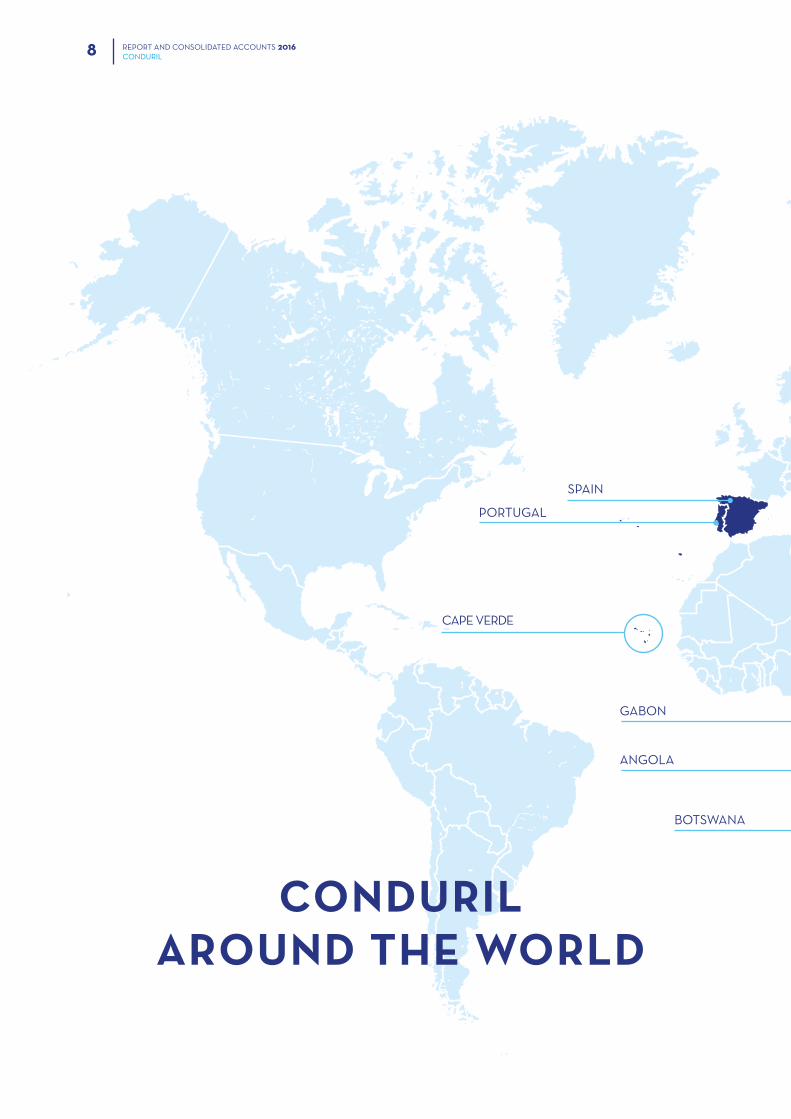
PORTUGAL
ANGOLA
GABON
SPAIN
CAPE VERDE
CONDURIL AROUND THE WORLD
BOTSWANA
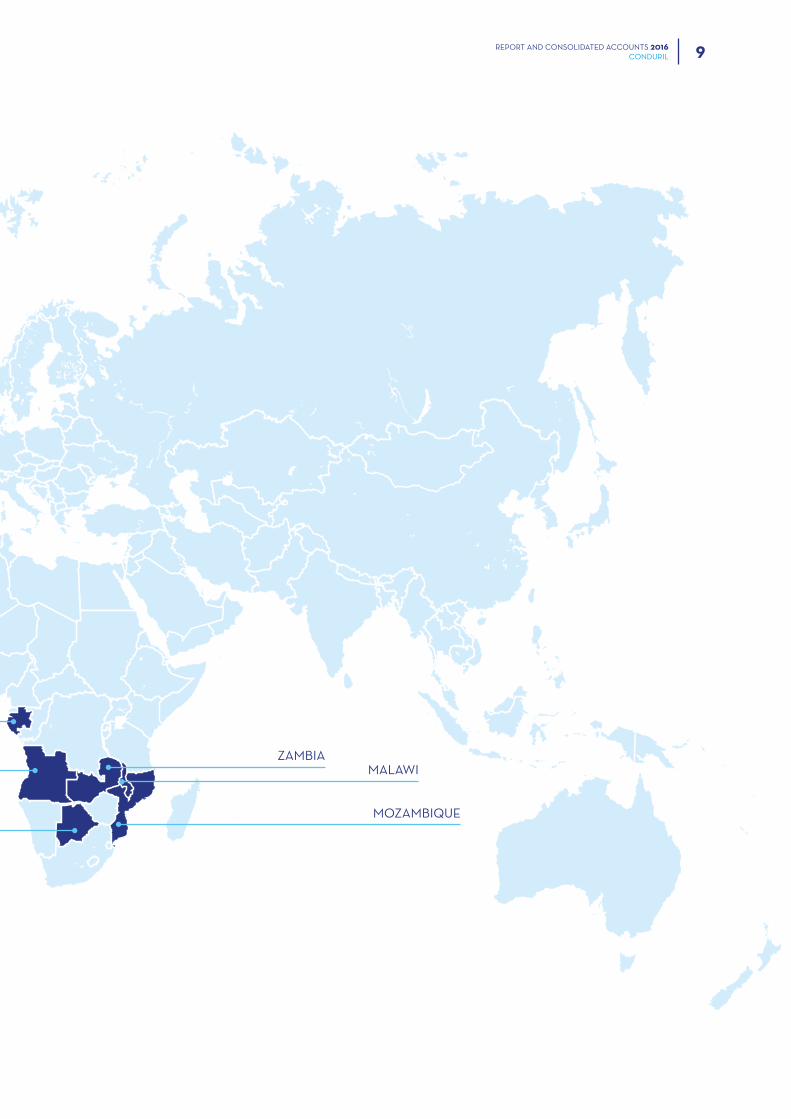
REPORT AND CONSOLIDATED ACCOUNTS 2016CONDURIL 9
MOZAMBIQUE
ZAMBIAMALAWI
BOTSWANA
02
CORPORATEINFORMATION
REPORT AND CONSOLIDATEDACCOUNTS
2016
12 REPORT AND CONSOLIDATED ACCOUNTS 2016CORPORATE INFORMATION
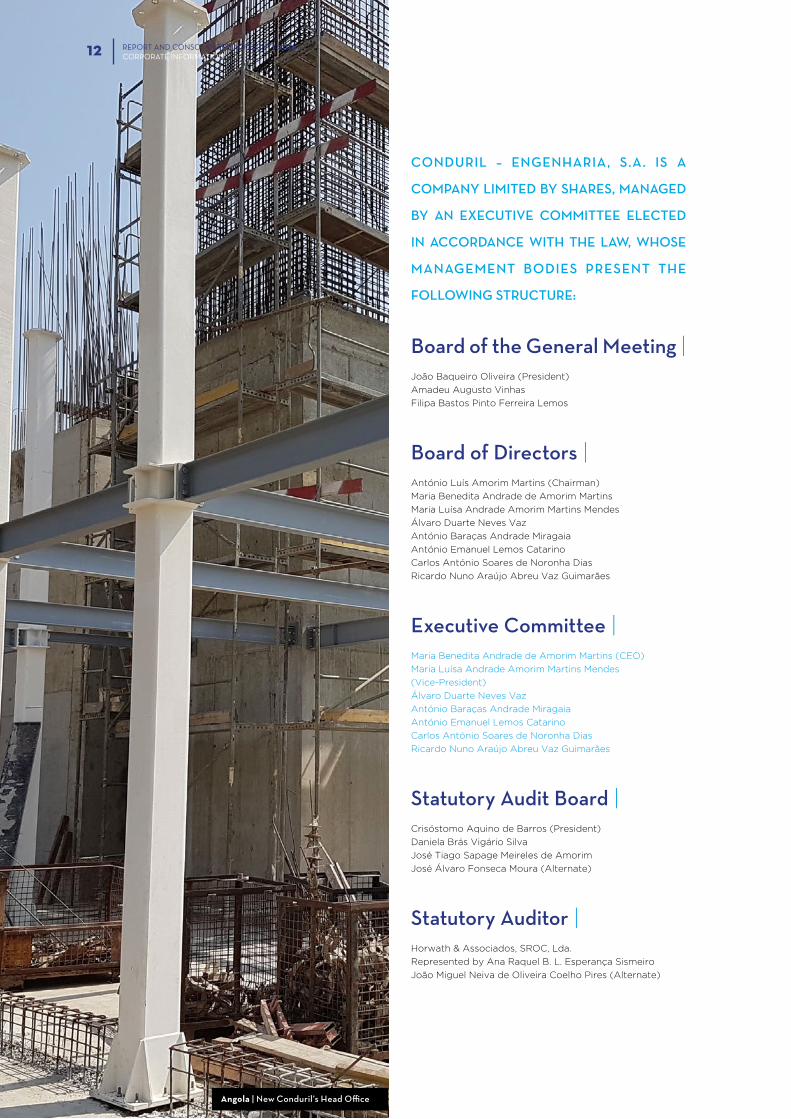
CONDURIL – ENGENHARIA, S.A. IS A
COMPANY LIMITED BY SHARES, MANAGED
BY AN EXECUTIVE COMMITTEE ELECTED
IN ACCORDANCE WITH THE LAW, WHOSE
MANAGEMENT BODIES PRESENT THE
FOLLOWING STRUCTURE:
Board of the General Meeting |João Baqueiro Oliveira (President)
Amadeu Augusto Vinhas
Filipa Bastos Pinto Ferreira Lemos
Board of Directors |António Luís Amorim Martins (Chairman)
Maria Benedita Andrade de Amorim Martins
Maria Luísa Andrade Amorim Martins Mendes
Álvaro Duarte Neves Vaz
António Baraças Andrade Miragaia
António Emanuel Lemos Catarino
Carlos António Soares de Noronha Dias
Ricardo Nuno Araújo Abreu Vaz Guimarães
Executive Committee |Maria Benedita Andrade de Amorim Martins (CEO)
Maria Luísa Andrade Amorim Martins Mendes
(Vice-President)
Álvaro Duarte Neves Vaz
António Baraças Andrade Miragaia
António Emanuel Lemos Catarino
Carlos António Soares de Noronha Dias
Ricardo Nuno Araújo Abreu Vaz Guimarães
Statutory Audit Board |Crisóstomo Aquino de Barros (President)
Daniela Brás Vigário Silva
José Tiago Sapage Meireles de Amorim
José Álvaro Fonseca Moura (Alternate)
Statutory Auditor |Horwath & Associados, SROC, Lda.
Represented by Ana Raquel B. L. Esperança Sismeiro
João Miguel Neiva de Oliveira Coelho Pires (Alternate)
Angola | New Conduril’s Head Office
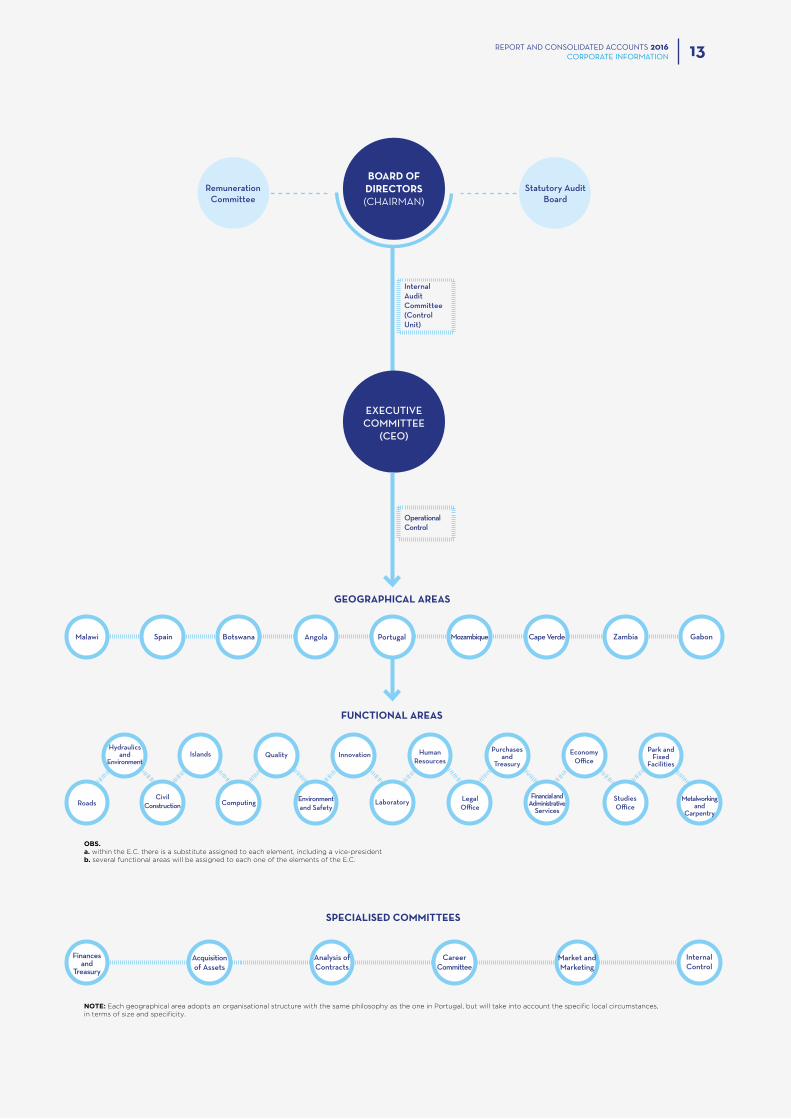
13REPORT AND CONSOLIDATED ACCOUNTS 2016CORPORATE INFORMATION
EconomyOffice
BOARD OFDIRECTORS(CHAIRMAN)
OperationalControl
GEOGRAPHICAL AREAS
Malawi Botswana Angola PortugalSpain Zambia Gabon
FUNCTIONAL AREAS
SPECIALISED COMMITTEES
RoadsCivil
Construction
Islands Quality
Computing Environmentand Safety
Innovation
StudiesOffice
Park andFixed
Facilities
Metalworkingand
Carpentry
Laboratory
HumanResources
Purchasesand
Treasury
LegalOffice
InternalAuditCommittee(ControlUnit)
Remuneration Committee
Statutory Audit Board
OBS.a. within the E.C. there is a substitute assigned to each element, including a vice-presidentb. several functional areas will be assigned to each one of the elements of the E.C.
NOTE: Each geographical area adopts an organisational structure with the same philosophy as the one in Portugal, but will take into account the specific local circumstances, in terms of size and specificity.
EXECUTIVECOMMITTEE
(CEO)
Mozambique Cape Verde
Financial and Administrative
Services
Financesand
Treasury
Acquisitionof Assets
Analysis ofContracts
CareerCommittee
Market andMarketing
InternalControl
Hydraulics and
Environment

03
CONSOLIDATED MANAGEMENT
REPORTREPORT AND CONSOLIDATED
ACCOUNTS2016
REPORT AND CONSOLIDATED ACCOUNTS 2016CONSOLIDATED MANAGEMENT REPORT16
THE BOARD OF DIRECTORS OF CONDURIL
- ENGENHARIA, S.A., IN COMPLIANCE WITH
THE ARTICLES OF ASSOCIATION AND
APPLICABLE LEGAL PROVISIONS, IN
ACCORDANCE WITH ARTICLES 65 AND 66
OF THE PORTUGUESE COMPANIES ACT,
PRESENTS AND SUBMITS TO THE GENERAL
MEETING OF SHAREHOLDERS, THE
CONSOLIDATED MANAGEMENT REPORT,
THE CONSOLIDATED ACCOUNTS FOR
THE PERIOD AND OTHER CONSOLIDATED
FINANCIAL STATEMENTS, FOR THE FINANCIAL
YEAR ENDING ON 31 DECEMBER 2016.
1 |The world economy recorded, in 2016, the worst performance
since the global crisis of 2009, presenting the lowest rate of
growth of the post-crisis. This growth slowdown was felt in
many economies where Conduril operates, very dependent on
the behaviour of commodities, and therefore affecting public
and private investment, as it can be seen in the evolution of
the indicators presented below:
The positive signs that the Portuguese economy has
been presenting are starting to be seen in the Portuguese
construction sector, even though 2016 is the ninth consecutive
year with downturn in the sector, where only 41% of the 1,745
million euros of public works were tendered.
The uncertainties in the international political landscape and
the vulnerabilities of the world trade, combined with the
shortage of investment seen, do not allow to predict, for 2017
or 2018, the desired solid and sustainable recovery of the
international economy. This period will be guided by a still
fragile recovery.
COUNTRIES
REAL OUTPUT GROWTH EXCHANGE RATE INFLATION RATE
2008–2015 2015 2016 a) CURRENCY 2015 2016 a) VAR 2015 2016 a)
Portugal -0.7% 1.5% 1.4% 0.5% 0.6%
Angola 5.1% 3.0% 0.8% AKZ - EUR 0.0068 0.0054 -20% 10.3% 33.7%
Mozambique 6.9% 6.6% 4.2% MZN - EUR 0.0204 0.0133 -35% 3.6% 18.0%
Zambia 7.0% 3.6% 3.0% ZMW - EUR 0.0837 0.0958 15% 10.1% 20.5%
Malawi 4.3% 2.9% 2.4% MWK - EUR 0.0014 0.0013 -4% 21.9% 23.5%
Gabon 3.7% 4.0% 3.2% FCFA - EUR 0.0015 0.0015 0% 0.6% 1.8%
Botswana 3.7% -0.3% 2.8% BWP - EUR 0.0814 0.0891 9% 3.1% 3.3%
Source: UN, The World Economic Situation and Prospects 2017a) estimated values
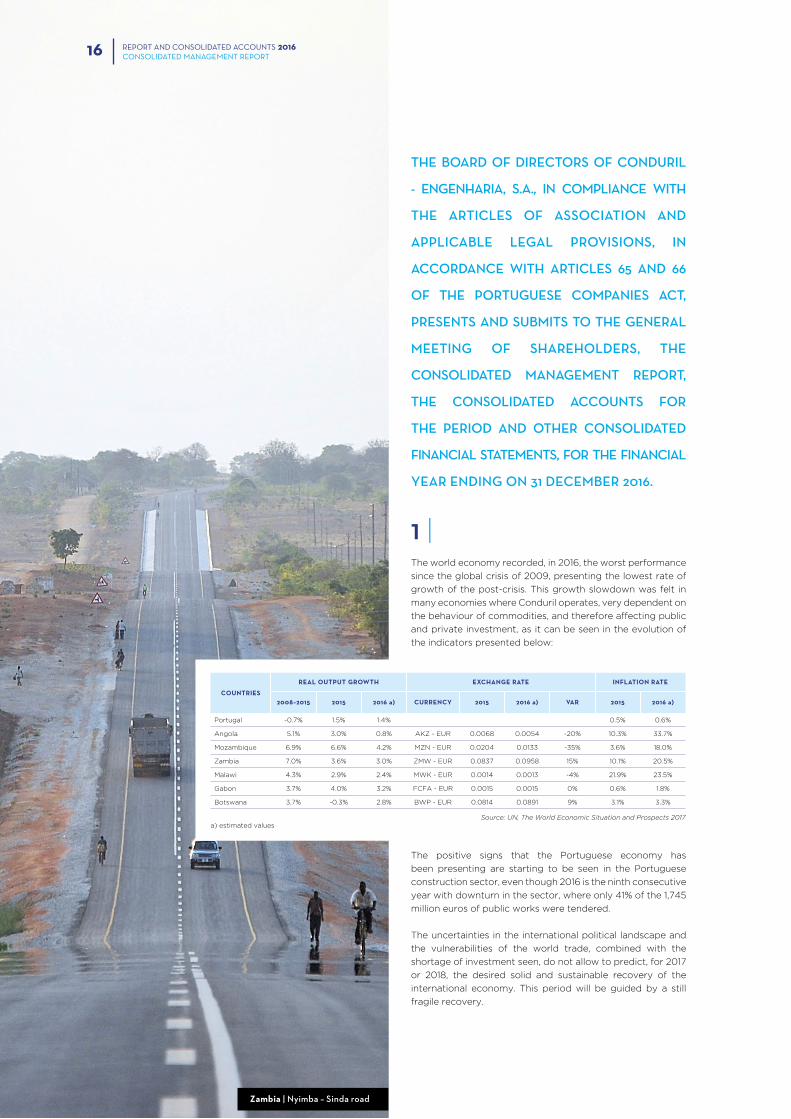
Zambia | Nyimba – Sinda road
REPORT AND CONSOLIDATED ACCOUNTS 2016CONSOLIDATED MANAGEMENT REPORT 17
2 |The activity of Conduril continues focused mainly on the
international market, which represents more than 80% of
turnover.
In 2016, in the Portuguese market, the completion of the
second stage of the Centro Materno Infantil do Norte
(maternal and child centre) and the boring of the new Águas
Santas tunnel should be noted. In turn, in Angola, the work
of Cabinda Base for Schlumberger was won and almost
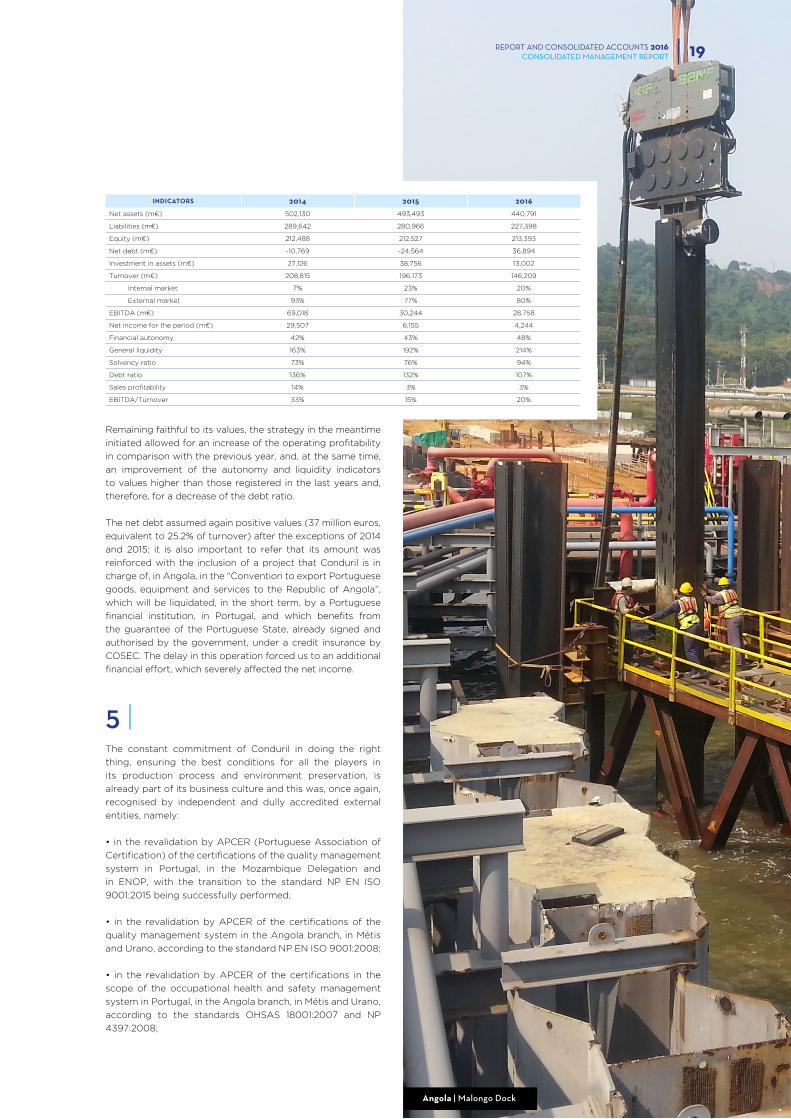
entirely performed, with the important rehabilitation work of
the Malongo dock for the Cabinda Gulf Oil Company also
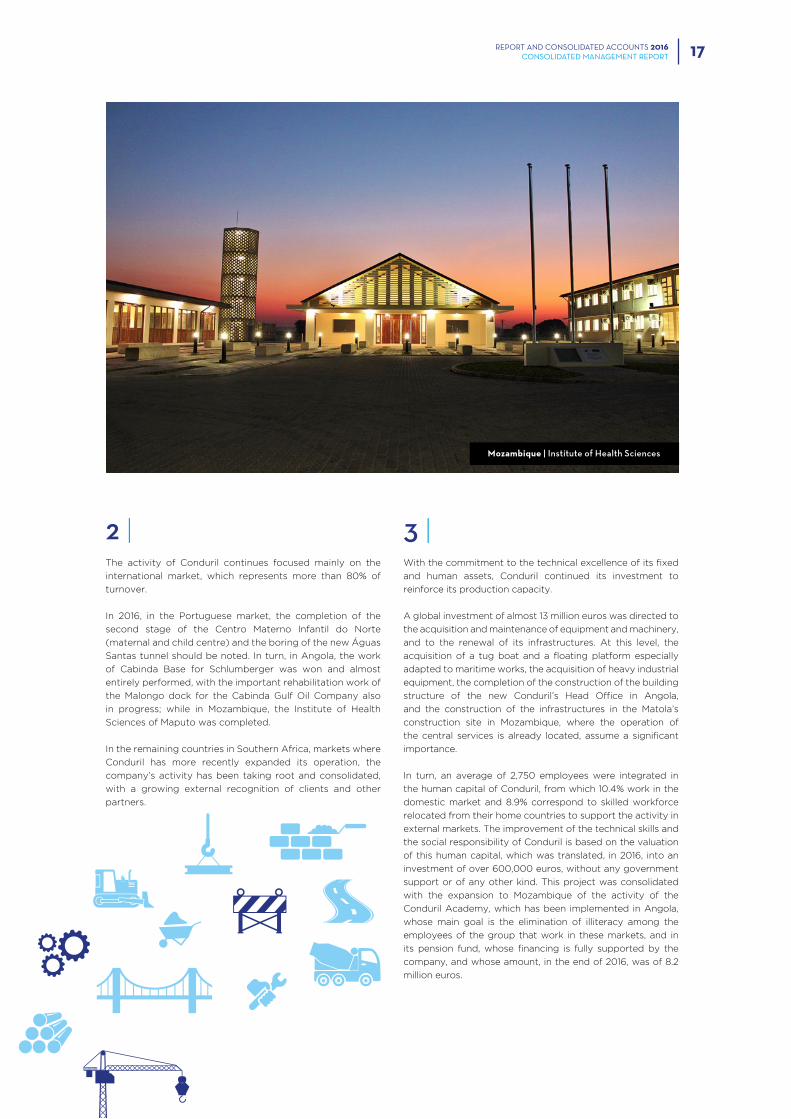
in progress; while in Mozambique, the Institute of Health
Sciences of Maputo was completed.
In the remaining countries in Southern Africa, markets where
Conduril has more recently expanded its operation, the
company’s activity has been taking root and consolidated,
with a growing external recognition of clients and other
partners.
3 |With the commitment to the technical excellence of its fixed
and human assets, Conduril continued its investment to
reinforce its production capacity.
A global investment of almost 13 million euros was directed to
the acquisition and maintenance of equipment and machinery,
and to the renewal of its infrastructures. At this level, the
acquisition of a tug boat and a floating platform especially
adapted to maritime works, the acquisition of heavy industrial
equipment, the completion of the construction of the building
structure of the new Conduril’s Head Office in Angola,
and the construction of the infrastructures in the Matola’s
construction site in Mozambique, where the operation of
the central services is already located, assume a significant
importance.
In turn, an average of 2,750 employees were integrated in
the human capital of Conduril, from which 10.4% work in the
domestic market and 8.9% correspond to skilled workforce
relocated from their home countries to support the activity in
external markets. The improvement of the technical skills and
the social responsibility of Conduril is based on the valuation
of this human capital, which was translated, in 2016, into an
investment of over 600,000 euros, without any government
support or of any other kind. This project was consolidated
with the expansion to Mozambique of the activity of the
Conduril Academy, which has been implemented in Angola,
whose main goal is the elimination of illiteracy among the
employees of the group that work in these markets, and in
its pension fund, whose financing is fully supported by the
company, and whose amount, in the end of 2016, was of 8.2
million euros.
Mozambique | Institute of Health Sciences
18
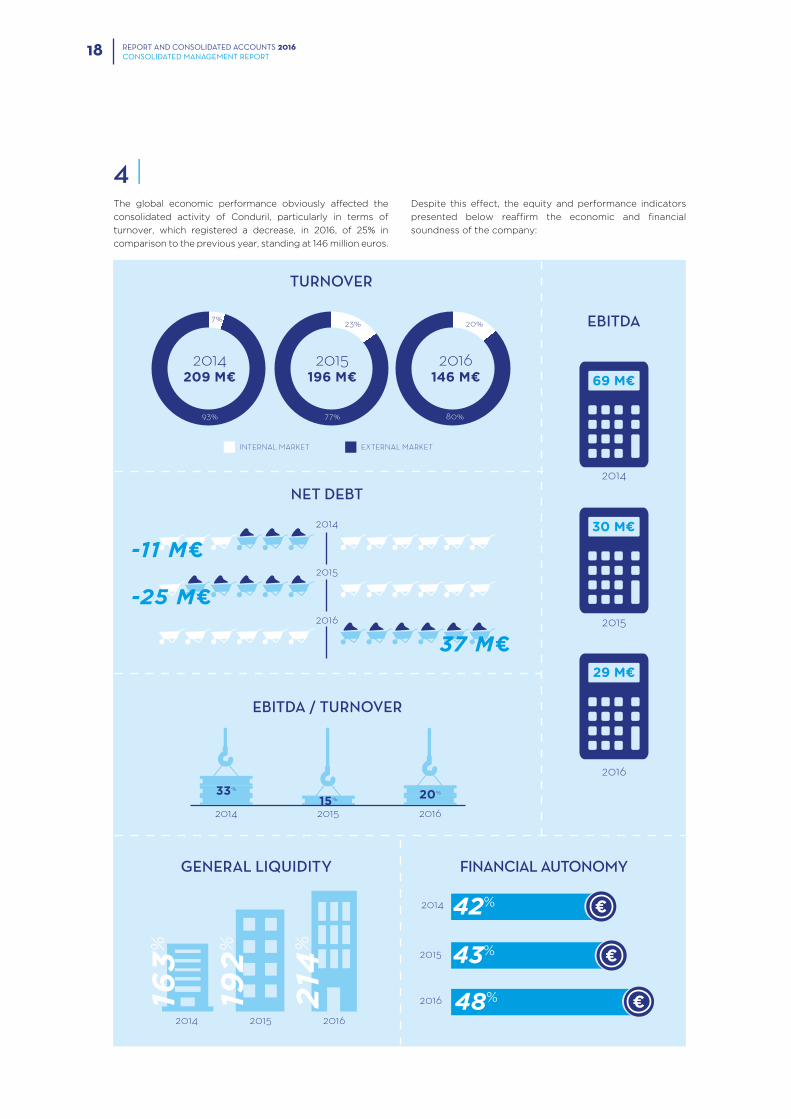
4 |The global economic performance obviously affected the
consolidated activity of Conduril, particularly in terms of
turnover, which registered a decrease, in 2016, of 25% in
comparison to the previous year, standing at 146 million euros.
69 M¤
2014
30 M¤
2015
29 M¤
2016
2016
2015
2014
2014209 M¤
2015196 M¤
2016146 M¤
93% 77% 80%
7% 23% 20%
201620152014
163
%
192
%
214
%
2016
2015
2014
-11 M¤
-25 M¤
37 M¤
48%
43%
42%
201620152014
33%
15% 20%
Despite this effect, the equity and performance indicators
presented below reaffirm the economic and financial
soundness of the company:
REPORT AND CONSOLIDATED ACCOUNTS 2016CONSOLIDATED MANAGEMENT REPORT
EBITDA
FINANCIAL AUTONOMY
TURNOVER
EXTERNAL MARKETINTERNAL MARKET
GENERAL LIQUIDITY
NET DEBT
EBITDA / TURNOVER
19
Remaining faithful to its values, the strategy in the meantime
initiated allowed for an increase of the operating profitability
in comparison with the previous year, and, at the same time,
an improvement of the autonomy and liquidity indicators
to values higher than those registered in the last years and,
therefore, for a decrease of the debt ratio.
The net debt assumed again positive values (37 million euros,
equivalent to 25.2% of turnover) after the exceptions of 2014
and 2015; it is also important to refer that its amount was
reinforced with the inclusion of a project that Conduril is in
charge of, in Angola, in the “Convention to export Portuguese
goods, equipment and services to the Republic of Angola”,
which will be liquidated, in the short term, by a Portuguese
financial institution, in Portugal, and which benefits from
the guarantee of the Portuguese State, already signed and
authorised by the government, under a credit insurance by
COSEC. The delay in this operation forced us to an additional
financial effort, which severely affected the net income.
5 |The constant commitment of Conduril in doing the right
thing, ensuring the best conditions for all the players in
its production process and environment preservation, is
already part of its business culture and this was, once again,
recognised by independent and dully accredited external
entities, namely:
• in the revalidation by APCER (Portuguese Association of
Certification) of the certifications of the quality management
system in Portugal, in the Mozambique Delegation and
in ENOP, with the transition to the standard NP EN ISO
9001:2015 being successfully performed;
• in the revalidation by APCER of the certifications of the
quality management system in the Angola branch, in Métis
and Urano, according to the standard NP EN ISO 9001:2008;
• in the revalidation by APCER of the certifications in the
scope of the occupational health and safety management
system in Portugal, in the Angola branch, in Métis and Urano,
according to the standards OHSAS 18001:2007 and NP
4397:2008;
INDICATORS 2014 2015 2016
Net assets (m¤) 502,130 493,493 440,791
Liabilities (m¤) 289,642 280,966 227,398
Equity (m¤) 212,488 212,527 213,393
Net debt (m¤) -10,769 -24,564 36,894
Investment in assets (m¤) 27,126 38,756 13,002
Turnover (m¤) 208,815 196,173 146,209
Internal market 7% 23% 20%
External market 93% 77% 80%
EBITDA (m¤) 69,018 30,244 28,758
Net income for the period (m¤) 29,507 6,155 4,244
Financial autonomy 42% 43% 48%
General liquidity 163% 192% 214%
Solvency ratio 73% 76% 94%
Debt ratio 136% 132% 107%
Sales profitability 14% 3% 3%
EBITDA/Turnover 33% 15% 20%
Angola | Malongo Dock
REPORT AND CONSOLIDATED ACCOUNTS 2016CONSOLIDATED MANAGEMENT REPORT
20
• in the revalidation by APCER of the certification of the
environmental management system in Portugal, according
to the standard NP EN ISO 14001:2012;
• in the renewal of the accreditation by IPAC (Portuguese
Institute for Accreditation) for the Portuguese Central
Laboratory, according to the standard NP EN ISO/IEC
17025:2005; and
• in the follow-up and maintenance of the certification
obtained in the scope of the EC Marking for the metal
structures produced in our Portuguese industrial facilities,
according to the standard EN 1090+1:2009+A1:2011;
• and, last but not least, by the customer satisfaction surveys
to the work we develop: abroad, in the last 78 construction
works, we obtained an average evaluation of 17.92 valores
and, in Portugal, in the last 12 construction works, we
obtained 17.50 valores [in a scale of 0-20].
6 |The difficulties that affect the economies of the countries
where Conduril operates, whose essential reflection has
been materialised in the reduction of investment in all
types of infrastructures, even more patent by the slight
growth projections in the short term and the continuous
low expectations of the economic agents, will continue to
restrict its activity. However, Conduril’s positioning in these
markets, its financial soundness that has been reinforced
throughout its existence, the strict analysis of all risks to
which it is exposed and the permanent assessment of new
opportunities at a global scale, combined with an order book
of over 385 million euros, guarantee the trust in sustaining a
turnover for 2017 higher than the turnover of 2016.
7 |Other information enclosed:
a | Conduril has branches in Angola, Mozambique, Botswana,
Cape Verde, Zambia, Malawi, Gabon and Morocco.
b | There are no overdue debts to the State or any other
public entities, including the Social Security.
c | The share capital, fully subscribed and paid-in, is composed of
2,000,000 ordinary shares with a nominal value of 5 euros each.
REPORT AND CONSOLIDATED ACCOUNTS 2016CONSOLIDATED MANAGEMENT REPORT
Portugal | Águas Santas tunnel
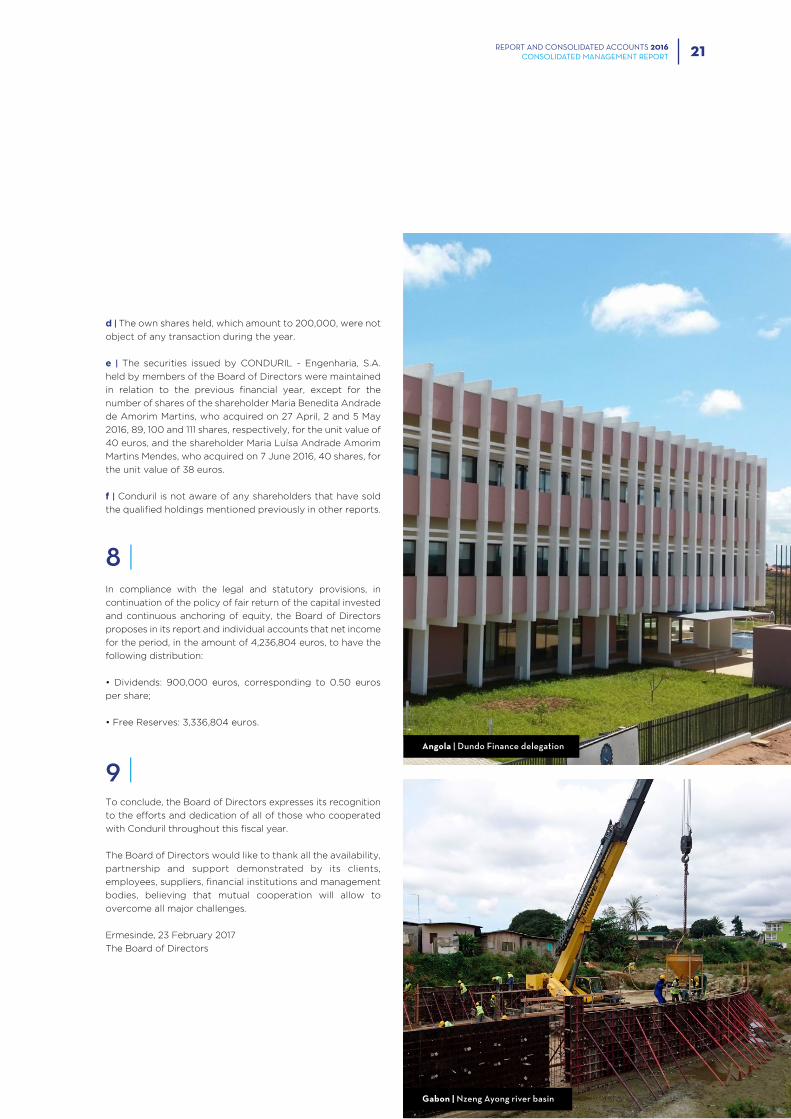
Malawi | Kamuzu dam
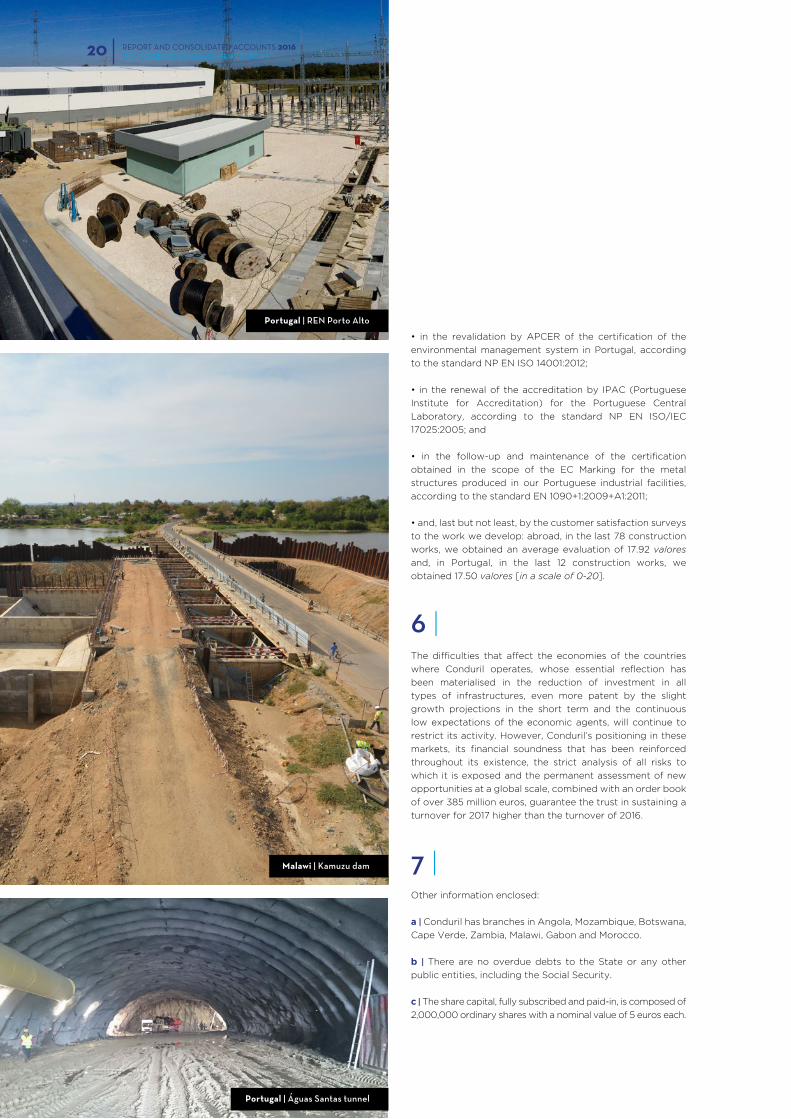
Portugal | REN Porto Alto
21
d | The own shares held, which amount to 200,000, were not
object of any transaction during the year.
e | The securities issued by CONDURIL - Engenharia, S.A.
held by members of the Board of Directors were maintained
in relation to the previous financial year, except for the
number of shares of the shareholder Maria Benedita Andrade
de Amorim Martins, who acquired on 27 April, 2 and 5 May
2016, 89, 100 and 111 shares, respectively, for the unit value of
40 euros, and the shareholder Maria Luísa Andrade Amorim
Martins Mendes, who acquired on 7 June 2016, 40 shares, for
the unit value of 38 euros.
f | Conduril is not aware of any shareholders that have sold
the qualified holdings mentioned previously in other reports.
8 |In compliance with the legal and statutory provisions, in
continuation of the policy of fair return of the capital invested
and continuous anchoring of equity, the Board of Directors
proposes in its report and individual accounts that net income
for the period, in the amount of 4,236,804 euros, to have the
following distribution:
• Dividends: 900,000 euros, corresponding to 0.50 euros
per share;
• Free Reserves: 3,336,804 euros.
9 |To conclude, the Board of Directors expresses its recognition
to the efforts and dedication of all of those who cooperated
with Conduril throughout this fiscal year.
The Board of Directors would like to thank all the availability,
partnership and support demonstrated by its clients,
employees, suppliers, financial institutions and management
bodies, believing that mutual cooperation will allow to
overcome all major challenges.
Ermesinde, 23 February 2017
The Board of Directors
REPORT AND CONSOLIDATED ACCOUNTS 2016CONSOLIDATED MANAGEMENT REPORT
Angola | Dundo Finance delegation
Gabon | Nzeng Ayong river basin
04
CONSOLIDATED FINANCIAL STATEMENTS
AND NOTESREPORT AND CONSOLIDATED
ACCOUNTS2016
REPORT AND CONSOLIDATED ACCOUNTS 2016CONSOLIDATED FINANCIAL STATEMENTS24
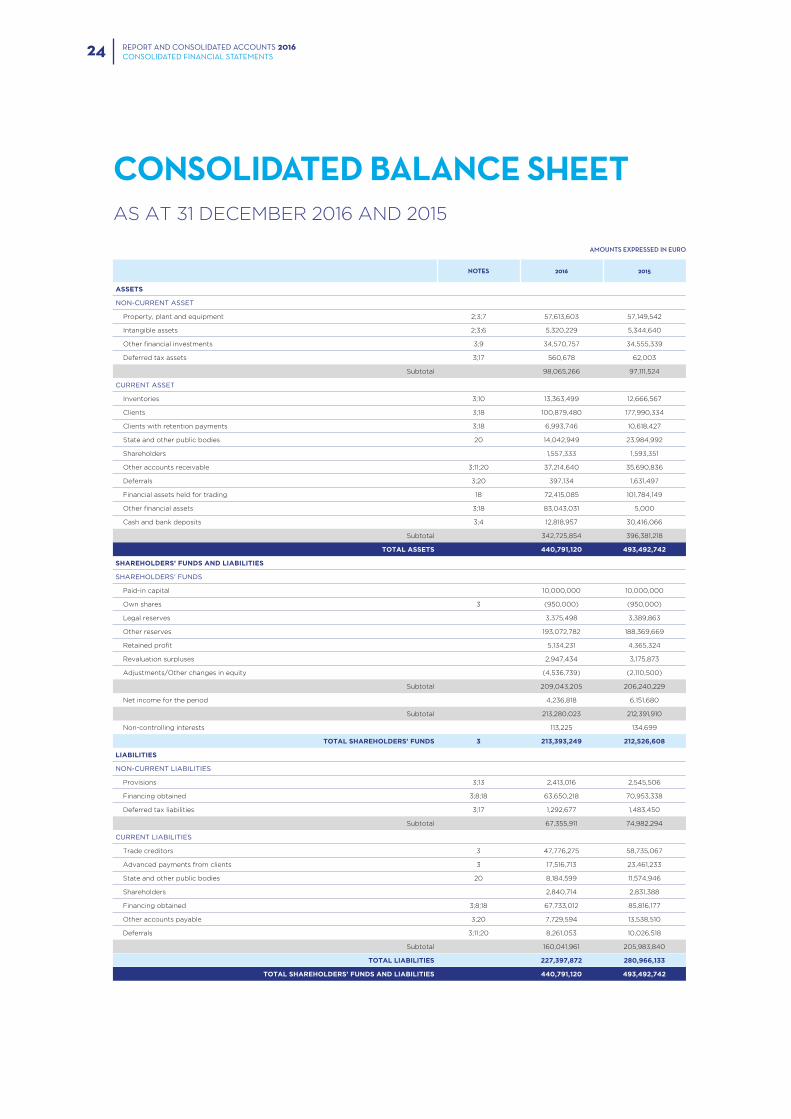
CONSOLIDATED BALANCE SHEETAS AT 31 DECEMBER 2016 AND 2015
NOTES 2016 2015
ASSETS
NON-CURRENT ASSET
Property, plant and equipment 2;3;7 57,613,603 57,149,542
Intangible assets 2;3;6 5,320,229 5,344,640
Other financial investments 3;9 34,570,757 34,555,339
Deferred tax assets 3;17 560,678 62,003
Subtotal 98,065,266 97,111,524
CURRENT ASSET
Inventories 3;10 13,363,499 12,666,567
Clients 3;18 100,879,480 177,990,334
Clients with retention payments 3;18 6,993,746 10,618,427
State and other public bodies 20 14,042,949 23,984,992
Shareholders 1,557,333 1,593,351
Other accounts receivable 3;11;20 37,214,640 35,690,836
Deferrals 3;20 397,134 1,631,497
Financial assets held for trading 18 72,415,085 101,784,149
Other financial assets 3;18 83,043,031 5,000
Cash and bank deposits 3;4 12,818,957 30,416,066
Subtotal 342,725,854 396,381,218
TOTAL ASSETS 440,791,120 493,492,742
SHAREHOLDERS’ FUNDS AND LIABILITIES
SHAREHOLDERS’ FUNDS
Paid-in capital 10,000,000 10,000,000
Own shares 3 (950,000) (950,000)
Legal reserves 3,375,498 3,389,863
Other reserves 193,072,782 188,369,669
Retained profit 5,134,231 4,365,324
Revaluation surpluses 2,947,434 3,175,873
Adjustments/Other changes in equity (4,536,739) (2,110,500)
Subtotal 209,043,205 206,240,229
Net income for the period 4,236,818 6,151,680
Subtotal 213,280,023 212,391,910
Non-controlling interests 113,225 134,699
TOTAL SHAREHOLDERS’ FUNDS 3 213,393,249 212,526,608
LIABILITIES
NON-CURRENT LIABILITIES
Provisions 3;13 2,413,016 2,545,506
Financing obtained 3;8;18 63,650,218 70,953,338
Deferred tax liabilities 3;17 1,292,677 1,483,450
Subtotal 67,355,911 74,982,294
CURRENT LIABILITIES
Trade creditors 3 47,776,275 58,735,067
Advanced payments from clients 3 17,516,713 23,461,233
State and other public bodies 20 8,184,599 11,574,946
Shareholders 2,840,714 2,831,388
Financing obtained 3;8;18 67,733,012 85,816,177
Other accounts payable 3;20 7,729,594 13,538,510
Deferrals 3;11;20 8,261,053 10,026,518
Subtotal 160,041,961 205,983,840
TOTAL LIABILITIES 227,397,872 280,966,133
TOTAL SHAREHOLDERS’ FUNDS AND LIABILITIES 440,791,120 493,492,742
AMOUNTS EXPRESSED IN EURO
REPORT AND CONSOLIDATED ACCOUNTS 2016CONSOLIDATED FINANCIAL STATEMENTS 25
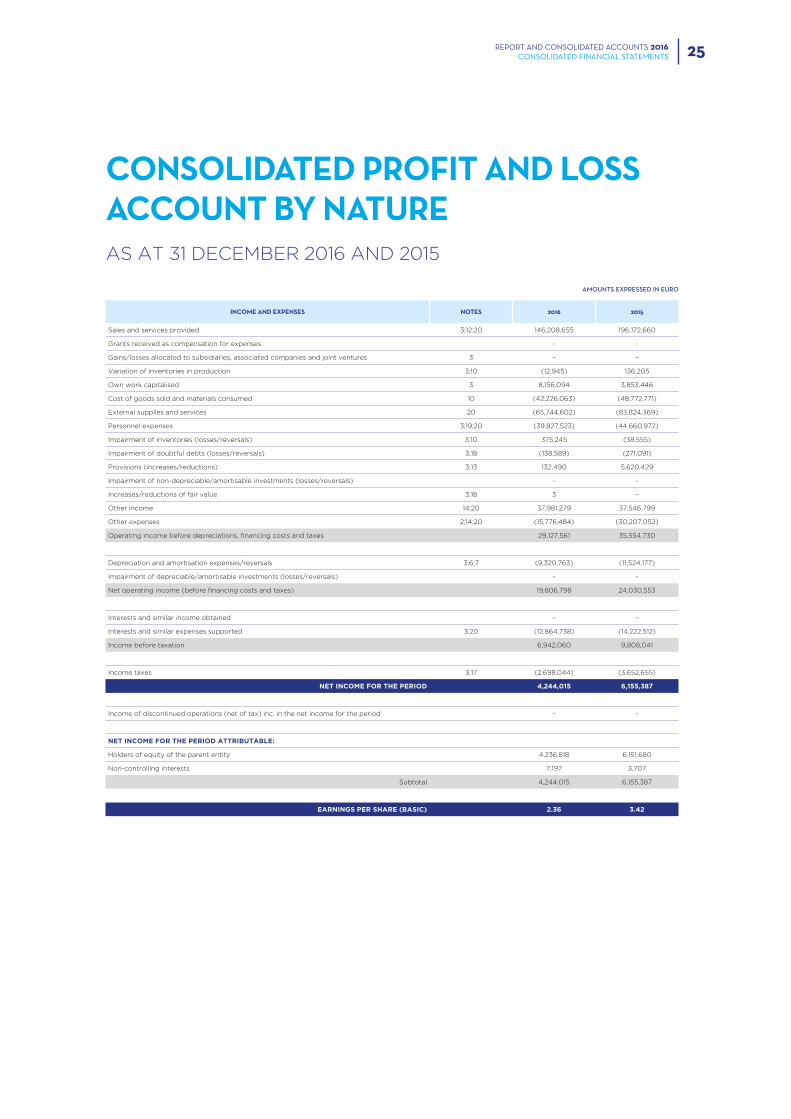
CONSOLIDATED PROFIT AND LOSS ACCOUNT BY NATUREAS AT 31 DECEMBER 2016 AND 2015
INCOME AND EXPENSES NOTES 2016 2015
Sales and services provided 3;12;20 146,208,655 196,172,660
Grants received as compensation for expenses – –
Gains/losses allocated to subsidiaries, associated companies and joint ventures 3 – –
Variation of inventories in production 3;10 (12,945) 136,205
Own work capitalised 3 8,156,094 3,853,446
Cost of goods sold and materials consumed 10 (42,226,063) (48,772,771)
External supplies and services 20 (65,744,602) (83,824,369)
Personnel expenses 3;19;20 (39,827,523) (44,660,972)
Impairment of inventories (losses/reversals) 3;10 375,245 (38,555)
Impairment of doubtful debts (losses/reversals) 3;18 (138,589) (271,091)
Provisions (increases/reductions) 3;13 132,490 5,620,429
Impairment of non-depreciable/amortisable investments (losses/reversals) – –
Increases/reductions of fair value 3;18 3 –
Other income 14;20 37,981,279 37,546,799
Other expenses 2;14;20 (15,776,484) (30,207,052)
Operating income before depreciations, financing costs and taxes 29,127,561 35,554,730
Depreciation and amortisation expenses/reversals 3;6;7 (9,320,763) (11,524,177)
Impairment of depreciable/amortisable investments (losses/reversals) – –
Net operating income (before financing costs and taxes) 19,806,798 24,030,553
Interests and similar income obtained – –
Interests and similar expenses supported 3;20 (12,864,738) (14,222,512)
Income before taxation 6,942,060 9,808,041
Income taxes 3;17 (2,698,044) (3,652,655)
NET INCOME FOR THE PERIOD 4,244,015 6,155,387
Income of discontinued operations (net of tax) inc. in the net income for the period – –
NET INCOME FOR THE PERIOD ATTRIBUTABLE:
Holders of equity of the parent entity 4,236,818 6,151,680
Non-controlling interests 7,197 3,707
Subtotal 4,244,015 6,155,387
EARNINGS PER SHARE (BASIC) 2.36 3.42
AMOUNTS EXPRESSED IN EURO
26
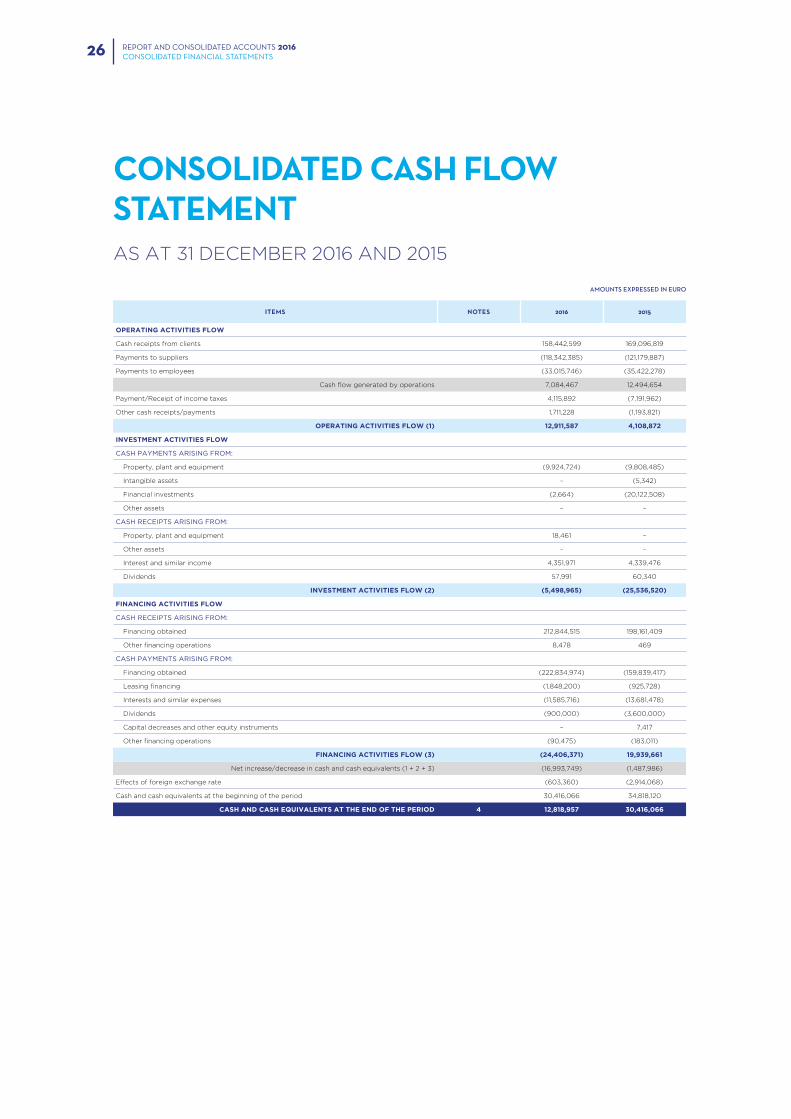
CONSOLIDATED CASH FLOW STATEMENTAS AT 31 DECEMBER 2016 AND 2015
ITEMS NOTES 2016 2015
OPERATING ACTIVITIES FLOW
Cash receipts from clients 158,442,599 169,096,819
Payments to suppliers (118,342,385) (121,179,887)
Payments to employees (33,015,746) (35,422,278)
Cash flow generated by operations 7,084,467 12,494,654
Payment/Receipt of income taxes 4,115,892 (7,191,962)
Other cash receipts/payments 1,711,228 (1,193,821)
OPERATING ACTIVITIES FLOW (1) 12,911,587 4,108,872
INVESTMENT ACTIVITIES FLOW
CASH PAYMENTS ARISING FROM:
Property, plant and equipment (9,924,724) (9,808,485)
Intangible assets – (5,342)
Financial investments (2,664) (20,122,508)
Other assets – –
CASH RECEIPTS ARISING FROM:
Property, plant and equipment 18,461 –
Other assets – –
Interest and similar income 4,351,971 4,339,476
Dividends 57,991 60,340
INVESTMENT ACTIVITIES FLOW (2) (5,498,965) (25,536,520)
FINANCING ACTIVITIES FLOW
CASH RECEIPTS ARISING FROM:
Financing obtained 212,844,515 198,161,409
Other financing operations 8,478 469
CASH PAYMENTS ARISING FROM:
Financing obtained (222,834,974) (159,839,417)
Leasing financing (1,848,200) (925,728)
Interests and similar expenses (11,585,716) (13,681,478)
Dividends (900,000) (3,600,000)
Capital decreases and other equity instruments – 7,417
Other financing operations (90,475) (183,011)
FINANCING ACTIVITIES FLOW (3) (24,406,371) 19,939,661
Net increase/decrease in cash and cash equivalents (1 + 2 + 3) (16,993,749) (1,487,986)
Effects of foreign exchange rate (603,360) (2,914,068)
Cash and cash equivalents at the beginning of the period 30,416,066 34,818,120
CASH AND CASH EQUIVALENTS AT THE END OF THE PERIOD 4 12,818,957 30,416,066
AMOUNTS EXPRESSED IN EURO
REPORT AND CONSOLIDATED ACCOUNTS 2016CONSOLIDATED FINANCIAL STATEMENTS
27
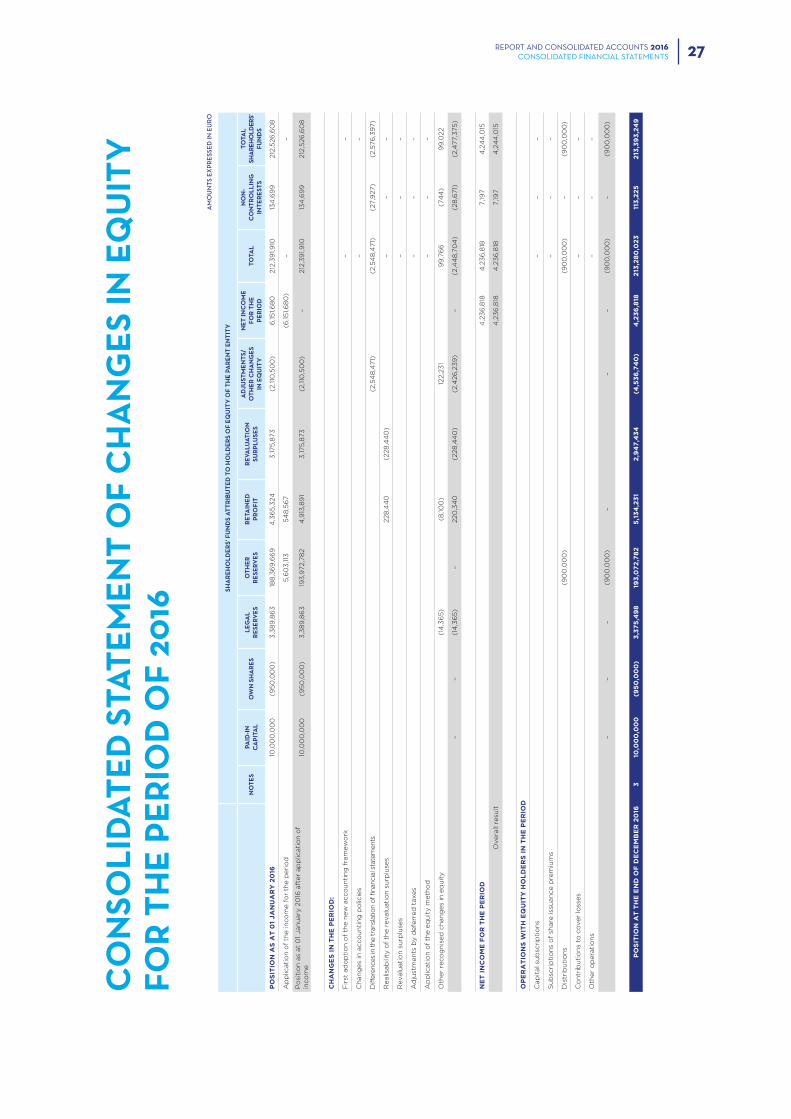
CO
NSO
LID
ATED
STA
TEM
ENT
OF
CH
AN
GES
IN E
QU
ITY
FO
R T
HE
PER
IOD
OF
2016
SHA
REH
OLD
ERS’
FU
ND
S AT
TRIB
UTE
D T
O H
OLD
ERS
OF
EQU
ITY
OF
THE
PAR
ENT
ENTI
TY
NO
TES
PAID
-IN
CA
PITA
LO
WN
SH
AR
ESLE
GA
L R
ESER
VES
OTH
ER
RES
ERV
ESR
ETA
INED
PR
OFI
TR
EVA
LUAT
ION
SU
RPL
USE
S
AD
JUST
MEN
TS/
OTH
ER C
HA
NG
ES
IN E
QU
ITY
NET
INC
OM
E FO
R T
HE
PER
IOD
TOTA
LN
ON
-C
ON
TRO
LLIN
G
INTE
RES
TS
TOTA
LSH
ARE
HO
LDER
S’FU
ND
S
PO
SIT
ION
AS
AT
01
JA
NU
AR
Y 2
016
10,0
00
,00
0
(95
0,0
00
)3
,38
9,8
63
18
8,3
69
,66
9
4,3
65
,324
3
,175
,873
(2
,110
,50
0)
6,15
1,6
80
212
,39
1,9
10
134
,69
9
212
,526
,60
8
Ap
plic
ati
on
of
the in
co
me f
or
the p
eri
od
5,6
03
,113
5
48
,56
7
(6,15
1,6
80
)–
–
Po
siti
on
as
at
01
Jan
uary
20
16 a
fter
ap
plic
ati
on
of
inco
me
10,0
00
,00
0
(95
0,0
00
)3
,38
9,8
63
19
3,9
72,7
82
4,9
13,8
91
3,175
,873
(2
,110
,50
0)
– 212
,39
1,9
10
134
,69
9
212
,526
,60
8
CH
AN
GE
S I
N T
HE
PE
RIO
D:
Fir
st a
do
pti
on
of
the n
ew
acco
un
tin
g f
ram
ew
ork
– –
Ch
an
ges
in a
cco
un
tin
g p
olic
ies
– –
Diff
ere
nce
s in
the tra
nsl
atio
n o
f finan
cial
sta
tem
ents
(2,5
48
,471)
(2,5
48
,471)
(27,9
27)
(2,5
76
,39
7)
Realis
ab
ility
of
the r
evalu
ati
on
su
rplu
ses
228
,44
0
(228
,44
0)
– –
–
Revalu
ati
on
su
rplu
ses
– –
–
Ad
just
men
ts b
y d
efe
rred
taxes
– –
–
Ap
plic
ati
on
of
the e
qu
ity m
eth
od
– –
–
Oth
er
reco
gn
ised
ch
an
ges
in e
qu
ity
(14
,36
5)
(8,10
0)
122,2
31
99
,76
6
(74
4)
99
,022
––
(14
,36
5)
–220
,34
0
(228
,44
0)
(2,4
26
,23
9)
– (2
,44
8,7
04
)(2
8,6
71)
(2,4
77,3
75
)
NE
T I
NC
OM
E F
OR
TH
E P
ER
IOD
4,2
36
,818
4
,23
6,8
18
7,19
7
4,2
44
,015
Overa
ll re
sult
4,2
36
,818
4
,23
6,8
18
7,19
7
4,2
44
,015
OP
ER
AT
ION
S W
ITH
EQ
UIT
Y H
OL
DE
RS
IN
TH
E P
ER
IOD
Cap
ital su
bsc
rip
tio
ns
– –
–
Su
bsc
rip
tio
ns
of
share
iss
uan
ce p
rem
ium
s–
– –
Dis
trib
uti
on
s(9
00
,00
0)
(90
0,0
00
)–
(90
0,0
00
)
Co
ntr
ibu
tio
ns
to c
over
loss
es
––
–
Oth
er
op
era
tio
ns
––
–
– –
–(9
00
,00
0)
––
– (9
00
,00
0)
–(9
00
,00
0)
PO
SIT
ION
AT
TH
E E
ND
OF
DE
CE
MB
ER
20
163
10,0
00
,00
0
(95
0,0
00
)3
,37
5,4
98
19
3,0
72
,78
2
5,1
34
,23
1 2
,94
7,4
34
(4
,53
6,7
40
)4
,23
6,8
18
213
,28
0,0
23
11
3,2
25
2
13,3
93
,24
9
AM
OU
NTS
EX
PRES
SED
IN E
UR
O
REPORT AND CONSOLIDATED ACCOUNTS 2016CONSOLIDATED FINANCIAL STATEMENTS
REPORT AND CONSOLIDATED ACCOUNTS 2016NOTES TO THE CONSOLIDATED FINANCIAL STATEMENTS28
1 | INTRODUCTORY NOTE
CONDURIL - Engenharia, S.A. (“CONDURIL” or “Company”),
is a company founded in 1959 and transformed in a company
limited by shares in 1976, with registered office at Av. Eng.º
Duarte Pacheco, 1835 – 4445-416 Ermesinde – Valongo,
Portugal, and the participated companies (“Group”), whose
main activity is public construction works and all other works
related to the exercise of this activity.
We believe that these consolidated financial statements are
a true and proper representation of the operations of the
companies belonging to the Group, as well as their financial
position and performance and cash flows.
The consolidated financial statements are filed in the
Company’s registered office.
All amounts expressed in these notes are presented in euros,
rounded to the nearest unit.
2 | ACCOUNTING FRAMEWORK
FOR THE PREPARATION OF THE
FINANCIAL STATEMENTS
2.1. These financial statements have been prepared
bearing in mind the continuation of the Group’s operations,
from the accounting records of the Group and in accordance
with the rules of the Accounting Standardisation System,
governed by the following legislation:
• Decree-law no. 158/2009, of 13 July (Accounting
Standardisation System);
• Decree Order no. 986/2009, of 7 September (Financial
Statements Models);
• Notice no. 15652/2009, of 7 September (Framework);
• Notice no. 15655/2009, of 7 September (Accounting
Standards and Financial Reporting);
• Decree Order no. 1011/2009, of 9 September (Code of
Accounts);
• Decree Order no. 218/2015, of 23 July (Code of Accounts).
NOTES TO THE CONSOLIDATED FINANCIAL STATEMENTS AS AT 31 DECEMBER2016
2.2. Indication and comment on the balance sheet and
the income statement whose contents are not comparable
with those of the previous financial year:
The amounts presented for comparison purposes are
comparable and presented in accordance with the model
resulting from the amendments introduced by the legislation
mentioned in the previous paragraph, with the exception of
the following facts:
• A reclassification of 3,418,439 euros from the item of
property, plant and equipment to the item of intangible
assets, regarding the amount of development rights in
Angola, was performed. For the financial statements
to be comparable, the corresponding restatement of
the mentioned items in the financial statements at 31
December 2015 was made.
• Due to the declared liquidation, in 2016, of the subsidiaries
4M Properties, S.A. and Mabalane – Inertes, Lda. the
financial statements of the period ending on 31 December
2016 reflect the impact of this operation. Therefore, in the
item “Other income” around 473,166 euros, in the item
“Other expenses” around 55,916 euros, and in the item
“Bad debts” around 341,363 euros, were rectified.
2.3. Impact of the changes to the accounting standards:
The Decree-law no. 98/2015, of 2 June, includes a set of
changes to the accounting standards with reference to 01
January 2016. The financial statements for the period ending
on 31 December 2016 includes a change to the record of the
responsibilities related to retirement benefits. Therefore, the
mentioned financial statements include in equity the effect
of remeasurement of liabilities regarding actuarial gains and
losses. The impact (increase) in equity at 31 December 2016
of this change is of 65,644 euros (on 01 January 2016, the
increase amounted to 541,672 euros). In the item “Personnel
expenses”, for the period of 2015, actuarial gains and losses
of around 52,487 euros were registered.
3 | SIGNIFICANT ACCOUNTING
POLICIES
The significant accounting policies adopted in the preparation
of the attached financial statements are the following:
3.1. Measurement bases used in the preparation of the
financial statements
The attached financial statements have been prepared bearing
in mind the continuation of the Group’s operations, from the
accounting books and records of the companies belonging
to the Group, maintained in accordance with the accounting
principles generally accepted in Portugal (NCRF).
a | Consolidated principles
The consolidated principles adopted by the Group in the
preparation of the consolidated financial statements are the
following:
i. Investments in subsidiaries
Permanent participations in companies in which the Group
REPORT AND CONSOLIDATED ACCOUNTS 2016NOTES TO THE CONSOLIDATED FINANCIAL STATEMENTS 29
owns, directly or indirectly, more than 50% of the voting rights
at a General Meeting of Shareholders or is able to establish
financial and operational policies (definition of control used by
the Group), are included in the consolidated financial statements
using the full consolidation method. Equity and net income of
these companies corresponding to the shareholding of third
parties in the subsidiary companies is shown separately in the
consolidated balance sheet and in the consolidated profit and
loss account in the item “Non-controlling interests”.
When losses attributable to minority shareholders exceed the
minority interest in a subsidiary’s equity, then the Group absorbs
this excess and any additional losses, except when the minority
shareholders have a binding obligation and are able to cover
such losses. If the subsidiary subsequently reports profits, then
the Group appropriates all profits until the minority’s share of
losses absorbed has been recovered.
The results of subsidiaries acquired or sold during the period
are included in the income statement from the effective date
of acquisition or up to the effective date of sale, as appropriate.
Adjustments to the financial statements of subsidiaries are
made whenever necessary to adjust them to the accounting
policies used by the Group. Transactions, balances and
dividends distributed between the Group’s subsidiaries are
eliminated on consolidation.
Whenever the Group has, in substance, control over other entities
created for a specific purpose (“Special Purpose Entities”), even
if no share capital interest is directly or indirectly held in those
entities, these are consolidated by the full consolidation method.
ii. Investments in associates
Investments in associated companies (companies where
the Group exercises significant influence but does not have
control or joint control through the participation in financial
and operational policies - usually corresponding to holdings
between 20% and 50% in a company’s share capital) are
registered by the equity method.
According to the equity method, investments in associated
companies are initially accounted at the acquisition cost,
which is adjusted proportionally to the Group’s share in the
corresponding equity of those companies, at the acquisition
date or at the date of the first adoption of the equity method.
Permanent participations are adjusted annually by the amount
corresponding to the participation in the net profit/loss of the
associated companies as opposed to income or expenses in
the period. Furthermore, the dividends of these companies are
registered as a decrease in investments, and the Group’s share
in the changes occurred in the associated company’s equity is
registered as a change in the Group’s equity.
The differences between the acquisition cost and fair value of the
assets and liabilities attributable to the associate on the acquisition
date, if positive, are recognised as goodwill. If those differences
are negative, after reassessment of the estimated fair value, they
are registered as gains for the period in the item “Other income”.
An assessment of the investments in associates is performed
whenever there are indications that the asset may be impaired,
with the impairment losses that are shown to exist being
registered as expenses. Impairment losses recognised in
previous periods that are no longer justifiable are reversed.
When the Group’s share of losses of the associated company
exceeds the investment value, the investment is reported at
null value, except to the extent of the Group’s commitments
to the associate, setting up a provision to cover those
obligations.
The Group’s share in unrealised gains arising from transactions
with associated companies is eliminated proportionately,
against the investment in that associated company. Unrealised
losses are eliminated, but only to the extent that there is no
evidence of impairment of the asset transferred.
iii. Jointly controlled entities
The financial interests in jointly controlled companies/
entities were consolidated in the attached financial
statements by the proportionate consolidation method from
the date in which the control is shared. According to this
method, the assets, liabilities, income and expenses of these
companies have been included in the consolidated financial
statements, on a line-by-line basis, in proportion to the
Group’s participation in the companies.
The classification of the financial interests held in jointly
controlled companies/entities is determined based on:
• shareholder agreements that regulate the joint control;
• effective percentage held;
• voting rights held.
Any change of consolidation generated by the acquisition
of a jointly controlled company/entity is registered
according to the accounting policies defined for subsidiaries.
Transactions, balances and dividends distributed between
the jointly controlled companies are eliminated in proportion
to the Group’s participation.
iv. Goodwill
At the balance sheet date, an evaluation of the recoverable
amount of the net value of the goodwill is made, and the
respective impairment losses recognised whenever the
accounting value of goodwill exceeds its recoverable
amount. The goodwill value is not amortised. The gain or
loss on disposal of an entity includes the accounting value
of goodwill related to the entity sold, unless the business
to which that goodwill is related is maintained generating
benefits to the Group. Impairment losses related to goodwill
cannot be reversed and are registered in the income
statement for the period, in the item “Impairment of non-
-depreciable/amortisable investments (losses/reversals)”.
The differences between the acquisition cost of investments in
subsidiaries and associates, and the fair value of the identifiable
assets and liabilities (including contingent liabilities) of
these companies at the date of their acquisition, if negative,
are recognised as income at the date of acquisition, after
reassessment of the fair value of the identifiable assets and
liabilities.
v. Translation of financial statements of foreign subsidiaries
Assets and liabilities of foreign entities financial statements
included on consolidation are translated into euros using the
exchange rates at the balance sheet date, and income and
expenses using the average exchange rates. The amount
related to the exchange rate difference is registered in the
equity item “Other changes in equity”.
REPORT AND CONSOLIDATED ACCOUNTS 2016NOTES TO THE CONSOLIDATED FINANCIAL STATEMENTS30
The goodwill value and fair value adjustments resulting from
the acquisition of foreign entities are treated as assets and
liabilities of those entities and translated to euros according to
the exchange rate in force at the end of the period. Whenever
a foreign company is sold, accumulated exchange rate
differences are recognised in the income statement as a gain
or loss on the disposal.
b | Intangible assets
The intangible assets, which essentially comprise development
rights and computer programmes, are registered at acquisition
cost, net of eventual impairment losses and accumulated
amortisation. These assets are written down from the moment
in which the underlying assets are completed or in use, by the
straight-line method, for a period of 60 and 3 years, respectively.
The intangible assets are only recognised when it is probable
that they derive future economic benefits for the Group, are
controllable by the Group and that they can be measured reliably.
The development costs for which the Group demonstrates
ability to complete their development and start their marketing
and/or use, and for which it is probable that their created asset
will generate future economic benefits, are capitalised. The
development costs that do not meet these criteria are registered
as expense in the period in which they are incurred.
The gains or losses arising from the sale or write-off of these
assets are determined as the difference between the sale price
and the accounting net value at the date of sale/write-off, and
are registered by the net value in the income statement, as
“Other income” or “Other expenses”.
c | Property, plant and equipment
The property, plant and equipment acquired up to 01
January 2009, are registered at their considered cost,
which corresponds to the acquisition cost or the revaluated
acquisition cost in accordance with the generally accepted
principles in Portugal until that date, net of accumulated
depreciation and impairment losses.
The property, plant and equipment acquired after that date,
are registered at acquisition cost, net of the corresponding
depreciation and accumulated impairment losses.
Depreciations are calculated, after the beginning of use of
the assets, by the straight-line method, on an annual basis,
according to the following estimated useful lives:
YEARS
Buildings and other constructions 10 – 25
Machinery and other equipment 3 – 16
Transport equipment 3 – 8
Office equipment 3 – 12
Other property, plant and equipment 3 – 10
Maintenance and repair costs, which do not increase the
useful life of these fixed assets are registered as expenses in
the period in which they occur. The costs of major repairs and
renovations are included in the accounting value of the asset
whenever it is expected that this would involve additional
future economic benefits.
Property, plant and equipment in progress represent assets
still in the construction phase or in transit, and are registered at
acquisition cost net of eventual impairment losses. These assets
are depreciated from the moment they are in a state of use.
The gains or losses arising from the sale or write-off of these
assets are determined as the difference between the sale price
and the accounting net value at the date of sale/write-off, and
are registered by the net value in the income statement, as
“Other income” or “Other expenses”.
d | Leases
Classification of leases as financial or operating is made based
on the substance and not on the form of the contract. The lease
agreements in which the Group acts as lessee are classified as
finance leases, if the risks and rewards incident to ownership lie
with the lessee, and as operating leases, if the risks and rewards
incident to ownership do not lie with the lessee.
In accordance with the financial method, the cost of the asset
is registered as an asset, the corresponding responsibility is
registered as a liability, in the item “Financing obtained”, and
the interests included in the value of rentals and the assets
reintegration are registered as costs in the income statement
for the concerning period.
Operating lease instalments are recognised as expenses
in the income statement, on a straight-line basis, over the
rental period.
e | Integration of branches
The accounting information of the branches where the Group
develops its activity, namely Angola, Mozambique, Morocco,
Botswana, Cape Verde, Senegal, Zambia, Malawi and Gabon,
is monthly integrated in accounting. The balances and
transactions occurred in the period between the registered
office and the branches are eliminated.
When the functional currency of the branch is different from
the reporting currency of the Group, the process of integration
is performed through the translation of the variations of
assets and liabilities, income and expenses at the exchange
rate in force on the date of each monthly integration. On
the reporting date, the exchange differences resulting from
monetary assets and liabilities are calculated, being registered
as income or expenses in the income statement.
In the accounting information of the branches are mainly
used accounting policies in force in Portugal. To guarantee
the uniformity of the accounting policies, whenever the local
legislation is different from the laws in force in Portugal, the
proper adjustments are made.
f | Impairment of non-current assets (except for goodwill)
Whenever an event or change in circumstances is identified
that would indicate that the amount by which the asset is
registered cannot be recovered, an assessment of impairment
is performed with reference at the end of each period.
Whenever the amount by which the asset is registered is
higher than its recoverable amount, an impairment loss is
recognised, registered as an expense in the item “Impairment
of depreciable/amortisable investments (losses/reversals)”.
The recoverable amount is the highest between the assets’
net selling price and the use value. The net selling price is the
amount that would have been achieved with the disposal
REPORT AND CONSOLIDATED ACCOUNTS 2016NOTES TO THE CONSOLIDATED FINANCIAL STATEMENTS 31
of the asset in a transaction between independent and
knowledgeable entities, deducted from the costs directly
attributable to the disposal. The use value is the present
value of estimated future cash flows expected to arise from
the continuing use of the asset and from its disposal at the
end of its useful life. Recoverable amounts are estimated for
individual assets or, if this is not possible, for the cash-
-generating unit to which the asset belongs.
After the recognition of an impairment loss, the expense
with the amortisation/depreciation of an asset is adjusted
in future periods to allocate the asset’s revised carrying
amount, less its residual value (if any), on a systematic basis
over its remaining useful life.
The reversal of impairment loss recognised in previous
periods is registered when it is concluded that the
recognised impairment losses no longer exist or have
decreased. This assessment is made whenever it is believed
that impairment losses previously recognised have been
reversed. The reversal of impairment losses is recognised
as income in the income statement. However, the reversal
of the impairment loss is performed up to the limit of the
amount that would be recognised (net of amortisation
or depreciation), if the impairment loss had not been
registered in previous periods.
g | Costs of financing obtained
Costs related to financing are recognised as an expense on
an accrual basis, even in cases where these costs are directly
attributable to the acquisition, construction or production of
an asset whose period of time to get ready for its intended
use is substantial, in which case it could be capitalised until
the moment in which all the activities necessary to prepare
the asset eligible for its use or sale are complete.
h | Inventories
Goods and raw, subsidiary and consumable materials are
stated at acquisition cost or at market price, whichever is
lower (using the average cost as a costing method). Market
price means the net realisable value or the replacement cost.
Finished or semi-finished products, by-products and products
and works in progress are valued at production cost (which
includes the cost of raw materials, labour and manufacturing
overheads) or at the market price in case this is lower. Market
price means the net realisable value.
In cases where the market price is lower than the acquisition
cost, impairment losses are recognised.
i | Financial instruments
i. Investments
The investments on other companies are registered at the
acquisition cost or, in the case of loans granted, at the nominal
value. An assessment of these investments is made whenever
there are indications that the asset may be impaired, with the
impairment losses that are shown to exist being registered as
costs. Income obtained from financial investments (dividends
or profit distributed) are registered in the income statement
for the period in which distribution is decided and announced.
ii. Debtors
Debtors are registered at their nominal value and presented
at the balance sheet net of eventual impairment losses,
recognised in the item “Impairment of doubtful debts (losses/
reversals)”, in order to reflect their net realisable value.
Impairment losses are recognised if there is objective and
measurable evidence that, as a result of one or more events
which occurred, the outstanding balance will not be fully or
partially received. For that, the Group takes into consideration
market information showing that the client is insolvent along
with historical data of overdue and not paid amounts.
Recognised impairment losses correspond to the difference
between the carrying amount and the present value of the
estimated cash flows, discounted at the original effective
interest rate, which is null whenever payment is expected
to occur within less than one year.
iii. Financing
Financing is registered as liabilities at their nominal value
net of transaction costs directly related to the issuance of
those liabilities. Financial expenses are calculated based on
the effective interest rate and are registered in the income
statement for the period on an accruals basis.
iv. Trade creditors
Trade creditors and other creditors are registered at their
nominal value, as they do not bear interests.
v. Financial liabilities and equity instruments
Financial liabilities and equity instruments are classified based
upon their contractual substance, regardless of the legal form
they assume.
An instrument is classified as a financial liability when there is a
contractual obligation for its settlement to be effected through
the delivery of cash or another financial asset, regardless of
its legal form. Financial liabilities are recognised initially at fair
value net of transaction costs incurred, and subsequently at
amortised cost, using the effective interest rate method.
An instrument is classified as an equity instrument when there
is no contractual obligation for its settlement to be effected
through the delivery of cash or another financial asset,
regardless of its legal form, which evidence a residual interest
in the assets of an entity after deducting all of its liabilities.
The costs directly attributable to the issuance of equity
instruments are recognised in equity as a deduction to
the amount issued. Amounts paid or received related to
purchases or sales of equity instruments are registered in
equity, net of transaction costs.
The distributions made of an equity instrument are deducted
to equity as dividends, when declared.
vi. Own shares
Own shares are accounted at the acquisition cost as an
allowance to equity. Gains or losses arising from disposal of
own shares are registered in the item “Other reserves”, not
affecting the profit/loss of the period.
vii. Discounted bills and accounts receivable in factoring
The Group derecognises financial assets in its financial
statements, only when the contractual rights to the cash
flows inherent to those assets have already expired, or when
the Group substantially transfers all the risks and benefits
REPORT AND CONSOLIDATED ACCOUNTS 2016NOTES TO THE CONSOLIDATED FINANCIAL STATEMENTS32
inherent to the ownership of those assets to a third entity. If
the Group substantially retains the risks and benefits inherent
to the ownership of those assets, it continues to recognise
them in its financial statements, by registering in liabilities, in
the item “Financing obtained”, the monetary consideration for
the assets transferred.
Consequently, clients’ balances represented by discounted
bills that have not yet reached their maturity date and
accounts receivable in factoring as at the balance sheet
date, with the exception of operations of “Factoring without
resource”, are recognised in the financial statements, in
liabilities, until they are collected.
viii. Cash and cash equivalents
The amounts included in the item “Cash and cash equivalents”
correspond to cash on hand, bank deposits, term deposits and
other treasury applications, which mature in less than three
months and are subject to insignificant risk of change in value.
j | Provisions, contingent liabilities and contingent assets
Provisions are recognised only when the Group has a present
obligation (legal or constructive) as result of a past event, it
is probable that an outflow of resources will be required to
settle the obligation, and a reliable estimate can be made of
that obligation. Provisions are reviewed at each balance sheet
date and are adjusted to reflect the best estimate at that date.
Provisions for restructuring costs are recognised whenever a
formal and detailed restructuring plan exists and that plan has
been communicated to the parties involved.
Contingent liabilities are defined by the Group as: (i) possible
obligations arising from past events and whose existence will
only be confirmed by the occurrence, or not, of one or more
uncertain future events not under full control of the Group,
or (ii) present obligations arising from past events, but which
are not recognised because it is unlikely that an outflow of
resources embodying economic benefits will be required to
settle the obligation or the amount of the obligation cannot
be measured with sufficient reliability.
Contingent assets usually arise from unplanned or other
unexpected events that give rise to the possibility of an
inflow of economic benefits to the Group. The Group does not
recognise the contingent assets in its financial statements; it
only proceeds to its disclosure if it considers that the economic
benefits which may result from there to the Group are likely.
When the realisation of income is virtually certain, then the
related asset is not a contingent asset and its recognition is
appropriate.
k | Economic periods
Income and expenses are registered in the period to which
they relate, regardless of the corresponding payment or
receipt, on an accruals basis. Differences between the amounts
received or paid and the corresponding income and expenses
are registered in the items “Other accounts receivable” and
“Other accounts payable” or “Deferrals”.
l | Income taxes
The income taxes registered in profit/loss include the effects
of current taxes and deferred taxes. The current income tax is
determined based on the taxable profit of each company included
on consolidation, in accordance with the tax rules in force.
Deferred taxes refer to the temporary differences between
the amounts of the assets and liabilities for the purposes
of accounting records and the respective amounts for the
purposes of taxation, as well as those arising from the tax
benefits obtained and the temporary differences between the
tax and accounting results. The tax is recognised in the income
statement, except when related with items, which are moved in
equity, a fact that implies their recognition in equity.
Deferred tax assets and liabilities are calculated and periodically
evaluated using the taxation rates, which are expected to be in
force on the date of reversal of temporary differences.
Deferred taxes refer to temporary differences between the
accounting values of the assets and liabilities and their tax base,
using the tax rates approved or substantially approved, at the
balance sheet date, in each jurisdiction and which are expected
to be applied when the temporary differences are reversed.
Deferred tax liabilities are recognised for all taxable temporary
differences (except for goodwill not deductible for tax
purposes), differences arising on initial recognition of assets
and liabilities that affect neither accounting nor taxable profit
and differences relating to investments in subsidiaries to the
extent that they will probably not reverse in the foreseeable
future. Deferred tax assets are recognised to the extent when
it is probable that future taxable profits will be available to
absorb deductible temporary differences for tax purposes.
Deferred tax assets are registered only when there are
reasonable expectations of sufficient taxable profits for
them to be used. Every year, a revaluation of the temporary
differences underlying to the deferred tax assets is made, with
the purpose of recognising or adjust them according to the
present expectation of their future recovery.
m | Non-current assets held for sale
Non-current assets are classified as held for sale if the balance
sheet value is realisable through a sales transaction, rather
than through its continuing use. This situation is only verified
when: (i) the sale is probable and the assets are available for
immediate sale in the present conditions; (ii) the management
is committed with a sales plan; and (iii) the sale is expectable to
occur within twelve months.
Non-current assets classified as held for sale are measured at
the lower value between the carrying amount and fair value net
of expectable expenses with its sale.
n | Government and other public entities subsidies
Subsidies for personnel training programmes or exploration
subsidies are registered in the item “Grants received as
compensation for expenses” of the income statement for
the period in which these programmes are carried out,
independently of when they are received, unless it becomes
receivable in a later period, in which it will be income for the
period when it was received.
Non-reimbursable subsidies related to the assets are
registered in the balance sheet as “Other changes in equity”
and recognised in the income statement proportionally to the
reintegrations of the subsidised assets, in each period.
o | Retirement complements
CONDURIL - Engenharia, S.A. has assumed the commitment
REPORT AND CONSOLIDATED ACCOUNTS 2016NOTES TO THE CONSOLIDATED FINANCIAL STATEMENTS 33
of attributing a number of pecuniary benefits to its employees
at complementary title of retirement pensions for old age
or disability. To cover those responsibilities, CONDURIL -
Engenharia, S.A. created a defined benefit Pension Fund
in 1989, exclusive to its employees, whose annual charges,
determined according to actuarial calculations, are registered
in accordance with the NCRF 28 – “Employee benefits”.
The actuarial responsibilities are calculated according to the
“Projected Unit Credit Method”, by using the actuarial and
financial assumptions considered appropriate.
p | Revenue
The Group recognises the income of works, contract by
contract, in accordance with the NCRF 19 – “Construction
contracts” under the percentage of completion method,
which is understood as the relation between costs incurred in
each work until a certain date and the sum of those costs with
the costs estimated for the work completion. The differences
between the values resulting from the application of the level
of completion to the estimated income and the invoiced
values are included in the items “Other accounts receivable”
and “Deferrals”.
Variations in works in the amount of revenue agreed in the
contract are recognised in the income for the period when
it is highly possible that the client will approve the amount
of revenue arising from the variation, and that this can be
reliably measured.
Claims for reimbursement of costs not included in the contract
price are included in contract revenue when negotiations are
at an advanced stage and it is probable that the client will
accept the claim, and that it will be reliably measurable.
To meet the costs incurred during the warranty period of the
works, the Group recognises every year liabilities to fulfil this
legal obligation, which is calculated taking into account the
annual production volume and the costs incurred in the past
with works in warranty period.
When it is probable that total costs foreseen in the
construction contract will exceed its defined income, the
expected loss shall be immediately recognised in the income
statement for the period.
Dividends are recognise as income in the income statement
for the period in which its attribution is decided.
q | Expenses with the preparation of proposals
The expenses made with the preparation of proposals for
several tenders are recognised in the income statement for
the period in which they are incurred.
r | Own work capitalised
Own work capitalised corresponds to construction and
improvement works carried out by any company of the
Group, as well as the major repairs of equipment and include
expenses with materials, direct labour and general expenses.
Those expenses are object of capitalisation only when fulfilled
the following requirements:
• The assets developed are identifiable;
• There is a strong probability of the assets generating future
economic benefits; and
• They can be reliably measured.
s | Subsequent events
Events that occur after the balance sheet date that provide
evidence or additional information on conditions existing at
the balance sheet date (“adjusting events”), are reflected
in the consolidated financial statements. Events after the
balance sheet date that provide information on conditions
arising after the balance sheet date (“non-adjusting events”),
when material, are disclosed in the notes to the consolidated
financial statements.
t | Judgements and estimates
For the preparation of the financial statements, the Board
of Directors of each company included on consolidation has
been based on best knowledge of past and/or present events,
considering assumptions related to future events.
The most significant accounting estimates reflected in the
consolidated financial statements for the periods ending on
31 December 2016 and 2015 include:
• Useful lives of tangible assets;
• Record of provisions and impairment losses;
• Recognition of revenue in works in progress;
• Recognition of the present value of responsibilities with
retirement benefits; and
• Calculation of fair value of the financial instruments.
The estimates were determined based on the best information
available at the preparation date of the financial statements.
However, situations may occur in subsequent periods that,
not being foreseeable at the date, have no impact on the
estimates. Changes to the estimates that occur after the date
of the financial statements, will be corrected in profit/loss,
using a prospective method, in accordance with NCRF 4.
3.2. Other relevant accounting policies
a | Earnings per share
Basic earnings per share are calculated by dividing the net
profit attributable to the shareholders of the Company by the
weighted average number of ordinary shares in circulation
during the period, excluding the number of own shares held.
b | Foreign currency
All assets and liabilities expressed in foreign currency have been
converted into the functional presentation currency, using the
exchange rates in force at the reporting date. Exchange gains
and losses resulting from differences between the exchange
rates in force on the date of the transactions and those in
force on the date of collection, payments or the balance sheet
date are recognised as income and expenses in the income
statement for the period.
Exchange differences related to accounts receivable/payable
whose maturity is not defined, are registered in the income
statement for the period when those accounts receivable/
payable are depreciated/disposed/liquidated. Financial
statements of participated companies and branches expressed
in foreign currency are translated to euros.
REPORT AND CONSOLIDATED ACCOUNTS 2016NOTES TO THE CONSOLIDATED FINANCIAL STATEMENTS34
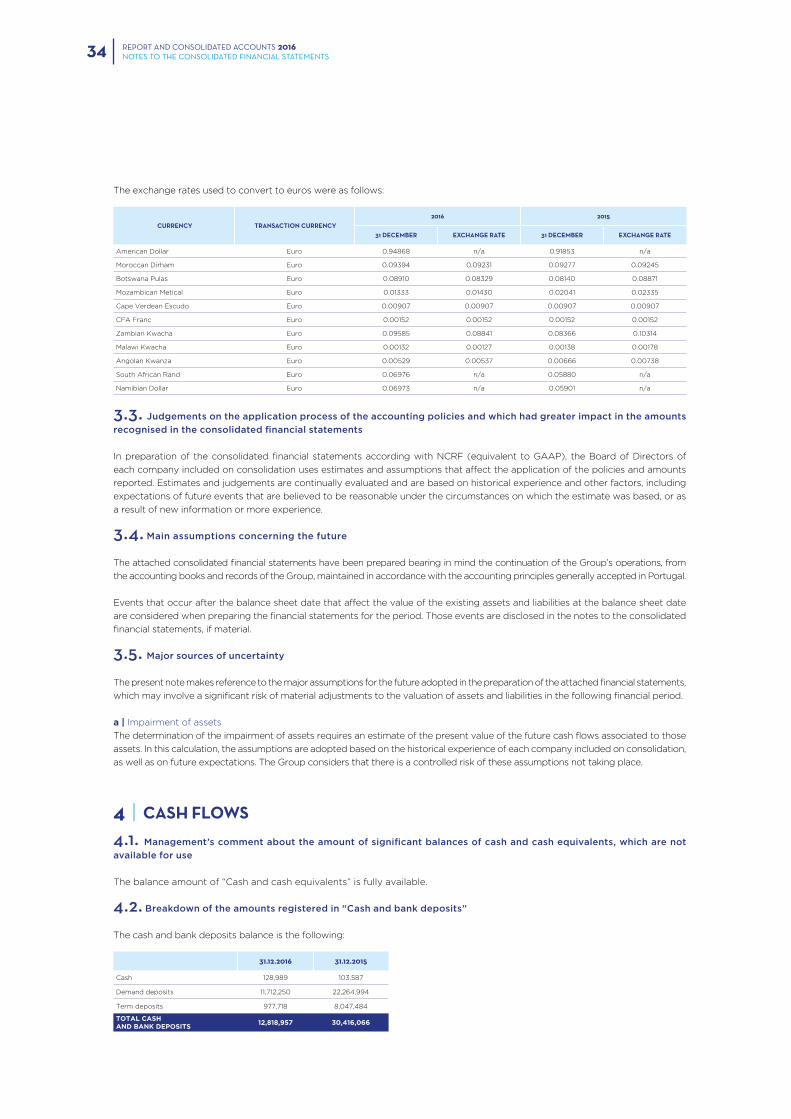
The exchange rates used to convert to euros were as follows:
CURRENCY TRANSACTION CURRENCY2016 2015
31 DECEMBER EXCHANGE RATE 31 DECEMBER EXCHANGE RATE
American Dollar Euro 0.94868 n/a 0.91853 n/a
Moroccan Dirham Euro 0.09394 0.09231 0.09277 0.09245
Botswana Pulas Euro 0.08910 0.08329 0.08140 0.08871
Mozambican Metical Euro 0.01333 0.01430 0.02041 0.02335
Cape Verdean Escudo Euro 0.00907 0.00907 0.00907 0.00907
CFA Franc Euro 0.00152 0.00152 0.00152 0.00152
Zambian Kwacha Euro 0.09585 0.08841 0.08366 0.10314
Malawi Kwacha Euro 0.00132 0.00127 0.00138 0.00178
Angolan Kwanza Euro 0.00529 0.00537 0.00666 0.00738
South African Rand Euro 0.06976 n/a 0.05880 n/a
Namibian Dollar Euro 0.06973 n/a 0.05901 n/a
3.3. Judgements on the application process of the accounting policies and which had greater impact in the amounts
recognised in the consolidated financial statements
In preparation of the consolidated financial statements according with NCRF (equivalent to GAAP), the Board of Directors of
each company included on consolidation uses estimates and assumptions that affect the application of the policies and amounts
reported. Estimates and judgements are continually evaluated and are based on historical experience and other factors, including
expectations of future events that are believed to be reasonable under the circumstances on which the estimate was based, or as
a result of new information or more experience.
3.4. Main assumptions concerning the future
The attached consolidated financial statements have been prepared bearing in mind the continuation of the Group’s operations, from
the accounting books and records of the Group, maintained in accordance with the accounting principles generally accepted in Portugal.
Events that occur after the balance sheet date that affect the value of the existing assets and liabilities at the balance sheet date
are considered when preparing the financial statements for the period. Those events are disclosed in the notes to the consolidated
financial statements, if material.
3.5. Major sources of uncertainty
The present note makes reference to the major assumptions for the future adopted in the preparation of the attached financial statements,
which may involve a significant risk of material adjustments to the valuation of assets and liabilities in the following financial period.
a | Impairment of assets
The determination of the impairment of assets requires an estimate of the present value of the future cash flows associated to those
assets. In this calculation, the assumptions are adopted based on the historical experience of each company included on consolidation,
as well as on future expectations. The Group considers that there is a controlled risk of these assumptions not taking place.
4 | CASH FLOWS
4.1. Management’s comment about the amount of significant balances of cash and cash equivalents, which are not
available for use
The balance amount of “Cash and cash equivalents” is fully available.
4.2. Breakdown of the amounts registered in “Cash and bank deposits”
The cash and bank deposits balance is the following:
31.12.2016 31.12.2015
Cash 128,989 103,587
Demand deposits 11,712,250 22,264,994
Term deposits 977,718 8,047,484
TOTAL CASHAND BANK DEPOSITS
12,818,957 30,416,066
REPORT AND CONSOLIDATED ACCOUNTS 2016NOTES TO THE CONSOLIDATED FINANCIAL STATEMENTS 35
5 | RELATED PARTIES
5.1. Remunerations of the key management personnel
a | Total remunerations: 1,302,507 euros (2015: 1,324,083 euros).
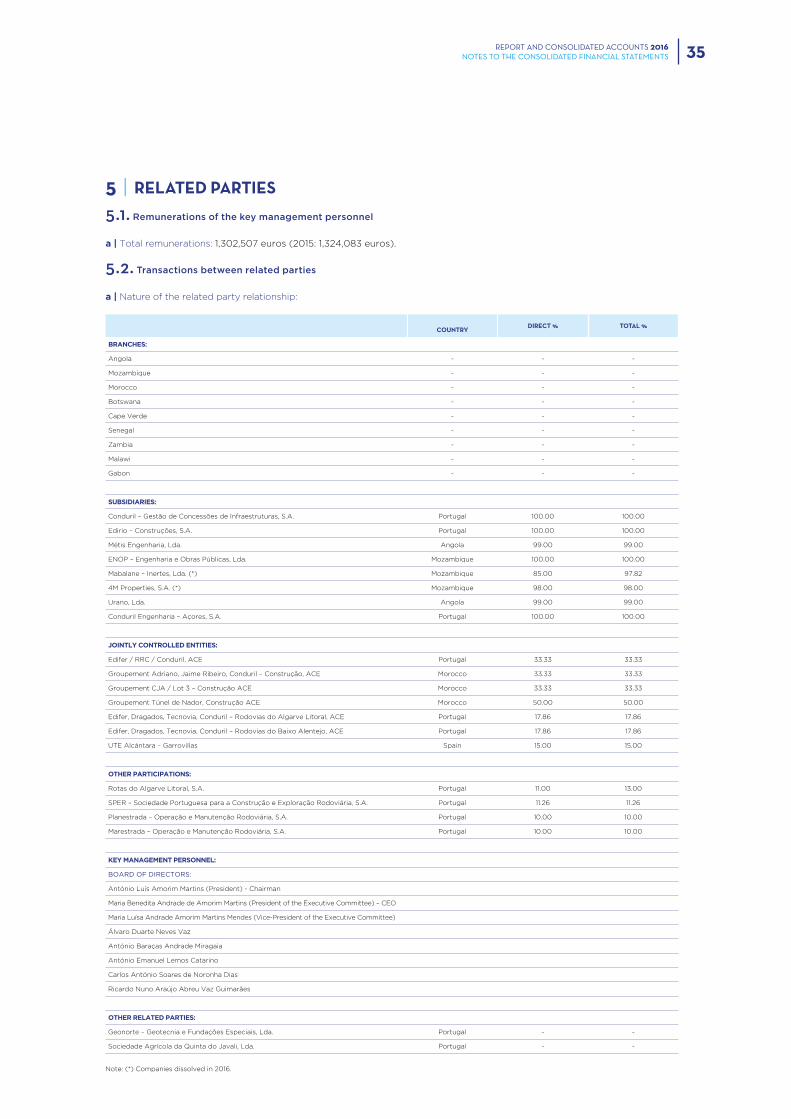
5.2. Transactions between related parties
a | Nature of the related party relationship:
COUNTRY DIRECT % TOTAL %
BRANCHES:
Angola - - -
Mozambique - - -
Morocco - - -
Botswana - - -
Cape Verde - - -
Senegal - - -
Zambia - - -
Malawi - - -
Gabon - - -
SUBSIDIARIES:
Conduril – Gestão de Concessões de Infraestruturas, S.A. Portugal 100.00 100.00
Edirio – Construções, S.A. Portugal 100.00 100.00
Métis Engenharia, Lda. Angola 99.00 99.00
ENOP – Engenharia e Obras Públicas, Lda. Mozambique 100.00 100.00
Mabalane – Inertes, Lda. (*) Mozambique 85.00 97.82
4M Properties, S.A. (*) Mozambique 98.00 98.00
Urano, Lda. Angola 99.00 99.00
Conduril Engenharia – Açores, S.A. Portugal 100.00 100.00
JOINTLY CONTROLLED ENTITIES:
Edifer / RRC / Conduril, ACE Portugal 33.33 33.33
Groupement Adriano, Jaime Ribeiro, Conduril – Construção, ACE Morocco 33.33 33.33
Groupement CJA / Lot 3 – Construção ACE Morocco 33.33 33.33
Groupement Túnel de Nador, Construção ACE Morocco 50.00 50.00
Edifer, Dragados, Tecnovia, Conduril – Rodovias do Algarve Litoral, ACE Portugal 17.86 17.86
Edifer, Dragados, Tecnovia, Conduril – Rodovias do Baixo Alentejo, ACE Portugal 17.86 17.86
UTE Alcántara – Garrovillas Spain 15.00 15.00
OTHER PARTICIPATIONS:
Rotas do Algarve Litoral, S.A. Portugal 11.00 13.00
SPER – Sociedade Portuguesa para a Construção e Exploração Rodoviária, S.A. Portugal 11.26 11.26
Planestrada – Operação e Manutenção Rodoviária, S.A. Portugal 10.00 10.00
Marestrada – Operação e Manutenção Rodoviária, S.A. Portugal 10.00 10.00
KEY MANAGEMENT PERSONNEL:
BOARD OF DIRECTORS:
António Luís Amorim Martins (President) - Chairman
Maria Benedita Andrade de Amorim Martins (President of the Executive Committee) – CEO
Maria Luísa Andrade Amorim Martins Mendes (Vice-President of the Executive Committee)
Álvaro Duarte Neves Vaz
António Baraças Andrade Miragaia
António Emanuel Lemos Catarino
Carlos António Soares de Noronha Dias
Ricardo Nuno Araújo Abreu Vaz Guimarães
OTHER RELATED PARTIES:
Geonorte – Geotecnia e Fundações Especiais, Lda. Portugal - -
Sociedade Agrícola da Quinta do Javali, Lda. Portugal - -
Note: (*) Companies dissolved in 2016.
REPORT AND CONSOLIDATED ACCOUNTS 2016NOTES TO THE CONSOLIDATED FINANCIAL STATEMENTS36
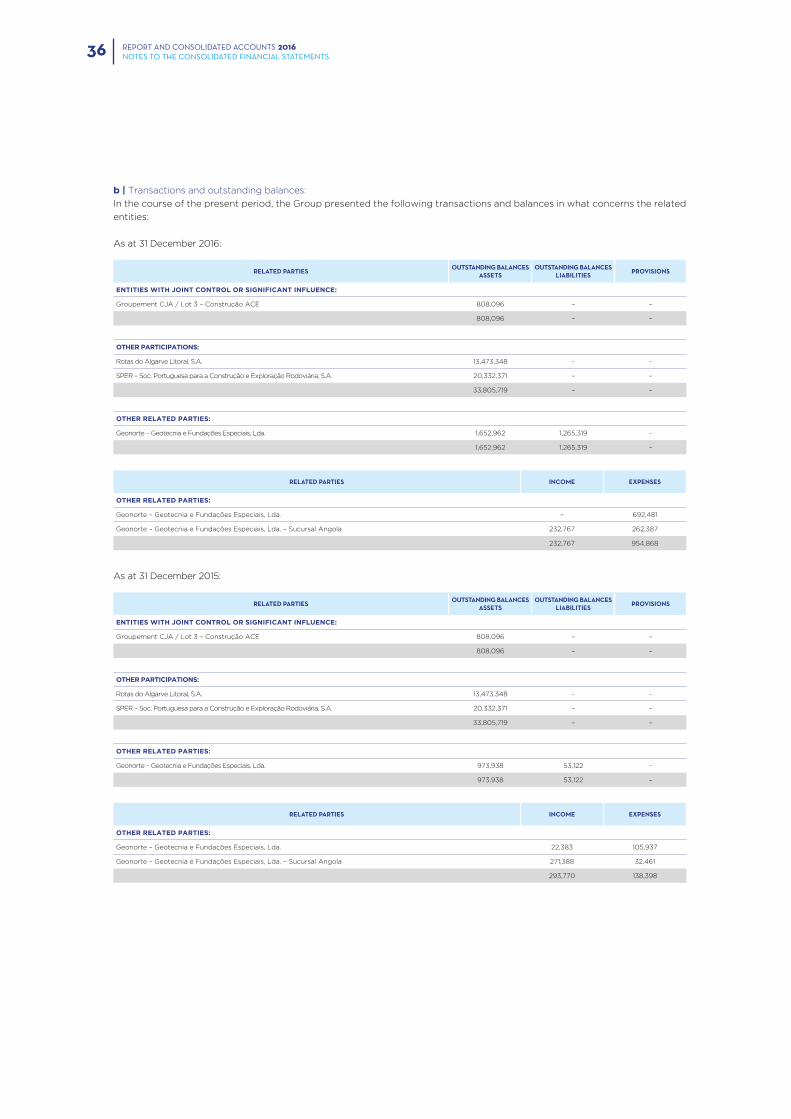
b | Transactions and outstanding balances:
In the course of the present period, the Group presented the following transactions and balances in what concerns the related
entities:
As at 31 December 2016:
RELATED PARTIES OUTSTANDING BALANCES ASSETS
OUTSTANDING BALANCES LIABILITIES PROVISIONS
ENTITIES WITH JOINT CONTROL OR SIGNIFICANT INFLUENCE:
Groupement CJA / Lot 3 – Construção ACE 808,096 – –
808,096 – –
OTHER PARTICIPATIONS:
Rotas do Algarve Litoral, S.A. 13,473,348 – –
SPER – Soc. Portuguesa para a Construção e Exploração Rodoviária, S.A. 20,332,371 – –
33,805,719 – –
OTHER RELATED PARTIES:
Geonorte – Geotecnia e Fundações Especiais, Lda. 1,652,962 1,265,319 –
1,652,962 1,265,319 –
RELATED PARTIES INCOME EXPENSES
OTHER RELATED PARTIES:
Geonorte – Geotecnia e Fundações Especiais, Lda. – 692,481
Geonorte – Geotecnia e Fundações Especiais, Lda. – Sucursal Angola 232,767 262,387
232,767 954,868
As at 31 December 2015:
RELATED PARTIES OUTSTANDING BALANCES ASSETS
OUTSTANDING BALANCES LIABILITIES PROVISIONS
ENTITIES WITH JOINT CONTROL OR SIGNIFICANT INFLUENCE:
Groupement CJA / Lot 3 – Construção ACE 808,096 – –
808,096 – –
OTHER PARTICIPATIONS:
Rotas do Algarve Litoral, S.A. 13,473,348 – –
SPER – Soc. Portuguesa para a Construção e Exploração Rodoviária, S.A. 20,332,371 – –
33,805,719 – –
OTHER RELATED PARTIES:
Geonorte – Geotecnia e Fundações Especiais, Lda. 973,938 53,122 –
973,938 53,122 –
RELATED PARTIES INCOME EXPENSES
OTHER RELATED PARTIES:
Geonorte – Geotecnia e Fundações Especiais, Lda. 22,383 105,937
Geonorte – Geotecnia e Fundações Especiais, Lda. – Sucursal Angola 271,388 32,461
293,770 138,398
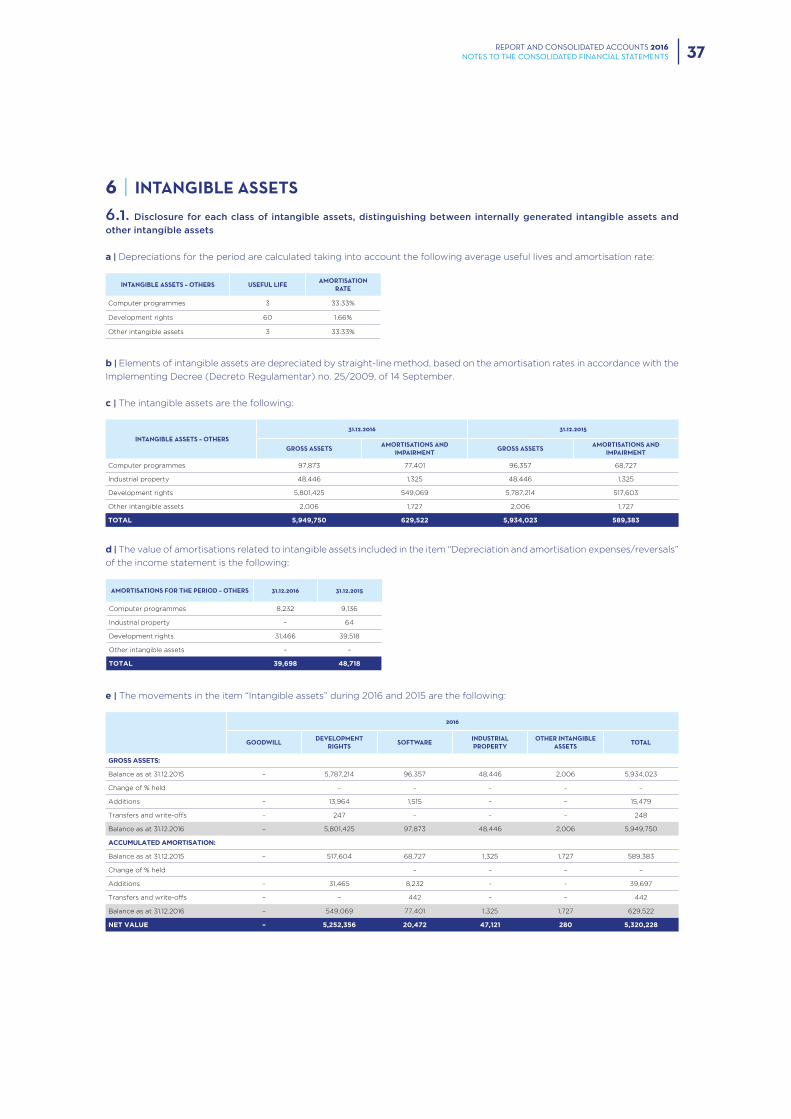
REPORT AND CONSOLIDATED ACCOUNTS 2016NOTES TO THE CONSOLIDATED FINANCIAL STATEMENTS 37
6 | INTANGIBLE ASSETS
6.1. Disclosure for each class of intangible assets, distinguishing between internally generated intangible assets and
other intangible assets
a | Depreciations for the period are calculated taking into account the following average useful lives and amortisation rate:
INTANGIBLE ASSETS – OTHERS USEFUL LIFE AMORTISATION RATE
Computer programmes 3 33.33%
Development rights 60 1.66%
Other intangible assets 3 33.33%
b | Elements of intangible assets are depreciated by straight-line method, based on the amortisation rates in accordance with the
Implementing Decree (Decreto Regulamentar) no. 25/2009, of 14 September.
c | The intangible assets are the following:
INTANGIBLE ASSETS – OTHERS
31.12.2016 31.12.2015
GROSS ASSETS AMORTISATIONS AND IMPAIRMENT GROSS ASSETS AMORTISATIONS AND
IMPAIRMENT
Computer programmes 97,873 77,401 96,357 68,727
Industrial property 48,446 1,325 48,446 1,325
Development rights 5,801,425 549,069 5,787,214 517,603
Other intangible assets 2,006 1,727 2,006 1,727
TOTAL 5,949,750 629,522 5,934,023 589,383
d | The value of amortisations related to intangible assets included in the item “Depreciation and amortisation expenses/reversals”
of the income statement is the following:
AMORTISATIONS FOR THE PERIOD – OTHERS 31.12.2016 31.12.2015
Computer programmes 8,232 9,136
Industrial property – 64
Development rights 31,466 39,518
Other intangible assets – –
TOTAL 39,698 48,718
e | The movements in the item “Intangible assets” during 2016 and 2015 are the following:
2016
GOODWILL DEVELOPMENT RIGHTS SOFTWARE INDUSTRIAL
PROPERTYOTHER INTANGIBLE
ASSETS TOTAL
GROSS ASSETS:
Balance as at 31.12.2015 – 5,787,214 96,357 48,446 2,006 5,934,023
Change of % held – – – – –
Additions – 13,964 1,515 – – 15,479
Transfers and write-offs – 247 – – – 248
Balance as at 31.12.2016 – 5,801,425 97,873 48,446 2,006 5,949,750
ACCUMULATED AMORTISATION:
Balance as at 31.12.2015 – 517,604 68,727 1,325 1,727 589,383
Change of % held – – – –
Additions – 31,465 8,232 – – 39,697
Transfers and write-offs – – 442 – – 442
Balance as at 31.12.2016 – 549,069 77,401 1,325 1,727 629,522
NET VALUE – 5,252,356 20,472 47,121 280 5,320,228
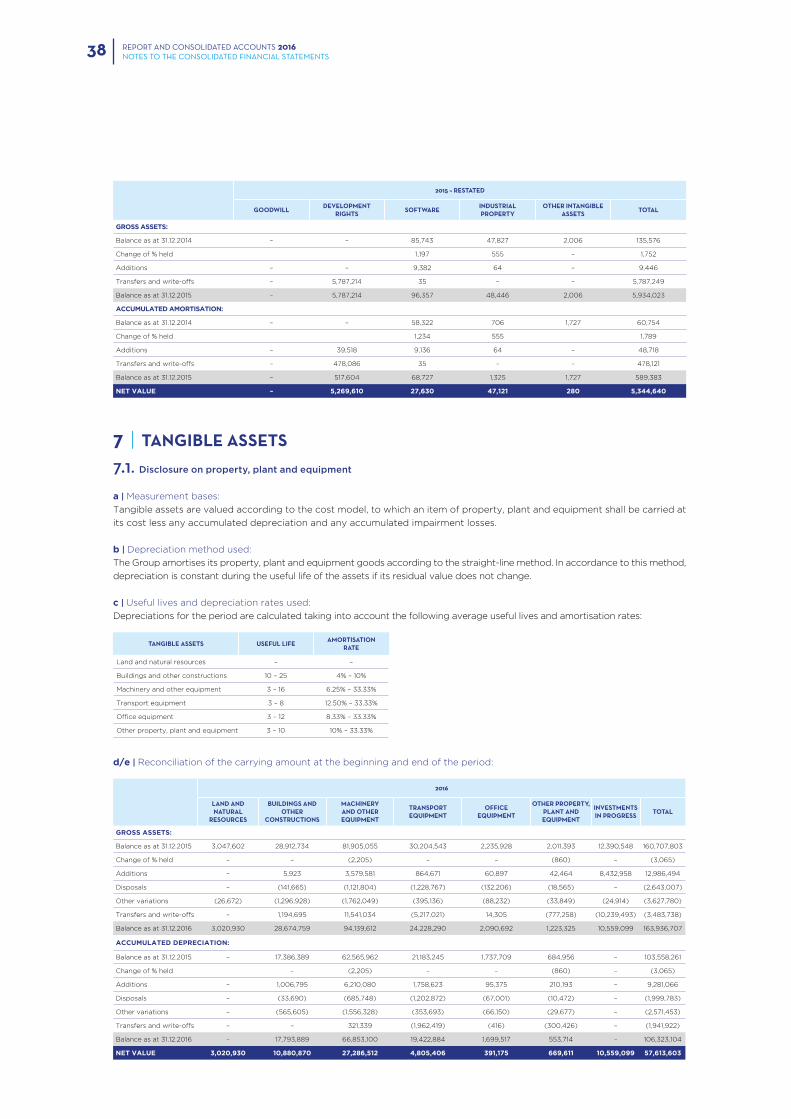
REPORT AND CONSOLIDATED ACCOUNTS 2016NOTES TO THE CONSOLIDATED FINANCIAL STATEMENTS38
2015 – RESTATED
GOODWILL DEVELOPMENT RIGHTS SOFTWARE INDUSTRIAL
PROPERTYOTHER INTANGIBLE
ASSETS TOTAL
GROSS ASSETS:
Balance as at 31.12.2014 – – 85,743 47,827 2,006 135,576
Change of % held 1,197 555 – 1,752
Additions – – 9,382 64 – 9,446
Transfers and write-offs – 5,787,214 35 – – 5,787,249
Balance as at 31.12.2015 – 5,787,214 96,357 48,446 2,006 5,934,023
ACCUMULATED AMORTISATION:
Balance as at 31.12.2014 – – 58,322 706 1,727 60,754
Change of % held 1,234 555 1,789
Additions – 39,518 9,136 64 – 48,718
Transfers and write-offs – 478,086 35 – – 478,121
Balance as at 31.12.2015 – 517,604 68,727 1,325 1,727 589,383
NET VALUE – 5,269,610 27,630 47,121 280 5,344,640
7 | TANGIBLE ASSETS
7.1. Disclosure on property, plant and equipment
a | Measurement bases:
Tangible assets are valued according to the cost model, to which an item of property, plant and equipment shall be carried at
its cost less any accumulated depreciation and any accumulated impairment losses.
b | Depreciation method used:
The Group amortises its property, plant and equipment goods according to the straight-line method. In accordance to this method,
depreciation is constant during the useful life of the assets if its residual value does not change.
c | Useful lives and depreciation rates used:
Depreciations for the period are calculated taking into account the following average useful lives and amortisation rates:
TANGIBLE ASSETS USEFUL LIFE AMORTISATION RATE
Land and natural resources – –
Buildings and other constructions 10 – 25 4% – 10%
Machinery and other equipment 3 – 16 6.25% – 33.33%
Transport equipment 3 – 8 12.50% – 33.33%
Office equipment 3 – 12 8.33% – 33.33%
Other property, plant and equipment 3 – 10 10% – 33.33%
d/e | Reconciliation of the carrying amount at the beginning and end of the period:
2016
LAND AND NATURAL
RESOURCES
BUILDINGS AND OTHER
CONSTRUCTIONS
MACHINERY AND OTHER EQUIPMENT
TRANSPORT EQUIPMENT
OFFICE EQUIPMENT
OTHER PROPERTY, PLANT AND EQUIPMENT
INVESTMENTS IN PROGRESS TOTAL
GROSS ASSETS:
Balance as at 31.12.2015 3,047,602 28,912,734 81,905,055 30,204,543 2,235,928 2,011,393 12,390,548 160,707,803
Change of % held – – (2,205) – – (860) – (3,065)
Additions – 5,923 3,579,581 864,671 60,897 42,464 8,432,958 12,986,494
Disposals – (141,665) (1,121,804) (1,228,767) (132,206) (18,565) – (2,643,007)
Other variations (26,672) (1,296,928) (1,762,049) (395,136) (88,232) (33,849) (24,914) (3,627,780)
Transfers and write-offs – 1,194,695 11,541,034 (5,217,021) 14,305 (777,258) (10,239,493) (3,483,738)
Balance as at 31.12.2016 3,020,930 28,674,759 94,139,612 24,228,290 2,090,692 1,223,325 10,559,099 163,936,707
ACCUMULATED DEPRECIATION:
Balance as at 31.12.2015 – 17,386,389 62,565,962 21,183,245 1,737,709 684,956 – 103,558,261
Change of % held – (2,205) – – (860) – (3,065)
Additions – 1,006,795 6,210,080 1,758,623 95,375 210,193 – 9,281,066
Disposals – (33,690) (685,748) (1,202,872) (67,001) (10,472) – (1,999,783)
Other variations – (565,605) (1,556,328) (353,693) (66,150) (29,677) – (2,571,453)
Transfers and write-offs – – 321,339 (1,962,419) (416) (300,426) – (1,941,922)
Balance as at 31.12.2016 – 17,793,889 66,853,100 19,422,884 1,699,517 553,714 – 106,323,104
NET VALUE 3,020,930 10,880,870 27,286,512 4,805,406 391,175 669,611 10,559,099 57,613,603
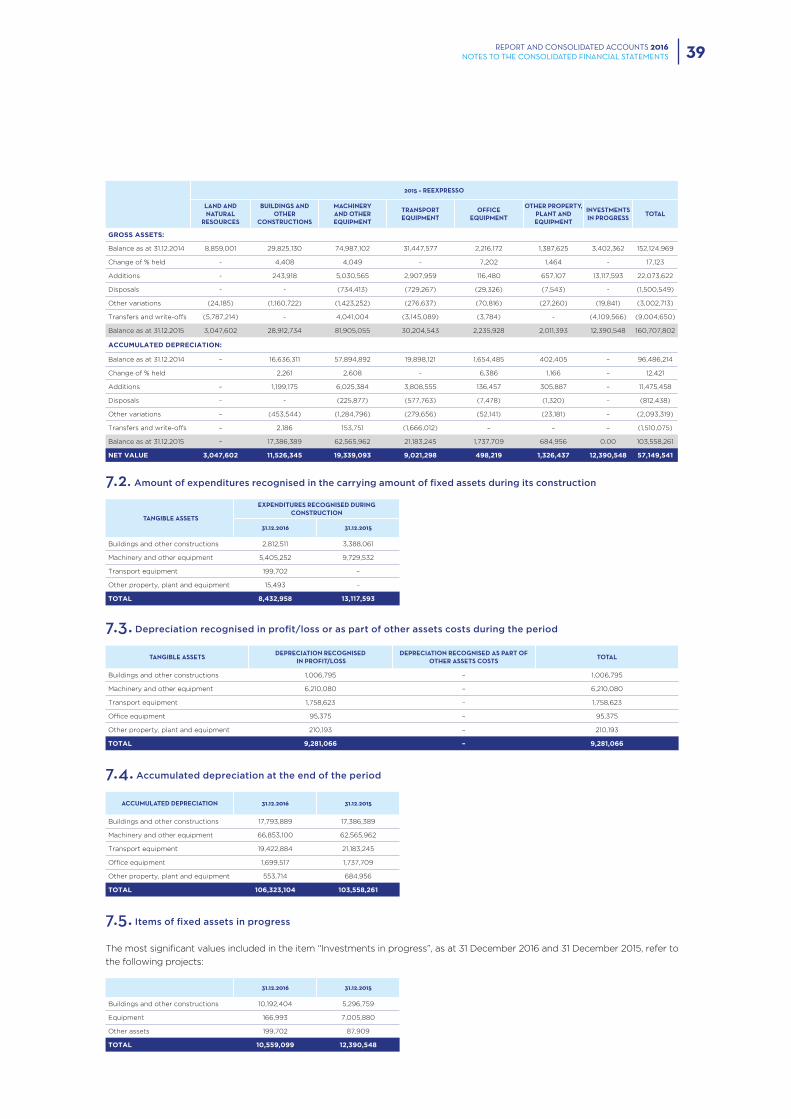
REPORT AND CONSOLIDATED ACCOUNTS 2016NOTES TO THE CONSOLIDATED FINANCIAL STATEMENTS 39
2015 – REEXPRESSO
LAND AND NATURAL
RESOURCES
BUILDINGS AND OTHER
CONSTRUCTIONS
MACHINERY AND OTHER EQUIPMENT
TRANSPORT EQUIPMENT
OFFICE EQUIPMENT
OTHER PROPERTY, PLANT AND EQUIPMENT
INVESTMENTS IN PROGRESS TOTAL
GROSS ASSETS:
Balance as at 31.12.2014 8,859,001 29,825,130 74,987,102 31,447,577 2,216,172 1,387,625 3,402,362 152,124,969
Change of % held - 4,408 4,049 - 7,202 1,464 - 17,123
Additions - 243,918 5,030,565 2,907,959 116,480 657,107 13,117,593 22,073,622
Disposals - - (734,413) (729,267) (29,326) (7,543) - (1,500,549)
Other variations (24,185) (1,160,722) (1,423,252) (276,637) (70,816) (27,260) (19,841) (3,002,713)
Transfers and write-offs (5,787,214) - 4,041,004 (3,145,089) (3,784) - (4,109,566) (9,004,650)
Balance as at 31.12.2015 3,047,602 28,912,734 81,905,055 30,204,543 2,235,928 2,011,393 12,390,548 160,707,802
ACCUMULATED DEPRECIATION:
Balance as at 31.12.2014 – 16,636,311 57,894,892 19,898,121 1,654,485 402,405 – 96,486,214
Change of % held 2,261 2,608 - 6,386 1,166 – 12,421
Additions – 1,199,175 6,025,384 3,808,555 136,457 305,887 – 11,475,458
Disposals – - (225,877) (577,763) (7,478) (1,320) – (812,438)
Other variations – (453,544) (1,284,796) (279,656) (52,141) (23,181) – (2,093,319)
Transfers and write-offs – 2,186 153,751 (1,666,012) – – – (1,510,075)
Balance as at 31.12.2015 – 17,386,389 62,565,962 21,183,245 1,737,709 684,956 0.00 103,558,261
NET VALUE 3,047,602 11,526,345 19,339,093 9,021,298 498,219 1,326,437 12,390,548 57,149,541
7.2. Amount of expenditures recognised in the carrying amount of fixed assets during its construction
TANGIBLE ASSETS
EXPENDITURES RECOGNISED DURING CONSTRUCTION
31.12.2016 31.12.2015
Buildings and other constructions 2,812,511 3,388,061
Machinery and other equipment 5,405,252 9,729,532
Transport equipment 199,702 –
Other property, plant and equipment 15,493 –
TOTAL 8,432,958 13,117,593
7.3. Depreciation recognised in profit/loss or as part of other assets costs during the period
TANGIBLE ASSETS DEPRECIATION RECOGNISED IN PROFIT/LOSS
DEPRECIATION RECOGNISED AS PART OF OTHER ASSETS COSTS TOTAL
Buildings and other constructions 1,006,795 – 1,006,795
Machinery and other equipment 6,210,080 – 6,210,080
Transport equipment 1,758,623 – 1,758,623
Office equipment 95,375 – 95,375
Other property, plant and equipment 210,193 – 210,193
TOTAL 9,281,066 – 9,281,066
7.4. Accumulated depreciation at the end of the period
ACCUMULATED DEPRECIATION 31.12.2016 31.12.2015
Buildings and other constructions 17,793,889 17,386,389
Machinery and other equipment 66,853,100 62,565,962
Transport equipment 19,422,884 21,183,245
Office equipment 1,699,517 1,737,709
Other property, plant and equipment 553,714 684,956
TOTAL 106,323,104 103,558,261
7.5. Items of fixed assets in progress
The most significant values included in the item “Investments in progress”, as at 31 December 2016 and 31 December 2015, refer to
the following projects:
31.12.2016 31.12.2015
Buildings and other constructions 10,192,404 5,296,759
Equipment 166,993 7,005,880
Other assets 199,702 87,909
TOTAL 10,559,099 12,390,548
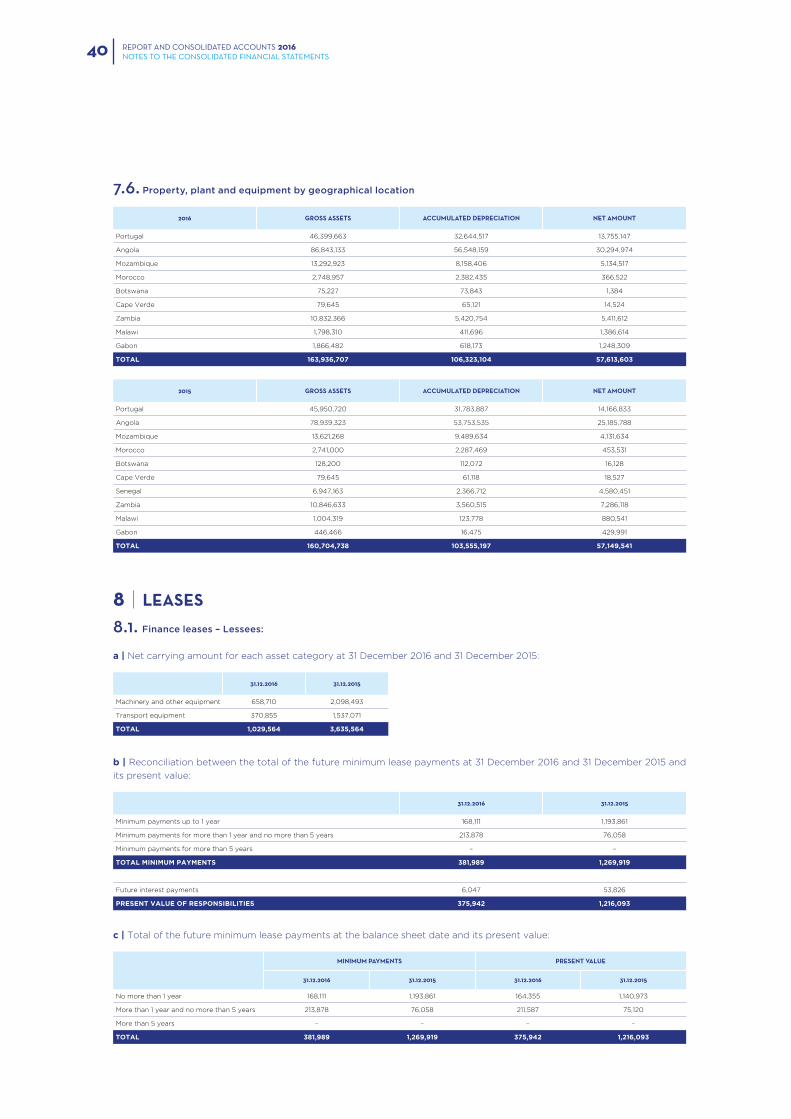
REPORT AND CONSOLIDATED ACCOUNTS 2016NOTES TO THE CONSOLIDATED FINANCIAL STATEMENTS40
7.6. Property, plant and equipment by geographical location
2016 GROSS ASSETS ACCUMULATED DEPRECIATION NET AMOUNT
Portugal 46,399,663 32,644,517 13,755,147
Angola 86,843,133 56,548,159 30,294,974
Mozambique 13,292,923 8,158,406 5,134,517
Morocco 2,748,957 2,382,435 366,522
Botswana 75,227 73,843 1,384
Cape Verde 79,645 65,121 14,524
Zambia 10,832,366 5,420,754 5,411,612
Malawi 1,798,310 411,696 1,386,614
Gabon 1,866,482 618,173 1,248,309
TOTAL 163,936,707 106,323,104 57,613,603
2015 GROSS ASSETS ACCUMULATED DEPRECIATION NET AMOUNT
Portugal 45,950,720 31,783,887 14,166,833
Angola 78,939,323 53,753,535 25,185,788
Mozambique 13,621,268 9,489,634 4,131,634
Morocco 2,741,000 2,287,469 453,531
Botswana 128,200 112,072 16,128
Cape Verde 79,645 61,118 18,527
Senegal 6,947,163 2,366,712 4,580,451
Zambia 10,846,633 3,560,515 7,286,118
Malawi 1,004,319 123,778 880,541
Gabon 446,466 16,475 429,991
TOTAL 160,704,738 103,555,197 57,149,541
8 | LEASES
8.1. Finance leases – Lessees:
a | Net carrying amount for each asset category at 31 December 2016 and 31 December 2015:
31.12.2016 31.12.2015
Machinery and other equipment 658,710 2,098,493
Transport equipment 370,855 1,537,071
TOTAL 1,029,564 3,635,564
b | Reconciliation between the total of the future minimum lease payments at 31 December 2016 and 31 December 2015 and
its present value:
31.12.2016 31.12.2015
Minimum payments up to 1 year 168,111 1,193,861
Minimum payments for more than 1 year and no more than 5 years 213,878 76,058
Minimum payments for more than 5 years – –
TOTAL MINIMUM PAYMENTS 381,989 1,269,919
Future interest payments 6,047 53,826
PRESENT VALUE OF RESPONSIBILITIES 375,942 1,216,093
c | Total of the future minimum lease payments at the balance sheet date and its present value:
MINIMUM PAYMENTS PRESENT VALUE
31.12.2016 31.12.2015 31.12.2016 31.12.2015
No more than 1 year 168,111 1,193,861 164,355 1,140,973
More than 1 year and no more than 5 years 213,878 76,058 211,587 75,120
More than 5 years – – – –
TOTAL 381,989 1,269,919 375,942 1,216,093
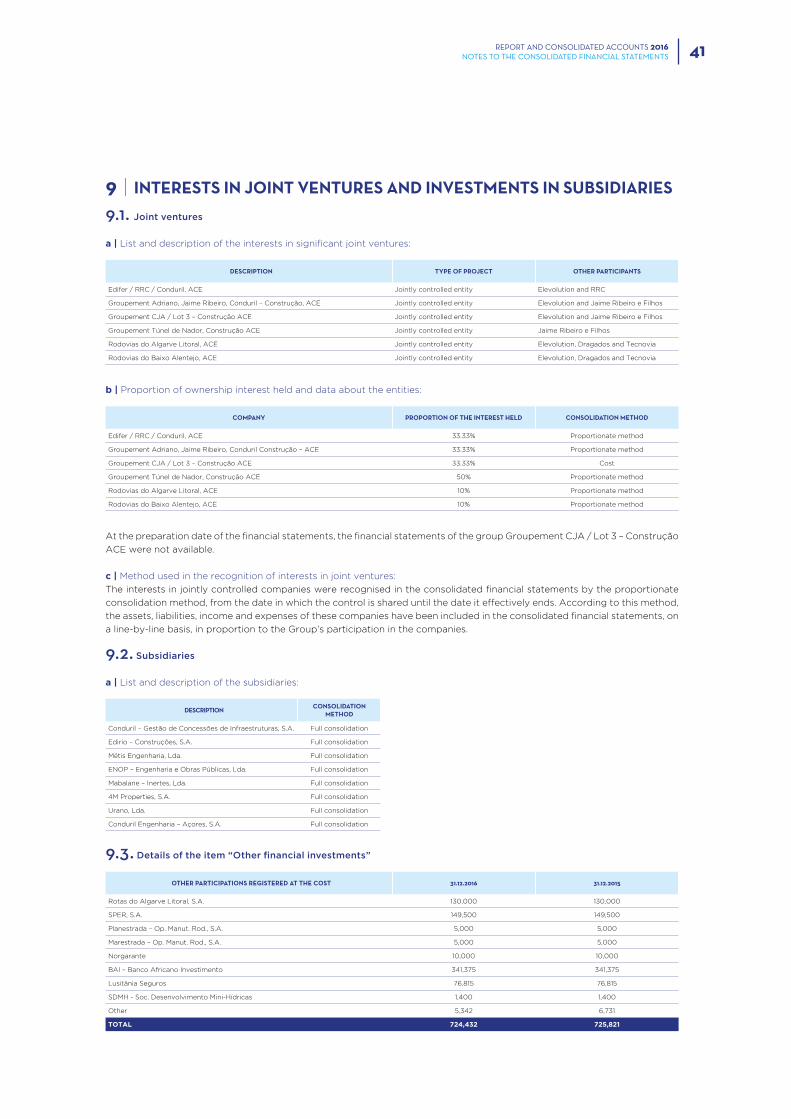
REPORT AND CONSOLIDATED ACCOUNTS 2016NOTES TO THE CONSOLIDATED FINANCIAL STATEMENTS 41
9 | INTERESTS IN JOINT VENTURES AND INVESTMENTS IN SUBSIDIARIES
9.1. Joint ventures
a | List and description of the interests in significant joint ventures:
DESCRIPTION TYPE OF PROJECT OTHER PARTICIPANTS
Edifer / RRC / Conduril, ACE Jointly controlled entity Elevolution and RRC
Groupement Adriano, Jaime Ribeiro, Conduril – Construção, ACE Jointly controlled entity Elevolution and Jaime Ribeiro e Filhos
Groupement CJA / Lot 3 – Construção ACE Jointly controlled entity Elevolution and Jaime Ribeiro e Filhos
Groupement Túnel de Nador, Construção ACE Jointly controlled entity Jaime Ribeiro e Filhos
Rodovias do Algarve Litoral, ACE Jointly controlled entity Elevolution, Dragados and Tecnovia
Rodovias do Baixo Alentejo, ACE Jointly controlled entity Elevolution, Dragados and Tecnovia
b | Proportion of ownership interest held and data about the entities:
COMPANY PROPORTION OF THE INTEREST HELD CONSOLIDATION METHOD
Edifer / RRC / Conduril, ACE 33.33% Proportionate method
Groupement Adriano, Jaime Ribeiro, Conduril Construção – ACE 33.33% Proportionate method
Groupement CJA / Lot 3 – Construção ACE 33.33% Cost
Groupement Túnel de Nador, Construção ACE 50% Proportionate method
Rodovias do Algarve Litoral, ACE 10% Proportionate method
Rodovias do Baixo Alentejo, ACE 10% Proportionate method
At the preparation date of the financial statements, the financial statements of the group Groupement CJA / Lot 3 – Construção
ACE were not available.
c | Method used in the recognition of interests in joint ventures:
The interests in jointly controlled companies were recognised in the consolidated financial statements by the proportionate
consolidation method, from the date in which the control is shared until the date it effectively ends. According to this method,
the assets, liabilities, income and expenses of these companies have been included in the consolidated financial statements, on
a line-by-line basis, in proportion to the Group’s participation in the companies.
9.2. Subsidiaries
a | List and description of the subsidiaries:
DESCRIPTION CONSOLIDATION METHOD
Conduril – Gestão de Concessões de Infraestruturas, S.A. Full consolidation
Edirio – Construções, S.A. Full consolidation
Métis Engenharia, Lda. Full consolidation
ENOP – Engenharia e Obras Públicas, Lda. Full consolidation
Mabalane – Inertes, Lda. Full consolidation
4M Properties, S.A. Full consolidation
Urano, Lda. Full consolidation
Conduril Engenharia – Açores, S.A. Full consolidation
9.3. Details of the item “Other financial investments”
OTHER PARTICIPATIONS REGISTERED AT THE COST 31.12.2016 31.12.2015
Rotas do Algarve Litoral, S.A. 130,000 130,000
SPER, S.A. 149,500 149,500
Planestrada – Op. Manut. Rod., S.A. 5,000 5,000
Marestrada – Op. Manut. Rod., S.A. 5,000 5,000
Norgarante 10,000 10,000
BAI – Banco Africano Investimento 341,375 341,375
Lusitânia Seguros 76,815 76,815
SDMH - Soc. Desenvolvimento Mini-Hídricas 1,400 1,400
Other 5,342 6,731
TOTAL 724,432 725,821
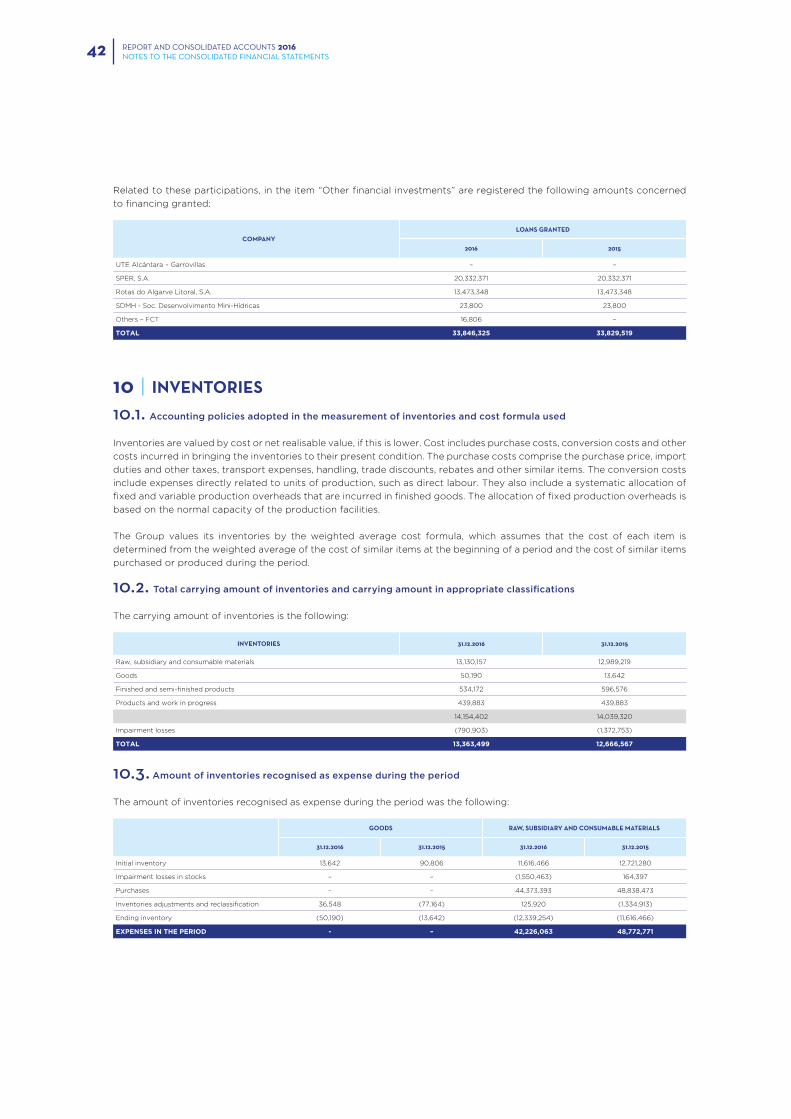
REPORT AND CONSOLIDATED ACCOUNTS 2016NOTES TO THE CONSOLIDATED FINANCIAL STATEMENTS42
Related to these participations, in the item “Other financial investments” are registered the following amounts concerned
to financing granted:
COMPANYLOANS GRANTED
2016 2015
UTE Alcántara – Garrovillas – –
SPER, S.A. 20,332,371 20,332,371
Rotas do Algarve Litoral, S.A. 13,473,348 13,473,348
SDMH - Soc. Desenvolvimento Mini-Hídricas 23,800 23,800
Others – FCT 16,806 –
TOTAL 33,846,325 33,829,519
10 | INVENTORIES
10.1. Accounting policies adopted in the measurement of inventories and cost formula used
Inventories are valued by cost or net realisable value, if this is lower. Cost includes purchase costs, conversion costs and other
costs incurred in bringing the inventories to their present condition. The purchase costs comprise the purchase price, import
duties and other taxes, transport expenses, handling, trade discounts, rebates and other similar items. The conversion costs
include expenses directly related to units of production, such as direct labour. They also include a systematic allocation of
fixed and variable production overheads that are incurred in finished goods. The allocation of fixed production overheads is
based on the normal capacity of the production facilities.
The Group values its inventories by the weighted average cost formula, which assumes that the cost of each item is
determined from the weighted average of the cost of similar items at the beginning of a period and the cost of similar items
purchased or produced during the period.
10.2. Total carrying amount of inventories and carrying amount in appropriate classifications
The carrying amount of inventories is the following:
INVENTORIES 31.12.2016 31.12.2015
Raw, subsidiary and consumable materials 13,130,157 12,989,219
Goods 50,190 13,642
Finished and semi-finished products 534,172 596,576
Products and work in progress 439,883 439,883
14,154,402 14,039,320
Impairment losses (790,903) (1,372,753)
TOTAL 13,363,499 12,666,567
10.3. Amount of inventories recognised as expense during the period
The amount of inventories recognised as expense during the period was the following:
GOODS RAW, SUBSIDIARY AND CONSUMABLE MATERIALS
31.12.2016 31.12.2015 31.12.2016 31.12.2015
Initial inventory 13,642 90,806 11,616,466 12,721,280
Impairment losses in stocks – – (1,550,463) 164,397
Purchases – – 44,373,393 48,838,473
Inventories adjustments and reclassification 36,548 (77,164) 125,920 (1,334,913)
Ending inventory (50,190) (13,642) (12,339,254) (11,616,466)
EXPENSES IN THE PERIOD - – 42,226,063 48,772,771
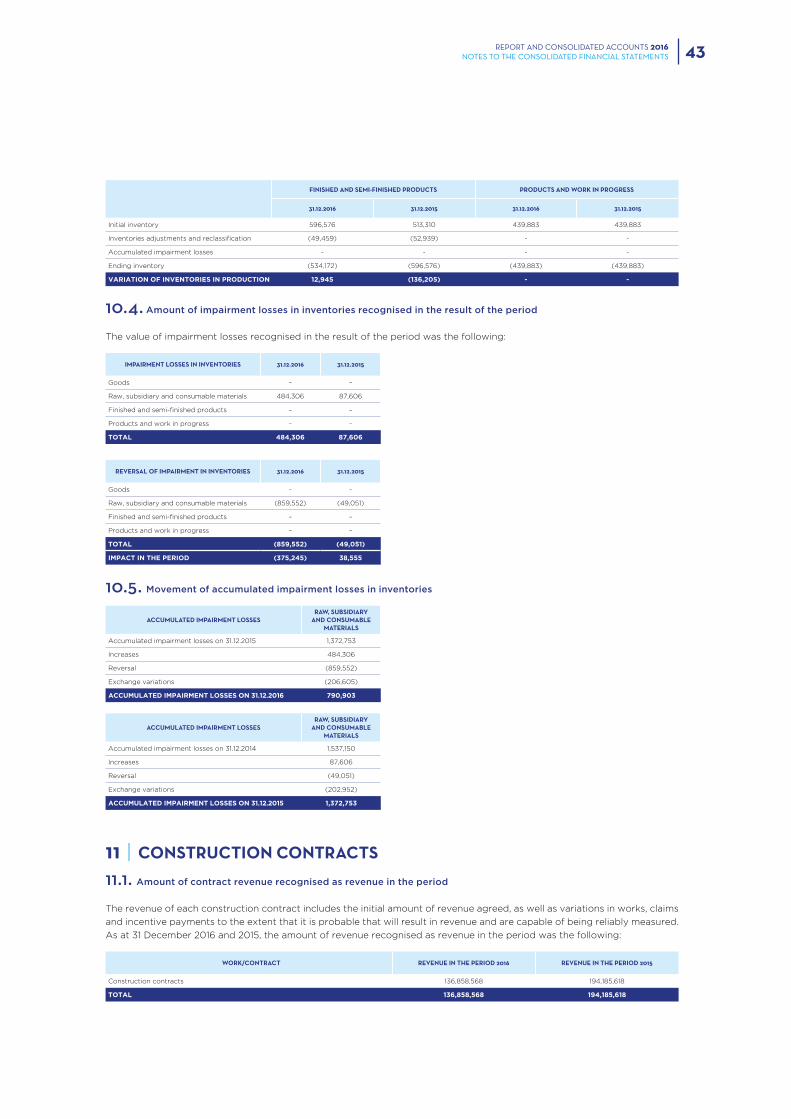
REPORT AND CONSOLIDATED ACCOUNTS 2016NOTES TO THE CONSOLIDATED FINANCIAL STATEMENTS 43
FINISHED AND SEMI-FINISHED PRODUCTS PRODUCTS AND WORK IN PROGRESS
31.12.2016 31.12.2015 31.12.2016 31.12.2015
Initial inventory 596,576 513,310 439,883 439,883
Inventories adjustments and reclassification (49,459) (52,939) - -
Accumulated impairment losses - - - -
Ending inventory (534,172) (596,576) (439,883) (439,883)
VARIATION OF INVENTORIES IN PRODUCTION 12,945 (136,205) - -
10.4. Amount of impairment losses in inventories recognised in the result of the period
The value of impairment losses recognised in the result of the period was the following:
IMPAIRMENT LOSSES IN INVENTORIES 31.12.2016 31.12.2015
Goods – –
Raw, subsidiary and consumable materials 484,306 87,606
Finished and semi-finished products – –
Products and work in progress – –
TOTAL 484,306 87,606
REVERSAL OF IMPAIRMENT IN INVENTORIES 31.12.2016 31.12.2015
Goods – –
Raw, subsidiary and consumable materials (859,552) (49,051)
Finished and semi-finished products – –
Products and work in progress – –
TOTAL (859,552) (49,051)
IMPACT IN THE PERIOD (375,245) 38,555
10.5. Movement of accumulated impairment losses in inventories
ACCUMULATED IMPAIRMENT LOSSESRAW, SUBSIDIARY
AND CONSUMABLE MATERIALS
Accumulated impairment losses on 31.12.2015 1,372,753
Increases 484,306
Reversal (859,552)
Exchange variations (206,605)
ACCUMULATED IMPAIRMENT LOSSES ON 31.12.2016 790,903
ACCUMULATED IMPAIRMENT LOSSESRAW, SUBSIDIARY
AND CONSUMABLE MATERIALS
Accumulated impairment losses on 31.12.2014 1,537,150
Increases 87,606
Reversal (49,051)
Exchange variations (202,952)
ACCUMULATED IMPAIRMENT LOSSES ON 31.12.2015 1,372,753
11 | CONSTRUCTION CONTRACTS
11.1. Amount of contract revenue recognised as revenue in the period
The revenue of each construction contract includes the initial amount of revenue agreed, as well as variations in works, claims
and incentive payments to the extent that it is probable that will result in revenue and are capable of being reliably measured.
As at 31 December 2016 and 2015, the amount of revenue recognised as revenue in the period was the following:
WORK/CONTRACT REVENUE IN THE PERIOD 2016 REVENUE IN THE PERIOD 2015
Construction contracts 136,858,568 194,185,618
TOTAL 136,858,568 194,185,618
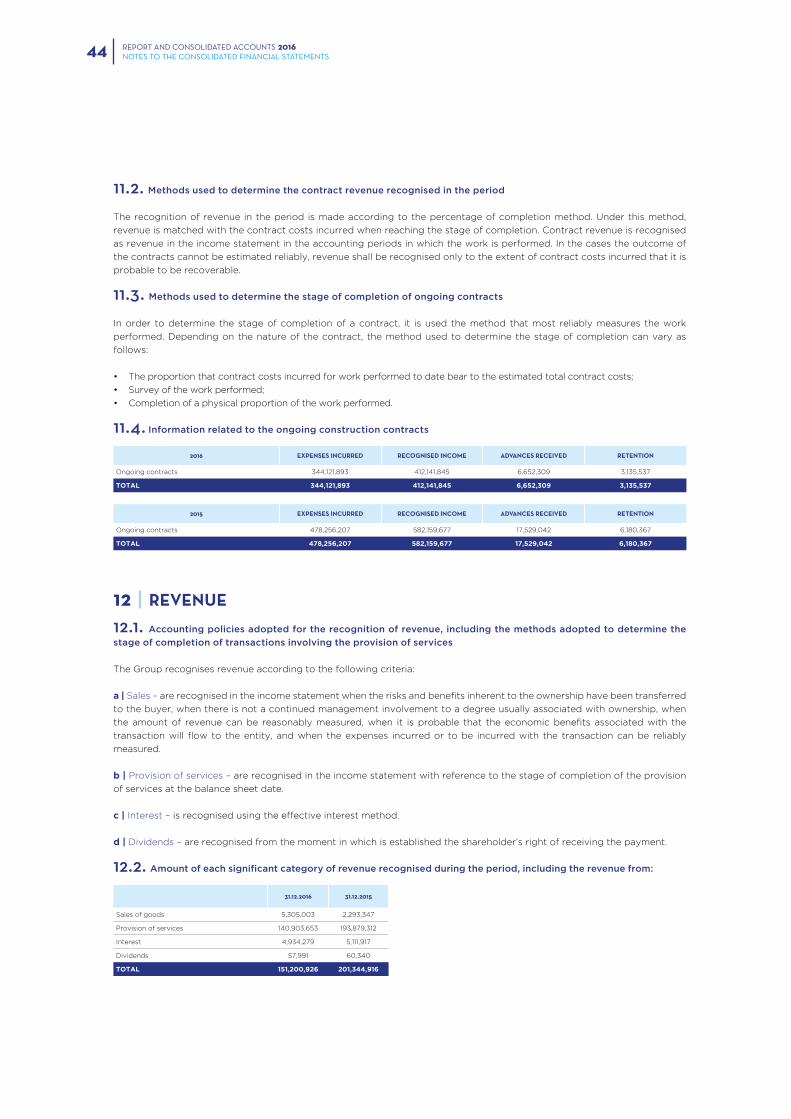
REPORT AND CONSOLIDATED ACCOUNTS 2016NOTES TO THE CONSOLIDATED FINANCIAL STATEMENTS44
11.2. Methods used to determine the contract revenue recognised in the period
The recognition of revenue in the period is made according to the percentage of completion method. Under this method,
revenue is matched with the contract costs incurred when reaching the stage of completion. Contract revenue is recognised
as revenue in the income statement in the accounting periods in which the work is performed. In the cases the outcome of
the contracts cannot be estimated reliably, revenue shall be recognised only to the extent of contract costs incurred that it is
probable to be recoverable.
11.3. Methods used to determine the stage of completion of ongoing contracts
In order to determine the stage of completion of a contract, it is used the method that most reliably measures the work
performed. Depending on the nature of the contract, the method used to determine the stage of completion can vary as
follows:
• The proportion that contract costs incurred for work performed to date bear to the estimated total contract costs;
• Survey of the work performed;
• Completion of a physical proportion of the work performed.
11.4. Information related to the ongoing construction contracts
2016 EXPENSES INCURRED RECOGNISED INCOME ADVANCES RECEIVED RETENTION
Ongoing contracts 344,121,893 412,141,845 6,652,309 3,135,537
TOTAL 344,121,893 412,141,845 6,652,309 3,135,537
2015 EXPENSES INCURRED RECOGNISED INCOME ADVANCES RECEIVED RETENTION
Ongoing contracts 478,256,207 582,159,677 17,529,042 6,180,367
TOTAL 478,256,207 582,159,677 17,529,042 6,180,367
12 | REVENUE
12.1. Accounting policies adopted for the recognition of revenue, including the methods adopted to determine the
stage of completion of transactions involving the provision of services
The Group recognises revenue according to the following criteria:
a | Sales – are recognised in the income statement when the risks and benefits inherent to the ownership have been transferred
to the buyer, when there is not a continued management involvement to a degree usually associated with ownership, when
the amount of revenue can be reasonably measured, when it is probable that the economic benefits associated with the
transaction will flow to the entity, and when the expenses incurred or to be incurred with the transaction can be reliably
measured.
b | Provision of services – are recognised in the income statement with reference to the stage of completion of the provision
of services at the balance sheet date.
c | Interest – is recognised using the effective interest method.
d | Dividends – are recognised from the moment in which is established the shareholder’s right of receiving the payment.
12.2. Amount of each significant category of revenue recognised during the period, including the revenue from:
31.12.2016 31.12.2015
Sales of goods 5,305,003 2,293,347
Provision of services 140,903,653 193,879,312
Interest 4,934,279 5,111,917
Dividends 57,991 60,340
TOTAL 151,200,926 201,344,916
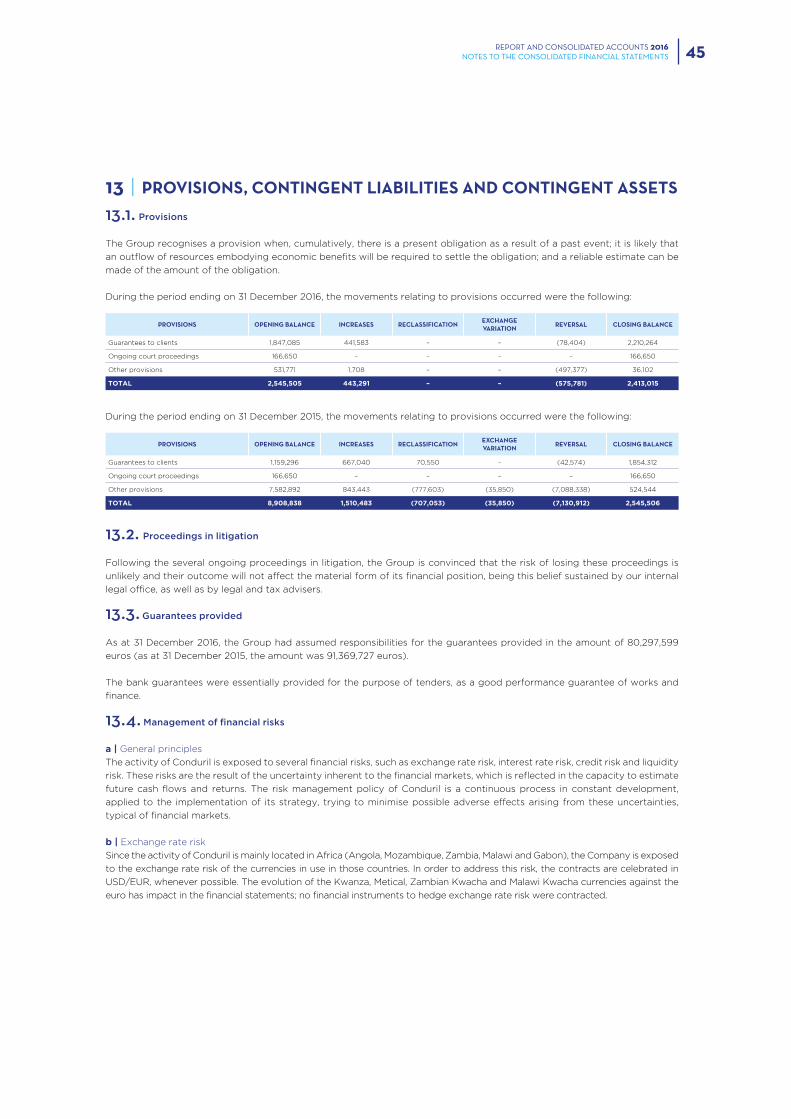
REPORT AND CONSOLIDATED ACCOUNTS 2016NOTES TO THE CONSOLIDATED FINANCIAL STATEMENTS 45
13 | PROVISIONS, CONTINGENT LIABILITIES AND CONTINGENT ASSETS
13.1. Provisions
The Group recognises a provision when, cumulatively, there is a present obligation as a result of a past event; it is likely that
an outflow of resources embodying economic benefits will be required to settle the obligation; and a reliable estimate can be
made of the amount of the obligation.
During the period ending on 31 December 2016, the movements relating to provisions occurred were the following:
PROVISIONS OPENING BALANCE INCREASES RECLASSIFICATION EXCHANGE VARIATION REVERSAL CLOSING BALANCE
Guarantees to clients 1,847,085 441,583 – – (78,404) 2,210,264
Ongoing court proceedings 166,650 – – – – 166,650
Other provisions 531,771 1,708 – – (497,377) 36,102
TOTAL 2,545,505 443,291 – – (575,781) 2,413,015
During the period ending on 31 December 2015, the movements relating to provisions occurred were the following:
PROVISIONS OPENING BALANCE INCREASES RECLASSIFICATION EXCHANGE VARIATION REVERSAL CLOSING BALANCE
Guarantees to clients 1,159,296 667,040 70,550 – (42,574) 1,854,312
Ongoing court proceedings 166,650 – – – – 166,650
Other provisions 7,582,892 843,443 (777,603) (35,850) (7,088,338) 524,544
TOTAL 8,908,838 1,510,483 (707,053) (35,850) (7,130,912) 2,545,506
13.2. Proceedings in litigation
Following the several ongoing proceedings in litigation, the Group is convinced that the risk of losing these proceedings is
unlikely and their outcome will not affect the material form of its financial position, being this belief sustained by our internal
legal office, as well as by legal and tax advisers.
13.3. Guarantees provided
As at 31 December 2016, the Group had assumed responsibilities for the guarantees provided in the amount of 80,297,599
euros (as at 31 December 2015, the amount was 91,369,727 euros).
The bank guarantees were essentially provided for the purpose of tenders, as a good performance guarantee of works and
finance.
13.4. Management of financial risks
a | General principles
The activity of Conduril is exposed to several financial risks, such as exchange rate risk, interest rate risk, credit risk and liquidity
risk. These risks are the result of the uncertainty inherent to the financial markets, which is reflected in the capacity to estimate
future cash flows and returns. The risk management policy of Conduril is a continuous process in constant development,
applied to the implementation of its strategy, trying to minimise possible adverse effects arising from these uncertainties,
typical of financial markets.
b | Exchange rate risk
Since the activity of Conduril is mainly located in Africa (Angola, Mozambique, Zambia, Malawi and Gabon), the Company is exposed
to the exchange rate risk of the currencies in use in those countries. In order to address this risk, the contracts are celebrated in
USD/EUR, whenever possible. The evolution of the Kwanza, Metical, Zambian Kwacha and Malawi Kwacha currencies against the
euro has impact in the financial statements; no financial instruments to hedge exchange rate risk were contracted.
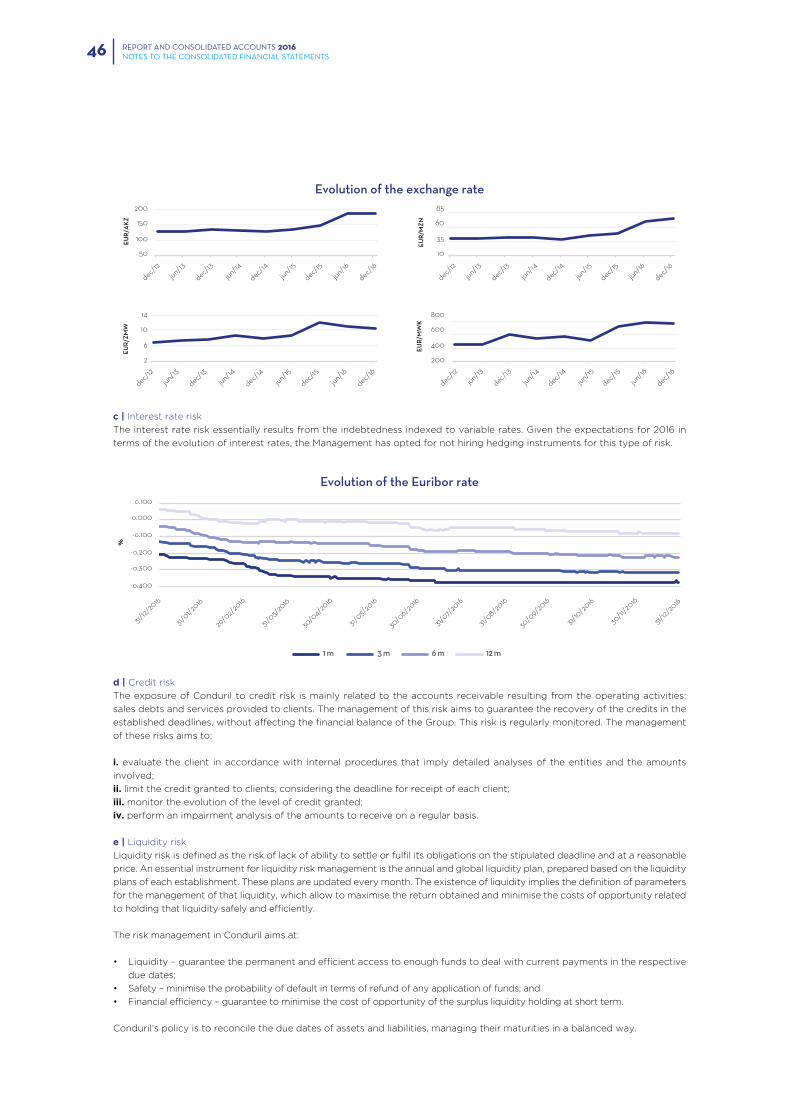
REPORT AND CONSOLIDATED ACCOUNTS 2016NOTES TO THE CONSOLIDATED FINANCIAL STATEMENTS46
c | Interest rate risk
The interest rate risk essentially results from the indebtedness indexed to variable rates. Given the expectations for 2016 in
terms of the evolution of interest rates, the Management has opted for not hiring hedging instruments for this type of risk.
Evolution of the exchange rate
Evolution of the Euribor rate
d | Credit risk
The exposure of Conduril to credit risk is mainly related to the accounts receivable resulting from the operating activities:
sales debts and services provided to clients. The management of this risk aims to guarantee the recovery of the credits in the
established deadlines, without affecting the financial balance of the Group. This risk is regularly monitored. The management
of these risks aims to:
i. evaluate the client in accordance with internal procedures that imply detailed analyses of the entities and the amounts
involved;
ii. limit the credit granted to clients, considering the deadline for receipt of each client;
iii. monitor the evolution of the level of credit granted;
iv. perform an impairment analysis of the amounts to receive on a regular basis.
e | Liquidity risk
Liquidity risk is defined as the risk of lack of ability to settle or fulfil its obligations on the stipulated deadline and at a reasonable
price. An essential instrument for liquidity risk management is the annual and global liquidity plan, prepared based on the liquidity
plans of each establishment. These plans are updated every month. The existence of liquidity implies the definition of parameters
for the management of that liquidity, which allow to maximise the return obtained and minimise the costs of opportunity related
to holding that liquidity safely and efficiently.
The risk management in Conduril aims at:
• Liquidity – guarantee the permanent and efficient access to enough funds to deal with current payments in the respective
due dates;
• Safety – minimise the probability of default in terms of refund of any application of funds; and
• Financial efficiency – guarantee to minimise the cost of opportunity of the surplus liquidity holding at short term.
Conduril’s policy is to reconcile the due dates of assets and liabilities, managing their maturities in a balanced way.
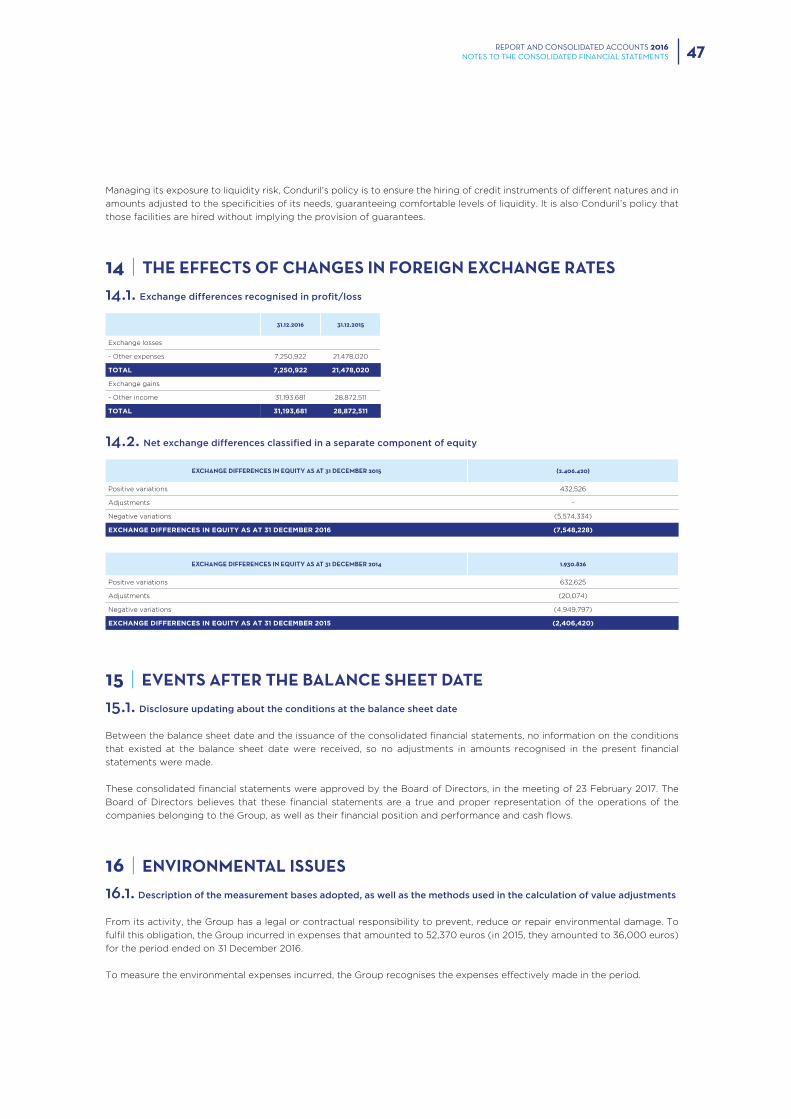
REPORT AND CONSOLIDATED ACCOUNTS 2016NOTES TO THE CONSOLIDATED FINANCIAL STATEMENTS 47
Managing its exposure to liquidity risk, Conduril’s policy is to ensure the hiring of credit instruments of different natures and in
amounts adjusted to the specificities of its needs, guaranteeing comfortable levels of liquidity. It is also Conduril’s policy that
those facilities are hired without implying the provision of guarantees.
14 | THE EFFECTS OF CHANGES IN FOREIGN EXCHANGE RATES
14.1. Exchange differences recognised in profit/loss
31.12.2016 31.12.2015
Exchange losses
- Other expenses 7,250,922 21,478,020
TOTAL 7,250,922 21,478,020
Exchange gains
- Other income 31,193,681 28,872,511
TOTAL 31,193,681 28,872,511
14.2. Net exchange differences classified in a separate component of equity
EXCHANGE DIFFERENCES IN EQUITY AS AT 31 DECEMBER 2015 (2.406.420)
Positive variations 432,526
Adjustments –
Negative variations (5,574,334)
EXCHANGE DIFFERENCES IN EQUITY AS AT 31 DECEMBER 2016 (7,548,228)
EXCHANGE DIFFERENCES IN EQUITY AS AT 31 DECEMBER 2014 1.930.826
Positive variations 632,625
Adjustments (20,074)
Negative variations (4,949,797)
EXCHANGE DIFFERENCES IN EQUITY AS AT 31 DECEMBER 2015 (2,406,420)
15 | EVENTS AFTER THE BALANCE SHEET DATE
15.1. Disclosure updating about the conditions at the balance sheet date
Between the balance sheet date and the issuance of the consolidated financial statements, no information on the conditions
that existed at the balance sheet date were received, so no adjustments in amounts recognised in the present financial
statements were made.
These consolidated financial statements were approved by the Board of Directors, in the meeting of 23 February 2017. The
Board of Directors believes that these financial statements are a true and proper representation of the operations of the
companies belonging to the Group, as well as their financial position and performance and cash flows.
16 | ENVIRONMENTAL ISSUES
16.1. Description of the measurement bases adopted, as well as the methods used in the calculation of value adjustments
From its activity, the Group has a legal or contractual responsibility to prevent, reduce or repair environmental damage. To
fulfil this obligation, the Group incurred in expenses that amounted to 52,370 euros (in 2015, they amounted to 36,000 euros)
for the period ended on 31 December 2016.
To measure the environmental expenses incurred, the Group recognises the expenses effectively made in the period.
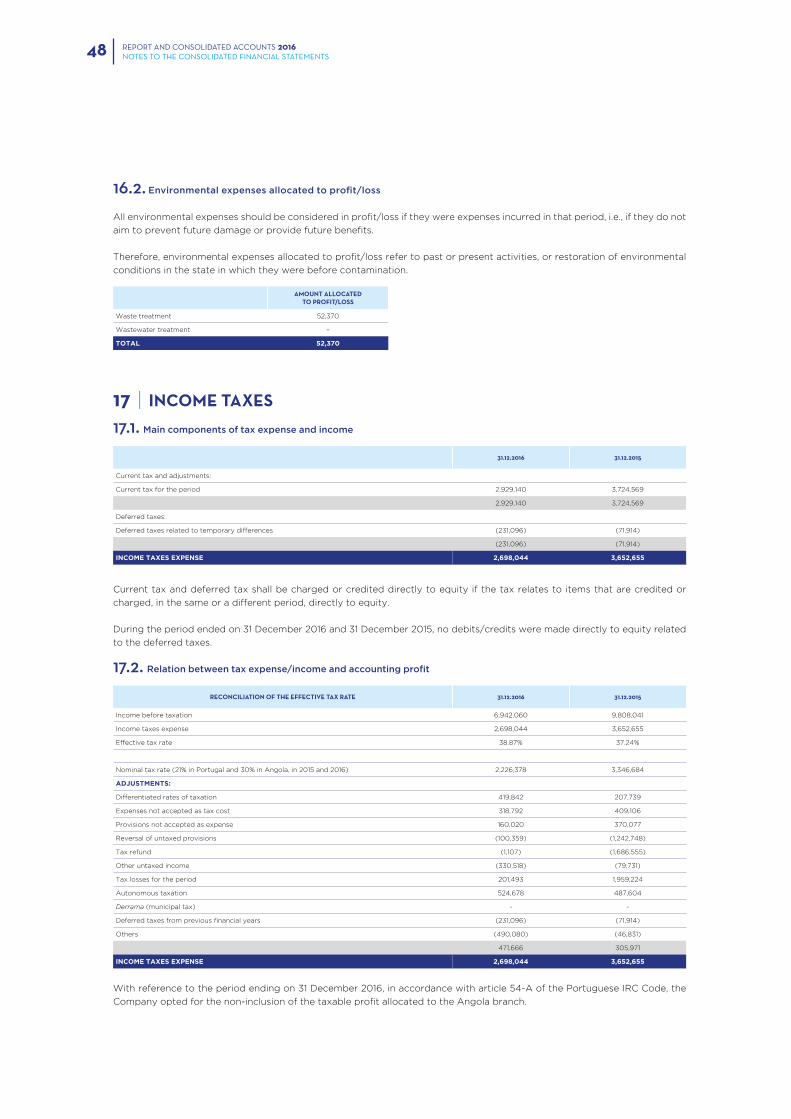
REPORT AND CONSOLIDATED ACCOUNTS 2016NOTES TO THE CONSOLIDATED FINANCIAL STATEMENTS48
16.2. Environmental expenses allocated to profit/loss
All environmental expenses should be considered in profit/loss if they were expenses incurred in that period, i.e., if they do not
aim to prevent future damage or provide future benefits.
Therefore, environmental expenses allocated to profit/loss refer to past or present activities, or restoration of environmental
conditions in the state in which they were before contamination.
AMOUNT ALLOCATED TO PROFIT/LOSS
Waste treatment 52,370
Wastewater treatment –
TOTAL 52,370
17 | INCOME TAXES
17.1. Main components of tax expense and income
31.12.2016 31.12.2015
Current tax and adjustments:
Current tax for the period 2,929,140 3,724,569
2,929,140 3,724,569
Deferred taxes:
Deferred taxes related to temporary differences (231,096) (71,914)
(231,096) (71,914)
INCOME TAXES EXPENSE 2,698,044 3,652,655
Current tax and deferred tax shall be charged or credited directly to equity if the tax relates to items that are credited or
charged, in the same or a different period, directly to equity.
During the period ended on 31 December 2016 and 31 December 2015, no debits/credits were made directly to equity related
to the deferred taxes.
17.2. Relation between tax expense/income and accounting profit
RECONCILIATION OF THE EFFECTIVE TAX RATE 31.12.2016 31.12.2015
Income before taxation 6,942,060 9,808,041
Income taxes expense 2,698,044 3,652,655
Effective tax rate 38.87% 37.24%
Nominal tax rate (21% in Portugal and 30% in Angola, in 2015 and 2016) 2,226,378 3,346,684
ADJUSTMENTS:
Differentiated rates of taxation 419,842 207,739
Expenses not accepted as tax cost 318,792 409,106
Provisions not accepted as expense 160,020 370,077
Reversal of untaxed provisions (100,359) (1,242,748)
Tax refund (1,107) (1,686,555)
Other untaxed income (330,518) (79,731)
Tax losses for the period 201,493 1,959,224
Autonomous taxation 524,678 487,604
Derrama (municipal tax) - -
Deferred taxes from previous financial years (231,096) (71,914)
Others (490,080) (46,831)
471,666 305,971
INCOME TAXES EXPENSE 2,698,044 3,652,655
With reference to the period ending on 31 December 2016, in accordance with article 54-A of the Portuguese IRC Code, the
Company opted for the non-inclusion of the taxable profit allocated to the Angola branch.
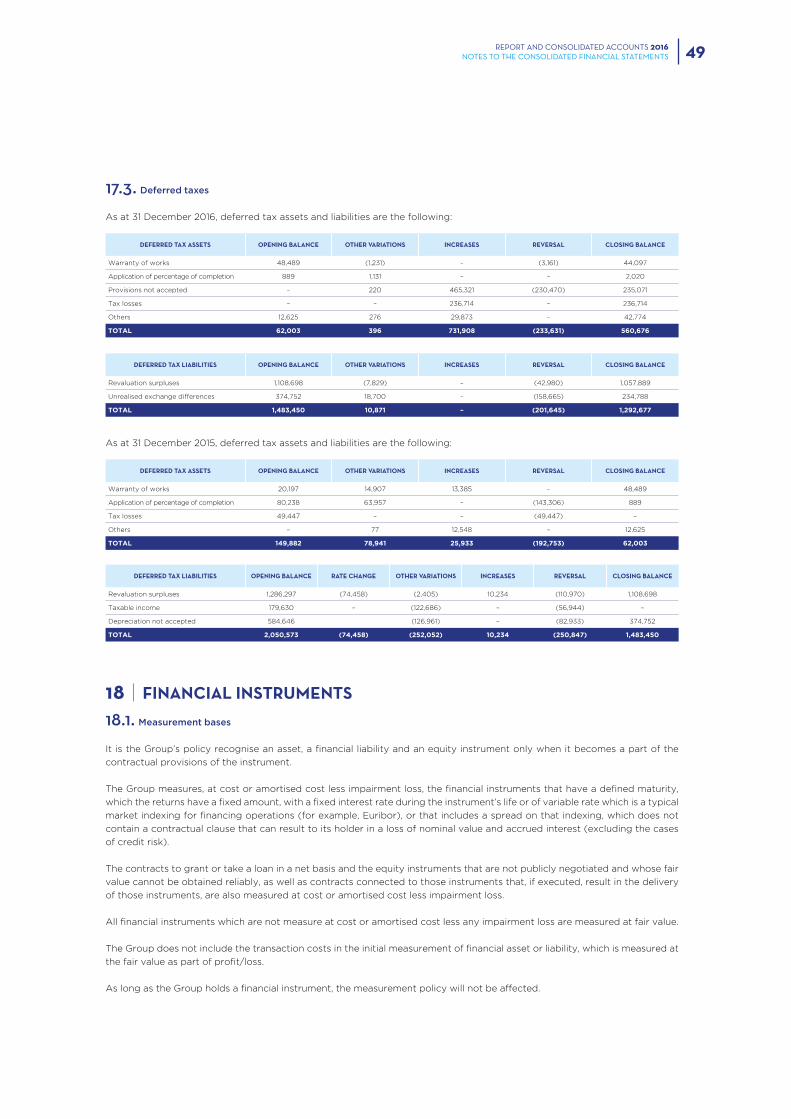
REPORT AND CONSOLIDATED ACCOUNTS 2016NOTES TO THE CONSOLIDATED FINANCIAL STATEMENTS 49
17.3. Deferred taxes
As at 31 December 2016, deferred tax assets and liabilities are the following:
DEFERRED TAX ASSETS OPENING BALANCE OTHER VARIATIONS INCREASES REVERSAL CLOSING BALANCE
Warranty of works 48,489 (1,231) – (3,161) 44,097
Application of percentage of completion 889 1,131 – – 2,020
Provisions not accepted – 220 465,321 (230,470) 235,071
Tax losses – – 236,714 – 236,714
Others 12,625 276 29,873 – 42,774
TOTAL 62,003 396 731,908 (233,631) 560,676
DEFERRED TAX LIABILITIES OPENING BALANCE OTHER VARIATIONS INCREASES REVERSAL CLOSING BALANCE
Revaluation surpluses 1,108,698 (7,829) – (42,980) 1,057,889
Unrealised exchange differences 374,752 18,700 – (158,665) 234,788
TOTAL 1,483,450 10,871 – (201,645) 1,292,677
As at 31 December 2015, deferred tax assets and liabilities are the following:
DEFERRED TAX ASSETS OPENING BALANCE OTHER VARIATIONS INCREASES REVERSAL CLOSING BALANCE
Warranty of works 20,197 14,907 13,385 – 48,489
Application of percentage of completion 80,238 63,957 – (143,306) 889
Tax losses 49,447 – – (49,447) –
Others – 77 12,548 – 12,625
TOTAL 149,882 78,941 25,933 (192,753) 62,003
DEFERRED TAX LIABILITIES OPENING BALANCE RATE CHANGE OTHER VARIATIONS INCREASES REVERSAL CLOSING BALANCE
Revaluation surpluses 1,286,297 (74,458) (2,405) 10,234 (110,970) 1,108,698
Taxable income 179,630 – (122,686) – (56,944) –
Depreciation not accepted 584,646 (126,961) – (82,933) 374,752
TOTAL 2,050,573 (74,458) (252,052) 10,234 (250,847) 1,483,450
18 | FINANCIAL INSTRUMENTS
18.1. Measurement bases
It is the Group’s policy recognise an asset, a financial liability and an equity instrument only when it becomes a part of the
contractual provisions of the instrument.
The Group measures, at cost or amortised cost less impairment loss, the financial instruments that have a defined maturity,
which the returns have a fixed amount, with a fixed interest rate during the instrument’s life or of variable rate which is a typical
market indexing for financing operations (for example, Euribor), or that includes a spread on that indexing, which does not
contain a contractual clause that can result to its holder in a loss of nominal value and accrued interest (excluding the cases
of credit risk).
The contracts to grant or take a loan in a net basis and the equity instruments that are not publicly negotiated and whose fair
value cannot be obtained reliably, as well as contracts connected to those instruments that, if executed, result in the delivery
of those instruments, are also measured at cost or amortised cost less impairment loss.
All financial instruments which are not measure at cost or amortised cost less any impairment loss are measured at fair value.
The Group does not include the transaction costs in the initial measurement of financial asset or liability, which is measured at
the fair value as part of profit/loss.
As long as the Group holds a financial instrument, the measurement policy will not be affected.
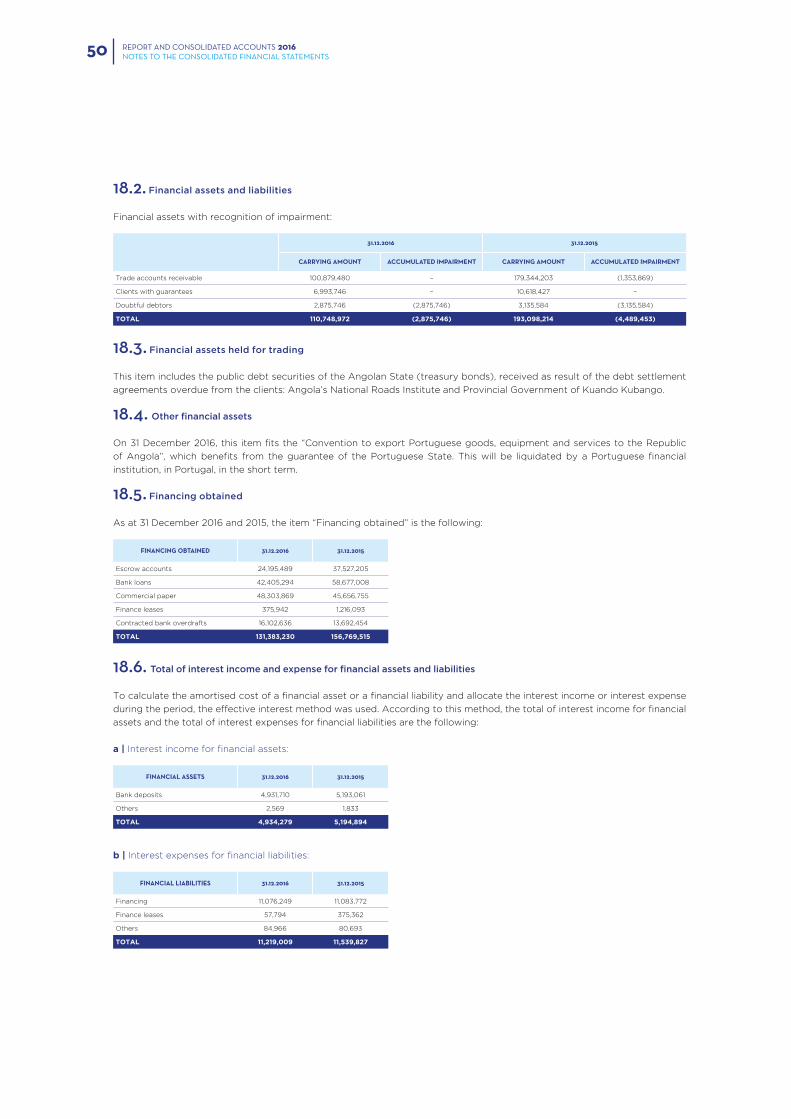
REPORT AND CONSOLIDATED ACCOUNTS 2016NOTES TO THE CONSOLIDATED FINANCIAL STATEMENTS50
18.2. Financial assets and liabilities
Financial assets with recognition of impairment:
31.12.2016 31.12.2015
CARRYING AMOUNT ACCUMULATED IMPAIRMENT CARRYING AMOUNT ACCUMULATED IMPAIRMENT
Trade accounts receivable 100,879,480 – 179,344,203 (1,353,869)
Clients with guarantees 6,993,746 – 10,618,427 –
Doubtful debtors 2,875,746 (2,875,746) 3,135,584 (3,135,584)
TOTAL 110,748,972 (2,875,746) 193,098,214 (4,489,453)
18.3. Financial assets held for trading
This item includes the public debt securities of the Angolan State (treasury bonds), received as result of the debt settlement
agreements overdue from the clients: Angola’s National Roads Institute and Provincial Government of Kuando Kubango.
18.4. Other financial assets
On 31 December 2016, this item fits the “Convention to export Portuguese goods, equipment and services to the Republic
of Angola”, which benefits from the guarantee of the Portuguese State. This will be liquidated by a Portuguese financial
institution, in Portugal, in the short term.
18.5. Financing obtained
As at 31 December 2016 and 2015, the item “Financing obtained” is the following:
FINANCING OBTAINED 31.12.2016 31.12.2015
Escrow accounts 24,195,489 37,527,205
Bank loans 42,405,294 58,677,008
Commercial paper 48,303,869 45,656,755
Finance leases 375,942 1,216,093
Contracted bank overdrafts 16,102,636 13,692,454
TOTAL 131,383,230 156,769,515
18.6. Total of interest income and expense for financial assets and liabilities
To calculate the amortised cost of a financial asset or a financial liability and allocate the interest income or interest expense
during the period, the effective interest method was used. According to this method, the total of interest income for financial
assets and the total of interest expenses for financial liabilities are the following:
a | Interest income for financial assets:
FINANCIAL ASSETS 31.12.2016 31.12.2015
Bank deposits 4,931,710 5,193,061
Others 2,569 1,833
TOTAL 4,934,279 5,194,894
b | Interest expenses for financial liabilities:
FINANCIAL LIABILITIES 31.12.2016 31.12.2015
Financing 11,076,249 11,083,772
Finance leases 57,794 375,362
Others 84,966 80,693
TOTAL 11,219,009 11,539,827
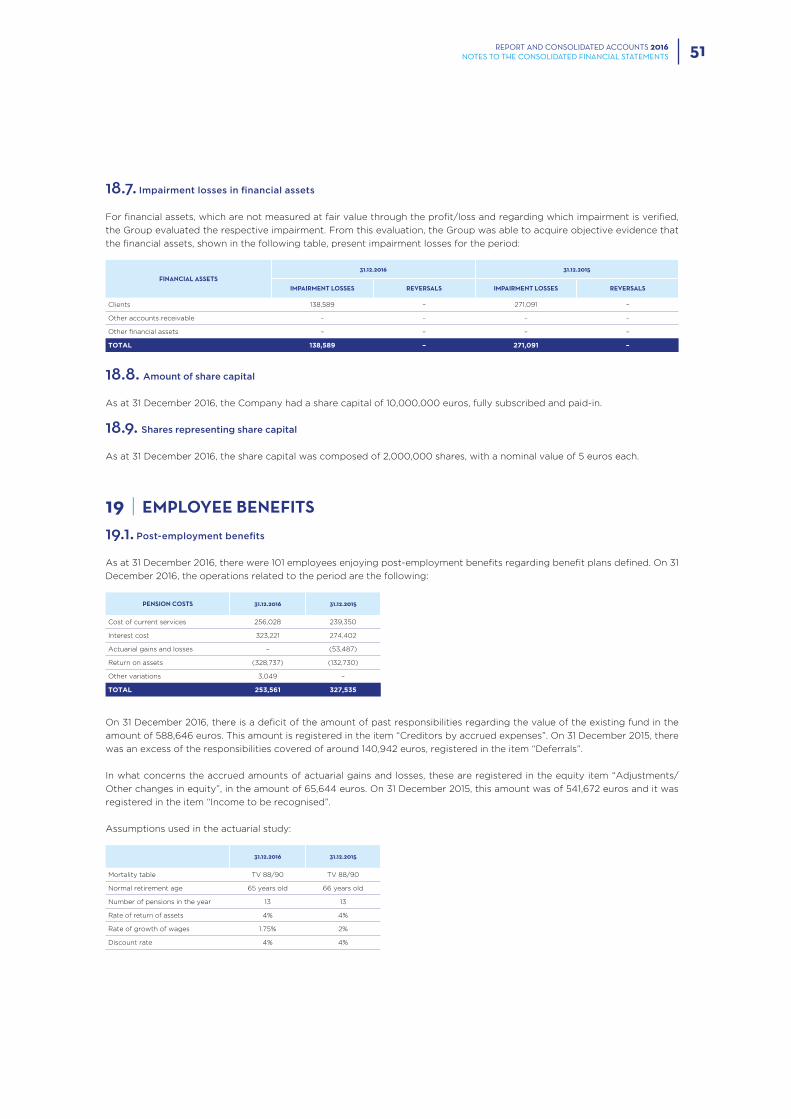
REPORT AND CONSOLIDATED ACCOUNTS 2016NOTES TO THE CONSOLIDATED FINANCIAL STATEMENTS 51
18.7. Impairment losses in financial assets
For financial assets, which are not measured at fair value through the profit/loss and regarding which impairment is verified,
the Group evaluated the respective impairment. From this evaluation, the Group was able to acquire objective evidence that
the financial assets, shown in the following table, present impairment losses for the period:
FINANCIAL ASSETS31.12.2016 31.12.2015
IMPAIRMENT LOSSES REVERSALS IMPAIRMENT LOSSES REVERSALS
Clients 138,589 – 271,091 –
Other accounts receivable – – – –
Other financial assets – – – –
TOTAL 138,589 – 271,091 –
18.8. Amount of share capital
As at 31 December 2016, the Company had a share capital of 10,000,000 euros, fully subscribed and paid-in.
18.9. Shares representing share capital
As at 31 December 2016, the share capital was composed of 2,000,000 shares, with a nominal value of 5 euros each.
19 | EMPLOYEE BENEFITS
19.1. Post-employment benefits
As at 31 December 2016, there were 101 employees enjoying post-employment benefits regarding benefit plans defined. On 31
December 2016, the operations related to the period are the following:
PENSION COSTS 31.12.2016 31.12.2015
Cost of current services 256,028 239,350
Interest cost 323,221 274,402
Actuarial gains and losses – (53,487)
Return on assets (328,737) (132,730)
Other variations 3,049 –
TOTAL 253,561 327,535
On 31 December 2016, there is a deficit of the amount of past responsibilities regarding the value of the existing fund in the
amount of 588,646 euros. This amount is registered in the item “Creditors by accrued expenses”. On 31 December 2015, there
was an excess of the responsibilities covered of around 140,942 euros, registered in the item “Deferrals”.
In what concerns the accrued amounts of actuarial gains and losses, these are registered in the equity item “Adjustments/
Other changes in equity”, in the amount of 65,644 euros. On 31 December 2015, this amount was of 541,672 euros and it was
registered in the item “Income to be recognised”.
Assumptions used in the actuarial study:
31.12.2016 31.12.2015
Mortality table TV 88/90 TV 88/90
Normal retirement age 65 years old 66 years old
Number of pensions in the year 13 13
Rate of return of assets 4% 4%
Rate of growth of wages 1.75% 2%
Discount rate 4% 4%
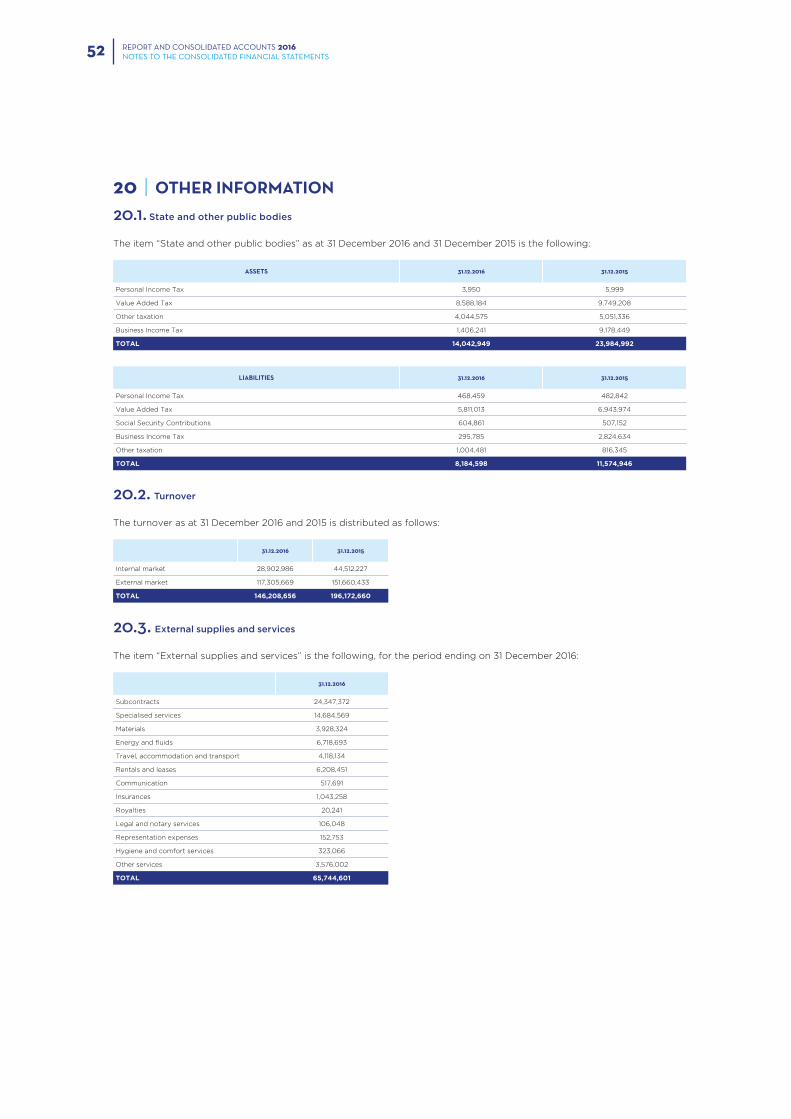
REPORT AND CONSOLIDATED ACCOUNTS 2016NOTES TO THE CONSOLIDATED FINANCIAL STATEMENTS52
20 | OTHER INFORMATION
20.1. State and other public bodies
The item “State and other public bodies” as at 31 December 2016 and 31 December 2015 is the following:
ASSETS 31.12.2016 31.12.2015
Personal Income Tax 3,950 5,999
Value Added Tax 8,588,184 9,749,208
Other taxation 4,044,575 5,051,336
Business Income Tax 1,406,241 9,178,449
TOTAL 14,042,949 23,984,992
LIABILITIES 31.12.2016 31.12.2015
Personal Income Tax 468,459 482,842
Value Added Tax 5,811,013 6,943,974
Social Security Contributions 604,861 507,152
Business Income Tax 295,785 2,824,634
Other taxation 1,004,481 816,345
TOTAL 8,184,598 11,574,946
20.2. Turnover
The turnover as at 31 December 2016 and 2015 is distributed as follows:
31.12.2016 31.12.2015
Internal market 28,902,986 44,512,227
External market 117,305,669 151,660,433
TOTAL 146,208,656 196,172,660
20.3. External supplies and services
The item “External supplies and services” is the following, for the period ending on 31 December 2016:
31.12.2016
Subcontracts 24,347,372
Specialised services 14,684,569
Materials 3,928,324
Energy and fluids 6,718,693
Travel, accommodation and transport 4,118,134
Rentals and leases 6,208,451
Communication 517,691
Insurances 1,043,258
Royalties 20,241
Legal and notary services 106,048
Representation expenses 152,753
Hygiene and comfort services 323,066
Other services 3,576,002
TOTAL 65,744,601
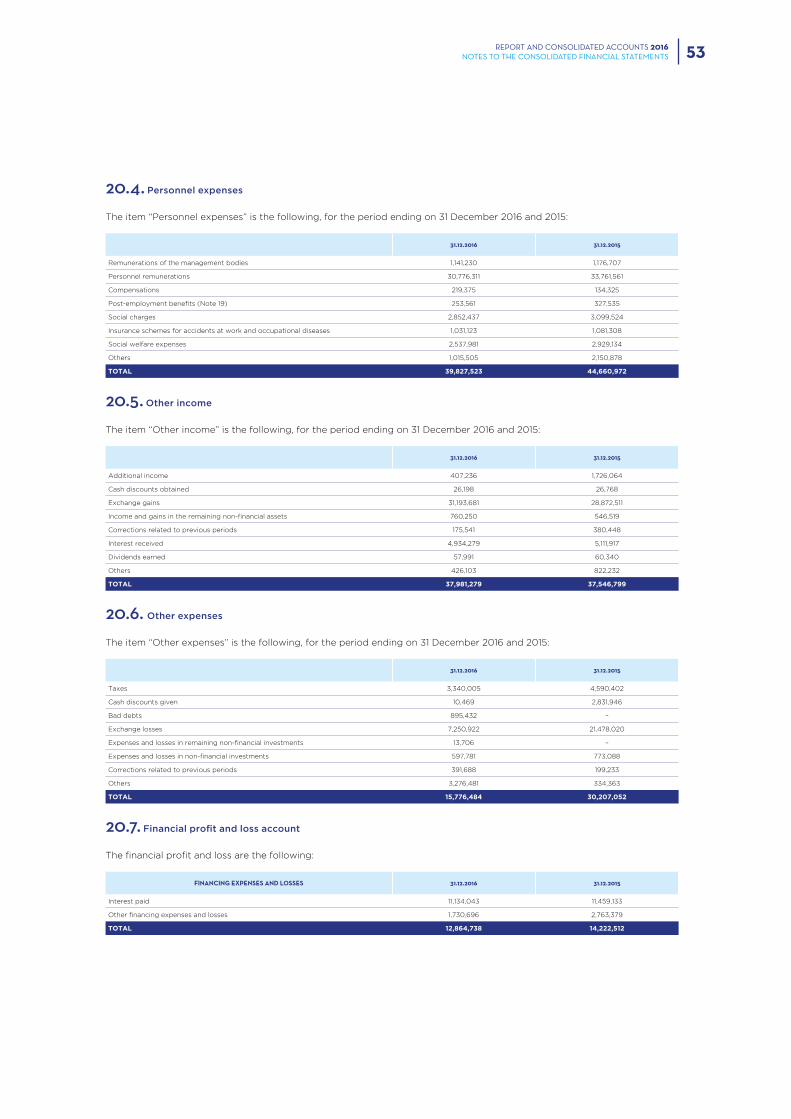
REPORT AND CONSOLIDATED ACCOUNTS 2016NOTES TO THE CONSOLIDATED FINANCIAL STATEMENTS 53
20.4. Personnel expenses
The item “Personnel expenses” is the following, for the period ending on 31 December 2016 and 2015:
31.12.2016 31.12.2015
Remunerations of the management bodies 1,141,230 1,176,707
Personnel remunerations 30,776,311 33,761,561
Compensations 219,375 134,325
Post-employment benefits (Note 19) 253,561 327,535
Social charges 2,852,437 3,099,524
Insurance schemes for accidents at work and occupational diseases 1,031,123 1,081,308
Social welfare expenses 2,537,981 2,929,134
Others 1,015,505 2,150,878
TOTAL 39,827,523 44,660,972
20.5. Other income
The item “Other income” is the following, for the period ending on 31 December 2016 and 2015:
31.12.2016 31.12.2015
Additional income 407,236 1,726,064
Cash discounts obtained 26,198 26,768
Exchange gains 31,193,681 28,872,511
Income and gains in the remaining non-financial assets 760,250 546,519
Corrections related to previous periods 175,541 380,448
Interest received 4,934,279 5,111,917
Dividends earned 57,991 60,340
Others 426,103 822,232
TOTAL 37,981,279 37,546,799
20.6. Other expenses
The item “Other expenses” is the following, for the period ending on 31 December 2016 and 2015:
31.12.2016 31.12.2015
Taxes 3,340,005 4,590,402
Cash discounts given 10,469 2,831,946
Bad debts 895,432 –
Exchange losses 7,250,922 21,478,020
Expenses and losses in remaining non-financial investments 13,706 –
Expenses and losses in non-financial investments 597,781 773,088
Corrections related to previous periods 391,688 199,233
Others 3,276,481 334,363
TOTAL 15,776,484 30,207,052
20.7. Financial profit and loss account
The financial profit and loss are the following:
FINANCING EXPENSES AND LOSSES 31.12.2016 31.12.2015
Interest paid 11,134,043 11,459,133
Other financing expenses and losses 1,730,696 2,763,379
TOTAL 12,864,738 14,222,512
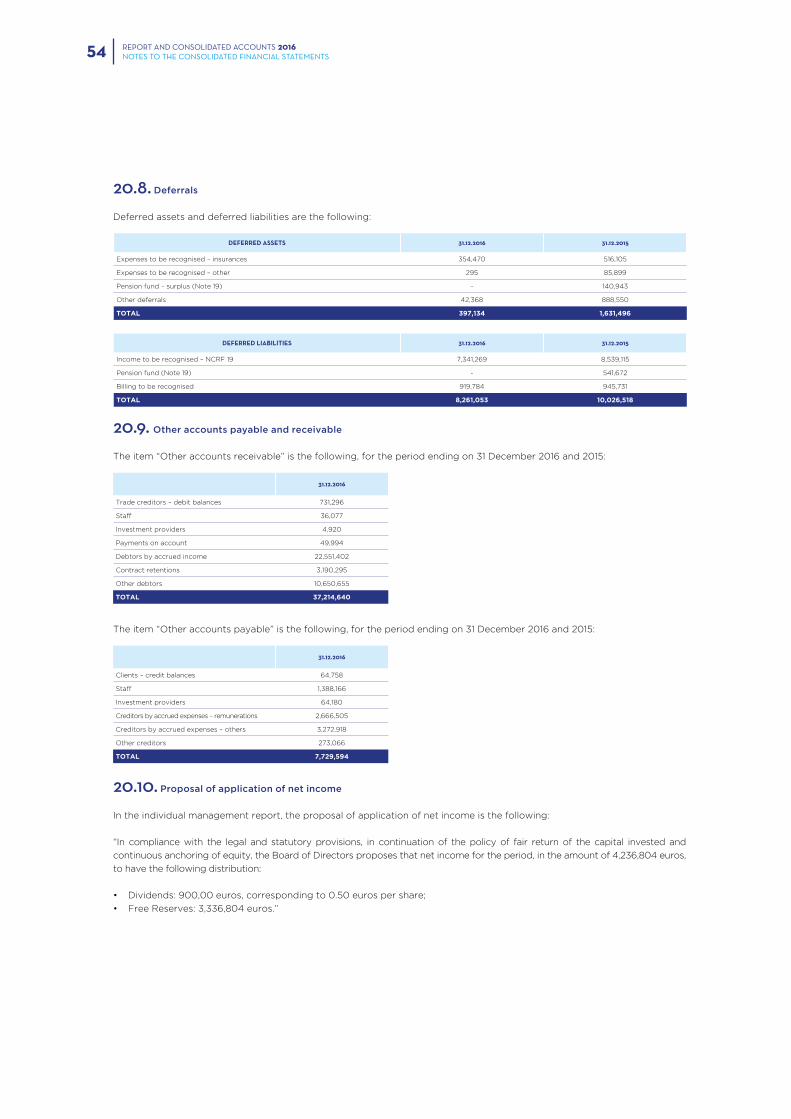
REPORT AND CONSOLIDATED ACCOUNTS 2016NOTES TO THE CONSOLIDATED FINANCIAL STATEMENTS54
20.8. Deferrals
Deferred assets and deferred liabilities are the following:
DEFERRED ASSETS 31.12.2016 31.12.2015
Expenses to be recognised – insurances 354,470 516,105
Expenses to be recognised – other 295 85,899
Pension fund – surplus (Note 19) – 140,943
Other deferrals 42,368 888,550
TOTAL 397,134 1,631,496
DEFERRED LIABILITIES 31.12.2016 31.12.2015
Income to be recognised – NCRF 19 7,341,269 8,539,115
Pension fund (Note 19) - 541,672
Billing to be recognised 919,784 945,731
TOTAL 8,261,053 10,026,518
20.9. Other accounts payable and receivable
The item “Other accounts receivable” is the following, for the period ending on 31 December 2016 and 2015:
31.12.2016
Trade creditors – debit balances 731,296
Staff 36,077
Investment providers 4,920
Payments on account 49,994
Debtors by accrued income 22,551,402
Contract retentions 3,190,295
Other debtors 10,650,655
TOTAL 37,214,640
The item “Other accounts payable” is the following, for the period ending on 31 December 2016 and 2015:
31.12.2016
Clients – credit balances 64,758
Staff 1,388,166
Investment providers 64,180
Creditors by accrued expenses – remunerations 2,666,505
Creditors by accrued expenses – others 3,272,918
Other creditors 273,066
TOTAL 7,729,594
20.10. Proposal of application of net income
In the individual management report, the proposal of application of net income is the following:
“In compliance with the legal and statutory provisions, in continuation of the policy of fair return of the capital invested and
continuous anchoring of equity, the Board of Directors proposes that net income for the period, in the amount of 4,236,804 euros,
to have the following distribution:
• Dividends: 900,00 euros, corresponding to 0.50 euros per share;
• Free Reserves: 3,336,804 euros.”
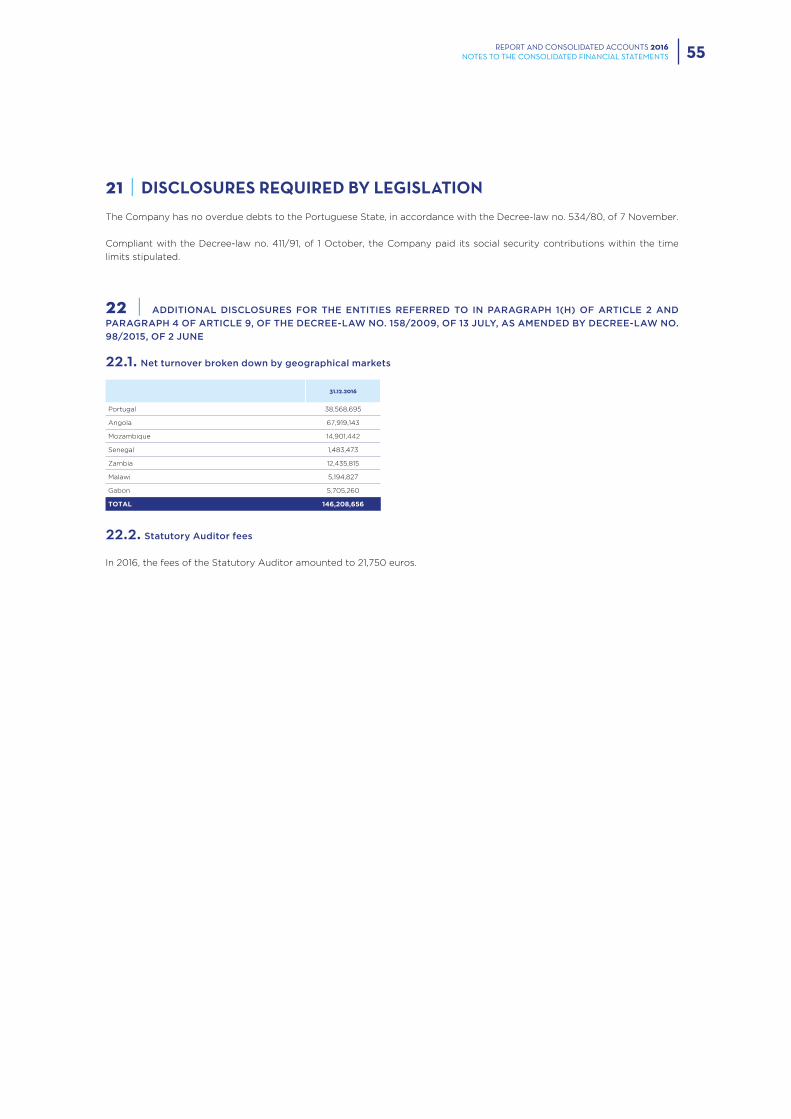
REPORT AND CONSOLIDATED ACCOUNTS 2016NOTES TO THE CONSOLIDATED FINANCIAL STATEMENTS 55
21 | DISCLOSURES REQUIRED BY LEGISLATION
The Company has no overdue debts to the Portuguese State, in accordance with the Decree-law no. 534/80, of 7 November.
Compliant with the Decree-law no. 411/91, of 1 October, the Company paid its social security contributions within the time
limits stipulated.
22 | ADDITIONAL DISCLOSURES FOR THE ENTITIES REFERRED TO IN PARAGRAPH 1(H) OF ARTICLE 2 AND
PARAGRAPH 4 OF ARTICLE 9, OF THE DECREE-LAW NO. 158/2009, OF 13 JULY, AS AMENDED BY DECREE-LAW NO.
98/2015, OF 2 JUNE
22.1. Net turnover broken down by geographical markets
31.12.2016
Portugal 38,568,695
Angola 67,919,143
Mozambique 14,901,442
Senegal 1,483,473
Zambia 12,435,815
Malawi 5,194,827
Gabon 5,705,260
TOTAL 146,208,656
22.2. Statutory Auditor fees
In 2016, the fees of the Statutory Auditor amounted to 21,750 euros.

05
REPORT AND OPINION OF THE STATUTORY
AUDIT BOARDREPORT AND CONSOLIDATED
ACCOUNTS2016
REPORT AND CONSOLIDATED ACCOUNTS 2016REPORT AND OPINION OF THE STATUTORY AUDIT BOARD58
STATUTORY AUDIT BOARD
FINANCIAL YEAR OF 2016
CONSOLIDATED ACCOUNTS |Dear Shareholders:
In compliance with the legal provisions, the Statutory Audit
Board submits its report and issues its opinion on the
consolidated management report, consolidated balance
sheet, consolidated accounts and proposal of application of
net income, which were presented by the Board of Directors
of CONDURIL - Engenharia, S.A., regarding the financial year
ended on 31 December 2016.
REPORT |In the performance of its duties, the Statutory Audit Board
had regular meetings accompanying the social activity and
the evolution of CONDURIL - Engenharia, S.A. business,
watched and ensured the fulfilment of the law and the
articles of association, and it was informed of the acts carried
out by the Board of Directors, which has always clarified any
situation when requested.
Also in the performance of its duties, the Board carried out
a careful analysis of the consolidated management report
presented by the Board of Directors, the consolidated
balance sheet, the consolidated income statement, the
consolidated cash flows and the changes in consolidated
equity for the financial year ended on 31 December 2016,
and its annexe with the explanatory notes. These documents
are considered to be correct and offer a clear picture of the
activity developed and the financial position.
Within the framework of its competence, the Board was
informed of the works developed during the year by the
Audit Firm, obtained information and clarifications provided
by its representative, required for the control of the official
audit to the other financial statements, was informed of the
conclusions and recommendations of the audit report sent
to the Board of Directors, and proceeded to the analysis
of the legal certification of consolidated accounts, whose
contents deserve the agreement of the Board.
The Board, still in the framework of its competence,
expresses its agreement regarding the accounting policies
and the valuation criteria adopted.
As a result of the above, the Board considers that the
consolidated management report, consolidated balance
sheet, consolidated income statement, consolidated cash
flows and changes in consolidated equity allow, in the whole,
for a correct understanding of the consolidated financial
situation of CONDURIL - Engenharia, S.A., on 31 December
2016, and the income statement for the financial year ended
on that date, and it also considers that the legal and statutory
provisions were respected.
As a conclusion, the Board also thanks, along with the Board
of Directors, the Employees for their commitment and
dedication.
Therefore, the Statutory Audit Board issues the
OPINION |1 | that the consolidated management report, consolidated
balance sheet, consolidated accounts and its notes for the
financial year ended on 31 December 2016 are approved;
2 | that the proposal of application of net income included
in the consolidated management report, in the terms
presented by the Board of Directors is approved.
Ermesinde, 14 March 2017
THE STATUTORY AUDIT REPORT |Crisóstomo Aquino de Barros, President
Daniela Brás Vigário Silva
José Tiago Sapage Meireles de Amorim

REPORT AND CONSOLIDATED ACCOUNTS 2016REPORT AND OPINION OF THE STATUTORY AUDIT BOARD 59
06
LEGAL CERTIFICATION OF CONSOLIDATED
ACCOUNTSREPORT AND CONSOLIDATED
ACCOUNTS2016
REPORT AND CONSOLIDATED ACCOUNTS 2016LEGAL CERTIFICATION OF CONSOLIDATED ACCOUNTS62
LEGAL CERTIFICATION OF CONSOLIDATED ACCOUNTS
REPORTING ON THE AUDIT OF
THE CONSOLIDATED FINANCIAL
STATEMENTS |Opinion
We have audited the consolidated financial statements of
Conduril - Engenharia, S.A. (the Group), which comprise
the consolidated balance sheet on 31 December 2016
(which reflects a total of 440,791,120 euros and total equity
of 213,393,249 euros, including a net income of 4,236,818
euros), the consolidated profit and loss account by nature,
the consolidated statement of changes in equity and the
consolidated cash flow statement for the year ended on that
date, and the notes attached to the consolidated financial
statements, comprising a summary of significant accounting
policies.
In our opinion, the consolidated financial statements
attached present a true and proper view, in all material
aspects, of the consolidated financial position of Conduril -
Engenharia, S.A. on 31 December 2016 and its consolidated
financial performance and cash flows for the year ended
on that date, in accordance with the accounting principles
generally accepted in Portugal.
Grounds for the opinion
Our audit was performed in accordance with the International
Standards on Auditing (ISAs) and further standards and
technical and ethical guidelines of the Portuguese Institute
of Statutory Auditors (“Ordem dos Revisores Oficiais de
Contas”). Our responsibilities under those standards are
described in the section “Auditor’s responsibilities on the
audit of the consolidated financial statements” below. We
are independent from the entities belonging to the Group
under the law and we meet all other ethical requirements
in accordance with the code of ethics of the Portuguese
Institute of Statutory Auditors.
We believe that the audit evidence obtained is sufficient and
appropriate to provide a basis to our opinion.
Responsibilities of the management body and the
supervisory body on the consolidated financial statements
The management body is responsible for:
• the preparation of the consolidated financial statements
that present a true and proper view of the financial position,
financial performance and cash flows of the Group, in
accordance with the accounting principles generally
accepted in Portugal;
• the preparation of the management report under the terms
of the rules and regulations;
• the creation and maintenance of an internal control system,
appropriate to enable the preparation of financial statements
free of material misstatements due to fraud or errors;
• the adoption of accounting policies and criteria adequate to
the circumstances; and
• the assessment of the Group’s ability to maintain its
continuity, disclosing, when applicable, the topics that could
give rise to justifiable doubt about the continuity of the
activities.
The supervisory body is responsible for supervising the
process of preparation and disclosure of the financial
information of the Group.
Auditor’s responsibilities on the audit of the
consolidated financial statements
Our responsibility is to obtain a reasonable assurance if the
consolidated financial statements, as a whole, are free of
material misstatements due to fraud or errors and issue a
report where our opinion is expressed. Reasonable assurance
is a high level of assurance, but it is not a guarantee that
an audit performed in accordance with the ISAs will
always detect a material misstatement when it exists. The
misstatements may derive from fraud or errors, and they
are considered material if, alone or together, they might
reasonably be expected to influence the economic decisions
of the users taken based on those financial statements.
As part of an audit under the ISAs, we make professional
judgements and we maintain professional scepticism during
the audit, and we also:
• identify and assess the risks of material misstatements of
the consolidated financial statements, due to fraud or errors;
prepare and perform audit procedures that address those
risks; and obtain sufficient and appropriate audit evidence
to provide a basis for our opinion. The risk of not detecting
a material misstatement due to fraud is higher that the risk
of not detecting a material misstatement due to errors,
since fraud can involve collusion, falsification, intentional
omissions, false statements or overlap of the internal control;
• obtain an understanding of the internal control relevant to
the audit, with the aim of preparing audit procedures that
are appropriate in the circumstances, but not to express an
opinion about the efficiency of the internal control of the
Group;
• evaluate the appropriateness of the accounting policies used
and reasonableness of accounting estimates and respective
disclosures made by the management body;
• concluded on the appropriation of use, by the management
body, of the going concern assumption and, based on the
audit evidence obtained, if there is any material uncertainty
related to events or conditions that could give rise to
justifiable doubt about the Group’s ability to continue its
activities. If we conclude that there is a material uncertainty,
we should point in our report the disclosures related included
REPORT AND CONSOLIDATED ACCOUNTS 2016LEGAL CERTIFICATION OF CONSOLIDATED ACCOUNTS 63
in the financial statements or, if those disclosures are not
appropriate, change our opinion. Our conclusions are based
on the audit evidence obtained until the date of our report.
However, events or future conditions may take the Group to
discontinue its activities;
• evaluate the presentation, structure and global contents
of the consolidated financial statements, including the
disclosures, and if those financial statements represent the
transactions and events underlying in order to achieve an
appropriate presentation;
• obtain sufficient and appropriate audit evidence regarding
the financial information of the entities or the activities
inside the Group to express an opinion on the consolidated
financial statements. We are responsible for the guidance,
supervision and performance of the Group’s audit, and we
are ultimately responsible for our audit opinion;
• communicate to the governance officers, among other
subjects, the scope and planned schedule of the audit, and
the relevant conclusions of the audit, including any significant
gap of the internal control identified during the audit.
Our responsibility also includes the verification of compliance
of the information in the management report with the
consolidated financial statements.
REPORTING ON OTHER LEGAL
RULES AND REGULATIONS |About the management report
Compliant with article 451, paragraph 3(e) of the Portuguese
Companies Act, we believe that the management report
was prepared in accordance with the applicable rules
and regulations in force, its information is in line with the
financial statements audited and, based on the knowledge
and evaluation on the Group, we did not identify material
misstatements.
Oporto, 13 March 2017
HORWATH & ASSOCIADOS, SROC, LDA.
Represented by Ana Raquel Borges L. Esperança Sismeiro
(ROC 1126)

CONDURIL - ENGENHARIA, S.A.
CONDURIL ANGOLA
CONDURIL MOÇAMBIQUE,
ENOP
CONDURIL BOTSWANA
CONDURIL ZÂMBIA
CONDURIL MALAWI
CONDURILGABÃO
CONDURIL AÇORES
MÉTIS
URANO
Avenida Eng.º Duarte Pacheco, n.º 1835
4445-416 Ermesinde - Portugal
T. +351 229 773 920
F. +351 229 748 668
Rua 2 IL (ao Largo do Ambiente)
Município de Ingombota - Luanda - Angola
T. +244 222 310 153
F. +244 222 310 713
Estrada Nacional n.º 4, Tchumene 2,
parcela 3380/12 Matola
T. +258 219 025 88
Tribal Lot 86 Portion 955 Isis Village
Tlokweng - Gaborone - Botswana
T. +267 319 02 53
F. +267 393 03 25
Plot 3817 Martin Mwamba Road
Lusaka - Zambia
PO Box 473 P/Bag E891 Manda Hill
Lusaka Zambia
T. +260 211 291 441
PO Box 40 Liwonde Malawi
Liwonde - Malawi
T. +265 994 956 884
Nzeng-Ayong (à 100m du
Carrefour GP), BP 203
Libreville - Gabon
Rua Padre João Baptista de Valles,
n.º 3 1º, SU/NA
9500-791 Ponta Delgada
Parque Industrial de Viana – B.º - Capalanga
Município de Viana – Luanda – ANGOLA
T. +244 939 212 517
Polo Industrial de Viana, Zona do Km 25
Município de Viana - Comuna do Zango –
Luanda – ANGOLA
T. +244 939 133 245
Recommended