PUNJABEXAMINATIONCOMMISSION
REPORT ONGRADES 5 AND8 EXAMS

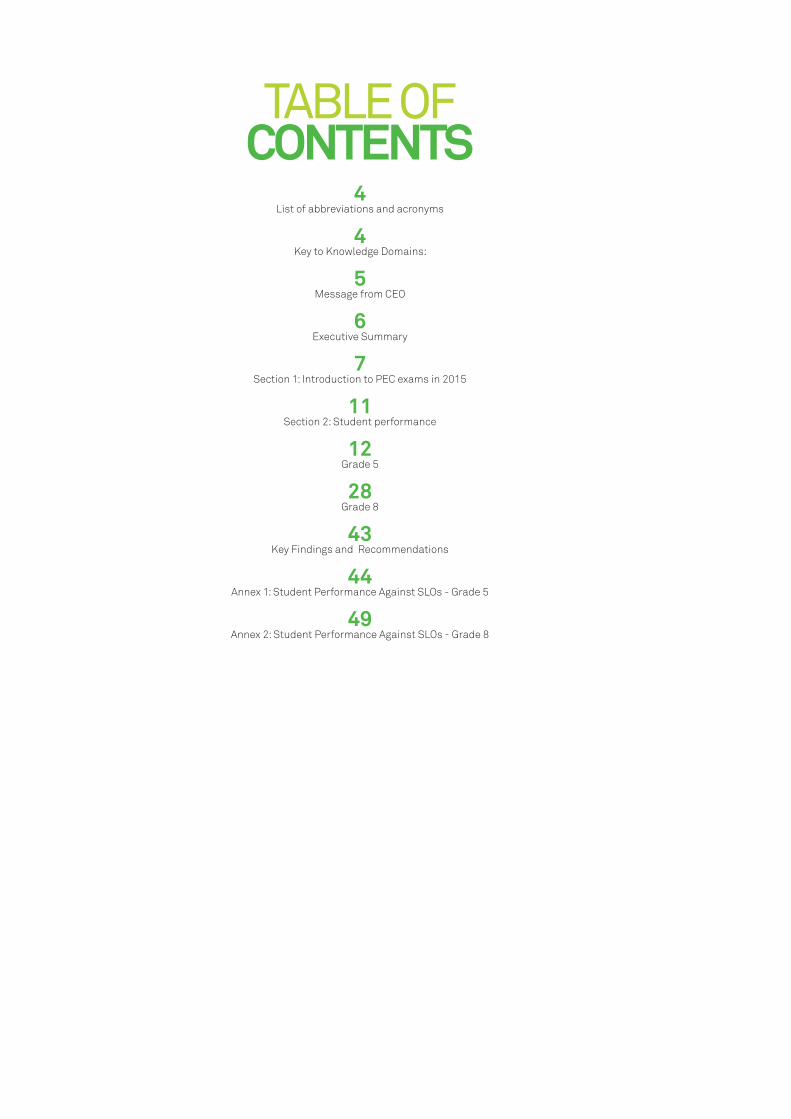
TABLE OFCONTENTS
4List of abbreviations and acronyms
4Key to Knowledge Domains:
5Message from CEO
6Executive Summary
7Section 1: Introduction to PEC exams in 2015
11Section 2: Student performance
12Grade 5
28Grade 8
43Key Findings and Recommendations
44Annex 1: Student Performance Against SLOs - Grade 5
49Annex 2: Student Performance Against SLOs - Grade 8
LIST OF ABBREVIATIONS AND ACRONYMSCRQ Constructed Response Question
DSD Directorate for Staff Development
GoPb Government of the Punjab
MCQ Multiple Choice Question
PCTB Punjab Curriculum and Textbook Board
PEC Punjab Examination Commission
PPBP Parho Punjab Barho Punjab
SED School Education Department
SLO Student Learning Outcome
KEY TO KNOWLEDGE DOMAINS:Knowledge: Recalling something that has been learnt, for instance,
2 + 4 = 6
Understanding: Realizing why 2 + 4 = 6, and that if 2 + 4 = 6, 4 + 2 should also be equal to 6.
Application: Synthesizing, analysing and applying their knowledge of basic addition to everyday life, for instance word problems such as: If your parents have 4 children, how many people are in your family? 6
4
PUNJAB EXAMINATION COMMISSION
Nasir Iqbal MalikChief Executive OfficerPunjab Examination Commission
5
REPORT ON GRADE 5 AND 8 EXAMS - 2015
MESSAGEFROM CEO
For most students, PEC exams are among the most important exams they will take in their lives. It is therefore important that these
exams are developed carefully, administered efficiently and marked reliably.
PEC therefore emphasizes a cycle of ongoing improvement, through which it continuously improves the design, conduct and marking of its exams.
This year, PEC introduced multiple innovations and improvements to its exams; these innovations and improvements are described in the following pages. As a result, more than ever before, this year’s exams provide a credible measure of student learning levels across the performance. These improvements are the start of an ambitious institutional strengthening agenda for PEC, and we will continue to steadily improve exam design, conduct and marking over the next three years.
The following report has been published to communicate the outcomes and trends from this year’s exams and to inform key stakeholders of strengths and
weaknesses in students’ knowledge and skills. We at PEC hope that the findings in this report can inform improvements in the quality of education delivered to our young boys and girls, who are the future of our province. We also believe that reforms at PEC will make a valuable contribution to the Chief Minister’s Parho Punjab, Barho Punjab campaign, launched to transform the quality of education in Punjab by the year 2018.
I express my gratitude to Mr. Abdul Jabbar Shaheen Secretary, Govt. of the Punjab, School Education Department for his continuous encouragement and guidance to accomplish this research work.
I am also indebted to Dr. Thomas Christie who remained engaged with the PEC data analysis team and guided their efforts. I am also thankful to CM Road Map team, for their technical contribution throughout the process, and to UNICEF for their abiding and generous technical and financial support every step of the way.
Thanks to all those who have helped in any way.
FOR THE LAST TEN YEARS, THE PUNJAB EXAMINATION COMMISSION (PEC) HAS ADMINISTERED EXAMS TO MILLIONS OF GRADES 5 AND 8 STUDENTS FROM ALL GOVERNMENT SCHOOLS AND THE MAJORITY OF PRIVATE SCHOOLS IN PUNJAB. THESE EXAMS PROVIDE THE GATEWAY FOR PRIMARY SCHOOL STUDENTS TO ENTER MIDDLE SCHOOL, AND MIDDLE SCHOOL STUDENTS TO ENTER HIGH SCHOOL.
EXECUTIVESUMMARY
Grade 5Students performed best in Islamiat, and were weakest in Science. They achieved a mean percentage score of 68 in Islamiat, 61 in Urdu, 50 in Mathematics, 49 in English and 45 in Science. Students in private schools outperformed students in government schools, and girls performed better than boys, especially in Constructed Response Questions (CRQs), which tested understanding and application of curricular topics. Overall, students fared best in questions that tested knowledge; these were mostly Multiple Choice Questions (MCQs). They were far weaker in questions that tested application of knowledge and skills. Students from districts Muzaffargarh, Layyah and Vehari performed the best on average, whereas students from districts Rawalpindi, Sheikhupura and Narowal had the lowest scores, on average. Overall, students in southern districts performed better than students in central and northern districts.
Grade 8Student performance in Grade 8 exams showed patterns similar to that of the Grade 5 exams, however performance among Grade 8 students was better than Grade 5 students in all subjects, with the lowest performing district averaging at 51.3%, compared to an average of 33.8% for Grade 5 exams. The highest performing subject was Islamiat, whereas Science was the weakest. Their mean scores were as follows: 76 in Islamiat, 68 in Urdu, 57 in English, 50 in Mathematics, and 47 in Science. Students, on average, scored better on MCQs than on CRQs. Students from private schools performed better than students from government schools, and in both school systems, girls performed better than boys. Within cognitive domains, students fared best in questions that tested knowledge and had difficulty with questions that tested application. As with Grade 5, students from districts Muzaffargarh, Layyah and Vehari performed the best, on average, whereas students from districts Rawalpindi, Narowal and Sheikhupura had the lowest scores, on average. Overall, students in southern districts performed better than students in central and northern districts.
THIS YEAR’S PEC EXAMS PROVIDE INSIGHTFUL INFORMATION ON THE QUALITY OF LEARNING IN PRIMARY AND MIDDLE SCHOOLS IN PUNJAB. THIS SECTION SUMMARIZES TRENDS THAT HAVE EMERGED FOR BOTH GRADES 5 AND 8.
6
PUNJAB EXAMINATION COMMISSION

SECTION 1: INTRODUCTION TO PEC EXAMS IN 2015Every year, the Punjab Examination Commission (PEC) conducts exams for Grade 5 and Grade 8 students in the province. These Grades are selected because they are critical milestones for students as they progress towards graduation. Grade 5 is the final year in primary school and Grade 8 is the final year in middle school. Therefore, if designed and conducted fairly, PEC exams can provide valuable data on how well students have performed at the primary and middle school levels.
In 2015, PEC introduced a four year improvement plan to strengthen the design and delivery of its exams and to use findings on student performance to provide rich, reliable data to inform the Government of the Punjab’s (GoPb’s) quality education drive.
7
REPORT ON GRADE 5 AND 8 EXAMS - 2015

SCALE OF THE EXAMS
A total of 6620 exam centers were set up for grade 5 students and 5863 exam centers were established for grade 8 students across the province, in which thousands of staff members were employed to oversee the conduct of the exams and perform invigilation duties. The staff deployed by PEC comprised 6271 superintendents, 5888 resident Inspectors, 40477 invigilators, 6271 grade IV staff, 1996 CTSC Heads and 2287 IT Teachers for grade 5 and 5482 superintends, 5128 resident Inspectors, 31445 invigilators, 5482 grade IV staff, 1996 CTSC Heads2 and 2274 IT teachers for grade 8. PEC subsequently established 241 marking centers for checking the exam
papers with marking staff of 23797 sub examiners and 4875 head examiners for grade 5 and 22365 sub examiners and 4572 head examiners for grade 8 exams.
In addition, education managers including the EDOs, the DEOs and the DDEOs, as well as the CTSC heads of all districts were engaged in the administration and conduct of these exams. Significant human and material resources were committed to ensure the smooth running of the exam cycle and considerable investment was made in printing, storing and distributing the exam papers to each and every exam center in the province. It was imperative that
The Punjab Examination Commission has been administering exams to the entire population of grade 5 and grade 8 students in government schools and a significant number of private candidates in Punjab from February 21, 2015 to March 3, 2015. These exams determine levels of student achievement, reveal teaching and learning issues and provide the basis for award of scholarships to high performing students. The scale on which these exams are conducted is massive, as Tables 1 and 2 reveal.
!
Registered Appeared Declared Pass
*Pass %
Public School
Male 412513 403700 210649 52.18 Female 372633 366591 213496 58.24
Private School
Male 235418 219306 144764 66.01 Female 201721 188068 134041 71.27
Private Candidate
Male 12174 11032 4324 39.20 Female 9283 8417 3964 47.10
Overall 1243742 1197114 711238 59.41
Table 1. Grade-5 Result Summary Year-2015Gender
Table 2. Grade-8 Result Summary Year-2015
!
Gender Registered Appeared DeclaredPass *Pass %
Public School
Male 362856 357210 227830 63.78 Female 307197 303530 207381 68.32
Private School
Male 130031 119420 86079 72.08 Female 126983 117304 88397 75.36
Private Candidate
Male 20692 18794 7585 40.36 Female 14634 13617 6580 48.32
Overall 962393 929875 623852 67.09
*Candidates who obtained 33% marks were considered pass.
8
PUNJAB EXAMINATION COMMISSION

these exams were administered efficiently.
While the 2015 exam cycle showed a remarkable improvement in exam administration, conduct and marking over previous years – particularly in terms of ensuring secrecy of the exam papers prior to distribution, and more noticeably, in terms of a drastic reduction in the incidence of cheating – considerable gaps emerged in communication across the delivery chain, the supply of exam papers and exam and marking center staff, exam and marking center infrastructure, and most importantly, in training administered
to exam and marking center staff on exam conduct and marking protocols. These gaps were bridged by the unremitting efforts of PEC’s headquarters staff who did not allow these challenges to nullify the success of the several interventions introduced during the 2015 exam cycle to better manage the exam process.
9
REPORT ON GRADE 5 AND 8 EXAMS - 2015
This report is intended
to provide a baseline
against which
changes in student
performance can be
measured in the coming
years.
The depth and credibility of data from the 2015 exams can be attributed to the following key improvements in the content, conduct and marking of
exams, introduced as the first phase of the improvement process:
1. An online registration system was introduced for transparent registration of students
2. The exam questions provided optimal coverage of the curriculum, and were fair tests of topics covered during the academic year
3. The exams contained constructed response questions, which required students to demonstrate an understanding of curricular topics, but also multiple choice questions for students who knew their topics but could not express them in their own words
4. Exam questions were thoroughly pre-tested to ensure they rewarded high achievement in each subject
5. Six reliable and comparable versions of Grade 5 and four of Grade 8 exams were distributed to each examination room and used in a seating arrangement that minimized cheating among students
6. Just-in-time printing and extensive monitoring and inspection were introduced to minimize systemic cheating in exams
7. Clear and detailed marking rubrics were developed for consistency in marking, and syndicated marking1 was introduced to minimize human error.
As a result of these improvements, we are confident that PEC exams in 2015 fairly and thoroughly assessed student capabilities. This report is the first of its kind to be distributed by PEC. In the coming years, PEC aims to institutionalize reports on its annual exams, and in doing so, provide information on: how well students are performing in tested subjects, strengths and weaknesses in student knowledge and skills, and the
1 In syndicated marking each CRQ is marked by a different examiner. This evens out the effect of lenient and severe markers. A CRQ mark which is out of line with the others is remarked by a senior marker to ensure that it is fair.
comparative performance of sub-groups of students.
As in the past, students from both Grades 5 and 8 were tested in the following subjects: Urdu, English, Mathematics, Science and Islamiat. Papers for Science, Mathematics and Islamiat were printed in both English and Urdu languages, and students had a choice in which language to take their exam. All subjects were divided into two sections: an objective section containing multiple choice questions (MCQs) and a subjective section consisting of constructed response questions (CRQs). Both sections tested knowledge, understanding and application of different concepts.
There are two possible units to measure how well students are learning in their classrooms: the chapters of the Punjab Curriculum and Textbook Board’s (PCTB) textbooks and the national curriculum. The long-term intention of PEC is to measure educational growth in Punjab’s student body, which calls for a stable unit of measurement. PCTB’s textbooks change frequently. The curriculum evolves much more slowly. This report is therefore based on the curriculum and is intended to provide a baseline against which changes in student performance can be measured in the coming years.
A total of 1,197,114 students participated in Grade 5 exams, while a total of 92,987,5 students participated in Grade 8 exams. As reported earlier, multiple versions were developed of Grade 5 and four of Grade 8 exams, which were equal in terms of curricular coverage and difficulty levels. These versions not only helped minimize cheating but provided rich coverage of the curriculum and a wealth of data on student performance within different topics and SLOs prescribed in the curriculum. This report does not provide a micro level analysis on SLOs but it does distinguish between topics in which students performed well and those in which students performed poorly.
10
PUNJAB EXAMINATION COMMISSION
SECTION 2: STUDENT PERFORMANCE This section is divided into two sub-sections: the first covers student performance in Grade 5 and the second covers student performance in Grade 8.
11
REPORT ON GRADE 5 AND 8 EXAMS - 2015

GRADE 5Key findingsOverall, students performed best in Islamiat and worst in Science, and in all subjects their performance was better in MCQs than in CRQs. Girls performed better than boys and students in private schools performed better than students in government schools. Within cognitive domains, students fared better in questions that tested knowledge and were weaker in questions that tested higher order thinking skills.
Performance by subjectMean scores by subject are provided in the figure below:
Considering students’ performance in individual subjects, we can fairly assume from the above figure that their understanding of Islamiat and Urdu was far better than of Mathematics, English and Science. And within these subjects, students consistently performed comparatively better in MCQs which mostly tested knowledge.
In order to show the difference between student performance in MCQs and CRQs, we have placed two different charts below representing the mean score achieved for each subject. They clearly show that students performed much better in MCQs, obtaining more than 50% marks for all subjects as compared to their respective CRQ scores.
Subject-Wise Comparison of Students Achievements in Grade 5Mean % achievement score by subject area
SOURCE: PEC
Islamiat
6861
50 49 45
Urdu Mathematics English Science
Figure 1: Performance by subject
Figure 2: Performance in MCQs
Comparison of Mean Achievement Score in objective (MCQ) paperMean % Achievement Score
SOURCE: PEC
Urdu
74.58 70.03
62.12 58.1855.44
Islamiat Mathematics English Science
12
PUNJAB EXAMINATION COMMISSION
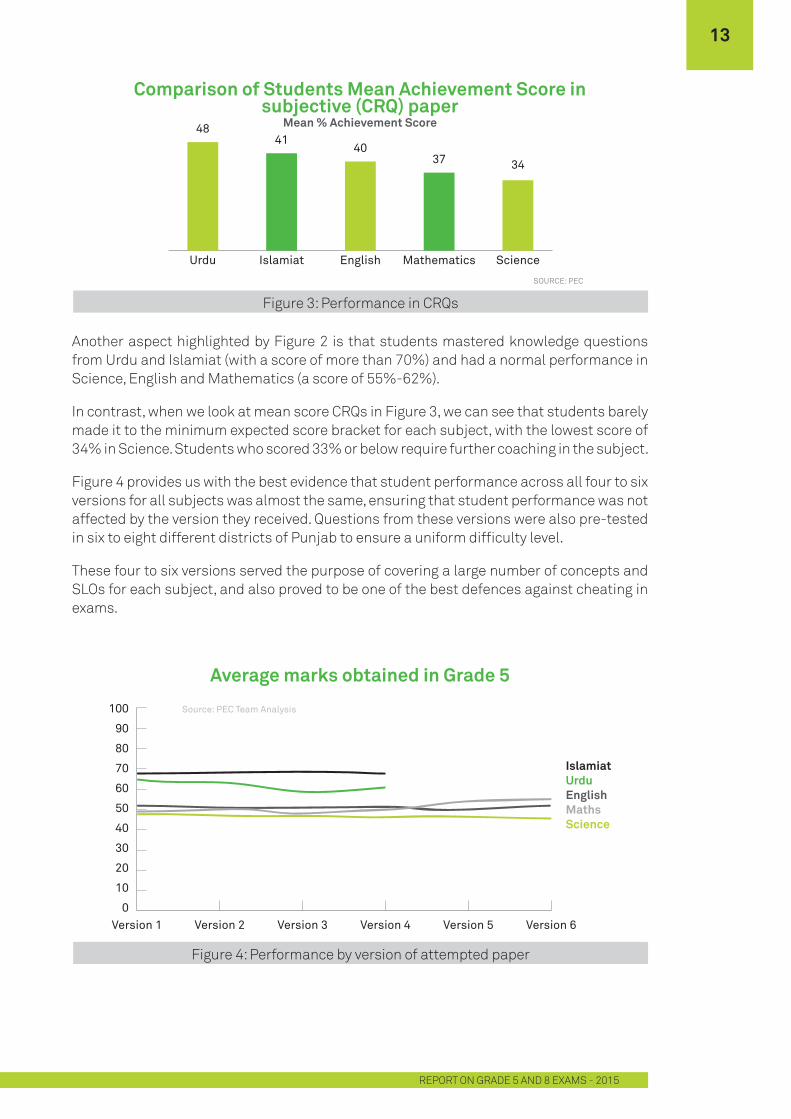
Comparison of Students Mean Achievement Score insubjective (CRQ) paper
Mean % Achievement Score
SOURCE: PEC
Urdu
4841
4037 34
Islamiat English Mathematics Science
Figure 3: Performance in CRQs
Figure 4: Performance by version of attempted paper
Another aspect highlighted by Figure 2 is that students mastered knowledge questions from Urdu and Islamiat (with a score of more than 70%) and had a normal performance in Science, English and Mathematics (a score of 55%-62%).
In contrast, when we look at mean score CRQs in Figure 3, we can see that students barely made it to the minimum expected score bracket for each subject, with the lowest score of 34% in Science. Students who scored 33% or below require further coaching in the subject.
Figure 4 provides us with the best evidence that student performance across all four to six versions for all subjects was almost the same, ensuring that student performance was not affected by the version they received. Questions from these versions were also pre-tested in six to eight different districts of Punjab to ensure a uniform difficulty level.
These four to six versions served the purpose of covering a large number of concepts and SLOs for each subject, and also proved to be one of the best defences against cheating in exams.
Average marks obtained in Grade 5
100
90
80
70
60
50
40
30
20
10
0
IslamiatUrduEnglishMathsScience
Version 1
Source: PEC Team Analysis
Version 2 Version 3 Version 4 Version 5 Version 6
1. In both Islamiyat and Urdu printing problems led to the administration of only four versions.
13
REPORT ON GRADE 5 AND 8 EXAMS - 2015
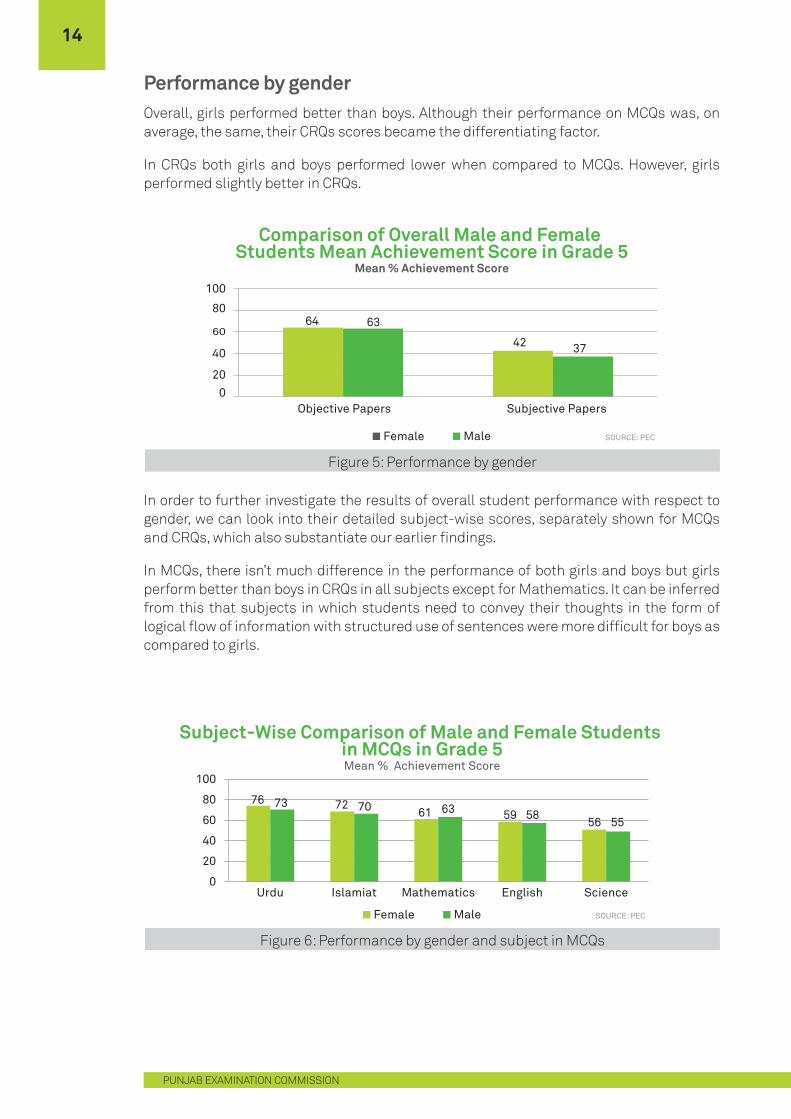
Performance by genderOverall, girls performed better than boys. Although their performance on MCQs was, on average, the same, their CRQs scores became the differentiating factor.
In CRQs both girls and boys performed lower when compared to MCQs. However, girls performed slightly better in CRQs.
In order to further investigate the results of overall student performance with respect to gender, we can look into their detailed subject-wise scores, separately shown for MCQs and CRQs, which also substantiate our earlier findings.
In MCQs, there isn’t much difference in the performance of both girls and boys but girls perform better than boys in CRQs in all subjects except for Mathematics. It can be inferred from this that subjects in which students need to convey their thoughts in the form of logical flow of information with structured use of sentences were more difficult for boys as compared to girls.
64
42
63
37
020
40
60
80
100
Objective Papers Subjective Papers
Comparison of Overall Male and Female Students Mean Achievement Score in Grade 5
Mean % Achievement Score
Female Male SOURCE: PEC
Figure 5: Performance by gender
Figure 6: Performance by gender and subject in MCQs
76 7261 59
56
73 70 63 5855
0
20
40
60
80
100
Urdu Islamiat Mathematics English Science
Subject-Wise Comparison of Male and Female Students in MCQs in Grade 5Mean % Achievement Score
Female Male SOURCE: PEC
14
PUNJAB EXAMINATION COMMISSION
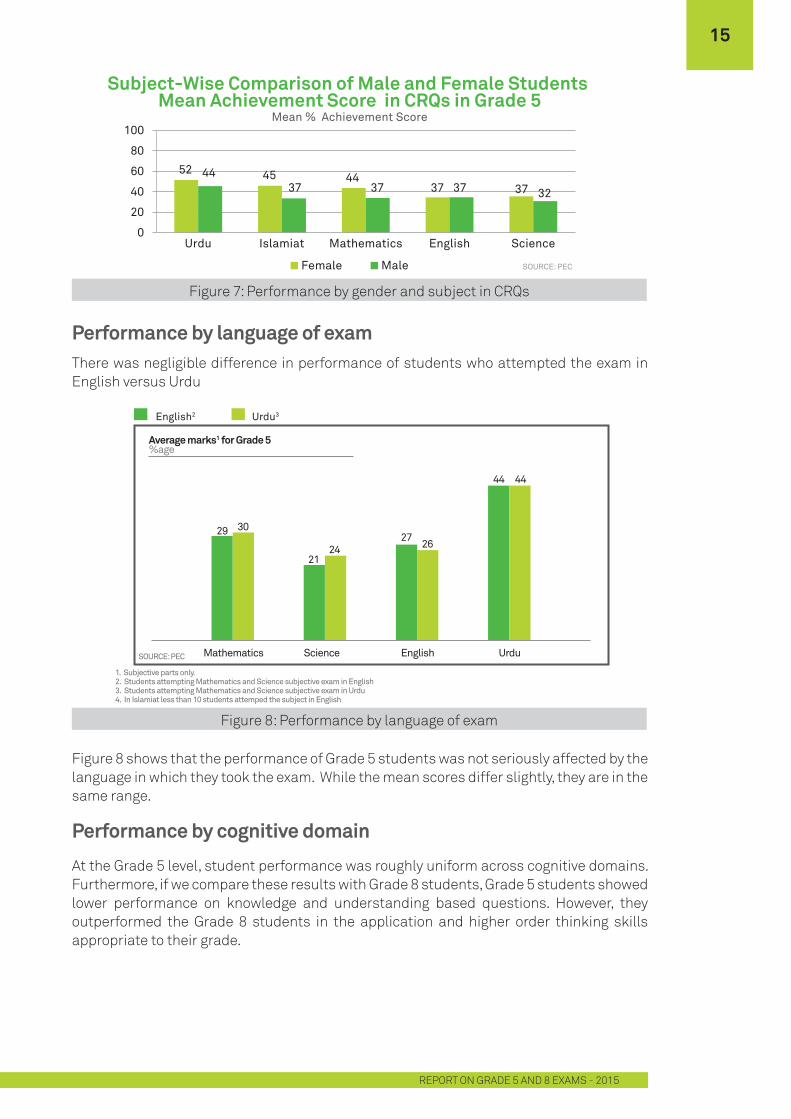
Figure 8 shows that the performance of Grade 5 students was not seriously affected by the language in which they took the exam. While the mean scores differ slightly, they are in the same range.
Performance by cognitive domain
At the Grade 5 level, student performance was roughly uniform across cognitive domains. Furthermore, if we compare these results with Grade 8 students, Grade 5 students showed lower performance on knowledge and understanding based questions. However, they outperformed the Grade 8 students in the application and higher order thinking skills appropriate to their grade.
Figure 7: Performance by gender and subject in CRQs
Figure 8: Performance by language of exam
52 45 4437 37
4437 37 37 32
0
20
40
60
80
100
Urdu Islamiat Mathematics English Science
Subject-Wise Comparison of Male and Female Students Mean Achievement Score in CRQs in Grade 5
Mean % Achievement Score
Female Male SOURCE: PEC
Performance by language of exam
English2
1. Subjective parts only.2. Students attempting Mathematics and Science subjective exam in English3. Students attempting Mathematics and Science subjective exam in Urdu4. In Islamiat less than 10 students attemped the subject in English
Urdu3
Mathematics Science English Urdu
Average marks1 for Grade 5%age
29 30
2124
2726
44 44
SOURCE: PEC
There was negligible difference in performance of students who attempted the exam in English versus Urdu
15
REPORT ON GRADE 5 AND 8 EXAMS - 2015
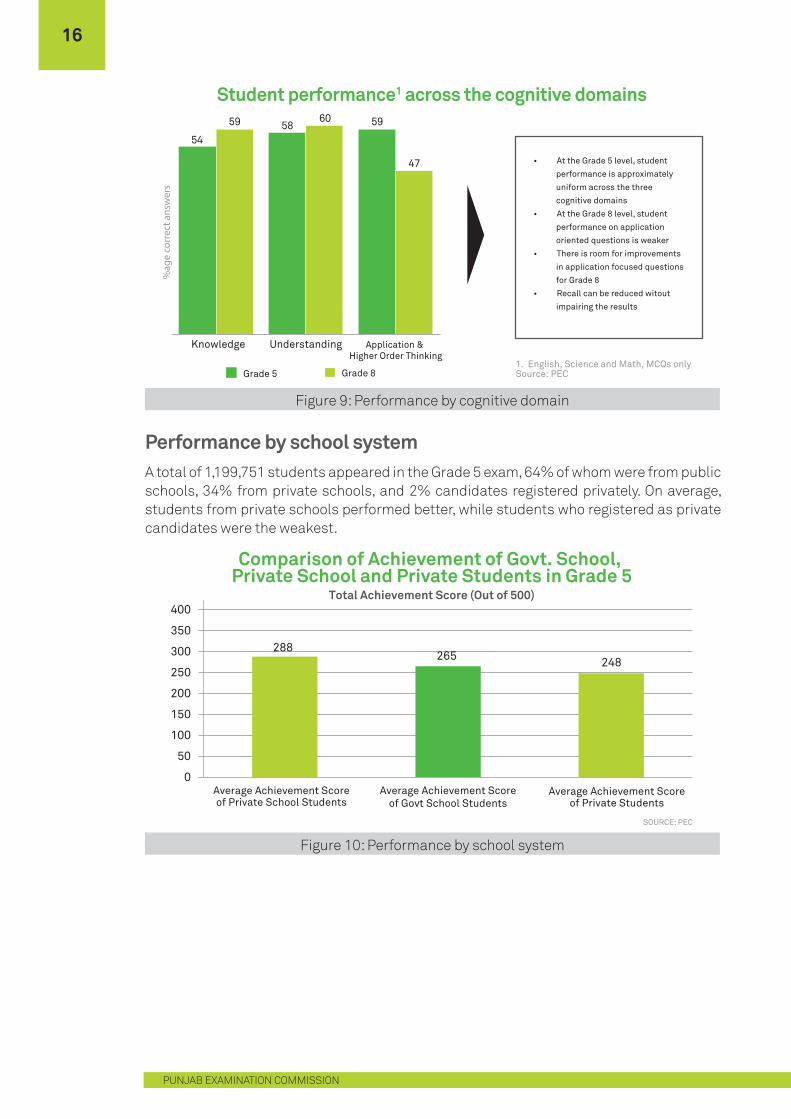
Performance by school systemA total of 1,199,751 students appeared in the Grade 5 exam, 64% of whom were from public schools, 34% from private schools, and 2% candidates registered privately. On average, students from private schools performed better, while students who registered as private candidates were the weakest.
Figure 9: Performance by cognitive domain
Figure 10: Performance by school system
Student performance1 across the cognitive domains
1. English, Science and Math, MCQs onlySource: PECGrade 5 Grade 8
595854
47
6059
Knowledge Understanding Application & Higher Order Thinking
%ag
e co
rrec
t ans
wer
s• At the Grade 5 level, student
performance is approximately
uniform across the three
cognitive domains
• At the Grade 8 level, student
performance on application
oriented questions is weaker
• There is room for improvements
in application focused questions
for Grade 8
• Recall can be reduced witout
impairing the results
288265 248
0
50
100
150
200
250
300
350
400
Average Achievement Scoreof Private School Students
Average Achievement Scoreof Govt School Students
Average Achievement Scoreof Private Students
Comparison of Achievement of Govt. School, Private School and Private Students in Grade 5
Total Achievement Score (Out of 500)
SOURCE: PEC
16
PUNJAB EXAMINATION COMMISSION
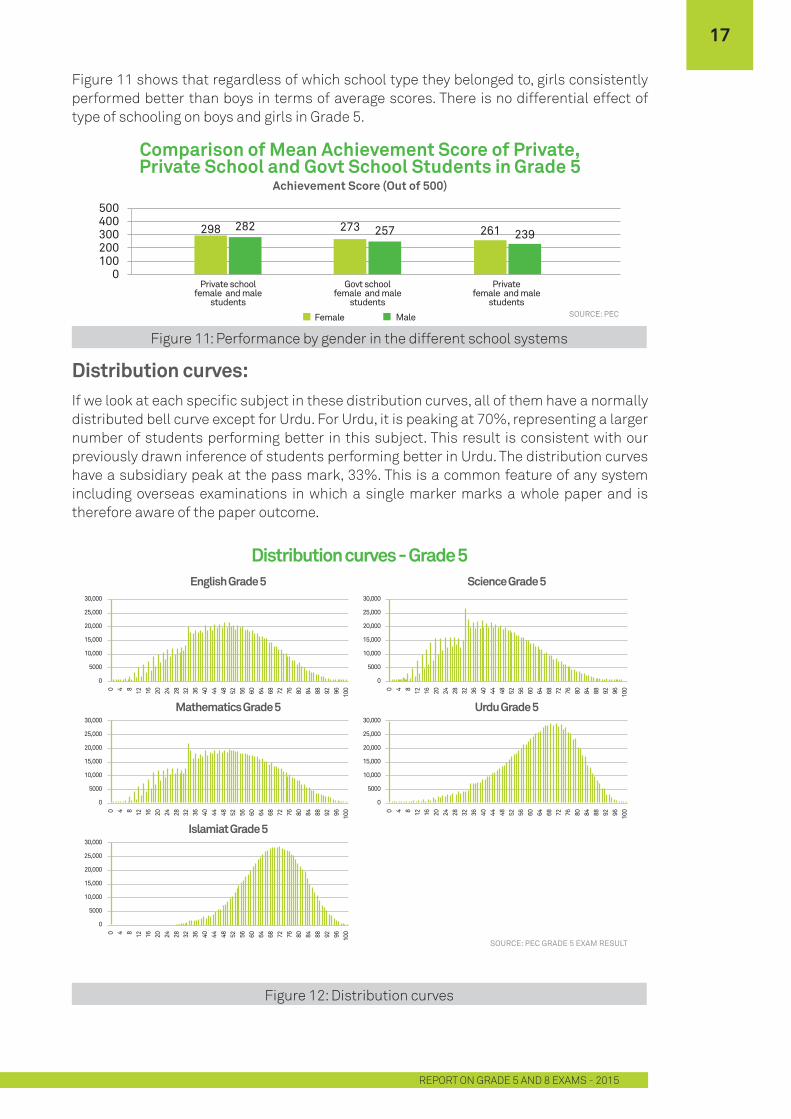
Distribution curves:If we look at each specific subject in these distribution curves, all of them have a normally distributed bell curve except for Urdu. For Urdu, it is peaking at 70%, representing a larger number of students performing better in this subject. This result is consistent with our previously drawn inference of students performing better in Urdu. The distribution curves have a subsidiary peak at the pass mark, 33%. This is a common feature of any system including overseas examinations in which a single marker marks a whole paper and is therefore aware of the paper outcome.
Figure 11 shows that regardless of which school type they belonged to, girls consistently performed better than boys in terms of average scores. There is no differential effect of type of schooling on boys and girls in Grade 5.
Figure 11: Performance by gender in the different school systems
Figure 12: Distribution curves
Distribution curves - Grade 5
30,000
25,000
20,000
15,000
10,000
5000
0
0 4 8 12 16 20 24 28 32 36 40 44 48 52 56 60 64 68 72 76 80 84 88 92 96 100
English Grade 5
30,000
25,000
20,000
15,000
10,000
5000
0
0 4 8 12 16 20 24 28 32 36 40 44 48 52 56 60 64 68 72 76 80 84 88 92 96 100
Mathematics Grade 5
30,000
25,000
20,000
15,000
10,000
5000
0
0 4 8 12 16 20 24 28 32 36 40 44 48 52 56 60 64 68 72 76 80 84 88 92 96 100
Islamiat Grade 5
30,000
25,000
20,000
15,000
10,000
5000
0
0 4 8 12 16 20 24 28 32 36 40 44 48 52 56 60 64 68 72 76 80 84 88 92 96 100
Urdu Grade 5
30,000
25,000
20,000
15,000
10,000
5000
0
0 4 8 12 16 20 24 28 32 36 40 44 48 52 56 60 64 68 72 76 80 84 88 92 96 100
Science Grade 5
SOURCE: PEC GRADE 5 EXAM RESULT
0100200300400500
Private schoolfemale and male
students
298 282
Privatefemale and male
students
261 239
Govt schoolfemale and male
students
273 257
Comparison of Mean Achievement Score of Private,Private School and Govt School Students in Grade 5
Achievement Score (Out of 500)
SOURCE: PECFemale Male
17
REPORT ON GRADE 5 AND 8 EXAMS - 2015
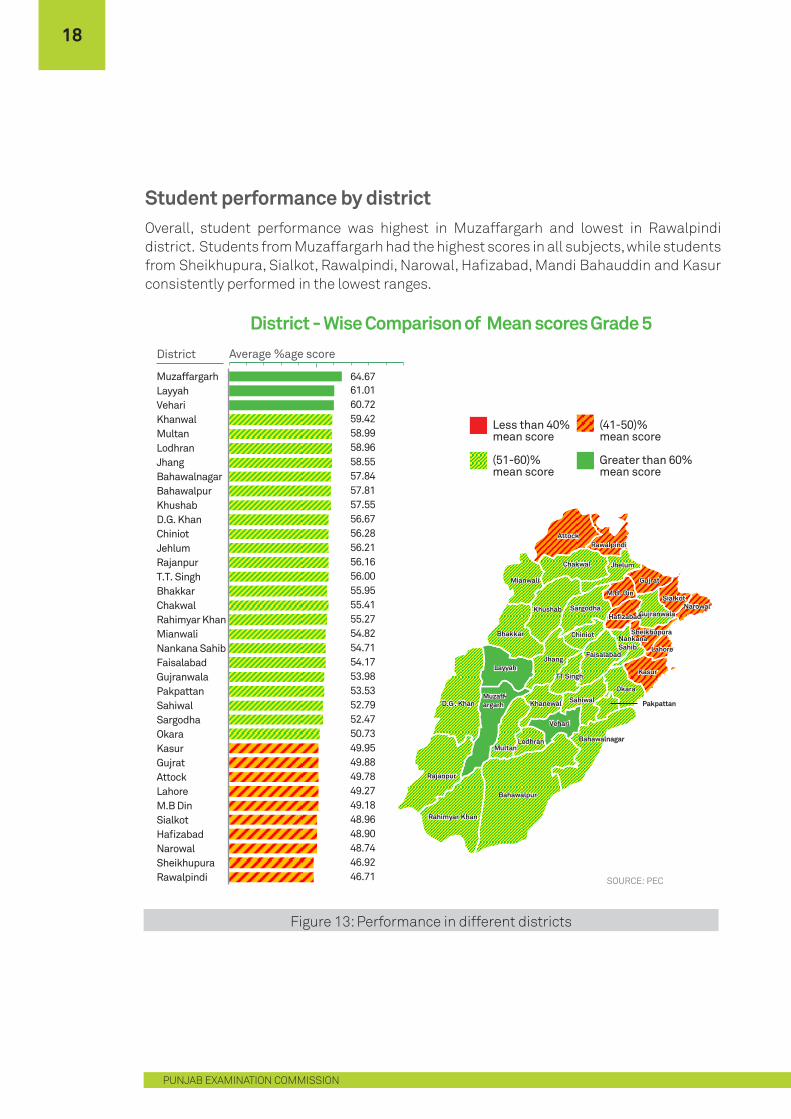
Student performance by district Overall, student performance was highest in Muzaffargarh and lowest in Rawalpindi district. Students from Muzaffargarh had the highest scores in all subjects, while students from Sheikhupura, Sialkot, Rawalpindi, Narowal, Hafizabad, Mandi Bahauddin and Kasur consistently performed in the lowest ranges.
Figure 13: Performance in different districts
SOURCE: PEC
District - Wise Comparison of Mean scores Grade 5
Greater than 60%mean score
Less than 40%mean score
(51-60)%mean score
(41-50)%mean score
District
46.7146.9248.7448.9048.9649.1849.2749.7849.8849.9550.7352.4752.7953.5353.9854.1754.7154.8255.2755.4155.9556.0056.1656.2156.2856.6757.5557.8157.8458.5558.9658.9959.4260.7261.0164.67
Average %age score
Hafizabad
Bahawalpur
Rajanpur
Bahawalnagar
D.G . Khan
Rahimyar Khan
Rawalpindi
Bhakkar
Layyah
Attock
Muzaff-argarh
Khushab
Chakwal
Lodhran
Vehari
Multan
Mianwali
Jhelum
Gujrat
Jhang
Chiniot
SahiwalKhanewal
TT Singh
Okara
Kasur
NarowalSialkot
Gujranwala
Lahore
Pakpattan
Faisalabad
Sargodha
M.B. Din
SheikhupuraNankanaSahib
MuzaffargarhLayyahVehariKhanwalMultanLodhranJhangBahawalnagarBahawalpurKhushabD.G. KhanChiniotJehlumRajanpurT.T. SinghBhakkarChakwalRahimyar KhanMianwaliNankana SahibFaisalabadGujranwalaPakpattanSahiwalSargodhaOkaraKasurGujratAttockLahoreM.B DinSialkotHafizabadNarowalSheikhupuraRawalpindi
18
PUNJAB EXAMINATION COMMISSION

On average, almost all the districts have scored above 50% in Urdu except for Narowal, but none of the districts was able to achieve an average score of over 70%.
Figure 14: Performance by district in Urdu
SOURCE: PEC
District - Wise Comparison of Students Achievement in Urdu in Grade 5District
48.5453.7154.3554.6654.7754.8855.4156.2358.5558.8858.9658.9859.1259.6360.6460.8760.960.9261.962.1262.4362.5763.0563.1363.1963.2663.2663.4263.9164.1964.4465.4765.5666.267.969.66
Average %age score
Hafizabad
Bahawalpur
Rajanpur
Bahawalnagar
D.G . Khan
Rahimyar Khan
Rawalpindi
Bhakkar
Layyah
Attock
Muzaff-argarh
Khushab
Chakwal
Lodhran
Vehari
Multan
Mianwali
Jhelum
Gujrat
Jhang
Chiniot
SahiwalKhanewal
TT Singh
Okara
Kasur
NarowalSialkot
Gujranwala
Lahore
Pakpattan
Faisalabad
Sargodha
M.B. Din
SheikhupuraNankanaSahib
Hafizabad
Bahawalpur
Rajanpur
Bahawalnagar
D.G . Khan
Rahimyar Khan
Rawalpindi
Bhakkar
Layyah
Attock
Muzaff-argarh
Khushab
Chakwal
Lodhran
Vehari
Multan
Mianwali
Jhelum
Gujrat
Jhang
Chiniot
SahiwalKhanewal
TT Singh
Okara
Kasur
NarowalSialkot
Gujranwala
Lahore
Pakpattan
Faisalabad
Sargodha
M.B. Din
SheikhupuraNankanaSahib
MuzaffargarhVehariMultanBahawalpurKhanewalPakpattanRahimyar KhanLodhranJehlumKasurHafizabadFaisalabadRajanpurLayyahJhangD.G. KhanBahawalnagarChakwalNankana SahibMianwaliBhakkarSargodhaGujranwalaM.B. DinAttockT.T. SingKhushabLahoreChiniotSheikhupuraSahiwalRawalpindiOkaraGujratSialkotNarowal
Greater than 50%mean score
Less than 33%mean score
(41-50)%mean score
(33-40)%mean score
19
REPORT ON GRADE 5 AND 8 EXAMS - 2015
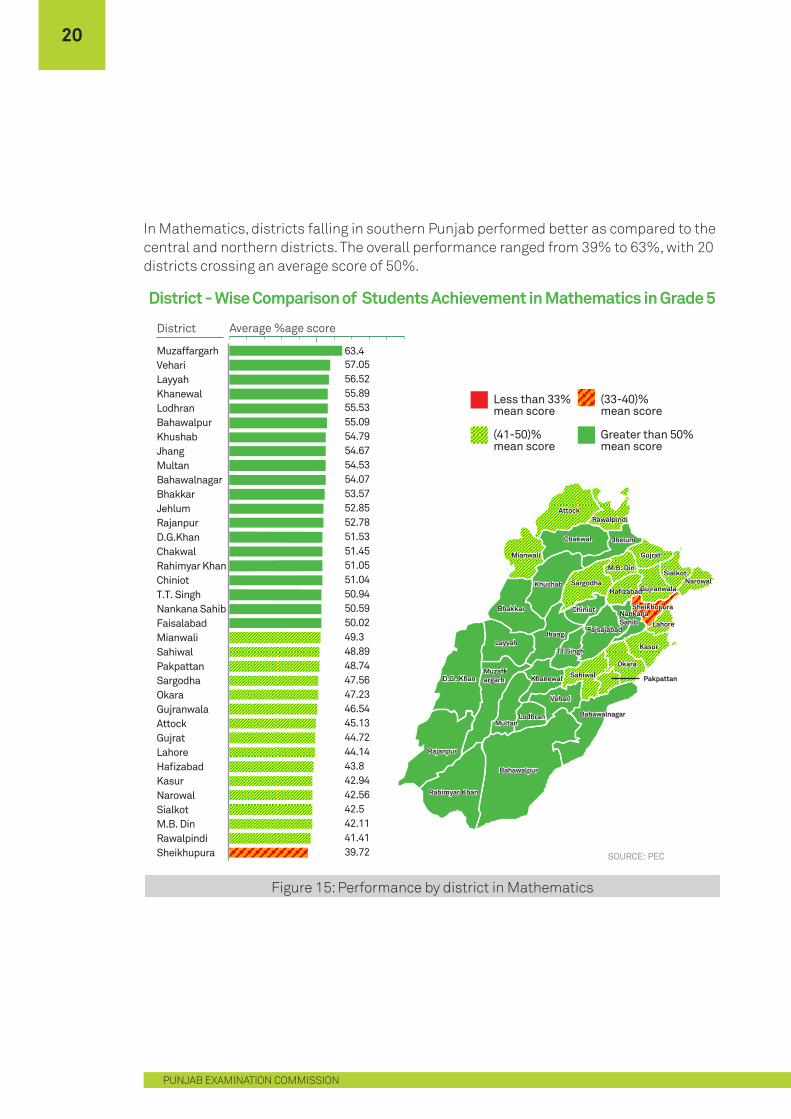
In Mathematics, districts falling in southern Punjab performed better as compared to the central and northern districts. The overall performance ranged from 39% to 63%, with 20 districts crossing an average score of 50%.
Figure 15: Performance by district in Mathematics
SOURCE: PEC
District - Wise Comparison of Students Achievement in Mathematics in Grade 5
District
39.7241.4142.1142.542.5642.9443.844.1444.7245.1346.5447.2347.5648.7448.8949.350.0250.5950.9451.0451.0551.4551.5352.7852.8553.5754.0754.5354.6754.7955.0955.5355.8956.5257.0563.4
Average %age score
Hafizabad
Bahawalpur
Rajanpur
Bahawalnagar
D.G . Khan
Rahimyar Khan
Rawalpindi
Bhakkar
Layyah
Attock
Muzaff-argarh
Khushab
Chakwal
Lodhran
Vehari
Multan
Mianwali
Jhelum
Gujrat
Jhang
Chiniot
SahiwalKhanewal
TT Singh
Okara
Kasur
NarowalSialkot
Gujranwala
Lahore
Pakpattan
Faisalabad
Sargodha
M.B. Din
SheikhupuraNankanaSahib
Hafizabad
Bahawalpur
Rajanpur
Bahawalnagar
D.G . Khan
Rahimyar Khan
Rawalpindi
Bhakkar
Layyah
Attock
Muzaff-argarh
Khushab
Chakwal
Lodhran
Vehari
Multan
Mianwali
Jhelum
Gujrat
Jhang
Chiniot
SahiwalKhanewal
TT Singh
Okara
Kasur
NarowalSialkot
Gujranwala
Lahore
Pakpattan
Faisalabad
Sargodha
M.B. Din
SheikhupuraNankanaSahib
MuzaffargarhVehariLayyahKhanewalLodhranBahawalpurKhushabJhangMultanBahawalnagarBhakkarJehlumRajanpurD.G.KhanChakwalRahimyar KhanChiniotT.T. SinghNankana SahibFaisalabadMianwaliSahiwalPakpattanSargodhaOkaraGujranwalaAttockGujratLahoreHafizabadKasurNarowalSialkotM.B. DinRawalpindiSheikhupura
Greater than 50%mean score
Less than 33%mean score
(41-50)%mean score
(33-40)%mean score
20
PUNJAB EXAMINATION COMMISSION
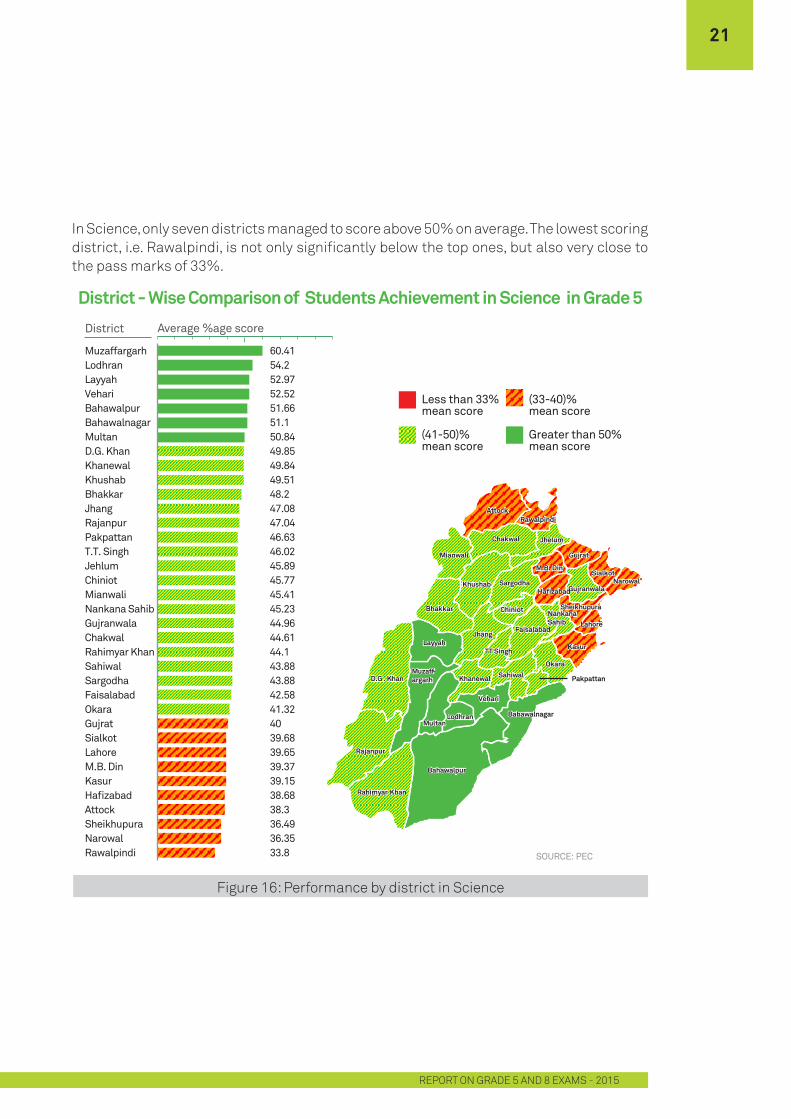
In Science, only seven districts managed to score above 50% on average. The lowest scoring district, i.e. Rawalpindi, is not only significantly below the top ones, but also very close to the pass marks of 33%.
Figure 16: Performance by district in Science
SOURCE: PEC
District - Wise Comparison of Students Achievement in Science in Grade 5
Greater than 50%mean score
Less than 33%mean score
(41-50)%mean score
(33-40)%mean score
District
60.4154.252.9752.5251.6651.150.8449.8549.8449.5148.247.0847.0446.6346.0245.8945.7745.4145.2344.9644.6144.143.8843.8842.5841.324039.6839.6539.3739.1538.6838.336.4936.3533.8
Average %age score
Hafizabad
Bahawalpur
Rajanpur
Bahawalnagar
D.G . Khan
Rahimyar Khan
Rawalpindi
Bhakkar
Layyah
Attock
Muzaff-argarh
Khushab
Chakwal
Lodhran
Vehari
Multan
Mianwali
Jhelum
Gujrat
Jhang
Chiniot
SahiwalKhanewal
TT Singh
Okara
Kasur
NarowalSialkot
Gujranwala
Lahore
Pakpattan
Faisalabad
Sargodha
M.B. Din
SheikhupuraNankanaSahib
Hafizabad
Bahawalpur
Rajanpur
Bahawalnagar
D.G . Khan
Rahimyar Khan
Rawalpindi
Bhakkar
Layyah
Attock
Muzaff-argarh
Khushab
Chakwal
Lodhran
Vehari
Multan
Mianwali
Jhelum
Gujrat
Jhang
Chiniot
SahiwalKhanewal
TT Singh
Okara
Kasur
NarowalSialkot
Gujranwala
Lahore
Pakpattan
Faisalabad
Sargodha
M.B. Din
SheikhupuraNankanaSahib
MuzaffargarhLodhranLayyahVehariBahawalpurBahawalnagarMultanD.G. KhanKhanewalKhushabBhakkarJhangRajanpurPakpattanT.T. SinghJehlumChiniotMianwaliNankana SahibGujranwalaChakwalRahimyar KhanSahiwalSargodhaFaisalabadOkaraGujratSialkotLahoreM.B. DinKasurHafizabadAttockSheikhupuraNarowalRawalpindi
21
REPORT ON GRADE 5 AND 8 EXAMS - 2015

In English, the average score ranged from 41% to 61% but only 15 districts were able to achieve a score of more than 50%.
Figure 17: Performance by district in English
SOURCE: PEC
District - Wise Comparison of Students Achievement in English in Grade 5
District
61.2257.6855.3754.4754.0553.4453.2853.1352.8252.6752.652.4450.8950.6950.2349.7949.7949.4748.9648.4248.0647.8347.7745.5845.4145.3845.344.6343.7943.3443.0542.9942.5742.5442.2141.51
MuzaffargarhJhangVehariJehlumLayyahKhanewalKhushabMultanChiniotChakwalT.T. SinghGujranwalaFaisalabadBahawalnagarMianwaliNarowalLodhranRahimyar KhanBahawalpurNankana SahibD.G. KhanRajanpurBhakkarAttockSargodhaLahoreSahiwalKasurSialkotRawalpindiGujratSheikhupuraM.B. DinPakpattanHafizabadOkara
Average %age score
Hafizabad
Bahawalpur
Rajanpur
Bahawalnagar
D.G . Khan
Rahimyar Khan
Rawalpindi
Bhakkar
Layyah
Attock
Muzaff-argarh
Khushab
Chakwal
Lodhran
Vehari
Multan
Mianwali
Jhelum
Gujrat
Jhang
Chiniot
SahiwalKhanewal
TT Singh
Okara
Kasur
NarowalSialkot
Gujranwala
Lahore
Pakpattan
Faisalabad
Sargodha
M.B. Din
SheikhupuraNankanaSahib
Hafizabad
Bahawalpur
Rajanpur
Bahawalnagar
D.G . Khan
Rahimyar Khan
Rawalpindi
Bhakkar
Layyah
Attock
Muzaff-argarh
Khushab
Chakwal
Lodhran
Vehari
Multan
Mianwali
Jhelum
Gujrat
Jhang
Chiniot
SahiwalKhanewal
TT Singh
Okara
Kasur
NarowalSialkot
Gujranwala
Lahore
Pakpattan
Faisalabad
Sargodha
M.B. Din
SheikhupuraNankanaSahib
Greater than 50%mean score
Less than 33%mean score
(41-50)%mean score
(33-40)%mean score
22
PUNJAB EXAMINATION COMMISSION

In Islamiat, all the districts generally performed very well. The average scores ranged from 77% in district Muzaffargarh to 58% in district Rawalpindi and out of 36 districts, eleven managed to score more than 70%.
Figure 18: Performance by district in Islamiat
SOURCE: PEC
District - Wise Comparison of Students Achievement in Islamiat in Grade 5
District
77.3174.3773.8872.4872.1771.8171.7670.9570.7570.5370.1669.6569.2469.2369.1768.5767.9867.2367.1266.9866.265.6765.3465.3365.126563.963.4163.2262.9762.9362.8260.6159.7859.5558.23
MuzaffargarhLayyahRajanpurVehariPakpattanMultan T.T. SinghKhanewalLodhranSahiwalD.G. KhanRahimyar KhanChiniotSargodhaJhangBahawalpurBahawalpurJehlumChakwalKhushabBhakkarFaisalabadNankana SahibMianwaliOkaraGujranwalaHafizabadNarowalGujratAttockM.B. DinSialkotKasurSheikhupuraLahoreRawalpindi
Average %age score
Hafizabad
Bahawalpur
Rajanpur
Bahawalnagar
D.G . Khan
Rahimyar Khan
Rawalpindi
Bhakkar
Layyah
Attock
Muzaff-argarh
Khushab
Chakwal
Lodhran
Vehari
Multan
Mianwali
Jhelum
Gujrat
Jhang
Chiniot
SahiwalKhanewal
TT Singh
Okara
Kasur
NarowalSialkot
Gujranwala
Lahore
Pakpattan
Faisalabad
Sargodha
M.B. Din
SheikhupuraNankanaSahib
Hafizabad
Bahawalpur
Rajanpur
Bahawalnagar
D.G . Khan
Rahimyar Khan
Rawalpindi
Bhakkar
Layyah
Attock
Muzaff-argarh
Khushab
Chakwal
Lodhran
Vehari
Multan
Mianwali
Jhelum
Gujrat
Jhang
Chiniot
SahiwalKhanewal
TT Singh
Okara
Kasur
NarowalSialkot
Gujranwala
Lahore
Pakpattan
Faisalabad
Sargodha
M.B. Din
SheikhupuraNankanaSahib
Greater than 50%mean score
Less than 33%mean score
(41-50)%mean score
(33-40)%mean score
23
REPORT ON GRADE 5 AND 8 EXAMS - 2015
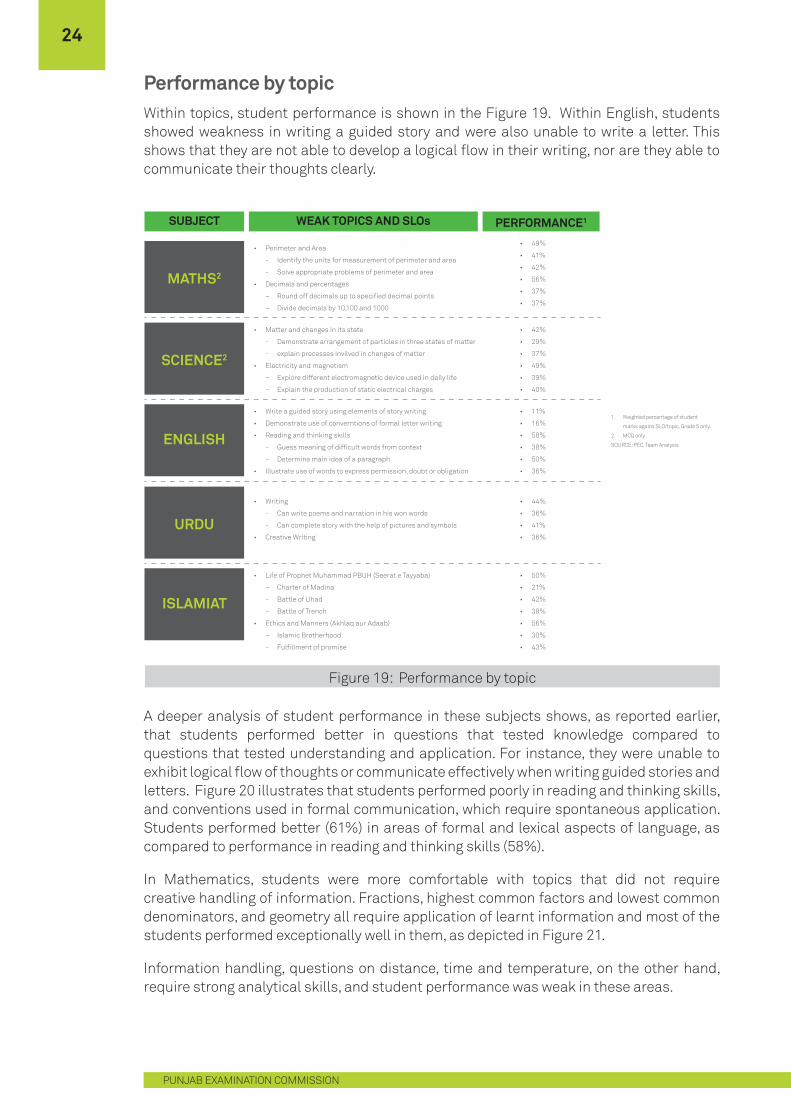
Performance by topicWithin topics, student performance is shown in the Figure 19. Within English, students showed weakness in writing a guided story and were also unable to write a letter. This shows that they are not able to develop a logical flow in their writing, nor are they able to communicate their thoughts clearly.
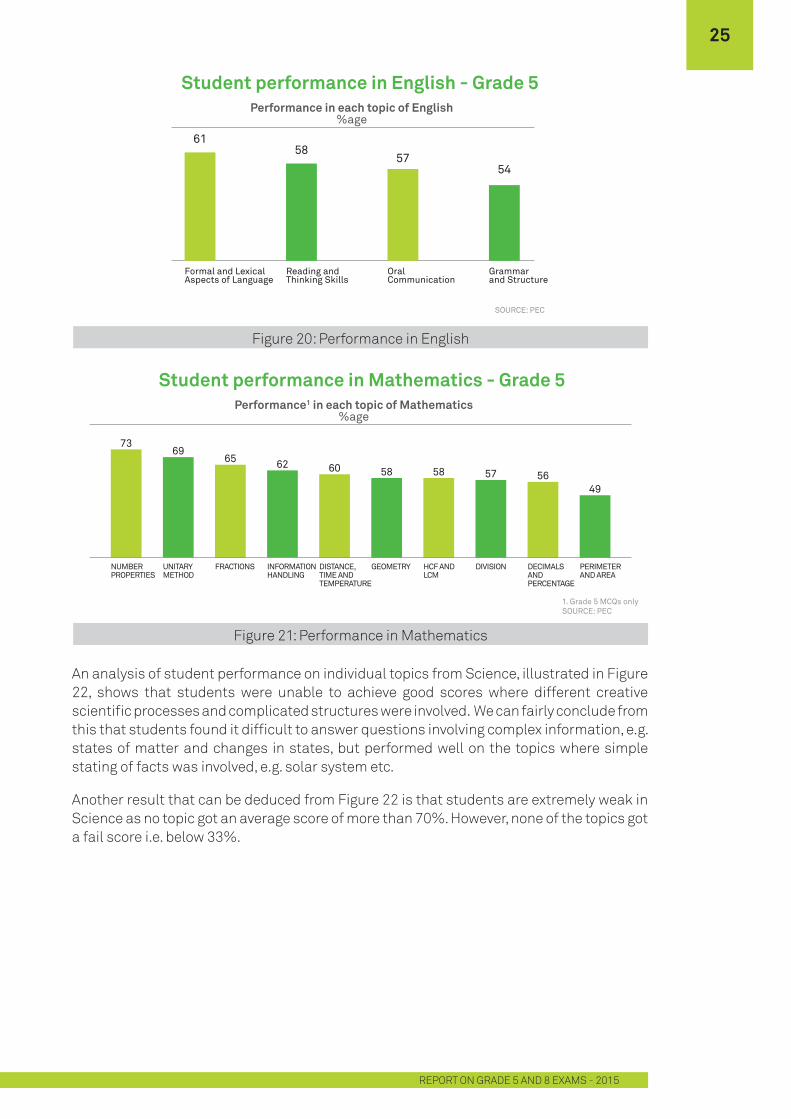
A deeper analysis of student performance in these subjects shows, as reported earlier, that students performed better in questions that tested knowledge compared to questions that tested understanding and application. For instance, they were unable to exhibit logical flow of thoughts or communicate effectively when writing guided stories and letters. Figure 20 illustrates that students performed poorly in reading and thinking skills, and conventions used in formal communication, which require spontaneous application. Students performed better (61%) in areas of formal and lexical aspects of language, as compared to performance in reading and thinking skills (58%).
In Mathematics, students were more comfortable with topics that did not require creative handling of information. Fractions, highest common factors and lowest common denominators, and geometry all require application of learnt information and most of the students performed exceptionally well in them, as depicted in Figure 21.
Information handling, questions on distance, time and temperature, on the other hand, require strong analytical skills, and student performance was weak in these areas.
Figure 19: Performance by topic
SUBJECT
MATHS2
SCIENCE2
ENGLISH
PERFORMANCE1WEAK TOPICS AND SLOs
• Perimeter and Area
- Identify the units for measurement of perimeter and area
- Solve appropriate problems of perimeter and area
• Decimals and percentages
− Round off decimals up to specified decimal points
− Divide decimals by 10,100 and 1000
• 49%
• 41%
• 42%
• 56%
• 37%
• 37%
• Matter and changes in its state
- Demonstrate arrangement of particles in three states of matter
- explain precesses invilved in changes of matter
• Electricity and magnetism
− Explore different electromagnetic device used in daily life
− Explain the production of static electrical charges
• 42%
• 29%
• 37%
• 49%
• 39%
• 40%
• Write a guided story using elements of story writing
• Demonstrate use of converntions of formal letter writing
• Reading and thinking skills
− Guess meaning of difficult words from context
− Determine main idea of a paragraph
• Illustrate use of words to express permission, doubt or obligation
• 11%
• 16%
• 58%
• 38%
• 50%
• 36%
URDU
ISLAMIAT
• Writing
- Can write poems and narration in his won words
- Can complete story with the help of pictures and symbols
• Creative Writing
• 44%
• 36%
• 41%
• 36%
• Life of Prophet Muhammad PBUH (Seerat e Tayyaba)
− Charter of Madina
− Battle of Uhad
− Battle of Trench
• Ethics and Manners (Akhlaq aur Adaab)
− Islamic Brotherhood
− Fulfillment of promise
• 50%
• 21%
• 42%
• 38%
• 56%
• 30%
• 43%
1. Weighted percentage of student
marks agains SLO/topic, Grade 5 only.
2. MCQ only
SOURCE: PEC, Team Analysis
24
PUNJAB EXAMINATION COMMISSION
An analysis of student performance on individual topics from Science, illustrated in Figure 22, shows that students were unable to achieve good scores where different creative scientific processes and complicated structures were involved. We can fairly conclude from this that students found it difficult to answer questions involving complex information, e.g. states of matter and changes in states, but performed well on the topics where simple stating of facts was involved, e.g. solar system etc.
Another result that can be deduced from Figure 22 is that students are extremely weak in Science as no topic got an average score of more than 70%. However, none of the topics got a fail score i.e. below 33%.
Figure 20: Performance in English
Student performance in English - Grade 5Performance in each topic of English
%age
SOURCE: PEC
Formal and LexicalAspects of Language
Reading andThinking Skills
OralCommunication
Grammarand Structure
6158
57 54
Figure 21: Performance in Mathematics
Student performance in Mathematics - Grade 5Performance1 in each topic of Mathematics
%age
NUMBERPROPERTIES
UNITARYMETHOD
FRACTIONS INFORMATIONHANDLING
DISTANCE,TIME ANDTEMPERATURE
GEOMETRY HCF ANDLCM
DIVISION DECIMALSANDPERCENTAGE
PERIMETERAND AREA
7369
65 62 60 58 58 57 5649
1. Grade 5 MCQs onlySOURCE: PEC
25
REPORT ON GRADE 5 AND 8 EXAMS - 2015
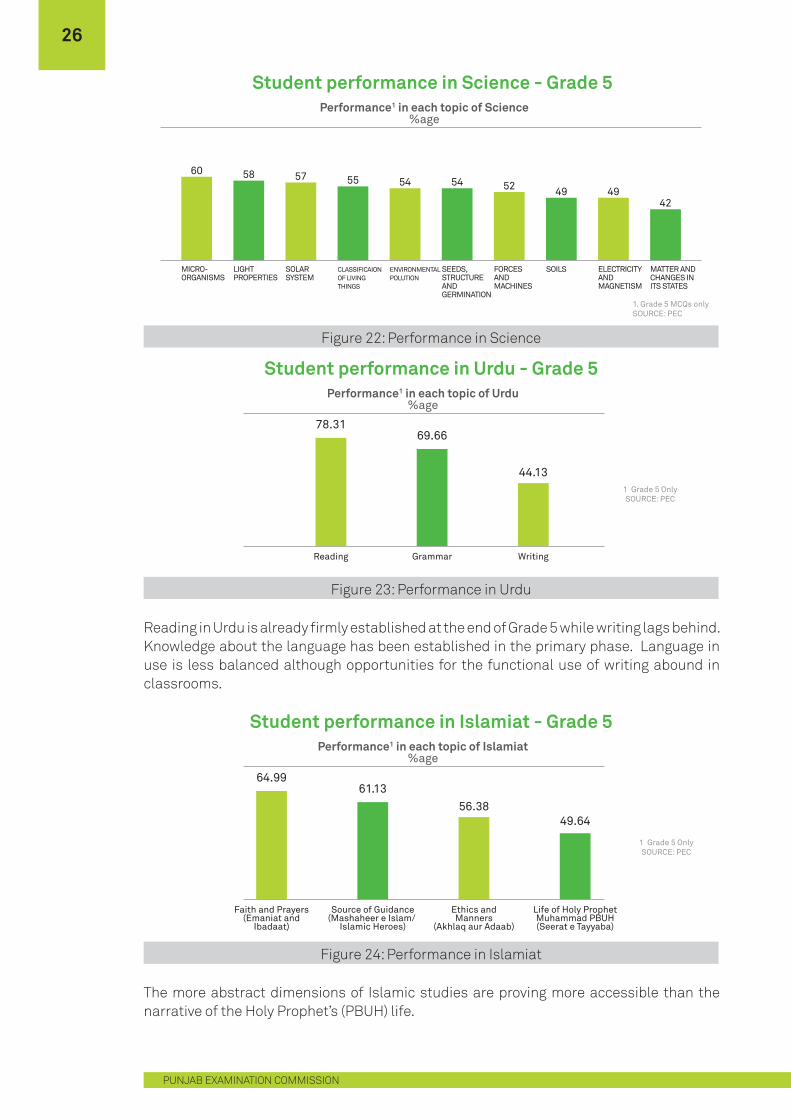
Figure 22: Performance in Science
Student performance in Science - Grade 5Performance1 in each topic of Science
%age
60 58 57 55 54 54 52 49 4942
1. Grade 5 MCQs onlySOURCE: PEC
MICRO-ORGANISMS
LIGHTPROPERTIES
SOLARSYSTEM
CLASSIFICAIONOF LIVINGTHINGS
ENVIRONMENTALPOLUTION
SEEDS,STRUCTUREANDGERMINATION
FORCESANDMACHINES
SOILS ELECTRICITYANDMAGNETISM
MATTER AND CHANGES INITS STATES
Figure 24: Performance in Islamiat
Student performance in Islamiat - Grade 5Performance1 in each topic of Islamiat
%age
1 Grade 5 OnlySOURCE: PEC
Faith and Prayers(Emaniat and
Ibadaat)
Source of Guidance(Mashaheer e Islam/
Islamic Heroes)
Ethics andManners
(Akhlaq aur Adaab)
Life of Holy ProphetMuhammad PBUH(Seerat e Tayyaba)
64.9961.13
56.38
49.64
Figure 23: Performance in Urdu
Student performance in Urdu - Grade 5Performance1 in each topic of Urdu
%age
1 Grade 5 OnlySOURCE: PEC
Reading
78.31
Grammar
69.66
Writing
44.13
Reading in Urdu is already firmly established at the end of Grade 5 while writing lags behind. Knowledge about the language has been established in the primary phase. Language in use is less balanced although opportunities for the functional use of writing abound in classrooms.
The more abstract dimensions of Islamic studies are proving more accessible than the narrative of the Holy Prophet’s (PBUH) life.
26
PUNJAB EXAMINATION COMMISSION

GRADE 8Key findingsStudent learning levels in Grade 8 PEC exam showed patterns similar to that of the Grade 5 exam. The highest performing subject was Islamiat, whereas Science proved to be the weakest. Students scored better on MCQs than on CRQs. In all three schooling systems (government schools, private schools and private individuals), girls performed better than boys. Within cognitive domains, students fared best in questions that tested knowledge and had difficulty with questions that tested application.
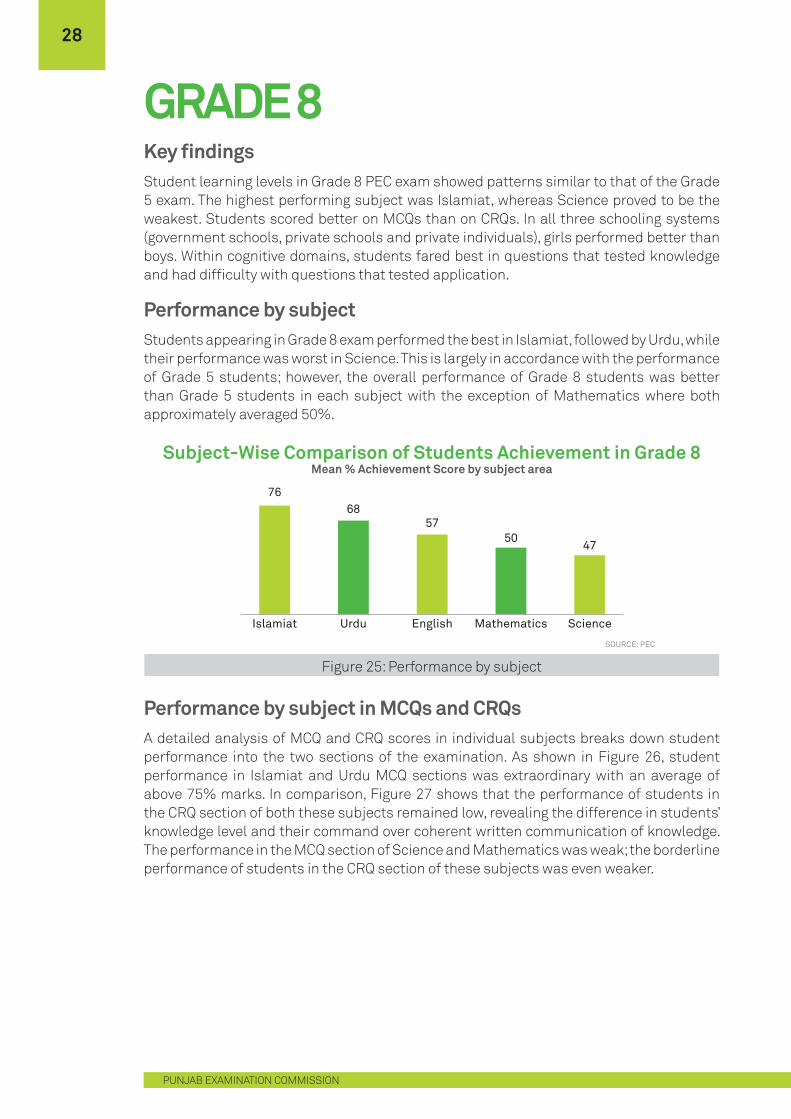
Performance by subjectStudents appearing in Grade 8 exam performed the best in Islamiat, followed by Urdu, while their performance was worst in Science. This is largely in accordance with the performance of Grade 5 students; however, the overall performance of Grade 8 students was better than Grade 5 students in each subject with the exception of Mathematics where both approximately averaged 50%.
Performance by subject in MCQs and CRQsA detailed analysis of MCQ and CRQ scores in individual subjects breaks down student performance into the two sections of the examination. As shown in Figure 26, student performance in Islamiat and Urdu MCQ sections was extraordinary with an average of above 75% marks. In comparison, Figure 27 shows that the performance of students in the CRQ section of both these subjects remained low, revealing the difference in students’ knowledge level and their command over coherent written communication of knowledge. The performance in the MCQ section of Science and Mathematics was weak; the borderline performance of students in the CRQ section of these subjects was even weaker.
Subject-Wise Comparison of Students Achievement in Grade 8Mean % Achievement Score by subject area
SOURCE: PEC
Islamiat
7668
5750
47
Urdu English Mathematics Science
Figure 25: Performance by subject
28
PUNJAB EXAMINATION COMMISSION
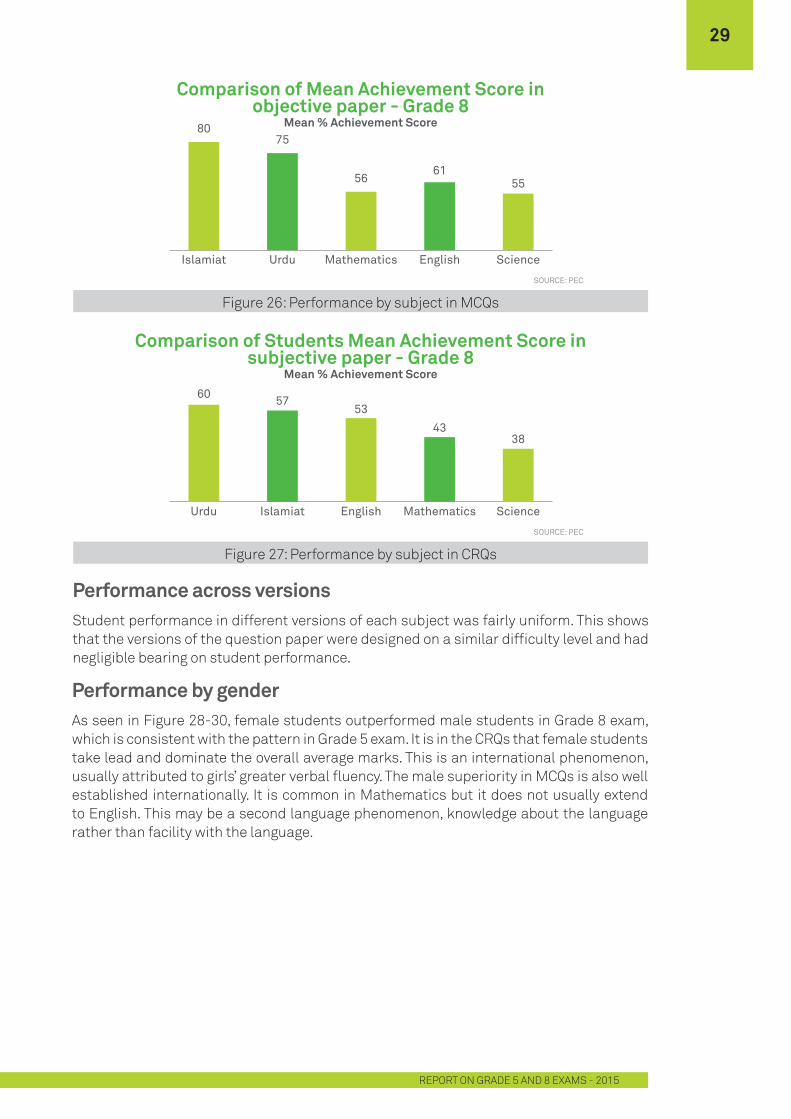
Figure 26: Performance by subject in MCQs
Figure 27: Performance by subject in CRQs
Comparison of Mean Achievement Score inobjective paper - Grade 8
Mean % Achievement Score
SOURCE: PEC
Islamiat
8075
5661
55
Urdu Mathematics English Science
Comparison of Students Mean Achievement Score insubjective paper - Grade 8
Mean % Achievement Score
SOURCE: PEC
Urdu
60 5753
4338
Islamiat English Mathematics Science
Performance across versionsStudent performance in different versions of each subject was fairly uniform. This shows that the versions of the question paper were designed on a similar difficulty level and had negligible bearing on student performance.
Performance by genderAs seen in Figure 28-30, female students outperformed male students in Grade 8 exam, which is consistent with the pattern in Grade 5 exam. It is in the CRQs that female students take lead and dominate the overall average marks. This is an international phenomenon, usually attributed to girls’ greater verbal fluency. The male superiority in MCQs is also well established internationally. It is common in Mathematics but it does not usually extend to English. This may be a second language phenomenon, knowledge about the language rather than facility with the language.
29
REPORT ON GRADE 5 AND 8 EXAMS - 2015
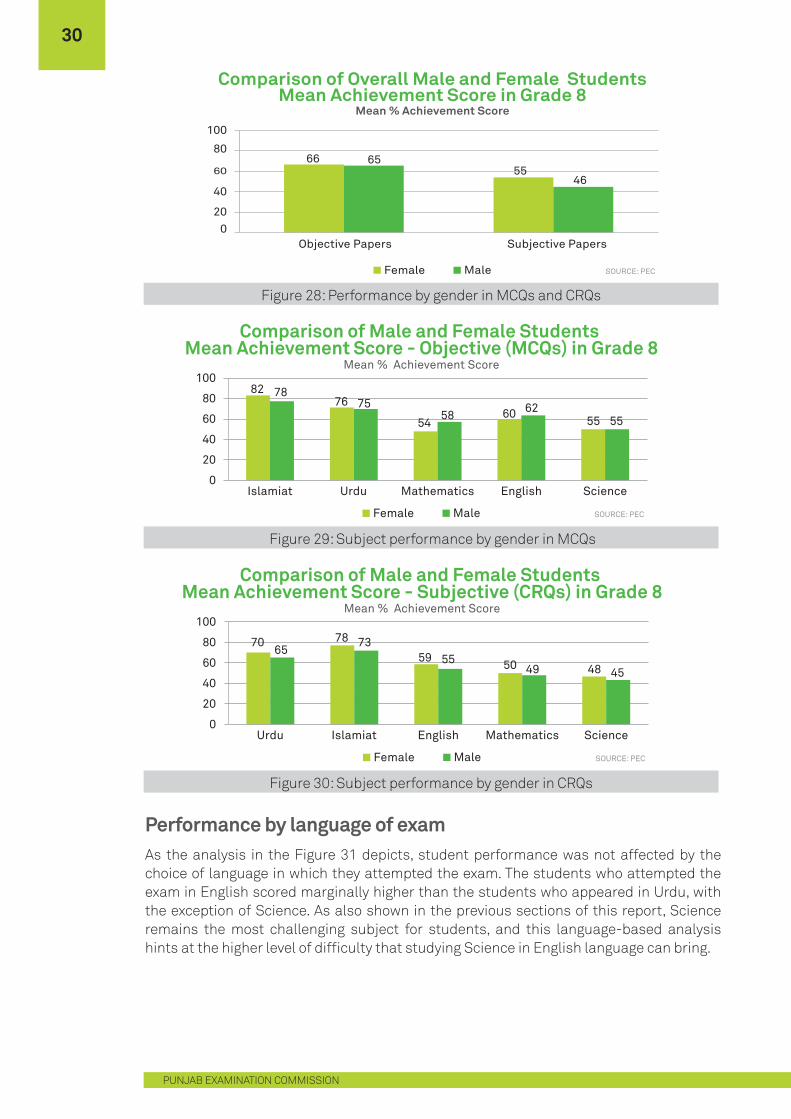
Figure 29: Subject performance by gender in MCQs
Figure 30: Subject performance by gender in CRQs
Performance by language of examAs the analysis in the Figure 31 depicts, student performance was not affected by the choice of language in which they attempted the exam. The students who attempted the exam in English scored marginally higher than the students who appeared in Urdu, with the exception of Science. As also shown in the previous sections of this report, Science remains the most challenging subject for students, and this language-based analysis hints at the higher level of difficulty that studying Science in English language can bring.
Figure 28: Performance by gender in MCQs and CRQs
6655
65
46
020
40
60
80
100
Objective Papers Subjective Papers
Comparison of Overall Male and Female StudentsMean Achievement Score in Grade 8
Mean % Achievement Score
Female Male SOURCE: PEC
8276
5460
55
7875
5862
55
0
20
40
60
80
100
Islamiat Urdu Mathematics English Science
Comparison of Male and Female Students Mean Achievement Score - Objective (MCQs) in Grade 8
Mean % Achievement Score
Female Male SOURCE: PEC
70 78
5950 48
6573
5549 45
0
20
40
60
80
100
Urdu Islamiat English Mathematics Science
Comparison of Male and Female Students Mean Achievement Score - Subjective (CRQs) in Grade 8
Mean % Achievement Score
Female Male SOURCE: PEC
30
PUNJAB EXAMINATION COMMISSION
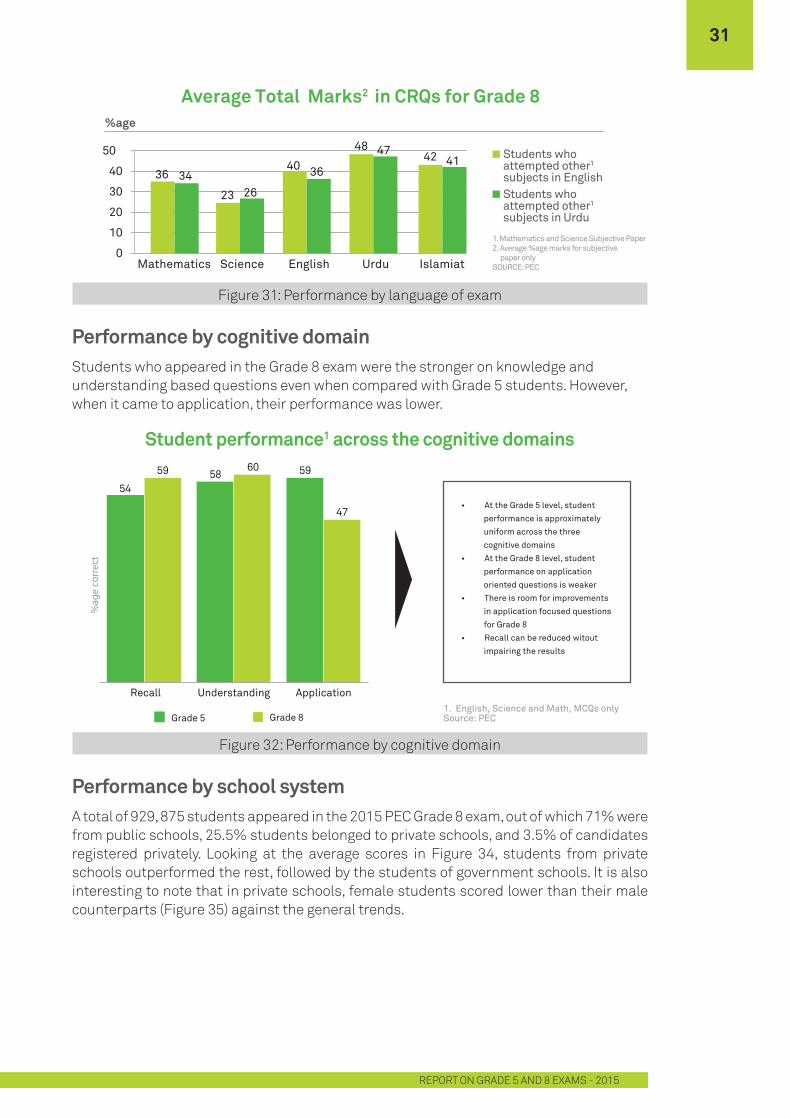
Performance by cognitive domainStudents who appeared in the Grade 8 exam were the stronger on knowledge and understanding based questions even when compared with Grade 5 students. However, when it came to application, their performance was lower.
Performance by school systemA total of 929, 875 students appeared in the 2015 PEC Grade 8 exam, out of which 71% were from public schools, 25.5% students belonged to private schools, and 3.5% of candidates registered privately. Looking at the average scores in Figure 34, students from private schools outperformed the rest, followed by the students of government schools. It is also interesting to note that in private schools, female students scored lower than their male counterparts (Figure 35) against the general trends.
Figure 31: Performance by language of exam
Figure 32: Performance by cognitive domain
Average Total Marks2 in CRQs for Grade 8
1. Mathematics and Science Subjective Paper2. Average %age marks for subjective paper onlySOURCE: PEC
36 34
0
10
20
30
40
50
Mathematics
23 26
Science
40 36
English
48 47
Urdu
42 41
Islamiat
%age
Students who attempted other1
subjects in EnglishStudents who attempted other1
subjects in Urdu
Student performance1 across the cognitive domains
1. English, Science and Math, MCQs onlySource: PECGrade 5 Grade 8
595854
47
6059
Recall Understanding Application
%ag
e co
rrec
t
• At the Grade 5 level, student
performance is approximately
uniform across the three
cognitive domains
• At the Grade 8 level, student
performance on application
oriented questions is weaker
• There is room for improvements
in application focused questions
for Grade 8
• Recall can be reduced witout
impairing the results
31
REPORT ON GRADE 5 AND 8 EXAMS - 2015

Figure 33: Performance by school system
Figure 34: Performance by gender in different school systems
314294
260
0
50
100
150
200
250
300
350
400
Average Achievement Scoreof Private School Students
Average Achievement Scoreof Govt School Students
Average Achievement Scoreof Private Students
Comparison of Achievement of Govt. School, Private School and Private Students in Grade 8
Total Achievement Score (Out of 500)
SOURCE: PEC
0100200300400500
232306
Private schoolfemale and male
students
304 285
Govt schoolfemale and male
students
273 252
Privatefemale and male
students
Comparison of Mean Achievement Score of Private,Private School and Govt School Students in Grade 8
Achievement Score (Out of 500)
SOURCE: PECFemale Male
32
PUNJAB EXAMINATION COMMISSION

Student performance by district
Overall Performance of districtsStudents in Muzaffargarh district comprehensively outshone rest of the 35 districts of Punjab in all five subjects. Their average score was 72%, which was substantially higher than the district coming second with 67.6%, Layyah. District Vehari closely followed Layyah with an average score of 66.2%.
Figure 35: Overall performance of districts
SOURCE: PEC
District - Wise Comparison of Students Overall Achievement in Grade 8
Greater than 50%mean score
Less than 33%mean score
(41-50)%mean score
(33-40)%mean score
District Average %age score
Hafizabad
Bahawalpur
Rajanpur
Bahawalnagar
D.G . Khan
Rahimyar Khan
Rawalpindi
Bhakkar
Layyah
Attock
Muzaff-argarh
Khushab
Chakwal
Lodhran
Vehari
Multan
Mianwali
Jhelum
Gujrat
Jhang
Chiniot
SahiwalKhanewal
TT Singh
Okara
Kasur
NarowalSialkot
Gujranwala
Lahore
Pakpattan
Faisalabad
Sargodha
M.B. Din
SheikhupuraNankanaSahib
MuzaffargarhLayyahVehariKhanewalLodhranJhangJehlumBahawalpurChakwalRajanpurMultanKhushabT.T. SinghGujranwalaBhakkarFaisalabadRahimyar KhanDG KhanMianwaliChiniotBahawalnagarSahiwalNankana SahibSargodhaKasurPakpatanLahoreAttockGujratOkaraM.B. DinSialkotHafizabadSheikhupuraNarowalRawalpindi
72.067.666.264.262.862.662.162.061.961.661.561.261.060.260.160.159.659.659.559.459.058.858.557.456.956.756.456.356.356.055.954.954.853.152.451.3
33
REPORT ON GRADE 5 AND 8 EXAMS - 2015
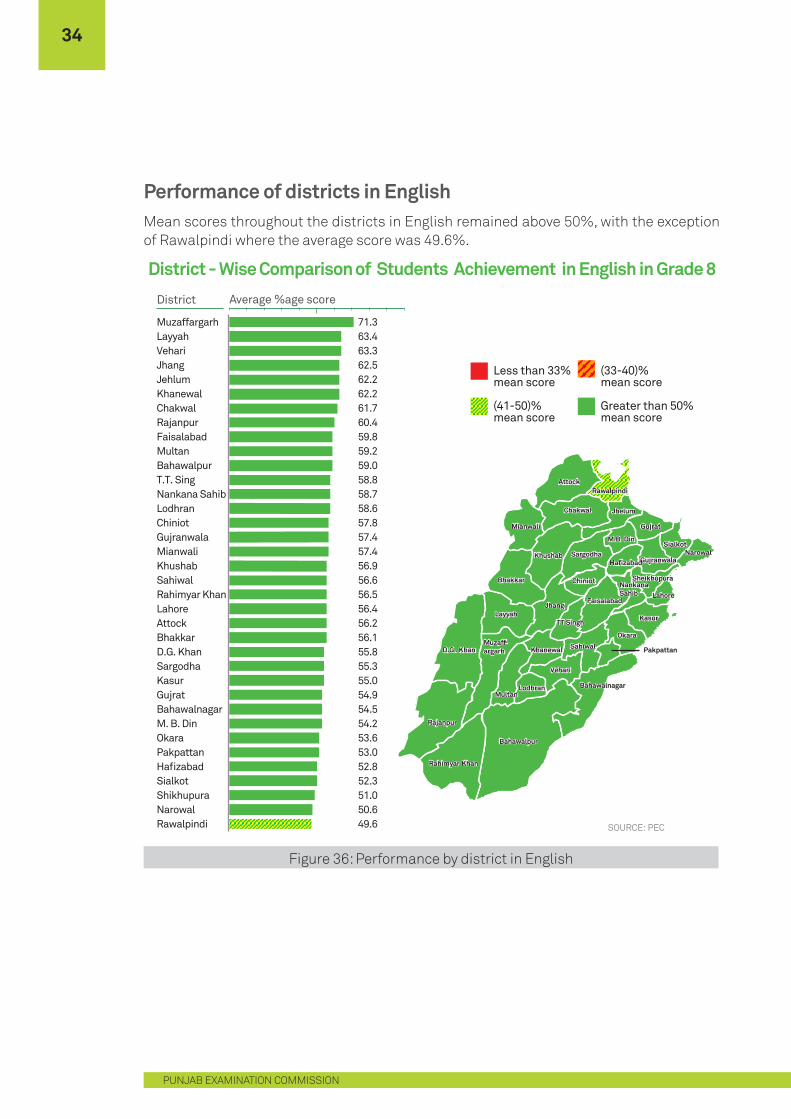
Performance of districts in EnglishMean scores throughout the districts in English remained above 50%, with the exception of Rawalpindi where the average score was 49.6%.
Figure 36: Performance by district in English
SOURCE: PEC
District - Wise Comparison of Students Achievement in English in Grade 8
District Average %age score
Hafizabad
Bahawalpur
Rajanpur
Bahawalnagar
D.G . Khan
Rahimyar Khan
Rawalpindi
Bhakkar
Layyah
Attock
Muzaff-argarh
Khushab
Chakwal
Lodhran
Vehari
Multan
Mianwali
Jhelum
Gujrat
Jhang
Chiniot
SahiwalKhanewal
TT Singh
Okara
Kasur
NarowalSialkot
Gujranwala
Lahore
Pakpattan
Faisalabad
Sargodha
M.B. Din
SheikhupuraNankanaSahib
Hafizabad
Bahawalpur
Rajanpur
Bahawalnagar
D.G . Khan
Rahimyar Khan
Rawalpindi
Bhakkar
Layyah
Attock
Muzaff-argarh
Khushab
Chakwal
Lodhran
Vehari
Multan
Mianwali
Jhelum
Gujrat
Jhang
Chiniot
SahiwalKhanewal
TT Singh
Okara
Kasur
NarowalSialkot
Gujranwala
Lahore
Pakpattan
Faisalabad
Sargodha
M.B. Din
SheikhupuraNankanaSahib
MuzaffargarhLayyahVehariJhangJehlumKhanewalChakwalRajanpurFaisalabadMultanBahawalpurT.T. SingNankana SahibLodhranChiniotGujranwalaMianwaliKhushabSahiwalRahimyar KhanLahoreAttockBhakkarD.G. KhanSargodhaKasurGujratBahawalnagarM. B. DinOkaraPakpattanHafizabadSialkotShikhupuraNarowalRawalpindi
71.363.463.362.562.262.261.760.459.859.259.058.858.758.657.857.457.456.956.656.556.456.256.155.855.355.054.954.554.253.653.052.852.351.050.649.6
Greater than 50%mean score
Less than 33%mean score
(41-50)%mean score
(33-40)%mean score
34
PUNJAB EXAMINATION COMMISSION
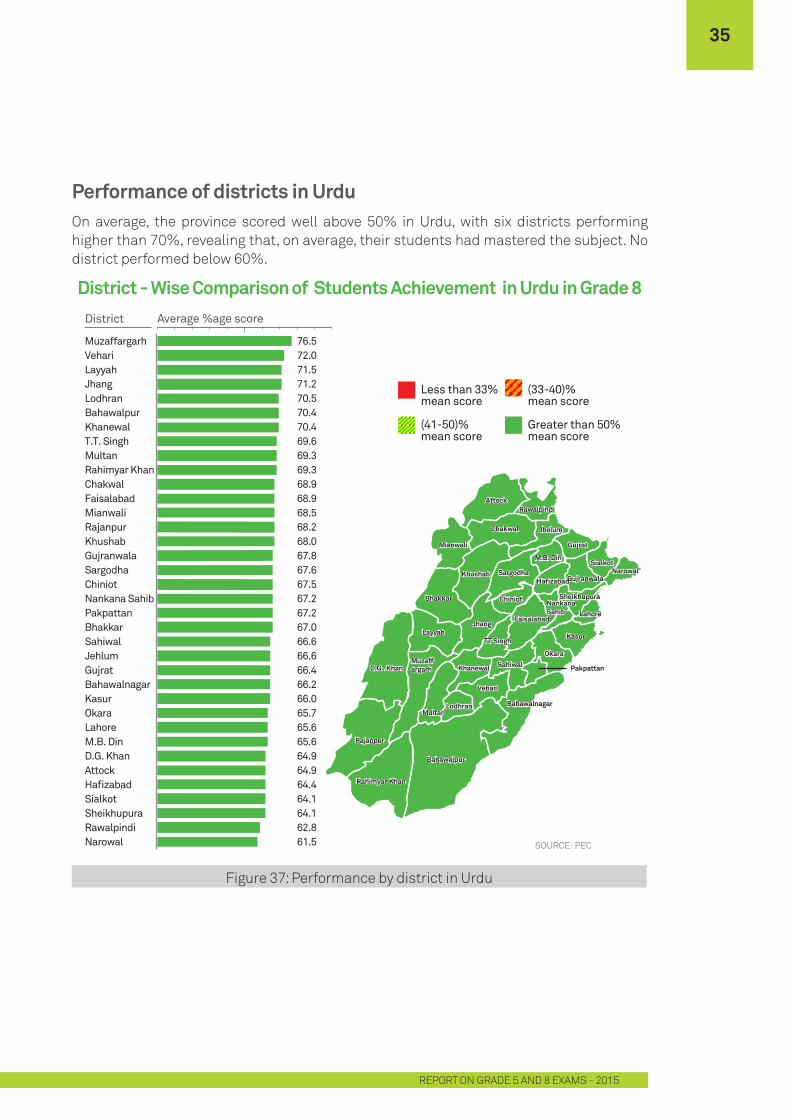
Performance of districts in UrduOn average, the province scored well above 50% in Urdu, with six districts performing higher than 70%, revealing that, on average, their students had mastered the subject. No district performed below 60%.
Figure 37: Performance by district in Urdu
SOURCE: PEC
District - Wise Comparison of Students Achievement in Urdu in Grade 8District Average %age score
Hafizabad
Bahawalpur
Rajanpur
Bahawalnagar
D.G . Khan
Rahimyar Khan
Rawalpindi
Bhakkar
Layyah
Attock
Muzaff-argarh
Khushab
Chakwal
Lodhran
Vehari
Multan
Mianwali
Jhelum
Gujrat
Jhang
Chiniot
SahiwalKhanewal
TT Singh
Okara
Kasur
NarowalSialkot
Gujranwala
Lahore
Pakpattan
Faisalabad
Sargodha
M.B. Din
SheikhupuraNankanaSahib
MuzaffargarhVehariLayyahJhangLodhranBahawalpurKhanewalT.T. SinghMultanRahimyar KhanChakwalFaisalabadMianwaliRajanpurKhushabGujranwalaSargodhaChiniotNankana SahibPakpattanBhakkarSahiwalJehlumGujratBahawalnagarKasurOkaraLahoreM.B. DinD.G. KhanAttockHafizabadSialkotSheikhupuraRawalpindiNarowal
76.572.071.571.270.570.470.469.669.369.368.968.968.568.268.067.867.667.567.267.267.066.666.666.466.266.065.765.665.664.964.964.464.164.162.861.5
Greater than 50%mean score
Less than 33%mean score
(41-50)%mean score
(33-40)%mean score
35
REPORT ON GRADE 5 AND 8 EXAMS - 2015
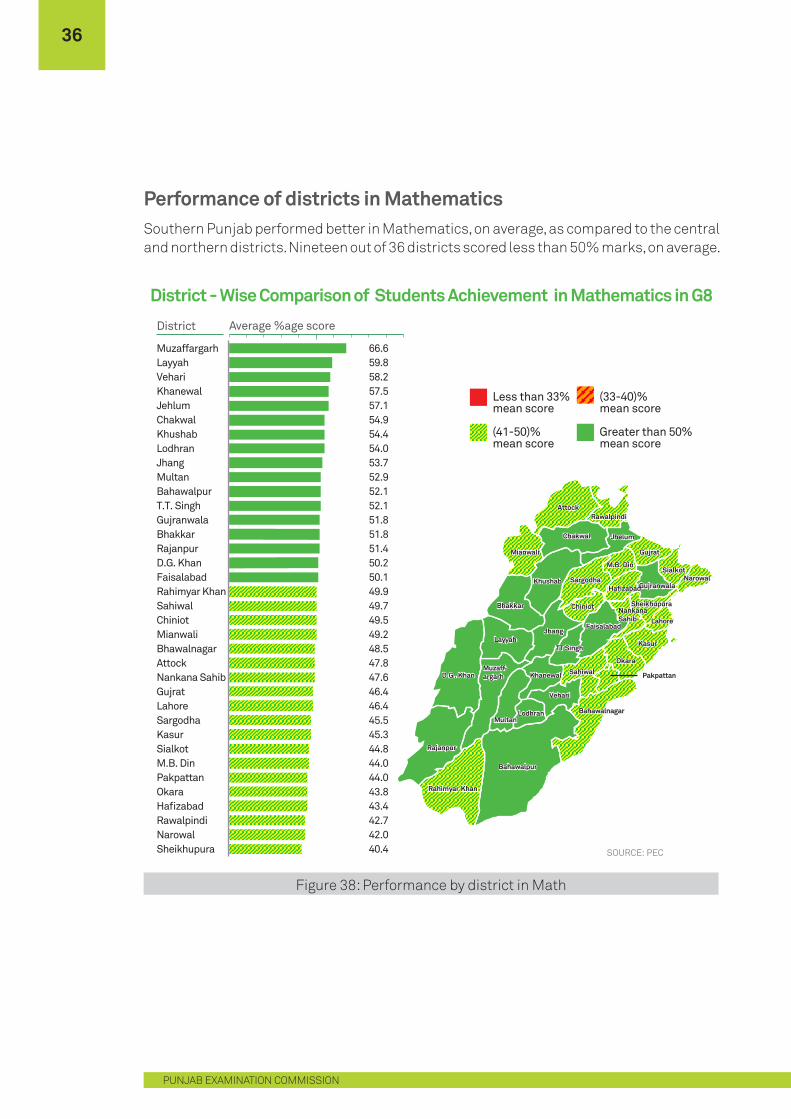
Performance of districts in MathematicsSouthern Punjab performed better in Mathematics, on average, as compared to the central and northern districts. Nineteen out of 36 districts scored less than 50% marks, on average.
Figure 38: Performance by district in Math
SOURCE: PEC
District - Wise Comparison of Students Achievement in Mathematics in G8
District Average %age score
Hafizabad
Bahawalpur
Rajanpur
Bahawalnagar
D.G . Khan
Rahimyar Khan
Rawalpindi
Bhakkar
Layyah
Attock
Muzaff-argarh
Khushab
Chakwal
Lodhran
Vehari
Multan
Mianwali
Jhelum
Gujrat
Jhang
Chiniot
SahiwalKhanewal
TT Singh
Okara
Kasur
NarowalSialkot
Gujranwala
Lahore
Pakpattan
Faisalabad
Sargodha
M.B. Din
SheikhupuraNankanaSahib
Hafizabad
Bahawalpur
Rajanpur
Bahawalnagar
D.G . Khan
Rahimyar Khan
Rawalpindi
Bhakkar
Layyah
Attock
Muzaff-argarh
Khushab
Chakwal
Lodhran
Vehari
Multan
Mianwali
Jhelum
Gujrat
Jhang
Chiniot
SahiwalKhanewal
TT Singh
Okara
Kasur
NarowalSialkot
Gujranwala
Lahore
Pakpattan
Faisalabad
Sargodha
M.B. Din
SheikhupuraNankanaSahib
MuzaffargarhLayyahVehariKhanewalJehlumChakwalKhushabLodhranJhangMultanBahawalpurT.T. SinghGujranwalaBhakkarRajanpurD.G. KhanFaisalabadRahimyar KhanSahiwalChiniotMianwaliBhawalnagarAttockNankana SahibGujratLahoreSargodhaKasurSialkotM.B. DinPakpattanOkaraHafizabadRawalpindiNarowalSheikhupura
66.659.858.257.557.154.954.454.053.752.952.152.151.851.851.450.250.149.949.749.549.248.547.847.646.446.445.545.344.844.044.043.843.442.742.040.4
Greater than 50%mean score
Less than 33%mean score
(41-50)%mean score
(33-40)%mean score
36
PUNJAB EXAMINATION COMMISSION
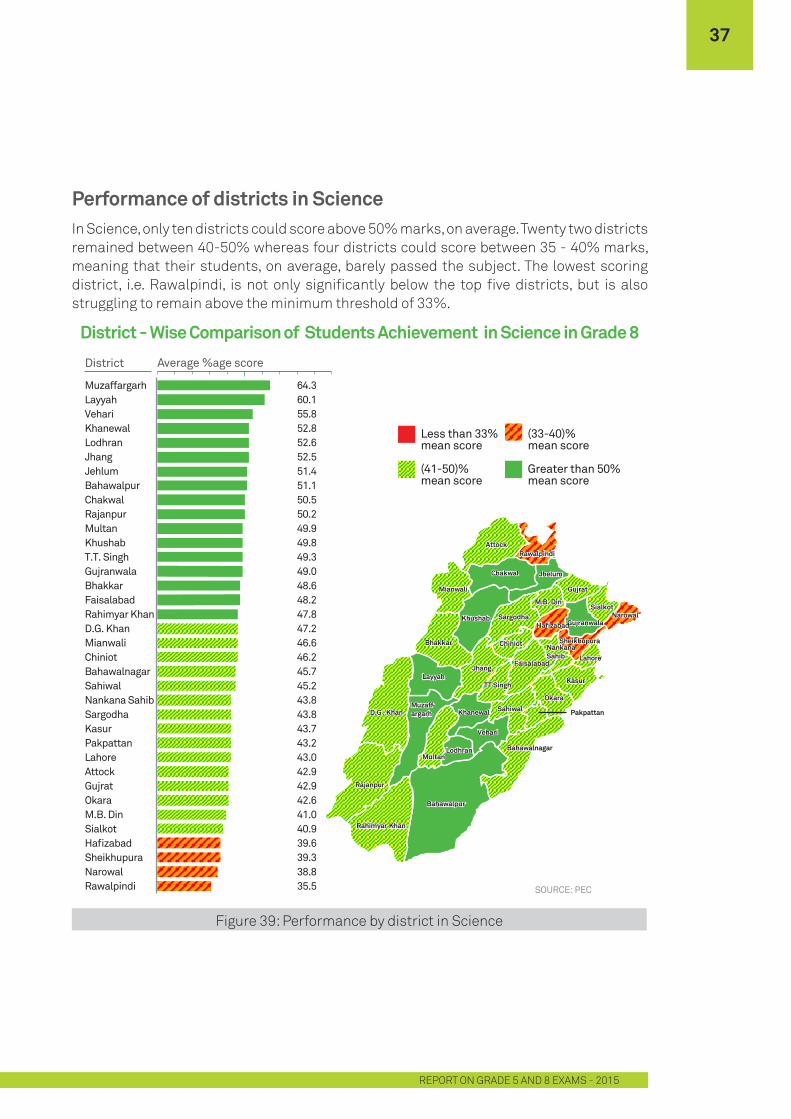
Performance of districts in ScienceIn Science, only ten districts could score above 50% marks, on average. Twenty two districts remained between 40-50% whereas four districts could score between 35 - 40% marks, meaning that their students, on average, barely passed the subject. The lowest scoring district, i.e. Rawalpindi, is not only significantly below the top five districts, but is also struggling to remain above the minimum threshold of 33%.
Figure 39: Performance by district in Science
SOURCE: PEC
District - Wise Comparison of Students Achievement in Science in Grade 8
District Average %age score
Hafizabad
Bahawalpur
Rajanpur
Bahawalnagar
D.G . Khan
Rahimyar Khan
Rawalpindi
Bhakkar
Layyah
Attock
Muzaff-argarh
Khushab
Chakwal
Lodhran
Vehari
Multan
Mianwali
Jhelum
Gujrat
Jhang
Chiniot
SahiwalKhanewal
TT Singh
Okara
Kasur
NarowalSialkot
Gujranwala
Lahore
Pakpattan
Faisalabad
Sargodha
M.B. Din
SheikhupuraNankanaSahib
Hafizabad
Bahawalpur
Rajanpur
Bahawalnagar
D.G . Khan
Rahimyar Khan
Rawalpindi
Bhakkar
Layyah
Attock
Muzaff-argarh
Khushab
Chakwal
Lodhran
Vehari
Multan
Mianwali
Jhelum
Gujrat
Jhang
Chiniot
SahiwalKhanewal
TT Singh
Okara
Kasur
NarowalSialkot
Gujranwala
Lahore
Pakpattan
Faisalabad
Sargodha
M.B. Din
SheikhupuraNankanaSahib
MuzaffargarhLayyahVehariKhanewalLodhranJhangJehlumBahawalpurChakwalRajanpurMultanKhushabT.T. SinghGujranwalaBhakkarFaisalabadRahimyar KhanD.G. KhanMianwaliChiniotBahawalnagarSahiwalNankana SahibSargodhaKasurPakpattanLahoreAttockGujratOkaraM.B. DinSialkotHafizabadSheikhupuraNarowalRawalpindi
64.360.155.852.852.652.551.451.150.550.249.949.849.349.048.648.247.847.246.646.245.745.243.843.843.743.243.042.942.942.641.040.939.639.338.835.5
Greater than 50%mean score
Less than 33%mean score
(41-50)%mean score
(33-40)%mean score
37
REPORT ON GRADE 5 AND 8 EXAMS - 2015
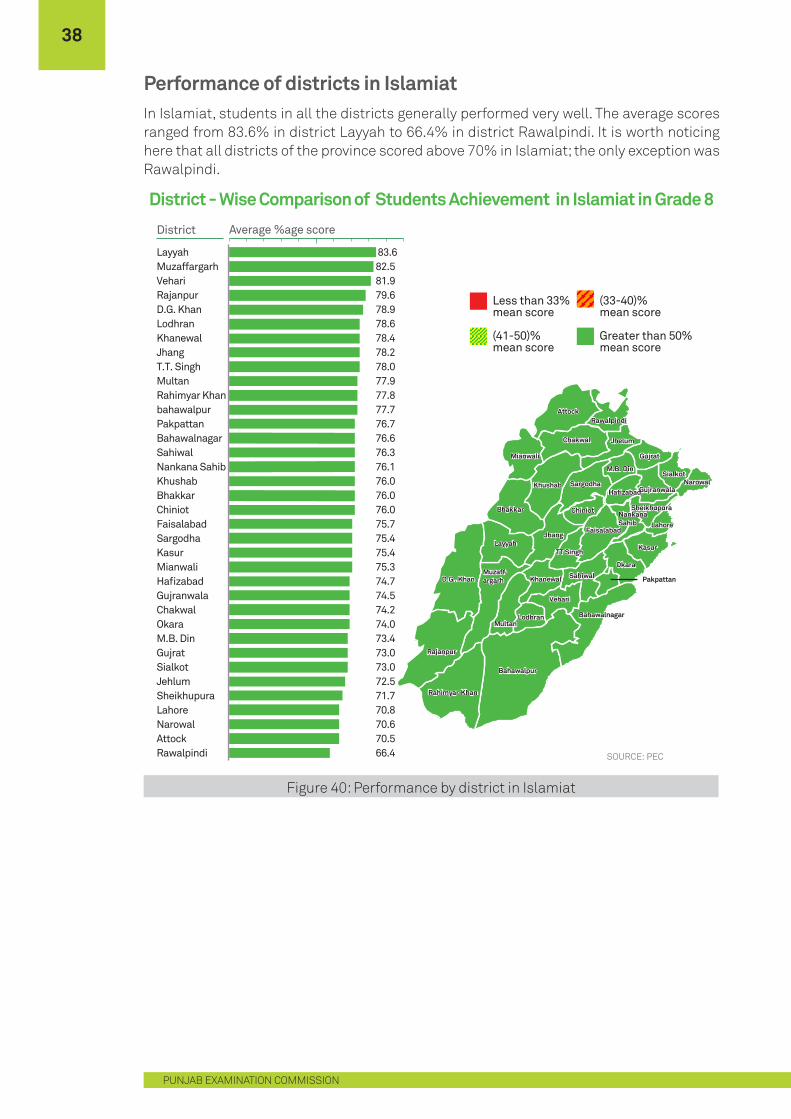
Performance of districts in IslamiatIn Islamiat, students in all the districts generally performed very well. The average scores ranged from 83.6% in district Layyah to 66.4% in district Rawalpindi. It is worth noticing here that all districts of the province scored above 70% in Islamiat; the only exception was Rawalpindi.
Figure 40: Performance by district in Islamiat
SOURCE: PEC
District - Wise Comparison of Students Achievement in Islamiat in Grade 8
District Average %age score
Hafizabad
Bahawalpur
Rajanpur
Bahawalnagar
D.G . Khan
Rahimyar Khan
Rawalpindi
Bhakkar
Layyah
Attock
Muzaff-argarh
Khushab
Chakwal
Lodhran
Vehari
Multan
Mianwali
Jhelum
Gujrat
Jhang
Chiniot
SahiwalKhanewal
TT Singh
Okara
Kasur
NarowalSialkot
Gujranwala
Lahore
Pakpattan
Faisalabad
Sargodha
M.B. Din
SheikhupuraNankanaSahib
Hafizabad
Bahawalpur
Rajanpur
Bahawalnagar
D.G . Khan
Rahimyar Khan
Rawalpindi
Bhakkar
Layyah
Attock
Muzaff-argarh
Khushab
Chakwal
Lodhran
Vehari
Multan
Mianwali
Jhelum
Gujrat
Jhang
Chiniot
SahiwalKhanewal
TT Singh
Okara
Kasur
NarowalSialkot
Gujranwala
Lahore
Pakpattan
Faisalabad
Sargodha
M.B. Din
SheikhupuraNankanaSahib
LayyahMuzaffargarhVehariRajanpurD.G. KhanLodhranKhanewalJhangT.T. SinghMultanRahimyar KhanbahawalpurPakpattanBahawalnagarSahiwalNankana SahibKhushabBhakkarChiniotFaisalabadSargodhaKasurMianwaliHafizabadGujranwalaChakwalOkaraM.B. DinGujratSialkotJehlumSheikhupuraLahoreNarowalAttockRawalpindi
83.682.581.979.678.978.678.478.278.077.977.877.776.776.676.376.176.076.076.075.775.475.475.374.774.574.274.073.473.073.072.571.770.870.670.566.4
Greater than 50%mean score
Less than 33%mean score
(41-50)%mean score
(33-40)%mean score
38
PUNJAB EXAMINATION COMMISSION
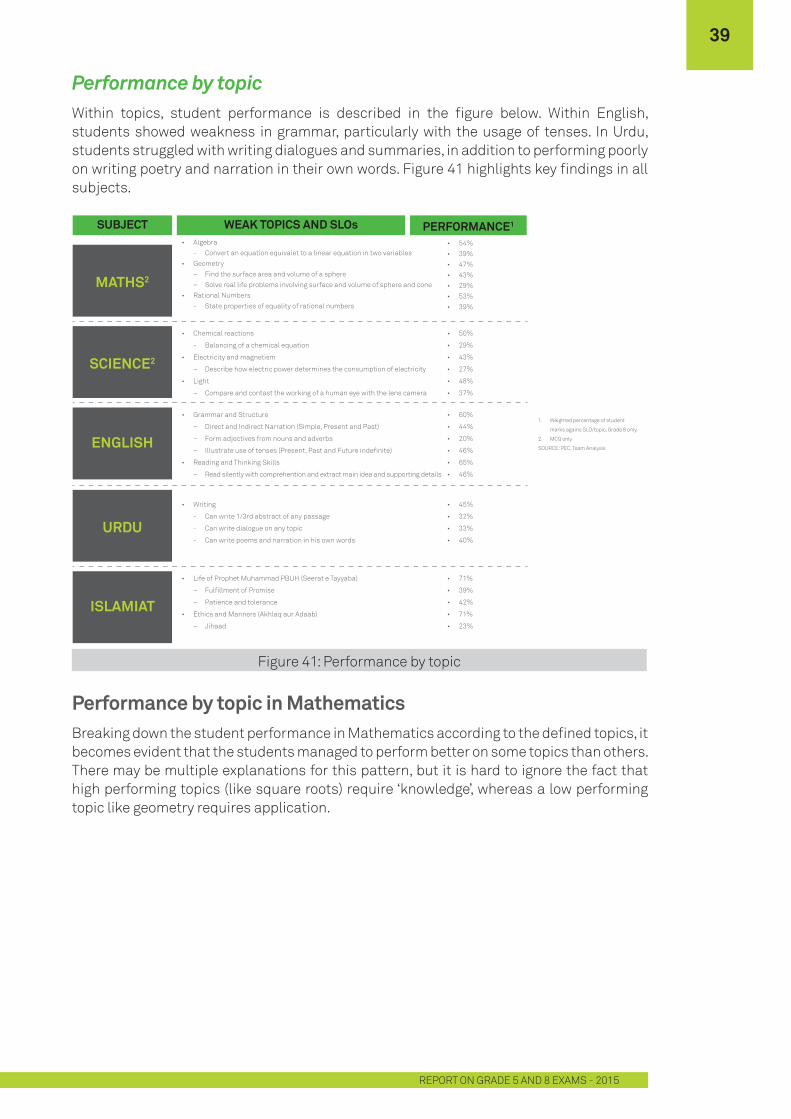
Figure 41: Performance by topic
SUBJECT
MATHS2
SCIENCE2
ENGLISH
PERFORMANCE1WEAK TOPICS AND SLOs• Algebra - Convert an equation equivalet to a linear equation in two variables• Geometry − Find the surface area and volume of a sphere − Solve real life problems involving surface and volume of sphere and cone• Rational Numbers - State properties of equality of rational numbers
• 54%• 39%• 47%• 43%• 29%• 53%• 39%
• Chemical reactions
- Balancing of a chemical equation
• Electricity and magnetism
− Describe how electric power determines the consumption of electricity
• Light
− Compare and contast the working of a human eye with the lens camera
• 50%
• 29%
• 43%
• 27%
• 48%
• 37%
• Grammar and Structure
− Direct and Indirect Narration (Simple, Present and Past)
− Form adjectives from nouns and adverbs
− Illustrate use of tenses (Present, Past and Future indefinite)
• Reading and Thinking Skills
− Read silently with comprehention and extract main idea and supporting details
• 60%
• 44%
• 20%
• 46%
• 65%
• 46%
URDU
ISLAMIAT
• Writing
- Can write 1/3rd abstract of any passage
- Can write dialogue on any topic
- Can write poems and narration in his own words
• 45%
• 32%
• 33%
• 40%
• Life of Prophet Muhammad PBUH (Seerat e Tayyaba)
− Fulfillment of Promise
− Patience and tolerance
• Ethics and Manners (Akhlaq aur Adaab)
− Jihaad
• 71%
• 39%
• 42%
• 71%
• 23%
1. Weighted percentage of student
marks agains SLO/topic, Grade 8 only.
2. MCQ only
SOURCE: PEC, Team Analysis
Performance by topicWithin topics, student performance is described in the figure below. Within English, students showed weakness in grammar, particularly with the usage of tenses. In Urdu, students struggled with writing dialogues and summaries, in addition to performing poorly on writing poetry and narration in their own words. Figure 41 highlights key findings in all subjects.
Performance by topic in Mathematics Breaking down the student performance in Mathematics according to the defined topics, it becomes evident that the students managed to perform better on some topics than others. There may be multiple explanations for this pattern, but it is hard to ignore the fact that high performing topics (like square roots) require ‘knowledge’, whereas a low performing topic like geometry requires application.
39
REPORT ON GRADE 5 AND 8 EXAMS - 2015
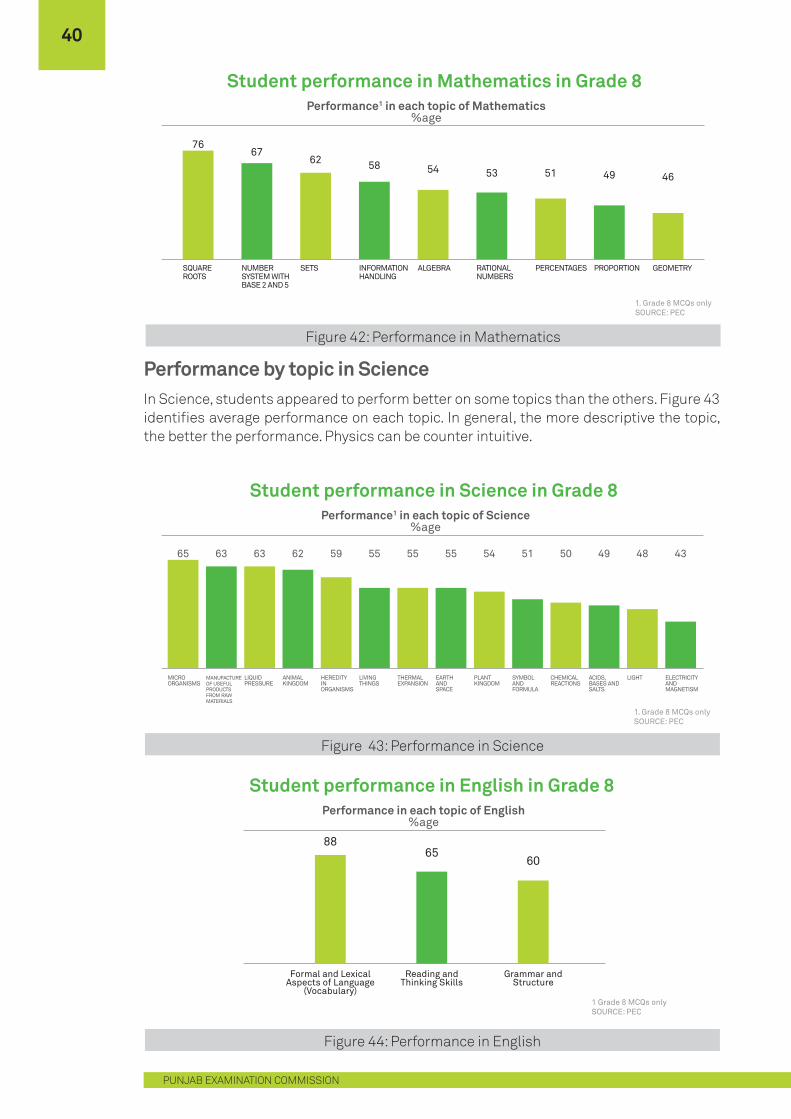
Figure 44: Performance in English
Student performance in English in Grade 8Performance in each topic of English
%age
1 Grade 8 MCQs onlySOURCE: PEC
Formal and LexicalAspects of Language
(Vocabulary)
Reading andThinking Skills
Grammar andStructure
8865
60
Figure 43: Performance in Science
Student performance in Science in Grade 8Performance1 in each topic of Science
%age
MICROORGANISMS
65
MANUFACTUREOF USEFULPRODUCTSFROM RAWMATERIALS
63
LIQUIDPRESSURE
63
ANIMAL KINGDOM
62
HEREDITYINORGANISMS
59
LIVINGTHINGS
55
THERMALEXPANSION
55
EARTHANDSPACE
55
PLANTKINGDOM
54
SYMBOLANDFORMULA
51
CHEMICALREACTIONS
50
ACIDS,BASES ANDSALTS
49
LIGHT
48
ELECTRICITYANDMAGNETISM
43
1. Grade 8 MCQs onlySOURCE: PEC
Performance by topic in ScienceIn Science, students appeared to perform better on some topics than the others. Figure 43 identifies average performance on each topic. In general, the more descriptive the topic, the better the performance. Physics can be counter intuitive.
Figure 42: Performance in Mathematics
Student performance in Mathematics in Grade 8Performance1 in each topic of Mathematics
%age
SQUAREROOTS
NUMBERSYSTEM WITHBASE 2 AND 5
SETS INFORMATIONHANDLING
ALGEBRA RATIONAL NUMBERS
PERCENTAGES PROPORTION GEOMETRY
7667
62 58 54 53 51 49 46
1. Grade 8 MCQs onlySOURCE: PEC
40
PUNJAB EXAMINATION COMMISSION
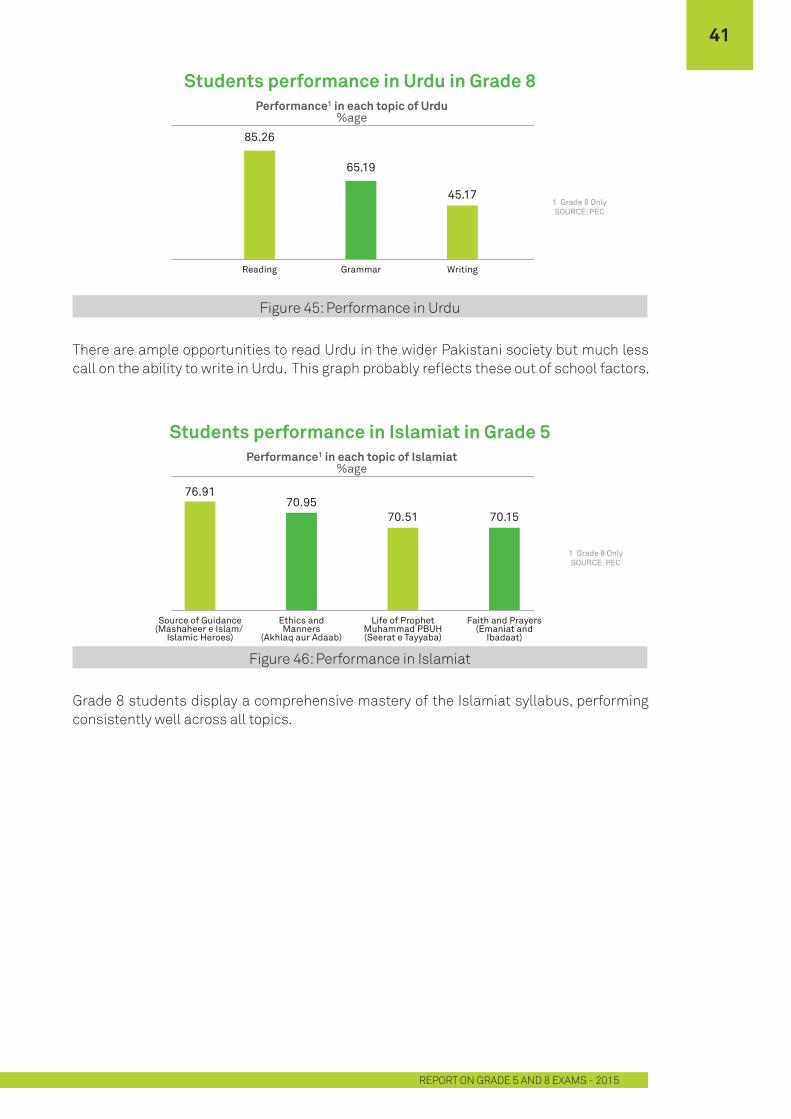
There are ample opportunities to read Urdu in the wider Pakistani society but much less call on the ability to write in Urdu. This graph probably reflects these out of school factors.
Grade 8 students display a comprehensive mastery of the Islamiat syllabus, performing consistently well across all topics.
Students performance in Urdu in Grade 8Performance1 in each topic of Urdu
%age
1 Grade 8 OnlySOURCE: PEC
Reading
85.26
Grammar
65.19
Writing
45.17
Students performance in Islamiat in Grade 5Performance1 in each topic of Islamiat
%age
1 Grade 8 OnlySOURCE: PEC
Faith and Prayers(Emaniat and
Ibadaat)
Source of Guidance(Mashaheer e Islam/
Islamic Heroes)
Ethics andManners
(Akhlaq aur Adaab)
Life of ProphetMuhammad PBUH(Seerat e Tayyaba)
76.9170.95
70.51
70.15
Figure 45: Performance in Urdu
Figure 46: Performance in Islamiat
41
REPORT ON GRADE 5 AND 8 EXAMS - 2015
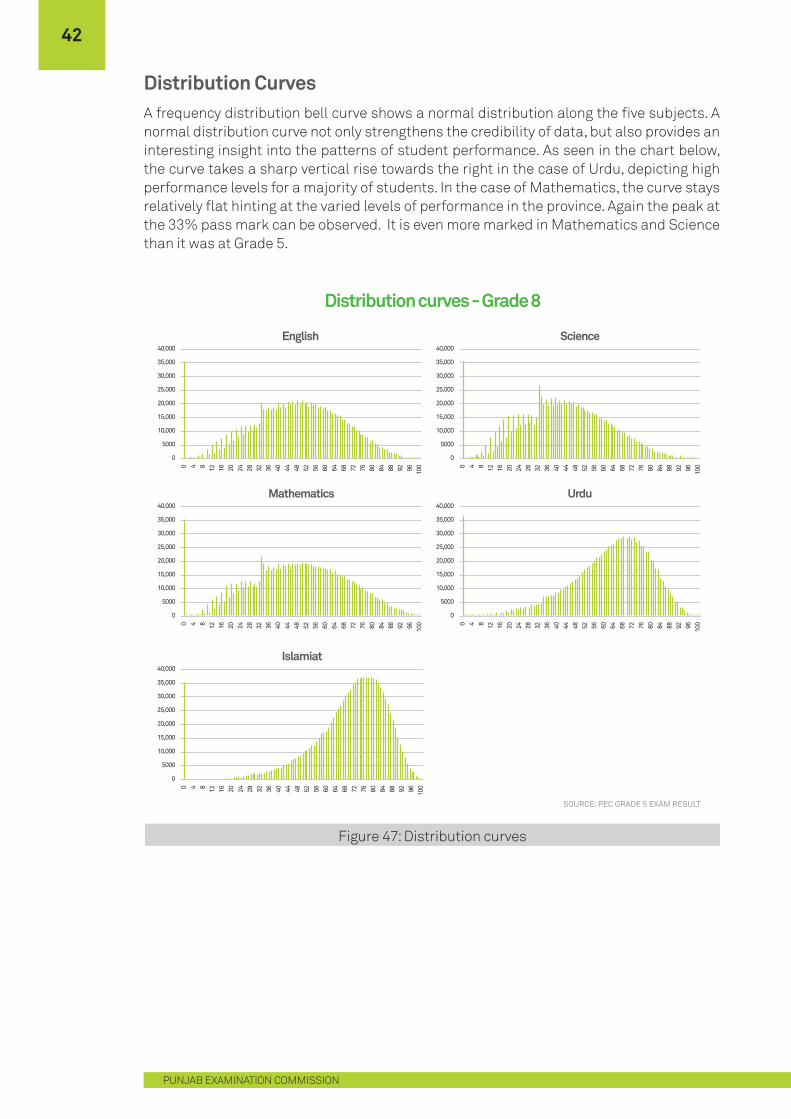
Distribution CurvesA frequency distribution bell curve shows a normal distribution along the five subjects. A normal distribution curve not only strengthens the credibility of data, but also provides an interesting insight into the patterns of student performance. As seen in the chart below, the curve takes a sharp vertical rise towards the right in the case of Urdu, depicting high performance levels for a majority of students. In the case of Mathematics, the curve stays relatively flat hinting at the varied levels of performance in the province. Again the peak at the 33% pass mark can be observed. It is even more marked in Mathematics and Science than it was at Grade 5.
Figure 47: Distribution curves
Distribution curves - Grade 8
40,000
35,000
30,000
25,000
20,000
15,000
10,000
5000
0
0 4 8 12 16 20 24 28 32 36 40 44 48 52 56 60 64 68 72 76 80 84 88 92 96 100
English
40,000
35,000
30,000
25,000
20,000
15,000
10,000
5000
0
0 4 8 12 16 20 24 28 32 36 40 44 48 52 56 60 64 68 72 76 80 84 88 92 96 100
Mathematics40,000
35,000
30,000
25,000
20,000
15,000
10,000
5000
0
0 4 8 12 16 20 24 28 32 36 40 44 48 52 56 60 64 68 72 76 80 84 88 92 96 100
Urdu
40,000
35,000
30,000
25,000
20,000
15,000
10,000
5000
00 4 8 12 16 20 24 28 32 36 40 44 48 52 56 60 64 68 72 76 80 84 88 92 96 100
Science
SOURCE: PEC GRADE 5 EXAM RESULT
40,000
35,000
30,000
25,000
20,000
15,000
10,000
5000
0
0 4 8 12 16 20 24 28 32 36 40 44 48 52 56 60 64 68 72 76 80 84 88 92 96 100
Islamiat
42
PUNJAB EXAMINATION COMMISSION
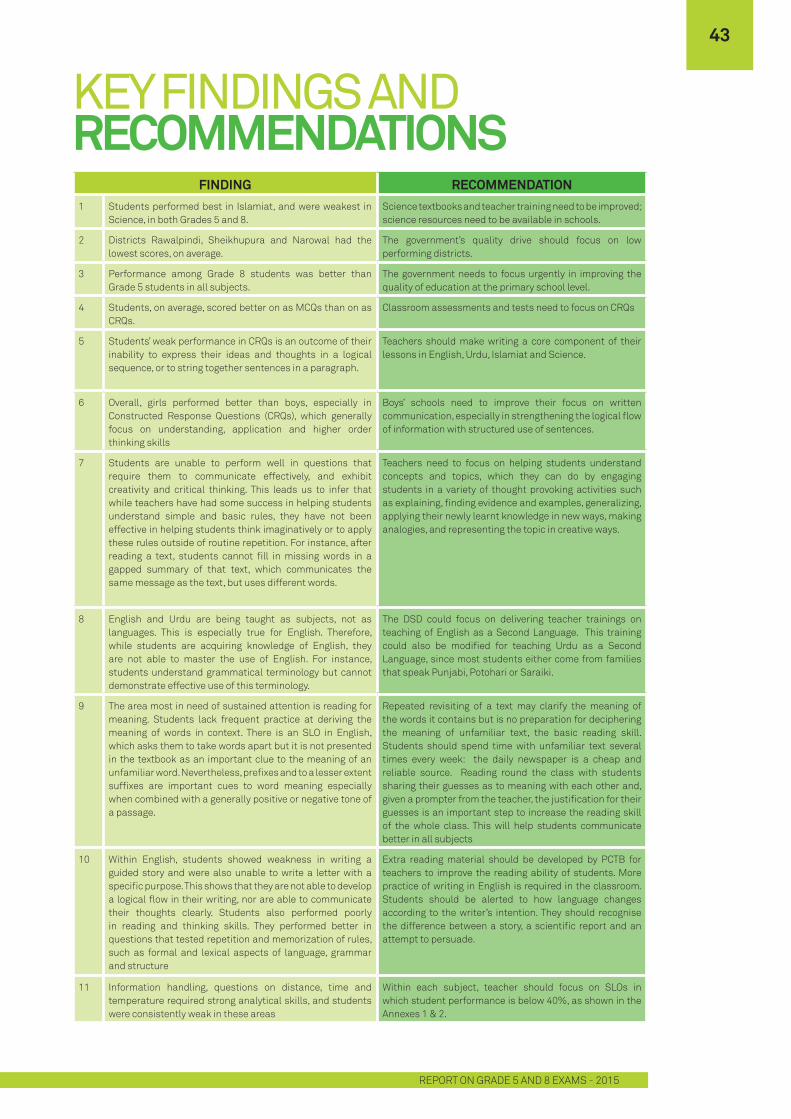
KEY FINDINGS AND RECOMMENDATIONS
FINDING RECOMMENDATION1 Students performed best in Islamiat, and were weakest in
Science, in both Grades 5 and 8.Science textbooks and teacher training need to be improved; science resources need to be available in schools.
2 Districts Rawalpindi, Sheikhupura and Narowal had the lowest scores, on average.
The government’s quality drive should focus on low performing districts.
3 Performance among Grade 8 students was better than Grade 5 students in all subjects.
The government needs to focus urgently in improving the quality of education at the primary school level.
4 Students, on average, scored better on as MCQs than on as CRQs.
Classroom assessments and tests need to focus on CRQs
5 Students’ weak performance in CRQs is an outcome of their inability to express their ideas and thoughts in a logical sequence, or to string together sentences in a paragraph.
Teachers should make writing a core component of their lessons in English, Urdu, Islamiat and Science.
6 Overall, girls performed better than boys, especially in Constructed Response Questions (CRQs), which generally focus on understanding, application and higher order thinking skills
Boys’ schools need to improve their focus on written communication, especially in strengthening the logical flow of information with structured use of sentences.
7 Students are unable to perform well in questions that require them to communicate effectively, and exhibit creativity and critical thinking. This leads us to infer that while teachers have had some success in helping students understand simple and basic rules, they have not been effective in helping students think imaginatively or to apply these rules outside of routine repetition. For instance, after reading a text, students cannot fill in missing words in a gapped summary of that text, which communicates the same message as the text, but uses different words.
Teachers need to focus on helping students understand concepts and topics, which they can do by engaging students in a variety of thought provoking activities such as explaining, finding evidence and examples, generalizing, applying their newly learnt knowledge in new ways, making analogies, and representing the topic in creative ways.
8 English and Urdu are being taught as subjects, not as languages. This is especially true for English. Therefore, while students are acquiring knowledge of English, they are not able to master the use of English. For instance, students understand grammatical terminology but cannot demonstrate effective use of this terminology.
The DSD could focus on delivering teacher trainings on teaching of English as a Second Language. This training could also be modified for teaching Urdu as a Second Language, since most students either come from families that speak Punjabi, Potohari or Saraiki.
9 The area most in need of sustained attention is reading for meaning. Students lack frequent practice at deriving the meaning of words in context. There is an SLO in English, which asks them to take words apart but it is not presented in the textbook as an important clue to the meaning of an unfamiliar word. Nevertheless, prefixes and to a lesser extent suffixes are important cues to word meaning especially when combined with a generally positive or negative tone of a passage.
Repeated revisiting of a text may clarify the meaning of the words it contains but is no preparation for deciphering the meaning of unfamiliar text, the basic reading skill. Students should spend time with unfamiliar text several times every week: the daily newspaper is a cheap and reliable source. Reading round the class with students sharing their guesses as to meaning with each other and, given a prompter from the teacher, the justification for their guesses is an important step to increase the reading skill of the whole class. This will help students communicate better in all subjects
10 Within English, students showed weakness in writing a guided story and were also unable to write a letter with a specific purpose. This shows that they are not able to develop a logical flow in their writing, nor are able to communicate their thoughts clearly. Students also performed poorly in reading and thinking skills. They performed better in questions that tested repetition and memorization of rules, such as formal and lexical aspects of language, grammar and structure
Extra reading material should be developed by PCTB for teachers to improve the reading ability of students. More practice of writing in English is required in the classroom. Students should be alerted to how language changes according to the writer’s intention. They should recognise the difference between a story, a scientific report and an attempt to persuade.
11 Information handling, questions on distance, time and temperature required strong analytical skills, and students were consistently weak in these areas
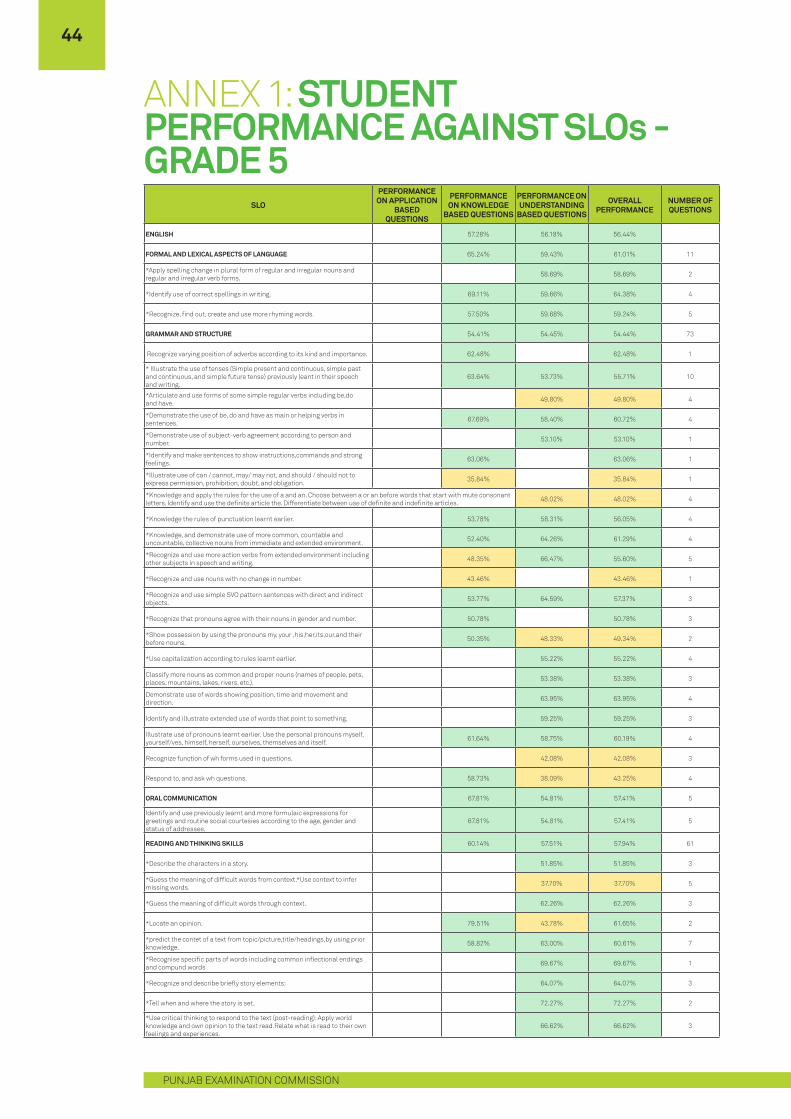
Within each subject, teacher should focus on SLOs in which student performance is below 40%, as shown in the Annexes 1 & 2.
43
REPORT ON GRADE 5 AND 8 EXAMS - 2015
SLO
PERFORMANCE ON APPLICATION
BASED QUESTIONS
PERFORMANCE ON KNOWLEDGE
BASED QUESTIONS
PERFORMANCE ON UNDERSTANDING
BASED QUESTIONS
OVERALL PERFORMANCE
NUMBER OF QUESTIONS
ENGLISH 57.28% 56.18% 56.44%
FORMAL AND LEXICAL ASPECTS OF LANGUAGE 65.24% 59.43% 61.01% 11
*Apply spelling change in plural form of regular and irregular nouns and regular and irregular verb forms. 58.69% 58.69% 2
*Identify use of correct spellings in writing. 69.11% 59.66% 64.38% 4
*Recognize, find out, create and use more rhyming words. 57.50% 59.68% 59.24% 5
GRAMMAR AND STRUCTURE 54.41% 54.45% 54.44% 73
Recognize varying position of adverbs according to its kind and importance. 62.48% 62.48% 1
* Illustrate the use of tenses (Simple present and continuous, simple past and continuous, and simple future tense) previously leant in their speech and writing.
63.64% 53.73% 55.71% 10
*Articulate and use forms of some simple regular verbs including be,do and have. 49.80% 49.80% 4
*Demonstrate the use of be, do and have as main or helping verbs in sentences. 67.69% 58.40% 60.72% 4
*Demonstrate use of subject-verb agreement according to person and number. 53.10% 53.10% 1
*Identify and make sentences to show instructions,commands and strong feelings. 63.06% 63.06% 1
*Illustrate use of can / cannot, may/ may not, and should / should not to express permission, prohibition, doubt, and obligation. 35.84% 35.84% 1
*Knowledge and apply the rules for the use of a and an. Choose between a or an before words that start with mute consonant letters. Identify and use the definite article the. Differentiate between use of definite and indefinite articles. 48.02% 48.02% 4
*Knowledge the rules of punctuation learnt earlier. 53.78% 58.31% 56.05% 4
*Knowledge, and demonstrate use of more common, countable and uncountable, collective nouns from immediate and extended environment. 52.40% 64.26% 61.29% 4
*Recognize and use more action verbs from extended environment including other subjects in speech and writing. 48.35% 66.47% 55.60% 5
*Recognize and use nouns with no change in number. 43.46% 43.46% 1
*Recognize and use simple SVO pattern sentences with direct and indirect objects. 53.77% 64.59% 57.37% 3
*Recognize that pronouns agree with their nouns in gender and number. 50.78% 50.78% 3
*Show possession by using the pronouns my, your ,his,her,its,our,and their before nouns. 50.35% 48.33% 49.34% 2
*Use capitalization according to rules learnt earlier. 55.22% 55.22% 4
Classify more nouns as common and proper nouns (names of people, pets, places, mountains, lakes, rivers, etc.). 53.38% 53.38% 3
Demonstrate use of words showing position, time and movement and direction. 63.95% 63.95% 4
Identify and illustrate extended use of words that point to something. 59.25% 59.25% 3
Illustrate use of pronouns learnt earlier. Use the personal pronouns myself, yourself/ves, himself, herself, ourselves, themselves and itself. 61.64% 58.75% 60.19% 4
Recognize function of wh forms used in questions. 42.08% 42.08% 3
Respond to, and ask wh questions. 58.73% 38.09% 43.25% 4
ORAL COMMUNICATION 67.81% 54.81% 57.41% 5
Identify and use previously learnt and more formulaic expressions for greetings and routine social courtesies according to the age, gender and status of addressee.
67.81% 54.81% 57.41% 5
READING AND THINKING SKILLS 60.14% 57.51% 57.94% 61
*Describe the characters in a story. 51.85% 51.85% 3
*Guess the meaning of difficult words from context.*Use context to infer missing words. 37.70% 37.70% 5
*Guess the meaning of difficult words through context. 62.26% 62.26% 3
*Locate an opinion. 79.51% 43.78% 61.65% 2
*predict the contet of a text from topic/picture,title/headings,by using prior knowledge. 58.82% 63.00% 60.61% 7
*Recognise specific parts of words including common inflectional endings and compund words 69.67% 69.67% 1
*Recognize and describe briefly story elements: 64.07% 64.07% 3
*Tell when and where the story is set. 72.27% 72.27% 2
*Use critical thinking to respond to the text (post-reading): Apply world knowledge and own opinion to the text read.Relate what is read to their own feelings and experiences.
66.62% 66.62% 3
ANNEX 1: STUDENT PERFORMANCE AGAINST SLOs - GRADE 5
44
PUNJAB EXAMINATION COMMISSION
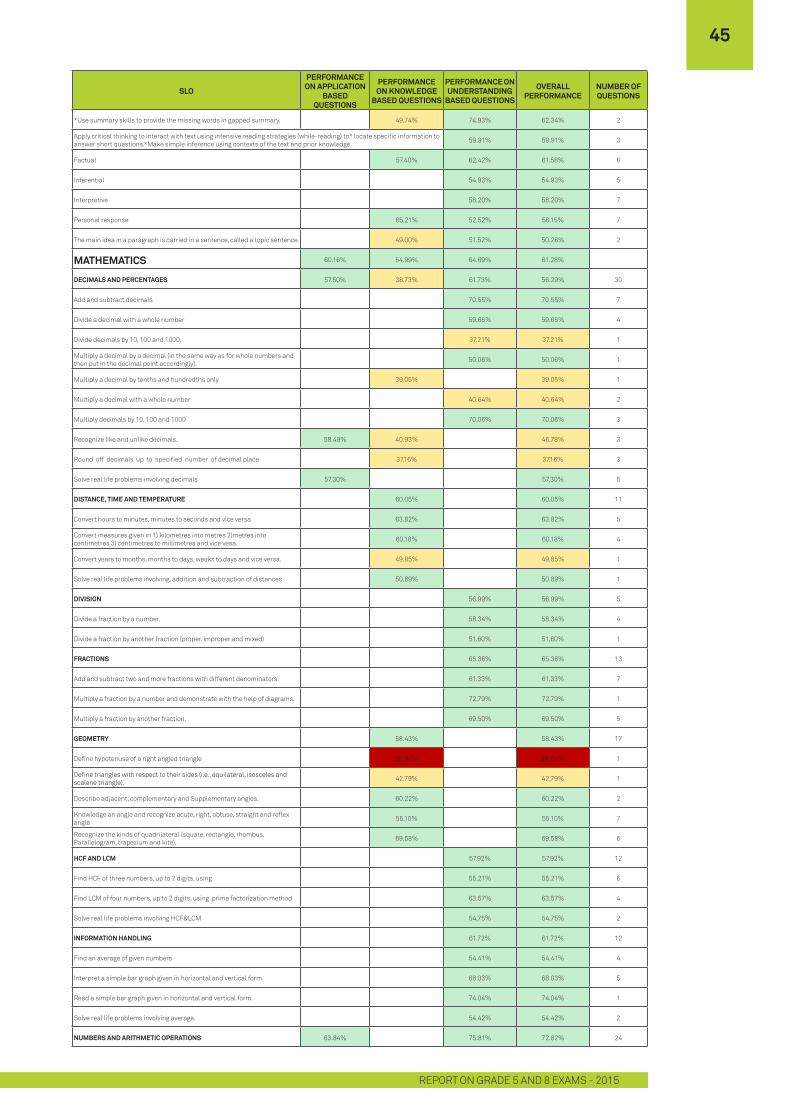
SLO
PERFORMANCE ON APPLICATION
BASED QUESTIONS
PERFORMANCE ON KNOWLEDGE
BASED QUESTIONS
PERFORMANCE ON UNDERSTANDING
BASED QUESTIONS
OVERALL PERFORMANCE
NUMBER OF QUESTIONS
*Use summary skills to provide the missing words in gapped summary. 49.74% 74.93% 62.34% 2
Apply critical thinking to interact with text using intensive reading strategies (while-reading) to* locate specific information to answer short questions.*Make simple inference using contexts of the text and prior knowledge 59.91% 59.91% 3
Factual 57.40% 62.42% 61.58% 6
Inferential 54.93% 54.93% 5
Interpretive 58.20% 58.20% 7
Personal response 65.21% 52.52% 56.15% 7
The main idea in a paragraph is carried in a sentence, called a topic sentence. 49.00% 51.52% 50.26% 2
MATHEMATICS 60.16% 54.99% 64.69% 61.28%
DECIMALS AND PERCENTAGES 57.50% 38.73% 61.73% 56.29% 30
Add and subtract decimals 70.55% 70.55% 7
Divide a decimal with a whole number 59.65% 59.65% 4
Divide decimals by 10, 100 and 1000. 37.21% 37.21% 1
Multiply a decimal by a decimal (in the same way as for whole numbers and then put in the decimal point accordingly). 50.06% 50.06% 1
Multiply a decimal by tenths and hundredths only 39.05% 39.05% 1
Multiply a decimal with a whole number 40.64% 40.64% 2
Multiply decimals by 10, 100 and 1000 70.06% 70.06% 3
Recognize like and unlike decimals. 58.49% 40.93% 46.78% 3
Round off decimals up to specified number of decimal place 37.16% 37.16% 3
Solve real life problems involving decimals 57.30% 57.30% 5
DISTANCE, TIME AND TEMPERATURE 60.05% 60.05% 11
Convert hours to minutes, minutes to seconds and vice versa 63.82% 63.82% 5
Convert measures given in 1) kilometres into metres 2)metres into centimetres 3) centimetres to millimetres and vice vesa. 60.18% 60.18% 4
Convert years to months, months to days, weeks to days and vice versa. 49.85% 49.85% 1
Solve real life problems involving, addition and subtraction of distances 50.89% 50.89% 1
DIVISION 56.99% 56.99% 5
Divide a fraction by a number. 58.34% 58.34% 4
Divide a fraction by another fraction (proper, improper and mixed) 51.60% 51.60% 1
FRACTIONS 65.36% 65.36% 13
Add and subtract two and more fractions with different denominators. 61.33% 61.33% 7
Multiply a fraction by a number and demonstrate with the help of diagrams. 72.79% 72.79% 1
Multiply a fraction by another fraction. 69.50% 69.50% 5
GEOMETRY 58.43% 58.43% 17
Define hypotenuse of a right angled triangle 26.84% 26.84% 1
Define triangles with respect to their sides (i.e., equilateral, isosceles and scalene triangle). 42.79% 42.79% 1
Describe adjacent, complementary and Supplementary angles. 60.22% 60.22% 2
Knowledge an angle and recognize acute, right, obtuse, straight and reflex angle 55.10% 55.10% 7
Recognize the kinds of quadrilateral (square, rectangle, rhombus, Parallelogram, trapezium and kite). 69.58% 69.58% 6
HCF AND LCM 57.92% 57.92% 12
Find HCF of three numbers, up to 2 digits, using 55.21% 55.21% 6
Find LCM of four numbers, up to 2 digits, using prime factorization method 63.57% 63.57% 4
Solve real life problems involving HCF&LCM 54.75% 54.75% 2
INFORMATION HANDLING 61.72% 61.72% 12
Find an average of given numbers 54.41% 54.41% 4
Interpret a simple bar graph given in horizontal and vertical form. 68.03% 68.03% 5
Read a simple bar graph given in horizontal and vertical form. 74.04% 74.04% 1
Solve real life problems involving average. 54.42% 54.42% 2
NUMBERS AND ARITHMETIC OPERATIONS 63.84% 75.81% 72.82% 24
45
REPORT ON GRADE 5 AND 8 EXAMS - 2015

SLO
PERFORMANCE ON APPLICATION
BASED QUESTIONS
PERFORMANCE ON KNOWLEDGE
BASED QUESTIONS
PERFORMANCE ON UNDERSTANDING
BASED QUESTIONS
OVERALL PERFORMANCE
NUMBER OF QUESTIONS
Add numbers of complexity and of arbitrary size 82.06% 82.06% 4
Divide numbers, up to 6 digits, by 2 digits and 3 digits numbers 75.03% 75.03% 1
Multiply numbers, up to 6 digits, by 10, 100 and 1000. 85.28% 85.28% 2
Multiply numbers, up to 6 digits, by 2 digits and 3 digits numbers 69.91% 69.91% 2
Recognize BODMAS rule, using only parentheses ( ). 58.40% 58.40% 1
Solve real life problems involving mixed operations of addition, subtraction, multiplication and division. 62.40% 62.40% 4
Subtract numbers of complexity and of arbitrary size 70.52% 70.52% 6
The main idea in a paragraph is carried in a sentence, called a topic sentence. 74.09% 74.09% 1
Verify distributive laws. 76.27% 76.27% 3
PERIMETER AND AREA 49.11% 46.73% 48.93% 13
Apply formulas to find perimeter and area of a square and rectangular region.. 49.14% 49.14% 7
Differentiate between perimeter and area of a region 46.73% 46.73% 1
Identify the units for measurement of perimeter and area 41.39% 41.39% 2
Solve appropriate problems of perimeter and area 41.83% 41.83% 1
Write the formulas for perimeter and area of a square and rectangle 60.40% 60.40% 2
UNITARY METHOD 70.71% 46.64% 68.86% 13
Calculate the value of a number of same type of objects when the value of another of the same type is given (unitary method) 64.58% 64.58% 6
Calculate the value of many objects of the same kind when the value of one of these objects is given.. 76.83% 76.83% 6
Solve real life problems involving direct and inverse proportion (by unitary method).roof 46.64% 46.64% 1
SCIENCE 51.02% 52.57% 53.42% 52.98%
CLASSIFICATION OF LIVING THINGS 43.14% 54.74% 57.58% 55.43% 28
Classify the flowering plants into two major groups and give examples of each group. 44.52% 48.55% 46.54% 2
Classify vertebrates into mammals, reptiles, fish, birds and amphibians on the basis of their characteristics. 41.75% 58.14% 58.09% 55.39% 6
Compare flowering and non flowering plants. 55.18% 55.18% 1
Compare the structure of a monocot and a dicot seed. 31.65% 36.33% 33.52% 5
Define classification 81.37% 78.14% 80.29% 3
Differentiate between vertebrates and invertebrates according to key characteristics. 47.98% 66.30% 60.19% 3
Explain the need and importance of Classification. 74.60% 74.60% 2
Identify key characteristics of worms and insects. 39.23% 54.83% 50.93% 4
Identify vertebrates and invertebrates from their surroundings. 82.87% 46.70% 64.79% 2
ELECTRICITY AND MAGNETISM 50.28% 48.73% 49.33% 18
Conduct an experiment to show the magnetic field of a bar magnet. 45.65% 53.90% 49.77% 2
Describe flow of electric current in an electrical circuit. 57.97% 40.10% 49.03% 4
Describe fuse and its importance in any electric circuit. 55.68% 58.94% 58.13% 4
Explain the phenomenon of lightening. 56.91% 47.64% 49.96% 4
Explain the production of static electrical charges in some common materials. 38.89% 43.00% 40.26% 3
Explore different electromagnetic devices used in their daily life. 39.16% 39.16% 1
ENVIRONMENTAL POLLUTION 67.07% 48.99% 55.50% 54.19% 16
Describe different kinds of pollution. 73.57% 73.57% 2
Differentiate between biodegradable and non biodegradable materials. 67.07% 53.39% 35.96% 48.09% 4
Explain main causes of water, air and land pollution. 46.09% 62.31% 55.82% 5
Explain the effects of water, air and land pollution on environment and suggest ways to reduce them. 40.12% 53.23% 48.86% 3
Plan and conduct a campaign to bring awareness to a problem of environmental pollution in their surroundings. 59.24% 59.24% 1
Suggest ways to reduce the impact of non biodegradable materials. 42.59% 42.59% 1
FORCES AND MACHINES 39.61% 47.26% 58.02% 51.87% 24
Compare the three kinds of levers using examples. 39.13% 39.13% 3
46
PUNJAB EXAMINATION COMMISSION
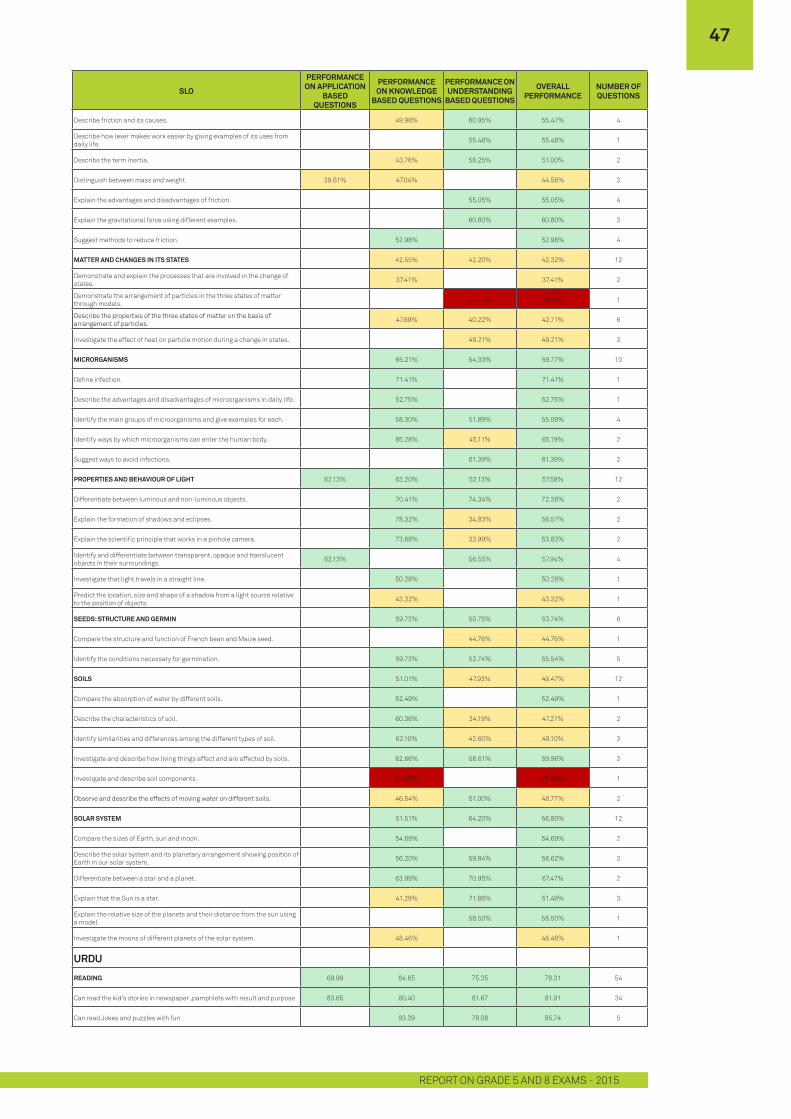
SLO
PERFORMANCE ON APPLICATION
BASED QUESTIONS
PERFORMANCE ON KNOWLEDGE
BASED QUESTIONS
PERFORMANCE ON UNDERSTANDING
BASED QUESTIONS
OVERALL PERFORMANCE
NUMBER OF QUESTIONS
Describe friction and its causes. 49.98% 60.95% 55.47% 4
Describe how lever makes work easier by giving examples of its uses from daily life. 55.48% 55.48% 1
Describe the term inertia. 43.76% 58.25% 51.00% 2
Distinguish between mass and weight. 39.61% 47.04% 44.56% 3
Explain the advantages and disadvantages of friction. 55.05% 55.05% 4
Explain the gravitational force using different examples. 60.80% 60.80% 3
Suggest methods to reduce friction. 52.98% 52.98% 4
MATTER AND CHANGES IN ITS STATES 42.55% 42.20% 42.32% 12
Demonstrate and explain the processes that are involved in the change of states. 37.41% 37.41% 2
Demonstrate the arrangement of particles in the three states of matter through models. 29.10% 29.10% 1
Describe the properties of the three states of matter on the basis of arrangement of particles. 47.69% 40.22% 42.71% 6
Investigate the effect of heat on particle motion during a change in states. 49.21% 49.21% 3
MICRORGANISMS 65.21% 54.33% 59.77% 10
Define infection. 71.41% 71.41% 1
Describe the advantages and disadvantages of microorganisms in daily life. 52.75% 52.75% 1
Identify the main groups of microorganisms and give examples for each. 58.30% 51.89% 55.09% 4
Identify ways by which microorganisms can enter the human body. 85.28% 45.11% 65.19% 2
Suggest ways to avoid infections. 61.39% 61.39% 2
PROPERTIES AND BEHAVIOUR OF LIGHT 62.13% 63.20% 52.13% 57.58% 12
Differentiate between luminous and non-luminous objects. 70.41% 74.34% 72.38% 2
Explain the formation of shadows and eclipses. 78.32% 34.83% 56.57% 2
Explain the scientific principle that works in a pinhole camera. 73.68% 33.99% 53.83% 2
Identify and differentiate between transparent, opaque and translucent objects in their surroundings. 62.13% 56.55% 57.94% 4
Investigate that light travels in a straight line. 50.28% 50.28% 1
Predict the location, size and shape of a shadow from a light source relative to the position of objects. 43.32% 43.32% 1
SEEDS: STRUCTURE AND GERMIN 59.73% 50.75% 53.74% 6
Compare the structure and function of French bean and Maize seed. 44.76% 44.76% 1
Identify the conditions necessary for germination. 59.73% 52.74% 55.54% 5
SOILS 51.01% 47.93% 49.47% 12
Compare the absorption of water by different soils. 52.49% 52.49% 1
Describe the characteristics of soil. 60.36% 34.19% 47.27% 2
Identify similarities and differences among the different types of soil. 62.10% 42.60% 49.10% 3
Investigate and describe how living things affect and are affected by soils. 62.66% 58.61% 59.96% 3
Investigate and describe soil components. 21.93% 21.93% 1
Observe and describe the effects of moving water on different soils. 46.54% 51.00% 48.77% 2
SOLAR SYSTEM 51.51% 64.20% 56.80% 12
Compare the sizes of Earth, sun and moon. 54.69% 54.69% 2
Describe the solar system and its planetary arrangement showing position of Earth in our solar system. 56.20% 59.84% 58.62% 3
Differentiate between a star and a planet. 63.99% 70.95% 67.47% 2
Explain that the Sun is a star. 41.29% 71.88% 51.49% 3
Explain the relative size of the planets and their distance from the sun using a model. 58.50% 58.50% 1
Investigate the moons of different planets of the solar system. 48.46% 48.46% 1
URDU
READING 69.99 84.65 75.35 78.31 54
Can read the kid's stories in newspaper ,pamphlets with result and purpose 83.65 80.40 81.67 81.91 34
Can read Jokes and puzzles with fun 93.39 78.08 85.74 5
47
REPORT ON GRADE 5 AND 8 EXAMS - 2015
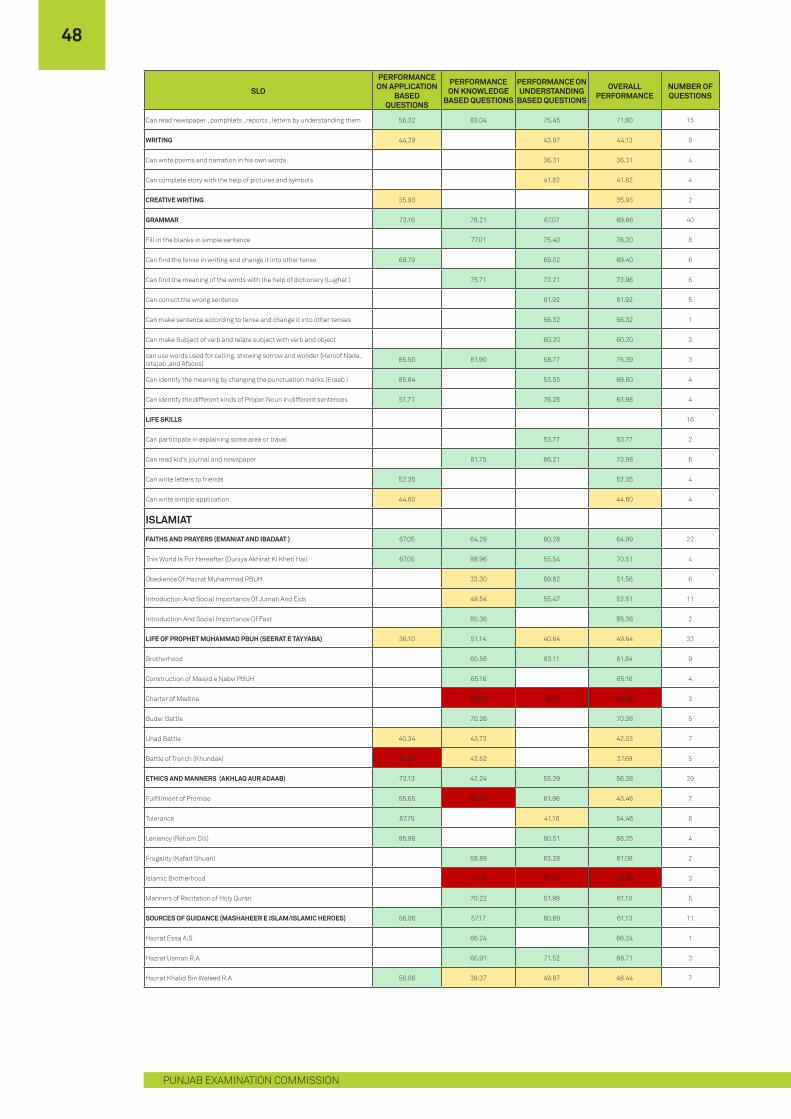
SLO
PERFORMANCE ON APPLICATION
BASED QUESTIONS
PERFORMANCE ON KNOWLEDGE
BASED QUESTIONS
PERFORMANCE ON UNDERSTANDING
BASED QUESTIONS
OVERALL PERFORMANCE
NUMBER OF QUESTIONS
Can read newspaper , pamphlets , reports , letters by understanding them 56.32 83.04 75.45 71.60 15
WRITING 44.29 43.97 44.13 8
Can write poems and narration in his own words 36.31 36.31 4
Can complete story with the help of pictures and symbols 41.82 41.82 4
CREATIVE WRITING 35.93 35.93 2
GRAMMAR 73.16 78.21 67.07 69.66 40
Fill in the blanks in simple sentence 77.01 75.40 76.20 8
Can find the tense in writing and change it into other tense 69.79 69.02 69.40 6
Can find the meaning of the words with the help of dictionary (Lughat ) 75.71 72.21 73.96 6
Can correct the wrong sentence 81.92 81.92 5
Can make sentence according to tense and change it into other tenses 56.32 56.32 1
Can make Subject of verb and relate subject with verb and object 60.20 60.20 3
can use words used for calling, showing sorrow and wonder (Haroof Nada , Istajab ,and Afsoos) 85.50 81.90 58.77 75.39 3
Can identify the meaning by changing the punctuation marks (Eraab ) 85.64 53.55 69.60 4
Can identify the different kinds of Proper Noun in different sentences 51.71 76.25 63.98 4
LIFE SKILLS 16
Can participate in explaining some area or travel 53.77 53.77 2
Can read kid's journal and newspaper 81.75 66.21 73.98 6
Can write letters to friends 52.35 52.35 4
Can write simple application 44.60 44.60 4
ISLAMIAT
FAITHS AND PRAYERS (EMANIAT AND IBADAAT ) 67.05 64.29 60.28 64.99 22
This World Is For Hereafter (Duniya Akhirat Ki Kheti Hai) 67.05 88.96 55.54 70.51 4
Obedience Of Hazrat Muhammad PBUH 33.30 69.82 51.56 6
Introduction And Social Importance Of Jumah And Eids 49.54 55.47 52.51 11
Introduction And Social Importance Of Fast 85.36 85.36 2
LIFE OF PROPHET MUHAMMAD PBUH (SEERAT E TAYYABA) 36.10 51.14 40.64 49.64 33
Brotherhood 60.56 63.11 61.84 9
Construction of Masjid e Nabvi PBUH 65.16 65.16 4
Charter of Madina 23.59 18.17 20.88 3
Buder Battle 70.26 70.26 5
Uhad Battle 40.34 43.73 42.03 7
Battle of Trench (Khundak) 31.87 43.52 37.69 5
ETHICS AND MANNERS (AKHLAQ AUR ADAAB) 73.13 42.24 55.29 56.38 29
Fulfillment of Promise 55.65 12.78 61.96 43.46 7
Tolerance 67.75 41.16 54.46 8
Leniency (Reham Dili) 95.98 80.51 88.25 4
Frugality (Kafait Shuari) 58.89 63.28 61.08 2
Islamic Brotherhood 27.08 32.81 29.95 3
Manners of Recitation of Holy Quran 70.22 51.99 61.10 5
SOURCES OF GUIDANCE (MASHAHEER E ISLAM/ISLAMIC HEROES) 56.06 57.17 60.69 61.13 11
Hazrat Essa A.S 66.24 66.24 1
Hazrat Usman R.A 65.91 71.52 68.71 3
Hazrat Khalid Bin Waleed R.A 56.06 39.37 49.87 48.44 7
48
PUNJAB EXAMINATION COMMISSION
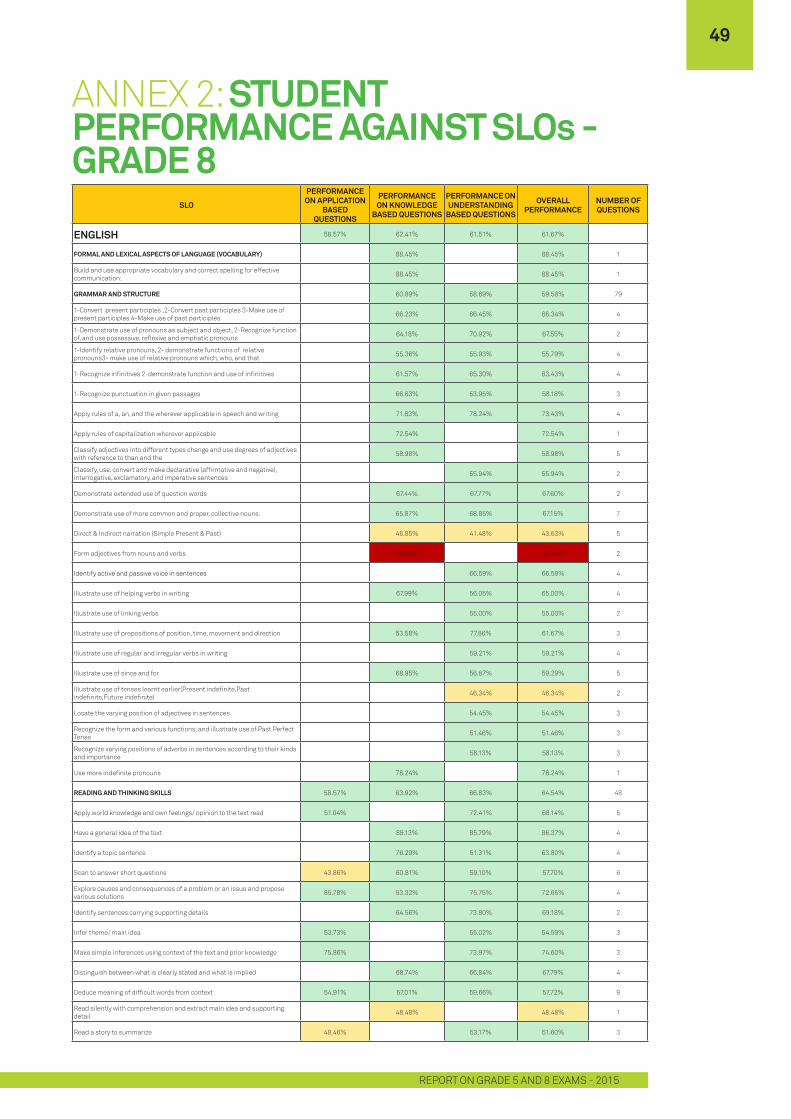
SLO
PERFORMANCE ON APPLICATION
BASED QUESTIONS
PERFORMANCE ON KNOWLEDGE
BASED QUESTIONS
PERFORMANCE ON UNDERSTANDING
BASED QUESTIONS
OVERALL PERFORMANCE
NUMBER OF QUESTIONS
ENGLISH 58.57% 62.41% 61.51% 61.67%
FORMAL AND LEXICAL ASPECTS OF LANGUAGE (VOCABULARY) 88.45% 88.45% 1
Build and use appropriate vocabulary and correct spelling for effective communication: 88.45% 88.45% 1
GRAMMAR AND STRUCTURE 60.89% 58.69% 59.58% 79
1-Convert present participles ,2-Convert past participles 3-Make use of present participles 4-Make use of past participles 66.23% 66.45% 66.34% 4
1-Demonstrate use of pronouns as subject and object, 2-Recognize function of, and use possessive, reflexive and emphatic pronouns 64.18% 70.92% 67.55% 2
1-Identify relative pronouns, 2- demonstrate functions of relative pronouns3- make use of relative pronouns which, who, and that 55.36% 55.93% 55.79% 4
1-Recognize infinitives 2-demonstrate function and use of infinitives 61.57% 65.30% 63.43% 4
1-Recognize punctuation in given passages 66.63% 53.95% 58.18% 3
Apply rules of a, an, and the wherever applicable in speech and writing 71.83% 78.24% 73.43% 4
Apply rules of capitalization wherever applicable 72.54% 72.54% 1
Classify adjectives into different types change and use degrees of adjectives with reference to than and the 58.98% 58.98% 5
Classify, use, convert and make declarative (affirmative and negative), interrogative, exclamatory, and imperative sentences 55.94% 55.94% 2
Demonstrate extended use of question words 67.44% 67.77% 67.60% 2
Demonstrate use of more common and proper, collective nouns. 65.87% 68.85% 67.15% 7
Direct & Indirect narration (Simple Present & Past) 46.85% 41.48% 43.63% 5
Form adjectives from nouns and verbs 20.44% 20.44% 2
Identify active and passive voice in sentences 66.59% 66.59% 4
Illustrate use of helping verbs in writing 67.99% 56.05% 65.00% 4
Illustrate use of linking verbs 55.00% 55.00% 2
Illustrate use of prepositions of position, time, movement and direction 53.58% 77.86% 61.67% 3
Illustrate use of regular and irregular verbs in writing 59.21% 59.21% 4
Illustrate use of since and for 68.95% 56.87% 59.29% 5
Illustrate use of tenses learnt earlier(Present indefinite,Past indefinite,Future indefinite) 46.34% 46.34% 2
Locate the varying position of adjectives in sentences 54.45% 54.45% 3
Recognize the form and various functions; and illustrate use of Past Perfect Tense 51.46% 51.46% 3
Recognize varying positions of adverbs in sentences according to their kinds and importance 58.13% 58.13% 3
Use more indefinite pronouns 78.24% 78.24% 1
READING AND THINKING SKILLS 58.57% 63.92% 66.83% 64.54% 48
Apply world knowledge and own feelings/ opinion to the text read 51.04% 72.41% 68.14% 5
Have a general idea of the text 88.13% 85.79% 86.37% 4
Identify a topic sentence 76.29% 51.31% 63.80% 4
Scan to answer short questions 43.86% 60.81% 59.10% 57.70% 6
Explore causes and consequences of a problem or an issue and propose various solutions 85.78% 53.32% 75.75% 72.65% 4
Identify sentences carrying supporting details 64.56% 73.80% 69.18% 2
Infer theme/ main idea 53.73% 55.02% 54.59% 3
Make simple inferences using context of the text and prior knowledge 75.86% 73.97% 74.60% 3
Distinguish between what is clearly stated and what is implied 68.74% 66.84% 67.79% 4
Deduce meaning of difficult words from context 54.91% 57.01% 59.66% 57.72% 9
Read silently with comprehension and extract main idea and supporting detail 48.48% 48.48% 1
Read a story to summarize 48.46% 53.17% 51.60% 3
ANNEX 2: STUDENT PERFORMANCE AGAINST SLOs - GRADE 8
49
REPORT ON GRADE 5 AND 8 EXAMS - 2015
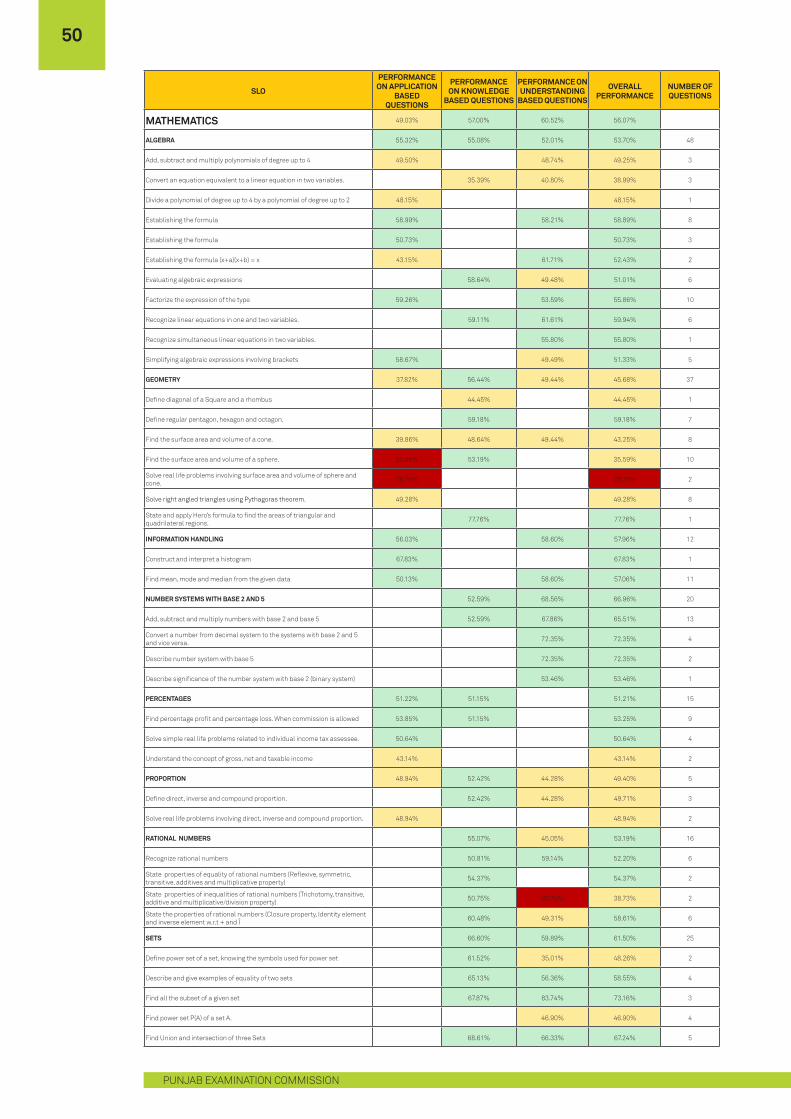
SLO
PERFORMANCE ON APPLICATION
BASED QUESTIONS
PERFORMANCE ON KNOWLEDGE
BASED QUESTIONS
PERFORMANCE ON UNDERSTANDING
BASED QUESTIONS
OVERALL PERFORMANCE
NUMBER OF QUESTIONS
MATHEMATICS 49.03% 57.00% 60.52% 56.07%
ALGEBRA 55.32% 55.08% 52.01% 53.70% 48
Add, subtract and multiply polynomials of degree up to 4 49.50% 48.74% 49.25% 3
Convert an equation equivalent to a linear equation in two variables. 35.39% 40.80% 38.99% 3
Divide a polynomial of degree up to 4 by a polynomial of degree up to 2 48.15% 48.15% 1
Establishing the formula 58.99% 58.21% 58.89% 8
Establishing the formula 50.73% 50.73% 3
Establishing the formula (x+a)(x+b) = x 43.15% 61.71% 52.43% 2
Evaluating algebraic expressions 58.64% 49.48% 51.01% 6
Factorize the expression of the type 59.26% 53.59% 55.86% 10
Recognize linear equations in one and two variables. 59.11% 61.61% 59.94% 6
Recognize simultaneous linear equations in two variables. 55.80% 55.80% 1
Simplifying algebraic expressions involving brackets 58.67% 49.49% 51.33% 5
GEOMETRY 37.82% 56.44% 49.44% 45.68% 37
Define diagonal of a Square and a rhombus 44.45% 44.45% 1
Define regular pentagon, hexagon and octagon. 59.18% 59.18% 7
Find the surface area and volume of a cone. 39.86% 48.64% 49.44% 43.25% 8
Find the surface area and volume of a sphere. 23.86% 53.19% 35.59% 10
Solve real life problems involving surface area and volume of sphere and cone. 28.79% 28.79% 2
Solve right angled triangles using Pythagoras theorem. 49.28% 49.28% 8
State and apply Hero’s formula to find the areas of triangular and quadrilateral regions. 77.76% 77.76% 1
INFORMATION HANDLING 56.03% 58.60% 57.96% 12
Construct and interpret a histogram 67.83% 67.83% 1
Find mean, mode and median from the given data 50.13% 58.60% 57.06% 11
NUMBER SYSTEMS WITH BASE 2 AND 5 52.59% 68.56% 66.96% 20
Add, subtract and multiply numbers with base 2 and base 5 52.59% 67.86% 65.51% 13
Convert a number from decimal system to the systems with base 2 and 5 and vice versa. 72.35% 72.35% 4
Describe number system with base 5 72.35% 72.35% 2
Describe significance of the number system with base 2 (binary system) 53.46% 53.46% 1
PERCENTAGES 51.22% 51.15% 51.21% 15
Find percentage profit and percentage loss. When commission is allowed 53.85% 51.15% 53.25% 9
Solve simple real life problems related to individual income tax assessee. 50.64% 50.64% 4
Understand the concept of gross, net and taxable income 43.14% 43.14% 2
PROPORTION 48.94% 52.42% 44.28% 49.40% 5
Define direct, inverse and compound proportion. 52.42% 44.28% 49.71% 3
Solve real life problems involving direct, inverse and compound proportion. 48.94% 48.94% 2
RATIONAL NUMBERS 55.07% 45.05% 53.19% 16
Recognize rational numbers 50.81% 59.14% 52.20% 6
State properties of equality of rational numbers (Reflexive, symmetric, transitive, additives and multiplicative property) 54.37% 54.37% 2
State properties of inequalities of rational numbers (Trichotomy, transitive, additive and multiplicative/division property) 50.75% 26.70% 38.73% 2
State the properties of rational numbers (Closure property, Identity element and inverse element w.r.t + and Î 60.48% 49.31% 58.61% 6
SETS 66.60% 59.89% 61.50% 25
Define power set of a set, knowing the symbols used for power set 61.52% 35.01% 48.26% 2
Describe and give examples of equality of two sets 65.13% 56.36% 58.55% 4
Find all the subset of a given set 67.87% 83.74% 73.16% 3
Find power set P(A) of a set A. 46.90% 46.90% 4
Find Union and intersection of three Sets 68.61% 66.33% 67.24% 5
50
PUNJAB EXAMINATION COMMISSION
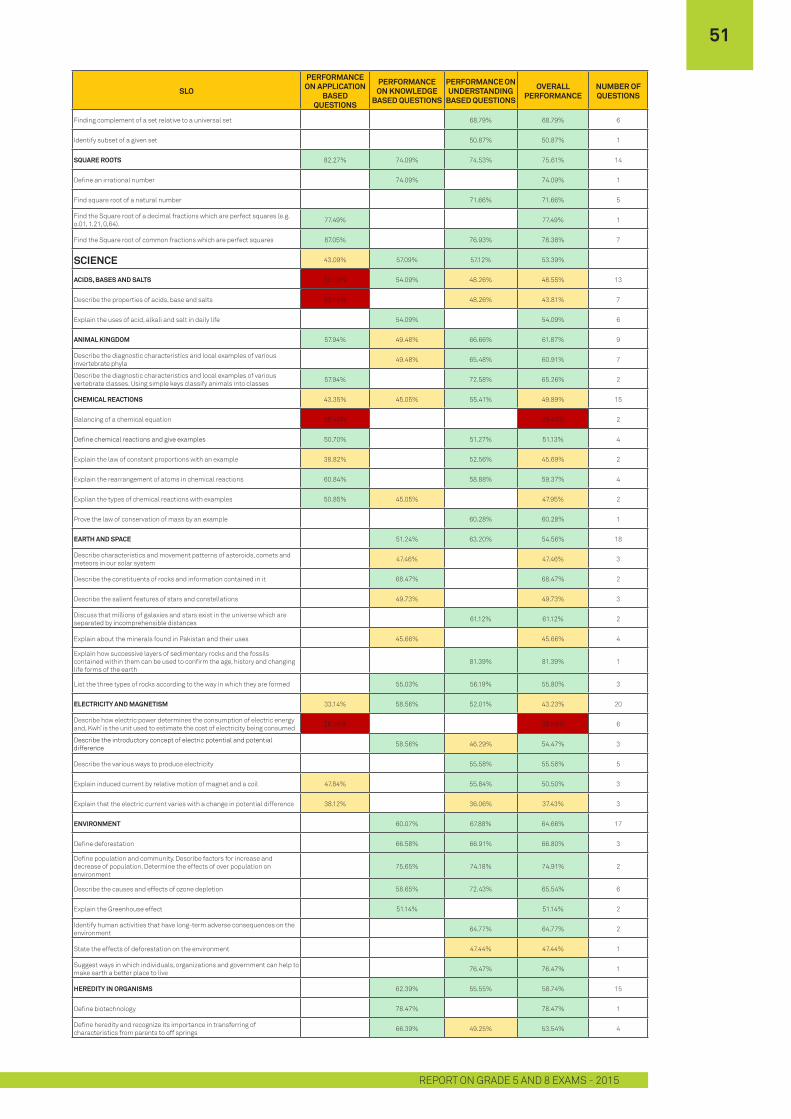
SLO
PERFORMANCE ON APPLICATION
BASED QUESTIONS
PERFORMANCE ON KNOWLEDGE
BASED QUESTIONS
PERFORMANCE ON UNDERSTANDING
BASED QUESTIONS
OVERALL PERFORMANCE
NUMBER OF QUESTIONS
Finding complement of a set relative to a universal set 68.79% 68.79% 6
Identify subset of a given set 50.87% 50.87% 1
SQUARE ROOTS 82.27% 74.09% 74.53% 75.61% 14
Define an irrational number 74.09% 74.09% 1
Find square root of a natural number 71.66% 71.66% 5
Find the Square root of a decimal fractions which are perfect squares (e.g. o.01, 1.21, 0,64). 77.49% 77.49% 1
Find the Square root of common fractions which are perfect squares 87.05% 76.93% 78.38% 7
SCIENCE 43.09% 57.09% 57.12% 53.39%
ACIDS, BASES AND SALTS 32.68% 54.09% 48.26% 48.55% 13
Describe the properties of acids, base and salts 32.68% 48.26% 43.81% 7
Explain the uses of acid, alkali and salt in daily life 54.09% 54.09% 6
ANIMAL KINGDOM 57.94% 49.48% 66.66% 61.87% 9
Describe the diagnostic characteristics and local examples of various invertebrate phyla 49.48% 65.48% 60.91% 7
Describe the diagnostic characteristics and local examples of various vertebrate classes. Using simple keys classify animals into classes 57.94% 72.58% 65.26% 2
CHEMICAL REACTIONS 43.35% 45.05% 55.41% 49.89% 15
Balancing of a chemical equation 29.44% 29.44% 2
Define chemical reactions and give examples 50.70% 51.27% 51.13% 4
Explain the law of constant proportions with an example 38.82% 52.56% 45.69% 2
Explain the rearrangement of atoms in chemical reactions 60.84% 58.88% 59.37% 4
Explian the types of chemical reactions with examples 50.85% 45.05% 47.95% 2
Prove the law of conservation of mass by an example 60.28% 60.28% 1
EARTH AND SPACE 51.24% 63.20% 54.56% 18
Describe characteristics and movement patterns of asteroids, comets and meteors in our solar system 47.46% 47.46% 3
Describe the constituents of rocks and information contained in it 68.47% 68.47% 2
Describe the salient features of stars and constellations 49.73% 49.73% 3
Discuss that millions of galaxies and stars exist in the universe which are separated by incomprehensible distances 61.12% 61.12% 2
Explain about the minerals found in Pakistan and their uses 45.66% 45.66% 4
Explain how successive layers of sedimentary rocks and the fossils contained within them can be used to confirm the age, history and changing life forms of the earth
81.39% 81.39% 1
List the three types of rocks according to the way in which they are formed 55.03% 56.19% 55.80% 3
ELECTRICITY AND MAGNETISM 33.14% 58.56% 52.01% 43.23% 20
Describe how electric power determines the consumption of electric energy and, Kwh’ is the unit used to estimate the cost of electricity being consumed 26.59% 26.59% 6
Describe the introductory concept of electric potential and potential difference 58.56% 46.29% 54.47% 3
Describe the various ways to produce electricity 55.58% 55.58% 5
Explain induced current by relative motion of magnet and a coil 47.84% 55.84% 50.50% 3
Explain that the electric current varies with a change in potential difference 38.12% 36.06% 37.43% 3
ENVIRONMENT 60.07% 67.88% 64.66% 17
Define deforestation 66.58% 66.91% 66.80% 3
Define population and community. Describe factors for increase and decrease of population. Determine the effects of over population on environment
75.65% 74.18% 74.91% 2
Describe the causes and effects of ozone depletion 58.65% 72.43% 65.54% 6
Explain the Greenhouse effect 51.14% 51.14% 2
Identify human activities that have long-term adverse consequences on the environment 64.77% 64.77% 2
State the effects of deforestation on the environment 47.44% 47.44% 1
Suggest ways in which individuals, organizations and government can help to make earth a better place to live 76.47% 76.47% 1
HEREDITY IN ORGANISMS 62.39% 55.55% 58.74% 15
Define biotechnology 78.47% 78.47% 1
Define heredity and recognize its importance in transferring of characteristics from parents to off springs 66.39% 49.25% 53.54% 4
51
REPORT ON GRADE 5 AND 8 EXAMS - 2015
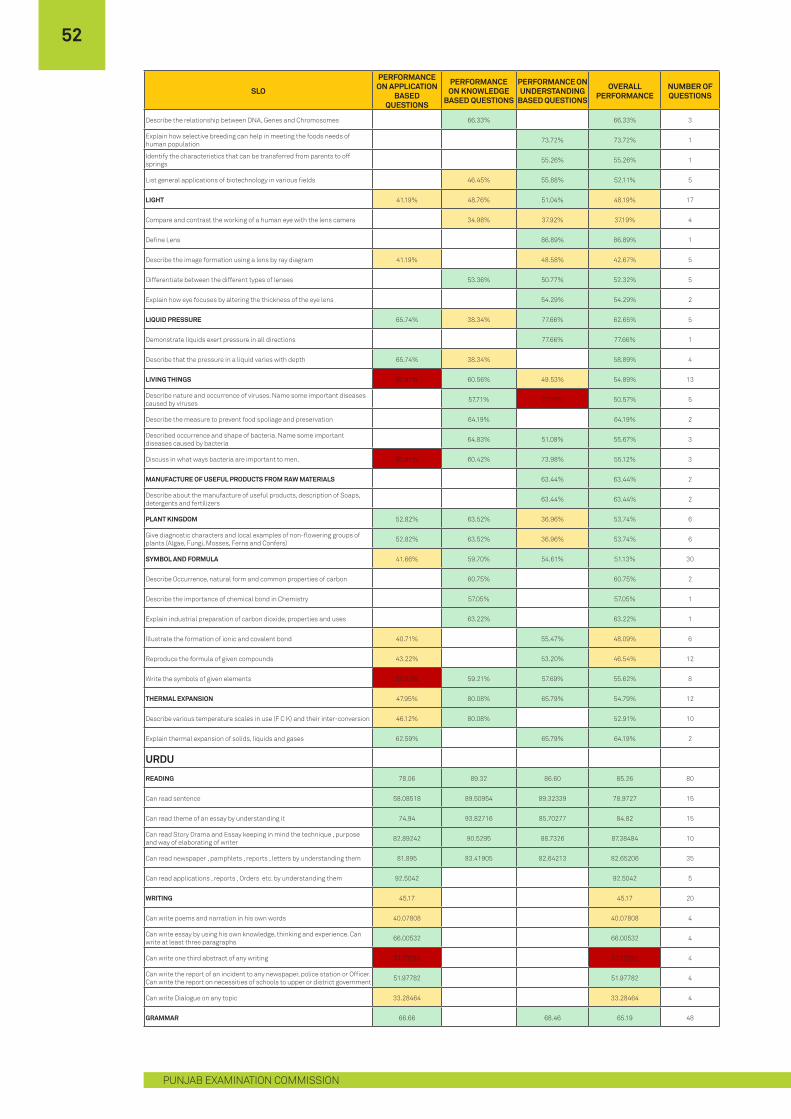
SLO
PERFORMANCE ON APPLICATION
BASED QUESTIONS
PERFORMANCE ON KNOWLEDGE
BASED QUESTIONS
PERFORMANCE ON UNDERSTANDING
BASED QUESTIONS
OVERALL PERFORMANCE
NUMBER OF QUESTIONS
Describe the relationship between DNA, Genes and Chromosomes 66.33% 66.33% 3
Explain how selective breeding can help in meeting the foods needs of human population 73.72% 73.72% 1
Identify the characteristics that can be transferred from parents to off springs 55.26% 55.26% 1
List general applications of biotechnology in various fields 46.45% 55.88% 52.11% 5
LIGHT 41.19% 48.76% 51.04% 48.19% 17
Compare and contrast the working of a human eye with the lens camera 34.98% 37.92% 37.19% 4
Define Lens 86.89% 86.89% 1
Describe the image formation using a lens by ray diagram 41.19% 48.58% 42.67% 5
Differentiate between the different types of lenses 53.36% 50.77% 52.32% 5
Explain how eye focuses by altering the thickness of the eye lens 54.29% 54.29% 2
LIQUID PRESSURE 65.74% 38.34% 77.66% 62.65% 5
Demonstrate liquids exert pressure in all directions 77.66% 77.66% 1
Describe that the pressure in a liquid varies with depth 65.74% 38.34% 58.89% 4
LIVING THINGS 30.97% 60.56% 49.53% 54.89% 13
Describe nature and occurrence of viruses. Name some important diseases caused by viruses 57.71% 21.97% 50.57% 5
Describe the measure to prevent food spoliage and preservation 64.19% 64.19% 2
Described occurrence and shape of bacteria. Name some important diseases caused by bacteria 64.83% 51.08% 55.67% 3
Discuss in what ways bacteria are important to men. 30.97% 60.42% 73.98% 55.12% 3
MANUFACTURE OF USEFUL PRODUCTS FROM RAW MATERIALS 63.44% 63.44% 2
Describe about the manufacture of useful products, description of Soaps, detergents and fertilizers 63.44% 63.44% 2
PLANT KINGDOM 52.82% 63.52% 36.96% 53.74% 6
Give diagnostic characters and local examples of non-flowering groups of plants (Algae, Fungi, Mosses, Ferns and Confers) 52.82% 63.52% 36.96% 53.74% 6
SYMBOL AND FORMULA 41.66% 59.70% 54.61% 51.13% 30
Describe Occurrence, natural form and common properties of carbon 60.75% 60.75% 2
Describe the importance of chemical bond in Chemistry 57.05% 57.05% 1
Explain industrial preparation of carbon dioxide, properties and uses 63.22% 63.22% 1
Illustrate the formation of ionic and covalent bond 40.71% 55.47% 48.09% 6
Reproduce the formula of given compounds 43.22% 53.20% 46.54% 12
Write the symbols of given elements 32.03% 59.21% 57.69% 55.62% 8
THERMAL EXPANSION 47.95% 80.08% 65.79% 54.79% 12
Describe various temperature scales in use (F C K) and their inter-conversion 46.12% 80.08% 52.91% 10
Explain thermal expansion of solids, liquids and gases 62.59% 65.79% 64.19% 2
URDU
READING 78.06 89.32 86.60 85.26 80
Can read sentence 58.08518 89.50954 89.32339 78.9727 15
Can read theme of an essay by understanding it 74.94 93.82716 85.70277 84.82 15
Can read Story Drama and Essay keeping in mind the technique , purpose and way of elaborating of writer 82.89242 90.5295 88.7326 87.38484 10
Can read newspaper , pamphlets , reports , letters by understanding them 81.895 83.41905 82.64213 82.65206 35
Can read applications , reports , Orders etc. by understanding them 92.5042 92.5042 5
WRITING 45.17 45.17 20
Can write poems and narration in his own words 40.07808 40.07808 4
Can write essay by using his own knowledge, thinking and experience. Can write at least three paragraphs 66.00532 66.00532 4
Can write one third abstract of any writing 31.73293 31.73293 4
Can write the report of an incident to any newspaper, police station or Officer. Can write the report on necessities of schools to upper or district government 51.97782 51.97782 4
Can write Dialogue on any topic 33.28464 33.28464 4
GRAMMAR 66.66 68.46 65.19 48
52
PUNJAB EXAMINATION COMMISSION
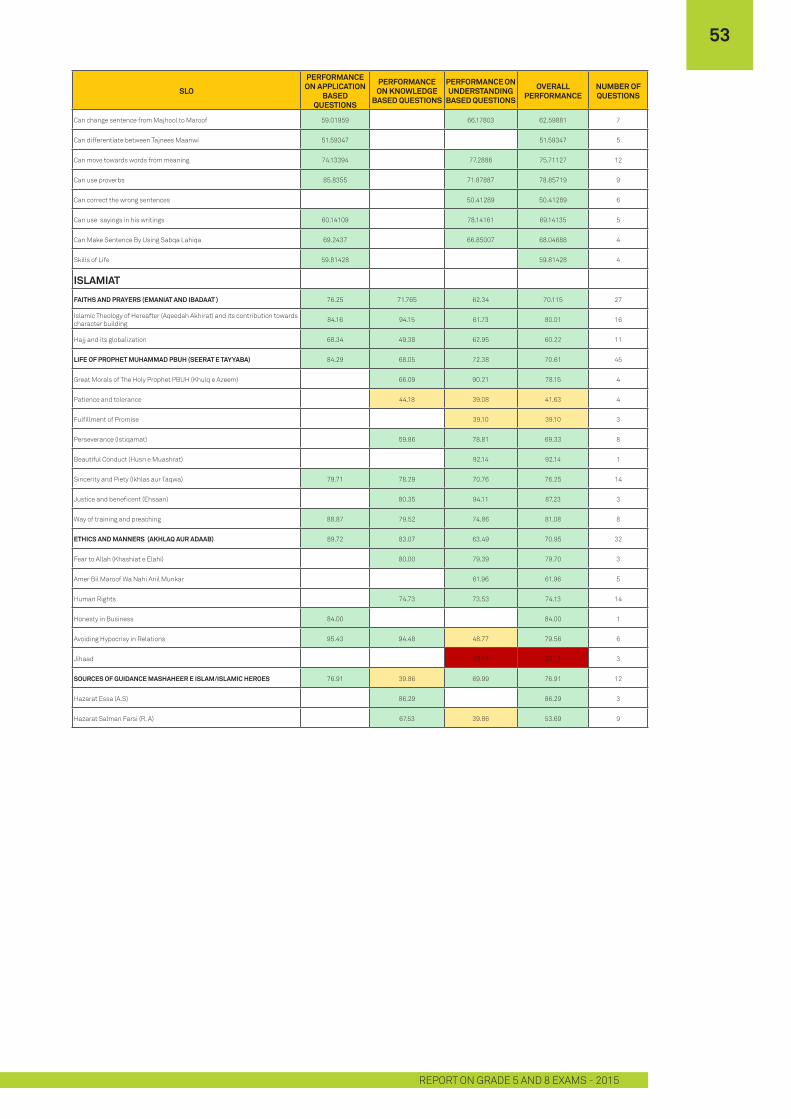
SLO
PERFORMANCE ON APPLICATION
BASED QUESTIONS
PERFORMANCE ON KNOWLEDGE
BASED QUESTIONS
PERFORMANCE ON UNDERSTANDING
BASED QUESTIONS
OVERALL PERFORMANCE
NUMBER OF QUESTIONS
Can change sentence from Majhool to Maroof 59.01959 66.17803 62.59881 7
Can differentiate between Tajnees Maanwi 51.59347 51.59347 5
Can move towards words from meaning 74.13394 77.2886 75.71127 12
Can use proverbs 85.8355 71.87887 78.85719 9
Can correct the wrong sentences 50.41289 50.41289 6
Can use sayings in his writings 60.14109 78.14161 69.14135 5
Can Make Sentence By Using Sabqa Lahiqa 69.2437 66.85007 68.04688 4
Skills of Life 59.81428 59.81428 4
ISLAMIAT
FAITHS AND PRAYERS (EMANIAT AND IBADAAT ) 76.25 71.765 62.34 70.115 27
Islamic Theology of Hereafter (Aqeedah Akhirat) and its contribution towards character building 84.16 94.15 61.73 80.01 16
Hajj and its globalization 68.34 49.38 62.95 60.22 11
LIFE OF PROPHET MUHAMMAD PBUH (SEERAT E TAYYABA) 84.29 68.05 72.38 70.61 45
Great Morals of The Holy Prophet PBUH (Khulq e Azeem) 66.09 90.21 78.15 4
Patience and tolerance 44.18 39.08 41.63 4
Fulfillment of Promise 39.10 39.10 3
Perseverance (Istiqamat) 59.86 78.81 69.33 8
Beautiful Conduct (Husn e Muashrat) 92.14 92.14 1
Sincerity and Piety (Ikhlas aur Taqwa) 79.71 78.29 70.76 76.25 14
Justice and beneficent (Ehsaan) 80.35 94.11 87.23 3
Way of training and preaching 88.87 79.52 74.86 81.08 8
ETHICS AND MANNERS (AKHLAQ AUR ADAAB) 89.72 83.07 63.49 70.95 32
Fear to Allah (Khashiat e Elahi) 80.00 79.39 79.70 3
Amer Bil Maroof Wa Nahi Anil Munkar 61.96 61.96 5
Human Rights 74.73 73.53 74.13 14
Honesty in Business 84.00 84.00 1
Avoiding Hypocrisy in Relations 95.43 94.48 48.77 79.56 6
Jihaad 23.17 23.17 3
SOURCES OF GUIDANCE MASHAHEER E ISLAM/ISLAMIC HEROES 76.91 39.86 69.99 76.91 12
Hazarat Essa (A.S) 86.29 86.29 3
Hazarat Salman Farsi (R. A) 67.53 39.86 53.69 9
53
REPORT ON GRADE 5 AND 8 EXAMS - 2015


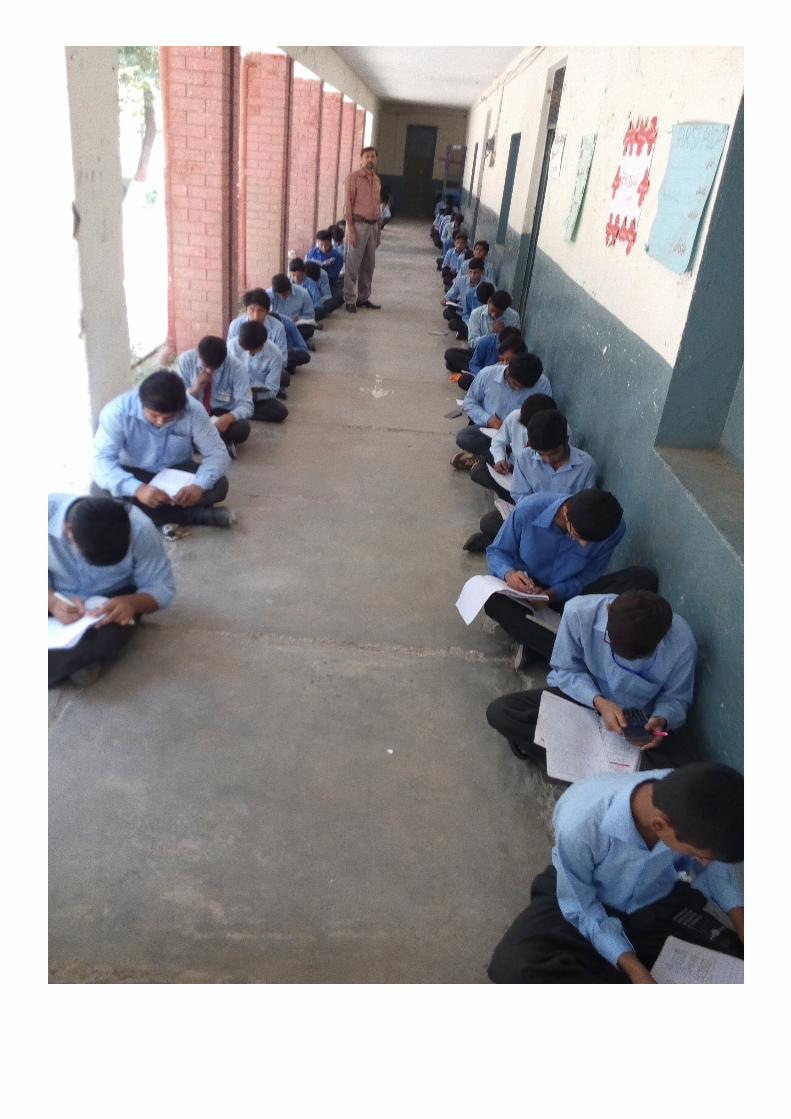
Recommended