Reservoir Characterization and
Stratigraphic Relationships of Mishrif
Formation in Gharraf Oil Field
In partial Fulfillment of the
Requirements for the Degree
of Master of Scie
Nabaa Tareq
Assist. Prof. Midhat E.Nasser,Ph.D
Ministry of Higher E
and Scientific Research
University of Baghdad
College of science
Department of Geology
Reservoir Characterization and
Stratigraphic Relationships of Mishrif
Formation in Gharraf Oil Field
A Thesis Submitted to the
College of science
University of Baghdad
In partial Fulfillment of the
Requirements for the Degree
of Master of Science in Geology
By Nabaa Tareq Mohammed Al-Itbi
B.Sc.2009
Supervised by
Senior Chief Geologist
,Ph.D Jabbar L. Ali,Ph.D
2013
Education
esearch
University of Baghdad
College of science
Department of Geology
Reservoir Characterization and
Stratigraphic Relationships of Mishrif
Formation in Gharraf Oil Field
Chief Geologist
Jabbar L. Ali,Ph.D

CHAPTER ONE
Introduction
1-1 Preface
The Cretaceous succession has been extensively studied because it contains
abundant reservoir intervals. It is the most productive interval in Iraq and
contains about 80% of the country’s oil reserves .The Mishrif Formation is the
most important carbonate reservoir in south east Iraq and contain oil at 32
structures. The largest accumulation is in the Rumaila North ,Rumaila South,
West Qurna ,Zubair ,Majnooon, and Halfaiya fields ,located on large -scale
north-south trending anticline. At least 15 other commercial oil accumulation in
the Mishrif Formation have been discovered in south east Iraq: Abu Ghirab,
Ahdab ,Amara, Buzurgan, Dujaila, Jabel Fauqi ,Gharraf, Hawaiza, etc. (Aqrawi
et al. 2010).
1-2 Aims of the Study
1- Determine the microfacies and their associated environments of the Mishrif
Formation in Gharraf oil field.
2- Determine the effect of facies change and diagenetical processes on
petrophysical properties in the studied well.
3- Study the petrophysical properties of the Mishrif formation in the studied oil
field .
4- Study the vertical stratigraphic relationships by thin sections and well log
5- Suggest a solution for different oil water contact among the three Gharraf
wells.
6- Determine oil entraping elements and possibility of stratigraphic
contributions.
1-3 Study Area

The Gharraf oil field is located south of Iraq in Thi Qar province about 85
km to the north of Nassriya city (Fig.1-1). The Gharraf oil field is a north west-
south east trending anticline with an area of 24 km length and 5 km width. Three
wells (Ga-1,Ga-2, Ga-3) were drilled in Gharraf oil field during the years of
1984, 1987, 1988 . The main oil accumulation zones in the field are the Mishrif
and Yamama Formation .The second accumulation zones are found in the
Ratawi and Zubair Formation (Fig. 1-2).
Fig. (1–1) General map of Iraq showing major tectonic units and oil/gas field
location (Al-Ameri,2011),Box shows the location of the study area

Fig (1-2) Stratigraphic Column of the Gharraf oil field in well Ga-1 modified after
Al-Naqib(1967)
Sargelu

1-4 Methodology
1- Seventy three thin section for the microfacies study were prepared.
2- Load data to the GeoFrame system was obtained from the Oil Exploration
Company, and used Petro View Plus 4.5 program to interpret input data and
produce Computer Processed Interpretation (CPI) for the three Gharraf wells .
3- The same program is used to calculate formation water resistivity (Rw) by
using Pickett plot and determine the lithology ,porosity by drawing the
relationships between φ density and φneutron , φsonic and φdensity.
1-5 Tectonic and structural setting
The two basic tectonic units of Iraq are the Arabian Shelf (Stable and
Unstable Shelf ) and Zagros Suture Zone (Jassim and Goff,2006).
The study area lies in the Mesopotamian Zone exactly in Euphrates Subzone
which considered as a part of the Mesopotamian Foredeep Basin .
The Mesopotamian Zone is the easternmost unit of the Stable Shelf and
contains the largest and richest petroleum province in Iraq and is dominated by
Cretaceous plays (Aqrawi et al. 2010).
This zone was probably uplifted during the Hercynian deformation but it
subsided from Late Permian time onwards . The sedimentary column of the
Mesopotamian Zone thickens increase to the east. It comprises 700-1400 m of
Upper Cretaceous. The Mesopotamian Zone contains buried faulted structures
below the Quaternary cover, separated by broad synclines .The fold structures
trend mainly north west-south east in the eastern part of the zone which is the
trend of the Gharraf structure. The Euphrates Subzone lies in the west of the
Mesopotamian Zone. It is a monocline dipping to the north east with short
anticlines (<10 km) and structural noses. Some longer north west -south east
oriented anticlines (20-30 k long)lie near to and parallel with the Euphrates
Boundary Fault. The basement is generally 7-6 km deep (Jassim and Goff,2006).

The Gharraf structure forms on of a series of anticlinal structures developed
on the southern flank of the Zagros Mountain front flexure. The trend of the
anticline is parallel to the main Zagros trend.
1-6 Stratigraphy
The Mishrif Formation (Cenomanian-Early Turonian) represents a
heterogeneous formation originally described as organic detrital limestones,
capped by limonitic fresh water limestones (Bellen et al.,1959 in Aqrawi et al.
2010 ).
The lower contact of the formation is conformable with the underlying unit
Rumaila Formation. The upper contact of the Mishrif Formation is
unconformable with Khasib Formation .
The Mishrif Formation was deposited through the Late Tithonian -Early
Turonian Megasequence AP8 according to Sharland (2001) within the Albian -
Early Turonian Sequence (Wasi’a Group) . The Mishrif Formation is thickest in
the Rumaila and Zubair fields (270 m), in the Nahr Umr and Majnoon fields
along the Iraq-Iran border it becomes (435 m) thick, and in Abo Amud field
between kut and Amara it is (380 m) thick. Other isolated occurrence lie near
Kifl (255 m) and Samarra (250 m) (Jassim and Goff,2006).
The thickness of the formation in Gharraf oil field reachs (301 m) (Table 1-1).
Table (1- 1) Thickness of Mishrif formation in studied wells
Field name Well name Top m. Bottom m. Thickness m.
Gharraf
Ga-1 2235 2536 301
Ga-2 2269.5 2557 287.5
Ga-3 2253 2549 296

1-7 Paleogeography and equivalent formation
According to Jassim and Goff (2006) deformation along the north east
Tethyan margin of the Arabian Plate in Cenomanian –Early Turonian time led
to the reactivation of longitudinal ridges and transversal blocks such as the
Mosul High and the Kirkuk Embayment. The Cenomanian Sea transgressed
onto the Rutba and Mosul Highs, which had re-emerged during the Early
Turonian. Deposition of pelagic Balambo Formation continued in the Balambo-
Tanjero Zone. On the shelf (apart from the major Rutba and Mosul Highs) some
north west-south east trending ridges have divided the basin into smaller basins,
causing facies variations. Major facies belts of the Cenomanian –Early Turonian
Sequences comprise:
1) A western clastic –carbonate inner shelf on which clastics of the Rutba
Formation, followed by coastal and supratidal carbonates of the M’sad were
deposited .
2) A deep inner –middle shelf sea in which deeper water limestones and marls of
the Rumila Formation were deposited .
3) A belt of shoals and rudist patch reefs of the Mishrif Formation which formed
above activity growing structures within the Rumaila basin.
4) A deep water basin developed along the plate margin (Balambo-Tanjero
Zone) in which the basinal limestones of the Upper Balambo Formation were
deposited. This basin shifted towards the south west and encroached on the
Foothill Zone in the Kirkuk Embayment.
5) An isolated deep basin, was formed between the Balambo basin in the NE
and the Rumaila basin in the south west. It occupied the area of the Foothill
Zone, especially the Kirkuk Embayment, in which the euxinic shales of the
Gulneri Formation and the basinal oligosteginal limestones of the Dokan
Formation were deposited .
6)The lagoonal inner shelf desiccation basin of the Kifl Formation which is the
youngest unit of the sequence developed in the Mesopotamian Zone.

In north west Iraq a relatively small basin (mainly in the Sinjar area) developed
in which carbonates of the Gir Bir and Mergi formations were deposited ; these
facies are now included in the Mishrif Formation .
The Mishrif Formation passes into the M’sad Formation towards the Rutba
Subzone(Jassim and Goff,2006).
The formation is equivalent to the Mishrif Formation and the upper part
of the Magwa Formation in Kuwait, to the Sarvak Formation in the
Zagros, to the lower part of the Judea Formation in central and north
east Syria, and to the Mardin Formation in south east Turkey (Jassim and
Goff,2006).
1-8 Previous Studies
The earliest study of the Mishrif Formation started in 1952 by Rabanit who
described the formation in Zubair area (Zu-3) of southern Iraq (Buday ,1980).
The Mishrif Formation was first formally described by Owen and Nasr (1958)
and Dunningiton et al. (1959) from southern Iraq.
Many geological studies have been done on the Mishrif Formation . The
stratigraphic, depositional environment and facies studies were:
Gaddo (1971 in Aqrawi et al. 2010) studies the Mishrif Formation in the
Rumaila ,Tuba and Zubair fields of southern Iraq. He recorded rudist biostromes
in five intervals in the middle part of the formation.
Alkersan (1975 in Aqrawi et al. 2010) noted that the shallowest – water
thickest and best sorted rudist facies of the Mishrif Formation in the Rumaila
anticlinorium occur near West Qurna, in the present day structurally lowest area.
Buday (1980) proposed that structural features including the Samarra –
Dujaila – Amara “ridge” which extended southwards into the Burgan High,
influenced the distribution of shallow – water Mishrif facies.
According to Reulet (1982; Aqrawi et al., 1998 in Aqrawi et al. 2010) the
formation consist of two third – order sequences separated by an intra-
formational unconformity which is recorded near the Iranian border at Amara.
Belaribi (1982) studied the sedimentary environment and the distribution of
facies in Mishrif Formation southern Iraq and determined six sedimentary
facies; lagoonal, shallower, subbasinal, coral reef, and fresh water facies.
Sherwani (1983) suggested that Mishrif depositional environment is basically
shallow inner shelf subdivided landward (west) into: subtidal, intertidal and
supratidal, while seaward a barrier (reef) and shallow outer shelf appear. And
concluded that what is often termed Mahilban, Fahad and Maotsi Formation are
tongues of Rumaila and Mishrif.
Sherwani and Mohammed (1993 in Aqrawi et al. 2010) recognized four
general facies within the Mishrif : restricted shelf, rudist build-up, open shelf
and sub-basinal.
Aqrawi et al. (1998 in Aqrawi et al. 2010) pointed that the Mishrif succession
indicates general shallowing from open-shelf to for-reef flat and finally inner-
shelf conditions. And suggested that the Mishrif facies belt consists of north
west-south east trending western and eastern higher energy facies (recorded in
the Dujaila and Gharraf areas).
Al-Jumaily (2001) recognized fifteen principle sedimentary microfacies and
indicated from the vertical analysis that the Mishrif Formation characterized by
tow regressive cycles.
Al-Keshan (2002) shows that there is compatibility between the seismic and
geologic data including physical properties change in the middle of the Mishrif
Formation towards well (x4) in Gharraf oil field.
Mahdi (2004) Studied the sequence stratigraphy and reservoir characterization
of the Mishrif Formation in Dujaila, Kumait, Amara, and Riefaiy field and
distinguished three complete transgressive -regressive sequence and their
correlative systems tracts. And the Microfacies analysis showed six
environmentally indicative facies associations within the Mishrif carbonate

platform: deep marine, shallow open marine, rudist biostrome, shoal, back-
shoal, and shallow restricted marine.
Al-Ubaidy (2004) noted five depositional environment within the Mihrif
succession; basinal, deep marine, shoal, shallow open marine and shallow
restricted environment and found two third order regressive cycle.
(Sadooni,2005) studied build-ups locations some distance away from the main
platform margin, he considered that the maximum thickness of the Mishrif
Formation in the Dujaila area was controlled by a local uplift the “Dujaila
Shoal”.
Al-Badry (2005) studied the Mishrif Formation in four oil fields within Mesan
governorate and recognized six depositional environment. the Mishrif formation
has been divided into four third order sequences (S1 , S2 , S3 , S4) , all of them
were deposited within 3rd order of marine depositional cycles .
Other studies concerned on the reservoir characterization of the Mishrif
Formation were:
Gaddo (1971 in Aqrawi et al. 2010) reported mean porosities of 9% at Zubair
and 16% at Rumaila. Porosities of up to 36% and permeabilities of up to 1560
mD occur in rudist-rich carbonates .
Alkersan (1975 in Aqrawi et al. 2010) noted that near Basra, the reservoir
quality of the rudist facies is highest in structural crests while on structural
flanks, reservoir quality deteriorates due to diagenesis and the presence of
lagoonal and sub-basinal facies
Reulet (1982 in Aqrawi et al. 2010) summarized average values of porosities
and permeability for Mishrif facies in southern Iraq (Table 1-2).

Table 1-2.Average porosity and permeability of facies the Mishrif Formation in southern Iraq
(after Reulet, 1982 in Aqrawi et al. 2010).
Facies Type Av. Porosity% Av. Permeability
Barrier (reefal) Biostrome 15-20 10-100
Shoal Shoal 20-25 100-1000
Outer shelf (moderate energy) Slope 10-15 c. 10
Inner shelf (moderate energy) Back-Shoal 10-15 0-10
Inner shelf (low energy) Lagoon 0-5 0.1
Gaddo (1971; Aqrawi et al., 1998 in Aqrawi et al. 2010) identified the
processes which further modified porosity include: meteoric cementation
beneath sequence boundaries,drusy mosaic cementatin , compactin ,
newmorphism and stylolitisation .Secondary pores are vuggy, mouldic or
channel-like
Al-Kalidi (2004) found different types of porosity (integranular,
intercrystalline, fracture, moldic, intragranular and vuggy) for the Mishrif
Formation in Halfayia oil field. The first three types are within effective porosity
and divided the formation into six reservoir units and six barrier units also
recognized 14th
secondary microfacies in well HF-1 the most important facies in
the reservoirs are the rudist boundstone and Packstone-Wackstone.
Sadooni (2005 in Aqrawi et al. 2010). noted that the most productive Mishrif
facies are peri-reefal bioclastic carbonates; rudist rich rudistone and frequently
well-cemented as at Buzurgan.
Fuloria (1976, in Sadoooni,2005 in Aqrawi et al. 2010)noted that reservoir
quality tends to decrease in downflank wells; this may be due to structural
control on reservoir facies or diagenetic factors.
Al-Obaidi (2005) studied the Mishrif Formation in selected wells from North
Rumaila and South Rumaila and West Qurna fields and indicated that the

effective porosity of the pay is represented the primary rock porosity, the
secondary porosity is either scarce or non-existent and also divided the
formation into five main reservoir units.
Handel (2006) studied the Mishrif Formation in Nassriya oil field and
suggested that the primary porosity of formation represents dominant one and
the secondary is of rare and divided the reservoir units into four grads (very
good, good, medium, and poor).
Al-Atya (2009) divided the Mishrif Formation into two units in wells (Ns-5,
Lu-2, Rt-5, R-270, WQ-17, Zb-114) and three units in wells (Hf-5, No-2, Ri-1).
(Al-Kilaby,2009) recognized seven reservoir units in wells (AG-17, AG-3, Af-1,
Fq-17, Hf-1) the seven one is present only at (No-1) and noted five main sub
environments.
Raheem (2009) studied the Mishrif Formation in West Qurna field , the
electrofacies showed that the Mishrif Formation consist of eight electrofacies.
Hamdan (2011) divided the Mishrif Formation in Buzurgan field into four
reservoirs oil-bearing zones. And built 3D static geological model for all these
zones.
CHAPTER TWO
MICROFACIES ANALYSIS

2-1 Preface
The microfacies classification of Mishrif Formation have been identified
according to Dunham classification (1962) (Fig 2-1). This classification is easy
to apply and depends on the texture of the rock. The environment of the
formation is determined in addition to the diagenetic processes and their effects
on reservoir properties.
Fig (2-1) Dunham Classification(1962)
Petrographic Description2-2
The petrographic study of the thin sections reflects that , the Mishrif
formation consist of :-
2-2-1 Skeletal grains
2-2-1-1 Foraminifera
a- Benthic foraminifera

Benthic foraminifera of different size are found, concentrated in the upper
and middle parts of the formations ,and less recorded in the lower part of the
formation [ pl-1(f)].
The diagenetic process affected the rocks making it difficult to distinguish
[p1(a,b,c,d,e)] .
b- Planktonic foraminifera
Planktonic foraminifera exist in the sections ,especially in the lower part of
the Mishrif Formation. This occurrence continue to the transitional zone
between the Mishrif and the underlying Rumaila Formation .The main
planktonic foraminifera that can be recognized are :Hedbergella sp., Heterohelix
sp., Globigerina sp., [pl-2 (a,b,c) pl6 (f)].
2-2-1-2 Mollusca
Mollusca is characterized by its wide distribution along the studied section.
It is found in several forms generally as shell fragments (longitudinal bioclast or
concave shape ). Others in the form of large bioclast or full size shells affected
by different diagenetic processes.
Rudist
Rudist represents the main component and the index fossil for the Mishrif
Formation . Rudist appearance is noticed in several forms (longitudinal,
concave, shell fragment) [pl-2 (d,e,f) pl-3(a,b,c,d) pl-7(b,c)] . In well Ga-3,
large parts of rudist are noticed representing the main form of the reservoir unit
in this well. Otherwise the talus (rudist fragments) are recognized only in well
Ga-2 [pl-3(e,f)] . All the rudist are affected by diagenetic process.
2-2-1-3 Calcispheres

Shelf limestone yield small-sized (diameter commonly <500m hollow
spherical microfossils exhibiting calcite walls. Many of these fossils, often
designated as (calcispheres),are interpreted as algal remains, particularly as algal
cysts. These calcispheres are abundant in association with other planktonic algae
and occur in pelagic ,basinal carbonate (Flügel ,2004) [pl-2(a)].
2-2-1-4 Other organisms
There are several types of organism found in the Mishrif Formation, but it's
occurrence is few or restricted such as ostacoda shells [pl-4(a),pl-10(c)] ,
Echinoderms fragment [p4-(b)], alge in addition to spicules [p4-(f)].
2-2-2 Non skeletal grains
Peloids
Peloids are spherical, ovoid, or rod-shaped, mainly silt size carbonate grains
that commonly lack definite internal structure. They are generally dark gray to
black owing to contained organic material and may or may not have athin , dark
outer rim. Peloids are composed mainly of fine micrite 2 to 5 microns in size .
Many peloids, especially those with well –rounded, symmetrical shapes, are
thought to be of fecal origin. These peloids are commonly called pellets. Fecal
pellets are produced by a variety of organisms that ingest fine carbonate mud
while feeding on organic-rich sediments. Not all marine peloids are fecal pellets.
Some are believed to form by carbonate encrustation around filaments of
cyanobacteria, endolithic algae (Boggs, 2009).
Peloids are distributed as little numbers along the section [Pl-5 (a,b,c)]. The
identification of peloids is sometimes difficult because of daigenetic process
that made some fossils look like pelloids .
2-2-3 Groundmass

a- Micrite
Most groundmass of Mishrif rocks is composed of micrite .Micrite is
microcrystalline (1-4) microns. Micrite has a grayish to brownish,
subtranslucent appearance under the microscope due to consist organic matter .
The presence of substantial micrite in limestone is commonly interpreted to
indicate deposition under fairly low-energy conditions, where little winnowing
of fine mud take place (Boggs, 2009) [pl-1 (b,c,d,e,f)].
b- Sparry calcite
Crystals of sparry calcite are large (0.02- 0.1 mm) compared to micrite
crystals and appear clean or white when viewed in plane light under a polarizing
microscope . They are distinguished from micrite by their larger size and clarity
and from carbonate grains by their crystalline shapes and lack of internal
microstructures (Boggs, 2009) .
The sparry calcite is less occurance than micrite in Mishrif rocks. It occurs as
a cement that fills channels and inside the carbonate grains [pl-1 (a)].
2-3 Carbonate microfacies and marine depositional environments
The term microfacies refers to sedimentary facies that can be studied and
characterized in small section of a rock (Boggs, 2009) . The purpose of
microfacies analysis is to provide a detailed inventory of carbonate rock
characteristics ( carbonate grain types, kinds and growth forms of fossils, size
and shape of grains, nature of micrite, cement, particle fabrics) that can
subsequently be related to depositional conditions (Boggs, 2009) .
After examined the thin sections by using polarizer microscope, the Mishrif
microfacies have been determined, and the depositional environments have been
concluded according to standard microfacies types (Fig 2-2) .

Fig (2-2) Distribution of SMF Types in the Facies Zone (FZ) of the rimmed carbonate
platform model (Flügel,2004)
These depositional environments and their microfacies association are :
2-3-1 Restricted platform interior environment (FZ8)

The microfacies association with this environment is
-Lime mudstone microfacies
This microfacies mainly composed of homogeneous unfossiliferous( pure
micrite). Some parts of these facies have been dolomitized .The dolomite crystal
contributed in different percentage. The standard microfacies (SMF) which is
similar to it is SMF (23). This microfacies founded in well Ga-1 Ga-2.
2-3-2 Open marine platform interior environment (FZ7)
Consist of the following facies :
-Bioclastic Wackstone Microfacies
This facies concluded shell fragments, echinoderm fragments, and some
benethic foraminifera. It’s similar to SMF(9) .This microfacies has been
recognized in the three wells Ga-1, Ga-2, Ga-3.
-Bioclastic Packstone – Wackstone Microfacies
Grains of this microfacies are dominated by shell fragments, some of these
shells related to Pelecypods . And some foraminifera cored with micrite
envelops also found. This microfacies is similar SMF (10) and recognized in
well Ga-3.
2-3-3 Deep shelf environment (FZ 2)
The microfacies that represents this environment is:
-Bioclastic Wackstone –Mudstone Microfacies
Allochems of this microfacies characterized by small shell fragments and some
types of planktonic foraminifera. This microfacies is similar to SMF (9) ,and
distinguished in the well Ga-2 only because there are no available samples in the
others well.
2-3-4 Toe-of-slope environment (FZ3)
The only facies represents this environment is:
-Pelagic Mudstone- Wackstone Microfacies

Planktonic foraminifera and Calcispheres are dominating in this microfacies.
It’s similar to SMF (3) . It is recognized in the three wells Ga-1, Ga-2, Ga-3.
2-3-5 Platform margin reefs environment (FZ5)
The microfacies representing this environment is :
- Bioclastic Packstone-Grainstone Microfacies
The major components of this microfacies is rudist . Rudist fragments are
ranging from small to large sizes, rare to common mollusk fragments. This
microfacies is similar to SMF (7) .This facies represents the main reservoir unit
and is only recognized in well Ga-1,3.
2-4 Diagenesis process
Diagenesis refers to physical , chemical and biological processes. Carbonate
minerals are more susceptible in general to diagenetic changes such as
dissolution, recrystallization, and replacement than most silicate minerals
(Boggs, 2009) .
Therefore the diagenetic processes and their effect on the petrophysical
properties of the Mishrif rocks are cleared .
2-4-1 Cementation
Comprises processes leading to the precipitation of minerals in primary or
secondary pores and require the supersaturation of pore fluids with respect to the
mineral (Flügel,2004) .
This process has a negative effect on porosity and permeability of the
formation in the study area. Several types of calcite cement have been
recognized in the Mishrif rocks these types are:
A- Bladed
Crystal that are not equidimensional and not fibrous. They correspond to
elongate crystal somewhat wider than fibrous crystals and exhibiting broad
flattened and pyramid-like terminations [pl-6(d)]. Crystal size up to 10 m in
width and between less than 20 and more than 100 m in length. Crystal
increase in width along their length. Commonly forming thin isopachous fringes
on grains. Usually High-Mg calcite but also aragonite. Marine – phreatic
(abundant in shallow-marine settings) and marine-vadose (Flügel,2004) .
B- Drusy
Void-filling and pore-lining cement in intergranular and intraskeletal pores,
molds and fractures, characterized by equant to elongated, anhedral to subhedral
calcite crystals [pl-6(a)]. Size usually >10 m . Size increases toward the center
of the void. Displays a characteristic fabric. Near-surface meteoric as well as
burial environments (Flügel,2004) .
C- Dog tooth
Sharply pointed acute calcite crystals of elongated scalenohedral or
rhombohedral form, growing normal and subnormal to the substrate (grain
surfaces ,atop earlier cements) [pl-6(c)]. Crystal are a few ten to a few hundred
micrometers long and have acute and sometimes blunted terminations. Often
meteoric and shallow-burial but also marine- phreatic and hydrothermal
(Flügel,2004) .
D- Blocky
Calcite cement consisting of medium to coarse-grained crystals without a
preferred orientation. Characterized by variously sized crystal (tens of microns
to several millimeters),often showing distinct crystal boundaries [pl-
6(a,b,c,d,e)].
High-Mg calcite or Low-Mg calcite. Typically occur in meteoric (meteoric
phreatic and vadose) and burial environments ;rare in marine hardgrounds and

reef. Precipitated after the dissolution of aragonite cements or grains or as late
diagenetic cement filling remaining pore space. Blocky textures can also
originated from recrystallization of pre-existing cements(Flügel,2004) .
2-4-2 Micritization
Organic participate in a variety of ways in generation carbonate deposits.
After carbonate sediment are deposited, however, organisms may breakdown
skeletal grains and other carbonate materials. This organic degradation is
actually a kind of sediment-forming process because it results in the production
of finer-grained sediment. Nonetheless, it is included here as a type of very early
diagenesis because it brings about modification of previously formed sediment.
The most important kind of biogenetic modification of sediment is caused by the
boring activities of organisms. Boring by algae ,fungi, and bacteria is a
particularly important process for modifying skeletal material and carbonate
grains (Boggs, 2009) .
If boring activities are prolonged and intense, the entire surface of a grain
may become infested by these aragonite-or Mg-calcite-filled boring ,resulting in
the formation of a thin coat of micrite around the grain. This coating is called a
micritic envelope (Bathurst,1966 in Boggs, 2009).Even more intensive boring
may result in complete micritization of the grain, with the result that all internal
textures are destroyed and a kind of peloid is created.
This process has been affected widely on the Mishrif rocks in the study ares
which led to destroy the skeletal grains of most fossils [pl-6(f), pl-1(b,c,d,e,f)] .
2-4-3 Recrystallization
Refers to changes in crystal size, crystal shape and crystal lattice orientation
without changes in mineralogy (Flügel,2004) .
This process affected on some parts of the formations characterized by the
transformation of micrite to microsparite [pl-1(a) pl-7(a)].
2-4-4 Dissolution
Undersaturation of pore fluids with respect to carbonate leads to dissolution
of metastable carbonate grains and cements. Dissolution is particularly effective
in shallow near-surface meteoric environments, in deep burial and cold waters
(Steinsund and Hald 1994 in Flügel,2004) as well in the deep sea (Berelson et al.
1994 in Flügel,2004).
This process has obvious and positive effects on the Mishrif rocks which
leads to increase porosity and enhance permeability [pl-6(b,c)].
2-4-5 Compaction and pressure solution (stylolization)
Refer to mechanical and chemical processes, triggered by increasing
overburden of sediments during burial and increasing temperature and pressure
conditions(Flügel,2004) .
A stylolite is a kind of sutured seam that is characterized by a jagged surface
, is generally coated by insolubles such as clay minerals or organic matter.
Stylolite are typically oriented parallel to depositional bedding; however , they
can occure also at various angles to bedding and thus create reticulate or nodule-
bounding patterns (Boggs, 2009) .
There are several styles and types of stylolite (Fig 2-3). And some of them
have been recognized in the formation [pl-7(d,e,f), pl-8(a,b,c,d,e)].

Fig (2-3 ) Terminology of pressure solution features (Flügel,2004) .
2-4-6 Dolomitization

Is a process whereby limestone or its precursor sediment is completely or
partly converted to dolomite by the replacement of the original CaCO3 by
magnesium carbonate, through the action of Mg bearing water. Porosity tend to
increase slightly in the initial stages of dolomitization of limestones , but
increase abruptly with higher amounts of dolomite. At this stage, the dolomite is
characterized a sucrosic texture composed of equally- sized rhombohedra with
intercrystalline porosity originating by dissolution of associate calcite
(Flügel,2004) .
This process has less effect on the formation in the study area.
There are several types of dolomite texture in carbonate rocks (Fig 2-4).Three
types of dolomite texture are recognized in the Mishrif formation which are
(planar-euhedral, planar void- filling, planar- porphyrotopic)[ Pl-8(f) ,pl-
9(a,b,c)].
Fig (2-4) Classification of dolomite textures (Gregg and Sibley ,1984 in Boggs, 2009)
2-5 Authigenic minerals
-Sulfides: Pyrite

Authigenic pyrites in limestones are usually developed in the form of cubic
euhedral crystals. Pyrite attracts sedimentologists, for the mineral is a valuable
indicator of chemical process (Wilkin et al. 1996 in Flügel,2004) and diagenetic
stages (Hudson 1992 in Flügel,2004). Fossils preserved in pyrite are attractive
for their beauty and for morphological details revealed by pyritization. Most of
the pyrite in sedimentary rocks is of diagenetic origins, although detrital and
synsedimentary pyrite occurs, too. Authingenic pyrite commonly forms under
reducing conditions replacing organic material or in close proximity to organic
material. Pyrite is formed in normal marine, euxinic, and freshwater
environments (Flügel,2004).
Pyrite has been recognized in different depth in the formation. The cubic
form of pyrite [pl-9(f)] and pyrite inside foraminifera chambers has been
noticed [pl-9(d,e)].
2-6 Types of porosities in the Mishrif Formation in Gharraf oil
field
Several types of porosity are recognized in thin sections derived from core
and classified according to Choquette and pray (1970 in Flügel,2004 ) (Fig 2-5),
which are:
2-6-1 Fabric –selective pores
a- Interparticle (intergranular) porosity: Porosity between individual particles
or grains of a sedimentary rocks.It corresponds generally to depositional primary
porosity, but also includes secondary porosity (Flügel,2004)[pl-3(b), pl-6(c)].

Fig (2-5) Pore types and porosity classification ( Choquette and Pary, 1970 in
Flügel,2004)
b- Intraparticle (intragranular) porosity: Primary pore space corresponding to
defined parts of skeletons (intraskeletal porosity, e.g. champer of foraminifera
(Bachman 1984 in Flügel,2004 ) or to open spaces created by the removal of
less calcified internal elements [pl-2(c), pl-3(a)] .
c- Fenestral porosity: Primary porosity bound to synsedimentary open-space
structures , and commonly associated with supratidal and intertidal, algal-and
microbial-related, mud-dominated sediments(Flügel,2004) [pl-10(a)].

d- Intercrystalline porosity: Porsity between more or less equal-size crystals
often related to early and late diagenetic recrystallization and dolomitization
processes(Flügel,2004) [pl-10(b)].
e- Moldic porosity: Results from the selective removal, commonly by solution,
of grains e.g. fossils or ooids .It requires a distinctive mineralogical or
microstructural difference between the solubility of grins and matrix or cements.
Molds for preferentially in rocks of mixed mineralogies in meteoric-phreatic,
but also in burial setting (Flügel,2004) [pl-10(c)] .
2-6-2 Non-fabric selective pores
a-Channel porosity : A system of secondary pores in which the openings are
markedly elongate and have developed independently of texture or fabric
(Flügel,2004) [pl-10(d)] .
b- Vuggy porosity : Caused by irregularly distributed early and late diagenetic
dissolution cutting across grains and/or cement boundaries and creating
millimeter-to meter-sized holes (Flügel,2004) [pl-10(e)].
c-Cavern porosity: Non-fabric selective porosity characterized by large caverns.
The term cavern applies to larger openings of channel or vugs shapes formed
predominantly by karstic solution processes(Flügel,2004) [pl-10(f)].

Plate (1)
(a) Benthic foraminifea in Bioclastic Packstone Grainstone Microfacies, Ga-3, C.2, 2337
m,(100x)
(b) Benthic foraminifera in Bioclastic Wackestone Microfacies, Ga-2, 2508m,(40x).
(c) Benthic foraminifera in Bioclastic Wackestone Microfacies, Ga-2, 2510m,(40x).
(d) Benthic foraminifera in Bioclastic Wackestone Microfacies, Ga-2 ,2508,(40x).
(e) Benthic foraminifera in Bioclastic Wackestone Microfacies, Ga-2, 2510m,(100x)
(f) Foraminifera in Pelagic Mudstone Wackestone Microfacies, Ga-2, 2339m ,(100x).
Plate (2)
(a) (b)
(c) (d)
(e) (f)
0.5 mm
0.5 mm
0.5 mm
0.2 mm
0.2 mm
0.2 mm

(a) Calcispheres in pelagic Wackestone Mudstone Microfacies, Ga-2, 2398m,(100x).
(b) Planktonic foraminifera in Pelagic Wackestone Mudstone Microfacies, Ga-2, C.3,
2434m,(40x).
(c) Intraparticle porosity inside foraminifera fossil , Ga-1, C.5, 2393m,(100x).
(d),(e),(f) Several forms of rudist in Bioclastic Packstone Grainstone Microfacies, Ga-3 C.3,
2339.50 m,(40x). Ga-3 C.3, 2339.50 m(40x), Ga-3 ,C.2 2337 m,(40x).
Plate (3)
(e) (f)
(c) (d)
(a) (b) 0.5 mm 0.2 mm
0.2 mm
0.2 mm
0.5 mm
0.5 mm

(a), (b),(c),(d) Different shapes of rudist, Ga-3, C.2, 2337m (40x) .Ga-3 C.3 ,2339.50m (40x).
Ga-3, C.2, 2337m (100x). Ga-3,2339.50m (40x)..
(e),(f) talus ,Ga-2, 2514 m (40x). Ga-2 , 2504 m(100x).
Plate (4)
(e) (f)
(c) (d)
(a) (b) 0.5 mm 0.5 mm
0.2 mm 0.5 mm
0.2 mm 0.5 mm

(a) Shell fragment ,Ga-2, 2288m (40x).
(b) Echinoderm fragment , Ga-1,C.5, 2400m (100x).
(c), (e) Bryozoa ,Ga-3, 2334.35m (40x), Ga-2 ,2270m (40x).
(d) Gastropod shell ,Ga-2, 2504m (100x).
(f) Green algae, Ga-3, C.6, 2390.50m (100x).
Plate (5)
(e) (f)
(c) (d)
(a) (b)
0.5 mm
0.2 mm
0.2 mm
0.5 mm
0.2 mm 0.5 mm

(a),(b),(c) peloids, Ga-2, 2556 m (40x),Ga-2, 2470 m(40x), Ga-2 , 2422 m(100x).
(d) Pelagic Lime Mudstone Wackstone Microfacies. Ga-1, C.3, 2284m (40x).
(e) Pelagic Mudstone Wackstone Microfacies. Ga-3, C.4, 2361m(100x).
(f) Bioclastic Wackstone Microfacies . Ga-3 C.1, 2320.50m (40x).
Plate (6)
(a) (b)
(c) (d)
(e) (f)
0.5 mm
0.5 mm
0.5 mm
0.2 mm 0.5 mm
0.2 mm

(a) Drusy & blocky calcite cement,Ga-3, C.1, 2320.50 m (100x).
(b), (e) Blocky calcite cement Ga-3, C.1, 2320.50 m(100x), Ga-3, C.2, 2333m(100x).
(c) Blocky & dog tooth cement , Ga-3, C.1, 2320.50 m (40x).
(d) Bladed and blocky calcite cement, Ga-3, C.1, 2320.50 m (40x).
(f) Micritization process, Ga-2, 2404m (100x).
Plate (7)
(e) (f)
(c) (d)
(a) (b)
0.5 mm 0.5 mm
0.2 mm 0.2 mm
0.2 mm 0.2 mm

(a) Recrystallization process, Ga-3,C2,2337m (100x).
(b),(c) Dissolution process, Ga-3,C.3, 2339.50m(40x),Ga-2,2406m,(40x).
(d),(e),(f) Sutured seam bedding parallel small amplitude,Ga-3,C.3, 2344m,(40x),Ga-
3,C.3,2344m,(40x),Ga-3,C.1,2320m,(100x).
Plate (8)
(e) (f)
(c) (d)
(a) (b)
0.5 mm 0.5 mm
0.5 mm
0.2 mm
0.2 mm 0.5 mm

(a) Non-sutured seams bedding parallel ,Ga2, 2418m (40x).
(b) ,(d),(e) Sutured seam bedding parallel large amplitude, Ga-2, 2504m (40x), 2536m(40x),
2544m (40x).
(c) Sutured seam bedding parallel small amplitude, Ga-2, 2510 (40x).
(f) Dolomitization process ,planar void-filling texture, Ga-3,C2, 2337m (40x).
Plate (9)
(e) (f)
(c) (d)
(a) (b)
0.5 mm
0.5 mm 0.5 mm
0.5 mm
0.5 mm 0.5 mm

(a) Dolomitization process ,planar-euhedral texture, Ga-3, C2, 2334m (100x).
(b) Dolomitization process , planar –porphyrotopic texture, Ga-3, C2, 2333m (40x).
(c) Dolomitization process, nonplanar-anhedral texture, Ga-2, 2286m (100x).
(d) Pyrite inside fossil ,Ga-2, 2376m (250x).
(e) Pyrite inside foraminifera chambers, Ga-2, 2339m(100x).
(f) Cubic pyrite .Ga-2, 2339m (100x).
Plate (10)
(a) (b)
(c) (d)
(e) (f)
0.5 mm
0.2 mm 0.2 mm
0.08 mm 0.2 mm
0.2 mm

(a) Fenestral porosity, Ga-3,C3,2339.50 m (40x).
(b) Intercrystaline porosity Ga-3 ,C2, 2334m (40x).
(c) Moldic porosity ,Ga-3, C2, 2337 m (100x).
(d) channel porosity , Ga-3, C2, 2333m (100x).
(e) Vuggy porosity , Ga-1, C5, 2393m(40x).
(f) Cavern porosity, Ga-1, C5, 2400m (40x).
(a) (b)
(c) (d)
(e)
(f) 0.5 mm 0.5 mm
0.5 mm
0.2 mm 0.2 mm
0.5 mm

CHAPTER THREE
Reservoir Characterization
3-1 Preface
Many different parameters of the rock can be recorded using well logs such
as formation resistivity , sonic velocity, density and radio activity. The recoded
data can then be interpreted to determine the lithology and porosity of the
penetrated formation and also the type and quality of fluids (oil, gas, or water)
within pores (Selly, 1998) .
These parameters have been recorded in this study using available well logs
and comparing the porosity results with the available core data analysis.
The well logs are also used for determining the upper and lower contact of
Mishrif Formation, divide the reservoir units of the formation and correlate from
well to well .
3-2 Basic principle of well logs
Before talking about the different applications of well logs the basic
principle of used well logs must be outlined.
3-2-1 Spontaneous Potential
The SP log is a record of direct current (DC) voltage (or potential) that
develops naturally (or spontaneously) between a moveable electrode in the well
bore and a fixed electrode located at the surface (Doll,1948 in Asquith and
Krygowski, 2004).It is measured in mill volts (mv).
The electric charge of the SP is caused by the flow of ions (largely Na⁺ and
Cl⁻) from concentrated to more dilute solutions. Generally this flow is from salty
formation water to fresh drilling mud .This naturally occurring electric potential
is basically related to the permeability of the formation. Deflection of the log
from an arbitrarily determined shale baseline permeable, and therefore porous
sandstones or carbonate. A poorly defined or absent SP deflection occurs in

uniformly impermeable formation or where the salinities of mud and formation
water are comparable (Selley,1998).
The SP log is used to :-
-detect permeable beds
-detect boundaries at permeable beds
-determine formation –water resistivity (Rw)
-determine the volume of shale in permeable beds (Asquith,2004).
The SP log has been used in this study to detect permeable beds and correlated
zones between wells.
3-2-2 Resistivity Logs
Resistivity logs are used to:
• determine hydrocarbon-bearing versus water-bearing zones
• indicate permeable zones
• determine porosity
By far the most important use of the resistivity logs is the determination of
hydrocarbon-bearing versus water-bearing zones. Because the rock’s matrix or
grains are nonconductive and any hydrocarbons in the pores are also
nonconductive, the ability of the rock to transmit a current is almost entirely a
function of water in the pores. As the hydrocarbon saturation of the pores
increase (as the water saturation decrease), the formation’s resistivity increase.
As the salinity of the water in the pores decrease (as Rw increase), the rock’s
resistivity also increase. Resistivity logs produce a current in the adjacent
formation and measure the response of the formation to that current. The current
can be produced and measured by either of two methods. Electrode tools
(also called galvanic devices or, for presently available versions, laterologs)
have electrodes on the surface of the tools to emit current and measure the
resistivity of the formation. Induction tools use coils to induction a current and
measure the formation’s conductivity (Asquith and Krygowski, 2004).

In this study deep (Rt), and shallow (Rxo) resistivity data is obtained from
Deep Induction Log (ILd) and Micro Spherical Focused Log (MSFL)
respectively.
3-2-3 Porosity Logs
Porosity is the first of two essential attributes of a reservoir . It is
expressed as the void ratio, which is the ratio of voids to solid rock or more
frequently as a percentage:
Porosity% (φ) = ( volume of voids / total volume of rock ) × 100
Porosity is conventionally symbolized by Greek letter Phi (φ). Pores are of
three morphological types: catenary, cul-de-sac, and closed. Catenary pores are
those that communicate with others by more than one throat passage. Cule-de-
sac, or dead end, pores have only one throat passage connecting with another
pore. Closed pores have no communication with other pores. Catenary and cul-
de-sacpores constitute effective porosity, in that hydrocarbons can emerge from
them (Selley ,1998).
Two main types of pore can be defined according to their time of
formation (Murray,1960 in Selley,1998).Primary pores are those formed when a
sediments deposited. Secondary pores are those developed in a rock some time
after deposition. Rock porosity can be obtained from sonic log, density log and
Nuclear Magnetic Resonable log (NMR) (Asquith and Krygowski, 2004).
Porosity may be measured in three ways; directly from cores, indirectly from
geophysical well logs or from seismic data (Selley,1998).
In this study the porosity measured from three types of logs including Sonic,
Density and Neutron logs and the results were compared with the laboratory
core data.

Porosity is computed from:
1- Sonic Log:-
The sonic log is a porosity log that measures interval transit time (∆t ,delta
t, or DT) of a compressional sound wave traveling through the formation along
the axis of the borehole. The sonic log device consists of one or more ultrasonic
transmitters and two or more receivers (Asquith and Krygowski, 2004).
When sonic porosities of carbonate with vuggy or fracture porosity are
calculated by Wyllie formula, porosity values are too low. This happens because
the sonic log only records matrix porosity rather than vuggy or fracture
secondary porosity. The percentage of vuggy of fracture secondary can be
calculated by subtracting sonic porosity from total porosity. Total porosity
values are obtained from one of the nuclear logs (density, neutron, or preferably
the combination of density and neutron) (Asquith and Krygowski, 2004).
The sonic log is used in this study for correlating wells, identifying lithology,
and calculating primary porosity.
2-Density Log:-
The density log measures formation density by emitting gamma radiation
from the tool and recording the amount of gamma radiation returning from the
formation. For this reason the device is often called the gamma-gamma tool
(Selley ,1998), Density is measured in grams per cubic centimeter, g/cm³, and is
indicated by the Greek letter ρ. Two separate density values are used by the
density log : the bulk density (ρb or RHOB )and the matrix density formation
(solid and fluid parts) as measured by logging tool. The matrix density is the
density of the solid framework of the rock (Asquith and Krygowski, 2004).
The gamma radiation reading can be related to the electron density of the
formation . Bulk density of a rock is a function of lithology and porosity. The
fluid in the pores near the borehole well is generally the mud filtrate. Because
the tool has only a shallow depth of investigation and effectively “sees” only

that part of the formation invaded by filtrate from the drilling mud, it reads this
value for the porosity. Thus the density of the fluid may vary from 1.0 g/cm³ for
fresh water mud to 1.1 g/cm³ for salty mud. Shale also affects the accuracy of
the density- derived porosity of reservoir .Also several minerals have anomalous
densities . The presence of oil has little effect on porosity values, but gas lowers
the density of a rock and thus causes the log to give too high a porosity
(selley,1998).
The formation density log is useful as a porosity- logging tool. Other uses of
density measurements include identification of minerals in evaporate deposits,
detection of gas determination of hydrocarbon density, evaluation of shaly sands
and complex lithologies and determination of oil shale yield (Shlumberger,
1972).
The density log has been used here to compute the total porosity .
3- Neutron Log:-
Neutron logs are porosity logs that measure the hydrogen concentration in a
formation. In clean formation (shale free) where the porosity is filled with water
or oil, the neutron log measures liquid filled porosity (Φn,PHIN, or NPHI)
(Asquith and Krygowski, 2004).
Neutron logs are used principally for delineation of poros formation and
determination of their porosity. They respond primarily to the amount of
hydrogen present in the formation(Shlumberger,1972).
Neutrons are created from a chemical source in the neutron logging tool.
The chemical source is usually a mixture of americium and beryllium which
continuously emit neutrons. When these neutrons collide with the nuclei of the
formation the neutron loses some of its energy. With enough collisions, the
neutron is absorbed by a nucleus and a gamma ray is emitted. Because the
hydrogen atom is almost equal in mass to the neutron, maximum energy loss
occurs when the neutron collides with a hydrogen atoms. Therefore, the energy

loss is dominated by the formation’s hydrogen concentration. Because hydrogen
in a porous formation is concentrated in the fluid-filled pores, energy loss can be
related to the formation’s porosity (Asquith and Krygowski, 2004).
The neutron log was recorded in API units. Because it is so accurate for clean
reservoirs, the neutron log is now directly recorded in either limestone or
sandstone porosity units (LPUs and SPUs ,respectively). Because shale always
contains some bonded water, the neutron log will always give a higher apparent
porosity reading in dirty reservoirs than actually exists. The hydrogen content of
oil and water is about equal, but is lower than that of hydrocarbon gas. Thus the
neutron log may give a porosity reading in gas reservoirs (Selley,1998).
3-2-4 Gamma Ray log and Caliper
Gamma ray (GR) logs measure the natural radioactivity in formations and
can be used for identifying lithologies and for correlation zones. Shale-free
sandstones and carbonates have low concentrations of radioactive material and
give low gamma ray readings. As shale content increase ,the gamma ray log
response increase because of the concentration of radioactive materials in shale
(Asquith and Krygowski, 2004).
The gamma ray log uses a scintillation counter to measure the natural
radioactivity of formation as the sonde is drawn up the borehole. The main
radioactive element in rocks is potassium, which is commonly found in illitic
clays and to a lesser extent in feldspars, mica, and glauconite. The gamma
reading is affected by hole diameter, so it is generally run together with a caliper
log, a mechanical device that records the diameter of the borehole. The caliper
log shows where the hole may be locally enlarged by washing out or caving and
hence deviating the expected gamma ray and other log responses.
The hole may also be narrower than the gauge of the bit where bridging
occurs. Bridging is caused by either sloughing of the slide of the hole and

incipient collapse or a buildup of mud cake opposite permeable zones
(Selley,1998).
In this study the gamma ray has been used for identifying lithology,
calculating the shale volume, and correlating adjacent wells.
3-3 Interpretation of logs data
To prepare the computer processed interpretation (CPI) for the Mishrif
reservoir the data (logs ,core) have been loaded in the GeoFrame system ,and the
following steps have been followed.
The lithology of Mishrif Formation is limestone interbedded with shale .In
this type of formations which contain shale and /or clay are commonly referred
to as shaly sand analysis.
Most of the shaly sand techniques developed over the years are related to the
shale volume, but a few, notably the Waximan-Smits and dual water methods,
seek to use the electrical properties of the clays in the formations to predict an
accurate water saturation (Asquith and Krygowski, 2004) .
Dual water system equation has been chosen to calculate water saturation in
Mishrif reservoir ( which is one of the total porosity equation when the Archi
conditions are not available). The dual water model postulates two different
types of water in a shaly formations a immovable water layer next to the clay
surface (bound water) and movable water that can be displaced by hydrocarbons
(free water). The presence of shale or clay minerals in a reservoir can cause
erroneous values for water saturation and porosity derived from logs. These
erroneous values are not limited to sandstone but also occur in limestones and
dolomites.
Essentially all measurements, then, are affected in some way by the presence
of clays and/ or shales.( Hilchie ,1978 in Asquith and Krygowski, 2004) noted
that the most significant effect of shale in a formation is to reduce the resistivity
contrast between oil or gas, and water. The net result is that if enough shale is
present in a reservoir ,it may be very difficult, or perhaps impossible ,to

determine if a zone is productive. Hilchie also suggests that for shale to
significantly affect log-derived water saturations, shale content must be greater
than 10 to 15 % (Asquith and Krygowski, 2004) . In the Mishrif reservoir the
shale content is reaches to 70%
3-3-1 Determining shale volume
The first step in shaly sand analysis is to determine the volume of shale.
There are several techniques available, the most common being those from the
SP, gamma ray, neutron-density crossplot . Perhaps the most widely used log
is the gamma ray , in part because there are several empirical relationships
between the response of measurement and shale or clay volume. And also
because shale is usually more radioactive than sand or carbonate (Asquith and
Krygowski, 2004) .
The shale volume has been calculated by this linear equation :
( )( )minmax
minlog
GRGR
GRGRIGR
−
−=
I GR = Gamma ray index
GR log = Gamma ray recorded by log ( API )
GR max = Maximum value of Gamma ray .
GR min = Minimum value of Gamma ray .
(Fig 3-1) shows the relationships between depth and volume of clay in the three
well Ga-1,Ga-2,Ga-3. It indicates there are two shaly units (barrier) between
upper and middle Mishrif, and another one between middle and lower Mishrif.

Ga-1
Fig (3-1) The relationships between depth and volume of clay in Ga
3-3-2 Determining of porosity
1-Eeffective and total porosity
The neutron and density logs were used for determine the effective
porosity in the case of good hole conditions by using the following equations:
*For the density log
φ effective= ρρρρ matrix((((1
φ effective = effective porosity
1 Ga-2 Ga
) The relationships between depth and volume of clay in Ga
2 Determining of porosity by logs
Eeffective and total porosity
The neutron and density logs were used for determine the effective
porosity in the case of good hole conditions by using the following equations:
1 – V shale) ) ) ) + ρρρρshale × × × × V shale – ρ/ ρρ/ ρρ/ ρρ/ ρ
effective porosity
Ga-3
) The relationships between depth and volume of clay in Ga-1,Ga-2 and Ga-3
The neutron and density logs were used for determine the effective
porosity in the case of good hole conditions by using the following equations:
ρ/ ρρ/ ρρ/ ρρ/ ρ matrix – ρρρρfluid

ρ matrix = Density of the dry rock ( g/cm3) in this study = 2.71(g/ cm
3) from
limestone formation
V shale = volume of shale
ρshale =density of shale recorded by log
ρ = bulk density recorder by log
ρfluid = Density of fluid ( g/cm3 ) = 1 g/cm3 for fresh water or 1.1 g/cm
3 for
salt mud (in this study =1 g/cm3) .
*For the neutron log
φ effective=φφφφNeutron – φφφφNeutronMatrix((((1 – V shale) ) ) ) + –φφφφ Neutron Shale
× × × × V shale/1 – φφφφNeutron Matrix
φNeutron =neutron porosity recorded by log
φNeutron Matrix = response of neutron log to matrix
φ Neutron Shale = response of neutron log to shale
In the case of bad hole conditions and the other logs (neutron density) are
not available the effective porosity is determined using sonic log . sonic log
reads far away from the hole wall ,compared with the neutron and density logs.
The following equation is used:
φ effective = DT log – DTmatrix((((1 – V shale) ) ) ) – DT shale × × × × V shale / DT
fluid – DT matrix
DT log = interval transit time recorded by log
DT matri = velocity of the rock at 0=φ for limestone = 47.5 (Ms/f)
DT shale =response of the sonic log to shale
DT fluid = velocity of pore fluid = 189 ( Ms/f) for fresh water or 185 (Ms /ft )
for salt mud
While the total porosity has been determined from the following equation:
φ total = ΦΦΦΦeffective + WCLP × × × × V shale
φ total =total porosity
φ effective =effective porosity derived from density and neutron or sonic logs
WCLP = wet clay porosity (0.15)
The derived porosities resulting from well logs are compared with the
laboratory core measured porosity in well (Ga-1,Ga-3) (Fig 2-9). The results
indicate that the porosity derived by logs show good matching with core
porosity in Ga-1, and very good matching in well Ga-3 after correction for shale
effect.
2- Secondary porosity
Secondary porosity has been calculated using the following equation:
( )sonicDNSPI φφ −= .
Spi=Secondary porosity Index
( )DN .φ = effective porosity derived from density and neutron
sonicφ = Primary porosity by sonic log
(Fig 3-2) (Fig 3-3) shows that primary porosity is the main type of the porosity
in the formation than secondary porosity

Ga-1 Ga-1
Ga-2 Ga-2
Fig (3-2) The relationships between depth and primary, secondary porosity in Ga-1,2
2250
2300
2350
2400
2450
2500
2550
2600
0 0.2 0.4
Dept
h
(m)
Primary Porosity
2250
2300
2350
2400
2450
2500
2550
2600
0 0.2 0.4
Dept
h
(m)
Spi
2200
2250
2300
2350
2400
2450
2500
2550
2600
0 0.2 0.4
Depth
(m)
Primary Porosity
2200
2250
2300
2350
2400
2450
2500
2550
2600
0 0.2 0.4
Depth
(m)
Spi

Ga-3 Ga-3
Fig (3-3) The relationships between depth and primary ,secondary porosity in well Ga-3.
3-3-3 Determination of formation water resistivity (Rw)
The value of (Rw) can vary widely from well to well in some reservoirs
because parameters that affect it include salinity, temperature, fresh water
invasion,, and changing depositional environments. However, several methods
for determining the reservoir water resistivity have been developed including
chemical analysis of produced water sample, direct measurement in resistivity
cell, water catalogs, spontaneous potential (SP) curve, resistivity-porosity logs
and various empirical methods (Djebbar and Erle,2004).
The last method is the resistivity- porosity logs which is named as Pickett
plot has been used to calculate Rw . It is one of the simplest and most effective
cross plot methods in use.
In this cross plot the neutron log represents the vertical axis ; while the
horizontal axis represents by the true resistivity value (Rt). The red points which
2200
2250
2300
2350
2400
2450
2500
2550
2600
0 0.2 0.4
Depth
(m)
Primary Porosity
2200
2250
2300
2350
2400
2450
2500
2550
2600
0 0.2 0.4
Depth
(m)
Spi

represents water saturation 100% have been reached together by straight line
then crossly with the value (1) on vertical axis . The vertical line from this point
reads the Rt value which represents (Rw).
The well Ga-1 has been chosen as an example (Fig 3-4), and shows that (Rw)
in the Mishrif Formation is equal to (0.021 ohm.m).
VCL1= volume of clay
Fig (3-4) Pickett plot displays the formation resistivity of water (Rw) for the Mishrif
Formation in well Ga-1
3-3-4 Determining of water and hydrocarbon saturation
After determining the corrected porosity, the water saturation can be
calculated. The dual water method has been used to determine the water
saturation in uninvaded zone and flashed zone by these equations:
-Uninvaded zone saturation
Swt=Y+((Rwf/Rt*φt²)+Y²)½

Where
Y=(SwB(RwB-RwF))/2RwB (Chair,Kulha and Thomas,2oo3)
Y= constant
Swt = total water saturation of uninvaded zone
Rwf=resistivity of formation water ( Ωm )
Rt = true resistivity recorded by log ( Ωm )
φt = total porosity
SwB= bounded water saturation(Swb=φB/φT)/ φB=the water associated with
the shales which occupies the bulk-volume-fraction./ φT=Total porosity
RwB= resistivity of bounded water( Ωm )
-Flashed zone saturation
Swxo=Y+((Rmf/Rxo*φt²)+Y²)½
Where
Y=(SwB(RwB-Rmf))/2RwB
Swxo=water saturation of flashed zone
Rmf= = Resistivity of Mud filtrate ( Ωm )
And the hydrocarbon saturation calculated from the below equation:
Sh = 1-Sw
Sh= hydrocarbon saturation
(Fig 3-5) shows that the most hydrocarbon saturation is found in well Ga-3

Ga-1
Fig(3-5) The relationships between the depth and water saturation in the three wells Ga
Ga-2 Ga
5) The relationships between the depth and water saturation in the three wells Ga
2,Ga-3
Ga-3
5) The relationships between the depth and water saturation in the three wells Ga-1,Ga-

3-3-5 Bulk Volume Water
The product of a formation’s water saturation (Sw) and its porosity (φ) is the
bulk volume of water (BVW).The bulk volume of water for the uninvaded zone
and flashed zones have been calculated by these equations:
-For the uninvaded zone
BVw= Sw * φ
-Flashed zone
BVxo= Sxo* φ
If the value for bulk volume water, calculated at several depths in a formation
, are constant or very close to constant, they indicate that the zone is of a single
rock type and at irreducible water saturation (Sw irr). When a zone is at
irreducible water saturation , water in the uninvaed zone (Sw) does not move
because it is held on grains by capillary pressure. Therefore, hydrocarbon
production from a zone at irreducible saturation should be water free (Asquith
and Krygowski, 2004) .
(Fig 3-6) shows that there are three production zone in each well .These zones
are deduced from the separation between BVw and BVxo values.

Ga-1
Fig (3-6) The relationships between bulk volume water and depth in the three
Ga-2
6) The relationships between bulk volume water and depth in the three
wells Ga-1,Ga-2,Ga-3
Ga-3
6) The relationships between bulk volume water and depth in the three

3-3-6 Determination of lithology
The lithology of the Mishrif Formation has been determined using two
types of cross plots:-
1-Neutron-density lithology plot
These logs combination are used to identify lithology and porosity . The
horizontal axis represents the neutron log; while the vertical axis represents
density log.
These logs shown in (Fig 3-7,8,9) indicate the main lithology of the formation is
limestone .
2- Neutron -sonic lithology plot
These logs are also used for identifying lithology and porosity. The
horizontal axis represents the neutron log ; while the vertical axis represents the
sonic log .
These logs show that the main lithology of the formation is limestone in well
Ga-1,2 (Fig 3-10,11) and dolomitic limestone in well Ga-3 (Fig 3-12)
A comparison of the two cross plots show that the neutron -sonic plot
indicates a much more dolomitic lithology compared to neutron - density plot.
This differ is due to the presence of vuggy porosity.
The sonic log measures only matrix porosity (intergranular and
intercrystalline) and the nuclear logs (neutron and density ) measure total
porosity. Therefore ,when vuggy porosity is present sonic porosity is less than
total (neutron- density) porosity and the data cluster is lower on the neutron-
sonic plot i.e., more dolomitic (Asquith and Krygowski, 2004) .

Fig (3-7) Neutron- density lithology plot for the Mishrif Formation in well
density lithology plot for the Mishrif Formation in well
Ga-1
density lithology plot for the Mishrif Formation in well

Fig (3-8) Neutron- density lithology plot for the Mishrif density lithology plot for the Mishrif Formation in well
Ga-2
Formation in well

Fig (3-9) Neutron- density lithology plot for the Mishrif
density lithology plot for the Mishrif Formation in well
Ga-3
Formation in well

Fig (3-10) Neutron- sonic lithology plot for the Mishrif Formation in well
Ga-1
Formation in well

Fig (3-11) Neutron-
sonic lithology plot for the Mishrif Formation in well
Ga-2
Formation in well

Fig (3-12) Neutron-
sonic lithology plot for the Mishrif Formation in well
Ga-3
Formation in well

After determined all these parameter the CPI for the three wells have been
completed (Fig 3-13,14,15).
Fig (3-13) CPI of the Mishrif Formation in well Ga-1
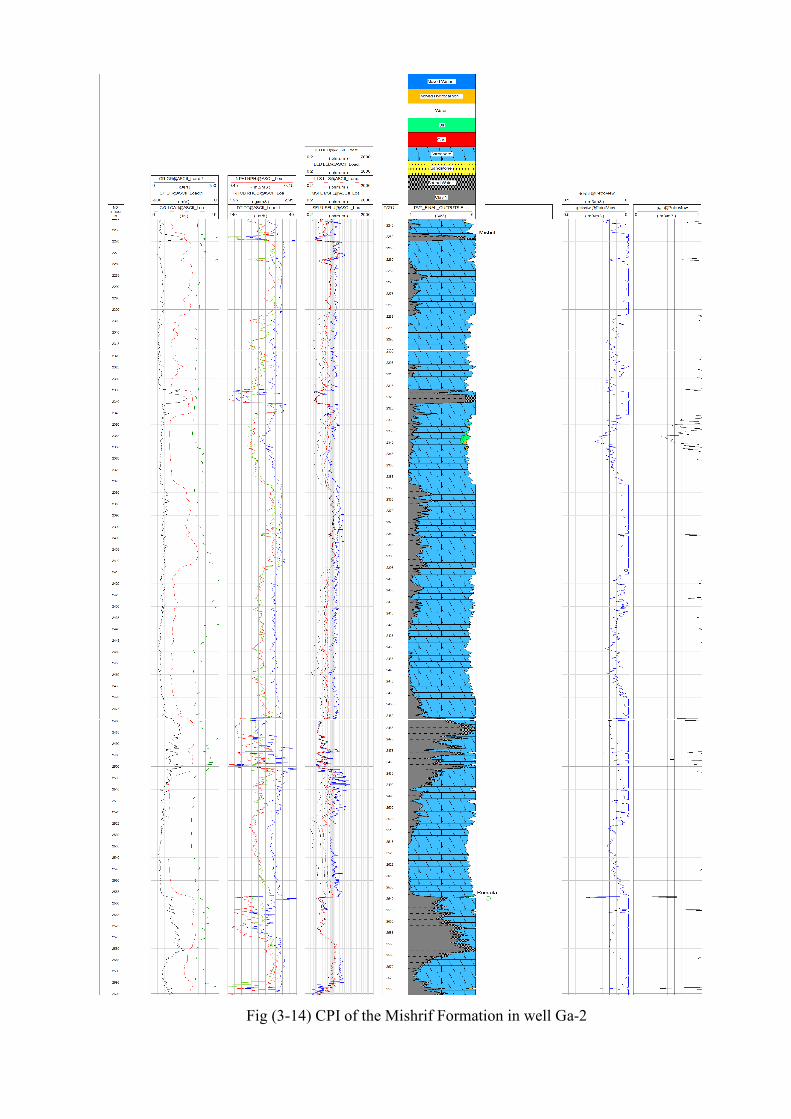
Fig (3--14) CPI of the Mishrif Formation in well Ga-
-2

Fig (3-15) CPI of the Mishrif Formation in Ga-3

3-4 Mishrif Zonation Acording to the CPI results the Mishrif Formation in Gharraf oil field has
been divided into three main reservoir zones , named Upper Mishrif ( MA),
Middle Mishrif ( MB), Lower Mishrif (MC). These reservoir zones have been
sealed by three cap layers named (Cɪ, Cп, Cпɪ) table (3-1),( Fig 3-16) .
The response of logs against the caps and reservoir zone are the following:
-Cap rocks
The well logs GR ,Dt recorded high value facing the cap rocks , and SP log
moves towards the positive reading ,Neutron log reads high value while the
density log low.
-Reservoir zone
The GR ,Dt recorded low value facing the reservoir zones , and SP log
moved towards the positive reading . The Neutron log less shows reading than
cap rock.
Table (3-1) Mishrif Zonation in Gharraf oil field
Units
Ga-1 Ga-2 Ga-3
Intervals(m)
Thickness(m)
Intervals(m)
Thickness(m)
Intervals(m)
Thickness(m)
Upper
MI
CI 2232-2235 3 2267-2270 3 2248-2252 4
MA 2235-2298 63 2270-2335 65 2252-2313 61
Middle
MI
CII 2298-2302 4 2335-2350 15 2313-2319 6
MB 2302-2455 153 2350-2479 129 2319-2466 147
Lower
MI
CIII 2454-2477 23 2479-2502 23 2466-2489 23
MC 2477-2536 59 2502-2557 55 2489-2548 59

Fig (3-16) Correlation section between three wells16) Correlation section between three wells from sea level by using logs data
from sea level by using logs data

CHAPTER FOUR
Stratigraphic Relationships and Dynamic of Trapping
4-1 Preface
Sequence stratigraphy analyzes the sedimentary response to changes in base
level, and the depositional trends that emerge from the interplay of
accommodation (space available for sediments to fill) and sedimentation.
Sequence stratigraphy has tremendous potential to decipher the Earth’s
geological record of local to global changes, and to improve the predictive
aspect of economic exploration and production (Catunenu, 2006).
For these reasons, sequence stratigraphy of Mishrif Formation in Gharraf field
has been studied using facies description , log response and a 3D seismic
section.
4-2 Seismic Stratigraphy
Seismic stratigraphy is basically a geologic approach to the stratigraphic
interpretation of seismic data. The unique properties of seismic reflections allow
the direct application of geologic concepts based on physical stratigraphy.
Primary seismic reflections are generated by physical surfaces in the rocks,
consisting mainly of strata (bedding) surfaces and unconformities with velocity-
density contrasts (Vail et al. , 1977).
4-3 Seismic Sequence Analysis
Seismic sequence analysis is based on the identification of stratigraphic units
composed of a relatively conformable succession of genetically related strata
termed depositional sequence. Depositional sequence boundaries are recognized
on seismic data by identifying reflections caused by lateral terminations of strata
termed onlap, downlap, toplap, and truncation (Vail et al. , 1977).
4-4 Parasequences
The parasequence is a stratigraphic unit defined as a relatively conformable
succession of genetically related beds or bedsets bounded by flooding surfaces
(Van Wagoner,1995 in Catunenu, 2006). Parasequence are commonly identified
with the coarsening upward prograding lobes in coastal to shallow marine
settings. The deposition of each prograding lobe is terminated by events of
abrupt water deepening, which lead to the formation of marine flooding surface
(Catunenu, 2006).
4-5 Sequence Boundary
Sequence boundary is an unconformity between two units of conformable,
genetically related strata does not automatically imply sea level control. It
simply means that at this boundary the pattern of sediment input or sediment
dispersal change abruptly .Sea level change commonly causes these shifts in
input and dispersal because it reshuffles the sediment pathways on the shelf and
slope (Schlager, 2005).
A type 1 sequence boundary (SB1) forms during a stage of rapid eustatic
sea level fall, resulting in a relative sea level fall both at the shelf edge and at the
shoreline, whereas a type 2 sequence boundary (SB2) forms when the rate of
eustatic sea level fall is less than the rate of subsidence at the shelf edge (relative
sea level rise at the shelf edge), but greater than the rate of subsidence at the
shoreline (relative sea level fall at the shoreline), resulting in the formation of a
subaerial unconformity that is characterized by minor erosion and a limited
lateral extent across the continental shelf (Catunenu, 2006).
4-6 Types Of Stratal Terminations
Onlap: termination of low-angle strata against a steeper stratigraphic
surface.Onlap may also be referred to as lapout, and marks the lateral

termination of a sedimentary unit at its depositional limit. Onlap type of strata
terminations may develop in marine, coastal, and nonmarine setting:
- Marine onlap: develops on continental slopes during transgressions ,
when deep water transgressive strata onlap onto the maximum regressive
surface (Catunenu, 2006).
Downlap: termination of inclined strata against a lower-angle surface. Downlap
may also be referred to as baselap, and marks the base of a sedimentary unit at
its depositional limit. Downlap is commonly seen at the base of prograding
clinoforms, either in shallow-marine or deep-marine environments. It is
uncommon to generate downlap in nonmarine settings, excepting for lacustrine
environments. Downlap therefore represents a change from marine (or
lacustrine) slope deposition to marine (or lacustrine) condensation or
nondeposition (Catunenu, 2006).
Toplap: termination of inclined strata (clinoforms) against an overlying lower
angle surface, mainly as a result of nondeposition. Strata lap out in a landward
direction at the top of the unit, but the successive terminations lie progressively
seaward. The toplap surface represents the proximal depositional limit of the
sedimentary unit (Catunenu, 2006) .
Truncation: termination of strata against an overlying erosional surface. Toplap
may develop into truncation, but truncation is more extreme than toplap and
implies either the development of erosional relief or the development of an
angular unconformity (Catunenu, 2006) .
4-7 System Tracts
The term depositional system was introduced by Fisher and McCowan
(1967) for a three dimensional assemblage of lithofacies genetically linked by a
common set of depositional processes. River, deltas and slopes are examples of
depositional systems. Coeval systems are often linked by lateral transitions, for
instance along a topographic gradient to form systems tracts (Schlager, 2005).

System tracts in sequence stratigraphy were originally defined by lap-out
patterns at the base and top ,internal bedding, stacking paterns and positions
within a sequence (Emery et al.,1996 in Schlager, 2005).
The standard model of sequence stratigraphy stipulates that the systems tract
from basin margin to deep water varies in a systematic fashion during a sea-
level cycle such that lowstand, transgressive and highstand systems tracts can be
distinguished (Posamentier and Vail,1988 in Schlager, 2005).
-The lowstand systems tract (LST) consists of the suite of depositional
systems developed when relative sea level has fallen below an earlier shelf
margin(Schlager, 2005).
-The transgressive systems tract (TST) consists of the depositional systems
developed when sea leval rise from its lowstand position to an elevation above
the old shelf margin and depositional environment shift landward(Schlager,
2005).
- The highstand systems tract (HST) consists of the depositional systems
developed then sea level stands above the old shelf margin and depositional
environments and facies belts prograde seaward (Schlager, 2005).
The standard model postulates further that systems tracts follow each other in
regular fashion . The lowstand systems tracts immediately overlies the sequence
boundary, the transgressive systems tract occupies the middle, the highstand
tract the top of a sequence (Schlager, 2005).
Highstand systems tracts are well developed in Mishrif carbonate platform,
that reflects decreasing accommodation and relative high carbonate production.
Accommodation describes the amount of space that is available for sediments to
fill, and it is measured by the distance between base level and the depositional
surface (Jerrey ,1988 in Catunenu, 2006).
The subdivision of sequence into systems tracts led to the recognition of two
other bounding surface besides the sequence boundary.
- The transgressive surface

forms the boundary between lowstand and transgressive tract. It marks the
initiation of transgression after regression (Posamentier and Allen,1999 in
Schlager, 2005) and represents the first significant flooding surface across the
shelf within a sequence (Van Wagoner et al.,1988 in Schlager, 2005).
The transgressive and highstand systems tracts of Mishrif Formation are
represented by regressive and transgressive facies tracts respectively , and
distinct lowstand units are lacking.
- The maximum flooding surface
Constitutes the boundary between transgressive and highstand tract .It
represents the surface that exists at the time of maximum transgression of the
shelf (Posamentier and Allen,1999 in Schlager, 2005).
Two maximum flooding surface have been noticed in the three wells.
4-8 Sequence stratigraphy of Mishrif Formation
The microfacies analysis for the Mishrif Formation in Gharraf oil field
shows a shallowing upwards successions (Fig 4-1,2,3).
The sub basinal facies developed at the base of upper sequence (CII)
corresponds to K140 MFS of Sharland et al.(2001) (Fig 4-4). This shale unit has
regional extension named the Surgeh and found in the three wells Ga-1,Ga-
2,Ga-3.
Other shale unit (CIII) of the top of MC corresponds to the flooding surface
K135 which is intermediate between the K130 (intra-Rumaila) and K140 (top-
Mishrif) MFS of sharland et al.(2001), and found in the three wells.
In the stratigraphic column sequence analysis, the Mishrif Formation
succession in all wells is subdivided into three depositional sequences. They are
labeled S1,S2,S3 in ascending order (Fig 4-1,2,3).

Fig(4-1) Sequence stratigraphic analysis of the Mishrif Formation at well Ga
T
1) Sequence stratigraphic analysis of the Mishrif Formation at well Ga
T-R sequences and their subdivisions.
no data
no data
1) Sequence stratigraphic analysis of the Mishrif Formation at well Ga-1 showing
no data
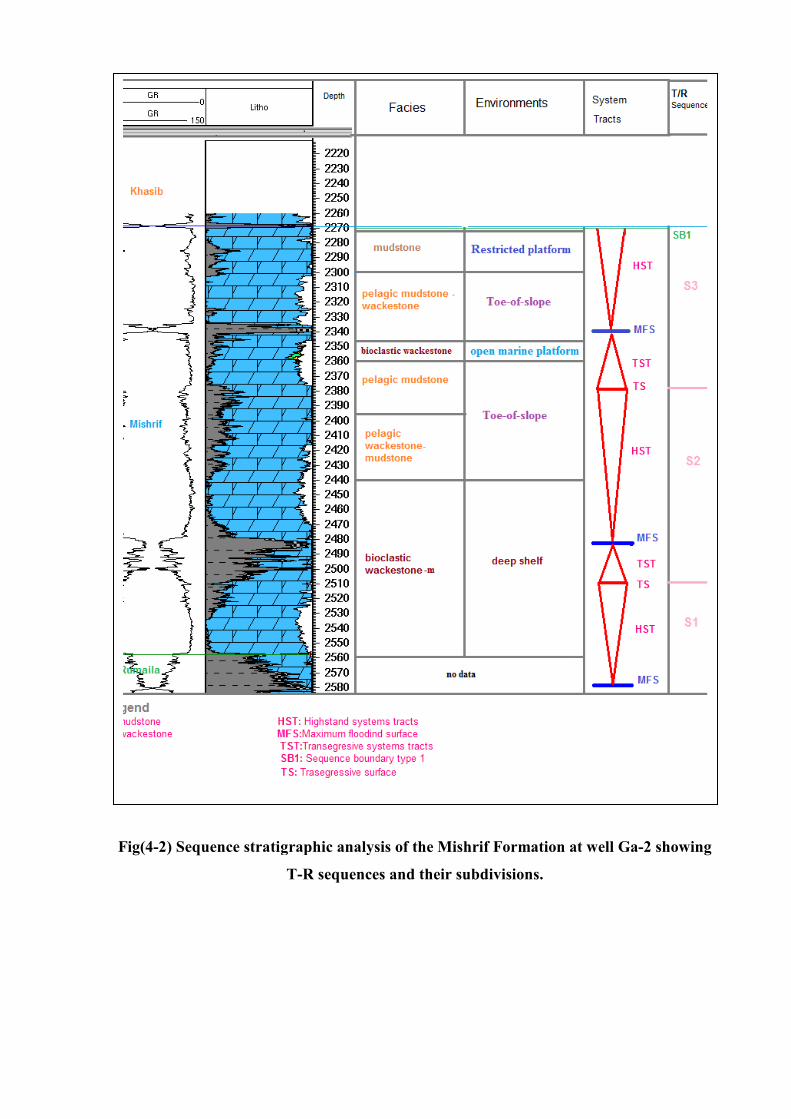
Fig(4-2) Sequence stratigraphic analysis of the Mishrif Formation at well Ga
T
stratigraphic analysis of the Mishrif Formation at well Ga
T-R sequences and their subdivisions.
stratigraphic analysis of the Mishrif Formation at well Ga-2 showing

Fig(4-3) Sequence stratigraphic analysis of the Mishrif Formation at well Ga
3) Sequence stratigraphic analysis of the Mishrif Formation at well Ga
T-R sequences and their subdivisions
no data
no data
no data
3) Sequence stratigraphic analysis of the Mishrif Formation at well Ga-3 showing

Fig(4-4) Schematic chronostratigraphic section for megasequence AP8 (149-92 Ma)
Sharland et al.(2001)
4-9 Mishrif Cycle
The Mishrif Formation consists of two third –order sequences separated by
an intra formational unconformity. Both sequences comprise three medium scale
cycles .In Gharraf well three order parasequence have been recognized.
The lower part of the Mishrif succession represents the highstand cycle bounded
below by maximum flooding surface , which represents the lower boundary of
the Mishrif Formation with the underlying Rumaila Formation.
HST is followed by another episode of deepening represented by shoal deep
facie TST indicating another sea level rise. This episode ended with MFS135.

The same cycle is repeated again and ending with MFS140. The third cycle
ended with the unconformity surface SB1 that separated the Mishrif and Khasib
Formation.
A minor fluctuation within each third order cycle can be recognized in the
studied wells using Gamma ray log.
4-10 Dynamic of trapping in Gharraf oil field
The Gharraf oil field is a north west south east trending anticline . According
to the microfacies analysis of the three wells in the field, there are lateral facies
variation in the field , and the reservoir properties become poor toward Ga-2 .
The electrical logs shows that the main oil accumulation is found in well Ga-
3,Ga-1 and Ga-2 in order from most to least. The oil water contact is determined
in Ga-1, Ga-3 at 2360 m and 2344m in well Ga-2 by using logs data (Fig 4-5).
The middle Mishrif have been divided into MB1 ,MB2 ,MB4 in Ga-1,3 and
MB3,MB4 in Ga-2 according to logs data and micrfacies analysis (Fig 4-5).
3D seismic section of the field (Fig 4-6) shows that the upper Mishrif (MA)
and lower Mishrif (MC) are continuous along the section , while the Middle
Mishrif (MB1,MB2) disappear toward Ga-2 and replaced by MB3 which has
different reservoir and facies characterization than MB1,MB2 and form
downlap strata termination.
According to all these studies (microfacies study, reservoir characterization
study and stratigraphic relationships study) the oil is trapped by an anticlinal
trap in the east of the field which includes Ga-1and Ga-3 . While the dynamic
of trapping in the west side of the field which includes Ga-2 is a stratigraphic
traps caused by facies variation.

Fig (4-5) Correlation section between three wells from sea level

Fig (4-6) 3D seismic section

CHAPTER FIVE
Summary and Conclusions
The study of Mishrif Formation in Gharraf oil field shows that:
1- Six microfacies are present in thin section of Mishrif rocks which are: Lime
Mudstone, Bioclastic Wackestone ,Bioclastic Packstone -Wackestone
,Bioclastic Wackestone -Mudstone, Pelagic Mudstone-Wackestone,Bioclastic
Packstone- Grainstone Microfacies .Their association environments are
:restricted platform interior environment(FZ8), open marine platform
environment (FZ7),deep shelf environment (FZ2),toe-of-slope environment
(FZ3), platform margin reefs (FZ5).
2- Carbonates of the Mishrif Formation are affected by several diagenetic
processes. They include: cementation, micritization,recrystalization ,
dissolution, compaction, dolomitization and pyritization.
3- Several types of porosity have been distinguished :fabric selective pores
(interparticle, intraparticle, fenestral, intercrystalline, moldic porosity) and non
fabric selective pores (channel, vuggy and cavern porosity)
4- The microfacies analysis of Mishrif Formation shows that ,there are lateral
facies change between Ga-1,3 and Ga-2.The main reservoir facies (Bioclastic
Packstone –Wackestone) which contain large rudist are found only in well Ga-
1,3, and replaced by Bioclastic Wackestone Microfacies which contain talus in
well Ga-2.
5- The Mishrif formation is divided into three main reservoir units
(MA,MB,MC) capped by three shale layers (CI, CII, CIII). The middle Mishrif
have been divided into MB1 ,MB2 ,MB4 in Ga-1,3 and MB3,MB4 in Ga-2
according to logs data and micrfacies analysis.
6- The CPI shows that (MB) is the main producting unit ,and the largest oil
accumulation is found in well Ga-3 ,Ga-1 then Ga-2 in order of high to low.

7-According to the logs response and the calculations of water and hydrocarbon
saturation, the oil water contact is determined at 2360m in Ga-1,Ga-3 and at
2344m in well Ga-2.
8-The neutron-density lithology plote and neutron-sonic lithology plote showed
that limestone is the main lithology of the formation.
9- The Mishrif-Khasib unconformity, maximum flooding surfaces, and
transgressive surfaces are the major key surfaces used to correlate the
depositional sequences.
10- The microfacies analysis show that the Mishrif Frmation forms a shallowing
upwards succession starting with deep shelf environment and ending with
restricted environment and consists of two third-order.
11- The seismic section shows the downlap termination strata caused the
stratigraphic trap (facies change) in the western side of the field.
12- According to facies and logs information the Mishrif Formation in Gharraf
oil field divided into eastern sector where Ga-1,and Ga-3 are located and
western sector where Ga-2 is located.
13- The dynamics of trapping is structural trap in the eastern side of the field
and stratigraphic trap in the western side.
References

• Al-Ameri, T.K., Zumberge,J., and Markarian, Z.M.,2011.Hydroc- arbons
in The Middle Miocene Jeribe Formation, Dyala Region, NE Iraq. Jornal
of Petroleum Geology ,34(2),pp199-216.
• Al-Atyah,M.F.A.,2009. Geological and reservoir study of Mishrif
Formation in selected wells from southern Iraq. M.Sc Thesis , University
of Basrah (in Arabic).
• Al-Badry,A.M.S.,2005.Sequence stratigraphy of the Mishrif Formation in
selected oil fields within Miesan county-south Iraq. M.Sc Thesis,
University of Baghdad (in Arabic).
• Al-Jumaily,S.S.N.,2001. Facies and depositional environment of the
Mishrif Formation in selected oil fields, southern Iraq. Ph.D Thesis,
University of Baghdad (in Arabic).
• Al-Kalidi,Z.A.S.,2004.Determination of effective porosity and
petrophysical characterization for Mishrif Frmation in Halfayia oil field.
M.Sc Thesis, University of Baghdad (in Arabic).
• Al-Keshan,A.Z.S.,2002.Seismic study of stratigraphic phenomenon in Al-
Mishrif Formation of Al-Garaaf field\south of Iraq. M.Sc Thesis,
University of Baghdad (in Arabic).
• Al-Kilaby,A.J.K.,2009.Reservoir characterization of the Mishrif
Formation at Abu Ghirab and Fauqi oil fields. M.Sc Thesis, University of
Baghdad.
• Al-Obaidi,S.N.,2005.Reservoir study of the Mishrif Formation in selected
wells from North Rumaila field.Ph.D Thesis, University of Baghdad.
• Aqrawi,A.A.M., Horbury, A.D.,Goof,J.C. and Sadooni, F.N.,2010. The
Petroleum Geology Of Iraq. Seientific Press Ltd,Great Britain,pp424.
• Asquith, G. and Krygowski, D., 2004, Basic Well Log Analysis, 2nd
Edition: AAPG Methods in Exploration Series 16. Published by The
American Association of Petroleum Geologists Tulsa, Oklahoma, pp.
244.
• Al-Ubaidy,U.M.B.M.,2004.Stratigraphic control on facies and diagenetic
development of the Mishrif Formation ,Zubair field. M.Sc Thesis,
University of Baghdad.
• Belaribi,I.,1982.Sedimentary environment and the distribution of facies in
MIshrif Formation southern-Iraq. M.Sc Thesis, University of Baghdad.
• Boggs,S.,Jr.,2009.Petrology Of Sedimentary Rocks.2nd
Edition,
Cambridge University Press, New York, pp.600.

• Buday, T.,1980.The Regional Geology of Iraq :Stratigraphy and
Paleogeography. Dar Al-Kutib house, University of
Mosul,Mosul,Iraq,pp.445.
• Catuneanu, O., 2006. Principles of Sequence Stratigraphy, First edition.
Elsevier, Amsterdam,pp. 369.
• Chair,Z.B.,Kulha,J.,Thomas,E.C.2003. Shaly Sand Analysis
,SPE,Reprint Series ,No.55,Society of Petroleum
Engineers,Richardson,Texas,pp.237.
• Dunham, R.J.,1962,Classification of carbonate rocks according to
depositional texture , in Ham, W.E.(ed.), Classification of Carbonate
Rocks :AAPG Memoir 1,PP.108-121.
• Flügel, E., 2004. Microfacies of Carbonate Rocks,Analysis Interpretation
and Application,Springer-Verlag,Berlin, pp.921.
• Hamdan,W.K.,2011. Petrel software modeling of the Mishrif Formation
in Buzurgan field. Unpublished M.Sc Thesis, University of Baghdad.
• Handel, A.M., 2006.The Study of Reservoir Properties of Mishrif
Formation in Nassiriya Field and its Relationship With Oil Production.
M.Sc Thesis , University of Basrah (in Arabic).
• Jassim, S.Z. and Goof,J.C.,2006.Geology of Iraq . Dolin ,Prague and
Moravian Museum,Brno (Czech Republic),pp.341.
• Mahdi, T.A.,2004. Sequence stratigraphy and reservoir characterization
of the Mishrif Formation in Dujaila,Kumait,Amara,and Riefay fields.
M.Sc Thesis, University of Baghdad.
• Raheem,M.K.,2009.Geological and reservoir evaluation of Mishrif
Formation in west Qurna field southern Iraq. M.Sc Thesis , University of
Basrah (in Arabic).
• Schlager,W.,2005. Carbonate Sedimentology and Sequence Stratigraphy,
SEPM,Tulsa,Oklahoma,U.S.A.,PP.198.
• Schlumberger, 1972, Log Interpretation, Vol. I—Principles: New
York, Schlumberger Limited, pp. 112.
• Selley, R.C., 1998,Elements of Petroleum Geology, Academic Press,
London, United Kinkdom,pp.470.
• Sharland,P.R.,Archer,R.,Casey,D.M.,Davies,R.B.,Hall,S.,He-ward,A.,
Horbury A. and Simmon,M.D.,2001.Arabian Plate Sequence Stratigraphy
. Geo Arabia Special Publication,2 by Gulf Petrolink,Bahrain,pp.371.
• Sherwani,G.H.,1983.Depositional environment and stratigraphic
relationships of Mishrif Formation in selected boreholes, southern and
middle Iraq. M.Sc Thesis, University of Baghdad (in Arabic).

• Tiab,D., and Donaldson,E.C.,2004. Petrophysics, 2nd
Edition:Theory and
Practice of Measuring Reservoir Rock and Fluid Transport Properties,
Elsevier, Amsterdam,pp. 881.
• Vail, P.R., Mitchum, R.M., and Jr², 1977. Seismic Stratigraphy and
Global changes of Sea level,part1, AAPG, Tulsa
,Oklahama,U.S.A.,Mem. 26,PP.51-52 .
Recommended